
Submitted:
03 July 2025
Posted:
04 July 2025
You are already at the latest version
Abstract
Goji berries (Lycium barbarum L.) are considered a functional food due to their high content of bioactive compounds with demonstrated health benefits. This study evaluated four cultivars (G3, G4, G5, and G7) that grown under Mediterranean climate conditions, focusing on their physicochemical properties, bioactive compound, and aromatic profiles to assess their suitability for fresh consumption or incorporation into food products. G4 exhibited the most favorable physicochemical characteristics, with the highest total soluble solids and sugar content. G5 stood out for its lower titratable acidity and highest ripening index, indicating desirable flavor attributes. Concerning bioactive compounds, G3 and G4 showed the highest total phenolic content, being neochlorogenic acid, the predominant. G5 was notable for its high carotenoid content, particularly zeaxanthin. These compounds significantly contributed to antioxidant activity. Volatile organic compounds (VOCs) profile revealed aldehydes as the dominant chemical family, being hexanal the most abundant. G5 and G7 exhibited the highest total VOC concentrations. Principal component analysis grouped G3 and G4 based on their high sugar and phenolic content, while G5 and G7 were characterized by their complex aromatic profiles.
Keywords:
goji berry
; bioactivity
; hierarchical clustering
; physicochemical characteristics
; volatile organic compounds
1. Introduction
Lycium barbarum L., also known as goji berry (GB), is one of the most common fruit species of the Solanaceae family originating from northwestern China. It has traditionally been used in traditional Chinese medicine to treat various ailments such as blurred vision, cough, asthma, diabetes, and kidney failure, among others [1]. From the 2000s onwards, it started to gain popularity in Western markets due to several factors, including its promotion as a "superfood", Western interest in traditional Chinese medicine, and various marketing campaigns highlighting the health benefits associated with its regular consumption [2]. This, together with its high adaptability, has led to its cultivation spreading to Western territories [3].
GBs are a good source of macronutrients, including carbohydrates, proteins, dietary fiber, and lipids, among which polyunsaturated fatty acids (PUFAs) such as linoleic acid (C18:2, Ω-6) and α-linolenic acid (C18:3, Ω-3) are particularly relevant [4]. However, most research has primarily focused on the high content of bioactive compounds, including organic acids, polyphenols, carotenoids, as well as vitamins and minerals [2,5]. Regular consumption of these berries has been associated with a reduction in oxidative stress, improved cardiovascular health, protection against macular degeneration, lowered blood glucose levels, and protection against neurodegenerative diseases, among other benefits [1,6,7].
For all these reasons, their use has greatly increased, which has resulted in the demand for these fruits becoming greater than the supply. This growth presents several significant challenges, including supply issues particularly for fresh GBs due to their short shelf life, the optimal selection of varieties based on geographical location, and the standardization of quality control measures to ensure a bioactive product capable of delivering health benefits [8,9]. A potential market niche lies in the incorporation of GBs into food matrices that are naturally deficient in bioactive compounds. They have been successfully incorporated into various food products, including ice creams, jams, sauces, salads, and beer, as well as in bakery and dairy products [10,11]. However, prior to their incorporation into food matrices, it is crucial to perform a thorough physicochemical and bioactive characterization, along with an analysis of volatile compound profiles, to select the most suitable variety. The aroma influences the flavor characteristics and quality of goji berries and their products, making it a key factor that significantly affects consumer preference and product acceptance [12]. Volatile compounds from various chemical families, including aldehydes such as hexanal and (E)-2-hexenal, ketones such as 2-octanone, and volatile fatty acids such as hexanoic and butyric acid are commonly present in GBs [13,14]. Additionally, interactions with other non-volatile chemical compounds, primarily phenols and flavonoids, may alter the natural aromatic profile and potentially lead to consumer rejection [15].
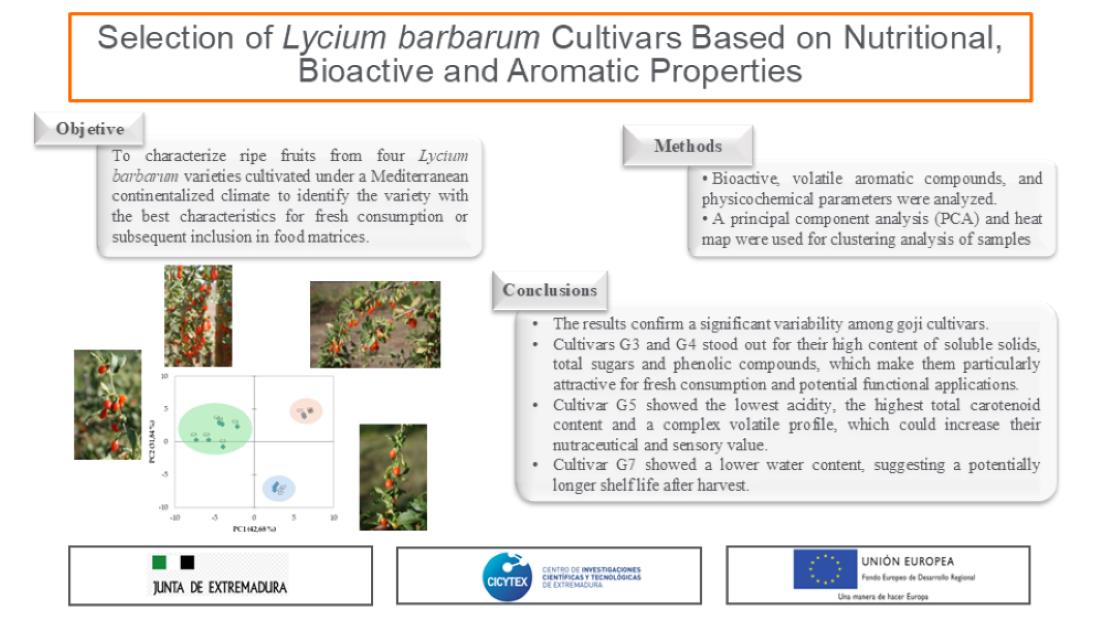
For these reasons, the main objective of the present study was to characterize ripe fruits from four Lycium barbarum cultivars cultivated under a Mediterranean continentalized climate to identify the variety with the best physicochemical characteristics, bioactivity, and aromatic profile as a basis for their suitability for fresh consumption or subsequent inclusion in food matrices.
2. Materials and Methods
2.1. Plant Material, Location, and Growing Conditions
Fruits from four goji berry (Lycium barbarum L.) cultivars (G3, G4, G5 and G7) growing in the experimental fields of the Scientific and Technological Research Center of Extremadura located in Malpartida de Plasencia (Extremadura, Spain) (39° 54′ 31.7ʺ N, 5° 55′ 18.4ʺ W), in 2023 year were analyzed. All cultivars were grown under organic production techniques. The fertilization plan included a compost-based application during the vegetative growth phase and foliar spraying with seaweed-based biostimulants and micronutrients during flowering and fruiting. Pest management was carried out using wettable sulfur applied biweekly from May to August and cinnamon extract applied occasionally for the control of white spider mite (Aceria kuko). Four plots per cultivar (five plants per plot) were established through random allocation. The berries were manually harvested at commercial ripeness, determined by uniform size and color and easy detachment from the plant, and with the stalk preserved to improve their shelf life. Subsequently, the fruits were immediately refrigerated (2 ± 1 °C), and transported to the Agri-Food Technology Institute of Extremadura (CICYTEX-INTAEX), where they were stored at -80 °C until further analysis.
2.2. Methods
2.2.1. Physicochemical Analysis
Goji samples were previously homogenized in a hand mixer and moisture content, total soluble solid (TSS), titratable acidity (TA), and pH were analyzed. Moisture was determined gravimetrically, following the AOAC Official Methods [16]. TSS was determined using a digital refractometer (Atago Model PR-1, Tokyo) and expressed as °Brix. TA was based on titration of the acids present in the berries using a DL50 Graphix automatic titrator (Metter Toledo, S.A.E., Madrid, Spain). For this, three grams of homogenate berries were mixed with 50 mL of deionized water and titrates with sodium hydroxide 0.1 N solution up to pH 8.1, and the results were expressed as percentage of malic acid. pH was measured with a pH-meter (micropH 2000) using a needle electrode (Crison Instruments SA, Barcelona, Spain) after calibration.
2.2.2. Sugar and Organic Acids Content
The berries sugar and organic acid profile were determined according to the procedure previously described by Lozano et al. [17]. For this, 1 gram of homogenized berries were mixed with 10 mL of deionized water. The mixture was centrifuged at 4000g for 10 min at 4 °C and the supernatant was passed through a 0.45-μm filter. For sugar analysis, 10 μl was injected into an Agilent 1100 HPLC system equipped with a refractive index detector (G-1362, Agilent Technology, California, EE.UU.) and Rezex RPM-Monosaccharide PB+2, 8 µm x 300 x 7.8 mm column with deionized water as mobile phase at a flow rate of 0.6 mL min-1. The organic acids were analyzing by injection of 10 μL in Agilent 1200 HPLC system equipped with diode array detector at 210 nm and Rezex ROA-Organic acid, 8 µm x 300 x 7.8 mm column with sulfuric acid as mobile phase at a flow rate of 0.5 mL min-1. The standards used for the identification and quantification of sugars and organic acids were acquired in Sigma Aldrich, and the results were expressed as mg of organic acid per g of dry weight.
2.2.3. Total Phenolic Content and Total Antioxidant Activity
Total phenolic compounds (TPC) were determined according to the procedure described by Fatchurrahman at al. [18]. Firstly, 1 g of goji sample was homogenized in a 30 mL of water: methanol (20:80, v/v) with sodium fluoride (2 mM). The mixture was centrifuged at 4000g for 10 min at 4 °C. Then 100 µL of supernatant was mixed with 1.58 mL water, 100 μL of Folin-Ciocalteu reagent (Panreac, AppliChem), and 300 μL of Na2CO3 solution (200 g/L). After allowing the solution to stand for 2 h, the absorbance was read at 725 nm using a UV–Vis Shimadzu spectrophotometer (Kyoto, Japan). TPC were quantified from a calibration curve using gallic acid (Sigma Aldrich) as a standard, and the results were expressed as mg of gallic acid (GAE) per gram of dry weight.
The antioxidant activity was determined by the radical scavenging activity (DPPH) according to Capotorto et al. [19]. For it, 50 μL of the same extract was mixed with 950 μL of 2,2-diphenyl-1-picrylhydrazyl (DPPH) solution. The absorbance was read at 515 nm after 1 h of incubation in dark conditions. Trolox (Sigma-Aldrich, Heidelberg, Germany) was used as a standard, and the DPPH activity was expressed as grams of trolox equivalents per kg of dry weight (g TE kg−1). The reducing power was determined by the cupric ion reducing activity (CUPRAC) according to Savran et al. [20]. For it, 100 μL of sample extract was mixed with CuCl2 (1 mL, 10 mM), neocuproine (1 mL, 7.5 mM) and NH4Ac buffer (1 mL, 1 M, pH 7.0). The absorbance was read at 450 nm after 1h of incubation in dark conditions. Trolox (Sigma-Aldrich, Heidelberg, Germany) was used as standard, and CUPRAC activity was expressed as milligrams of trolox equivalents per gram of dry weight (mg TE g−1).
2.2.4. Individual Phenolic Compounds
For phenolic profile analysis, goji samples were analyzed according to Manzano et al. [21]. For this, 1 g of goji sample were homogenized with 10 mL of water: methanol (20:80, v/v) with sodium fluoride (2 mM). The mixture was homogenized in an ultrasonic bath (P-Selecta-516, Barcelona, Spain) at 35KHz and 4 °C for 30 min in dark conditions. After this, the extract was centrifuged at 4000g for 10 min at 4 °C. Then, 10 µL of the supernatant was injected into Agilent 1200 HPLC system equipped with a DAD and fluorescence detector to separate and identify the individual phenolic compounds. The compounds identification was performed to compare the retention times and purity peak spectra with stock dissolution. Quantification was performed by chromatographic comparison with authentic markers. Regression analysis of the peak area was performed. The results are expressed as mg phenolic compound (PC) 100 g−1 dry weight.
2.2.5. Total and Individual Carotenoid Compounds
Total carotenoid compounds (TCC) were determined according to the procedure described by Zacarías-Garcia et al. [22]. Firstly, 0.5 g of goji samples were ground and homogenized at 4 °C for 3 min with 12 mL of methanol/acetone/dichloromethane (25:25:50, v/v/v) containing 0.1% BHT and 10 mL of water (extraction solvent) and centrifuged at 4500g for 5 min at 4 °C to recover the organic phase. The aqueous phase was re-extracted two more times with 6 mL of dichloromethane (HPLC grade, Sharlab, Barcelona, Spain) and the organic extracts were saponified in methanolic KOH (12 %, w/v) for 90 min in dark condition. Afterwards, 6 mL of 50 mM Tris-HCl pH 7.5 with 1 M NaCl and 6 mL of dichloromethane were added, shaken and centrifuged at 4500 g for 5 min at 4 °C. The aqueous phase was discarded, and the organic extract was filtered with anhydrous Na2SO4, dried and redissolved in 2 mL of extraction solvent. Subsequently, 25 µL of the redissolved extract was diluted to 1mL with extraction solvent and measured on the UV-Vis spectrophotometer (Shimadzu, Kyoto, Japan) at 450 nm. TCC was quantified from a calibration curve using zeaxanthin (Sigma Aldrich) as standard, and the results were expressed as mg zeaxanthin equivalents per gram of dry weight.
Individual carotenoid compounds were obtained according to Bohoyo-Gil et al. [23] by ultra-high performance liquid chromatography (UHPLC) (Agilent 1290, Agilent Technologies, CA, USA) with a Lichrosorb RP-18 column (4.6 × 200 mm × 10 µm) thermostatically controlled at 28 °C and coupled to a 460 nm DAD detector. The flow rate remained constant at 0.3 mL/min. The mobile phase solvents consisted of acetonitrile/water (85:15, v/v) (phase A), and acetonitrile/methanol/ethyl acetate (60:20:20, v/v/v) (phase B). The gradient elution conditions were 100 % phase A for 4 min, then the gradient changed to 100 % phase B at 4.17 min until 9 min, and finally, the gradient changed to 100 % phase A at 9.17 min until the end of the analysis (11 min). Prior to chromatographic analysis, the extract sample was filtered through a 0.22 µm filter and 1.4 µL was injected into the chromatographic system. Results were expressed as µg compound per g-1 dry weight.
2.2.6. Ascorbic Acid Content
Ascorbic acid content was analyzed following the procedure described by Campos et al. [24] with slight modifications. Thus, 5 g of goji sample were homogenized with 20 mL of an extractant solution of H3PO4 (5% w/v) with 1mM ethylenediaminetetraacetic acid (EDTA). The homogenized extract was filtered through glass wool and brought to a final volume 100 mL with extractant solution. Ascorbic acid was quantified from a calibration curve using L-ascorbic acid as standard (Sigma Aldrich) by UHPLC (Agilent 1290, Agilent Technologies, CA, USA) with a Kinetex C18-100A column (4.6 µm x 250 mm x 5 µm) thermostatically controlled at 25 °C coupled to a Diode array detector at 244 nm. The flow rate was kept constant at 1 mL/min of deionized water/H2SO4 (0.05 %, w/v) at pH 2.2. Prior to chromatographic analysis, the extract sample was filtered through a 0.22 µm filter and 10 µL was injected into the chromatographic system. The results were expressed as mg L-1 ascorbic acid per 100 g of dry weight.
2.2.7. Analysis of Volatile Aromatic Compounds (VOCs)
Solid phase microextraction – gas chromatography - mass spectrometry (SPME-GC–MS) were applied to carry out the analysis of volatile compounds, according to Lu et al. [25] with modifications. For it, five grams of GBs previously homogenized were weighed into a 20 mL glass vial, which was screw-capped with a Teflon-silicone septum. 20 μl of a 4-methyl-1-pentanol methanolic solution (334.4 μg mL-1) was added to each sample to reach a final concentration of 1.22 mg Kg-1. Prior to extraction each sample was equilibrated for 5 min at 37 °C using a CombiPAL autosampler (CTC Analytics, Zwingen, Switzerland). Then, a 1-cm 50/30 μm DVB/CAR/PDMS SPME fibre (Supelco, Bellefonte, PA, USA) was inserted into the vial through the disk and exposed to the headspace for 30 min at 37 °C. The volatile compounds were desorbed by inserting the SPME fibre into the injection port (set at 270 °C) of a Varian CP-3800 gas chromatograph coupled to a Varian Saturn 2200 MS mass spectrometer (Varian Inc., Palo Alto, CA, USA) equipped with a HP-5 capillary column (30 m x 0.32 mm x 0.25 μm; Agilent Technology, Santa Clara, CA, USA) and helium (1 mL min-1) as carrier gas. The oven temperature was set at 35 °C for 10 min, raised to 250 °C at a rate of 7 °C min, and held for 5 min with a total running time of 45 min. The temperatures of transfer line, trap and manifold the mass were 280 °C, 200°C and 60 °C, respectively. The mass spectra were obtained by electronic impact at 70 eV, with one scan s-1 over a m/z range of 40‒300. Compounds were identified by comparing their mass spectra and linear retention indexes (LRI) with those of the injected standards (Sigma–Aldrich, St. Louis, MO, USA) or with mass spectra contained in the NIST. Concentration was estimated by using the internal standard and expressed as μg Kg-1. Only the most abundant compounds were considered.
2.3. Statistical Analysis
All the experiments were performed in triplicate, and the results were expressed as mean ± SD (standard deviation). Normality was checked using the Shapiro-Wilk test, and homoscedasticity was checked using the Levene test. For data with normal distribution and homoscedasticity, the ANOVA test was applied followed by Tukey's post-hoc test. A Kruskal Wallis test followed by Dunn-Bonferroni was performed when data did not present a normal distribution, and a Welch ANOVA test followed by Games-Howell was performed when variances were not equal. All at a probability level (p < 0.05). The principal component analysis (PCA) and heat map were used for clustering analysis of samples. All Statistical analysis was performed using XLSTAT-Pro 201,610 (Addinsoft 2009, París, France) statistical software package
3. Results and Discussion
3.1. Physicochemical Quality Characteristics
There were obvious differences among the four cultivars for the main physicochemical characteristics (Table 1). Moisture content is considered a relevant quality factor in the commercialization of berries, as it is strongly correlated with freshness, texture, and postharvest shelf life. In this regard, the values for this parameter ranged from 78.96 to 84.74 g 100 g⁻¹ fw, which is largely consistent with previous studies, where values were reported to be around 75-85% for a commercial maturity stage [5,8]. Among the different cultivars, G7 exhibited the lowest moisture content, which could be attributed to specific structural characteristics, such as skin composition or cellular architecture, among others. These traits may confer lower susceptibility to physical and microbiological deterioration, thereby contributing to a longer shelf life [26], compared to G3, G4, and G5 cultivars.
Total soluble solids (TSS) and titratable acidity (TA) are key parameters for evaluating the sweetness and sensory quality of goji berries. These parameters reflect the accumulation of dissolved sugars and organic acids during fruit ripening [27]. TSS and TA ranged from 17.73 % to 20.27 % and 0.34 % to 0.42 %, respectively. Previous studies characterized the same cultivars but grown in 2022 year, showing a significantly lower TSS (p < 0.05) [5], suggesting the influence of year on TSS content. In the current study, G3 and G4 cultivars exhibited the highest levels of TSS (p < 0.001). Regarding TA, it was the G5 variety that showed a significantly lower content (p < 0.05). Moreover, the results were similar (p > 0.05) to those found in 2022 for the same cultivars [5], indicating that acidity is not affected by the year of harvest.
The ratio of total soluble solids to titratable acidity (TSS/TA), defined as the ripening index (RI), is a key indicator of maturity stage and organoleptic quality in fruits [27]. Cultivar G5 exhibited the highest RI value (54.8), followed in decreasing order by G4, G3, and G7 (51.2, 48.8, and 44.5, respectively) (p < 0.001). These results are consistent with those reported for the same cultivars in a different harvest year (31.7–52.9) [5], and higher than the values observed by Polat et al. [28] in goji berries grown in Turkey, which ranged from 29.9 to 44.9. These findings confirm that the fruit was harvested at an appropriate stage of ripeness and suggest better consumer acceptability in terms of taste and sweetness [29].
3.2. Sugar and Organic Acids Composition
Goji berries are known for their high sugar content, mainly glucose and fructose, although smaller amounts of sucrose may also be present [5,27]. However, there is considerable variability in both individual and total sugar content depending on the cultivar, growing conditions, ripening stage, and postharvest techniques [8], making their analysis a key step in defining the sensory profile of each cultivar. Table 2 of this study presents the individual and total sugar and organic acid content of the four cultivars studied. Glucose and fructose monosaccharides were the only sugars identified, with concentrations ranging from 26.36 to 44.10 g 100 g⁻¹ dw and 28.99 to 50.77 g 100 g⁻¹ dw, respectively. The disaccharide sucrose was not detected in any of the cultivars studied, which could be attributed to its complete hydrolysis into glucose and fructose in fully ripened fruits [30]. The total sugar content ranged from 55.36 to 92.81 g 100 g⁻¹ dw, showing considerable variability among cultivars, with G3 and G4 cultivars showing significantly higher content (p < 0.05), and G7 the lowest content (p < 0.05). In this context, and in line with consumer preferences, cultivars G3 and G4 would be more attractive for commercialization as fresh fruit due to their higher sweetness (88.34 and 92.81 g 100 g⁻¹ dw, respectively), in contrast to cultivars G5 and G7 (55.36 and 70.95 g 100 g⁻¹ dw, respectively), which may be more suitable for the development of functional food products such as snacks or juices [8].
On the other hand, among the numerous bioactive compounds present in goji berries, organic acids play an essential role in the sensory, functional, and nutritional characteristics of these fruits, influencing flavor, stability, and the bioavailability of other nutrients [8]. In this study, a total of six organic acids were identified (oxalic, citric, tartaric, malic, ascorbic, and succinic acids), as shown in Table 2. The results indicate that citric acid is the predominant organic acid in goji berries (0.68 - 4.45 g 100 g⁻¹ dw), followed by tartaric acid (1.00 - 1.53 g 100 g⁻¹ dw), and malic acid (0.47 - 1.73 g 100 g⁻¹ dw). These acids represent 81.5% of the total organic acids in this type of berries, being therefore the main contributors to the organoleptic acidity of these fruits, which are often described as sour by consumers [31].
The remaining identified organic acids showed average concentrations below 0.7 g 100 g⁻¹ dw. In this regard, succinic acid represents 12.2% of the total organic acid content and contributes to potential "bitter" notes. On the other hand, ascorbic acid, accounting for 6.5 % of total organic acids, is a powerful antioxidant with important nutritional and functional implications, although its concentration varies mainly depending on the fruit’s ripeness, cultivar, and climatic conditions [30]. According to previous studies, Tibetan cultivars and those grown in colder regions tend to produce berries with significantly higher ascorbic acid content [32]. Lastly, oxalic acid represents only 0.32 % of the total organic acid content, and although toxic at high concentrations, its presence in goji berries is limited, with a primarily metabolic role linked to the tricarboxylic acid cycle and osmotic regulation [26].
The results presented here are comparable to the organic acid profiles previously reported for goji berries grown in Portugal [33] and Turkey [32]. Statistical analysis showed significant differences between cultivars in the content of all organic acids, except for succinic acid, as well as in total organic acid content, which ranged from 3.71 to 7.31 g 100 g⁻¹ dw.
3.3. Bioactive Quality Characteristics
3.3.1. Phenolic Compounds
Total and individual phenolic compounds of different goji berry cultivars are presented in Table 3. The total phenolic content (TPC) ranged from 14.83 to 19.11 mg GAE g⁻¹ dw. The G3 and G4 cultivars exhibited the highest TPC (p < 0.05), followed in decreasing order by G7 and G5. TPC can vary between studies depending on factors such as the extraction method, berry cultivar, location, and storage conditions, with reported values ranging from 2.9 mg GAE g⁻¹ dw [18] to 57 mg GAE g⁻¹ dw [34]. The values obtained in this study fall within the mid-range of these reported TPC levels and are slightly higher than those obtained in previous work by the research team (8.03 – 15.5 mg GAE g-1 dw) [5]. This result suggests that, under the same growing conditions, the harvest year may produce slight changes in the bioactive compounds content [35].
Phenolic compounds are chemically diverse and include phenolic acids, flavonoids, anthocyanins, and stilbenes, each exhibiting distinct bioavailability, stability, and biological activity [36]. Therefore, their individual identification is crucial. The findings of this study reveal a diverse composition of phenolic compounds in goji berries, with phenolic acids predominating over flavonoids (Table 3). Thus, the identification of six distinct compounds, including five phenolic acids (chlorogenic_AClo, neochlorogenic_AnClo, p-coumaroylquinic_ApC, p-coumaric_ApCou, and trans-ferulic_t-Fer acids) and one flavonoid (ruthin_Rut), underscores the phytochemical richness of this fruit and its potential bioactive, according with previous studies [26].
Neochlorogenic acid (AnClo) was the most abundant compound, with concentrations ranging from 287 to 1214 μg g⁻¹ dw, suggesting its key role in the antioxidant activity of goji berries. In comparison, chlorogenic acid (AClo) was present at significantly lower levels (89–213 μg g⁻¹ dw), though it remains an important component due to its well-documented ability to modulate inflammatory responses and protect against oxidative stress [34]. These findings are consistent with previous studies on goji berries [37], which have reported a higher abundance of AClo and its positional isomers, including AnClo. This variation has been linked to factors such as harvest timing and fruit maturity [38]. For example, Zhang et al. [39] and Rubio et al. [5] reported AClo concentrations ranging from 112 to 525 μg g⁻¹ fw and 540-1077 μg g−1 dw, respectively but did not identify AnClo in any of them, while Breniere et al. [37] detected AClo and AnClo at levels of 16.02 and 11.44 mg kg⁻¹ dw, respectively, significantly lower than those found in the present study. Both compounds were found in significantly lower amounts in the G7 variety compared to the others (p < 0.05). These discrepancies suggest that phenolic composition is primarily influenced by genetic factors, as well as environmental conditions during cultivation, among other variables. The relative proportions of AClo and its isomers (AnClo) depend on the enzymatic pathways involved in their biosynthesis, particularly the activity of hydroxycinnamoyl-CoA quinate transferase (HQT) and hydroxycinnamoyl-CoA shikimate transferase (HCT). A higher expression or activity of HCT in a specific goji berry cultivar favors the biosynthesis of neochlorogenic acid, whereas a predominance of HQT activity results in increased chlorogenic acid production [40].
p-Coumaroylquinic acid (ApC) and trans-ferulic acid (t-Fer) were also identified in substantial amounts, with concentrations ranging from 41 to 209 μg g⁻¹ dw and 30 to 45 μg g⁻¹ dw, respectively. These results are consistent with previous studies on the classification of different Lycium barbarum cultivars grown in the south westernmost region of Europe [5]. Both compounds have been extensively reported in the literature for their roles in promoting cardiovascular health and exhibiting antimicrobial potential against various pathogens, further emphasizing their relevance in human nutrition [41]. Moreover, p-coumaric acid (ApCou) and rutin (Rut) were detected exclusively in G5 cultivar, with concentrations of 7 and 13 μg g⁻¹ dw, respectively, suggesting cultivar-specific chemical variability.
The significant differences observed among cultivars indicate that the phenolic composition of goji berries is likely influenced by genetic, environmental, and agronomic factors. This underscores the importance of selecting cultivars with specific phytochemical profiles, given their nutraceutical potential as valuable sources of bioactive compounds beneficial to human health [26].
3.3.2. Carotenoid Compounds
Carotenoids are essential bioactive compounds in goji berries due to their antioxidant properties and their role in determining the fruit’s color and nutritional value [39]. In this study, the total carotenoid content (TCC) ranged from 1.13 to 2.45 mg βCE g⁻¹ dw (Table 3), aligning with previous studies on goji berries cultivated in Spain, France and Serbia [5,37,42]. Among the analyzed cultivars, G5 exhibited the highest TCC concentration (p < 0.05). Regarding the individual carotenoid profile, five major compounds were identified: capsanthin (Cap), zeaxanthin (Zea), β-cryptoxanthin (β-Crp), α-carotene (α-Car), and β-carotene (β-Car). Zea was the predominant carotenoid across all cultivars, with concentrations ranging from 1026 to 1722 µg g⁻¹ dw, showing no significant differences among them (p > 0.05). This finding is consistent with previous studies identifying zeaxanthin as the primary carotenoid in goji berries [5,37], a crucial aspect given its role in eye health and its potential applications in the nutraceutical industry. In contrast, α-Car, Cap, and β-Crp were present in lower amounts, with concentrations ranging from 44 to 164 µg g⁻¹ dw, 32 to 147 µg g⁻¹ dw, and 15 to 36 µg g⁻¹ dw, respectively. The G3 cultivar exhibited the highest concentrations of α-Car and Cap (p < 0.05), which may influence fruit color intensity and antioxidant capacity. Meanwhile, β-Car was the least abundant carotenoid, with the highest concentration observed in the G4 cultivar. The literature reveals substantial variation in carotenoid composition and content among different studies. Zhang et al. [39] identified Zea as the predominant carotenoid, according with our study, but reported highly variable concentrations among cultivars (17–9306 µg g⁻¹ fw). Additionally, lutein (10–79 µg g⁻¹ fw), β-Crp (9–739 µg g⁻¹ fw), neoxanthin (3–265 µg g⁻¹ fw), and β-Car (18–413 µg g⁻¹ fw) were identified, with higher concentrations than those found in this study.
3.3.3. Antioxidant Activity
The antioxidant capacity was assessed using the DPPH and CUPRAC methods, and the results are shown in Table 3. In the DPPH assay, the values obtained (10.04–12.42 mg TE g⁻¹ dw) indicate moderate antioxidant activity, with differences observed among the cultivars. The G7 cultivar exhibited the lowest antioxidant capacity compared to G3, G5, and G4 (p < 0.05). Similar values ranging from 6.7 to 17.6 mg TE g⁻¹ dw have been reported in other studies [5], while Islam et al. [43] reported lower values (16-36 μmol TE g⁻¹ dw) in goji berries grown in China. These discrepancies could be attributed to variations in the phenolic compounds concentration and other antioxidant metabolites present in each cultivar. Previous studies have shown that genetic factors, grown conditions and ripeness can influence the accumulation of these compounds, which may explain the observed differences between studies [10,26]. In contrast, the CUPRAC assay yielded higher values (105–126 mg TE g⁻¹ dw), indicating a higher capacity for cupric ion reduction. These results are consistent with those reported by Turan et al. [44], who found values of 152 to 206 mg TE g⁻¹ dw. In contrast to DPPH assay, no significant differences were found among cultivars in the CUPRAC assay (p > 0.05). This suggests that, although some differences in antioxidant capacity are evident in the DPPH assay, the overall reducing power of the antioxidant compounds in goji berries is relatively consistent across the evaluated cultivars.
3.4. Volatile Organic Compounds (VOCs)
A total of 26 volatile organic compounds (VOCs) were identified in goji berries, which were classified into the following chemical families: alcohols, aldehydes, ketones, esters, and aromatic compounds, with the latter represented exclusively by eucalyptol. Figure 1 shows the total VOCs content by chemical family, expressed in µg g⁻¹ of fresh weight (fw). Overall, aldehydes were the predominant chemical family, followed by alcohols, esters, and ketones. The predominance of aldehydes as the main chemical group is consistent with previous findings in goji berries from Ningxia [25], where significant differences among cultivars were observed for all chemical families except aldehydes. Cultivar G5 showed the highest abundance of alcohol, followed in decreasing order by G7, G4, and G3 (p < 0.001). Ketone levels were higher in G5 and G4 compared to G3 (p < 0.01). Regarding esters, cultivars G7 and G5 exhibited higher amounts than G3 and G4 (p < 0.001). Therefore, cultivar G5 presented the highest total abundance of volatile compounds among all cultivars analyzed in this study, suggesting significant differences in secondary metabolism between cultivars.
The volatile profile richest in alcohol observed in cultivar G5 could be associated with increased alcohol dehydrogenase activity in this cultivar, an enzyme that plays a key role in the conversion of aldehydes to alcohols during fruit ripening [45]. In fact, individual volatile compounds such as 1-hexanol and 1-octen-3-ol (Table 4) are associated with green, floral, and fresh aromatic notes, which may contribute positively to the sensory profile of this variety. Moreover, both volatiles have been correlated with a potential role in the plant’s defense mechanisms against biotic or abiotic stress [25]. Previous studies in strawberry, peach, and nectarine [46] indicate that a higher abundance of alcohols is often correlated with higher sensory acceptance by consumers, which could imply added value for this specific cultivar when incorporating goji berries into food-derived products.
Hierarchical clustering heatmaps are based on replacing the relationship between samples with a distance measure, thereby grouping similar samples into the same category. This method has previously been applied to compare differences among various goji berry cultivars [25]. The hierarchical clustering of the goji berry cultivars analyzed in the present study is shown in Figure 2. The horizontal axis represents the number of goji berry samples analyzed, while the vertical axis corresponds to the identified volatile compounds. Blue and red blocks indicate relatively low and high contents, respectively. Figure 2 clearly illustrates that the relative content of volatile compounds varies among cultivars. Most volatiles were significantly lower in cultivars G3 and G4, whereas G5 and G7 exhibited notably higher levels. Additionally, column clustering followed a bottom-up approach. At layer 0, samples were classified individually. At layer 1, experimental replicates within the same cultivar were grouped together. As clustering progressed, cultivars G3 and G4 were grouped into the same class, in contrast to G5 and G7. At the highest level, a clear distinction was observed for cultivar G5, which separated from the rest of the analyzed cultivars. These results indicate that varietal genetics plays a key role in determining both the quantity and type of volatile compounds produced, consistent with the findings reported by [13].
Table 4 presents the differential quantification of the individual volatile compounds identified across the different goji berry cultivars analyzed in this study. A total of 26 volatile compounds were detected, including 10 alcohols, 9 aldehydes, 3 ketones, 3 esters, and a single aromatic compound (eucalyptol). Comparative analysis revealed significant differences in both the quantity and type of volatile compounds present in each cultivar, highlighting the important role of genotype in shaping the volatile profile. This finding aligns with Zhou et al. [13], who reported a high degree of differentiation among goji berry cultivars and their geographic origins based on volatile compound analysis.
Aldehydes were the most abundant chemical family, with hexanal being the predominant compound across all cultivars, ranging from 11.43 to 15.93 µg/g. The high concentration of hexanal is consistent with its well-known contribution to the aroma of fruits and vegetables, where it imparts green, herbaceous, and fresh notes typical of freshly harvested products [47]. No significant differences were observed in hexanal content among cultivars, suggesting the conservation of specific biosynthetic pathways across genotypes. In this regard, previous studies in goji berries have also identified hexanal, along with 2-hexenal and 2-heptenal, as dominant aldehydes [13,25,48], all of which are associated with the oxidation of unsaturated fatty acids such as linoleic acid (C18:2 n-6), which accounts for approximately 60% of the total fatty acids in these fruits [49]. The low concentrations of 2-hexenal and 2-heptenal observed in the present study suggest limited activity of the lipoxygenase pathway in the cultivars analyzed, ensuring a uniform set of aroma characteristics associated with these VOCs [13].
Regarding alcohols, cultivar G5 exhibited the highest total abundance, with notable levels of 1-hexanol (10.49 µg/g) and 1-octen-3-ol (16.71 µg/g), compounds known for their herbaceous and earthy aroma descriptors [46]. This suggests that G5 may possess a more intense aromatic profile compared to the other cultivars. Cultivar G7 also showed elevated levels, particularly of 1-pentanol (1.14 µg/g) and 3-hexen-1-ol (3.86 µg/g), both associated with green and fresh aromatic notes [47], while G3 and G4 presented lower contents for most quantified alcohols. These findings suggest higher enzymatic activity in the metabolic pathways of cultivars G5 and G7.
The Ketones family were present in lower amounts, although certain compounds such as 3-buten-2-one were significantly more abundant in G5, suggesting enhanced activity of metabolic pathways associated with carotenoid degradation [12]. Additionally, 5,9-undecadien-2-one a compound with potential fruity or floral aromatic contributions [50] was exclusively detected in cultivars G4 and G5. This restricted distribution supports the hypothesis of cultivar-specific metabolic differences, likely driven by differential expression of enzymes involved in the conversion of carotenoids to oxygenated volatile compounds [46].
With respect to esters, which are commonly associated with fruity and sweet aromas [47], G5 and G7 exhibited higher levels of VOCs such as methyl salicylate, a compound with pleasant sensory attributes and potential functional value [51]. The presence of 2-hexenoic acid, ethyl ester and butanoic acid, butyl ester was also higher in these cultivars, which may be linked to a higher degree of fruit ripeness at harvest [46].
Finally, in the category of aromatic compounds, only eucalyptol was identified. This monoterpene is widely reported in plant-derived foods for its fresh, mentholated aroma and has previously been described in goji berries [51]. In the present study, it was the only aromatic compound detected and showed notable differences among cultivars. G7 exhibited the highest concentration (7.47 µg/g), followed by G5 (5.74 µg/g), potentially conferring unique aromatic traits to these fruits, with implications for commercial differentiation.
Altogether, the above findings confirm that the volatile compound profile of goji berries is highly cultivar dependent. In this regard, cultivar G5 stood out for its higher total content and diversity of VOCs, suggesting greater aromatic potential and possibly higher sensory acceptance. This makes G5 particularly suitable for both fresh consumption and its incorporation into food matrices as a source of bioactive compounds.
3.5. PCA Analysis
To understand the interrelationships among the variables studied and the results obtained for the different samples, a Principal Component Analysis (PCA) was performed, which helped to clarify the underlying patterns in the data. The first two principal components accounted for 74.52% of the total variance, indicating that a two-dimensional representation of the data provides an adequate summary of the information. The first principal component (PC1) explained 42.68% of the total variance and was primarily defined by six volatile organic compounds (1-octen-3-ol, 2,5-pentadecadien-1-ol, 1-octanol, 2-nonen-1-ol, 2,6-octadienal, and 3-buten-2-one) and pH, all showing strong positive loadings (> 0.9). On the negative side of this axis, titratable acidity and glucose were located. The second principal component (PC2) accounted for 31.84% of the total variance and was positively associated with moisture, fructose, citric acid, and neochlorogenic acid, all of which exhibited high factor loadings (> 0.9). Conversely, three volatile organic compounds (3-hexen-1-ol, 1-penten-3-one, and 2-hexanoic acid) showed negative associations with this component.
When the samples were plotted in the space defined by the first two principal components (Figure 3), clear differentiation among cultivars was observed. Cultivars G3 and G4 were located on the negative side of PC1 (scores between -2 and -7), which can be attributed to their lower pH and volatile compound levels, and higher titratable acidity and glucose contents. This profile may correspond to a more acidic and less aromatic sensory profile. In contrast, cultivars G5 and G7 were positioned on the positive side of PC1, indicating a more balanced and aromatic physicochemical profile. PC2 contributed complementary information regarding the physicochemical composition and aroma of the studied fruits. All cultivars showed positive PC2 scores, except for G7, which had strongly negative values (between -7 and -8). This was mainly due to lower levels of moisture, fructose, citric acid, and neochlorogenic acid, along with higher concentrations of specific volatile compounds such as 3-hexen-1-ol and 1-penten-3-one. This profile suggests a similarly aromatic, but less sweet sensory character compared to the other cultivars evaluated.
4. Conclusions
The present study revealed significant variability among goji cultivars in their physicochemical characteristics, bioactive compound composition, and aromatic profile. Cultivars G3 and G4 stood out due to their high content of soluble solids, total sugars, and phenolic compounds—attributes that make them particularly attractive for fresh consumption and potential functional applications. G5 exhibited the lowest acidity and the highest total carotenoid content, along with a complex volatile profile, which could enhance its nutraceutical and sensory value. Meanwhile, G7 showed a lower water content, suggesting a potentially longer postharvest shelf life. Differences in antioxidant activity, as well as in the presence of specific phenolic and volatile compounds, highlight the influence of cultivar on the fruit’s quality and functionality, opening new opportunities for valorization according to commercial end-use. However, further studies are needed to explore the potential application of goji berries in the development of value-added food products, with the aim of enhancing their nutritional and functional properties.
Author Contributions
Conceptualization, M.J.R., and P.C.M; methodology, P.C.M., M.R.G., and N.N.B.; software, J.C.S., and M.J.R.; validation, J.C.S., M.J.R., and P.C.M.; formal analysis, J.C.S., and P.C.M.; investigation, J.C.S., P.C.M., and M.J.R.; resources, J.C.S., M.R.G., and N.N.P.; data curation, J.C.S.; writing—original draft preparation, J.C.S.; writing—review and editing, J.C.S.; M.J.R and P.C.M.; visualization, M.R.G.; supervision, M.J.R. and P.C.M.; project administration, M.J.R., and P.C.M.; funding acquisition, P.C.M.. All authors have read and agreed to the published version of the manuscript.
Funding
This research was funded by Junta de Extremadura and the European FEDER Funds for financial support (VAVEGEX and ECOBERRY projects).
Data Availability Statement
Data will be made available on request
Acknowledgments
The authors would like to thank the Junta de Extremadura and the European FEDER Funds for the financial support (VAVEGEX and ECOBERRY projects).
Conflicts of Interest
The authors declare no conflicts of interest.
Abbreviations
| α-Car | α-Carotene |
| β-Car | β-carotene |
| β-Crp | β-Cryptoxanthin |
| Cap | Capsanthin |
| AClo | Chlorogenic Acid |
| AnClo | Neoclorogenic Acid |
| ApC | p-coumaroylquinic |
| ApCou | p-coumaric acid |
| GB | Goji Berry |
| LRI | Linear Retention Index |
| PCA | Principal Component Analysis |
| TCC | Total Carotenoid Content |
| TPC | Total Phenolic Compounds |
| Rut | Ruthin |
| t-Fer | t-ferulic acid |
| TSS | Total Soluble Solid |
| TA | Titratable acidity |
| VOC | Volatile Organic Compound |
| Zea | Zeaxanthin |
References
- Antonelli, M.; Donelli, D. Health-Promoting Effects of Goji Berries (Lycium Barbarum): A Literature Overview. Biology and Life Sciences Forum 2024, 40, 1. [Google Scholar] [CrossRef]
- Shi, X.; Wang, X.; Zheng, Y.; Fu, L. Advances in the Study of Bioactive Compounds and Nutraceutical Properties of Goji Berry (Lycium Barbarum L.). Applied Sciences 2024, 15, 262. [Google Scholar] [CrossRef]
- FAO What Are Healthy Diets? Joint Statement by the Food and Agriculture Organization of the United Nations and the World Health Organization. 2024.
- Ceccarini, M.R.; Codini, M.; Cataldi, S.; Fioretti, B.; Brecchia, G.; Albi, E.; Beccari, T. Licium Barbarum Cultivated in Italy: Chemical Characterization and Nutritional Evaluation. Italian Journal of Food Science 2022. [Google Scholar] [CrossRef]
- Rubio, R.M.; García, M.R.; Barroso, N.N.; Iñiguez, F.M.S.; Gómez, M.J.R.; Magro, P.C. Classification of Goji Berry (Lycium Barbarum L.) Varieties According to Physicochemical and Bioactive Signature. European Food Research and Technology 2024. [Google Scholar] [CrossRef]
- Li, X.; Holt, R.R.; Keen, C.L.; Morse, L.S.; Yiu, G.; Hackman, R.M. Goji Berry Intake Increases Macular Pigment Optical Density in Healthy Adults: A Randomized Pilot Trial. Nutrients 2021, 13, 4409. [Google Scholar] [CrossRef]
- Sun, Q.; Du, M.; Kang, Y.; Zhu, M.J. Prebiotic Effects of Goji Berry in Protection against Inflammatory Bowel Disease. Crit Rev Food Sci Nutr 2023, 63, 5206–5230. [Google Scholar] [CrossRef]
- Yu, J.; Yan, Y.; Zhang, L.; Mi, J.; Yu, L.; Zhang, F.; Lu, L.; Luo, Q.; Li, X.; Zhou, X.; et al. A Comprehensive Review of Goji Berry Processing and Utilization. Food Sci Nutr 2023, 11, 7445–7457. [Google Scholar] [CrossRef]
- Fernández-Ríos, A.; Laso, J.; Aldaco, R.; Margallo, M. Superfoods: A Super Impact on Health and the Environment? Curr Opin Environ Sci Health 2023, 31, 100410. [Google Scholar] [CrossRef]
- Vidović, B.B.; Milinčić, D.D.; Marčetić, M.D.; Djuriš, J.D.; Ilić, T.D.; Kostić, A.; Pešić, M.B. Health Benefits and Applications of Goji Berries in Functional Food Products Development: A Review. Antioxidants 2022, Vol. 11, Page 248 2022, 11, 248. [Google Scholar] [CrossRef]
- Aguilera, J.M. Berries as Foods: Processing, Products, and Health Implications. Annu Rev Food Sci Technol 2024, 15, 1–26. [Google Scholar] [CrossRef]
- Peng, Q.; Huang, J.; Li, S.; Massou, B.B.; Chen, Z.; Zhu, Q.; Xie, G. Comprehensive Origin Authentication of Wolfberry Pulp (Lycium Barbarum L.) Using Multimodal Sensory Analysis and Chemometrics. Ind Crops Prod 2024, 219, 119023. [Google Scholar] [CrossRef]
- Zhou, Y.; Wang, D.; Duan, H.; Zhou, S.; Guo, J.; Yan, W. Detection and Analysis of Volatile Flavor Compounds in Different Varieties and Origins of Goji Berries Using HS-GC-IMS. LWT 2023, 187, 115322. [Google Scholar] [CrossRef]
- Oğuz, İ.; Oğuz, H.İ.; Ürün, İ.; Attar, Ş.H.; Atasever, S.; Kafkas, N.E. Determination of Aroma and Protein Contents in Organic Lycium Barbarum L. and Lycium Chinense Miller Fruits in Different Ripening Periods. Erwerbs-Obstbau 2023, 65, 1171–1183. [Google Scholar] [CrossRef]
- de Freitas Santos Júnior, A.; Mota, M.D.; de Aragão Tannus, C.; de Souza Dias, F.; de Andrade Santana, D.; Moura, H.F.S.; Magalhães, H.I.F. Phytochemical, Biological and Technological Aspects of Phenolic Bioactives in Goji Berries. Phytochemicals in Goji Berries 2020, 15–37. [Google Scholar] [CrossRef]
- AOAC Moisture in Malt Gravimetric Method. (935.29). In Official Methods of Analysis (17th Ed.); Association of Official Analytical Chemist: Gaithersburg, Maryland, 2000.
- Lozano, M.; Vidal-Aragón, M.C.; Hernández, M.T.; Ayuso, M.C.; Bernalte, M.J.; García, J.; Velardo, B. Physicochemical and Nutritional Properties and Volatile Constituents of Six Japanese Plum (Prunus Salicina Lindl.) Cultivars. European Food Research and Technology 2009, 228, 403–410. [Google Scholar] [CrossRef]
- Fatchurrahman, D.; Amodio, M.L.; Colelli, G. Quality of Goji Berry Fruit (Lycium Barbarum L.) Stored at Different Temperatures. Foods 2022, 11, 3700. [Google Scholar] [CrossRef]
- Capotorto, I.; Amodio, M.L.; Diaz, M.T.B.; de Chiara, M.L.V.; Colelli, G. Effect of Anti-Browning Solutions on Quality of Fresh-Cut Fennel during Storage. Postharvest Biol Technol 2018, 137, 21–30. [Google Scholar] [CrossRef]
- Savran, A.; Zengin, G.; Aktumsek, A.; Mocan, A.; Glamoćlija, J.; Ćirić, A.; Soković, M. Phenolic Compounds and Biological Effects of Edible Rumex Scutatus and Pseudosempervivum Sempervivum: Potential Sources of Natural Agents with Health Benefits. Food Funct 2016, 7, 3252–3262. [Google Scholar] [CrossRef]
- Manzano Durán, R.; Sánchez, J.E.F.; Velardo-Micharet, B.; Gómez, M.J.R. Multivariate Optimization of Ultrasound-Assisted Extraction for the Determination of Phenolic Compounds in Plums (Prunus Salicina Lindl.) by High-Performance Liquid Chromatography (HPLC). Instrum Sci Technol 2020, 48, 113–127. [Google Scholar] [CrossRef]
- Zacarías-Garcia, J.; Carlos, G.; Gil, J.V.; Navarro, J.L.; Zacarías, L.; Rodrigo, M.J. Juices and By-Products of Red-Fleshed Sweet Oranges: Assessment of Bioactive and Nutritional Compounds. Foods 2023, 12, 400. [Google Scholar] [CrossRef] [PubMed]
- Bohoyo-Gil, D.; Dominguez-Valhondo, D.; García-Parra, J.J.; González-Gómez, D. UHPLC as a Suitable Methodology for the Analysis of Carotenoids in Food Matrix. European Food Research and Technology 2012, 235, 1055–1061. [Google Scholar] [CrossRef]
- Campos, F.M.; Ribeiro, S.M.R.; Della Lucia, C.M.; Pinheiro-Sant’Ana, H.M.; Stringheta, P.C. Optimization of Methodology to Analyze Ascorbic and Dehydroascorbic Acid in Vegetables. Quim Nova 2009, 32, 87–91. [Google Scholar] [CrossRef]
- Lu, J.; Li, H.; Quan, J.; An, W.; Zhao, J.; Xi, W. Identification of Characteristic Aroma Volatiles of Ningxia Goji Berries (Lycium Barbarum L.) and Their Developmental Changes. Int J Food Prop 2017, 20, S214–S227. [Google Scholar] [CrossRef]
- Ma, R.H.; Zhang, X.X.; Ni, Z.J.; Thakur, K.; Wang, W.; Yan, Y.M.; Cao, Y.L.; Zhang, J.G.; Rengasamy, K.R.R.; Wei, Z.J. Lycium Barbarum (Goji) as Functional Food: A Review of Its Nutrition, Phytochemical Structure, Biological Features, and Food Industry Prospects. Crit Rev Food Sci Nutr 2023, 63, 10621–10635. [Google Scholar] [CrossRef] [PubMed]
- Zhang, X.; Wei, X.; Ali, M.M.; Rizwan, H.M.; Li, B.; Li, H.; Jia, K.; Yang, X.; Ma, S.; Li, S.; et al. Changes in the Content of Organic Acids and Expression Analysis of Citric Acid Accumulation-Related Genes during Fruit Development of Yellow (Passiflora Edulis f. Flavicarpa) and Purple (Passiflora Edulis f. Edulis) Passion Fruits. International Journal of Molecular Sciences 2021, 22, 5765. [Google Scholar] [CrossRef]
- Polat, M.; Mertoglu, K.; Eskimez, I.; Okatan, V. Effects of the Fruiting Period and Growing Seasons on Market Quality in Goji Berry (Lycium Barbarum L.). Folia Horticulturae 2020, 32, 229–239. [Google Scholar] [CrossRef]
- Valero, D.; Serrano, M. Postharvest Biology and Technology for Preserving Fruit Quality; 2010. [Google Scholar]
- Zhao, J.; Li, H.; Xi, W.; An, W.; Niu, L.; Cao, Y.; Wang, H.; Wang, Y.; Yin, Y. Changes in Sugars and Organic Acids in Wolfberry (Lycium Barbarum L.) Fruit during Development and Maturation. Food Chem 2015, 173, 718–724. [Google Scholar] [CrossRef]
- Mutyam, S.; Chilakala, S.; Tallapally, M.; Upadhyayula, V.V.R. Gas Chromatography–Mass Spectrometric Determination of Organic Acids in Fruit Juices by Multiwalled Carbon Nanotube–Based Ion-Pair Dispersive Solid-Phase Extraction and in Situ Butylation. Rapid Communications in Mass Spectrometry 2021, 35, e9165. [Google Scholar] [CrossRef]
- Kafkas, N.E.; Oğuz, H.İ.; Oğuz, İ. Evaluation of Fruit Characteristics of Various Organically-Grown Goji Berry (Lycium Barbarum L., Lycium Chinense Miller) Species during Ripening Stages. Journal of Food Composition and Analysis 2021, 101, 103846. [Google Scholar] [CrossRef]
- Pires, T.C.S.P.; Dias, M.I.; Barros, L.; Calhelha, R.C.; Alves, M.J.; Santos-Buelga, C.; Ferreira, I.C.F.R. Phenolic Compounds Profile, Nutritional Compounds and Bioactive Properties of Lycium Barbarum L.: A Comparative Study with Stems and Fruits. Ind Crops Prod 2018, 122, 574–581. [Google Scholar] [CrossRef]
- Jeepipalli, S.P.K.; Xu, B. Phenolic Profiles and Antioxidant Properties of Goji Berries (Lycium Barbarum). Phytochemicals in Goji Berries 2020, 225–232. [Google Scholar] [CrossRef]
- Poggioni, L.; Romi, M.; Guarnieri, M.; Cai, G.; Cantini, C. Nutraceutical Profile of Goji (Lycium Barbarum L.) Berries in Relation to Environmental Conditions and Harvesting Period. Food Biosci 2022, 49, 101954. [Google Scholar] [CrossRef]
- Vuolo, M.M.; Lima, V.S.; Maróstica Junior, M.R. Phenolic Compounds: Structure, Classification, and Antioxidant Power. Bioactive Compounds: Health Benefits and Potential Applications 2019, 33–50. [Google Scholar] [CrossRef]
- Breniere, T.; Fanciullino, A.L.; Dumont, D.; Le Bourvellec, C.; Riva, C.; Borel, P.; Landrier, J.F.; Bertin, N. Effect of Long-Term Deficit Irrigation on Tomato and Goji Berry Quality: From Fruit Composition to in Vitro Bioaccessibility of Carotenoids. Front Plant Sci 2024, 15, 1339536. [Google Scholar] [CrossRef] [PubMed]
- Cui, M.; Xiao, M.; Zhang, D.; Xie, Z. Characterization of Goji Quality at Different Harvest Stages in Qaidam Basin Based on Transcriptome and Widely Targeted Metabolome. J Food Biochem 2024, 2024, 1139944. [Google Scholar] [CrossRef]
- Zhang, Q.; Chen, W.; Zhao, J.; Xi, W. Functional Constituents and Antioxidant Activities of Eight Chinese Native Goji Genotypes. Food Chem 2016, 200, 230–236. [Google Scholar] [CrossRef]
- Su, Z.; Jia, H.; Sun, M.; Cai, Z.; Shen, Z.; Zhao, B.; Li, J.; Ma, R.; Yu, M.; Yan, J. Integrative Analysis of the Metabolome and Transcriptome Reveals the Molecular Mechanism of Chlorogenic Acid Synthesis in Peach Fruit. Front Nutr 2022, 9, 961626. [Google Scholar] [CrossRef]
- Zhao, Z.; Moghadasian, M.H. Chemistry, Natural Sources, Dietary Intake and Pharmacokinetic Properties of Ferulic Acid: A Review. Food Chem 2008, 109, 691–702. [Google Scholar] [CrossRef]
- Ilić, T.; Dodevska, M.; Marčetić, M.; Božić, D.; Kodranov, I.; Vidović, B. Chemical Characterization, Antioxidant and Antimicrobial Properties of Goji Berries Cultivated in Serbia. Foods 2020, 9, 1614. [Google Scholar] [CrossRef]
- Islam, T.; Yu, X.; Badwal, T.S.; Xu, B. Comparative Studies on Phenolic Profiles, Antioxidant Capacities and Carotenoid Contents of Red Goji Berry (Lycium Barbarum) and Black Goji Berry (Lycium Ruthenicum). Chem Cent J 2017, 11, 1–8. [Google Scholar] [CrossRef] [PubMed]
- Turan, B.; Tekin-Cakmak, Z.H.; Kayacan Çakmakoglu, S.; Karasu, S.; Kasapoglu, M.Z.; Avci, E. Effect of Different Drying Techniques on Total Bioactive Compounds and Individual Phenolic Composition in Goji Berries. Processes 2023, 11, 754. [Google Scholar] [CrossRef]
- Defilippi, B.G.; Manríquez, D.; Luengwilai, K.; González-Agüero, M. Chapter 1 Aroma Volatiles: Biosynthesis and Mechanisms of Modulation During Fruit Ripening. Adv Bot Res 2009, 50, 1–37. [Google Scholar] [CrossRef]
- El Hadi, M.A.M.; Zhang, F.J.; Wu, F.F.; Zhou, C.H.; Tao, J. Advances in Fruit Aroma Volatile Research. Molecules 2013, 18, 8200–8229. [Google Scholar] [CrossRef]
- Forney, C.F.; Song, J. Flavors and Aromas: Chemistry and Biological Functions. Fruit and Vegetable Phytochemicals: Chemistry and Human Health: Second Edition 2017, 1, 515–539. [Google Scholar] [CrossRef]
- Chen, F.; Su, Y.; Zhang, F.; Guo, Y. Low-Temperature Headspace-Trap Gas Chromatography with Mass Spectrometry for the Determination of Trace Volatile Compounds from the Fruit of Lycium Barbarum L. J Sep Sci 2015, 38, 670–676. J Sep Sci 2015, 38, 670–676. [Google Scholar] [CrossRef]
- Endes, Z.; Uslu, N.; Musa Özcan, M.; Fatif, E. Physico-Chemical Properties, Fatty Acid Composition and Mineral Contents of Goji Berry (Lycium Barbarum L.) Fruit. Journal of Agroalimentary Processes and Technologies 2015. [Google Scholar]
- Zhu, H.; Wei, M.; Zhang, Y.; Tao, X. Analysis of Volatile Organic Compounds of Different Types of Peppers (Capsicum Annuum L.) Using Comprehensive Two-Dimensional Gas Chromatography With Time-of-Flight Mass Spectrometry. eFood 2024, 5, e70027. [Google Scholar] [CrossRef]
- Do, S.; Kim, Y.; Yim, J.; Lee, K.G. Analysis of Volatile Compounds, Betaine, and Antioxidant Effect in Goji Berry (Lycium Barbarum L.) Powder Extracted by Various Drying Methods and Extraction Solvents. Curr Res Food Sci 2024, 9, 100798. [Google Scholar] [CrossRef]
Figure 1.
Volatile compounds of goji berries are classified by chemical families. Values are expressed as the average of each family in µg g⁻¹ fw. Bars with different letters (a, b, c) indicate significant differences (p < 0.05) due to cultivars.
Figure 1.
Volatile compounds of goji berries are classified by chemical families. Values are expressed as the average of each family in µg g⁻¹ fw. Bars with different letters (a, b, c) indicate significant differences (p < 0.05) due to cultivars.
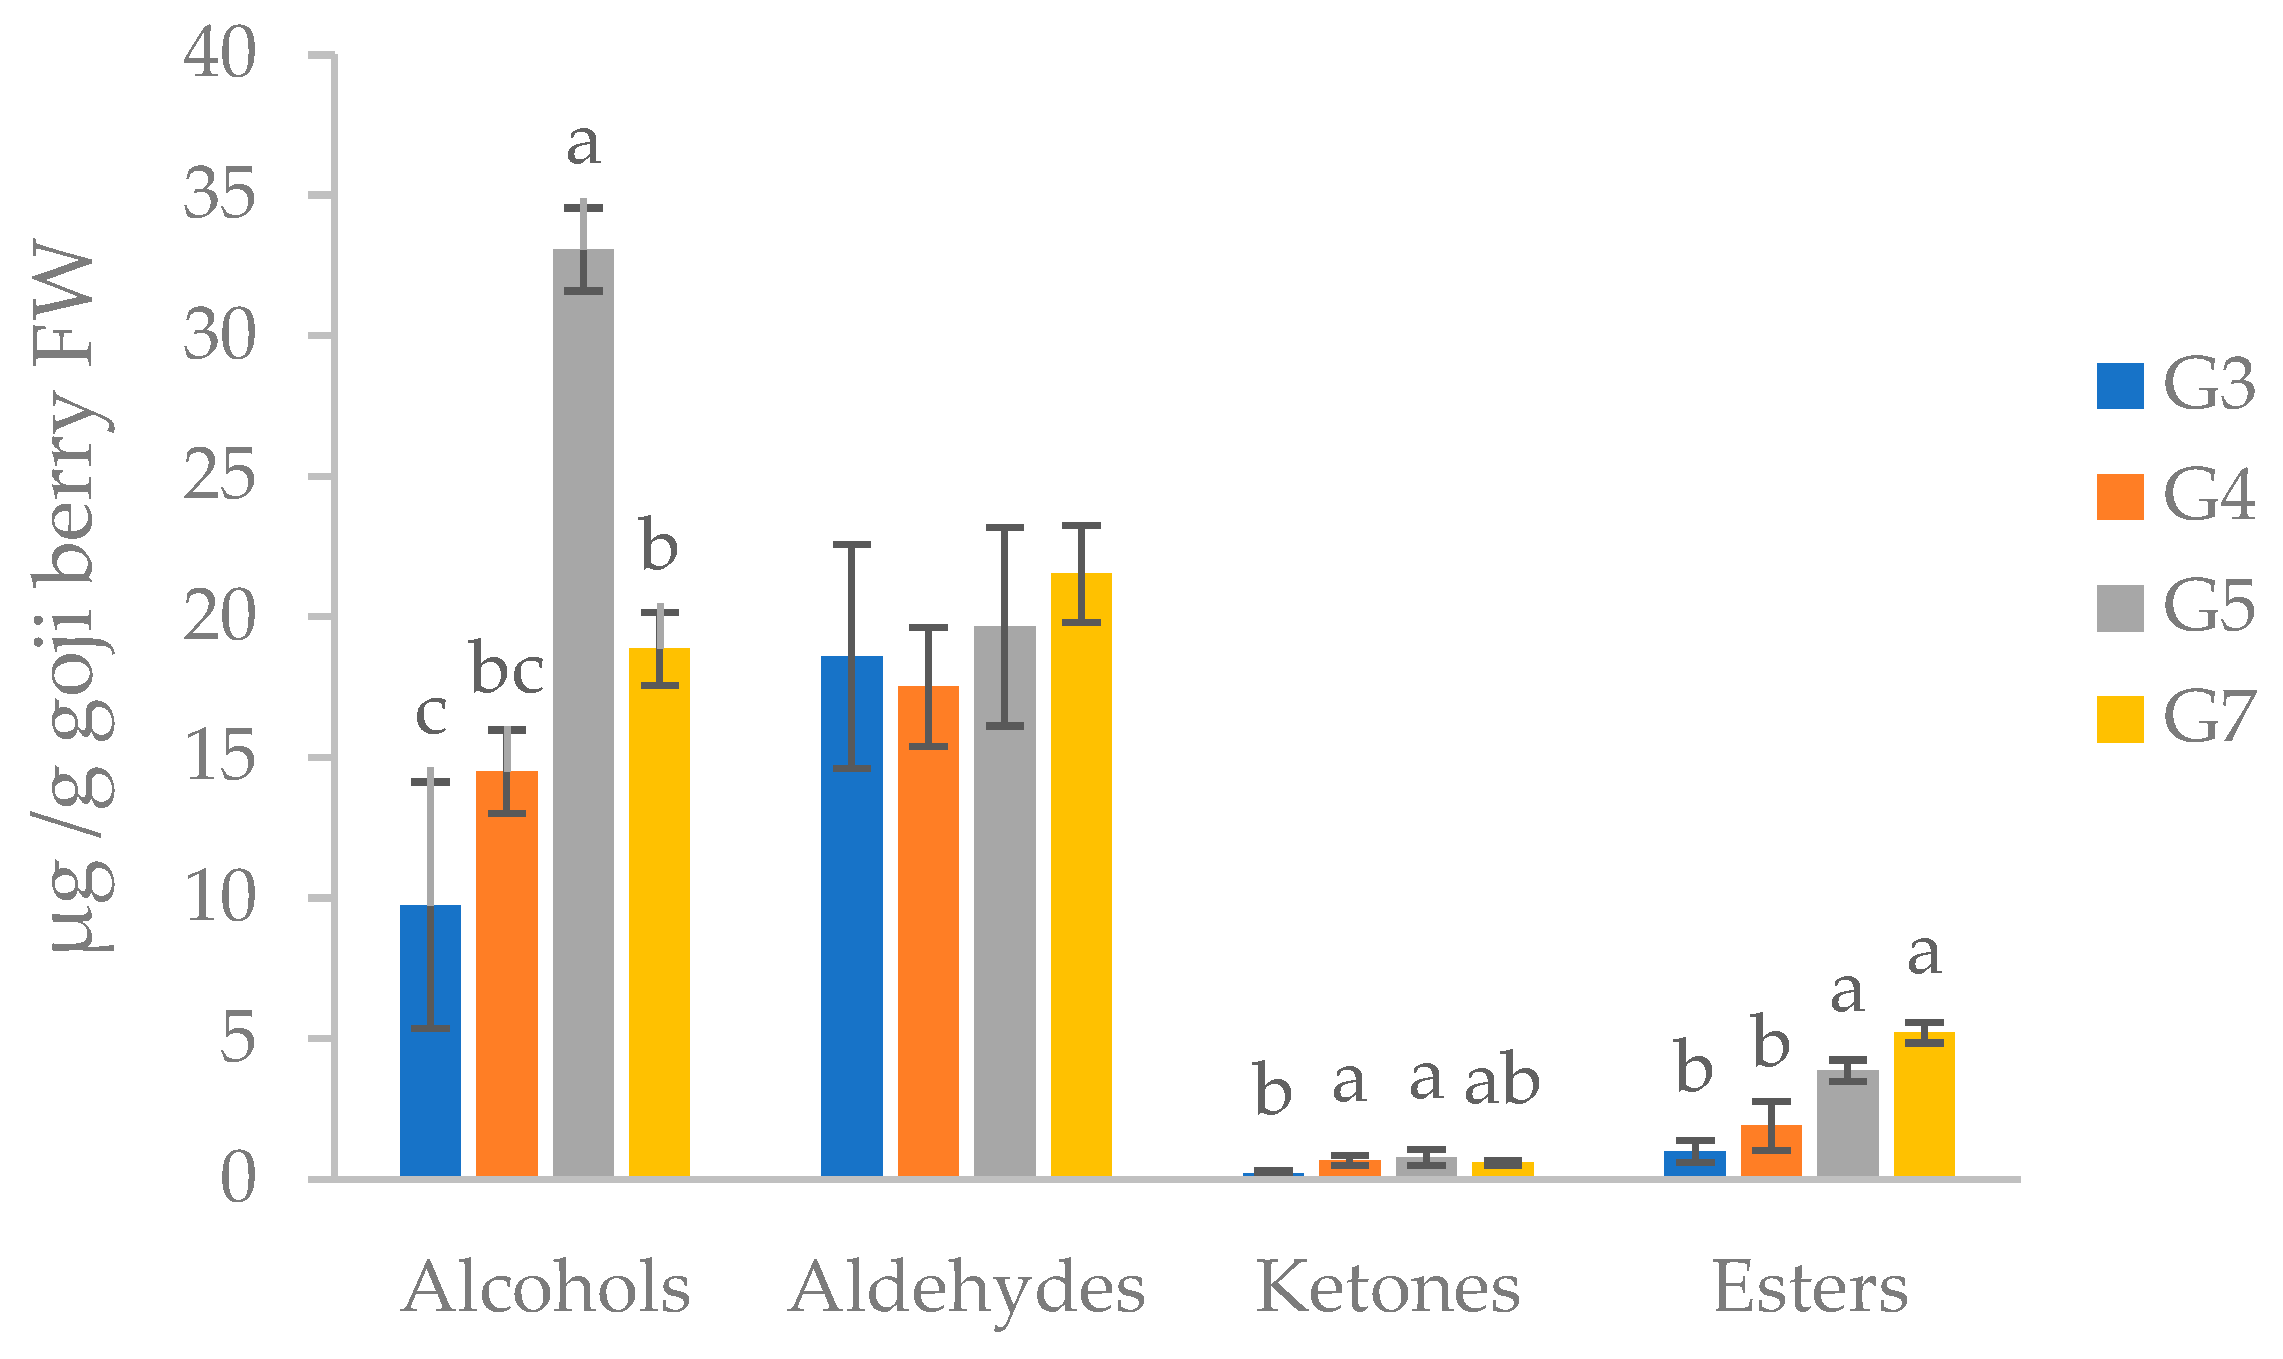
Figure 2.
Volatile compounds heat map identified in different goji berry cultivars. Red indicates a higher detection of a compound in the variable compared to blue color.
Figure 2.
Volatile compounds heat map identified in different goji berry cultivars. Red indicates a higher detection of a compound in the variable compared to blue color.
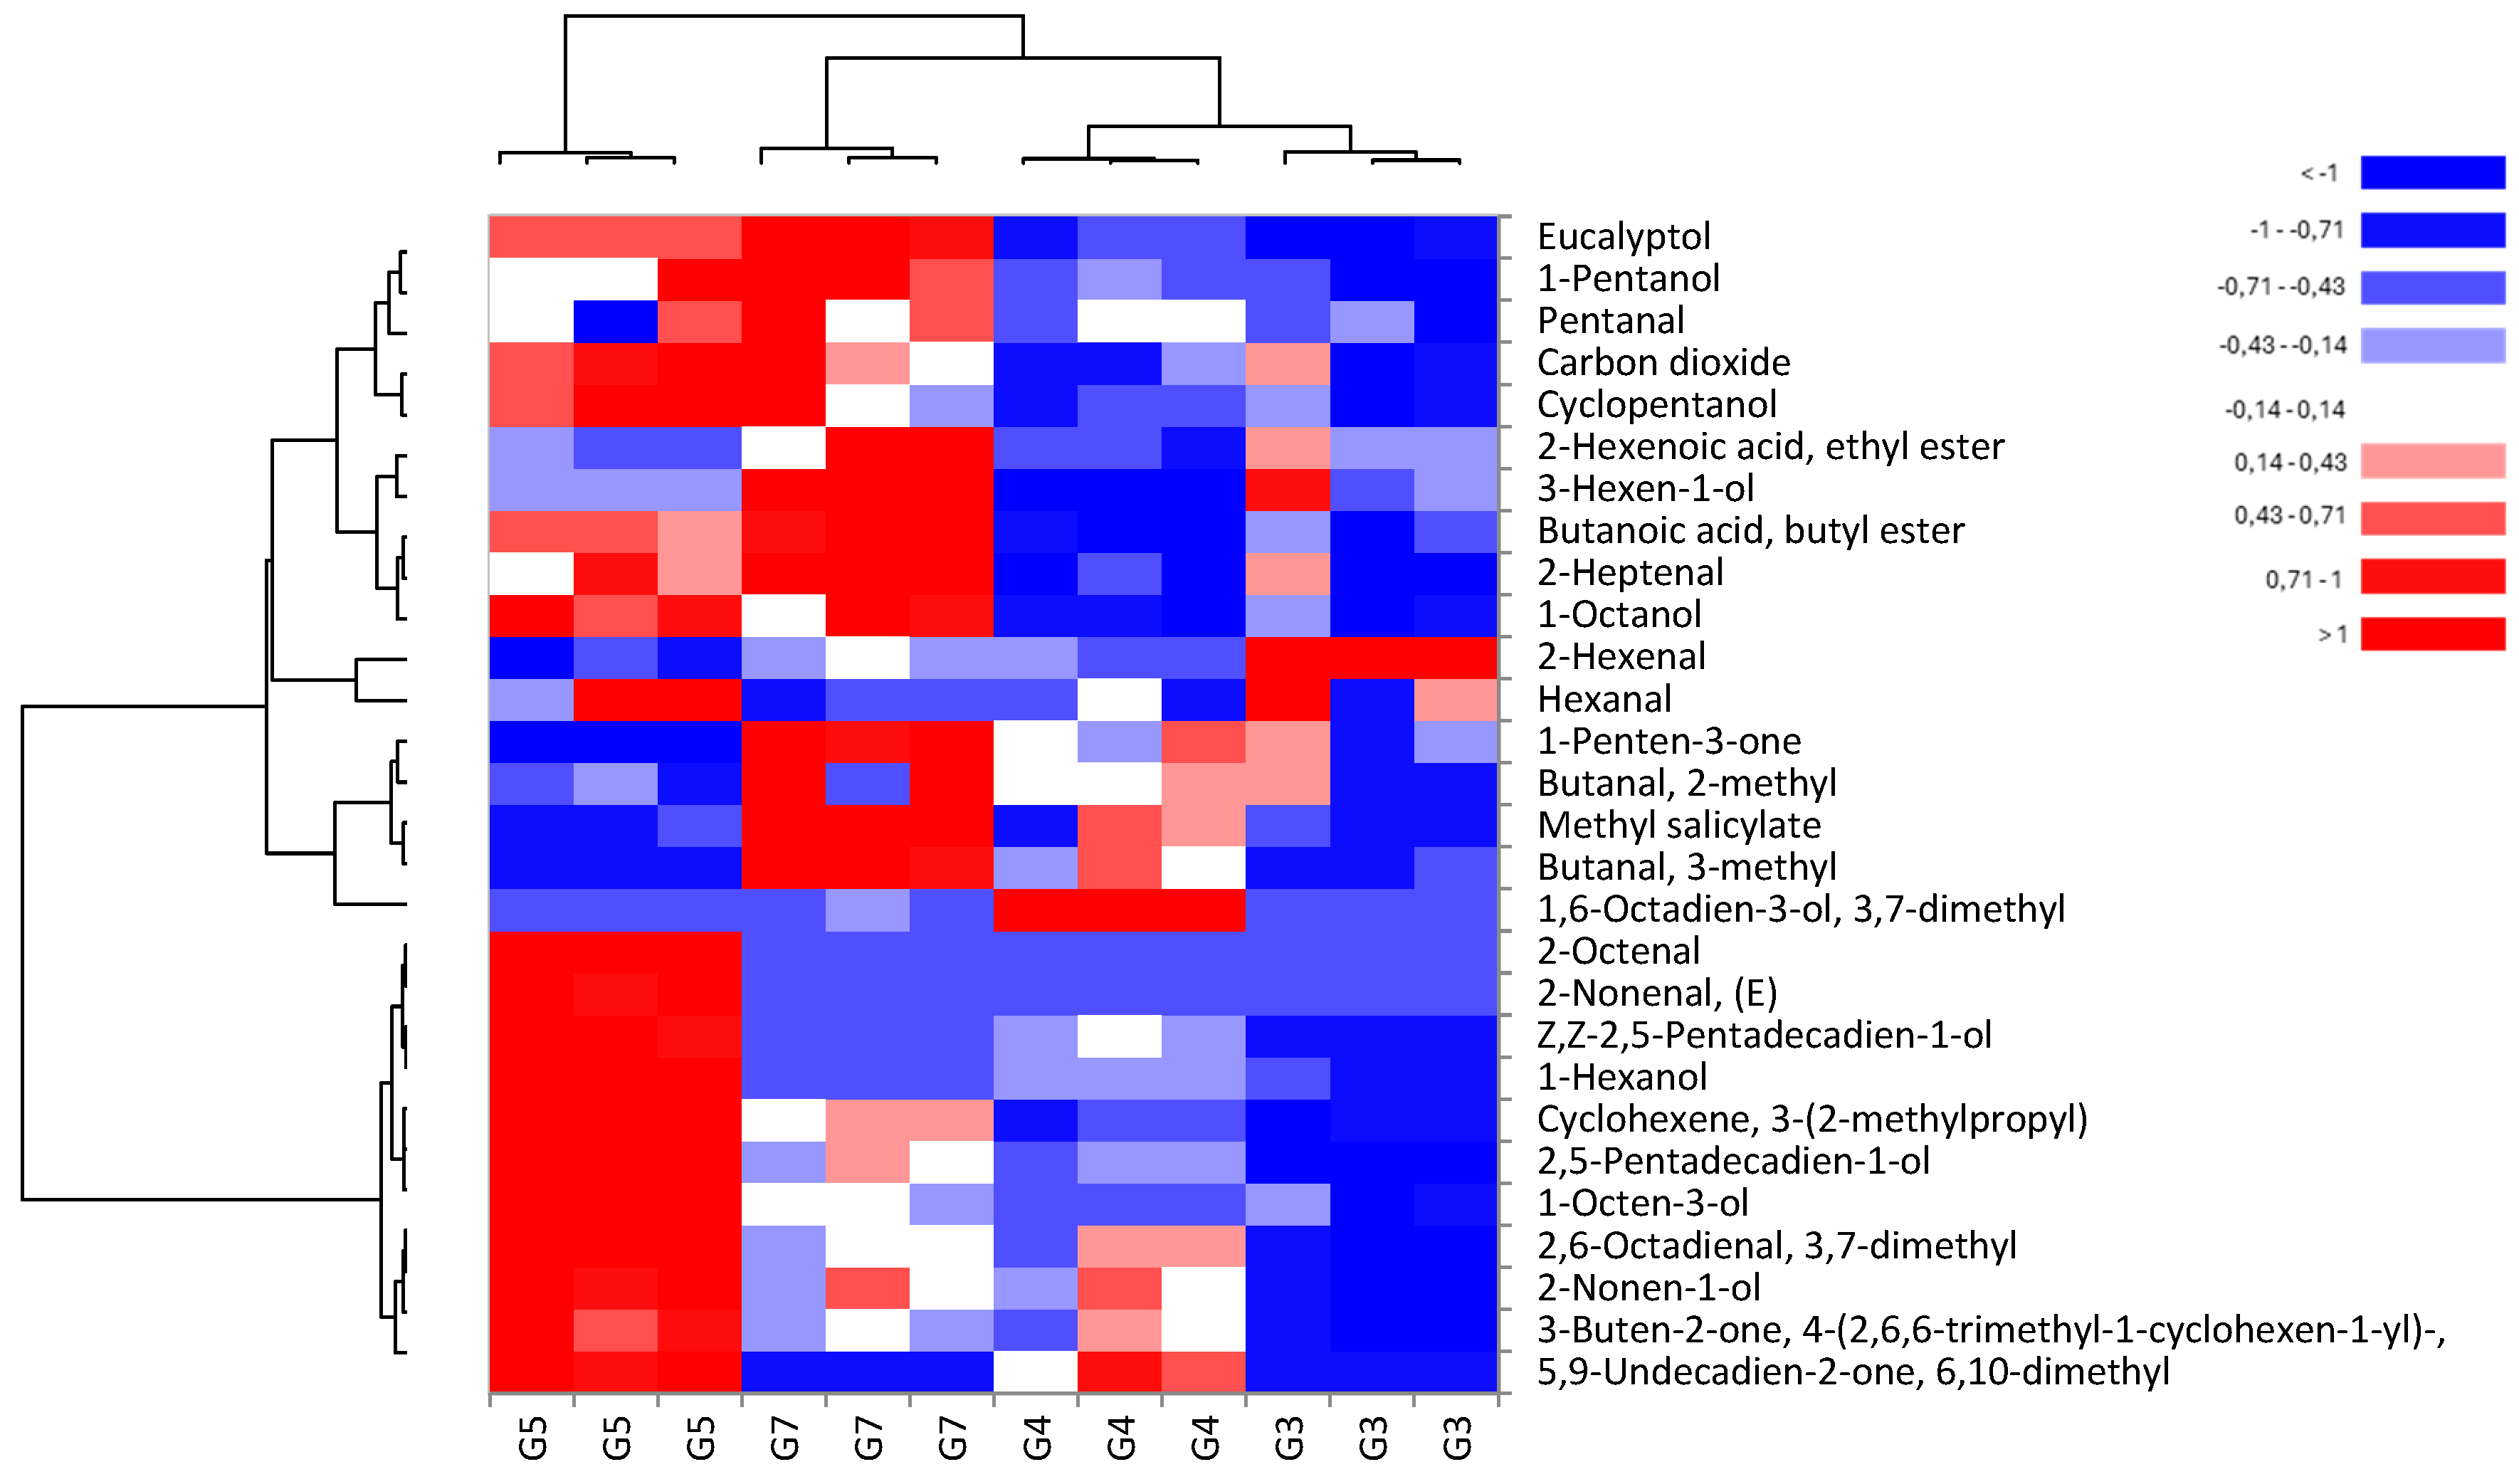
Figure 3.
Principal component analysis (PCA) plotting components 1 and 2 for the different goji berry cultivars.
Figure 3.
Principal component analysis (PCA) plotting components 1 and 2 for the different goji berry cultivars.
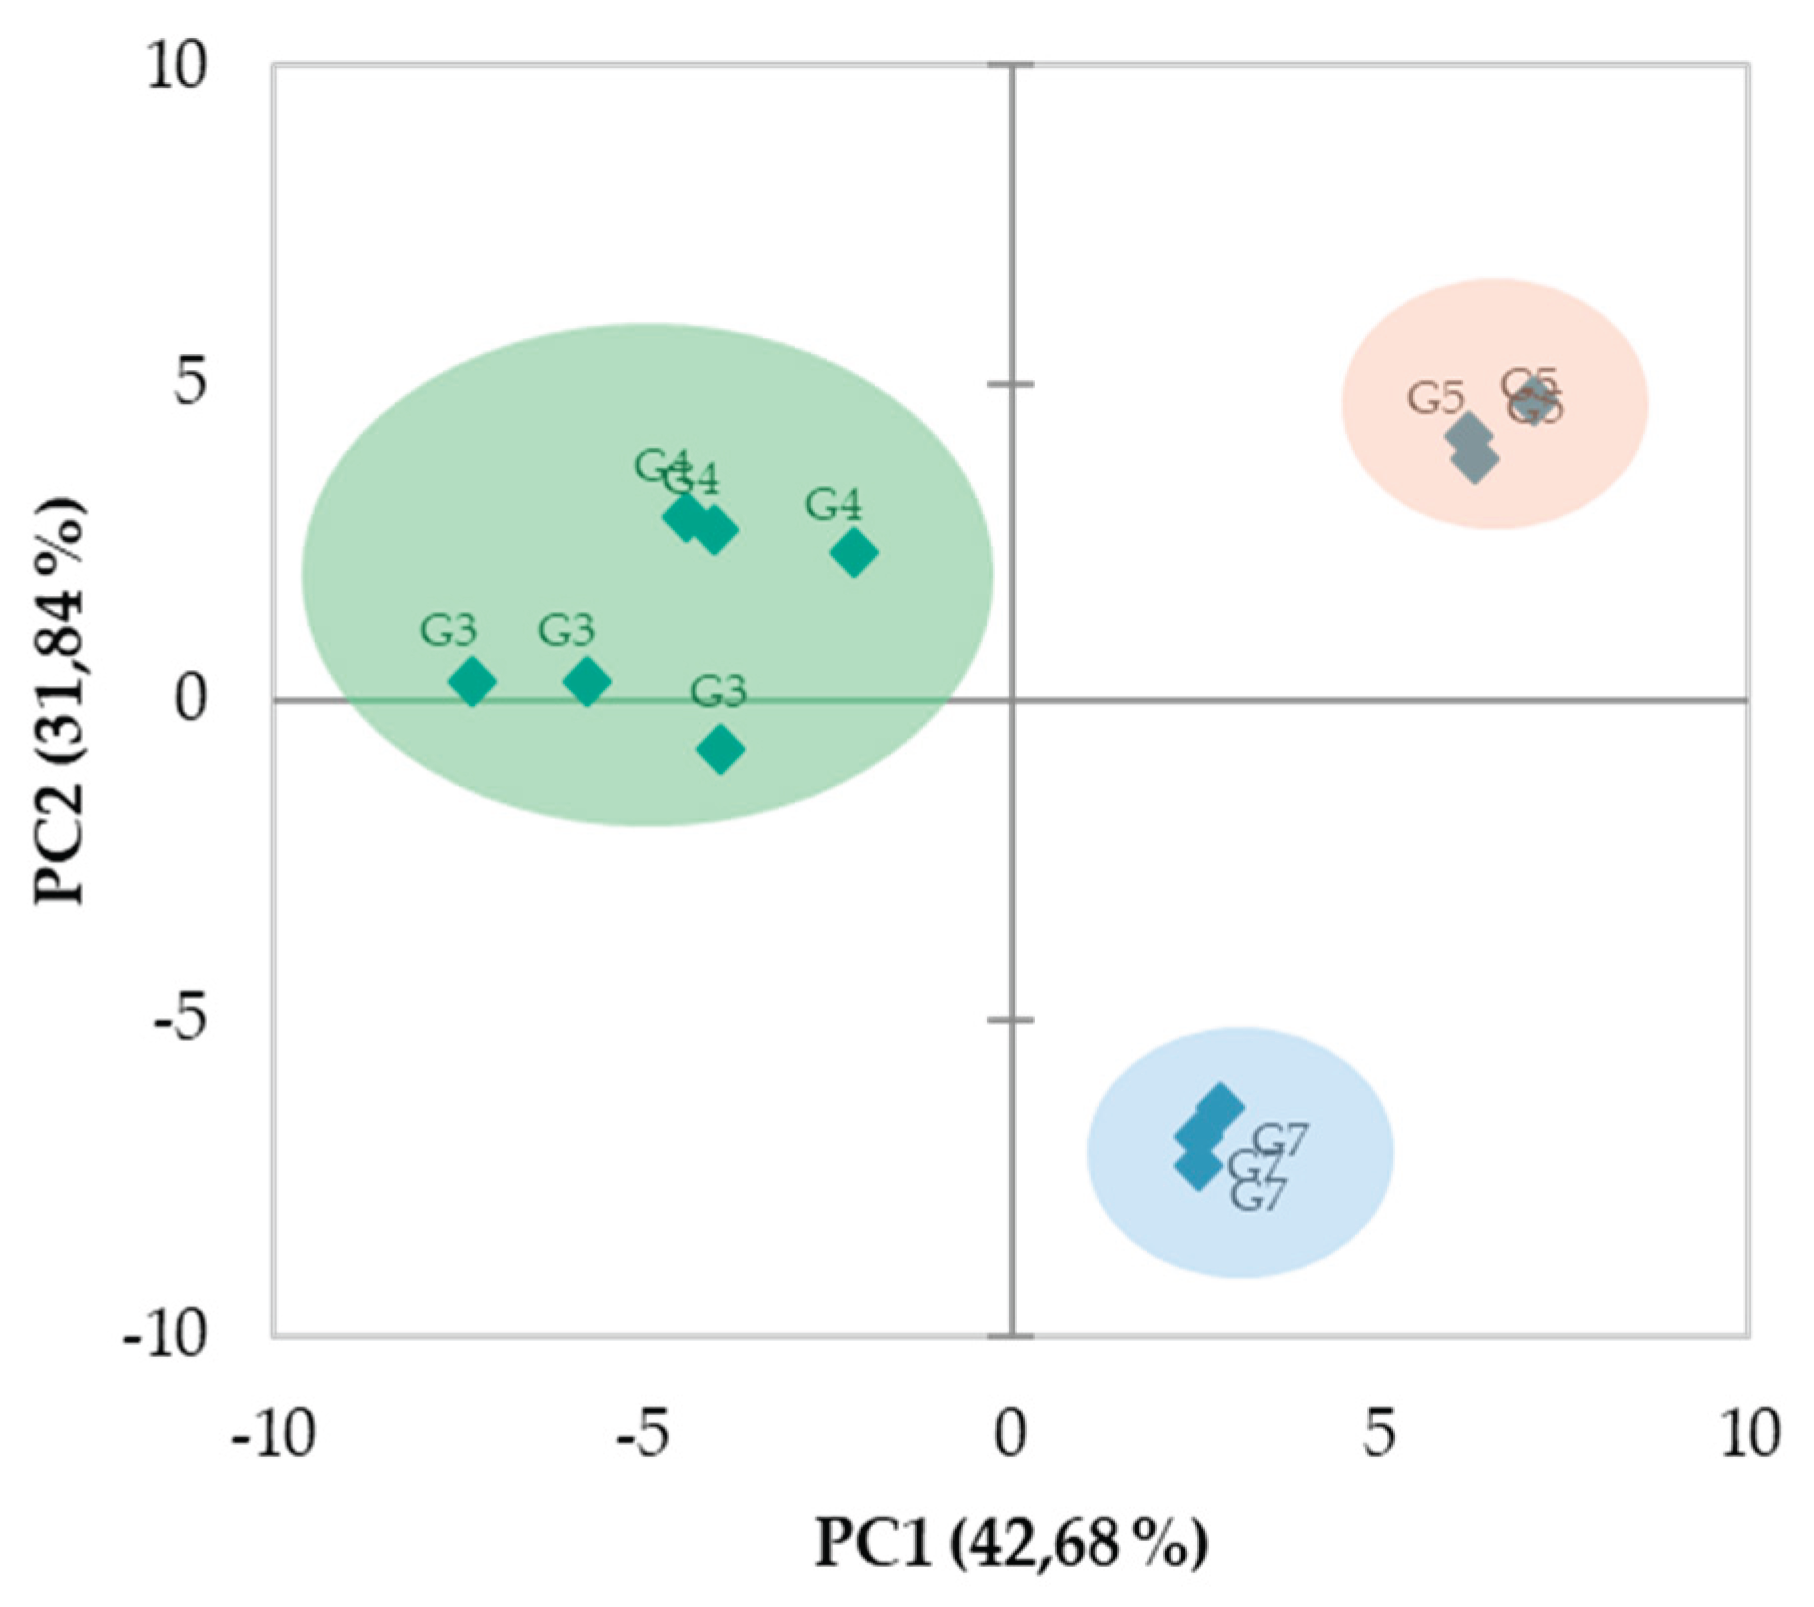

Table 1.
Physicochemical characteristics of goji berry cultivars expressed as mean ± SD.
| G3 | G4 | G5 | G7 | p | |
| Moisture (g 100 g-1 fw) | 83.44 ± 0.18a | 84.74 ±0.91a | 83.05 ±0.79a | 78.96 ± 0.89b | *** |
| pH | 4.91 ± 0.15b | 5.06 ± 0.12b | 5.29 ± 0.25a | 5.23 ± 0.15a | *** |
| TSS (ºBrix) | 20.27 ± 0.01a | 20.17 ± 0.01a | 18.77 ± 0.05b | 17.73 ± 0.01c | *** |
| TA (%) | 0.42 ± 0.01a | 0.39 ± 0.00a | 0.34 ± 0.00b | 0.40 ± 0.00a | *** |
| RI | 48.80 ± 1.05c | 51.16 ± 0.20b | 54.84 ± 0.65a | 44.46 ± 0.26d | *** |
TSS total soluble solids, TA titratable acidity, RI ripening index. Different letters (a, b, c) in the same row show significant differences ***p < 0.001 between goji berry cultivars. Multiple comparisons were analyzed following Tukey test for moisture and TSS; Games Howall test for pH and TA.
Table 2.
Sugar and organic acid composition of goji berries batches expressed as mean ± SD.
| G3 | G4 | G5 | G7 | p | |
| Sugars (g 100 g-1 dw) | |||||
| Glucose | 44.10 ± 0.82a | 44.04 ± 1.28a | 26.89 ± 0.92b | 26.36 ± 0.41b | * |
| Fructose | 44.24 ± 0.89ab | 48.77 ± 1.45a | 44.06 ± 2.31ab | 28.99 ± 0.46b | * |
| Total | 88.34 ± 1.67a | 92.81 ± 2.73a | 70.95 ± 3.98b | 55.36 ± 0.87c | *** |
| Organic acids (g 100 g-1 dw) | |||||
| Oxalic | 0.02 ± 0.00a | 0.01 ± 0.00b | 0.01 ± 0.00b | 0.02 ± 0.00a | ** |
| Citric | 1.60 ± 0.12b | 3.57 ± 0.17a | 4.45 ± 0.57a | 0.68 ± 0.02c | *** |
| Tartaric | 1.53 ± 0.10a | 1.52 ± 0.06a | 1.31 ± 0.04b | 1.00 ± 0.04c | *** |
| Malic | 1.73 ± 0.17a | 0.91 ± 0.06b | 0.47 ± 0.18c | 1.09 ± 0.06b | *** |
| Ascorbic | 0.46 ± 0.03a | 0.51 ± 0.03a | 0.38 ± 0.03b | 0.26 ± 0.02c | *** |
| Succinic | 0.96 ± 0.09 | 0.69 ± 0.06 | 0.68 ± 0.04 | 0.65 ± 0.06 | NS |
| Total | 6.29 ± 0.36ab | 7.19 ± 0.25a | 7.31 ± 0.81ab | 3.71 ± 0.18b | * |
Different letters (a, b, c) in the same row show significant differences: *p < 0.05, **p < 0.01, ***p < 0.001 between goji berry cultivars. Multiple comparisons were analyzed following Dunn-Bonferroni test for glucose, fructose and total organic acids; Games Howall test for oxalic and citric acids; Tukey test for total sugars and malic and ascorbic acids. NS: not significant.
Table 3.
Total and individual carotenoid and phenolic compounds, and antioxidant activity of goji berry cultivars expressed as mean ± SD.
Table 3.
Total and individual carotenoid and phenolic compounds, and antioxidant activity of goji berry cultivars expressed as mean ± SD.
| G3 | G4 | G5 | G7 | p | |
| Total phenolic content (TPC) (mg GAE g-1 dw) | 17.86 ± 1.04a | 19.11 ± 2.18a | 14.83 ± 0.97c | 16.79 ± 1.20b | * |
| Individual phenolic compounds (µg phenol g-1 dw) | |||||
| Chlorogenic acid (AClo) | 199.9 ±19.85a | 163.86 ± 17.46a | 213.3 ± 27.4a | 89.85 ± 6.77b | * |
| Neoclorogenic acid (AnClo) | 621.5 ± 84.2c | 890.3 ± 42.6b | 1214.4 ± 47.5a | 287.5 ± 14.0d | *** |
| p-coumaroylquinic (ApC) | 89.74 ± 4.26b | 90.26 ± 9.79b | 209.9 ± 9.8a | 41.28 ± 3.12c | ** |
| p-coumaric acid (ApCou) | n.d.b | n.d.b | 7.03 ± 1.10a | n.d.b | ** |
| t-ferulic acid (t-Fer) | 30.50 ± 3.29b | 40.58 ± 1.89a | 42.92 ± 1.60a | 45.29 ± 5.06a | *** |
| Ruthin (Rut) | n.d.b | n.d.b | 12.67 ± 3.74a | n.d.b | ** |
|
Total carotenoid content (TCC) (mg βCE g-1 dw) |
1.97 ± 0.01ab | 2.45 ± 0.23a | 1.38 ± 0.32b | 1.13 ± 0.09b | ** |
| Individual carotenoid compounds (µg g-1 dw) | |||||
| Capsanthin (Cap) | 147.8 ± 58.3a | 49.02 ± 23.07b | 32.06 ± 4.46b | 95.76 ± 11.48ab | * |
| Zeaxanthin (Zea) | 1398 ± 514.1 | 1722.6 ± 768.7 | 1212.0 ± 268.9 | 1026.7 ± 98.3 | NS |
| β-Cryptoxanthin (β-Crp) | 36.83 ± 11.87 | 31.28 ± 13.24 | 15.01 ± 2.67 | 26.69 ± 2.57 | NS |
| α-carotene (α-Car) | 163.8 ± 49.6a | 149.2 ± 74.2ab | 44.48 ± 9.50b | 74.67 ± 11.01ab | ** |
| β-carotene (β-Car) | 1.47 ± 0.65ab | 2.40 ± 0.57a | 1.17 ± 0.18b | 1.47 ± 0.17ab | * |
| Antioxidant activity (mg TE g-1 dw) | |||||
| DPPH | 12.42 ± 1.11a | 10.04 ± 0.71b | 12.15 ± 0.55a | 12.34 ± 0.71a | * |
| CUPRAC | 102.9 ± 3.0 | 126.0 ± 19.2 | 106.9 ± 10.08 | 104.7 ± 5.2 | NS |
Different letters (a, b, c) in the same row show significant differences: *p < 0.05, **p < 0.01, ***p < 0.001 between goji berry cultivars. Multiple comparisons were analyzed following Dunn-Bonferroni test for ApCou, Rut and Cap; Games Howall test for TCC; Tukey test for TPC, AClo, AnClo, ApC, t-Fer, DPPH, α and β-Car. NS: not significant. n.d.: not detected.
Table 4.
Quantification of volatile organic compounds (µg/g) [mean (n = 3)] obtained by GC-MS in goji variety fruits.
Table 4.
Quantification of volatile organic compounds (µg/g) [mean (n = 3)] obtained by GC-MS in goji variety fruits.
| LRI | Volatile organic compounds | Id. Method | G3 | G4 | G5 | G7 |
| Alcohols | ||||||
| 660.0 | Cyclopentanol | NIST | 0.14 ± 0.09b | 0.17 ± 0.03b | 0.63 ± 0.12a | 0.40 ± 0.18ab |
| 746.5 | 1-Pentanol | Sigma–Aldrich | 0.27 ± 0.19b | 0.53 ± 0.08ab | 0.89 ± 0.35a | 1.14 ± 0.25a |
| 853.9 | 3-Hexen-1-ol | Sigma–Aldrich | 2.08 ± 0.92ab | 0.77 ± 0.06b | 1.65 ± 0.01b | 3.86 ± 0.39a |
| 870.2 | 1-Hexanol | Sigma–Aldrich | 1.17 ± 0.65d | 3.00 ± 0.32b | 10.49 ± 1.18a | 2.28 ± 0.01c |
| 980.5 | 1-Octen-3-ol | NIST | 5.58 ± 2.34c | 7.00 ± 0.38bc | 16.71 ± 0.84a | 9.34 ± 0.69b |
| 1058.6 | 2,5-Pentadecadien-1-ol | NIST | 0.07 ± 0.04c | 0.37 ± 0.09b | 1.11 ± 0.08a | 0.54 ± 0.15b |
| 1071.4 | 1-Octanol | NIST | 0.30 ± 0.12b | 0.27 ± 0.03b | 0.78 ± 0.13a | 0.75 ± 0.17a |
| 1098.1 | 1,6-Octadien-3-ol, 3,7-dimethyl | NIST | 0.07 ± 0.04b | 2.02 ± 0.49a | 0.07 ± 0.01b | 0.21 ± 0.04a |
| 1103.0 | 2-Nonen-1-ol | NIST | 0.09 ± 0.06c | 0.33 ± 0.08b | 0.54 ± 0.07a | 0.34 ± 0.06b |
| 1300.8 | Z,Z-2,5-Pentadecadien-1-ol | NIST | n.d. | 0.05 ± 0.01b | 0.21 ± 0.06a | 0.02 ± 0.00c |
| Aldehydes | ||||||
| 637.2 | Butanal, 3-methyl | Sigma–Aldrich | 0.63 ± 0.16c | 2.64 ± 1.09b | 0.59 ± 0.20c | 5.48 ± 1.65a |
| 644.1 | Butanal, 2-methyl | Sigma–Aldrich | 0.93 ± 0.45a | 1.36 ± 0.17a | 0.83 ± 0.19a | 2.17 ± 1.05a |
| 672.9 | Pentanal | Sigma–Aldrich | 0.38 ± 0.09b | 0.49 ± 0.05ab | 0.49 ± 0.19ab | 0.74 ± 0.26a |
| 786.1 | Hexanal | Sigma–Aldrich | 14.04 ± 3.20a | 11.88 ± 1.18a | 15.93 ± 3.29a | 11.43 ± 0.71a |
| 849.1 | 2-Hexenal | NIST | 2.20 ± 0.18a | 0.62 ± 0.12c | 0.35 ± 0.14c | 0.87 ± 0.15b |
| 958.8 | 2-Heptenal | NIST | 0.37 ± 0.12b | 0.33 ± 0.04b | 0.53 ± 0.08ab | 0.66 ± 0.03a |
| 973.3 | 2-Nonenal, (E) | NIST | n.d. | n.d. | 0.18 ± 0.06a | n.d. |
| 974.8 | 2-Octenal | NIST | n.d. | n.d. | 0.41 ± 0.04a | n.d. |
| 1098.6 | 2,6-Octadienal, 3,7-dimethyl | NIST | 0.06 ± 0.04c | 0.20 ± 0.05b | 0.33 ± 0.03a | 0.19 ± 0.01b |
| Ketones | ||||||
| 663.1 | 1-Penten-3-one | NIST | 0.18 ± 0.09bc | 0.24 ± 0.10b | n.d. | 0.49±0.10a |
| 1458.3 | 5,9-Undecadien-2-one, 6,10-dimethyl | NIST | n.d. | 0.31 ± 0.11b | 0.52 ± 0.17a | n.d. |
| 1494.1 | 3-Buten-2-one | NIST | 0.02 ± 0.02b | 0.12 ± 0.05b | 0.28 ± 0.10a | 0.11 ± 0.03b |
| Esters | ||||||
| <600.0 | Carbon dioxide | NIST | 0.34 ± 0.17a | 0.37 ± 0.05a | 0.64 ± 0.05a | 0.59 ± 0.13a |
| 989.9 | Cyclohexene, 3-(2-methylpropyl) | NIST | 0.14 ± 0.05b | 0.06 ± 0.03c | 0.08 ± 0.02c | 0.36 ± 0.16a |
| 995.3 | Butanoic acid, butyl ester | NIST | 0.15 ± 0.09b | 0.08 ± 0.04b | 0.37 ± 0.01a | 0.52 ± 0.08a |
| 1194.6 | Methyl salicylate | NIST | 0.24 ± 0.15b | 0.53 ± 0.12b | 2.73 ± 0.34a | 1.38 ± 0.24b |
| 1046.1 | 2-Hexenoic acid, ethyl ester | NIST | 0.14 ± 0.05a | 0.06 ± 0.03b | 0.08 ± 0.02b | 0.36 ± 0.16a |
| Aromatic Compounds | ||||||
| 1027.0 | Eucalyptol | Sigma–Aldrich | 1.43 ± 0.51d | 2.86 ± 0.26c | 5.74 ± 0.14b | 7.47 ± 0.89a |
LRI: Lineal Retention Index; I.d. Method: method of identification (RF: mass spectrum and retention time identical with a reference compound; RI, mass spectrum and retention index from literature in agreement; TI, tentative identification by mass spectrum-NIST library). n.d.: non-detected. Multiple comparisons were analyzed following Tukey test for cyclopentanol; 1-pentanol; 1-octen-3-ol; 1-octanol; 2-nonen-1-ol; 2-heptenal; 2,6-octadienal, 1-penten-3-ol; 3-Buten-2-one; butanoic acid; butyl ester; cyclohexene, 3-(2-methylpropyl); eucalyptol, Games-Howell test for 3-hexen-1-ol and Dunn-Bonferroni test for 1-hexanol; 1,6-octadien-3-ol; 2,5-pentadecadien-1-ol; butanal, 2-methyl; butanal, 3-methyl; pentanal; hexanal; 2-hexenal; 2-nonenal; 2-octenal; 5,9-Undecadien-2-one, 2-hexenoic acid; methyl salicylate.
Disclaimer/Publisher’s Note: The statements, opinions and data contained in all publications are solely those of the individual author(s) and contributor(s) and not of MDPI and/or the editor(s). MDPI and/or the editor(s) disclaim responsibility for any injury to people or property resulting from any ideas, methods, instructions or products referred to in the content. |
© 2025 by the authors. Licensee MDPI, Basel, Switzerland. This article is an open access article distributed under the terms and conditions of the Creative Commons Attribution (CC BY) license (http://creativecommons.org/licenses/by/4.0/).
Copyright: This open access article is published under a Creative Commons CC BY 4.0 license, which permit the free download, distribution, and reuse, provided that the author and preprint are cited in any reuse.


