Submitted:
02 July 2025
Posted:
04 July 2025
You are already at the latest version
Abstract
The metal of the Pressurizer in Nuclear Powe Plant is subject to aging mechanisms caused temperature fatigue, temperature aging, vibration fatigue and corrosion. After decades of operation under these conditions, defects form in the metal structure. In addition to the well-known deterministic methods of testing and monitoring the metal, new approaches have been increasingly sought in recent years. This article examines the development of defects in the metal of the Pressurizer due to corrosion. Defects in the metal are detected and sized by ultrasonic non-destructive testing method. Their development is tracked over a period of time of 25 years. For such a long period of time, enough data for defects length is accumulated, a probability distribution can be applied. The statistical data represent the standardized defect sizes - the ratio of the measured length of the defect to the maximum permissible length, according to the normative documents. A Weibull distribution is applied for statistical processing of these data. The results show the Weibull distribution is suitable for data estimation. The probability of when defects in the Pressurizer’s metal will reach maximum length and the housing will be destroyed is estimated.
Keywords:
nuclear power plant
; defect
; Weibull distribution
1. Introduction
New nuclear technologies are interesting and exciting. But in fact, the big problem in the nuclear industry is the operation of a large number of units that are at the end of their design life. According to information from the IAEA, out of 416 nuclear reactors, 189 have been operating for 40 years, [1]. The policy of every nuclear power plant is to be safe and secure, to supply the planned amount of electricity. As the years of service increase, however, the metal of the equipment ages due to the degradation mechanisms at work. The bearing capacity of the structures deteriorates, and this compromises nuclear safety. Therefore, the safe management of the "old" units is a great challenge. Knowledge is needed about metal degradation, as well the synergistic interaction of several degradation mechanisms. Shared information on good NPP practices and feedback from operational experience are particularly valuable and help to decide on a methodology for evaluating equipment. This article shares the experience of assessing the condition and carrying out the technical diagnostics of the Pressurizer. The primary circuit pressure compensation system in NPPs is designed for: 1) maintaining the pressure in the primary circuit during the change in temperature regime; 2) protection of the primary circuit from pressure rise above the permissible pressure, in emergency modes; 3) creating pressure in the primary circuit for starting the main circulation pump during the start-up of the unit. The Pressurizer is designed to create and maintain pressure in the main circulation circuit, as well as to limit pressure fluctuations in transient and emergency modes. The water level in the Pressurizer is the main technological parameter of the reactor plant and characterizes the amount of coolant available in the primary circuit. Pressure compensation is carried out by phase conversion of the coolant in the Pressurizer from water to vapor phase and vice versa. During the phase transition, the coolant changes its volume repeatedly. At a pressure of 16 MPa, the phase transition from water to vapor phase is carried out at a temperature of 347 °C and leads to a 5,45-fold increase in the volume of the evaporated coolant. This increase in the volume of the evaporated coolant causes a significant increase in the total volume of the coolant in the primary circuit and a noticeable increase in pressure. The main mechanisms of degradation of mechanical properties of the Pressurizer elements are temperature fatigue, temperature aging, vibration fatigue and corrosion, [2]. Temperature fatigue is due to temperature stratification (the change in the temperature of the fluid along the height in the vessel of the Pressurizer), strapping (uneven wear of the inner surface of the vessel due to fluid turbulence) and temperature shock. Vibration fatigue is caused by the operation of pumps and by a change in fluid pressure. The corrosion mechanisms are stress corrosion cracking, boric acid corrosion and air corrosion. These mechanisms of degradation of mechanical properties cause fatigue of the material and cause the appearance of defects. This leads to the compromise of the security of the NPP, [3]. This article examines the appearance and development of defects in the metal of the Pressurizer due to corrosion. The presence of metal defects is determined by a deterministic test method, and the assessment of the development of defects is by a probabilistic method. The normative documents require the application of only deterministic methods for metal control – visual, capillary, ultrasound, radiographic, etc. The IAEA strongly recommends the use of statistical approaches to assess the condition of facilities. In the last ten years, statistical methods have been applied for current and forecast assessment of the technical condition of NPP’s equipment.
2. Materials and Methods
The Pressurizers of two real nuclear units WWER type has been studied, Figure 1.
The objects of the study are the metals on the outer and inner surfaces of the Pressurizers housings. The housings are made of alloy structural steel (10ГН2МФА). The inner surface of the case is clad with austenitic steel (08Х19Н10Г2Б). The internal-housing devices, the sprinkler device, the protective screens, the platforms and the stairs are made of chrome-nickel austenitic steels 08Х18Н10Т, the support is made of steel 22К. Good strength characteristics of steel 10ГН2МФА provide strength of equipment with low metal consumption. Plating of the inner surfaces provides corrosion resistance in the middle of the coolant. The characteristic operating modes of Pressurizers are continuous fluid wetting and drying, temperature fatigue and temperature aging, corrosion cracking, boric acid corrosion, air corrosion. In this study, two methods are applied: 1) ultrasonic non-destructive metal testing to investigate the integrity of the metal structure and 2) Weibull probability distribution for estimating the development of defects in the metal. The Pressurizers metal testing is carried out using ultrasonic inspection methods, [4]. These methods are based on the physical processes that occur in the volume and on the surfaces of the studied object during the propagation of ultrasound waves. The ultrasonic non-destructive testing method uses high-frequency ultrasonic waves to detect defects in materials and welded joints. The basic principle is that ultrasonic waves are sent into the material through a piezoelectric transducer (probe) and the echo signals from the reflected waves are analyzed. The interaction of waves with various imperfections or defects leads to a change in certain wave properties and characteristics such as energy, transformation, speed and direction of propagation, which are registered by receiving sensors. When the wave encounters an imperfection such as a crack or cavity, some of the energy is returned and detected by the probe. By measuring the transit time and amplitude of the signal, the size, depth, and orientation of the imperfection can be determined. Ultrasonic transducers are manufactured with different operating frequencies, which are selected according to the application and the type of material from which the control objects are manufactured. The usual frequency range is from 0.5 MHz to 10 MHz, as:
- Low frequencies (0.5 – 2 MHz) → for deep penetration into rough, dense or thick materials.
- Medium frequencies (2 – 10 MHz) → most commonly used for industrial control of welds and metal structures.
The choice of frequency depends on the thickness of the material, resolution, as well as on the type of converter - contact, immersion, angular. The received signals are fed to appropriate equipment for subsequent processing and visualization of the process, Figure 2.
In the operational tests of NPP equipment, ultrasonic methods are applied in the examination of responsible welded joints. This creates an opportunity to detect volumetric and flat defects such as cracks, non-alloys, slag and non-metallic inclusions, gas pores, corrosion, delamination. In Figure 3 a multi-channel ultrasonic flaw detector is shown.
The ultrasonic equipment is set up using calibration specimens, Figure A1 and Figure A2. Scanning ultrasonic devices are used for the testing of the Pressurizer, Figure 4.
The scanning device consists of: a chassis with magnetic wheels sticking to the pipeline; switch box connected to two motors; a movable rack perpendicular to the chassis on which the movement in the "Y" direction is carried out; motors with built-in encoders for the position of the device on the control object. The device is also equipped with guides (side), which additionally ensure the parallel movement of the scanner along the welded joint by means of an installed guide chain. The device is controlled remotely from a workstation with software designed for this activity, Figure A3.
The ultrasonic control method is deterministic. The characteristic data for each defect are its dimensions, equivalent area, location and type. Since ultrasonic testing registers indications of defects, we speak of indications later in the text. The specific object of the study was a welded joint on the outer surface of the Pressurizers, for which inconsistencies were found inside the seam by ultrasonic method, [5,6,7,8,9,10]. The observation period is 25 years.
The indications (of the defects) were analyzed using a Weibull distribution. The Weibull distribution is a probability distribution that is commonly used in reliability analyses and is characterized by three parameters: form parameter (β), scale parameter (η) and location parameter (γ). It is a summary of many other distributions, such as the exponential, normal, logarithmic-normal, gamma, and Riley distributions.
Main characteristics of the Weibull distribution are:
- Form Parameter (β): Determines the shape of the distribution curve. At β < 1 the distribution is decreasing, at β = 1 it becomes exponential, and at β > 1 there is a peak and then it falls.
- Scale parameter (η): Determines the characteristic life or average lifespan of objects. About 63% of the sites should be damaged by the time set by the η.
- Location parameter (γ): It means the minimum time to failure. Not all sites will be damaged before this time.
The Weibull distribution is very flexible and can be used to model different types of failover processes, such as: 1) Reliability of electronic components, 2) Life expectancy of machinery and equipment, 3) Predicting the time period to product failure, 4) Safety ana- lyses. By changing the parameters, the allocation can be adapted to different reliability scenarios and used to predict failure processes in different systems. Hypothetically, we choose this distribution as an appropriate physical model for estimating the state of objects, [11]. Let the metal be considered as a set of metal threads and statistically estimate the probability of breaking any thread. In this way, it is statistically estimated what is the probability of defects in the metal structure. For the present study, we initially choose a Weibull distribution; the aim is to verify that it is appropriately selected and can be applied to track the development of defects in a welded Pressurizers joint. Systematization of the indications has been carried out. „Systematization“ means that a sample is made for all indications that are above a specified level of fixation of the ultrasound signal, reflected by the incompleteness. For each indication, the value of the equivalent area of the defect indication is divided by the maximum allowable area of defects for this facility, determined by the norms [4]. The normalized value of the equivalent area of the indication is obtained . In case , the facility is suitable for safe operation. In case the indication has reached the maximum amount allowed by the regulations. This is how probabilistic estimation is carried out. The moment of time for rupture of a Pressurizer's welded joint in the presence of metal defects is estimated. The data for are ranked in ascending order of variations. On the basis of the set of inconsistencies and by representing their dimensions in probability paper, it is possible to estimate the moment in time when one or more indications will reach critical dimensions and a failure of the facility will follow.
The random variable is indicated In the two-parameter Weibull distribution, the distribution function is:
The function determines the probability that the defect will reach critical dimensions and the metal will rupture; β and η are distribution parameters. probabilistic networks are built for the development of indications. Reliability Function, which determines the probability that the metal will not tear due to defects is:
Probability density Function:
Failure Intensity Function:
3. Results
The welded joints of the hull of two Pressurizers have been examined; defects were found on only one welded joint. In the welded compound No. "XX" of the Pressurizer, the presence of a row of objects of reflection (during ultrasonic testing) with a maximum area of 28 mm2, located at a depth of 146-150 mm from the outer surface of the housing, was found. Initially, the indication has the character of unintelligible with a conditional size of 5-7 mm. After many years of operation of the Pressurizer, ultrasonic testing revealed the presence of 19 indications in 2000, with lengths of up to 150 mm, Figure 5. In 2011 there are 30 indications with lengths of up to 360 mm. In 2012, there were 27 indications with sizes up to 380 mm. The lower number of indications in 2012 is explained by the process of merging (consolidation) of closely spaced indications. The defects spread to the inside of the suture and can only manifest and control with an ultrasound method.
The circular welded joint of the Pressurizer is mentally divided into 6 sectors, for better orientation. Let us estimate the probability of brittle destruction of the object caused by two of the largest indications in the metal, taken from Sector I and from Sector III. Data on indications lengths are processed statistically according to the formulas of the Weibull distribution, Table 1.
The data for and ) , calculated by (1) are plotted in Weibull paper, Figure 6. Figure 6a shows the indications of the I sector of the object "Welded joint of the Pressurizer housing", and on Figure 6b data on sector III indications. Coordinate points are connected by a line. This is the so-called Weibull line. The distribution parameters are graphically defined as follows: A straight line is built, starting at the evaluation point and parallel to the Weibull line. The new line crosses the vertical line drawn through the at a point with coordinates , that corresponds to the format parameterа . The parameter сis defined by the intersection of the Weibull line with the horizontal line with the coordinate or as from draw a vertical line until the abscissa axis intersects.
Graphically define the parameters for the I sector data: , for sector III - .
4. Discussion
The original source of these defects is most likely non-boil, located at a depth of 146-150 mm below the outer surface of the casing. The location of the defects indicates that the main mechanism of degradation of the mechanical properties of the metal in the first years of operation of the Pressurizer is mechanical stress caused by temperature changes in the fluid. An analysis of the obtained graphical patterns is carried out. In case the approximation line is straight, then the Weibull two-parameter distribution is applicable. Linearity is found for Figure 6. This means that the hypothetically selected Weibull distribution is suitable for analyzing the state of the metal of the Pressurizer based on the development of defects in the metal. Once the parameters (β, η) of a two-parameter Weibull distribution are known, it is possible to determine the probability values of the function of metal rupture due to defects in the metal. These values can be determined graphically (by Figure 6) or computationally (1). Let the values of y) be determined by a graphical method, taking a certain indication, . From Figure 6a it is observed – for example – in case =40 % is obtained , or 1% is the probability that the defect will reach maximum allowable values. Other values of and of ) are given in Table A1.
Figure 6 expresses the relationship between the growth of defects and the rupture of the Pressurizer housing. Let us clarify the relationship between the two events: 1) The moment when the defect reaches maximum permissible values ( and 2) Metal tearing and demolition of Pressurizer weld. Initially, the defects are too small, at the submicroscopic level. They cannot be "felt" through the methods of non-destructive testing, which is practically applied to the equipment in nuclear power plants. Such defects are most often point defects in the metal crystal lattice, Figure A4 and linear defects, Figure A5. Their dimensions are on the order of interatomic distances. Through an electron microscope, one can "see" the origin of defects due to the rupture of interatomic bonds - there is simply no building material in the metal structure, Figure A6. Under the influence of operating conditions, however, defects grow to a microscopic level, and over time – to millimeter sizes and can already be ascertained by technical means for non-destructive testing. During this entire period, the welded seam was not destroyed, the Pressurizer remained intact and continued to perform its functions as part of the nuclear power plant. When the defect reaches maximum dimensions defined in strength standards, it means that the limits of mechanical parameters have been reached. Any subsequent load on the equipment (pressure, vibration, temperature) exceeds the ability of the seam to withstand it, the metal begins to break down quickly – the phenomenon of “fast fracture”. As a conclusion, it can be said that reaching the maximum size of the defects is the beginning of the end of the facilities. Such a relationship is mathematically justified in strength analyses. Specialized software is used, models of the sites are made, load factors are simulated and after many calculations, boundary conditions of operation of the facility are determined.
What benefits does the study bring to the present work? Let's see what is the practice of studying the metal of equipment in nuclear power plants. The Pressurizers welds metal are usually examined regularly every 4 years. When defects are found in the metal, the metal is examined every year. Non-destructive methods of control are applied. By visual method and capillary method, the surface of the suture and the adjacent peri-suture strip of 20 cm are examined. By ultrasonic method, the inside of the metal is scanned. When defects are found, their location is determined by a coordinate system, as well as the size and type of defects (surface abrasions, gas cavities, etc.). With each subsequent test of the defect area, the size of the defects is tracked – and they usually grow. Data on the size of the defects are accumulated and the condition of the facility is tracked on them. This is the practice in every nuclear power plant, in every country. Thus, it is not possible to "predict" when defects will reach extreme permissible dimensions, in which year of Pressurizer's exploitation this will occur (except in cases of strength analyses).
The benefits of this article are as follows: 1. A new approach to conducting metal condition assessments of welded joints is demonstrated. This approach includes two methods - a method of non-destructive testing and a method of processing data from Inservice inspection. The first method is deterministic and is applied as required by law, and the second method is probabilistic, not required by the norms, but gives quick and visual information about the long-term operation of the facility. 2. The Weibull distribution is an appropriate type of distribution for estimating the growth of normalized defects in the metal caused by the aging mechanisms typical of the working environment. This hypothesis has also been proven for defects in the metal of a nuclear reactor vessel [12], as well for defects in Steam generator welds, [13]. 3. Probabilistic distributions, when properly selected, are extremely convenient and practical for monitoring the resource of equipment in nuclear power plants. 4. Preparation of probability networks replaces the need to conduct strength analyses, which require a lot of resources.
The topics of future development are which other statistical approaches and methods are suitable for assessing the technical condition of the NPPs equipment metal.
5. Conclusions
The size of the defects of a Pressurizer welded joint increases by the mechanism of corrosion-mechanical destruction, and new defects are found. The root cause of the increase in defects is the temperature changes in the fluid. The dynamics of increasing the number and magnitude of defects, the direction of increase towards the internal volume of the casing shows that at a later stage the predominant mechanism of development is stress corrosion caused by temperature changes and the content of boric acid in the fluid. This mechanism causes the appearance of new defects and an increase (up to two times) in the size of the already identified defects. Defects in the metal cause brittleness and can lead to the destruction of the welded joint. The Weibull distribution (two-parametric) is suitable for assessing the development of defects in the metal, and through this distribution the probability of destruction of the object can be estimated.
Author Contributions
Conceptualization, G.T.D.; methodology, G.T.D.; software, G.T.D.; validation, G.T.D.; formal analysis, G.T.D.; investigation, G.T.D.; resources, G.T.D.; data curation, G.T.D.; writing—original draft preparation, G.T.D.; writing—review and editing, G.T.D.; visualization, G.T.D.; supervision, G.T.D.; project administration, G.T.D.; funding acquisition, G.T.D. All authors have read and agreed to the published version of the manuscript.
Funding
This research was funded by Technical University of Sofia.
Data Availability Statement
Not applicable.
Conflicts of Interest
The author declares no conflicts of interest.
Abbreviations
The following abbreviations are used in this manuscript:
| IAEA | International Atomic Energy Agency |
| NPP | Nuclear Power Plant |
Appendix A
Figure A1.
Calibration specimen for adjusting the sensitivity of the ultrasound equipment.

Figure A2.
Sensitivity setting data of the ultrasound equipment.
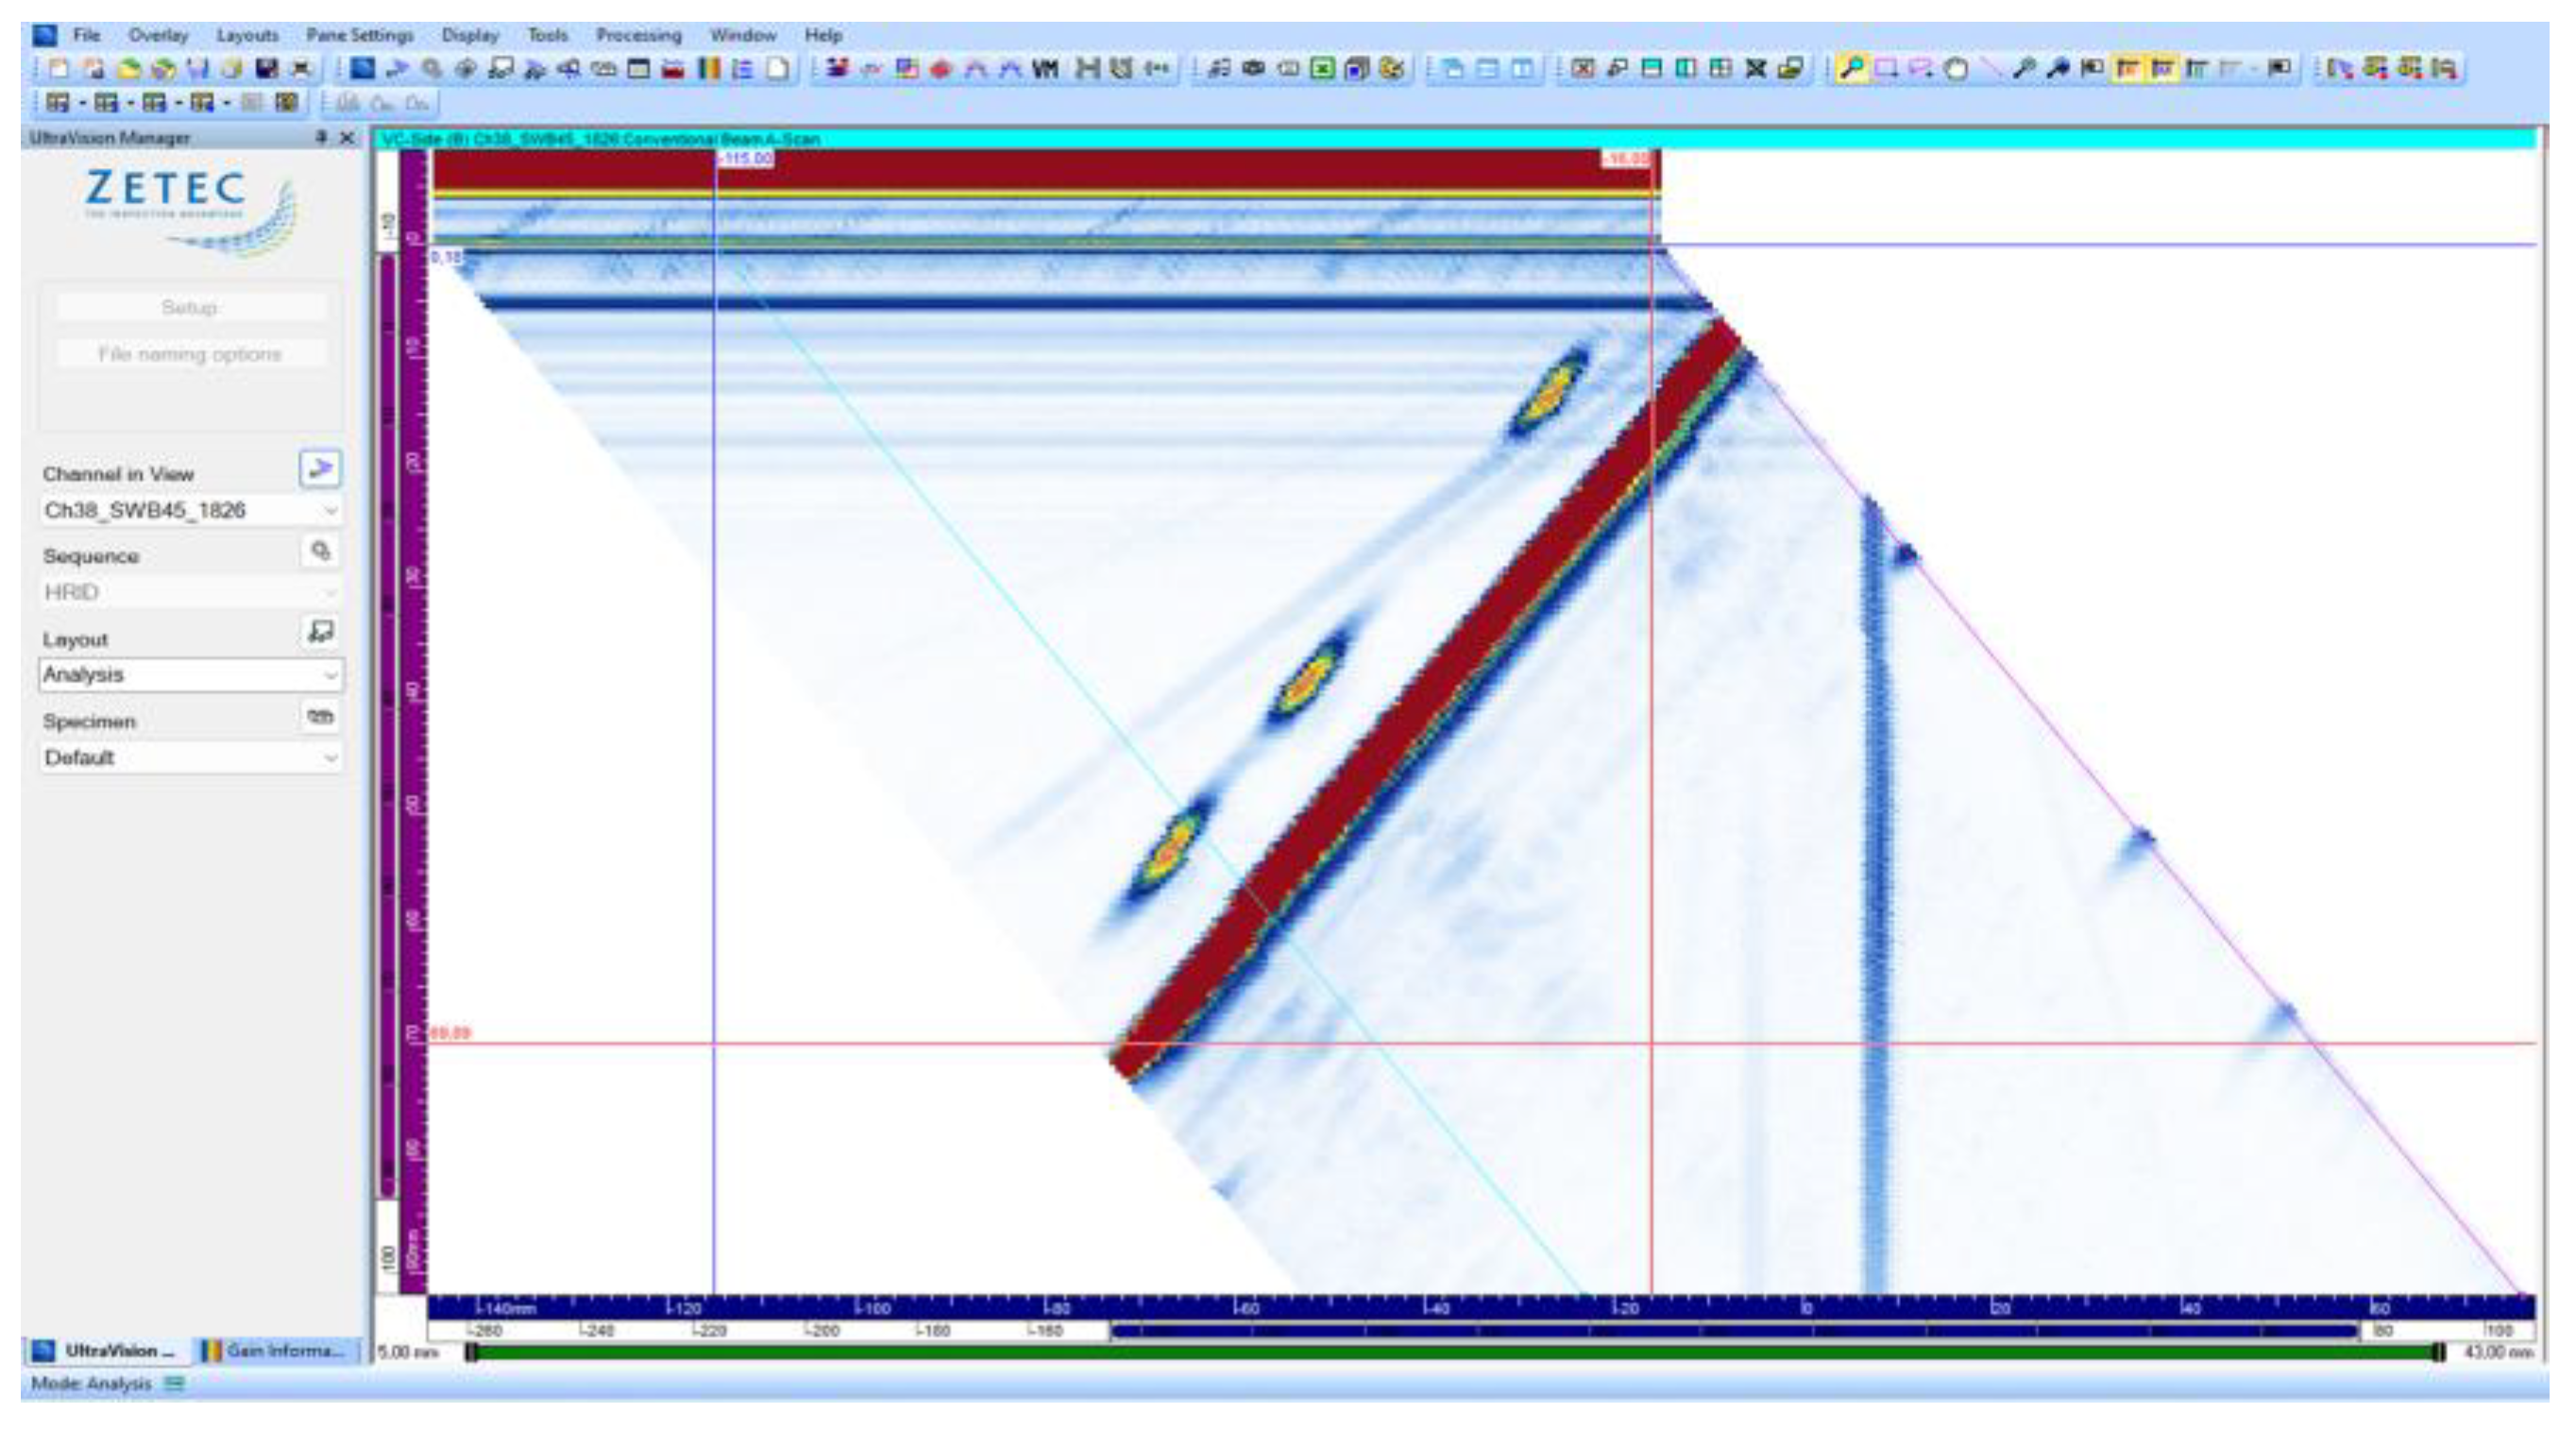
Figure A3.
Connection diagram of automated control equipment.
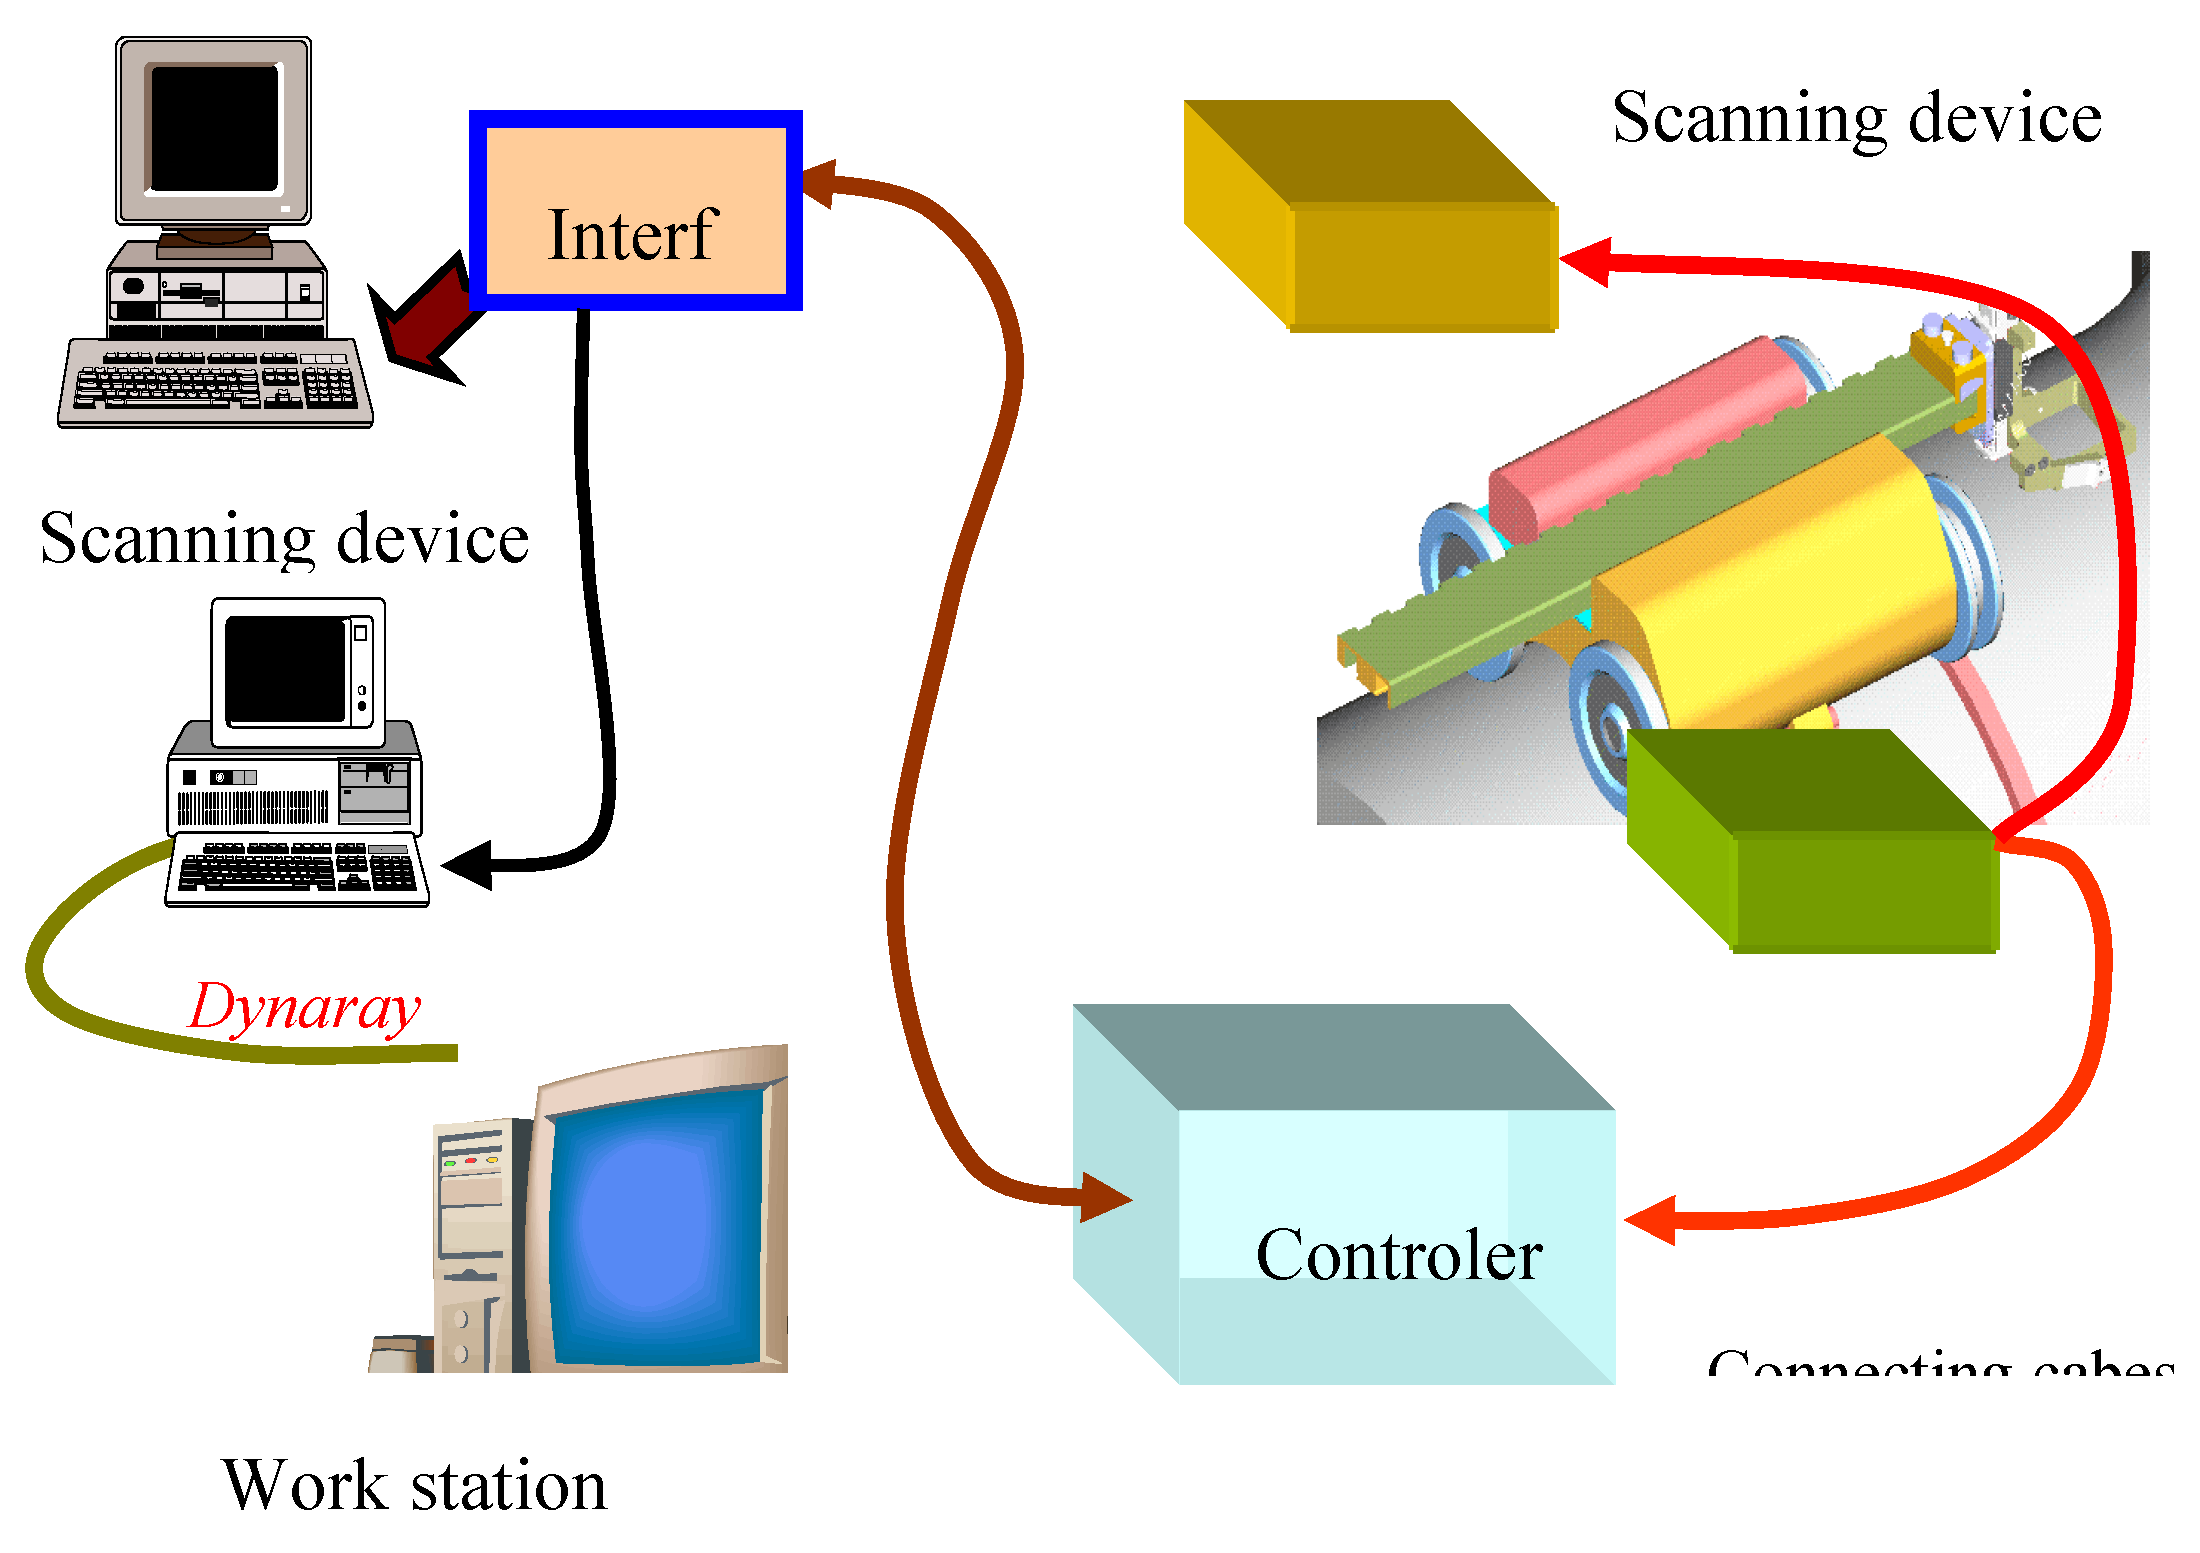
Figure A4.
Point defects in a metal crystal lattice (diagram).
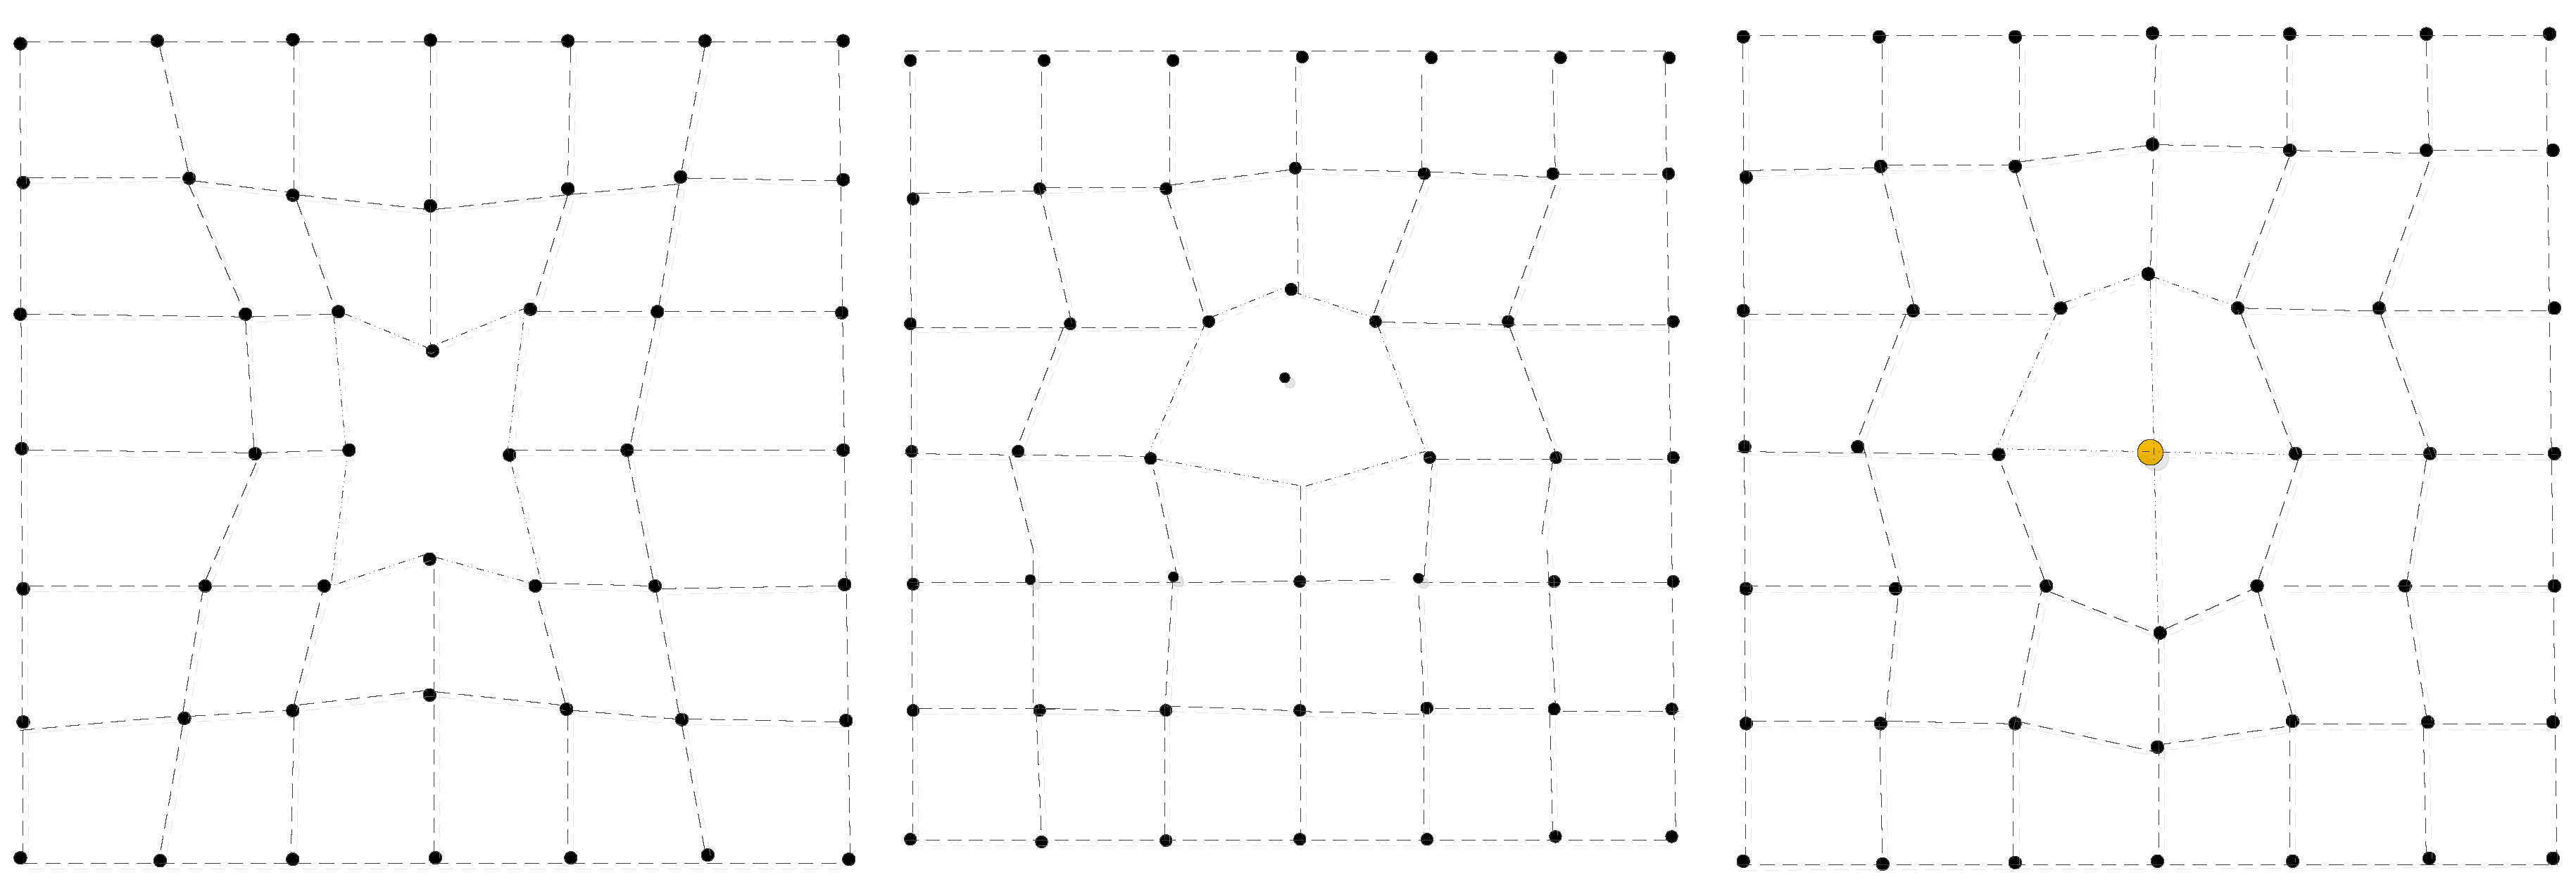
Figure A5.
Linear defects in a metal crystal lattice (diagram).
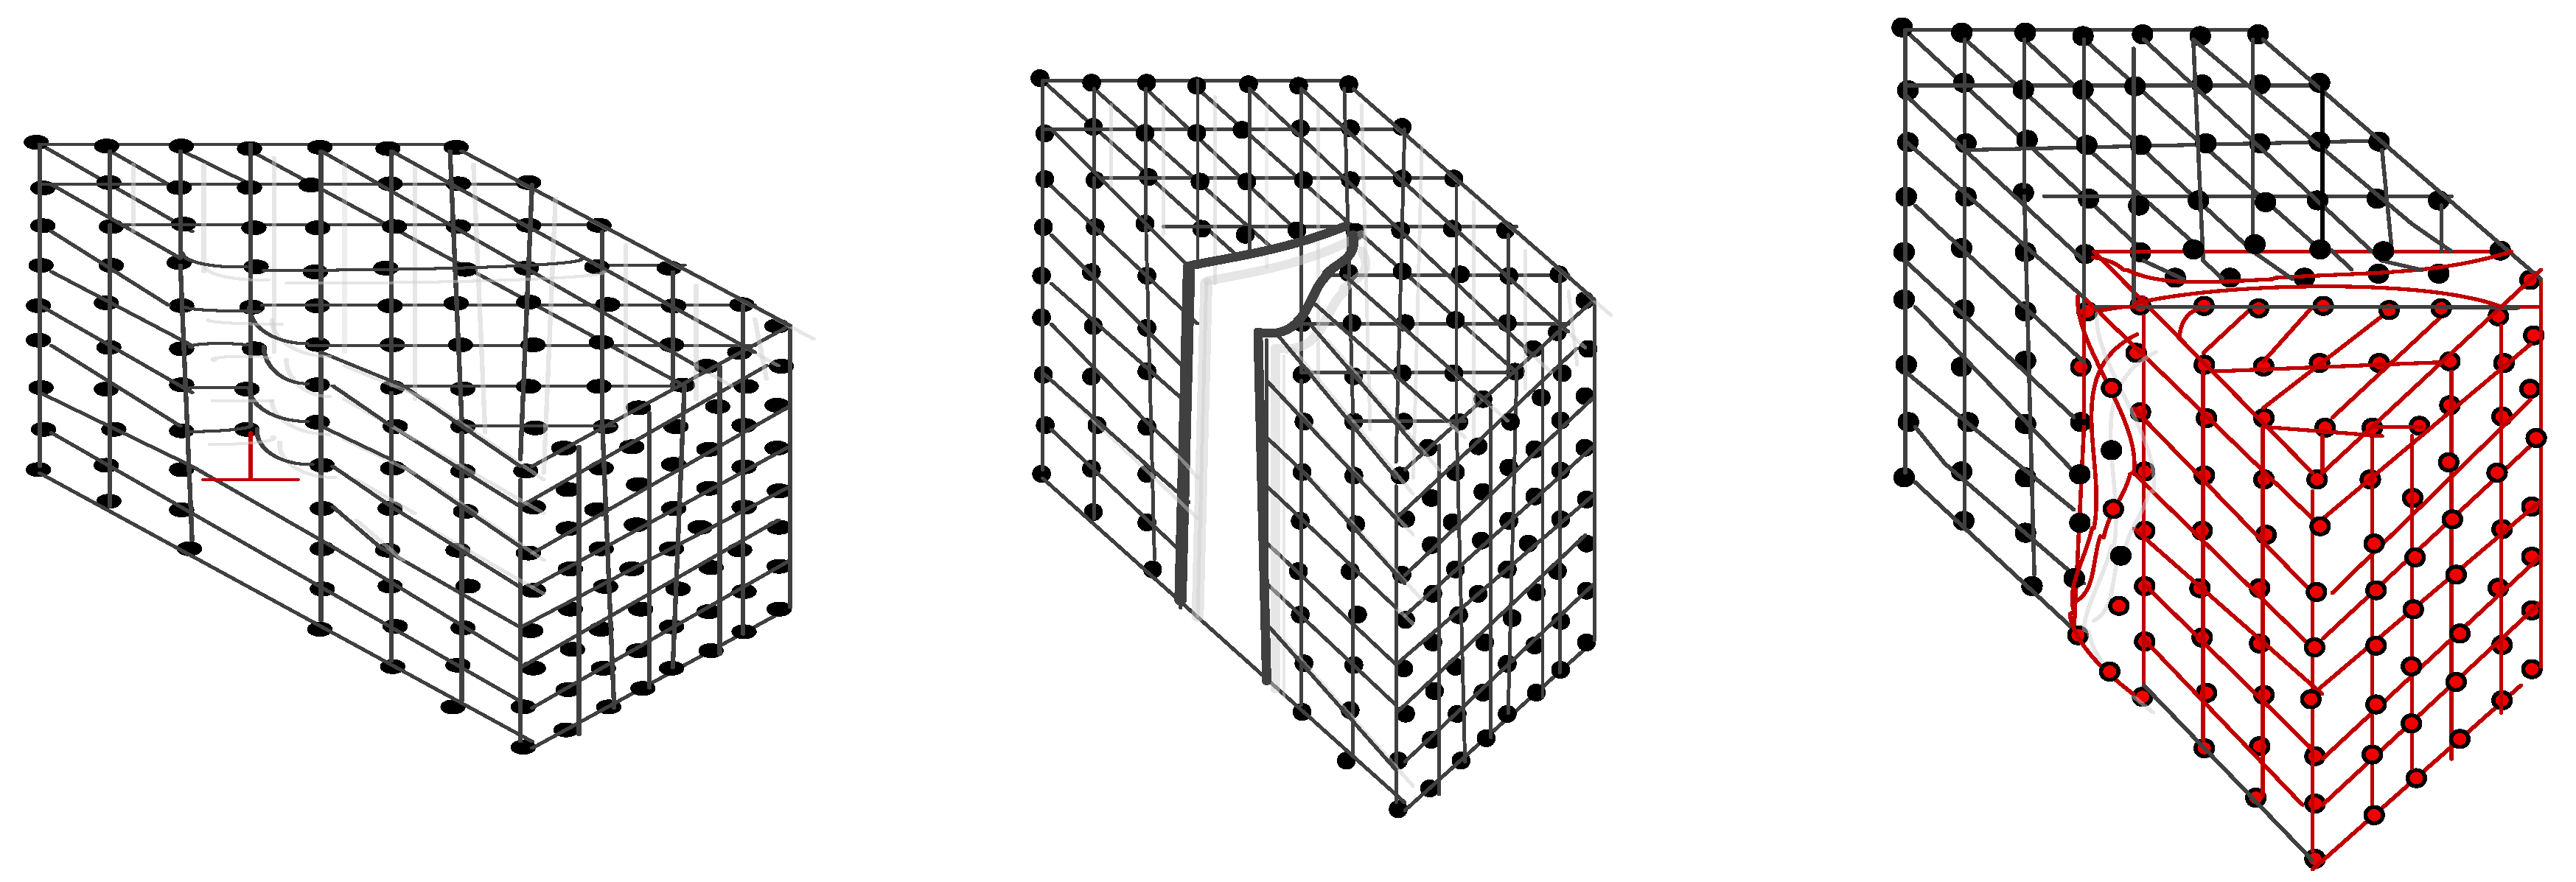
Figure A6.
Photographs of defects in the metal structure observed through a microscope.
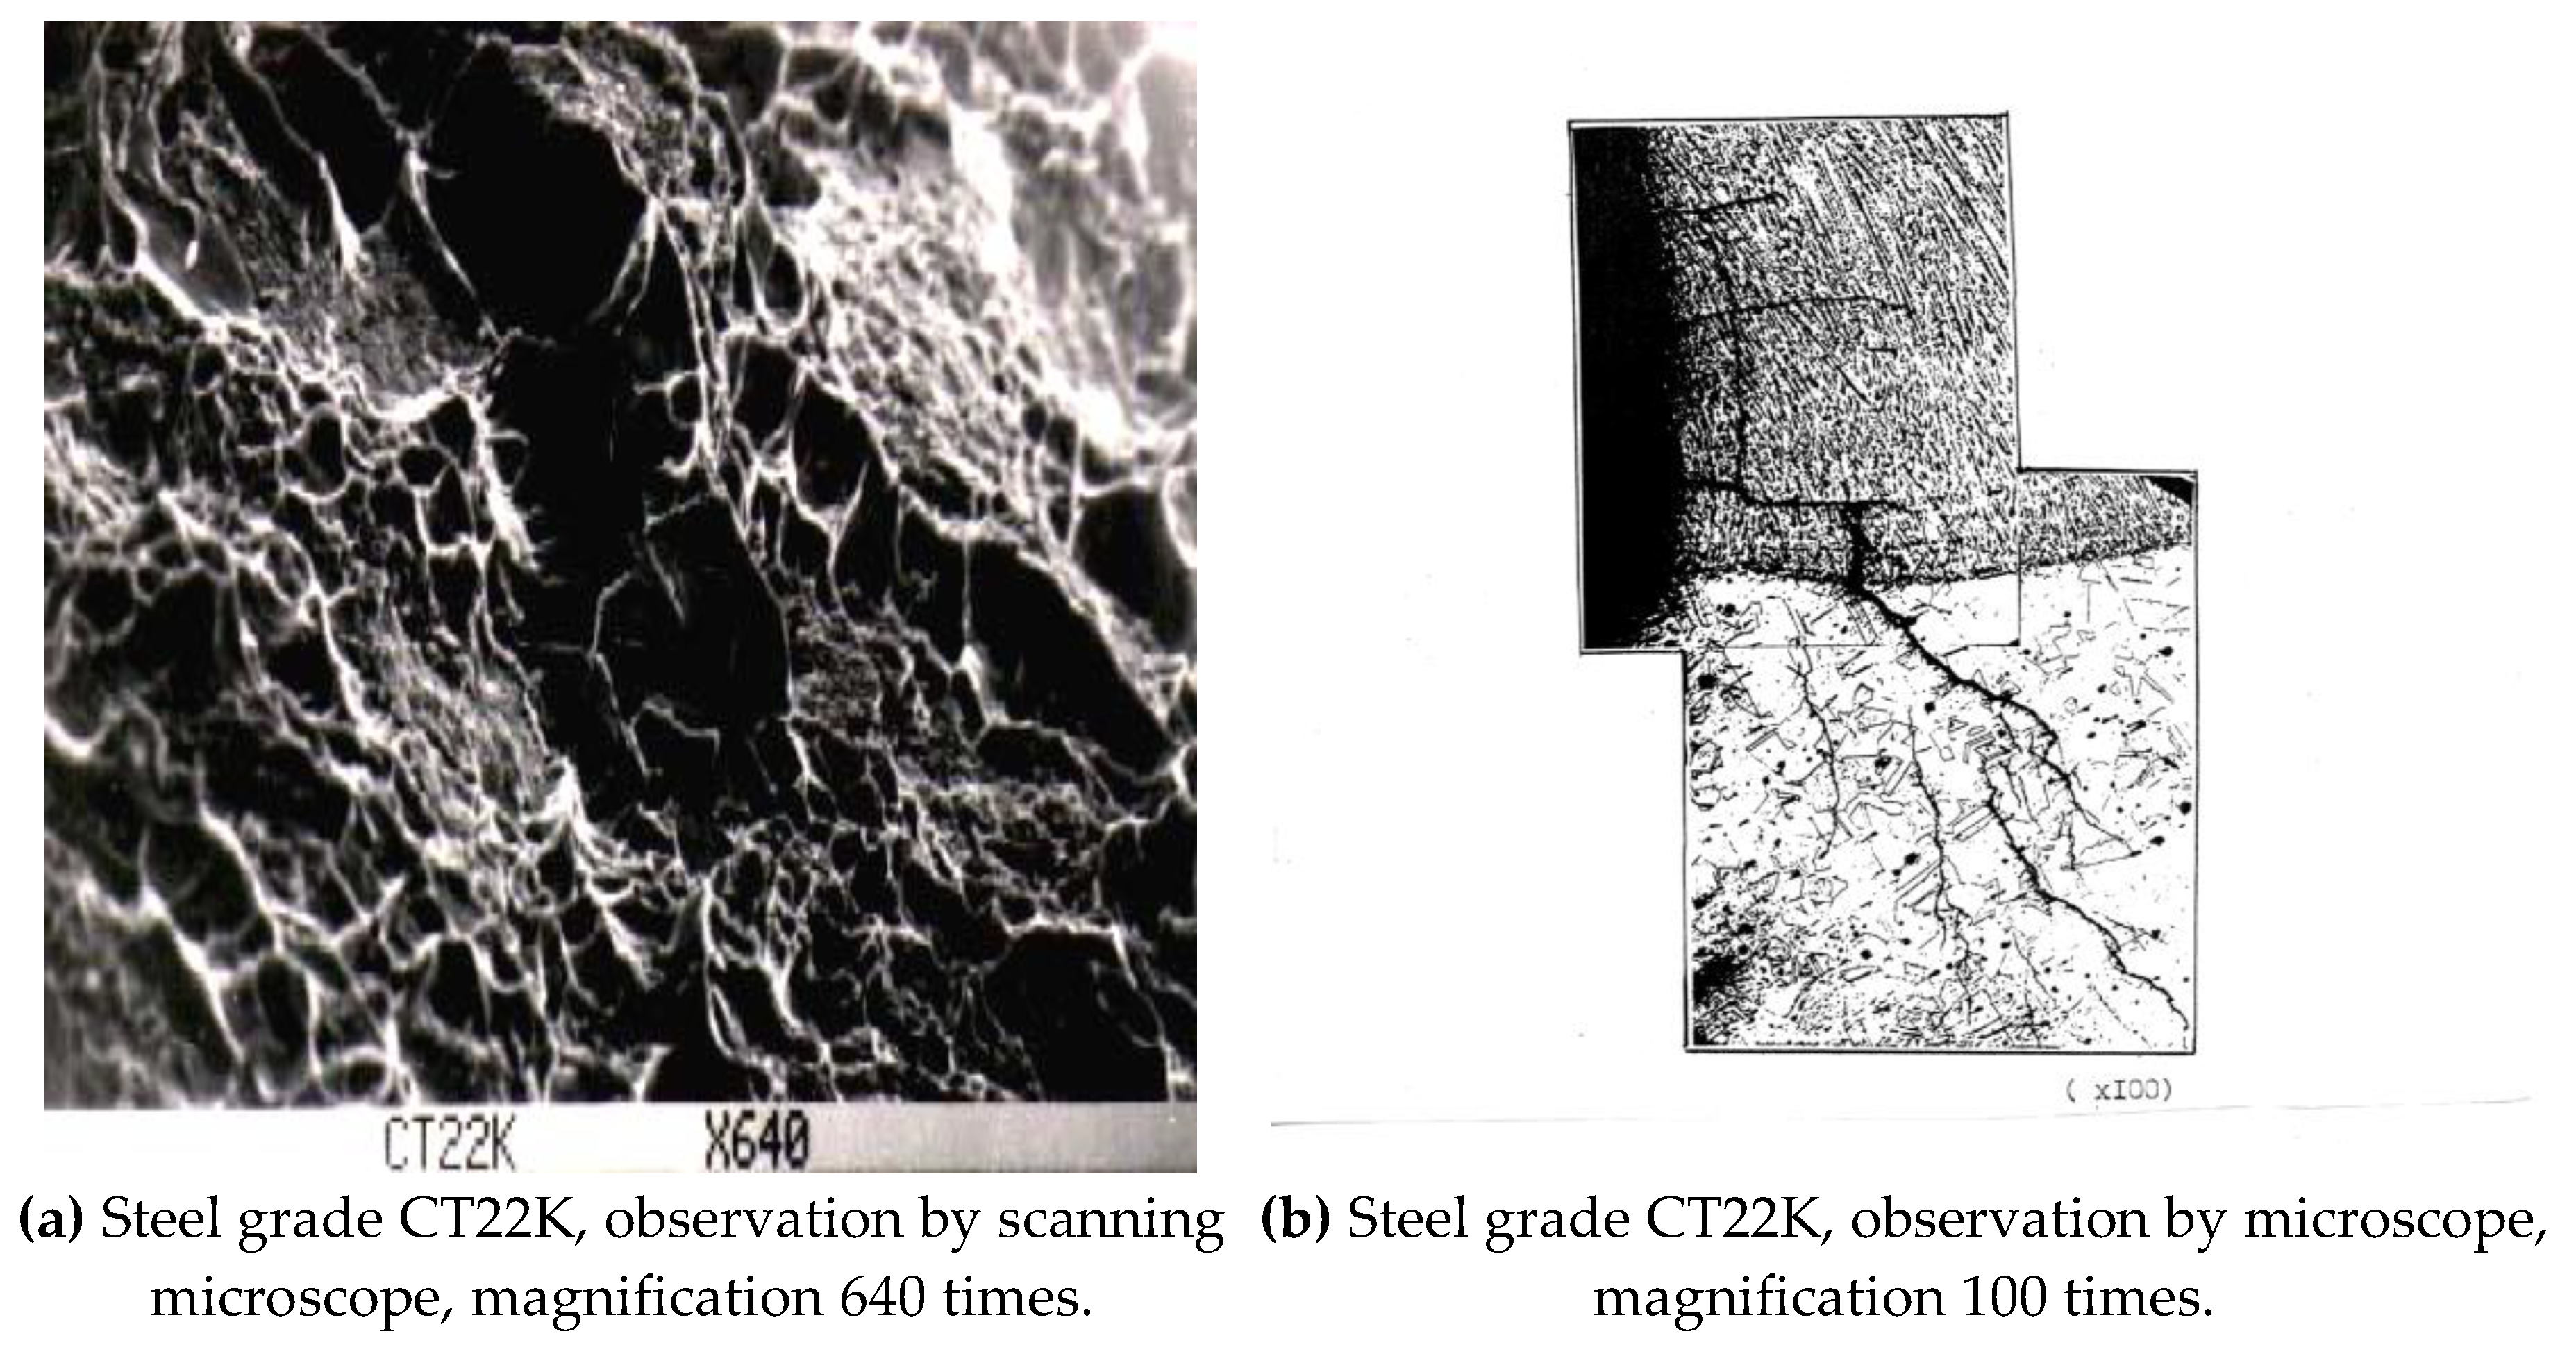

Table A1.
values of y), graphically obtained from Figure 6.
Table A1.
values of y), graphically obtained from Figure 6.
| Example values of |
y) [%] I sector |
y) [%] III sector |
| 40 | 1 | 0,3 |
| 50 | 5 | 63 |
| 60 | 20 | Над 100 |
References
- Available online: https://pris.iaea.org/PRIS/WorldStatistics/OperationalByAge.aspx.
- IAEA International Atomic Energy Agency, Safety Reports Series № 82 (2019) Ageing Management for Nuclear Power Plants: International Generic Ageing Lessons Learned (IGALL). 2020. Available online: https://www.iaea.org/publications/13475/ageing-management-for-nuclear-power-plants-international-generic-ageing-lessons-learned-igal.
- IAEA International Atomic Energy Agency. Unified Procedures for Lifetime Assessment of Components and Piping in WWER, NPP, Verlife. 2011. Available online: https://inis.iaea.org/search/search.aspx?orig_q=RN:43130377.
- FNP-105-18 Rules for Inspection of Metal, Equipment and Pipelines of Nuclear Power Plants during Manufacture and Installation. 2018. Available online: https://www.secnrs.ru/science/development/english/?doc=5936.
- BDS EN 10228-3:2016 Non-destructive testing of steel forgings - Part 3: Ultrasonic testing of ferritic or martensitic steel forgings. 2016. Available online: https://bds-bg.org/en/project/show/bds:proj:88457.
- BDS EN 10228-4:2016 Non-destructive testing of steel forgings - Part 4: Ultrasonic testing of austenitic and austenitic-ferritic stainless steel forgings. 2016. Available online: https://bds-bg.org/en/project/show/bds:proj:88458.
- BDS EN ISO 17 640:2019 Non-destructive testing of welded joints. Ultrasonic testing. Technologies, Test Levels and Evaluation. 2019. Available online: https://bds-bg.org/bg/project/show/bds:proj:107011.
- BDS EN ISO 16 823:2014 Non-destructive testing of welded joints. Ultrasonic testing. Transmittance technology. 2014. Available online: https://bds-bg.org/bg/project/show/bds:proj:90669.
- GOST R 50.05.02-2019 Conformity assessment system in the field of atomic energy use. Conformity assessment in the form of control. Ultrasonic Testing of Welded Joints and Weld Coatings. 2019. Available online: https://www.ntcexpert.ru/documents/gost-r-50-05-14-2019.pdf.
- GOST R 50.05.04-2018 Conformity assessment system in the field of atomic energy use. Conformity assessment in the form of control. Ultrasonic Testing of Austenitic Steel Welds. 2018. Available online: https://www.ntcexpert.ru/documents/gost-r-50-05-14-2019.pdf.
- Weibull distribution. Available online: https://www.sciencedirect.com/topics/physics-and-astronomy/weibull-distribution.
- Dimova, G.T. Probabilistic Approach to Determining the Tendency to Destroy a Nuclear Reactor Vessel in the Presence of Metal Defects. Journal of Power and Energy Engineering 2025, 13, 1–12. [Google Scholar] [CrossRef]
- Dimova, G.T.; Staevski, K. Probabilistic distribution of defects in the metal of components of the I-th circuit of WWER Nuclear Power Plant. 2013, 106, 25–33. [Google Scholar]
Figure 1.
Diagram on Pressurizer.
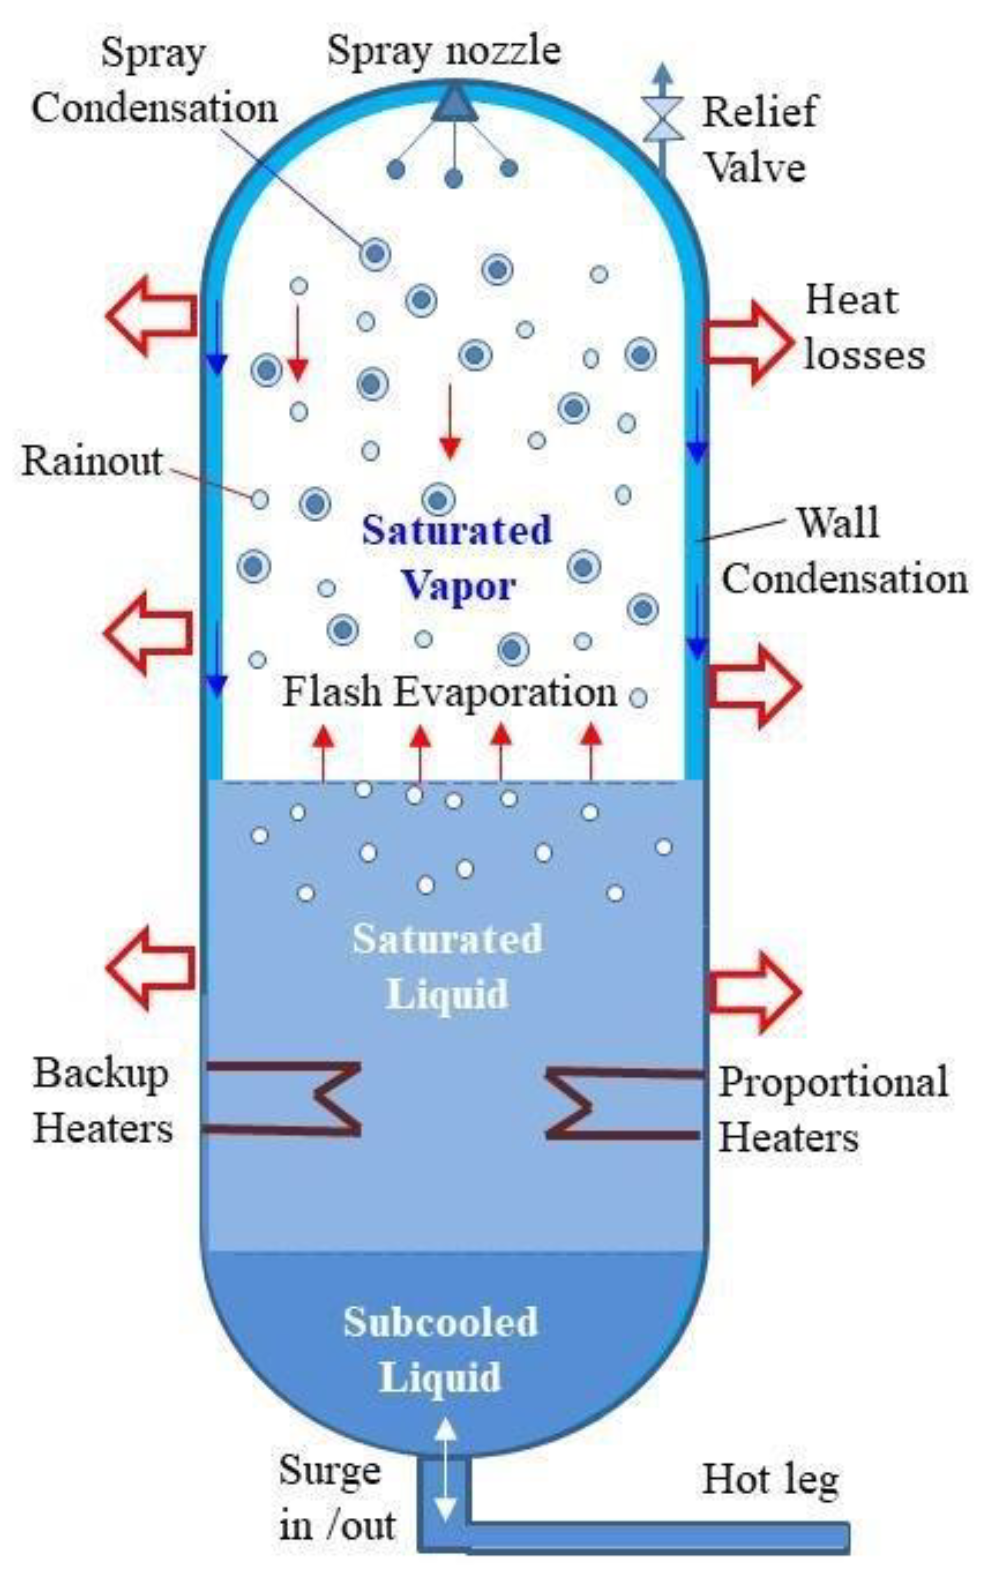
Figure 2.
Ultrasonic inspection scheme.
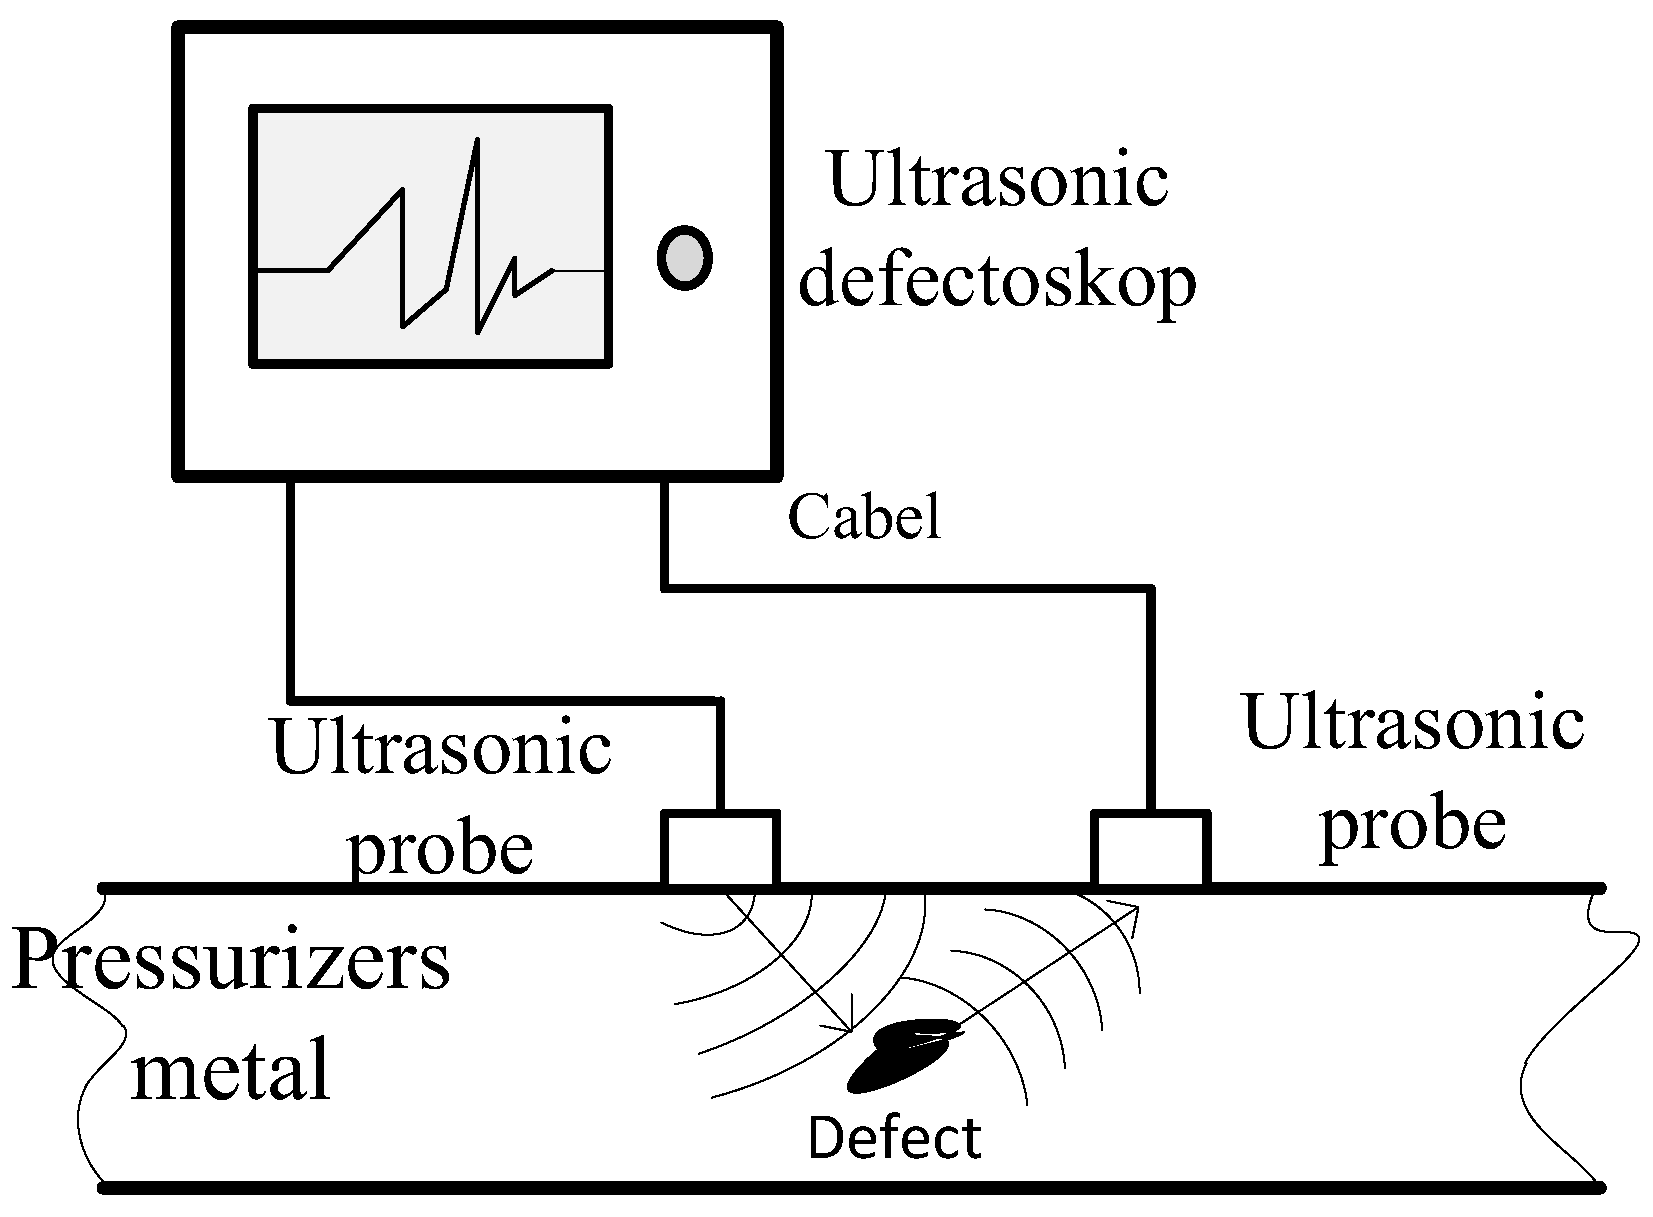
Figure 3.
Multi-channel ultrasonic flaw detector.
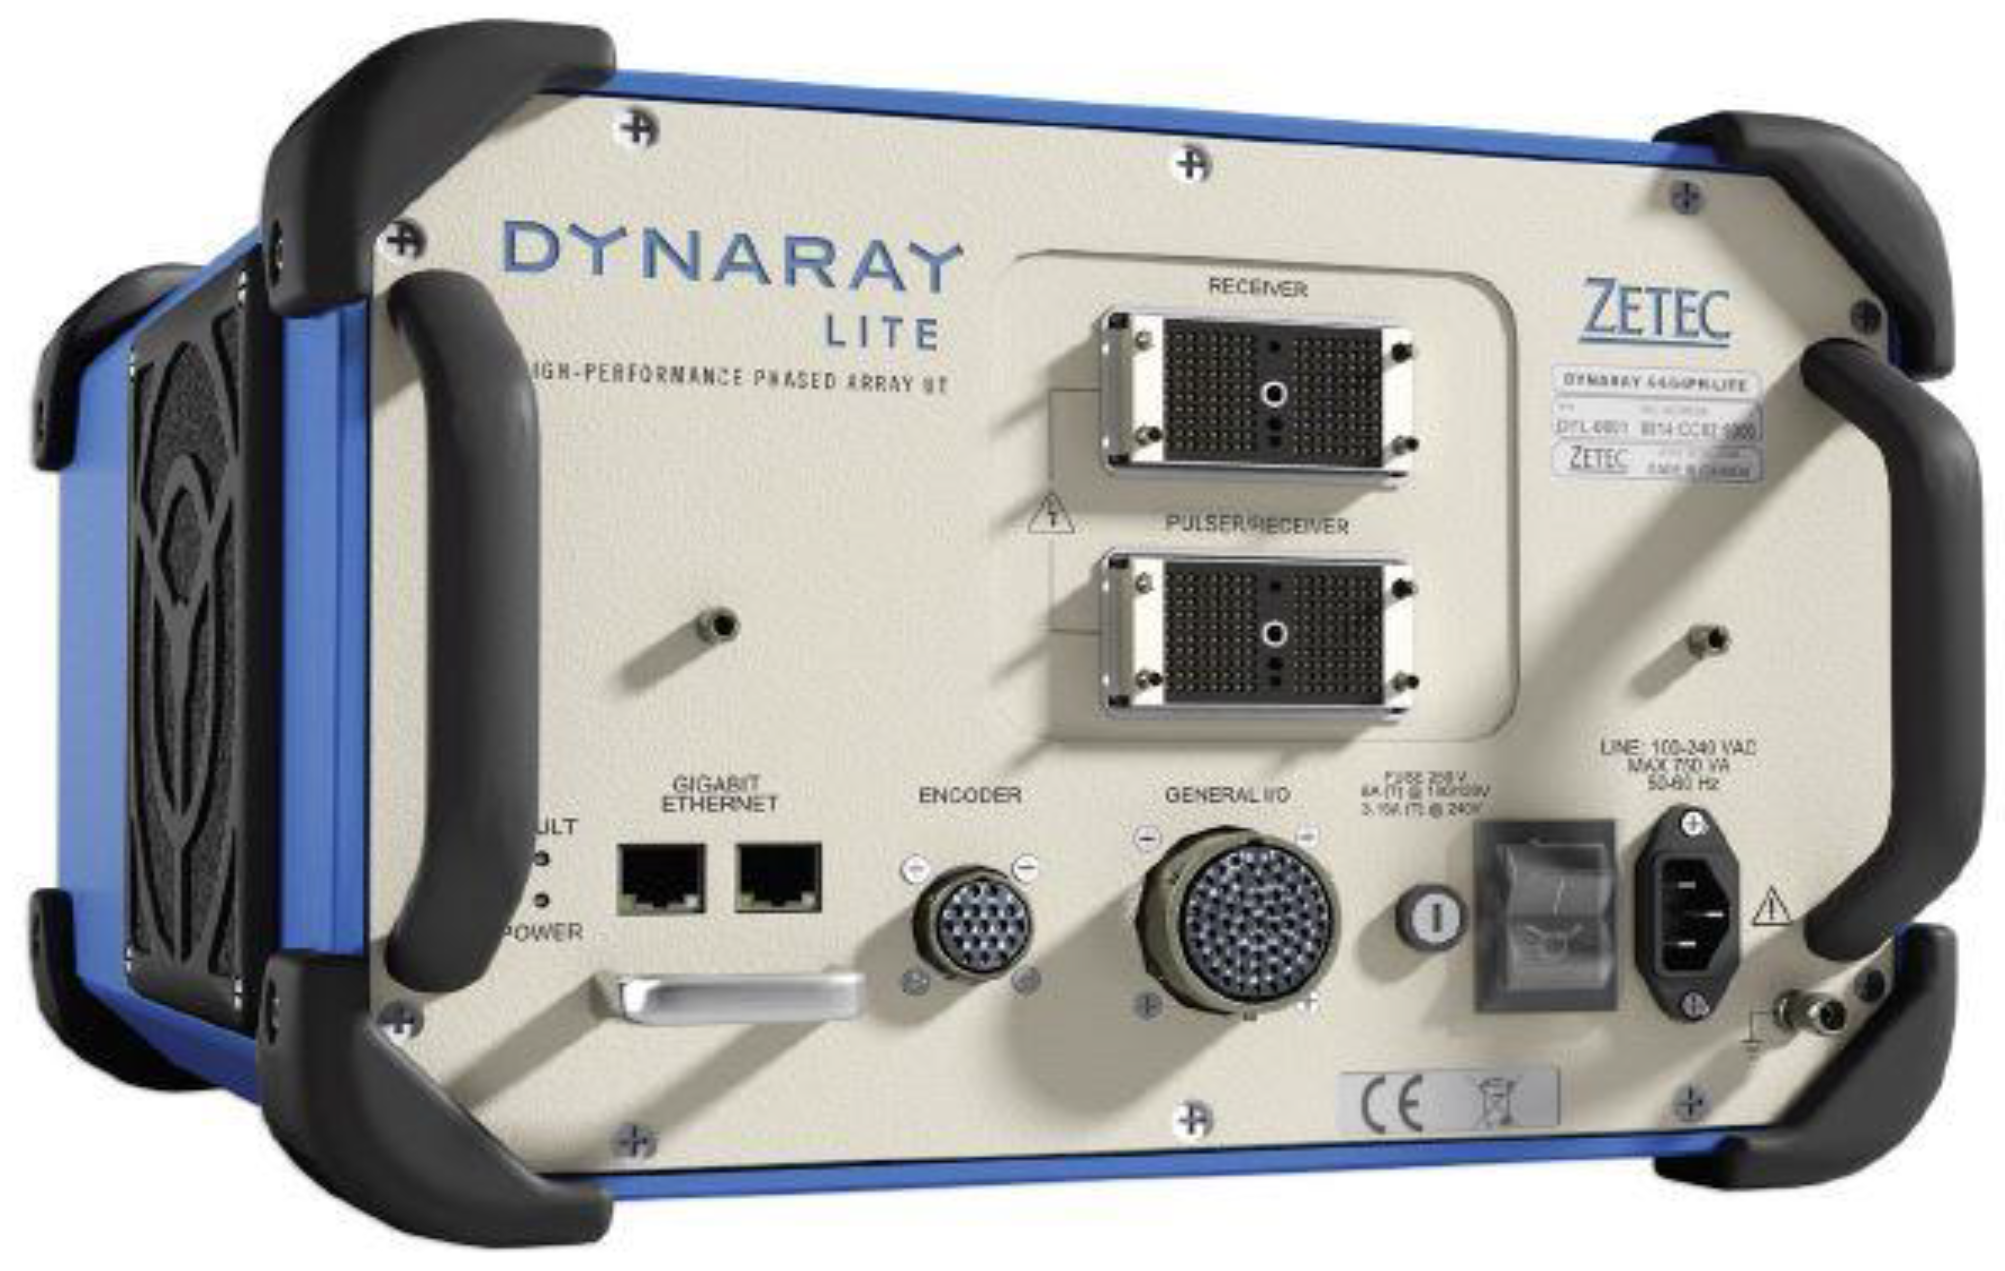
Figure 4.
Scanning ultrasonic flaw detectors.
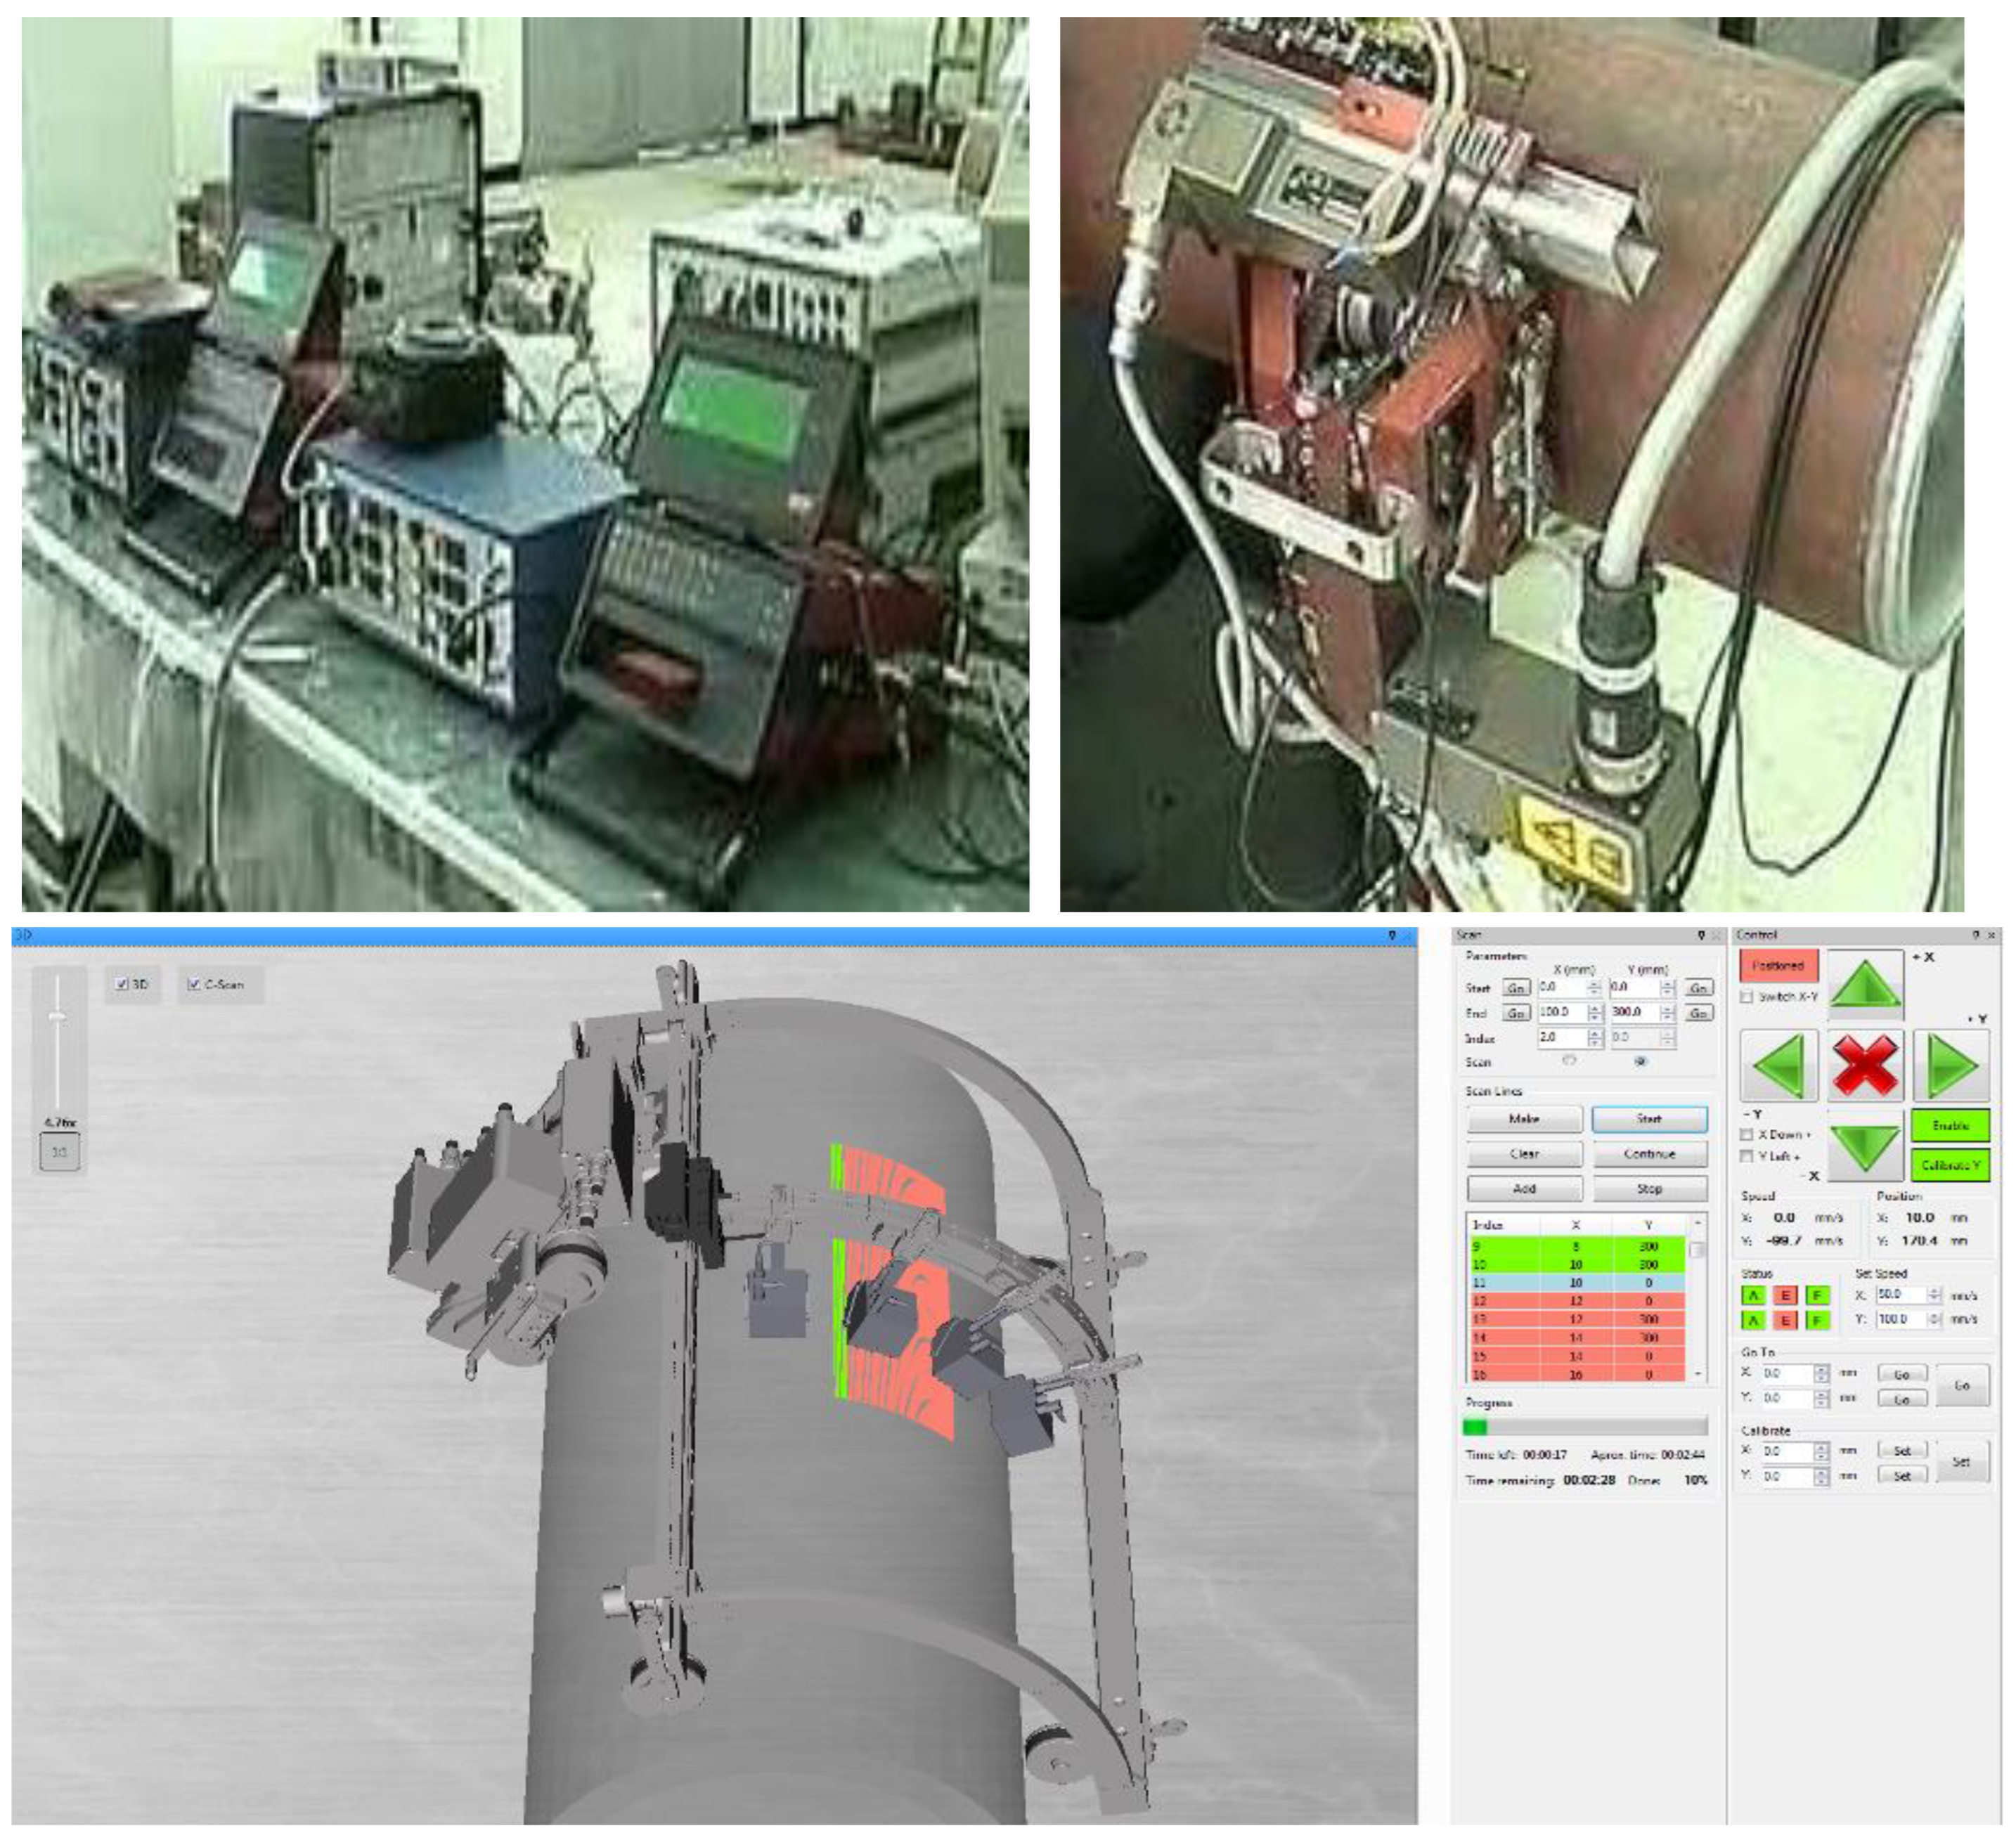
Figure 5.
Lengths of defect indications, [mm] in the object "Welded joint of the Pressurizer housing“.
Figure 5.
Lengths of defect indications, [mm] in the object "Welded joint of the Pressurizer housing“.
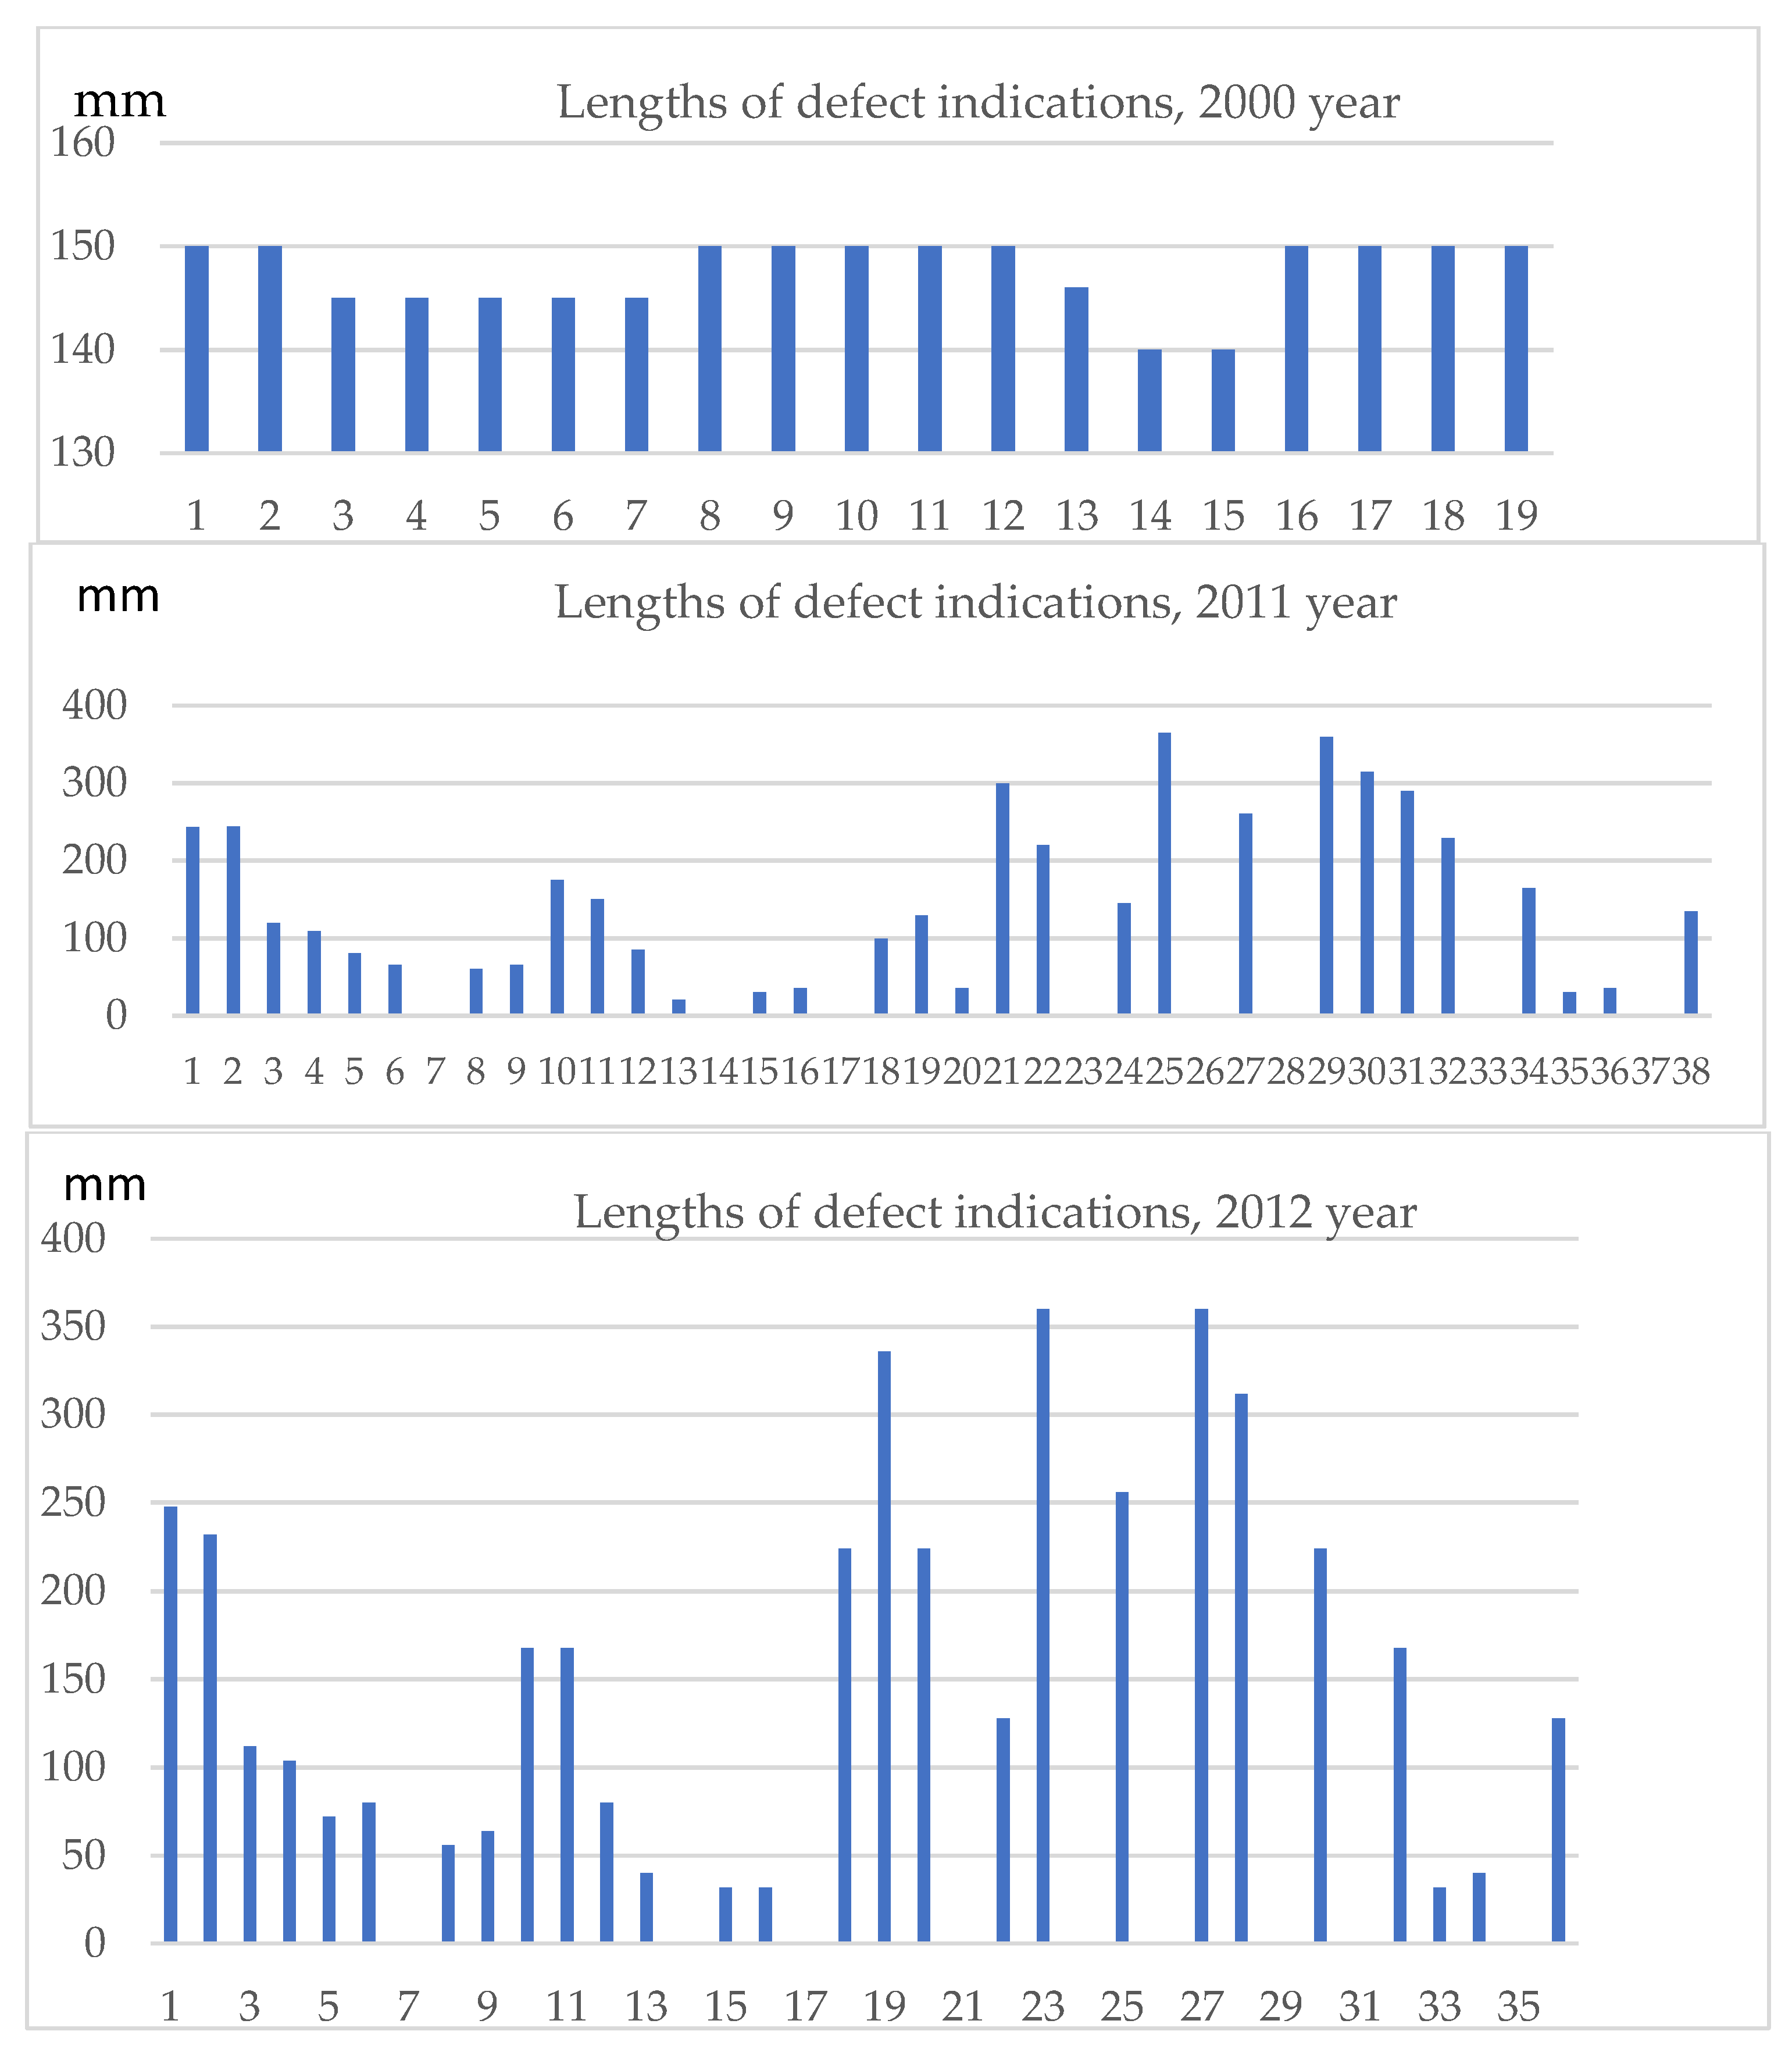
Figure 6.
Data for and ) , calculated by (1) are plotted in Weibull paper.
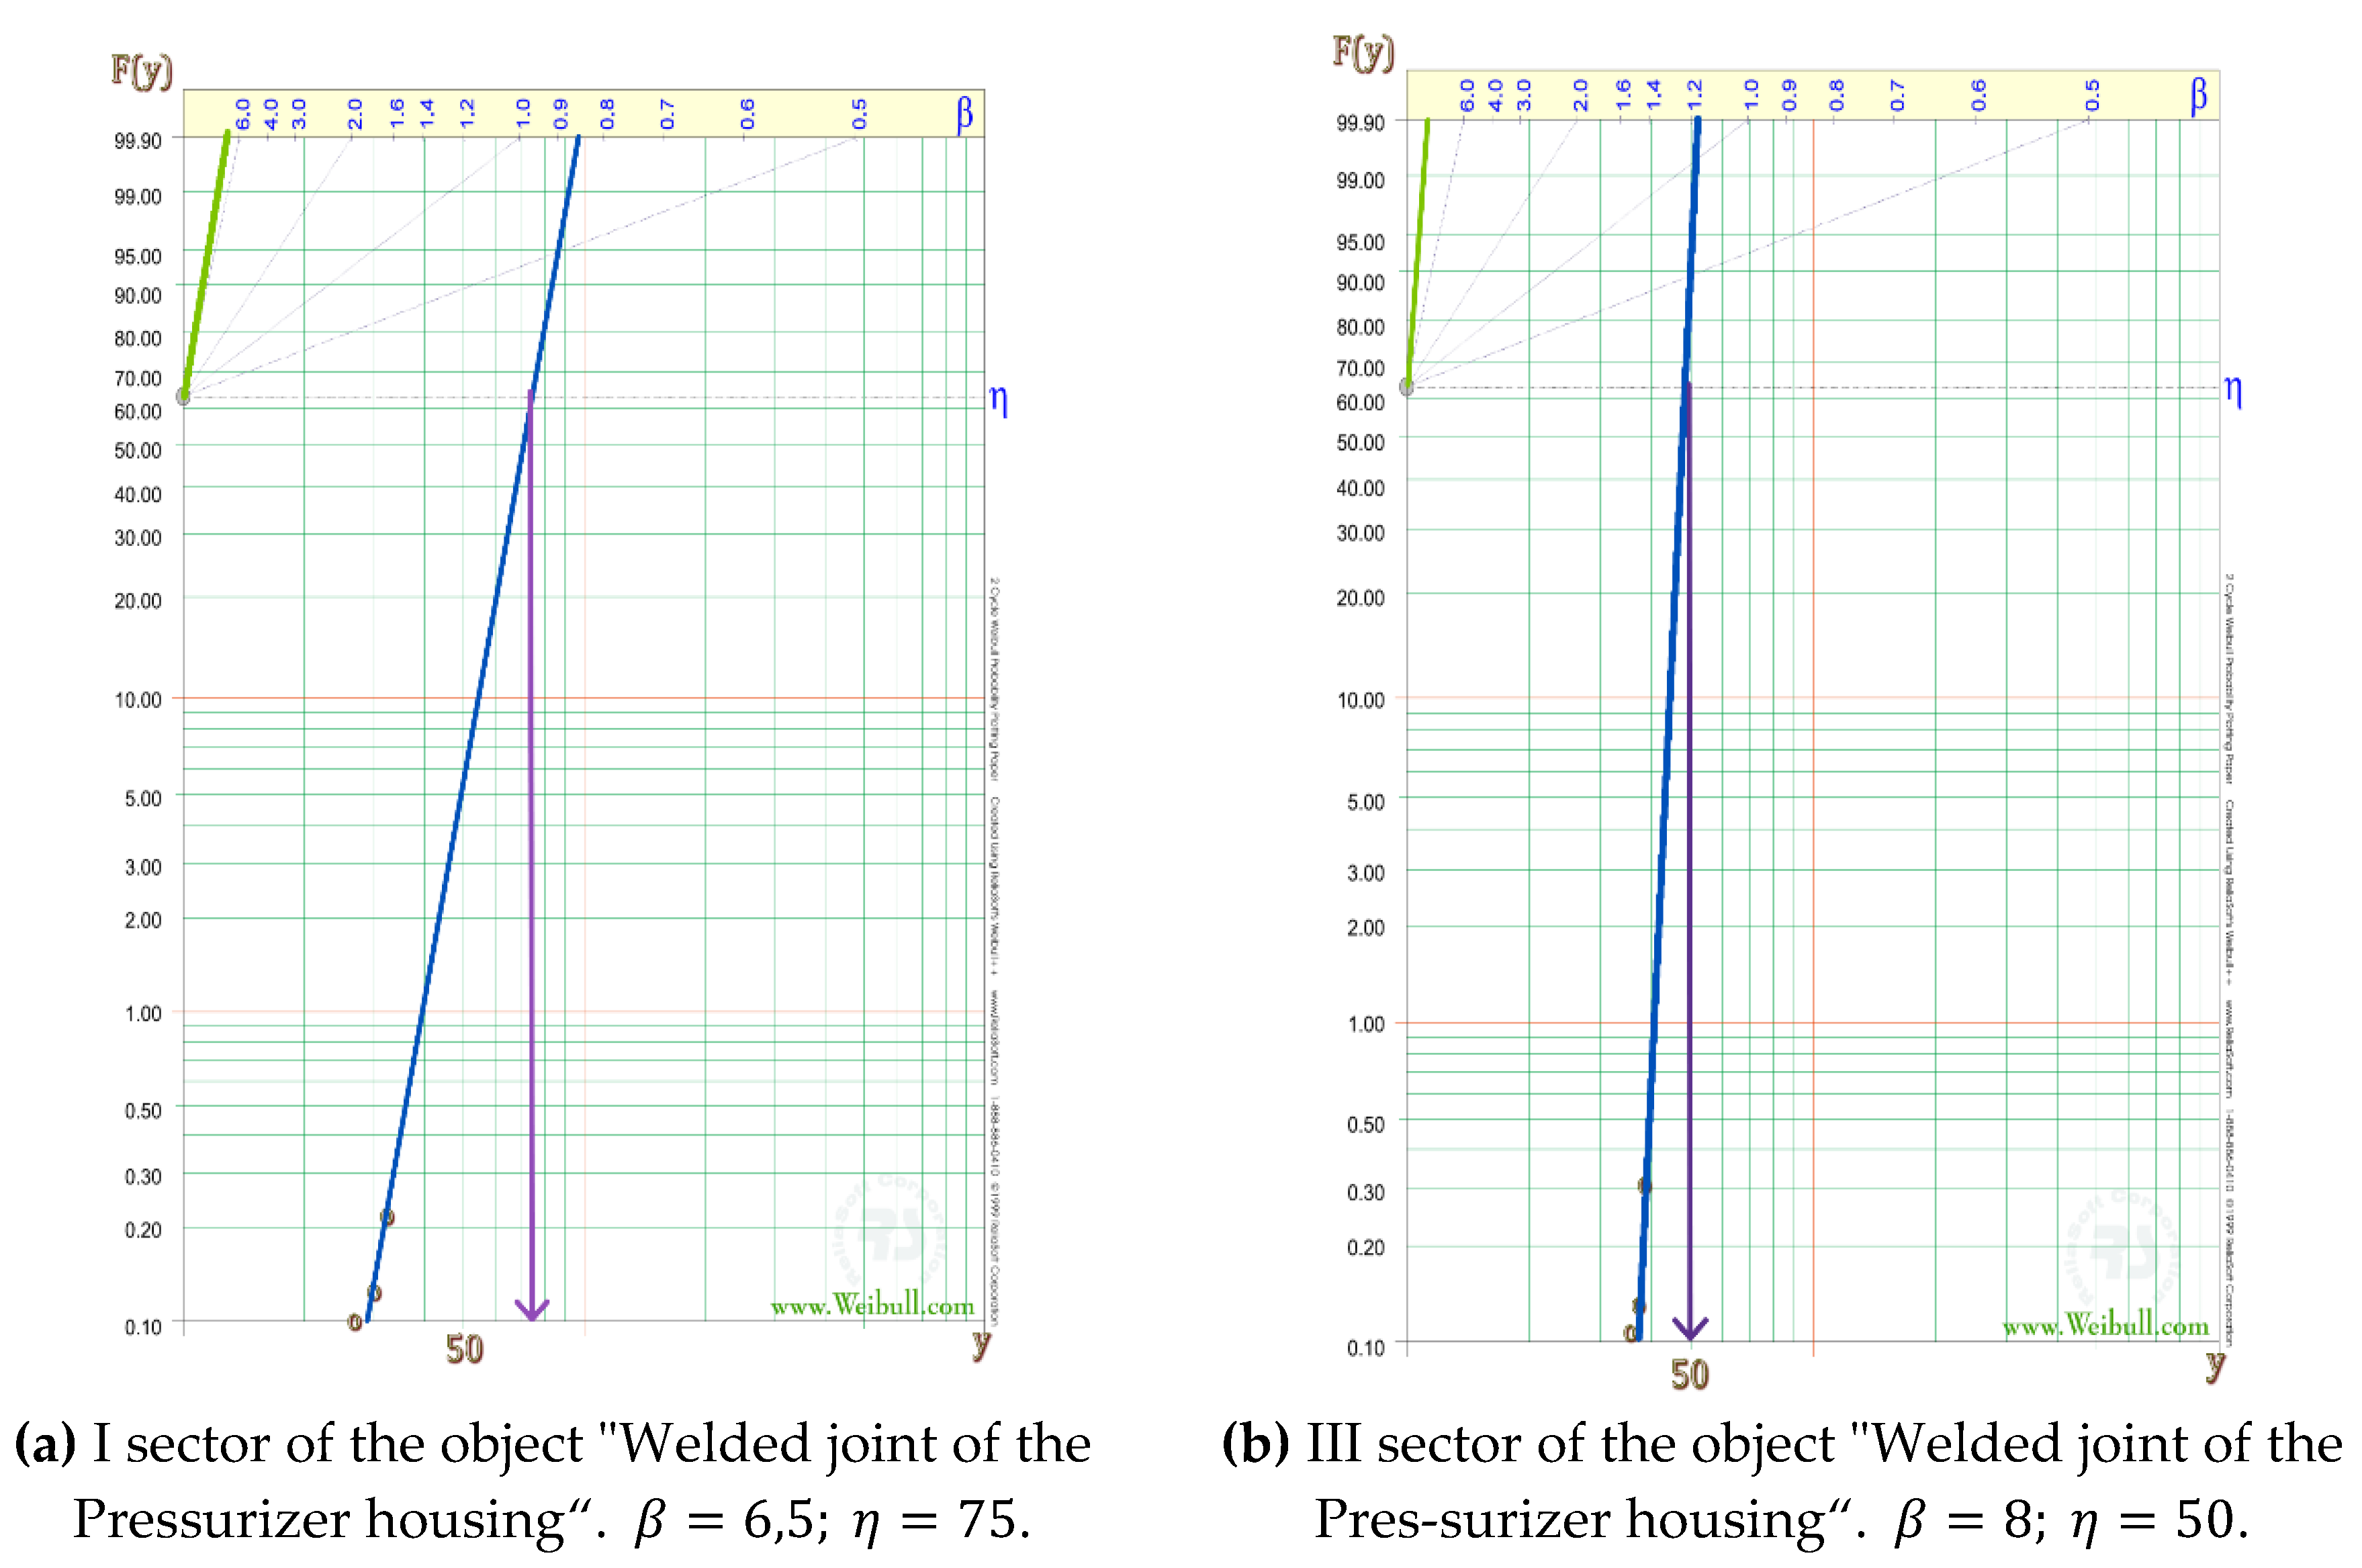
Table 1.
Ranked data for the indications in sectors I and III of the object "Welded joint of the Pressurizer housing“.
Table 1.
Ranked data for the indications in sectors I and III of the object "Welded joint of the Pressurizer housing“.
|
[%] |
|||||
|---|---|---|---|---|---|
| Ranked data for the largest defect from sector I of the site | |||||
| 1 | 31 | 0,109 | 0,891 | 0,7 | 0,22 |
| 2 | 30,3 | 0,265 | 0,735 | 1,4 | 0,11 |
| 3 | 28,9 | 0,421 | 0,579 | 10,2 | 0,01 |
| 4 | 18,7 | 0,578 | 0,422 | 0 | 0 |
| 5 | 18,7 | 0,734 | 0,266 | 0 | 0 |
| 6 | 18,7 | 0,89 | 0,11 | 0 | 0 |
| Ranked data for the largest defect from sector III of the site | |||||
| 1 | 28 | 0,109 | 0,891 | 0,5 | 0,31 |
| 2 | 27,5 | 0,265 | 0,735 | 1,7 | 0,09 |
| 3 | 25,8 | 0,421 | 0,579 | 7,7 | 0,02 |
| 4 | 18,1 | 0,578 | 0,422 | 0 | 0 |
| 5 | 18,1 | 0,734 | 0,266 | 0 | 0 |
| 6 | 18,1 | 0,89 | 0,11 | 0 | 0 |
Disclaimer/Publisher’s Note: The statements, opinions and data contained in all publications are solely those of the individual author(s) and contributor(s) and not of MDPI and/or the editor(s). MDPI and/or the editor(s) disclaim responsibility for any injury to people or property resulting from any ideas, methods, instructions or products referred to in the content. |
© 2025 by the authors. Licensee MDPI, Basel, Switzerland. This article is an open access article distributed under the terms and conditions of the Creative Commons Attribution (CC BY) license (http://creativecommons.org/licenses/by/4.0/).
Copyright: This open access article is published under a Creative Commons CC BY 4.0 license, which permit the free download, distribution, and reuse, provided that the author and preprint are cited in any reuse.


