
Submitted:
03 July 2025
Posted:
04 July 2025
You are already at the latest version
Abstract
Restoration plantations in subtropical regions, often established with fast-growing tree species like Acacia auriculiformis and Eucalyptus urophylla, are frequently developed on highly weathered soils characterized by natural phosphorus (P) deficiencies. To investigate strategies for mitigating nutrient imbalances in such ecosystems, a long-term (≥ 13 years) fertilization experiment was designed. The experiment involved three fertilization regimes: nitrogen (N) fertilizer alone, P fertilizer alone and a combination of N and P (NP) fertilizer. The objective of this study was to investigate the effects of long-term fertilization practices on soil quality in subtropical plantations through a soil quality index (SQI). Principal component analysis (PCA) was used along with a literature review to select a minimum dataset (MDS) to calculate SQI. Three physical indicators (silt, clay, soil water content), three chemical indicators (soil organic carbon, inorganic nitrogen, total phosphorus), and two biological indicators (microbial biomass carbon, phosphodiesterase enzyme activity) were chosen as MDS from a total dataset (TDS) of eighteen soil indicators. Our study showed that long-term fertilization did not significantly change the soil quality as measured by SQI in both Acacia auriculiformis (p=0.25) and Eucalyptus urophylla (p=0.45) plantations. However, investigations of individual soil indicators in the MDS suggested that P addition through fertilization (P and NP regimes) strongly increases the P pool in the subtropical plantation soil. The MDS provided a strong representation of the TDS data (R2=0.81), and the SQI was positively correlated with littermass (R2=0.37). These findings suggest that the MDS can serve as a quantitative and effective tool for long-term soil quality monitoring.
Keywords:
soil quality
; nitrogen deposition
; phosphorus limitation
; a minimum dataset
; subtropical plantation
1. Introduction
Subtropical forests comprise 11% of the world’s forest ecosystems [1]. In areas with increasing population density and rapid economic development, subtropical forest ecosystems are often transformed into alternative land-use practices that prioritize the production of wood and other forest products [2]. However, such forms of conversion are typically unsustainable, resulting in significant degradation of the land and forest ecosystems [3-5]. Protective forest plantations play a pivotal role in preventing soil erosion and ecosystem restoration. Evidence suggests that fast-growing trees can promote erosion control through mechanisms including soil improvement and water regulation [6, 7]. As a result, extensive plantations have been established in southern China since the 1980s. Afforestation efforts in this region frequently utilize fast-growing tree species such as Eucalyptus urophylla and Acacia auriculiformis [8].
Managing fast-growing monoculture plantations for long-term sustainability requires careful consideration of risks including potential nutrient limitation [9-11]. Subtropical forest soils, characterized by high weathering, often face phosphorus (P) limitation [12-14], which can hinder tree growth, reduce soil fertility, and potentially alter nutrient cycling processes [15-17]. Furthermore, subtropical areas in China have been regarded as nitrogen (N) deposition hotspots primarily attributed to the increased consumption of N fertilizers and fossil fuels in recent decades, which might experience even greater P limitation [18, 19]. The resulting imbalance between N and P supply in the subtropical plantations can have negative consequences for soil quality and the sustainability of plantation ecosystems [20-22]. Ren et al. [23] found that most of these monoculture plantations have low productivity, thereby offering insufficient forest goods and ecosystem services.
Given that both N and P are particularly important nutrients for ecosystem structure, processes and function, fertilization has been one of the intensive forest management practices in plantations [24-27]. Results from previous studies demonstrate a strong and consistent association between fertilization and changes in soil nutrients. Lu et al. [28] reported that N fertilization significantly increased soil carbon (C) levels in subtropical forests via a decade-long N addition experiment and meta-analysis. Meanwhile, P fertilization was found to improve N-induced negative effects including nitrate leaching and nitrous oxide emission. While combined N+P fertilization is supposed to have synergistic effects on soil microbial activity and nutrient dynamics [29]. According to Fan et al. [30], soil physicochemical indicators including available P and related enzyme activity were considerably changed under N and P fertilizers. Overall, these studies illustrate how different fertilizer applications affect soil nutrient pools and the effects can be site-specific. However, few studies have quantitatively and comprehensively examined the consequences of long-term fertilization practices on soil quality of subtropical plantations.
Soil quality, defined as “the capacity of a soil to function within ecosystem and land-use boundaries to sustain biological productivity, maintain environmental quality and promote plant and animal health” [31], is a multifaceted concept for assessing the impacts of management practices [32-34]. By focusing on a specific soil threat like nutrient imbalance and a key function like nutrient supply, soil quality assessment can provide more targeted insights into the impacts of management practices. Building on Bünemann et al. [35], who emphasized the importance of assessing changes in soil quality status to devise adaptive management strategies, this study aims to evaluate the effects of long-term fertilizer application on soil quality in subtropical plantation soils via soil quality assessment.
Although soil quality cannot be measured directly, certain soil physical, chemical and biological indicators offer valuable information about soil processes and functions [36-39], and a minimum dataset (MDS) is often preferred because it can significantly reduce laboratory analysis workload and associated costs [40-43]. An MDS represents a subset of carefully chosen soil indicators selected from the total dataset (TDS), offering sufficient information for comprehensive soil quality evaluations. Many multivariate techniques including principal component analysis (PCA), redundancy analysis and factor analysis can capture the most relevant information while minimizing redundancy and complexity [35]. Among them, PCA is a popular method to identify MDS and has been extensively applied in various soil quality assessment studies [44-47].
In this study, we took advantage of the long-term fertilization experimental plot in the Acacia auriculiformis and Eucalyptus urophylla plantations starting in 2010. We hypothesized that Acacia auriculiformis plantation would exhibit higher soil quality than that of Eucalyptus urophylla plantation, due to the N-fixing capabilities of leguminous species in the former. Previous studies have reported positive impacts on soil nutrient pools and microbial communities in plantations dominated by leguminous species such as Acacia auriculiformis [48-50]. Given the differential responses of soil indicators to fertilization, we refrained from making any a priori predictions regarding SQI variation among treatments. Our investigation focused on the key questions: 1) How do long-term fertilization regimes affect a range of potential soil quality indicators? 2) How does soil quality vary among different fertilization regimes and plantations as measured by an SQI? 3) Can an MDS be identified that effectively represents the overall soil quality with long-term fertilization ?
2. Materials and Methods
2.1. Site Description
Soil quality indicators were assessed in two forest plantations located at the Heshan National Field Research Station of Forest Ecosystems (112°50′E, 22°34′N), Guangdong Province, South China (Figure 1A). The station is situated within a humid subtropical monsoon zone. The annual precipitation is about 1300 mm, with most rainfall occurring between May and September. The mean annual temperature is 21.7 °C. The terrain is hilly, with slopes ranging from 8° to 20°. Both plantations were established in 1984, covering areas of 4.6 ha and 1.9 ha, respectively [51]. Historically, unsustainable exploitation practices and inadequate land-use management have resulted in the degradation of the original forest ecosystem (Figure 1B, C). To address this issue, restoration efforts began in 1980s with the introduction of various tree species. The plantations investigated in this study were dominated by two different vegetation types: leguminous plants and non-leguminous plants. The leguminous plantation was primarily composed of Acacia auriculiformis, while the non-leguminous plantation was dominated by Eucalyptus urophylla (Figure 1D, E). These are typical fast-growing species for restoration in southern China and both were 40 years old. Details of the two plantations are presented in Tables S1 and S2.
2.2. Experimental Design and Sampling
In August 2010, an N and P fertilization study was established in the Acacia auriculiformis and Eucalyptus urophylla plantation as a randomized complete block design with three blocks, and three fertilization treatments varying in application dose. The field experiment included a control plot without fertilizer application (Control), an N fertilizer of 50 kg N ha-1 yr-1 (N fertilizer), a P fertilizer of 50 kg P ha-1 yr-1 (P fertilizer) and an N+P fertilizer of 50 kg N ha-1 yr-1 + 50 kg P ha-1 yr-1 (NP 50 fertilizer). Within each plantation, twelve 10 m × 10 m plots were established, separated by 10 m wide buffer zones to minimize interference between different fertilization treatments. Ammonium nitrate (NH4NO3) and/or dihydrogen phosphate (NaH2PO4) dissolved in 10 L water was used for the application. The fertilizer solution was then sprayed evenly on each plot every two months starting in August 2010. The control plots received 10 L of water during each fertilizer application.
The soil was sampled in September (wet season) and December (dry season) of 2023, respectively in the two plantations. Five soil samples were randomly collected from the 0-20 cm soil layer in each plot and mixed into a single composite soil sample. In this way, a total of 48 (4 treatments × 3 replicates × 2 plantations × 2 seasons) soil samples were collected. The soil samples were brought to the lab, immediately sieved in a 2 mm mesh, and then divided into two parts. One part was air-dried at room temperature and the other part was stored at -4 °C for further analyses. We collected litter within each plot during the wet (July-September 2023) and dry (October-December 2023) seasons, using a 100 × 100 cm sampling frame. Three bags of litter samples were collected from each subplot and then dried at 105 °C to determine the litter mass.
2.3. Laboratory Analysis
A total of eighteen physical, chemical, and biological indicators were measured in each collected soil sample. The soil physical indicators included soil water content (SWC) and soil structure. SWC was determined by gravimetric method with oven drying [52]. Particle size distributions of sand (0.05–2.0 mm), silt (0.002–0.05 mm) and clay (< 0.002 mm) were determined by the laser diffractometry method [53]. The soil chemical indicators included pH, soil organic C (SOC), total N (TN), inorganic N (IN), total P (TP) and cation exchange capacity (CEC). Soil pH was measured using a combination glass electrode meter (Mettler Toledo, Zurich, Switzerland) in a 1:2.5 soil-to-water slurry. SOC and TN were measured using an elemental analyzer (vario Max cube, Elementar, Germany). Soil IN, including ammonium (NH4+) and nitrate (NO3-), were extracted by potassium chloride at a 1:2.5 soil–water ratio and determined using a continuous segmented flow analyzer (AA3, SEAL Analytical, Germany). Soil TP was measured using an X-ray fluorescence spectrometer (CNX-808, NCS, China). The exchangeable cations (K+, Ca2+, Na+, Mg2+, Al3+, Fe3+, and Mn2+) were determined following protocols as described previously [54], and CEC was calculated as the sum of the exchangeable cations. The soil biological indicators included microbial biomass C (MBC), microbial biomass N (MBN) and potential enzyme activities related to C, N and P cycle including β-glucosidase (BG), xylanase (XYL), β-D-cellobiohydrolase (CBH), β-N-acetylglucosaminidase (NAG), phosphodiesterase (PDE) and phosphomonoesterase (PME). MBC and MBN were determined by the chloroform fumigation method [55, 56]. Potential enzyme activities were measured using the microporous plate fluorescence method based on Bell et al. [57].
2.4. The Minimum Dataset
A literature study was conducted using Core Collection databases from the Web of Science®, - Clarivate Analytics platform (https://webofknowledge.com/) to identify suitable indicators to be included in the MDS of fertilization experiments. We set the topic retrieval as (forest OR plantation) and (fertiliz*) and ("soil quality" OR "soil health"), and only research articles written in English were included. After downloading all lists of articles, a screening process for article eligibility was performed (Figure S1). MDS were collected and summarized from 32 publications to identify the most suggested indicators (Table S4). Three main steps were followed to conduct soil quality assessment in this study: (i) apply PCA to identify MDS, (ii) apply standard scoring functions to normalize the MDS indicators, and (iii) integrate the indicator scores into a soil quality index for quantification and comparison [32, 58]. PCA helps in reducing the dimensionality of the soil indicators measured by transforming the original data into a smaller set of uncorrelated variables called principal components (PCs).
The normalized data of soil physical, chemical and biological properties underwent PCA separately [59]. PCs with eigenvalues ≥ 1 were selected according to Kaiser's criterion to ensure that each retained PC explains at least as much variance as a single original variable. For each PC, only the indicators with an absolute loading value within 10% of the highest loading were retained. Pearson's correlation coefficient was used to assess the relationships between variables when more than one indicator was retained in each PC. If highly loaded indicators have a high correlation (p < 0.05), it indicates redundancy, and so only a representative indicator was chosen for MDS. Otherwise, each indicator was retained in the MDS. After determining the MDS for the SQI, each soil indicator was transformed into a unitless score ranging from 0.00 to 1.00 using the standard scoring function [32, 42]. The indicators were considered good (i.e., more is better) when increasing values indicate positive soil quality or bad (i.e., less is better) when decreasing values reflect better soil quality. “More is better” (Equation 1) and “less is better” (Equation 2) functions were used as follows:
where S is the score of the soil indicator, X is the soil indicator value, and Xmax, Xmin are the maximum and minimum values of each soil indicator observed among the two plantations.
The transformed indicator scores were integrated into an SQI using the following formula (Equation 3):
where Wi and Si are, respectively, the weight and the indicator score. For validation of the relationship between TDS and MDS in SQI, Wi is derived from the communality of the indicator in each PCA for TDS and the variation in each PC for MDS, respectively. Communality refers to the proportion of variance in a soil indicator that is accounted for by all the retained principal components. For indicators in MDS, the total weight (i.e., 1) is evenly distributed among three categories of physical, chemical and biological indicators. Specifically, for uncorrelated indicators within a PC, weights were assigned equally, corresponding to the PC's proportion of the total. Conversely, correlated indicators within a PC had their weights determined by dividing the PC's explained variance proportion among them [33, 45, 60, 61].
2.5. Data Analysis
Data analysis was carried out using R (version 4.3.2). After confirming the normality of data and homogeneity of variance, one-way analysis of variance (ANOVA) was conducted to test the effect of fertilizer applications on individual soil indicators, and Tukey's Honestly Significant Difference (HSD) test was used to compare the mean difference of soil indicators among fertilizer treatments (p < 0.05). A Pearson correlation analysis was conducted to assess the correlations between soil indicators to avoid redundancy. PCA was performed using the “FactoMineR” package [62].
3. Results
3.1. Effect of Fertilization on Soil Indicators
The soil was acidic, with a pH ranging from 3.74 to 4.10 and classified as loam texture according to United States Department of Agriculture (USDA, 2017) classification system. The physical indicators were relatively stable compared to the chemical and biological indicators; the latter ones showed large variation across different fertilizer treatments (Table S3). Notably, fertilization practices significantly impacted the soil nutrient pool. P treatment resulted in an average decrease of IN by 25% and 33% in the Acacia auriculiformis and Eucalyptus urophylla plantations, respectively. Similarly, NP led to IN reductions of 27% and 21% on average in Acacia auriculiformis and Eucalyptus urophylla plantations, respectively. Furthermore, it was noteworthy that both P and NP treatment significantly increased TP while decreasing enzyme activities associated with the P cycle (i.e., PME and PDE). In the Acacia auriculiformis plantation, TP increased by an average of 101% under both P and NP treatment. The Eucalyptus urophylla plantation displayed similar trends, with TP increases of 64% and 92% on average under P and NP treatment, respectively.
3.2. Principal Component Analysis
The results of PCA for physical indicators showed that the first 2 PCs had eigenvalues > 1.0, explaining 49.8% and 33.1% of the total variance, respectively (Table 1). Together, they explained a cumulative variance of 82.9%. The variable vector for SWC and silt pointed in a positive direction on PC1, indicating a positive correlation between these variables and PC1 (Figure 2). The variable vector for sand pointed in a negative direction on PC1, likewise, PC1 was negatively associated with sand (the associated loading was -0.87). PC2 on the other hand, was largely influenced by clay (loading: -0.95).
The results of PCA for soil chemical indicators showed that the first 2 PCs had eigenvalues > 1.0, explaining 45.7% and 26.2% of the total variance, respectively (Table 1). In total, the first 2 PCs captured 71.91% of the total variation. PC1 was highly dependent on SOC, TN, and IN (loading: 0.90, 0.86, and 0.75). PC2 had a strong positive correlation with TP (loading: 0.88). With the variable vector for TP pointed in the direction of the cluster of P and NP points and away from the cluster of C and N points, it represented that both the P and NP treatment affected soil TP. Furthermore, indicators including IN, TN, and SOC were positively correlated because they clustered together closely.
The results of PCA for biological indicators showed that the first 2 PCs had eigenvalues > 1.0 and accounted for 66.9% and 15.0% of the total variance, respectively (Table 1). Together, they explained a cumulative variance of 81.9%. All the variable vectors pointed in a positive direction on PC1, indicating a positive correlation between these variables and PC1. Meanwhile, these variables themselves were positively correlated because the variable vectors were close together and they are all highly contributing variables in PC1. PC2 was significantly impacted by PDE (loading: 0.74) compared with other variables.
3.3. Selection of the MDS
While the measurement methods for these soil indicators may vary, they reflect the content or level of certain properties in the soil based on our literature study (Figure 2). The most used soil physical indicators are soil water storage and bulk density (> 20%), followed by porosity and soil texture. Soil organic carbon/matter (19%), and various forms of macronutrients including N, P, K, Ca, and Mg are the most frequently used chemical indicators. Additionally, soil pH is another commonly measured chemical indicator. The most utilized biological indicators comprise soil enzymes (35%), along with MBC and MBN.
Our analysis of soil physical properties revealed that factors contributing most to the overall composition (PC1) were silt and sand, however, silt and sand were significantly correlated (r = -0.79, p < 0.05) (Figure 3A). Additionally, the adsorption of organic matter onto silt particles is critical for stabilizing soil organic matter [63], therefore only silt is retained in MDS. While SWC did not have a high weight in PC1, it was the most frequently proposed physical indicator as revealed in the literature study. Given its important role in nutrient cycling and storage, SWC was also retained in MDS. For PC2, clay had the highest loading and was retained in MDS.
In the PCA for chemical indicators, the highly weighted indicators for PC1 were SOC and TN. They were significantly correlated with each other. SOC is the main source of nutrients and the most common chemical indicator used in MDS as revealed before, therefore it was not excluded from MDS (Figure 3B). Since TN (r = 0.94, p < 0.05) had a stronger correlation with SOC than IN (r = 0.55, p < 0.05) and IN was a more sensitive indicator in the ANOVA (Table S3), only IN was retained in MDS. TP had the highest loading in PC2 and was therefore retained in MDS.
In the PCA for biological indicators, BG, CBH, XYL, NAG and MBC had the highest loadings in PC1 and demonstrated significant correlations with each other. To reduce redundancy, only MBC was retained in MDS (Figure 3C). PDE as the highly weighted indicator in PC2 was retained in MDS. Finally, based on PCA results, literature study and the management goal, a total of eight soil indicators were chosen as the MDS, including three physical indicators (silt, clay, SWC), three chemical indicators (SOC, IN, TP) and two biological indicators (MBC, PDE).
The soil indicator values were normalized between 0 and 1 using a standard scoring function. The “more is better” function was used for all the indicators except for silt and sand. High sand content weakens soil's ability to retain nutrients while high silt content can increase susceptibility to topsoil erosion. Therefore “less is better” function was applied to silt and sand. Weights were assigned to the indicators and standardized to unity (Table 1). For the indicators in TDS, weights were assigned by the communality of each indicator. For the indicators in MDS, weights were assigned by the variation in each PC (Figure 4).
The SQI in TDS was calculated using the following formula (Equation 4):
The SQI in MDS was calculated using the following formula (Equation 5):
where Si is the score of the soil indicators and the coefficients are the weights.
3.4. Soil Quality Index
The SQI values ranged from 0.63 to 0.72 in the Acacia auriculiformis plantation and from 0.60 to 0.66 in the Eucalyptus urophylla plantation (Figure 5A). On average, the SQI was 6% higher in the Acacia auriculiformis plantation compared to the Eucalyptus urophylla plantation, except under the NP treatment (Figure 5B). However, statistical analysis indicated that this difference was not significant. Across different fertilization regimes, the SQI of all treatments were at similar levels, suggesting comparable soil quality under different treatments (Figure 5C). Nonetheless, the observed changes in specific soil indicators such as TP, PDE, IN, and SOC implied that fertilizer treatments may have influenced certain aspects of soil function and nutrient dynamics.
3.5. SQI Evaluation
Validation of the MDS is important [40], therefore a linear model was used to assess the relationship between MDS and TDS (Figure 6), revealing a strong correlation (R² = 0.81). This indicates the MDS effectively captured key soil quality attributes. Additionally, a linear regression analysis demonstrated a positive relationship between litter mass and SQI (R² = 0.37), suggesting that organic matter inputs positively influence soil quality (Figure 7).
4. Discussion
This study investigated a total of eighteen soil indicators which can generally represent soil nutrient pools, focusing on observing the response of plantation soil to different fertilization practices. Generally, fertilization had a significant impact on soil indicators. Soil biological, chemical and physical soil indicators interact in intricate ways, measuring the status of these indicators provides valuable insights into these complex interactions, a critical step towards achieving sustainable forest management practices.
4.1. Effects of Fertilization on Soil Indicators
The clear response of the soil TP and P-acquiring enzyme activities following long-term P treatment strongly suggests potential P limitation in these subtropical plantations. Meanwhile, P treatment resulted in a decrease of IN in both plantations, with a more significant reduction observed during the wet season. This decrease in IN could be due to several factors, including increased N demand by microbes and plants stimulated by P fertilization, as well as potential N losses through leaching processes in these plantations [64, 65]. It was worth noting that P treatment decreased SOC by an average of 28% in the Eucalyptus urophylla plantation. This aligns with the findings of Xia et al. [66] who found accelerated SOC mineralization after P input, likely due to enhanced microbial activity breaking down more complex SOC fractions.
Compared to P, N is less likely to be a limiting element in subtropical plantations due to N deposition, which might explain the weaker influence of N fertilizer on soil indicators. However, a noteworthy observation was a 35% decline in SOC in the Acacia auriculiformis plantation during the wet season while in the dry season, the SOC level stabilized. This decrease might be due to faster decomposition of surface litter during the wet season leading to a temporary decline in SOC, while deeper SOC layers remain relatively stable [30].
NP treatment can have complex effects on the soil nutrient pool in subtropical plantations. Due to the biological N fixation of leguminous plants, the background TN in the Acacia auriculiformis plantation was 1.2 g/kg higher than that of Eucalyptus urophylla plantation. NP treatment increased TN by an average of 9%, whereas N and P treatment decreased TN by an average of 18% and 27% respectively in the Eucalyptus urophylla plantation. NP treatment may have synergistic interactions and facilitate optimal N utilization by the non-leguminous plants, resulting in an overall increase in TN levels [67-69]. Application of N alone (N treatment) without proportional P availability, however, could lead to nutrient imbalances and N leaching contributing to the observed decrease in TN levels [70].
4.2. The Minimum Dataset of Two Plantations
Readily measurable and management-sensitive soil indicators are crucial for effective soil quality assessment. Existing frameworks like Soil Management Assessment Framework (SMAF) and Comprehensive Assessment of Soil Health (CASH), while valuable for farmlands, may not fully capture the complexities of forest ecosystems [58, 71]. Forest soils often have unique characteristics and challenges compared to farmlands, necessitating site-specific assessment methods. Focusing solely on soil physical and chemical properties can overlook the dynamic aspects of soil quality while relying solely on biological indicators might not capture long-term changes. Some studies assign weights based on specific soil functions, but the interconnected nature of soil indicators makes it challenging to definitively link each indicator to a single function [72]. To capture a comprehensive picture of soil quality and the interplay between these aspects, we assigned equal weight to all three types of indicators (physical, chemical and biological) in the soil quality assessment. The literature review (Table S5) showed that although some indicators like water storage, SOC and potential soil enzyme activity are frequently used in MDS, most selection processes consider site-specific properties such as soil texture, climatic conditions and management goals [73-75]. In this study, we chose three physical indicators (silt, clay, SWC), three chemical indicators (SOC, IN, TP) and two biological indicators (MBC, PDE) as the MDS, allowing us to evaluate the impact of fertilization practices on the soil quality in the plantations. These indicators were chosen because they represent key aspects of the overall nutrient pool and their responses to management practices allow us to track changes in soil quality over time.
SWC and soil physical structure play the important roles in nutrient delivery for biological activity and plant growth. Clay and silt content are key factors in the stabilization of soil organic matter through mechanisms including physical protection [63, 76-78]. Notably, these indicators exhibited negligible seasonal fluctuations, suggesting relative stability of soil physical properties under fertilization.
SOC, a primary source of energy and substrate for nutrient mineralization, exhibited surprisingly different responses to fertilization depending on the season and plantation. Fertilization significantly impacted SOC, with an average decrease of 32% observed in the Acacia auriculiformis plantation during the wet season. In the Eucalyptus urophylla plantation, both N and P treatments led to SOC reductions (16% and 33%, respectively), but these declines occurred during the dry season. These contrasting seasonal variations across plantations highlight the complexity of SOC dynamics. MBC, an important indicator of soil biological activity [79-81], showed no significant changes across fertilization treatments. TP was consistently higher under the P and NP treatments, indicating an increase in soil P pool, which may potentially alleviate P limitation for plants and microorganisms. Conversely, PDE activity was consistently higher under C and N treatments compared to P and NP treatments. This aligns with previous studies demonstrating that P fertilizer consistently suppresses P-acquiring enzyme activities, possibly by reducing the need for plants and microbes to produce these enzymes when sufficient inorganic P is readily available [82-84]. Although enzymes are known to be affected by factors other than nutrients, our study did not reveal strong effects of fertilization on soil pH. This suggests a potential response by plants and microbes to acquire relatively scarce P resources through the upregulated production of P-acquiring enzymes.
SQI, calculated based on the MDS, did not show any significant difference (p > 0.05), indicating that all the fertilization practices seem to maintain a relatively stable soil nutrient provision. However, analysis of individual soil indicators demonstrated that the nutrient pool has been changed. The observed stability of the SQI across fertilization treatments might be attributed to opposing trends in TP and PDE. While P and NP fertilization significantly increased TP (suggesting an alleviation of P limitation), control plots exhibited the highest levels of PDE activity (potentially indicating a microbial response to acquire scarce P). These contrasting changes in TP and PDE might have offset each other in the SQI calculation, masking the individual effects of these indicators on soil quality. As hypothesized, Acacia auriculiformis plantations generally exhibited higher SQI values compared to Eucalyptus urophylla plantations, although the ANOVA test indicated that the difference was not statistically significant (p > 0.05). This disparity can be attributed to the unique N-fixing capabilities of Acacia species. By establishing a symbiotic relationship with N-fixing bacteria, Acacia auriculiformis can enhance nutrient recycling [85-87]. The SQI in the two plantations became comparable under NP treatment, indicating that NP fertilization may have influenced biological N fixation processes in the Eucalyptus urophylla plantation. The external addition of N and P could diminish the natural advantage of Acacia auriculiformis in enhancing soil quality through N fixation, leading to similar SQI levels between the two plantations [69].
4.3. P Limitation and Soil Quality in Subtropical Plantations
Human activities are causing a continuous increase in N availability within ecosystems, mainly through various anthropogenic inputs. However, this rise is not matched by a corresponding increase in P inputs. This growing imbalance suggests a potential exacerbation of the existing nutrient limitation, potentially impacting ecosystem functioning and services [88-92]. Previous studies have confirmed the pervasive P limitation in subtropical areas [84, 93, 94]. Therefore, nutrient imbalance or limitation, particularly P deficiency, is an important aspect to consider in restoration efforts. Fertilization, as an intensive forest management strategy, is often applied to plantation forests established for productive purposes or ecosystem restoration. Plantation ecosystems rely heavily on their understory vegetation for structural integrity and ecological function.
This understory layer, particularly the dominant herb layer species such as Dicranopteris dichotoma (Thunb.) Bernh., Ottochloa nodosa var. micrantha (Balansa) Keng f. and Blechnopsis orientalis, exhibited sensitivity to fertilization practices (Figure S2). The observed responses in biomass across these representative species highlight the need for careful management of fertilization regimes. This balanced approach is crucial to maximize the potential benefits of fertilization while minimizing any potential negative consequences, such as disruptions to essential ecosystem functions, especially under conditions of P limitation. While our study found no significant changes in SQI with long-term fertilization, analysis of individual indicators, such as TP and PDE which significantly changed in fertilized plots, suggests potential alterations in nutrient cycling processes that warrant further investigation. Therefore, appropriately balanced fertilization regimes and long-term monitoring of soil quality, including analysis of individual indicators alongside SQI, are crucial for sustainable forest restoration.
5. Conclusions
To conclude, SQI can facilitate comparisons between different treatments and sites, offering valuable insight into soil quality and management practices. In this study, the SQI did not reveal significant differences among treatments. However, the indicators in the MDS provided a clear and comprehensive vision of the overall soil nutrient pool. These findings highlight the importance of analyzing individual soil indicators alongside SQI to gain a more comprehensive understanding of soil quality. SQI, while a valuable tool, may not always capture the complexities of nutrient cycling processes due to potential masking effects from opposing trends in MDS indicators. Future research will connect these findings to practical applications for sustainable forest management. This study utilized relatively small experimental plots, which may not fully capture the spatial variability of soil properties. Including results from a larger number of plots in future studies with diverse fertilization regimes would strengthen the generalizability of the findings to other similar plantations. However, despite these limitations, this study provides a valuable framework for assessing soil quality changes under long-term fertilization practices in subtropical plantations.
Supplementary Materials
Author Contributions
Jiani Peng: Conceptualization, Formal analysis, Investigation, Methodology, Writing - original draft, Writing – review & editing, Visualization. Qinggong Mao: Investigation, Writing - Review & Editing, Funding acquisition. Sichen Mao: Investigation. Senhao Wang: Investigation, Funding acquisition. Baixin Zhang: Investigation. Mianhai Zheng: Writing – review & editing. Juan Huang: Writing – review & editing. Jiangming Mo: Resources. Xiangping Tan: Writing – review & editing, Funding acquisition. Wei Zhang: Resources, Supervision, Writing - Review & Editing, Funding acquisition.
Acknowledgments
This work was supported by National Natural Science Foundation of China (32401387, 32271725 and 32171596), and Basic Research Project of South China Botanical Garden, Chinese Academy of Sciences (JCYJXM-202511).
Conflicts of Interest
The authors declare that they have no known competing financial interests or personal relationships that could have appeared to influence the work reported in this paper.
References
- FAO. 2020. Global Forest Resources Assessment 2020: Main report. Rome. https://www.fao.org/3/ca8283en/CA8283EN.pdf.
- Foley, J.A.; DeFries, R.; Asner, G.P.; Barford, C.; Bonan, G.; Carpenter, S.R.; Chapin, F.S.; Coe, M.T.; Daily, G.C.; Gibbs, H.K.; et al. Global consequences of land use. Science 2005, 309, 570–574. [Google Scholar] [CrossRef] [PubMed]
- Gibson, L.; Lee, T.M.; Koh, L.P.; Brook, B.W.; Gardner, T.A.; Barlow, J.; Peres, C.A.; Bradshaw, C.J.; Laurance, W.F.; Lovejoy, T.E.; et al. Primary forests are irreplaceable for sustaining tropical biodiversity. Nature 2011, 478, 378–381. [Google Scholar] [CrossRef]
- Haddad, N.M.; Brudvig, L.A.; Clobert, J.; Davies, K.F.; Gonzalez, A.; Holt, R.D.; Lovejoy, T.E.; Sexton, J.O.; Austin, M.P.; Collins, C.D.; et al. Habitat fragmentation and its lasting impact on Earth’s ecosystems. Sci. Adv. 2015, 1, e1500052. [Google Scholar] [CrossRef] [PubMed]
- McDowell, N.G.; Allen, C.D.; Anderson-Teixeira, K.; Aukema, B.H.; Bond-Lamberty, B.; Chini, L.; Clark, J.S.; Dietze, M.; Grossiord, C.; Hanbury-Brown, A.; et al. Pervasive shifts in forest dynamics in a changing world. Science 2020, 368, eaaz9463. [Google Scholar] [CrossRef]
- Castro-Díez, P.; Vaz, A.S.; Silva, J.S.; van Loo, M.; Alonso, Á.; Aponte, C.; Bayón, Á.; Bellingham, P.J.; Chiuffo, M.C.; DiManno, N.; et al. Global effects of non-native tree species on multiple ecosystem services. Biol. Rev. 2019, 94, 1477–1501. [Google Scholar] [CrossRef]
- Hua, F.; Bruijnzeel, L.A.; Meli, P.; Martin, P.A.; Zhang, J.; Nakagawa, S.; Miao, X.; Wang, W.; McEvoy, C.; Peña-Arancibia, J.L.; et al. The biodiversity and ecosystem service contributions and trade-offs of forest restoration approaches. Science 2022, 376, 839–844. [Google Scholar] [CrossRef]
- Ren, H.; Shen, W. J.; Lu, H.F.; Wen, X.Y.; Jian, S.G. Degraded ecosystems in China: status, causes, and restoration efforts. Landscape Ecol. Eng. 2007, 3, 1–13. [Google Scholar] [CrossRef]
- Cleveland, C.C.; Townsend, A.R.; Schmidt, S.K. Phosphorus limitation of microbial processes in moist tropical forests: Evidence from short-term laboratory incubations and field studies. Ecosystems 2002, 5, 0680–0691. [Google Scholar] [CrossRef]
- Chen, Y.; Sayer, E.J.; Li, Z.; Mo, Q.; Li, Y.; Ding, Y.; Wang, J.; Lu, X.; Tang, J.; Wang, F. Nutrient limitation of woody debris decomposition in a tropical forest: contrasting effects of N and P addition. Funct. Ecol. 2016, 30, 295–304. [Google Scholar] [CrossRef]
- Camenzind, T.; Hättenschwiler, S.; Treseder, K.K.; Lehmann, A.; Rillig, M.C. Nutrient limitation of soil microbial processes in tropical forests. Ecol. Monogr. 2018, 88, 4–21. [Google Scholar] [CrossRef]
- Vitousek, P.M. Litterfall, Nutrient cycling, and nutrient limitation in tropical forests. Ecology 1984, 65, 285–298. [Google Scholar] [CrossRef]
- Reich, P.B.; Oleksyn, J. Global patterns of plant leaf N and P in relation to temperature and latitude. Proc. Nat. Acad. Sci. 2004, 101, 11001–11006. [Google Scholar] [CrossRef]
- Reed, S.C.; Townsend, A.R.; Davidson, E.A.; Cleveland, C.C. Stoichiometric patterns in foliar nutrient resorption across multiple scales. New Phytol. 2012, 196, 173–180. [Google Scholar] [CrossRef] [PubMed]
- Elser, J.J.; Bracken, M.E.; Cleland, E.E.; Gruner, D.S.; Harpole, W.S.; Hillebrand, H.; Ngai, J.T.; Seabloom, E.W.; Shurin, J.B.; Smith, J.E. Global analysis of nitrogen and phosphorus limitation of primary producers in freshwater, marine and terrestrial ecosystems. Ecol. Lett. 2007, 10, 1135–1142. [Google Scholar] [CrossRef] [PubMed]
- Harpole, W.S.; Ngai, J.T.; Cleland, E.E.; Seabloom, E.W.; Borer, E.T.; Bracken, M.E.; Elser, J.J.; Gruner, D.S.; Hillebrand, H.; Shurin, J.B.; et al. Nutrient co-limitation of primary producer communities. Ecol. Lett. 2011, 14, 852–862. [Google Scholar] [CrossRef]
- Alvarez-Clare, S.; Mack, M.C.; Brooks, M. A direct test of nitrogen and phosphorus limitation to net primary productivity in a lowland tropical wet forest. Ecology 2013, 94, 1540–1551. [Google Scholar] [CrossRef]
- Zhu, J.; Wang, Q.; He, N.; Smith, M.D.; Elser, J.J.; Du, J.; Yuan, G.; Yu, G.; Yu, Q. Imbalanced atmospheric nitrogen and phosphorus depositions in China: Implications for nutrient limitation. Journal of Geophysical Research. Biogeosciences 2016, 121, 1605–1616. [Google Scholar] [CrossRef]
- Yu, G.; Jia, Y.; He, N.; Zhu, J.; Chen, Z.; Wang, Q.; Piao, S.; Liu, X.; He, H.; Guo, X.; et al. Stabilization of atmospheric nitrogen deposition in China over the past decade. Nat. Geosci. 2019, 12, 424–429. [Google Scholar] [CrossRef]
- Cleveland, C.C.; Liptzin, D. C:N:P stoichiometry in soil: is there a “Redfield ratio” for the microbial biomass? Biogeochemistry 2007, 85, 235–252. [Google Scholar] [CrossRef]
- LeBauer, D.S.; Treseder, K.K. Nitrogen limitation of net primary productivity in terrestrial ecosystems is globally distributed. Ecology 2008, 89, 371–379. [Google Scholar] [CrossRef]
- Mao, Q.; Lu, X.; Mo, H.; Gundersen, P.; Mo, J. Effects of simulated N deposition on foliar nutrient status, N metabolism and photosynthetic capacity of three dominant understory plant species in a mature tropical forest. Sci. Total Environ. 2018, 610, 555–562. [Google Scholar] [CrossRef] [PubMed]
- Ren, H.; Fan, Y.; Zou, Z.; Hui, D.; Guo, Q.; Huang, Y. Long-term structural and functional changes in Acacia mangium plantations in subtropical China. Landscape Ecol. Eng. 2021, 17, 11–19. [Google Scholar] [CrossRef]
- Berg, B.; Matzner, E. Effect of N deposition on decomposition of plant litter and soil organic matter in forest systems. Environ. Rev. 1997, 5, 1–25. [Google Scholar] [CrossRef]
- Fox, T.R. Sustained productivity in intensively managed forest plantations. For. Ecol. Manage. 2000, 138, 187–202. [Google Scholar] [CrossRef]
- Johnson, D.W.; Curtis, P.S. Effects of forest management on soil C and N storage: meta-analysis. For. Ecol. Manage. 2001, 140, 227–238. [Google Scholar] [CrossRef]
- Ameray, A.; Bergeron, Y.; Valeria, O.; Montoro Girona, M.; Cavard, X. Forest carbon management: A review of silvicultural practices and management strategies scross soreal, temperate and tropical Forests. Curr. For. Rep. 2021, 7, 245–266. [Google Scholar] [CrossRef]
- Lu, X.; Vitousek, P.M.; Mao, Q.; Gilliam, F.S.; Luo, Y.; Turner, B.L.; Zhou, G.; Mo, J. Nitrogen deposition accelerates soil carbon sequestration in tropical forests. Proc. Nat. Acad. Sci. 2021, 118, e2020790118. [Google Scholar] [CrossRef]
- Li, J.; Liu, Z.F.; Jin, M.K.; Zhang, W.; Lambers, H.; Hui, D.; Liang, C.; Zhang, J.; Wu, D.; Sardans, J.; et al. Microbial controls over soil priming effects under chronic nitrogen and phosphorus additions in subtropical forests. ISME J. 2023, 17, 2160–2168. [Google Scholar] [CrossRef]
- Fan, L.; Xue, Y.; Wu, D.; Xu, M.; Li, A.; Zhang, B.; Mo, J.; Zheng, M. Long-term nitrogen and phosphorus addition have stronger negative effects on microbial residual carbon in subsoils than topsoils in subtropical forests. Global Change Biol. 2024, 30, e17210. [Google Scholar] [CrossRef]
- Doran, J.W.; Parkin, T.B. Defining and assessing soil quality, in: Defining soil quality for a sustainable environment. Def. Soil Qual. Sustain. Environ. 1994, 35, 1–21. [Google Scholar]
- Andrews, S.S.; Karlen, D.L.; Mitchell, J.P. A comparison of soil quality indexing methods for vegetable production systems in Northern California. Agr. Ecosyst. Environ. 2002, 90, 25–45. [Google Scholar] [CrossRef]
- Karlen, D.L.; Ditzler, C.A.; Andrews, S.S. Soil quality: why and how? Geoderma 2003, 114, 145–156. [Google Scholar] [CrossRef]
- Karlen, D.L.; Andrews, S.S.; Wienhold, B.J.; Zobeck, T.M. Soil Quality Assessment: Past, Present and Future. USDA-ARS / UNL Faculty, USA 2008; 1203.
- Bünemann, E.K.; Bongiorno, G.; Bai, Z.; Creamer, R.E.; De Deyn, G.; De Goede, R.; Fleskens, L.; Geissen, V.; Kuyper, T.W.; Mäder, P.; et al. Soil quality – A critical review. Soil. Boil. Biochem. 2018, 120, 105–125. [Google Scholar] [CrossRef]
- Bai, Z.; Caspari, T.; Gonzalez, M.R.; Batjes, N.H.; Mader, P.; Bunemann, E.K.; de Goede, R.; Brussaard, L.; Xu, M.; Santos Ferreira, C.S.; et al. Effects of agricultural management practices on soil quality: A review of long-term experiments for Europe and China. Agr. Ecosyst. Environ. 2018, 265, 1–7. [Google Scholar] [CrossRef]
- Lehmann, J.; Bossio, D.A.; Kögel-Knabner, I.; Rillig, M.C. The concept and future prospects of soil health. Nat. Rev. Earth. Environ. 2020, 1, 544–553. [Google Scholar] [CrossRef]
- Gozukara, G.; Acar, M.; Ozlu, E.; Dengiz, O.; Hartemink, A.E.; Zhang, Y. A soil quality index using Vis-NIR and pXRF spectra of a soil profile. Catena 2022, 211, 105954. [Google Scholar] [CrossRef]
- Bayrakli, B.; Dengiz, O.; Kars, N. Soil quality assessment based on MCDA–GIS hybrid approach for sustainable hazelnut farming under humid ecosystem environment. Rend. Lincei-Sci. Fis. 2023, 34, 921–940. [Google Scholar] [CrossRef]
- Andrews, S.S.; Carroll, C.R. Designing a soil quality assessment tool for sustainable agroecosystem management. Ecol. Appl. 2001, 11, 1573–1585. [Google Scholar] [CrossRef]
- Bone, J.; Barraclough, D.; Eggleton, P.; Head, M.; Jones, D.T.; Voulvoulis, N. Prioritising soil quality assessment through the screening of sites: The use of publicly collected data. Land. Degrad. Dev. 2014, 25, 251–266. [Google Scholar] [CrossRef]
- Raiesi, F. A minimum data set and soil quality index to quantify the effect of land use conversion on soil quality and degradation in native rangelands of upland arid and semiarid regions. Ecol. Indic. 2017, 75, 307–320. [Google Scholar] [CrossRef]
- Yu, P.; Liu, S.; Zhang, L.; Li, Q.; Zhou, D. Selecting the minimum data set and quantitative soil quality indexing of alkaline soils under different land uses in northeastern China. Sci. Total Environ. 2018, 616, 564–571. [Google Scholar] [CrossRef] [PubMed]
- Huang, Z.; Selvalakshmi, S.; Vasu, D.; Liu, Q.; Cheng, H.; Guo, F.; Ma, X. Identification of indicators for evaluating and monitoring the effects of Chinese fir monoculture plantations on soil quality. Ecol. Indic. 2018, 93, 547–554. [Google Scholar]
- Shao, G.; Ai, J.; Sun, Q.; Hou, L.; Dong, Y. Soil quality assessment under different forest types in the Mount Tai, central Eastern China. Ecol. Indic. 2020, 115, 106439. [Google Scholar] [CrossRef]
- He, Y.; Han, X.; Wang, X.; Wang, L.; Liang, T. Long-term ecological effects of two artificial forests on soil properties and quality in the eastern Qinghai-Tibet Plateau. Sci. Total. Environ. 2021, 796, 148986. [Google Scholar] [CrossRef] [PubMed]
- Yang, K.; Diao, M.; Zhu, J.; Lu, D.; Zhang, W. A global meta-analysis of indicators for assessing forest soil quality through comparison between paired plantations versus natural forests. Land Degrad. Dev. 2022, 33, 3603–3616. [Google Scholar] [CrossRef]
- Franche, C.; Lindström, K.; Elmerich, C. Nitrogen-fixing bacteria associated with leguminous and non-leguminous plants. Plant Soil 2009, 321, 35–59. [Google Scholar] [CrossRef]
- Sitters, J.; Edwards, P.J.; Olde Venterink, H. Increases of Soil C, N, and P Pools Along an Acacia Tree Density Gradient and Their Effects on Trees and Grasses. Ecosystems 2013, 16, 347–357. [Google Scholar] [CrossRef]
- Yu, Q.; Hanif, A.; Rao, X.; He, J.; Sun, D.; Liu, S.; He, D.; Shen, W. Long-term restoration altered edaphic properties and soil microbial communities in forests: evidence from four plantations of southern China. Restor. Ecol. 2021, 29, e13354. [Google Scholar] [CrossRef]
- Zhang, W.; Zhu, X.; Luo, Y.; Rafique, R.; Chen, H.; Huang, J.; Mo, J. Responses of nitrous oxide emissions to nitrogen and phosphorus additions in two tropical plantations with N-fixing vs. non-N-fixing tree species. Biogeosciences 2014, 11, 4941–4951. [Google Scholar] [CrossRef]
- FAO. 2019. Standard operating procedure for handling and preparation of soil samples for chemical and physical analyses.
- Eshel, G.; Levy, G.J.; Mingelgrin, U.; Singer, M.J. Critical evaluation of the use of laser diffraction for particle-size distribution analysis. Soil Sci. Soc. Am. J. 2004, 68, 736–743. [Google Scholar]
- Huang, J.; Zhang, W.; Li, Y.; Wang, S.; Mao, J.; Mo, J.; Zheng, M. Long-term nitrogen deposition does not exacerbate soil acidification in tropical broadleaf plantations. Environ. Res. Lett. 2021, 16, 114042. [Google Scholar] [CrossRef]
- Brookes, P.C.; Landman, A.; Pruden, G.; Jenkinson, D.S. Chloroform fumigation and the release of soil nitrogen: A rapid direct extraction method to measure microbial biomass nitrogen in soil. Soil. Boil. Biochem. 1985, 17, 837–842. [Google Scholar] [CrossRef]
- Vance, E.D.; Brookes, P.C.; Jenkinson, D.S. An extraction method for measuring soil microbial biomass C. Soil. Boil. Biochem. 1987, 19, 703–707. [Google Scholar] [CrossRef]
- Bell, C.W.; Fricks, B.E.; Rocca, J.D.; Steinweg, J.M.; McMahon, S.K.; Wallenstein, M.D. High-throughput fluorometric measurement of potential soil extracellular enzyme activities. Jove-j. Vis. Exp. 2013, 81, 50961. [Google Scholar]
- Andrews, S.S.; Karlen, D.L.; Cambardella, C.A. The soil management assessment framework. Soil Sci. Soc. Am. J. 2004, 68, 1945–1962. [Google Scholar] [CrossRef]
- Wander, M.M.; Bollero, G.A. Soil quality assessment of tillage impacts in Illinois. Soil Sci. Soc. Am. J. 1999, 63, 961–971. [Google Scholar] [CrossRef]
- Yu, P.; Han, D.; Liu, S.; Wen, X.; Huang, Y.; Jia, H. Soil quality assessment under different land uses in an alpine grassland. Catena 2018, 171, 280–287. [Google Scholar] [CrossRef]
- Askari, M.S.; Holden, N.M. Indices for quantitative evaluation of soil quality under grassland management. Geoderma 2014, 230, 131–142. [Google Scholar] [CrossRef]
- Lê, S.; Josse, J.; Husson, F. FactoMineR: An R Package for Multivariate Analysis. J. Stat. Softw. 2008, 25, 1–18. [Google Scholar] [CrossRef]
- Hassink, J. The capacity of soils to preserve organic C and N by their association with clay and silt particles. Plant Soil 1997, 191, 77–87. [Google Scholar] [CrossRef]
- Chen, H.; Gurmesa, G.A.; Zhang, W.; Zhu, X.; Zheng, M.; Mao, Q.; Zhang, T.; Mo, J. Nitrogen saturation in humid tropical forests after 6 years of nitrogen and phosphorus addition: hypothesis testing. Funct. Ecol. 2016, 30, 305–313. [Google Scholar] [CrossRef]
- Wang, R.; Bicharanloo, B.; Hou, E.; Jiang, Y.; Dijkstra, F.A. Phosphorus supply increases nitrogen transformation rates and retention in soil: A global meta-analysis. Earths Future 2022, 10, e2021EF002479. [Google Scholar] [CrossRef]
- Xia, Y.; Peñuelas, J.; Sardans, J.; Zhong, X.; Xu, L.; Yang, Z.; Yang, Y.; Yang, L.; Yue, K.; Fan, Y. Phosphorus addition accelerates soil organic carbon mineralization by desorbing organic carbon and increasing microbial activity in subtropical forest soils. Appl. Soil Ecol. 2024, 193, 105166. [Google Scholar] [CrossRef]
- Reed, S.C.; Townsend, A.R.; Cleveland, C.C.; Nemergut, D.R. Microbial community shifts influence patterns in tropical forest nitrogen fixation. Oecologia 2010, 164, 521–531. [Google Scholar] [CrossRef] [PubMed]
- Matson, A.L.; Corre, M.D.; Burneo, J.I.; Veldkamp, E. Free-living nitrogen fixation responds to elevated nutrient inputs in tropical montane forest floor and canopy soils of southern Ecuador. Biogeochemistry 2015, 122, 281–294. [Google Scholar] [CrossRef]
- Zheng, M.; Li, D.; Lu, X.; Zhu, X.; Zhang, W.; Huang, J.; Fu, S.; Lu, X; Mo, J. Effects of phosphorus addition with and without nitrogen addition on biological nitrogen fixation in tropical legume and non-legume tree plantations. Biogeochemistry 2016, 131, 65–76. [Google Scholar] [CrossRef]
- Gundersen, P.; Callesen, I.; de Vries, W. 1998. Nitrate leaching in forest ecosystems is related to forest floor CN ratios. Environ. Pollut. 1998, 102, 403–407. [Google Scholar] [CrossRef]
- Fine, A.K.; Van Es, H.M.; Schindelbeck, R.R. Statistics, scoring Functions, and regional analysis of a comprehensive soil health database. Soil Sci. Soc. Am. J. 2017, 81, 589–601. [Google Scholar] [CrossRef]
- Lima, A.C.R.; Brussaard, L.; Totola, M.R.; Hoogmoed, W.B.; de Goede, R.G. A functional evaluation of three indicator sets for assessing soil quality. Appl. Soil Ecol. 2013, 64, 194–200. [Google Scholar] [CrossRef]
- Levi, M.R.; Shaw, J. N.; Wood, C. W.; Hermann, S. M.; Carter, E. A.; Feng, Y. Land Management Effects on Near-Surface Soil Properties of Southeastern U.S. Coastal Plain Kandiudults. Soil Sci. Soc. Am. J. 2010, 74, 258–271. [Google Scholar] [CrossRef]
- Kiani, M.; Hernandez-Ramirez, G.; Quideau, S. , Smith, E.; Janzen, H.; Larney, F.J.; Puurveen, D. Quantifying sensitive soil quality indicators across contrasting long-term land management systems: Crop rotations and nutrient regimes. Agr. Ecosyst. Envirom. 2017, 248, 123–135. [Google Scholar] [CrossRef]
- Liu, T.; Wu, X.; Li, H.; Ning, C.; Li, Y.; Zhang, X.; He, J.; Filimonenko, E.; Chen, S.; Chen, X.; et al. Soil quality and r – K fungal communities in plantations after conversion from subtropical forest. Catena 2022, 219, 106584. [Google Scholar] [CrossRef]
- Six, J.; Conant, R.T.; Paul, E.A.; Paustian, K. Stabilization mechanisms of soil organic matter: Implications for C-saturation of soils. Plant Soil 2002, 24, 155–176. [Google Scholar] [CrossRef]
- Lützow, M.V.; Kögel-Knabner, I.; Ekschmitt, K.; Matzner, E.; Guggenberger, G.; Marschner, B.; Flessa, H. Stabilization of organic matter in temperate soils: mechanisms and their relevance under different soil conditions – a review. Eur. J. Soil Sci. 2016, 57, 426–445. [Google Scholar] [CrossRef]
- Stockmann, U.; Adams, M.A.; Crawford, J.W.; Field, D.J.; Henakaarchchi, N.; Jenkins, M.; Minasny, B.; McBratney, A.B.; Courcelles, V.R.; Singh, K.; et al. The knowns, known unknowns and unknowns of sequestration of soil organic carbon. Agr. Ecosyst. Environ. 2013, 164, 80–99. [Google Scholar] [CrossRef]
- Hargreaves, P.R.; Brookes, P.C.; Ross, G.J.S.; Poulton, P.R. Evaluating soil microbial biomass carbon as an indicator of long-term environmental change. Soil. Boil. Biochem. 2003, 35, 401–407. [Google Scholar] [CrossRef]
- Lepcha, N.T.; Devi, N.B. Effect of land use, season, and soil depth on soil microbial biomass carbon of Eastern Himalayas. Ecol. Process 2020, 9, 65. [Google Scholar] [CrossRef]
- Patoine, G.; Eisenhauer, N.; Cesarz, S.; Phillips, H.R.; Xu, X.; Zhang, L.; Guerra, C.A. Drivers and trends of global soil microbial carbon over two decades. Nat. Commun. 2022, 13, 4195. [Google Scholar] [CrossRef]
- Allison, S.D.; Vitousek, P.M. Responses of extracellular enzymes to simple and complex nutrient inputs. Soil. Boil. Biochem. 2005, 37, 937–944. [Google Scholar] [CrossRef]
- Sullivan, B.W.; Alvarez-Clare, S.; Castle, S.C.; Porder, S.; Reed, S.C.; Schreeg, L.; Townsend, A.R.; Cleveland, C.C. Assessing nutrient limitation in complex forested ecosystems: alternatives to large-scale fertilization experiments. Ecology 2014, 95, 668–681. [Google Scholar] [CrossRef]
- Yokoyama, D.; Imai, N.; Kitayama, K. Effects of nitrogen and phosphorus fertilization on the activities of four different classes of fine-root and soil phosphatases in Bornean tropical rain forests. Plant Soil 2017, 416, 463–476. [Google Scholar] [CrossRef]
- Marchante, E.; Kjøller, A.; Struwe, S.; Freitas, H. Short- and long-term impacts of Acacia longifolia invasion on the belowground processes of a Mediterranean coastal dune ecosystem. Appl. Soil Ecol. 2008, 40, 210–217. [Google Scholar] [CrossRef]
- Jensen, E.S.; Peoples, M.B.; Boddey, R.M.; Gresshoff, P.M.; Hauggaard-Nielsen, H.; J. R. Alves, B.; Morrison, M.J. Legumes for mitigation of climate change and the provision of feedstock for biofuels and biorefineries. A review. Agron. Sustain. Dev. 2012, 32, 329–364. [Google Scholar] [CrossRef]
- Zhang, Y.; Hou, L.; Li, Z.; Zhao, D.; Song, L.; Shao, G.; Ai, J.; Sun, Q. Leguminous supplementation increases the resilience of soil microbial community and nutrients in Chinese fir plantations. Sci. Total Environ. 2020, 703, 134917. [Google Scholar] [CrossRef]
- Peñuelas, J.; Poulter, B.; Sardans, J.; Ciais, P.; van der Velde, M.; Bopp, L.; Boucher, O.; Godderis, Y.; Hinsinger, P.; Llusia, J.; et al. Human-induced nitrogen–phosphorus imbalances alter natural and managed ecosystems across the globe. Nat. Commun. 2013, 4, 2934. [Google Scholar] [CrossRef]
- Fernández-Martínez, M.; Vicca, S.; Janssens, I.A.; Sardans, J.; Luyssaert, S.; Campioli, M.; Chapin III, F.S.; Ciais, P.; Malhi, Y.; Obersteiner, M.; et al. Nutrient availability as the key regulator of global forest carbon balance. Nat. Clim. Change. 2014, 4, 471–476. [Google Scholar] [CrossRef]
- Wieder, W.R.; Cleveland, C.C.; Smith, W.K.; Todd-Brown, K. Future productivity and carbon storage limited by terrestrial nutrient availability. Nat. Geosci. 2015, 8, 441–444. [Google Scholar] [CrossRef]
- Leff, J.W.; Jones, S.E.; Prober, S.M.; Barberán, A.; Borer, E.T.; Firn, J.L.; Harpole, W.S.; Hobbie, S.E.; Hofmockel, K.S.; Knops, J.M.H.; et al. Consistent responses of soil microbial communities to elevated nutrient inputs in grasslands across the globe. Proc. Nat. Acad. Sci. 2015, 112, 10967–10972. [Google Scholar] [CrossRef]
- Li, Y.; Niu, S.; Yu, G. Aggravated phosphorus limitation on biomass production under increasing nitrogen loading: a meta-analysis. Global Change Biol. 2016, 22, 934–943. [Google Scholar] [CrossRef]
- Du, E.; Terrer, C.; Pellegrini, A.F.; Ahlström, A.; van Lissa, C.J.; Zhao, X.; Xia, N.; Wu, X.; Jackson, R.B. Global patterns of terrestrial nitrogen and phosphorus limitation. Nat. Geosci. 2020, 13, 221–226. [Google Scholar] [CrossRef]
- Hou, E.; Luo, Y.; Kuang, Y.; Chen, C.; Lu, X.; Jiang, L.; Luo, X.; Wen, D. Global meta-analysis shows pervasive phosphorus limitation of aboveground plant production in natural terrestrial ecosystems. Nat. Commun. 2020, 11, 637. [Google Scholar] [CrossRef] [PubMed]
Figure 1.
Study area and plantation sites. (A) Location of the study area in relation to Guangzhou, China. (B) Land cover map of Heshan City. (C) Aerial view of the research station. (D) Typical appearance of the Acacia auriculiformis plantation. (E) Typical appearance of the Eucalyptus urophylla plantation.
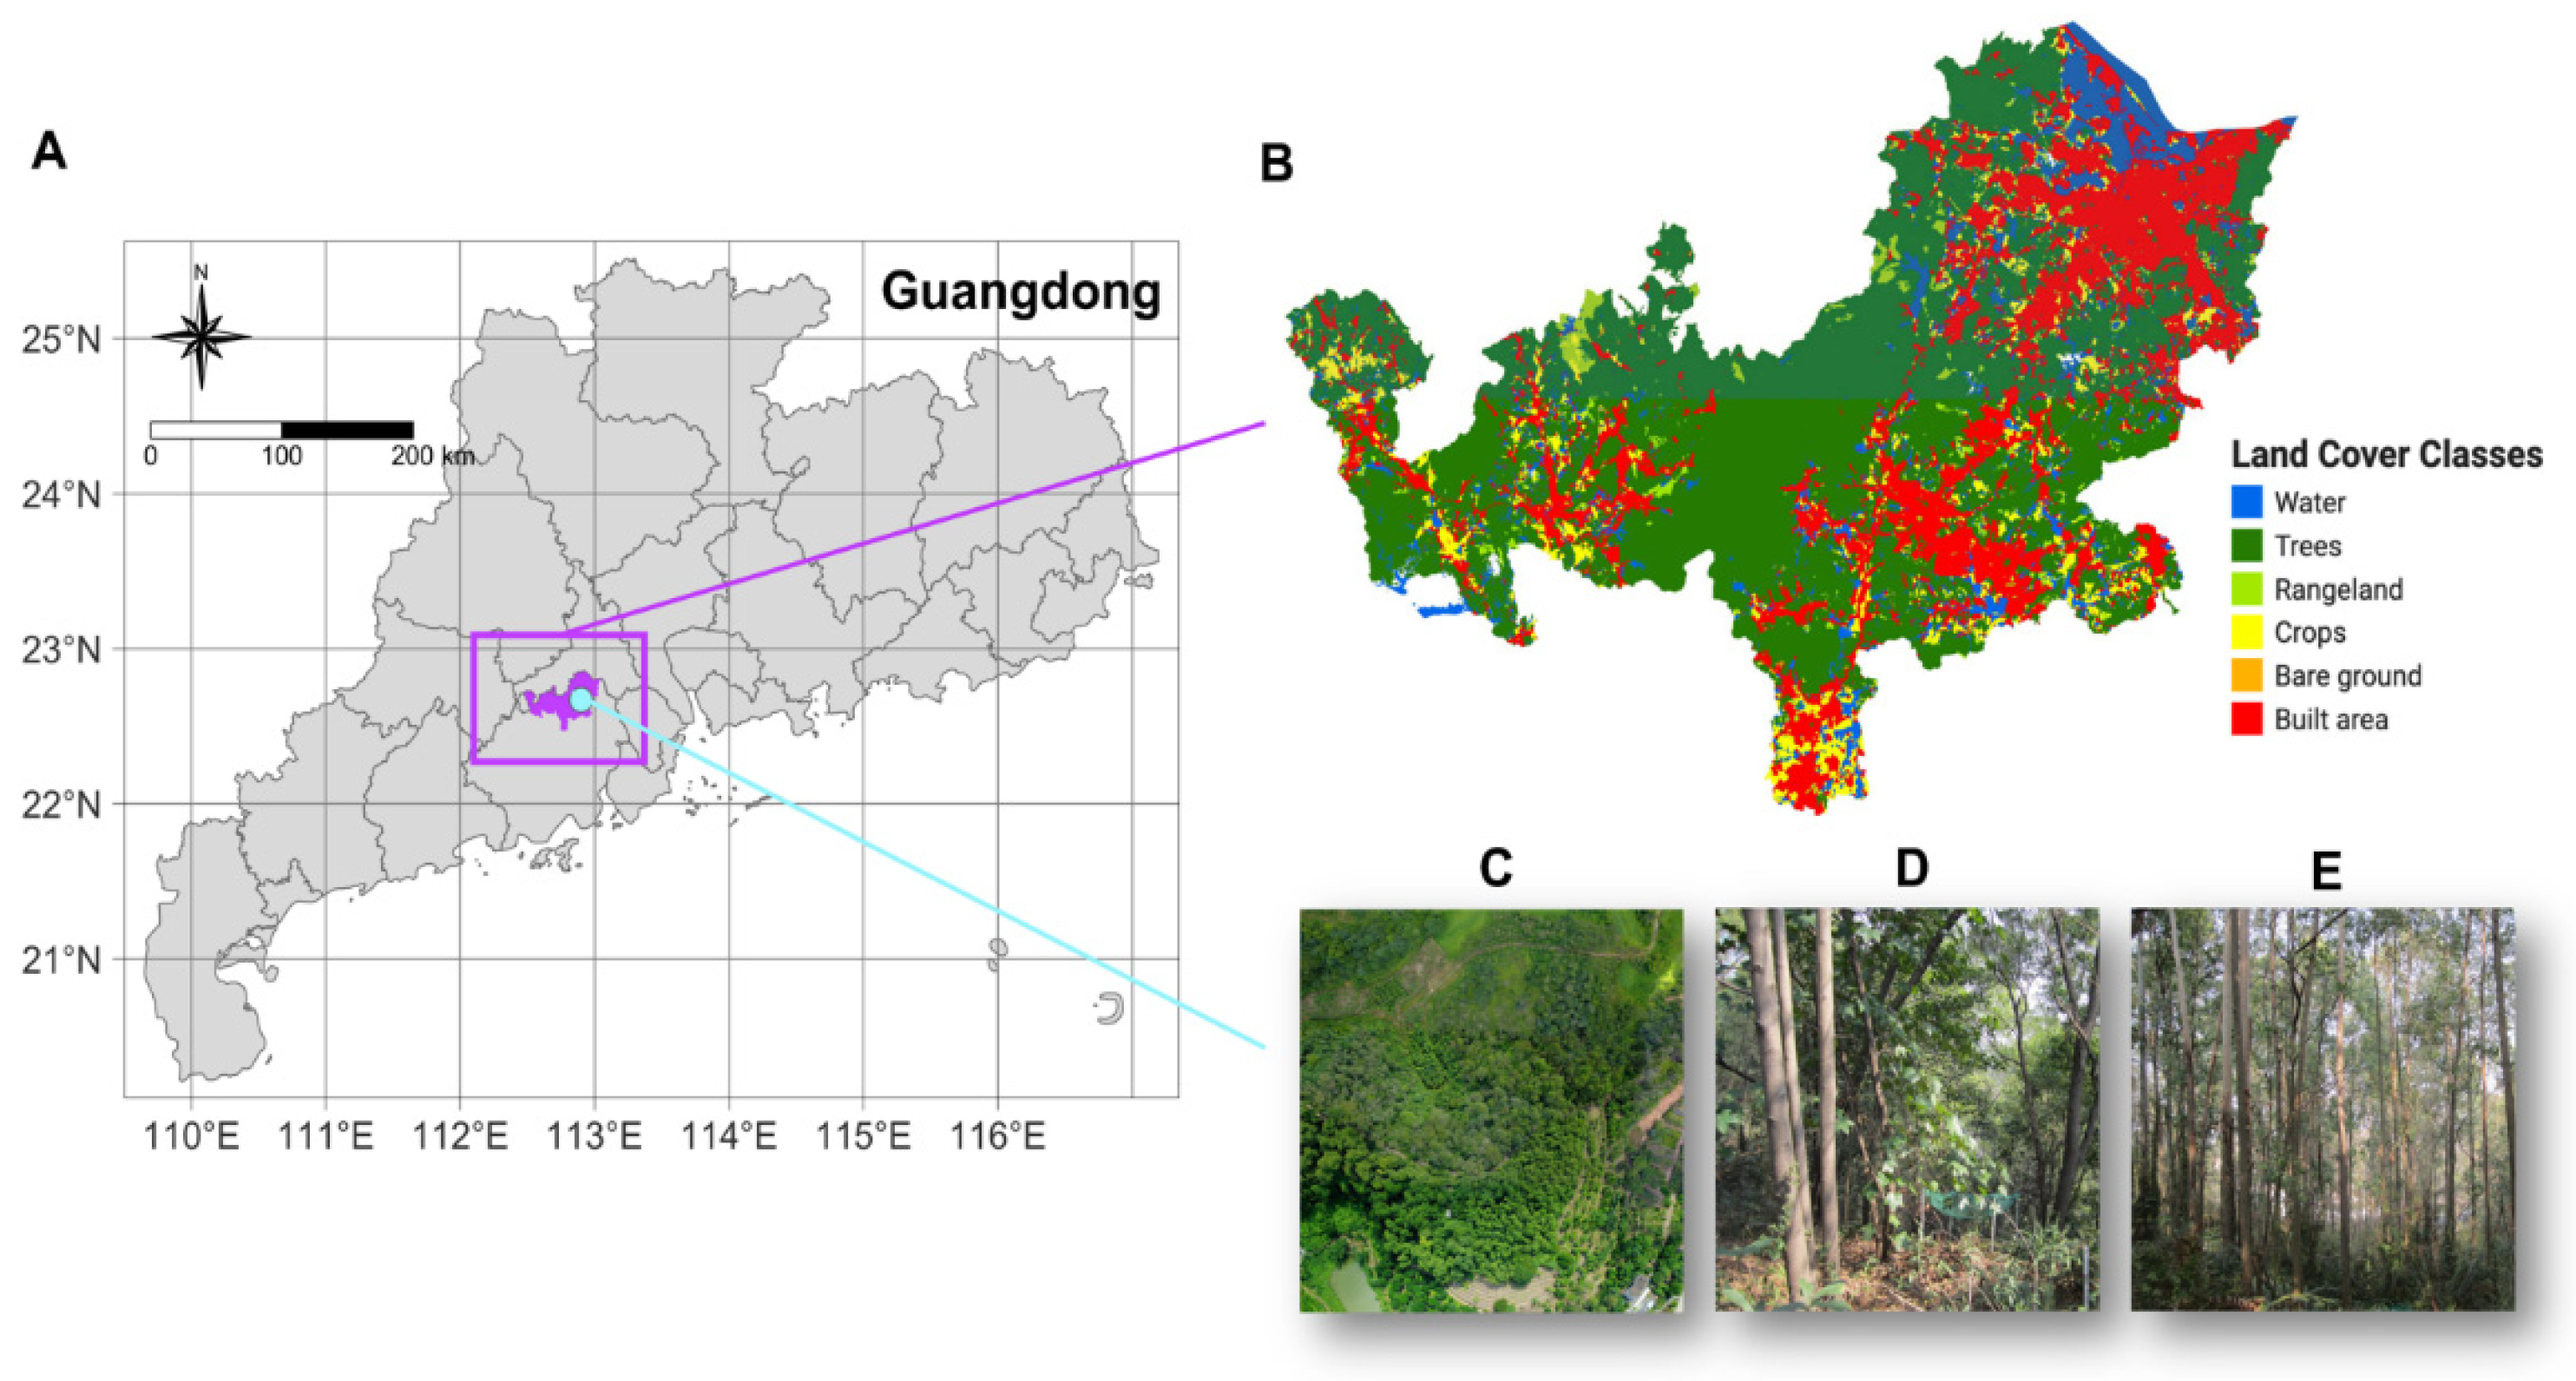
Figure 2.
Correlation of soil physical (A), chemical (B), and biological (C) indicators (SWC, soil water content; SOC, soil organic carbon; TN, total N; IN, inorganic N; TP, total P; CEC, cation exchange capacity; MBC, microbial biomass C; MBN, microbial biomass N; BG, β-glucosidase; XYL, xylanase; CBH, β-D-cellobiohydrolase; NAG, β-N-acetylglucosaminidase; PDE, phosphodiesterase; PME, phosphomonoesterase). ×, insignificant correlation coefficients.
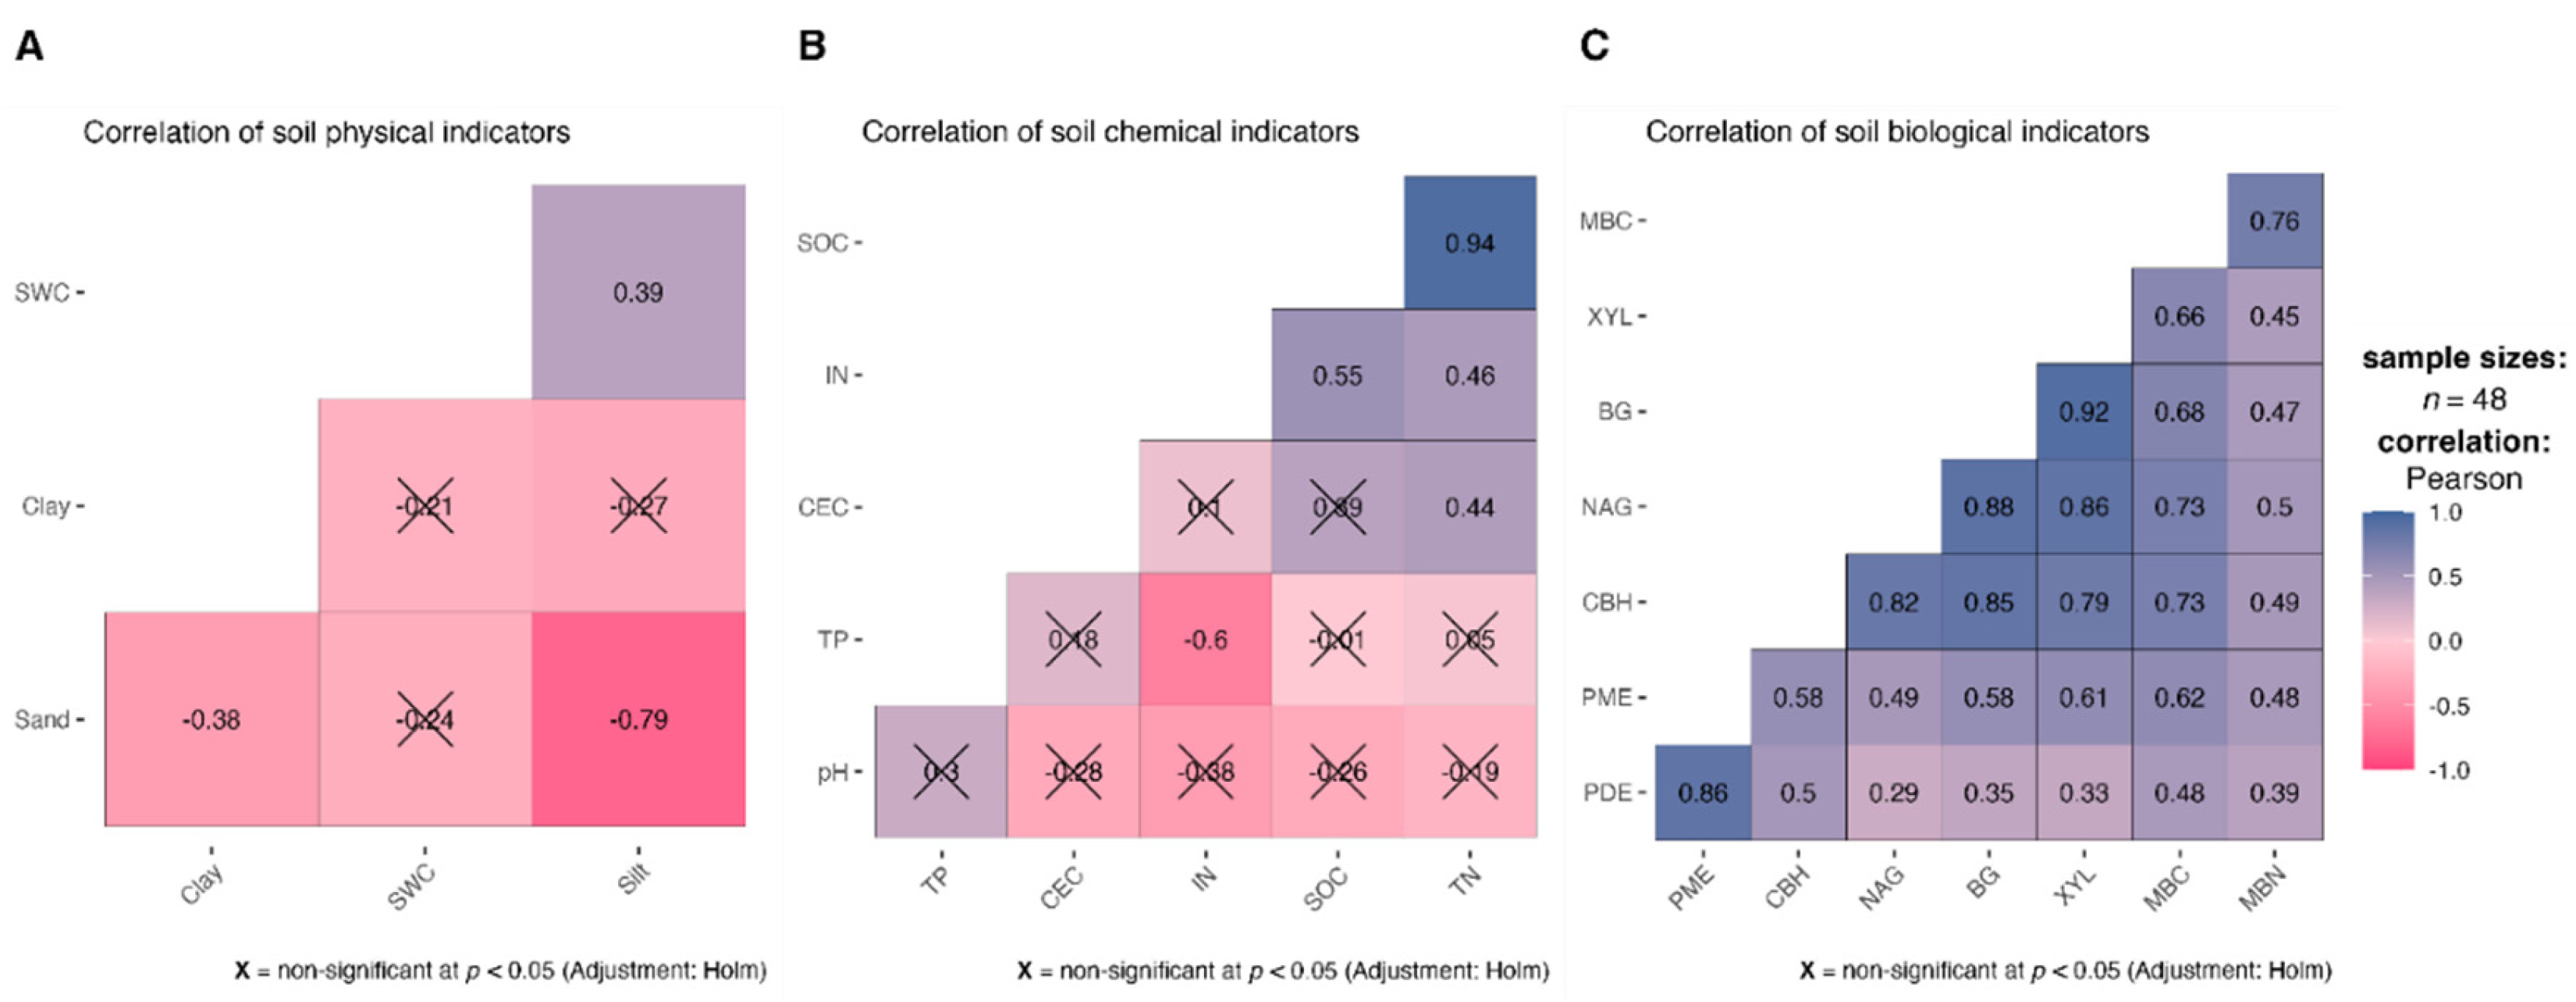
Figure 3.
Principal component analysis of soil physical (A), chemical (B), and biological (C) indicators (SWC, soil water content; SOC, soil organic carbon; TN, total N; IN, inorganic N; TP, total P; CEC, cation exchange capacity; MBC, microbial biomass C; MBN, microbial biomass N; BG, β-glucosidase; XYL, xylanase; CBH, β-D-cellobiohydrolase; NAG, β-N-acetylglucosaminidase; PDE, phosphodiesterase; PME, phosphomonoesterase) from four fertilization treatments. Dim1, principal component 1; Dim2, principal component 2; contrib, contribution.
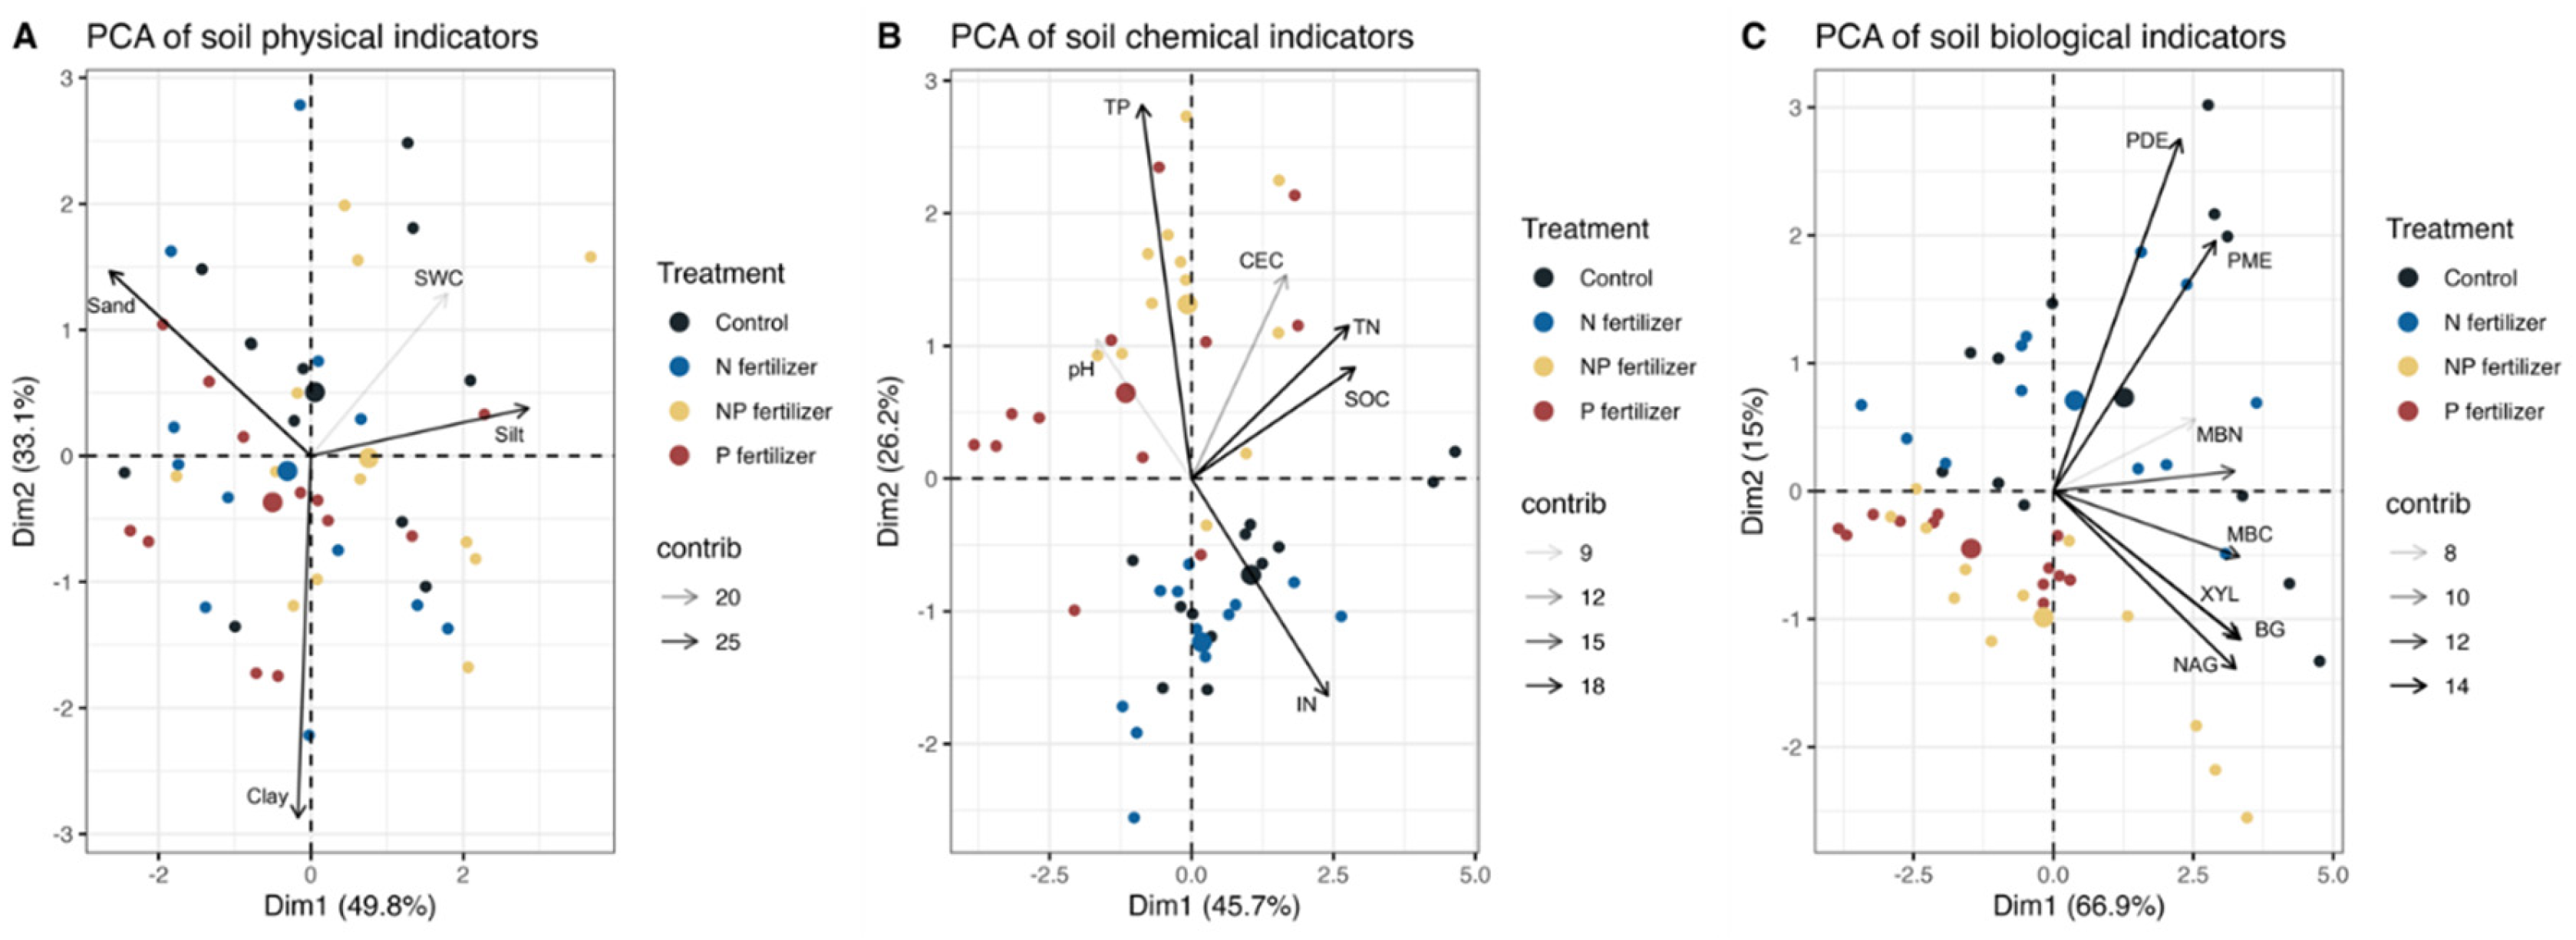
Figure 4.
Treemap summarizing the soil indicators in minimum data sets through the articles selected (n = 32). For further details on indicators see Table S4. We used a specific classification for measurement indicators owing to the abundance of methods and terminology.
Figure 4.
Treemap summarizing the soil indicators in minimum data sets through the articles selected (n = 32). For further details on indicators see Table S4. We used a specific classification for measurement indicators owing to the abundance of methods and terminology.
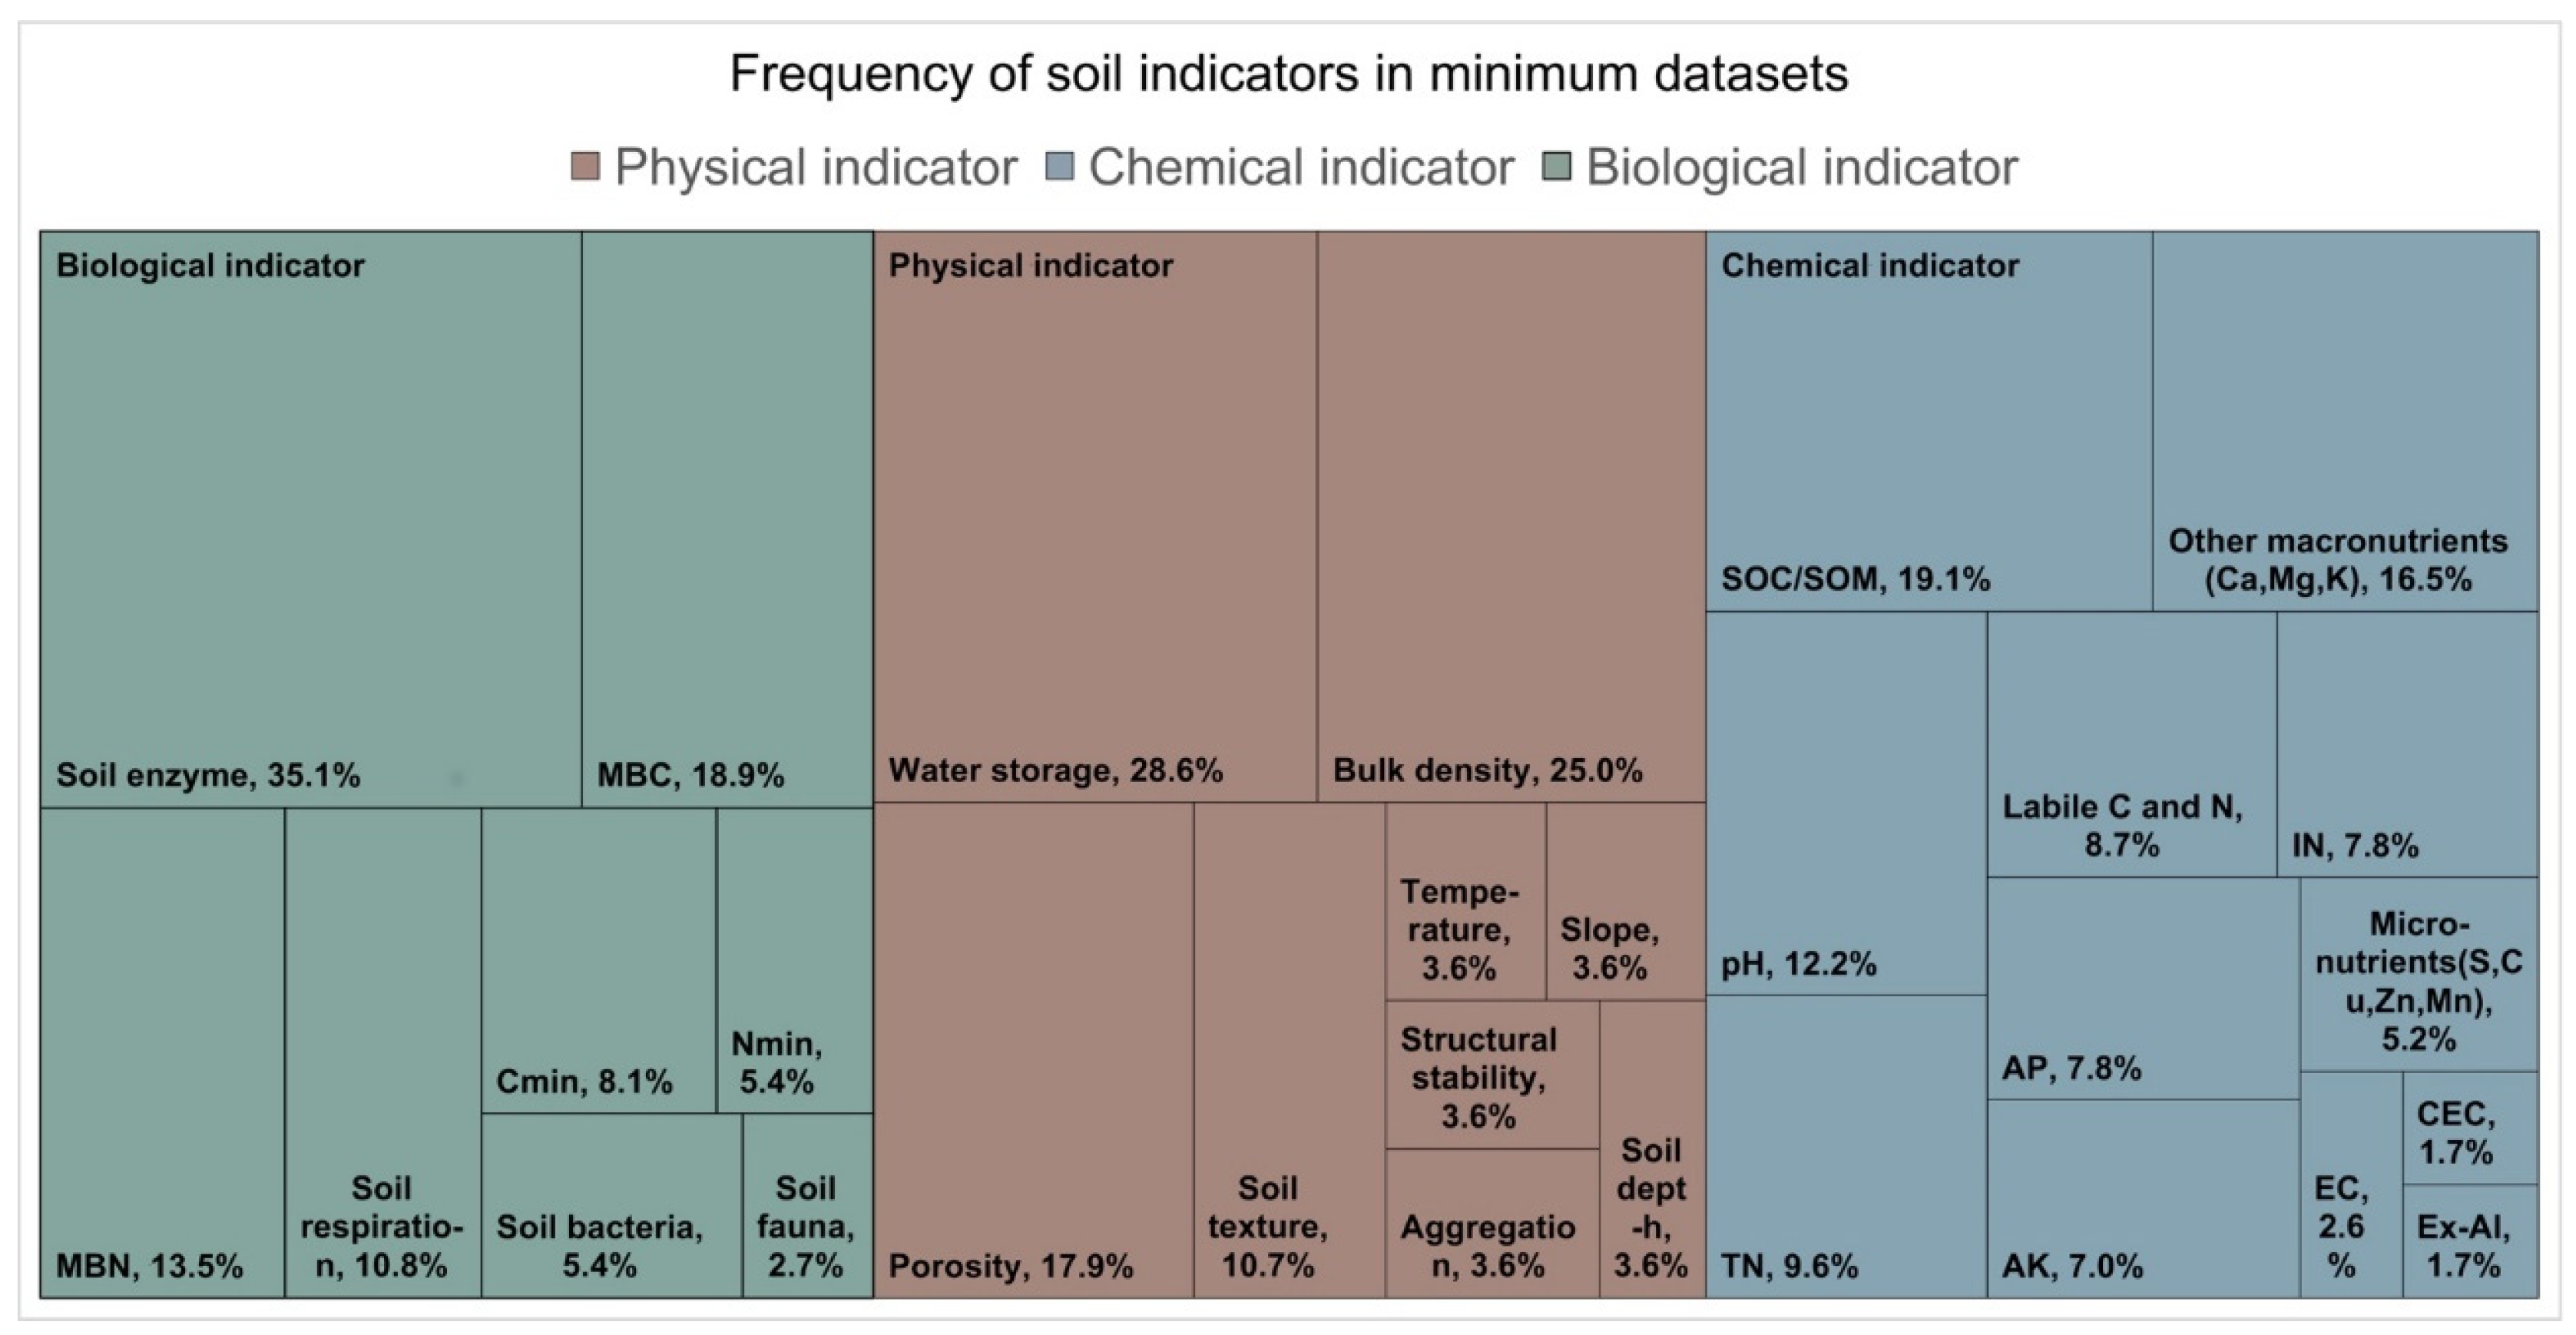
Figure 5.
Soil quality overview (A,B) and SQI (C) under different fertilizer treatments in the Acacia auriculiformis and Eucalyptus urophylla plantations. C, control; N, nitrogen fertilizer; P, phosphorus fertilizer; NP, nitrogen and phosphorus fertilizer.
Figure 5.
Soil quality overview (A,B) and SQI (C) under different fertilizer treatments in the Acacia auriculiformis and Eucalyptus urophylla plantations. C, control; N, nitrogen fertilizer; P, phosphorus fertilizer; NP, nitrogen and phosphorus fertilizer.
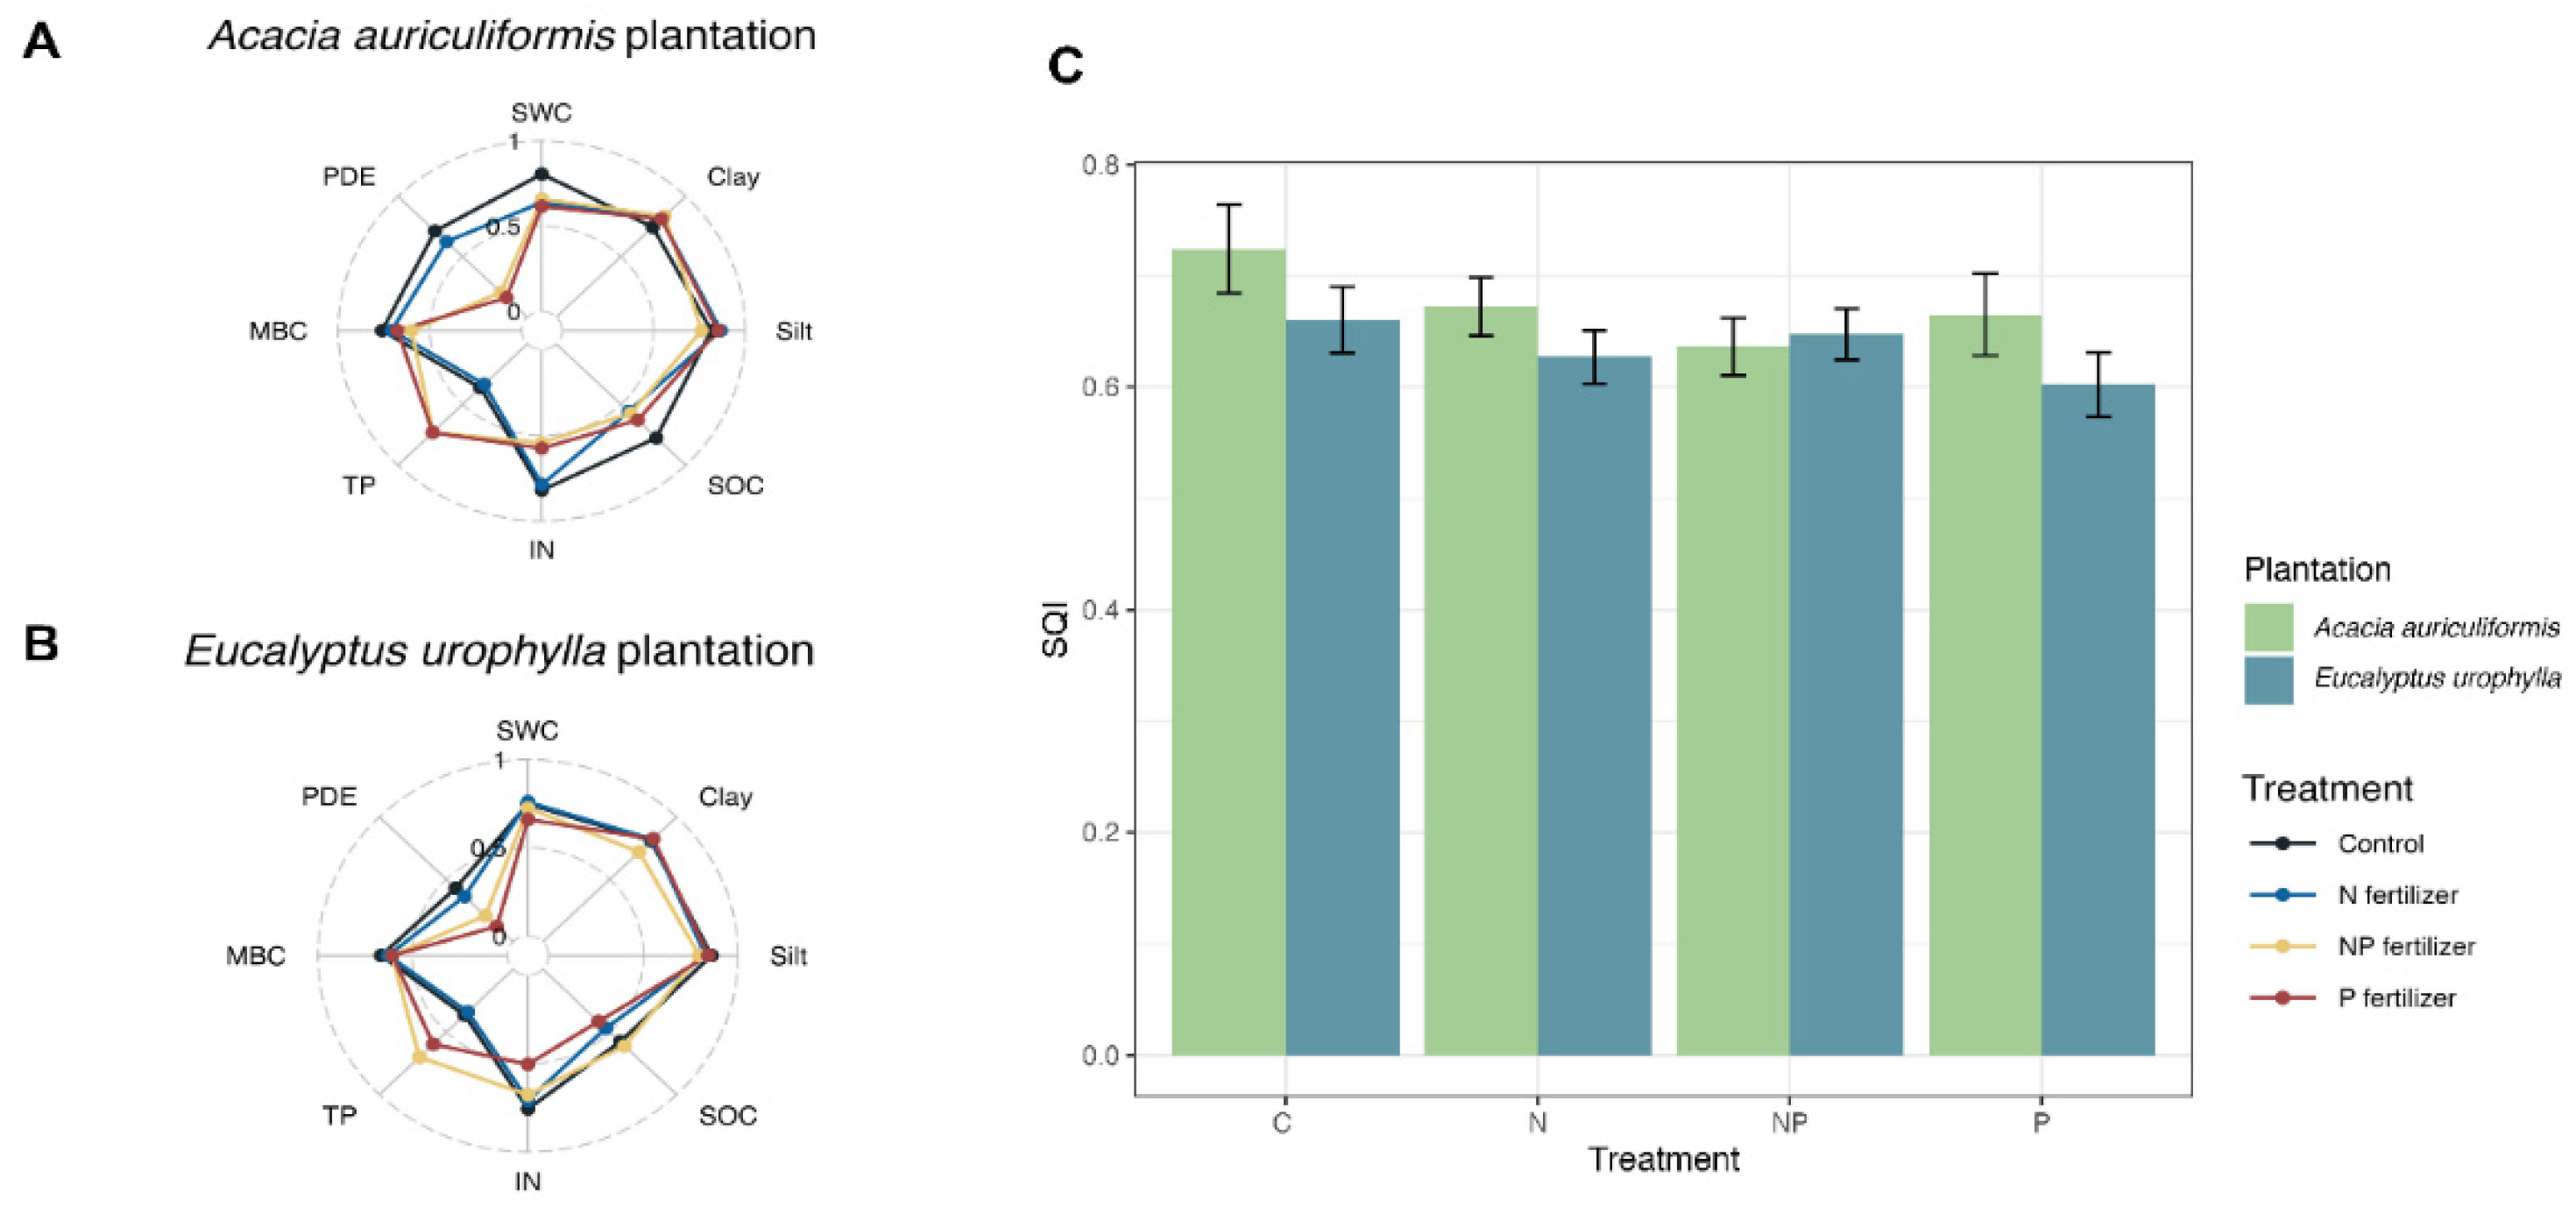
Figure 6.
The relationship between MDS and TDS.
Figure 7.
The relationship between litter mass and SQI.
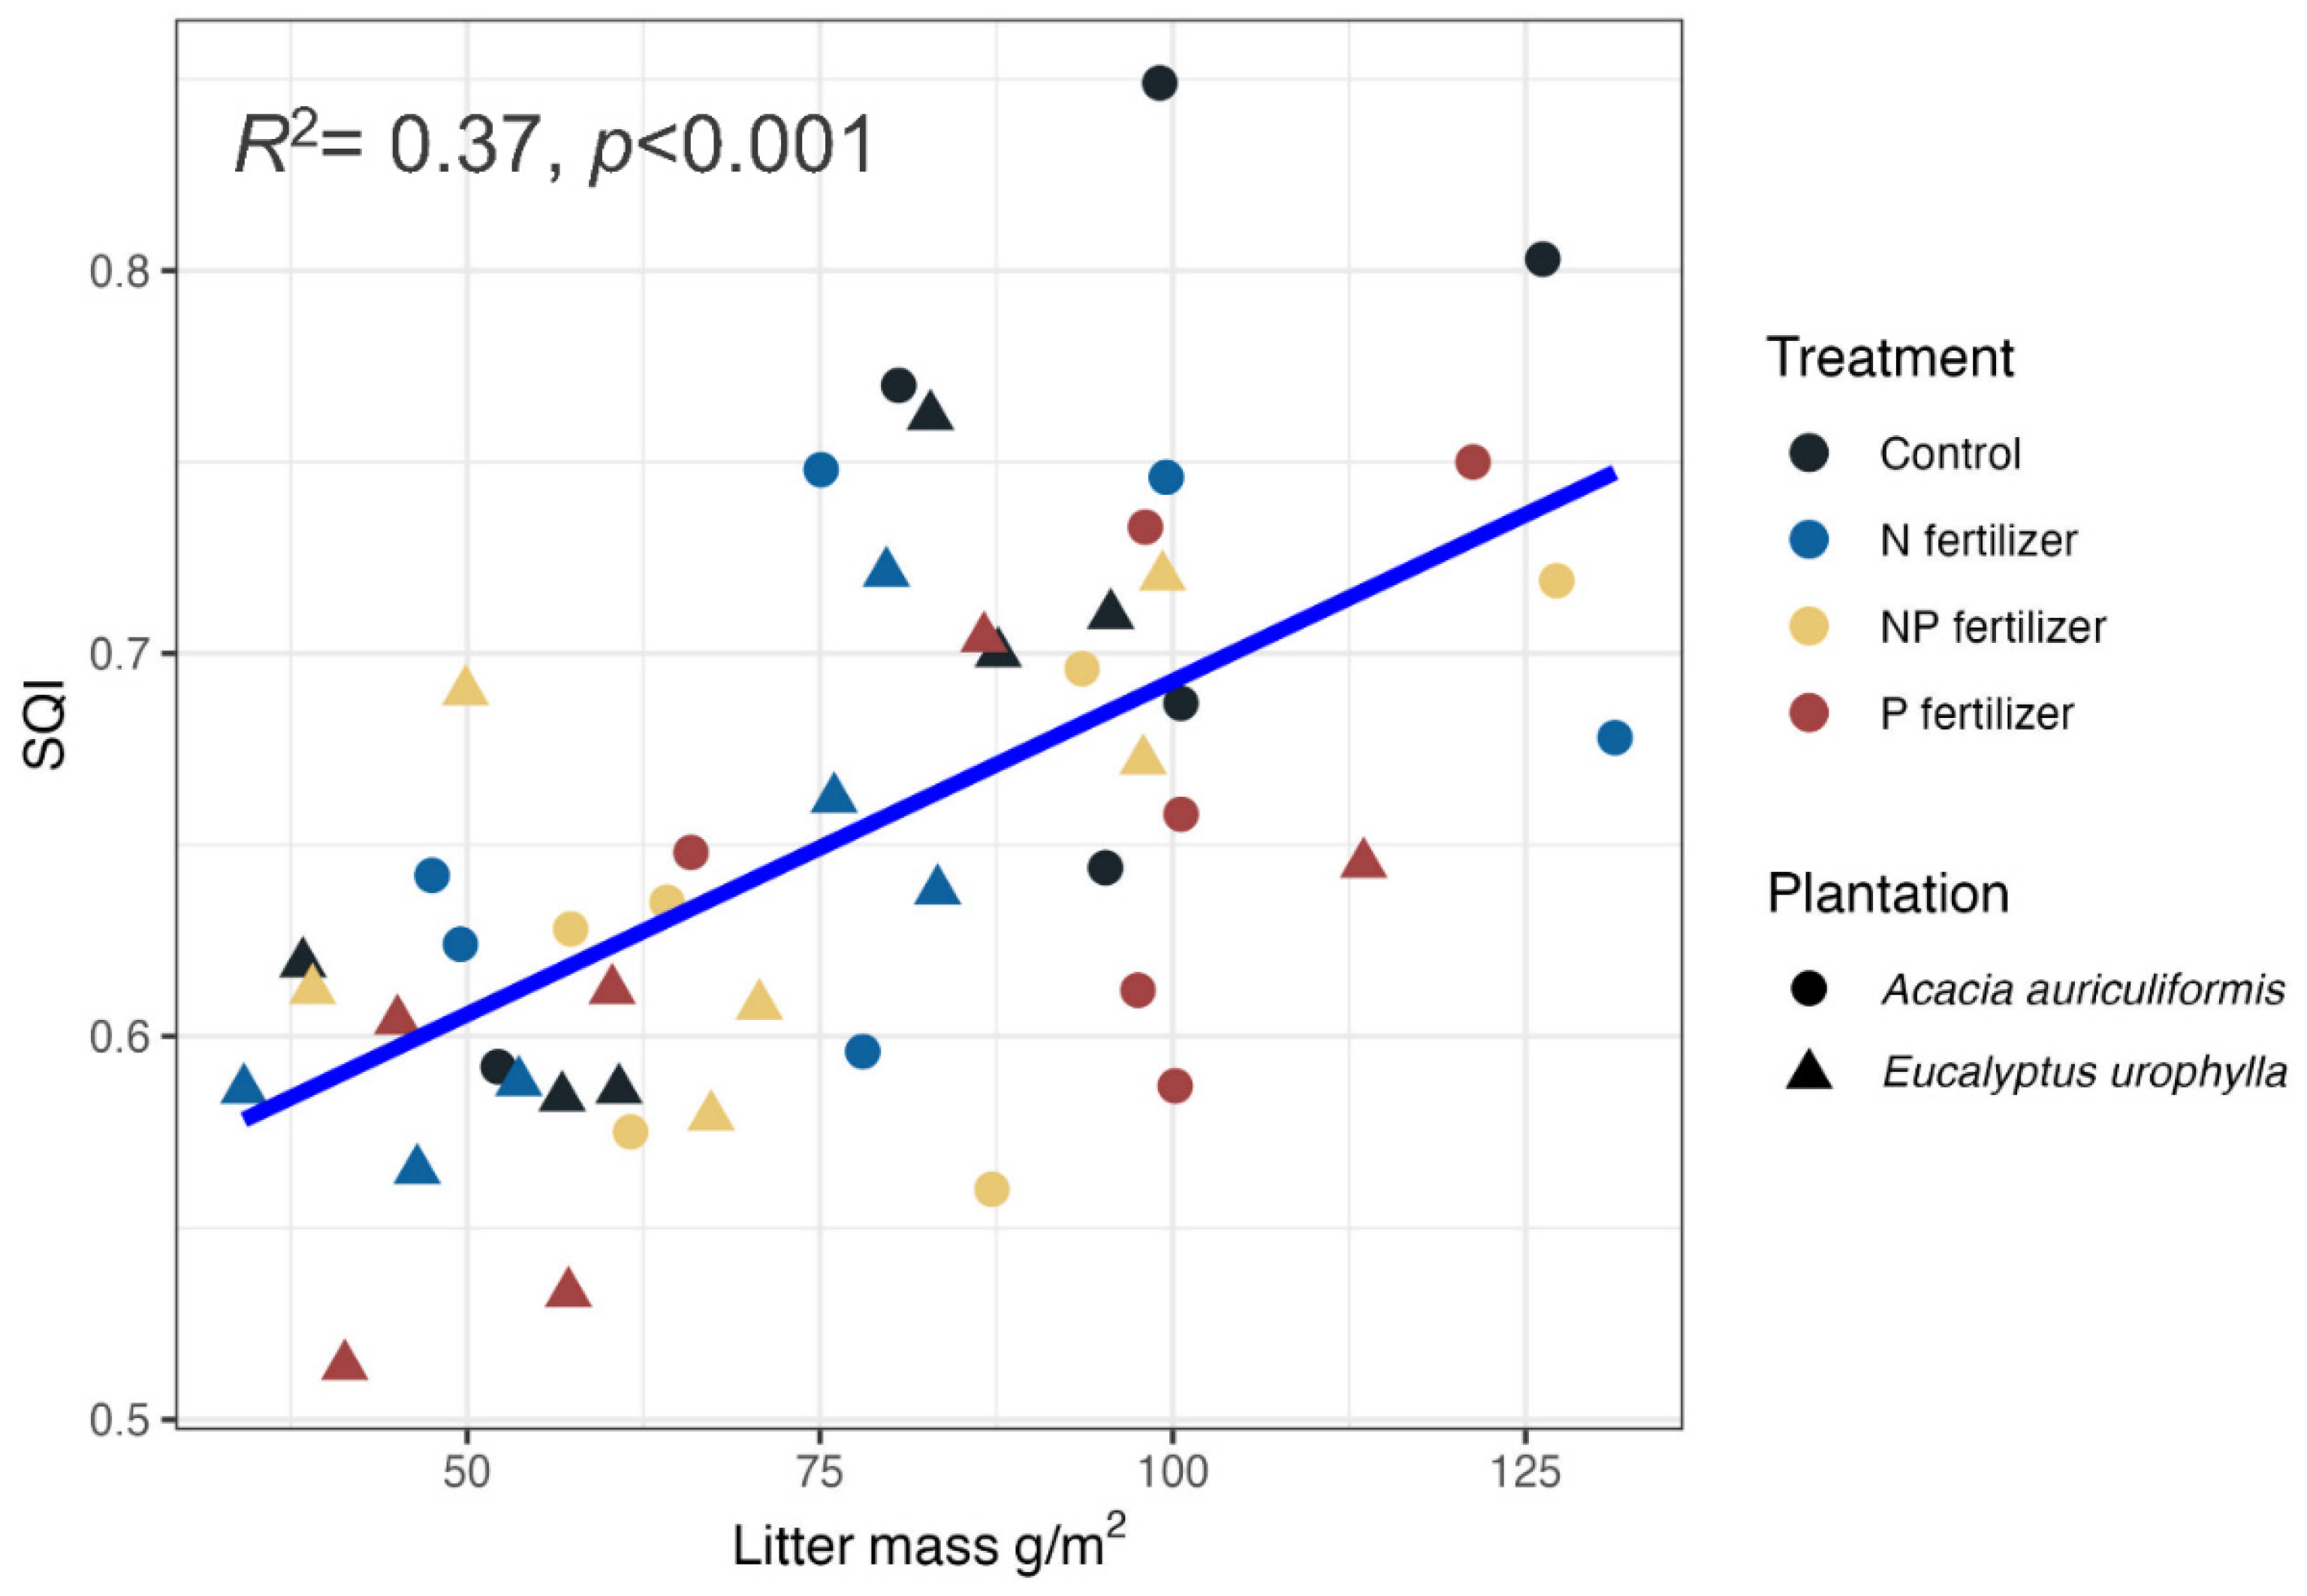

Table 1.
Principal component analysis results of TDS and soil physical, chemical, and biological indicators.
Table 1.
Principal component analysis results of TDS and soil physical, chemical, and biological indicators.
| Soil Indicators | Total Dataset | Physical | Chemical | Biological | |||||||||||
|---|---|---|---|---|---|---|---|---|---|---|---|---|---|---|---|
| PC1 | PC2 | PC3 | PC4 | PC5 | COM | PC1 | PC2 | COM | PC1 | PC2 | COM | PC1 | PC2 | COM | |
| SWC | 0.66 | -0.022 | 0.138 | -0.266 | 0.183 | 0.559 | 0.590 | 0.420 | 0.525 | ||||||
| Clay | -0.5 | 0.22 | 0.373 | -0.465 | -0.381 | 0.799 | -0.060 | -0.950 | 0.906 | ||||||
| Silt | 0.434 | -0.628 | 0.391 | -0.312 | 0.214 | 0.879 | 0.940 | 0.120 | 0.898 | ||||||
| Sand | -0.099 | 0.465 | -0.614 | 0.596 | 0.036 | 0.960 | -0.870 | 0.480 | 0.987 | ||||||
| pH | -0.509 | -0.213 | -0.033 | -0.01 | 0.677 | 0.764 | -0.525 | 0.328 | 0.383 | ||||||
| SOC | 0.514 | 0.454 | 0.589 | 0.244 | 0.244 | 0.936 | 0.900 | 0.262 | 0.879 | ||||||
| TN | 0.403 | 0.444 | 0.675 | 0.254 | 0.249 | 0.942 | 0.865 | 0.360 | 0.878 | ||||||
| TP | -0.438 | -0.454 | 0.448 | 0.509 | 0.07 | 0.863 | -0.273 | 0.881 | 0.851 | ||||||
| IN | 0.714 | 0.441 | 0.042 | -0.259 | 0.131 | 0.790 | 0.750 | -0.512 | 0.825 | ||||||
| CEC | 0.218 | 0.071 | 0.627 | 0.267 | -0.436 | 0.707 | 0.520 | 0.480 | 0.501 | ||||||
| MBC | 0.829 | -0.214 | -0.083 | 0.096 | -0.165 | 0.776 | 0.870 | 0.042 | 0.759 | ||||||
| MBN | 0.657 | 0.007 | -0.064 | 0.425 | -0.083 | 0.623 | 0.683 | 0.151 | 0.489 | ||||||
| BG | 0.84 | -0.302 | -0.138 | 0.07 | -0.063 | 0.825 | 0.899 | -0.312 | 0.906 | ||||||
| CBH | 0.864 | -0.242 | 0.02 | 0.017 | -0.147 | 0.827 | 0.894 | -0.138 | 0.818 | ||||||
| XYL | 0.831 | -0.295 | -0.169 | 0.087 | -0.017 | 0.814 | 0.882 | -0.305 | 0.871 | ||||||
| NAG | 0.806 | -0.485 | -0.115 | 0.047 | 0.05 | 0.903 | 0.875 | -0.374 | 0.906 | ||||||
| PDE | 0.696 | 0.564 | -0.127 | -0.237 | 0.082 | 0.882 | 0.609 | 0.740 | 0.918 | ||||||
| PME | 0.813 | 0.335 | -0.207 | -0.152 | 0.049 | 0.842 | 0.779 | 0.526 | 0.884 | ||||||
| Eigenvalue | 7.37 | 2.46 | 2.22 | 1.54 | 1.09 | 1.99 | 1.32 | 2.74 | 1.57 | 5.35 | 1.2 | ||||
| Variance (%) | 40.97 | 13.68 | 12.32 | 8.58 | 6.05 | 49.78 | 33.08 | 45.68 | 26.23 | 66.89 | 14.97 | ||||
| Cumulative variance (%) | 40.97 | 54.65 | 66.97 | 75.55 | 81.60 | 49.78 | 82.86 | 45.68 | 71.91 | 66.89 | 81.86 | ||||
Notes: PC, principal component; COM, communalities. SWC, soil water content; SOC, soil organic carbon; TN, total N; IN, inorganic N; TP, total P; CEC, cation exchange capacity; MBC, microbial biomass C; MBN, microbial biomass N; BG, β-glucosidase; XYL, xylanase; CBH, β-D-cellobiohydrolase; NAG, β-N-acetylglucosaminidase; PDE, phosphodiesterase; PME, phosphomonoesterase.
Disclaimer/Publisher’s Note: The statements, opinions and data contained in all publications are solely those of the individual author(s) and contributor(s) and not of MDPI and/or the editor(s). MDPI and/or the editor(s) disclaim responsibility for any injury to people or property resulting from any ideas, methods, instructions or products referred to in the content. |
© 2025 by the authors. Licensee MDPI, Basel, Switzerland. This article is an open access article distributed under the terms and conditions of the Creative Commons Attribution (CC BY) license (http://creativecommons.org/licenses/by/4.0/).
Copyright: This open access article is published under a Creative Commons CC BY 4.0 license, which permit the free download, distribution, and reuse, provided that the author and preprint are cited in any reuse.


