
Submitted:
03 July 2025
Posted:
04 July 2025
You are already at the latest version
Abstract
Introduction: Nicotine dependence assessment is essential in smoking cessation programs. The Fagerström Test for Nicotine Dependence (FTND) is widely used, but its subjective nature limits accuracy. Biomarkers such as cotinine, exhaled carbon monoxide (CO), and carboxyhemoglobin (COHb) provide objective measures of tobacco exposure and dependence.
Methods: A prospective observational study was conducted at the Smoking Cessation Unit of Salamanca University Hospital from 2009 to 2022. A total of 3820 smokers were included. Demographic data, smoking history, and dependence level were recorded. Biomarkers, including serum cotinine, exhaled CO and COHb, were measured. The correlation between biomarkers and FTND scores was analyzed.
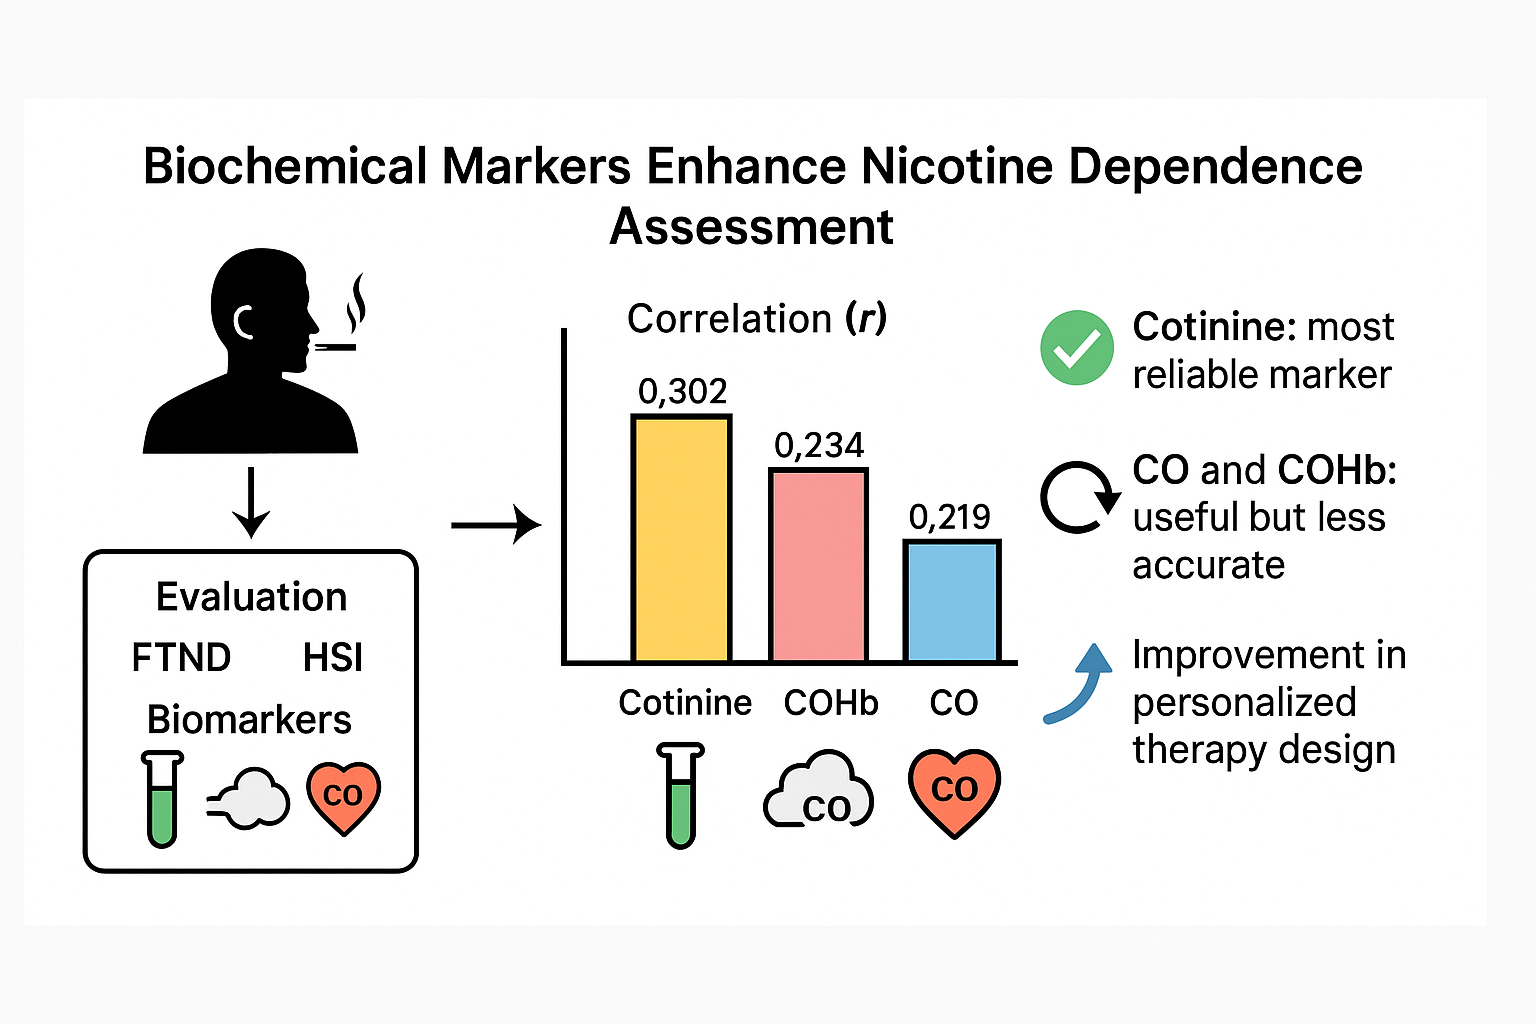
Results: Cotinine levels showed the strongest correlation with FTND scores (r = 0.302, p < 0.001), followed by COHb (r = 0.234, p < 0.001) and exhaled CO (r = 0.219, p < 0.001).
Conclusion: Biomarkers offer a reliable alternative to subjective nicotine dependence assessments. Cotinine proved to be the most accurate marker. Integrating biomarkers into clinical practice could improve cessation outcomes by enabling personalized treatment strategies.
Keywords:
nicotine dependence
; cotinine
; carbon monoxide
; carboxyhemoglobin
Introduction
Smoking is one of the leading preventable causes of morbidity and mortality worldwide, responsible for more than 8 million deaths per year according to the World Health Organization (WHO) [1].
Tobacco causes both physical and psychological dependence. To measure physical nicotine dependence, the Fagerström Test for Nicotine Dependence (FTND) and its simplified version, the Heavy Smoking Index (HSI), are commonly used. The FTND consists of six questions and classifies dependence as mild (0-4 points), moderate (5-6 points), or severe (≥ 7 points). The HSI, on the other hand, has only two questions and also classifies dependence as low (0-2 points), moderate (3-4 points), and high (5-6 points) [2-5].
The subjective nature of these tests may limit their clinical utility, as nicotine dependence is a complex process that includes physical and psychological aspects that are difficult to quantify. The use of objective tools, such as biochemical markers, could be helpful in overcoming these limitations.
In this context, biological markers such as exhaled carbon monoxide (CO), carboxyhemoglobin (COHb), and cotinine offer an objective alternative for quantifying exposure and assessing dependence.
CO is a colorless and odorless gas generated by tobacco combustion [6-10], and its measurement in exhaled air allows for the estimation of immediate exposure to tobacco smoke, as there is a direct relationship between the number of cigarettes smoked and CO levels in exhaled air [11]. Regular smokers typically present CO concentrations equal to or greater than 8-10 ppm, with this figure serving as the cutoff point. Its sensitivity and specificity are around 90%, although the cutoff point may vary depending on environmental factors [9, 10].
Occasional smokers present CO levels below 10 ppm but always higher than 6 ppm, while non-smokers rarely have levels above 6 ppm [12]. Most of the CO binds reversibly to hemoglobin (Hb), forming carboxyhemoglobin (COHb). The affinity of CO for hemoglobin is 200 to 250 times greater than that of oxygen; however, COHb is completely dissociable, and CO is released and eliminated through the lungs once exposure ceases [11, 13, 14].
Cotinine is the primary metabolite of nicotine and has a half-life of 11 to 37 hours, compared to 2-5 hours for CO, making it a more reliable indicator of tobacco consumption [12]. Its sensitivity and specificity for distinguishing between smokers and non-smokers are high, as well as for quantifying consumption: regular smokers typically have serum levels between 200-400 ng/mL, those with lower consumption present levels between 40 and 50 ng/mL, and non-smokers have levels below 10 ng/mL [15-17].
In smokers, cotinine levels correlate with the number of cigarettes per day, smoking history, CO levels, and FTND scores. Although this statement by Benowitz dates back to the 1980s, it has been validated by various authors over the following years [18].
Regarding biochemical markers, it should be noted that for a smoker to develop physical nicotine dependence, the substance must be present chronically in their bloodstream. Since the FTND aims to measure the degree of physical nicotine dependence, it is expected that FTND scores would positively correlate with blood levels of cotinine or other biochemical markers of tobacco consumption.
Studies examining the relationship between exhaled CO concentration and FTND scores typically rely on a single measurement. However, as Pérez Trullen et al. [19] point out, a single and isolated CO measurement is not a reliable indicator for assessing chronic nicotine consumption. Due to its very short half-life (2 to 5 hours), CO levels are significantly influenced by the time elapsed since the last cigarette was smoked [20, 21].
For this reason, the longer half-life of cotinine (15 to 20 hours) makes its blood concentration less sensitive to the time since the last cigarette compared to CO measurement in exhaled air. Consequently, cotinine is presumably a more suitable biochemical marker for chronic nicotine intake and, therefore, a better parameter for correlating with dependence.
The use of biological markers, together with dependence markers, could improve the design and effectiveness of personalized treatments and enable more precise patient follow-up. This study evaluates the usefulness of these biochemical markers compared to the FTND and HSI in smoker patients starting smoking cessation programs.
Methods
Study Design and Population:
A prospective observational study was conducted at the Smoking Cessation Unit of the University Hospital of Salamanca between September 2009 and June 2022. The study included 3,820 smokers over the age of 18 who started a smoking cessation program in this Unit. The included patients agreed to participate in the study and were followed up for 12 months, with scheduled visits at 1, 3, 6, and 12 months. During each visit, biochemical marker levels, treatment adherence, and smoking cessation outcomes were recorded.
Variables:
Demographic data (sex and age), consumption markers (cigarettes/day, years of smoking, and pack-year index [PYI]), and biochemical markers (cotinine, CO, and COHb) were collected. To assess dependence, the FTND and HSI were used. These tests allowed the classification of patients into low, moderate, or high dependence levels.
Statistical Analysis:
Biochemical markers (cotinine levels, carbon monoxide, and carboxyhemoglobin) were evaluated using bivariate analysis (Pearson correlation) to analyze their relationship with the other variables studied. Subsequently, an individual analysis was performed using analysis of variance (ANOVA) and multiple comparisons to assess the relationship between biochemical marker levels and tobacco dependence levels based on FTND scores (high, moderate, or low), as well as the Heavy Smoking Index.
The ANOVA test evaluates whether the observed differences between group means are statistically significant or merely the result of random variability. Bonferroni correction and Dunnett's t-test were applied to control for Type I error. Values of p < 0.05 were considered significant. Data were analyzed using IBM SPSS version 25.0.
Results
Of the 3,820 participants, 53% were men, and the mean age was 48.6 ± 11.4 years. The average tobacco consumption was 24.5 ± 11.5 cigarettes/day, with a mean pack-year index (PYI) of 40.1 ± 24.1. The average smoking duration was 31.6 ± 11.6 years.
As shown in Table 1, the mean FTND score in the studied population was 6.68 ± 1.91 points, while the mean HSI score was 3.97 ± 1.30 points. According to the FTND scale, 56% of patients had high dependence, 31.4% had moderate dependence, and 12.6% had low dependence. According to the HSI scale, 13.3% of patients had low dependence, 52% had moderate dependence, and 34.7% had high dependence.
In summary, a higher percentage of patients were classified as having high dependence using the FTND (56% vs. 34.7% with HSI). A greater proportion of patients were classified in the moderate dependence range with the HSI (52% vs. 31.4% with FTND). The percentage of patients with low dependence was similar for both tests (12.6% vs. 13.3%).
The mean blood cotinine level was 365.1 ± 175.3 ng/mL. When divided according to dependence levels based on the FTND, the mean cotinine value was 262.17 ± 154.83 ng/mL in patients with low dependence, 336.11 ± 164.31 ng/mL in patients with moderate dependence, and 402.78 ± 173.20 ng/mL in patients with high dependence. The differences between the three groups were statistically significant (p = 0.000).
When using the HSI to determine the level of dependence, the mean cotinine value was 258.19 ± 163.80 ng/mL in patients with low dependence, 353.79 ± 160.85 ng/mL in patients with moderate dependence, and 420.77 ± 178.37 ng/mL in patients with high dependence.
The mean levels of CO in exhaled air were 20.5 ± 13.9 ppm, and the mean COHb was 3.8 ± 2%. When divided by dependence levels according to the FTND, the mean value for low dependence was 14.10 ± 11.27 ppm, for moderate dependence it was 18.8 ± 13.2 ppm, and for high dependence it was 22.4 ± 14.6 ppm. All these comparisons were statistically significant with a p = 0.000. Regarding carboxyhemoglobin, the overall mean was 3.8 ± 2%, with mean values of 2.7 ± 1.7% for low dependence according to FTND, 3.5 ± 1.9% for moderate dependence, and 4.1 ± 2.1% for high dependence.
When stratifying CO levels according to HSI dependence levels, the mean levels were 14.45 ± 12.09 ppm for low dependence, 19.91 ± 14.39 ppm for moderate dependence, and 23.11 ± 13.63 ppm for high dependence. Regarding carboxyhemoglobin, the mean values were 2.82 ± 1.86% for low dependence, 3.71 ± 2.11% for moderate dependence, and 4.2 ± 1.98% for high dependence.
Table 2 shows the correlations obtained between the different biochemical markers and the dependence tests (FTND and HSI). Cotinine showed a significant correlation with the FTND (r = 0.302, p < 0.001), establishing a consistent relationship with chronic nicotine exposure (Figure 1 -graphic A-). On the other hand, both CO and COHb presented a moderate correlation with the FTND (r = 0.219, p < 0.001 and r = 0.234, p < 0.001, respectively) (Figure 1 -graphics B y C-).
Cotinine showed a correlation with the level of dependence according to the HSI similar to that observed with the FTND, with r = 0.301 (p < 0.001) (Figure 1 -graphic A-). On the other hand, both CO and COHb showed positive correlations, but lower than those of cotinine, with the level of dependence measured by the HSI scale, with r = 0.192 (p < 0.001) for CO and r = 0.210 (p < 0.001) for COHb (Table 2, Figure 1 -graphics B and C-).
When analyzing individually, using an analysis of variance (ANOVA), the relationship between the levels of biochemical markers and the different levels of tobacco dependence based on the FTND score (high, moderate, or low) and the HSI, statistically significant differences were found for all levels, with a p = 0.000. In other words, higher levels of dependence were associated with higher levels of serum cotinine, CO, and COHb. This can be observed in Table 3 and Table 4 and Figure 2.
Discussion
Published studies on the relationship between tobacco consumption biomarkers and nicotine dependence levels are scarce [22, 23], but existing studies highlight the importance of using biochemical markers that accurately reflect the degree of chronic nicotine consumption whenever possible. Since the FTND and HSI measure the degree of physical dependence on nicotine, it is expected that the score obtained on these tests will correlate positively with the levels of biochemical markers and, therefore, can be used as markers of dependence.
The relationship between CO and dependence established by the FTND shows significant variation in the literature, with correlation coefficients ranging from 0.23 to 0.88, which does not happen in the case of cotinine [24-26]. Benowitz and colleagues note that these differences are due to the use of single measurements of CO values to determine the correlation, so CO cannot be considered a good index of tobacco consumption. Although CO has an accumulated value throughout the day based on consumption, it has a very short half-life from the last cigarette, so its utility is limited [27, 28].
In our study, the relationship between CO and COHb levels with the FTND and HSI shows similar results, with a positive correlation for both FTND and HSI (r = 0.219 and r = 0.192 for CO; and r = 0.234 and r = 0.210 for COHb). This reflects that elevated levels of CO and/or COHb correspond with higher scores on both tests, findings consistent with existing literature. However, it should be noted that in our study, the correlation values observed are relatively low but significant.
For this reason, cotinine has emerged as a more reliable indicator of tobacco consumption due to its longer half-life compared to CO and COHb. However, the available literature regarding the relationship between tobacco dependence and cotinine levels is much smaller and older [20]. Despite this, the published findings align with those observed in our study, showing significant and moderately high correlations between cotinine levels and the degree of dependence, measured using the FTND. Pomerleau and colleagues [20] found a correlation of 0.42 (p < 0.005) between cotinine levels and FTND score. Other authors have also found significant correlations between CO and FTND (r = 0.5853; p = 0.0001) and between COHb and FTND (r = 0.549; p = 0.0001) [21]. In our study, the correlation values observed were 0.302 for the FTND scale and 0.301 for the HSI scale, with little variation between the two tests, unlike Pomerleau's study. In any case, the correlation observed with cotinine is better than the one observed with CO and COHb.
In conclusion, the results obtained in this study validate the use of biochemical markers as complementary, though not substitute, tools to traditional nicotine dependence tests. Although FTND and HSI are widely used, their subjective nature limits their accuracy, making it necessary to complement or integrate the information obtained with other parameters. Cotinine presents a better correlation with nicotine dependence, measured by the FTND, than CO in exhaled air and COHb, positioning it as the most reliable biochemical marker for quantifying physical nicotine dependence.
Nonetheless, the determination of CO and COHb are less invasive tests that are simpler, cheaper, and faster than cotinine determination. Therefore, it is necessary to perform a cost-benefit analysis in each case to decide which test to use.
Conclusion
The findings of this study put into focus the potential of biochemical markers, particulary cotinine, as objective tools to complement traditional nicotine dependence assessment such as the FTND and HIS. Given cotinine`s stronger correlation with dependence levels, its integration into smoking cessation programs could enhance personalized treatmen strategies. However, the practicality and lower cost of CO and COHb measurements make them valuable alternatives in resource-limited settings. Future research should explore cost-effectiveness analyses and long-term clinical outcomes to optimize the use of these biomarkers in routine smoking cessation interventions.
Author Contributions
Conceptualization and methodology: MAH-M & RCP. Software validation and formal analysis: LGP, EBO, HSV. Writing and original draft preparation: LGP, EBO, VHS. Writing review and editing: MAH-M & RCP. All authors have read and agreed to the published version of the manuscript.
Funding
This research was funded by Sociedad Española de Neumología y Cirugía Torácica (SEPAR) grant name (CONVOCATORIA BECAS SEPAR 2022. AYUDA A LA INVESTIGACIÓN).
Institutional Review Board Statement
The study was conducted according to the guidelines of the Declaration of Helsinki, and approved by the Ethics Committee for Research with Medicinal Products of the Salamanca Health Area (protocol code PI 2021 07 827, July 30, 2021).
Informed Consent Statement
Informed consent was waived as the data and biological samples used in the study were collected as part of standard clinical care at our hospital.
Conflicts of Interest
The authors have no conflicts of interest to declare.
References
- WHO. Trends in prevalence of tobacco use. WHO global report on trends in prevalence of tobacco use 2000–2025. Fourth edition. Geneva: WHO; 2021. p. 5-19. ISBN 9789240039322.
- Bhang SY, Choi SW, Ahn JH. The efficacy and predictive value of the Heavy Smoking Index for smoking cessation among daily smokers in a public health center. J Subst Use 2014; 19 (1-2): 7-11. [CrossRef]
- Lim KH, Idzwan MF, Sumarni MG, Kee CC, Amal NM, Lim KK, Gurpreet K. Heaviness of smoking index, number of cigarettes smoked and the Fagerström test for nicotine dependence among adult male Malaysians, Asian Pac J Cancer Prev 2012; 13(1): 343-346. [CrossRef]
- John U, Meyer C, Schumann A, Hapke U, Rumpf HJ, Adam C, et al. A short form of the Fagerstrom Test for Nicotine Dependence and the Heaviness of Smoking Index in two adult population samples. Addict Behav 2004; 29(6): 1207-1212. [CrossRef]
- Álvarez Gutiérrez FJ, Pérez Trullén A. Cinco minutos para el tabaco en las consultas de atención especializada. En: Barrueco Ferrero M, Hernández Mezquita MA, Torrecilla García M, editores. Manual de Prevención y Tratamiento del Tabaquismo. 4ª ed. Barcelona: EUROMEDICE Ediciones Médicas SL; 2009. p. 95-116.
- Jarvis MJ, Russell MA, Saloojee Y. Expired air carbon monoxide: a simple breath test of tobacco smoke intake. Br Med J. 1980; 281 (6238): 484-485. [CrossRef]
- Shaoqing Y, Ruxin Z, Yingjian C, Jianqiu C, Yanshen W, Genhong L. A meta-analysis of the association of exhaled carbon monoxide on asthma and allergic rhinitis. Clin Rev Allergy Immunol. 2011; 41(1): 67–75. [CrossRef]
- Tual S, Piau JP, Jarvis MJ, Dautzenberg B, Annesi-Maesano I. Impact of tobacco control policies on exhaled carbon monoxide in non-smokers. J Epidemiol Community Health. 2010; 64(6): 554–556. [CrossRef]
- Maga M, Janik MK, Wachsmann A, Chrząstek-Janik O, Koziej M, Bajkowski, et al. Influence of air pollution on exhaled carbon monoxide levels in smokers and non-smokers. A prospective cross-sectional study. Environ Res. 2017; 152: 496–502. [CrossRef]
- Zhang Q, Li L, Smith M, Guo Y, Whitlock G, Bian Z, et al. China Kadoorie Biobank study collaboration. Exhaled carbon monoxide and its associations with smoking, indoor household air pollution and chronic respiratory diseases among 512,000 Chinese adults. Int J Epidemiol. 2013; 42(5): 1464–1475. [CrossRef]
- Clark KD, Wardrobe-Wong N, Elliott JJ, Gill PT, Tait NP, Snashall PD. Cigarette smoke inhalation and lung damage in smokers volunteers. Eur Respir J 1998; 12: 395-399. [CrossRef]
- Benowitz NL, Bernert JT, Foulds J, Hecht SS, Jacob P, Jarvis MJ. Biochemical verification of tobacco use and cessation. Nicotine Tob Res. 2002; 4: 149–159. [CrossRef]
- Stork C, Anguish D. Carbon Monoxide. In: Wexler P, editor. Encyclopedia of Toxicology. 2nd ed. New York: Elsevier; 2005. p. 423-425. [CrossRef]
- Jarzon L, Lindell SE, Trell E, Larme P. Smoking habits and carboxyhaemoglobin: A cross-sectional study of an urban population of middleaged men. J Epidemiol Community Health. 1981; 35: 271-273. [CrossRef]
- Abrams DB, Follick MJ, Biener L, Carey KB, Hitti J. Saliva cotinine as a measure of smoking status in field settings. Am J Public Health 1987; 77: 846-848. [CrossRef]
- Moyer TP, Charlson JR, Enger RJ, Dale LC, Ebbert JO, Schroeder DR, Hurt RD. Simultaneous analysis of nicotine, nicotine metabolites and tobacco alkaloids in serum or urine by tandem mass spectrometry with clinically rele- vant metabolic profiles. Clin Chem 2002; 48: 1460-1471. PMID: 12194923.
- Haley NJ, Axelrad CM, Tilton KA: Validation of self-repord smoking behaviour: Biochemical analyses of cotinine and thiocyanate. Am J Public Health 1983; 73: 1204-1207. [CrossRef]
- Benowitz NL. The use of biologic fluid samples in assessing tobacco smoke consumption. NIDA Res Monogr. 1983; 48: 6-26. PMID: 6443145.
- Pérez Trullén A, Lázaro Sierra J, Clemente Jiménez ML, Herrero Labarga M, Cascán Herreros MP. Marcadores biológicos y funcionales de susceptibilidad, exposición y lesión por el consumo de tabaco. En: Jiménez-Ruiz CA, Fagerström KO, editores. Tratado de Tabaquismo. 3ª ed. Madrid: Grupo Aula Médica; 2011. p. 323-340.
- Pomerleau CS, Pomerleau OF, Majchzak MJ, Kloska DD, Malakuti R. Relationship between nicotine tolerance questionaire scores and plasma cotinine. Addict Behav 1990; 15: 73-78. [CrossRef]
- Clemente ML, Pérez-Trullén A, Rubio E, et al. Correlación entre los niveles de monóxido de carbono en el aire espirado y los sistemas de medición de la dependencia nicotínica DSM-IV, test de Fagerström y ARU-SMQ-9 en adolescentes fumadores. Med Clin (Barc) 2003; 121 (3): 89-94. [CrossRef]
- Benowitz NL, Bernert JT, Foulds J, Hecht SS, Jacob P, Jarvis MJ, et al. Biochemical Verification of Tobacco Use and Abstinence: 2019 Update. Nicotine Tob Res. 2020; 22 (7): 1086-1097. PMID: 31570931; PMCID: PMC7882145. [CrossRef]
- Noonan D, Jiang Y, Duffy SA. Utility of biochemical verification of tobacco cessation in the Department of Veterans Affairs. Addict Behav. 2013; 38 (3): 1792-1795. Epub 2012 Nov 24. PMID: 23261494; PMCID: PMC4856005. [CrossRef]
- Heatherton TF, Kozlowski LT, Frecker RC, Fagerström KO. The Fagerström Test for Nicotine Dependence: a revision of the Fagerström Tolerance Questionnaire. Br J Addict, 1991; 86 (9): 1119-1127. [CrossRef]
- Harackiewicz JM, Blair LW, Sansone C, Epstein JA, Stuchell RN. Nicotine gum and self-help manuals in smoking cessation: an evaluation in a medical context. Addict Behav. 1988; 13 (4): 319-330. PMID: 3239463. [CrossRef]
- Tønnesen P, Fryd V, Hansen M, Helsted J, Gunnersen AB, Forchammer H, Stockner M. Two and four mg nicotine chewing gum and group counselling in smoking cessation: an open, randomized, controlled trial with a 22-month follow-up. Addict Behav. 1988; 13 (1): 17-27. PMID: 3284283. [CrossRef]
- Benowitz NL, Hukkanen J, Jacob P. Nicotine Chemistry, Metabolism, Kinetics and Biomarkers. In: Henningfield JE, London ED, Pogun S, editors. Nicotine Psychopharmacology. Handbook of Experimental Pharmacology, vol 192. Berlin, Heidelberg: Springer; 2009. Available from: . [CrossRef]
- Asar E, Bulut YE, Dindar Badem N, Orscelik A, Sahin CE, Buyukluoglu G, Kucuk I, Kocahan T, Erguder T. Tobacco Use and Second-Hand Smoke Exposure Among Athletes; Assessment by Urine Cotinine Level and Exhaled Carbon Monoxide: A Cross-Sectional Study. Healthcare. 2025; 13(2):198. [CrossRef]
Figure 1.
Correlation between biochemical levels and dependence levels (HSI and FTND) at the start of the study.
Figure 1.
Correlation between biochemical levels and dependence levels (HSI and FTND) at the start of the study.
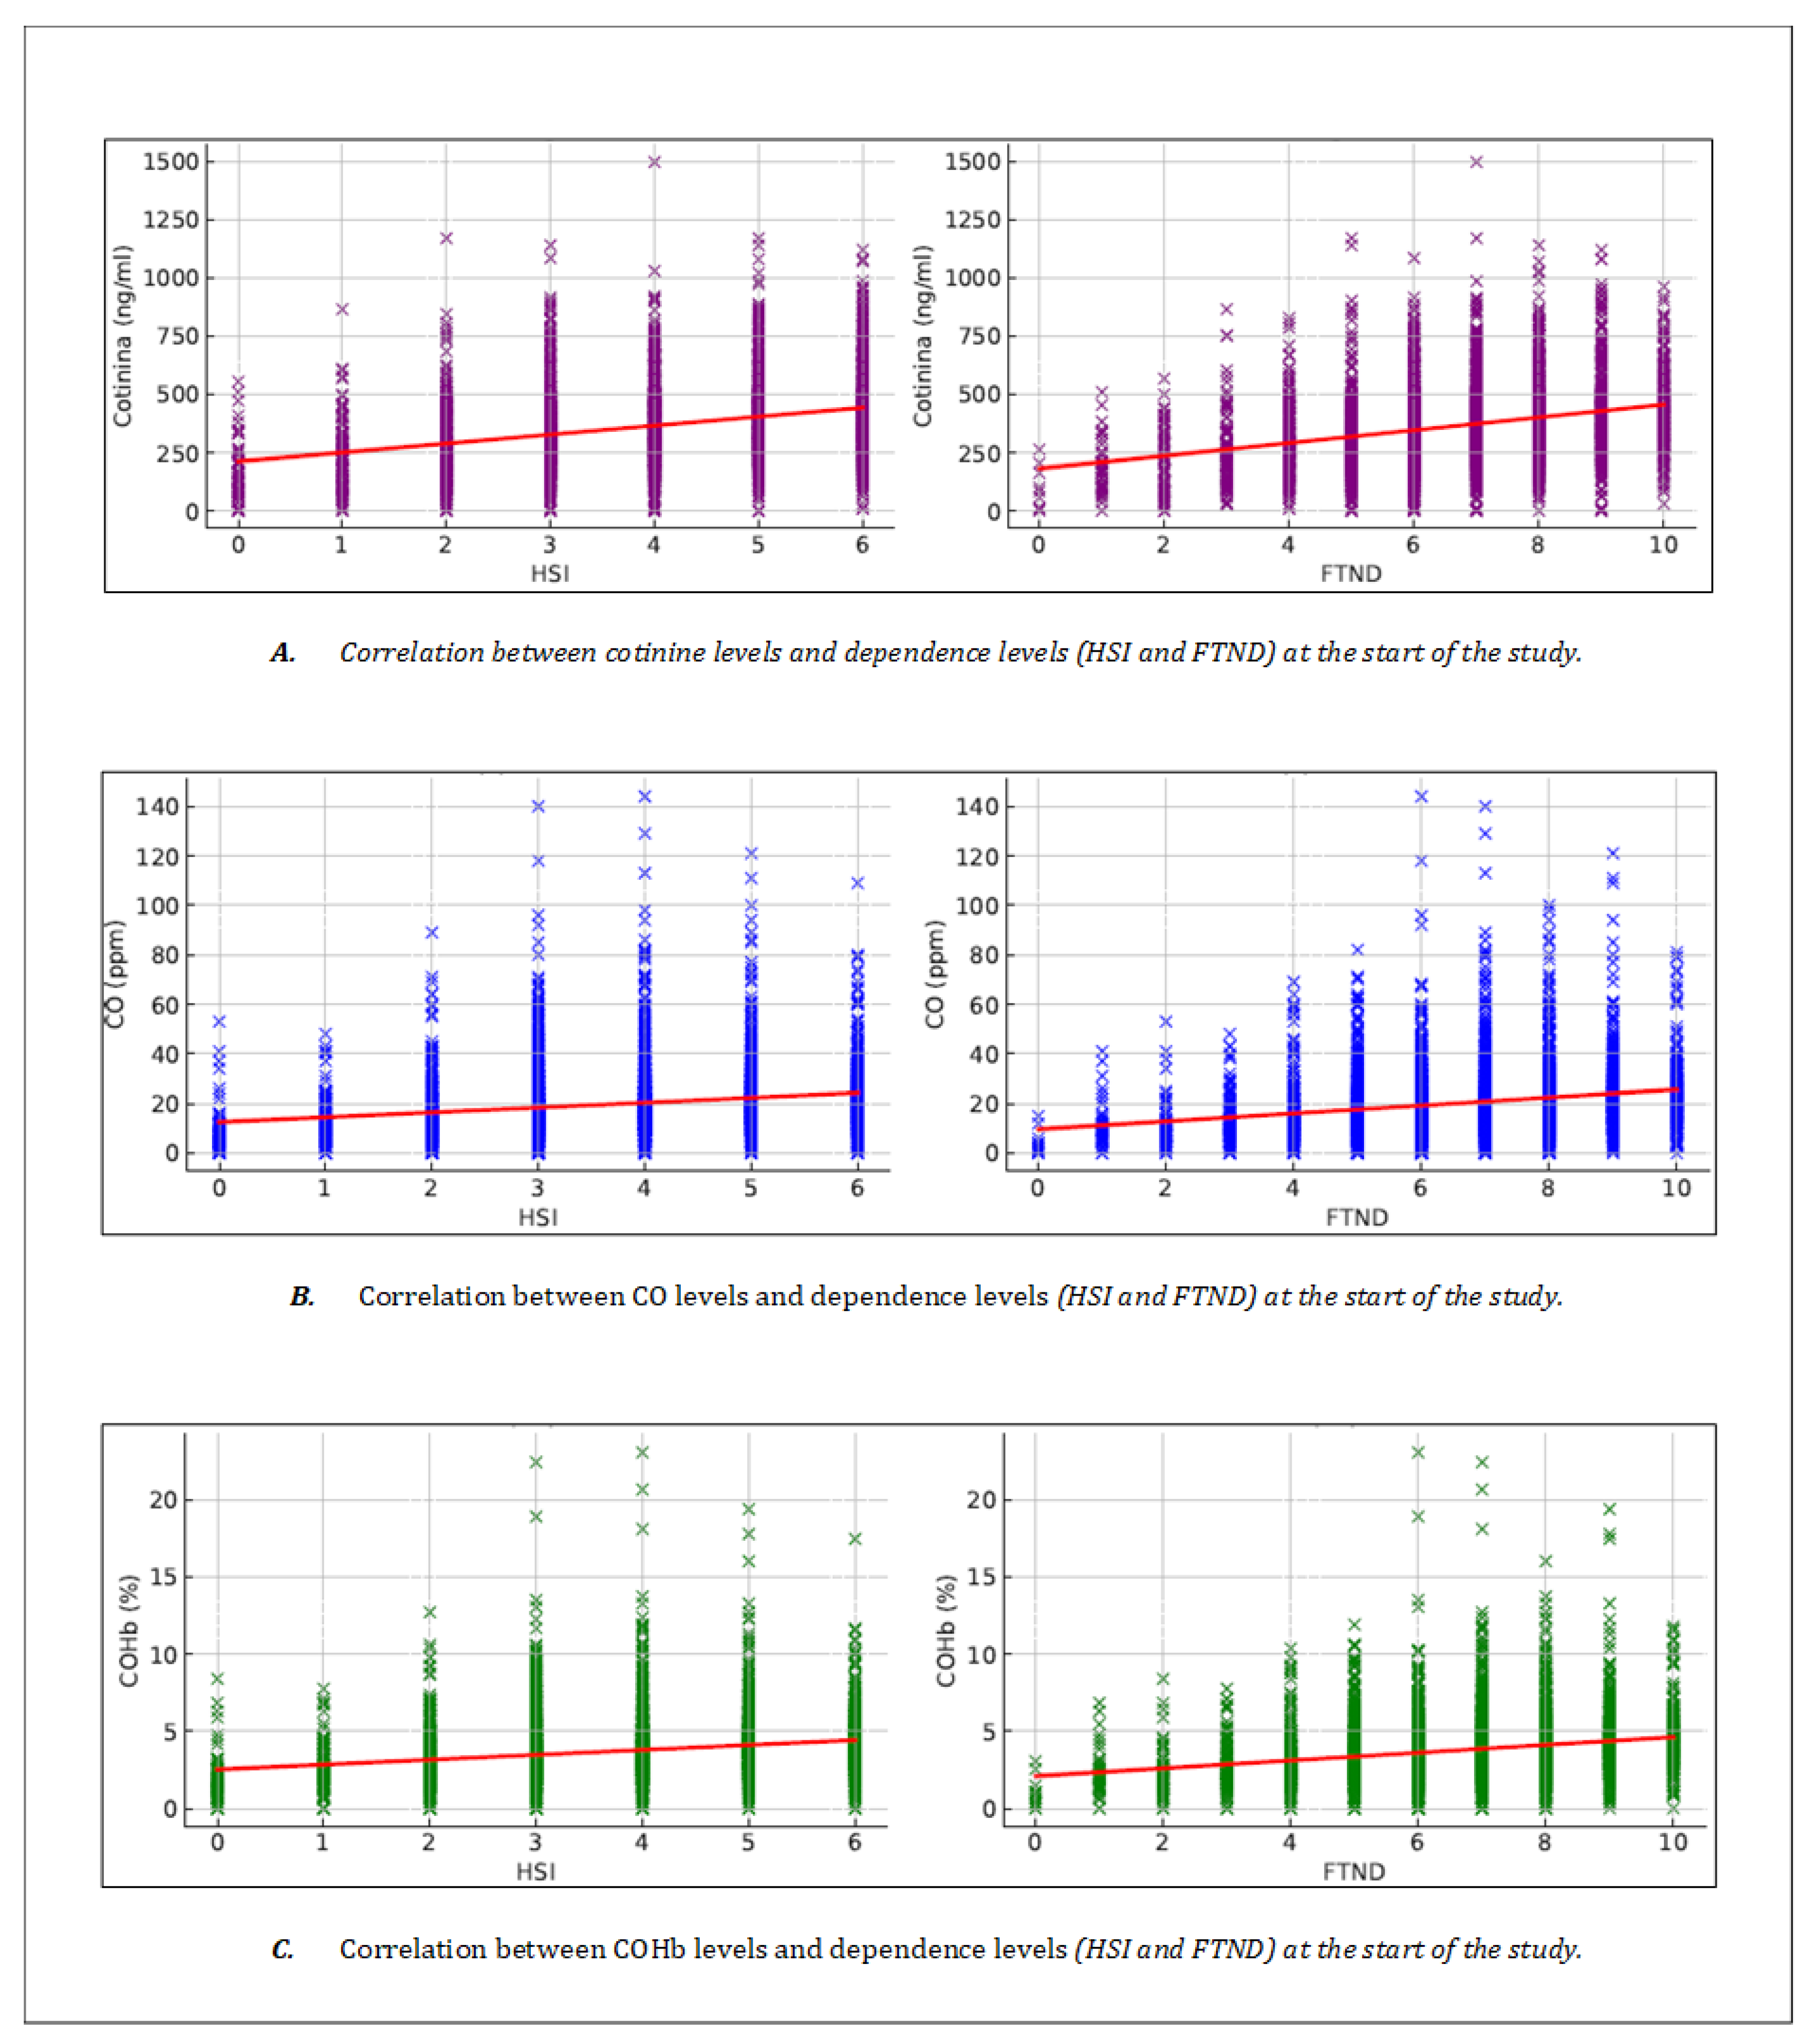
Figure 2.
Evolution of biochemical marker levels based on tobacco dependence according to the FTND.
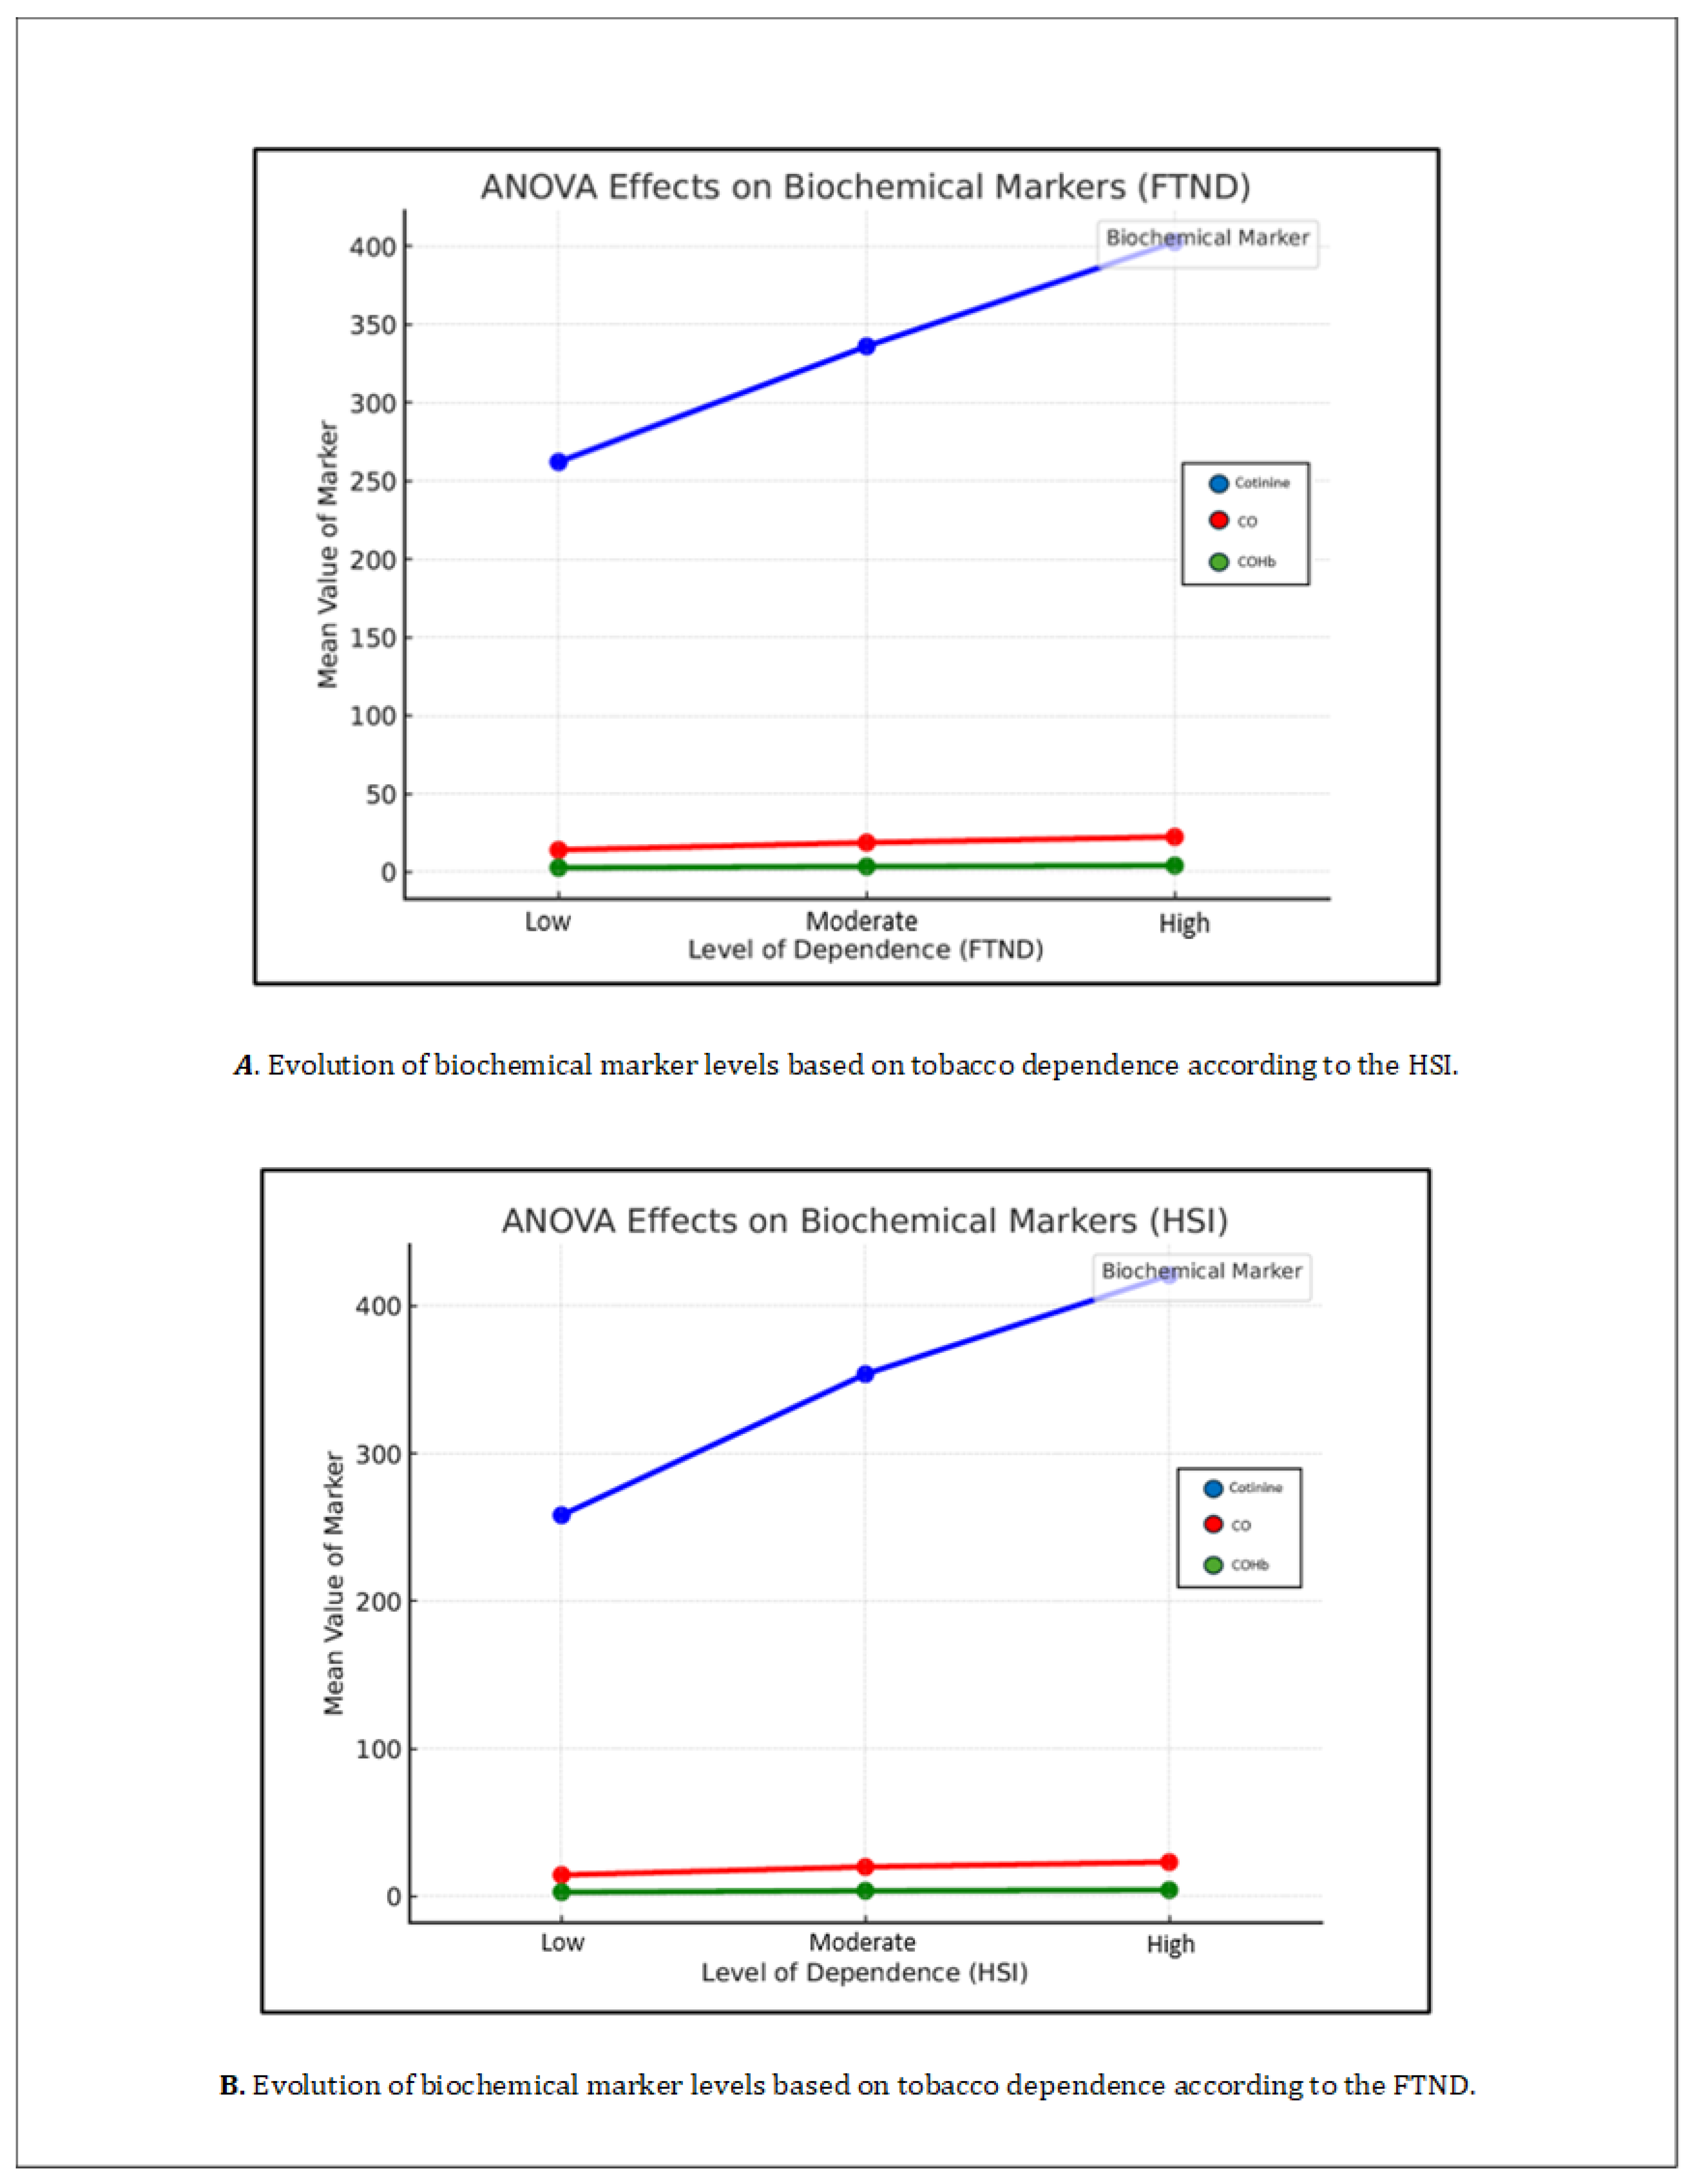

Table 1.
Mean values of biochemical markers and dependence levels in the population at the start of the study.
Table 1.
Mean values of biochemical markers and dependence levels in the population at the start of the study.
| Global mean values | Mean values by dependence levels (FTND) | Mean values by dependence levels (HSI) | Dependence levels | |
|---|---|---|---|---|
|
Cotinina (ng/ml) |
365.11 ± 175.37 | 262.170 ± 154.83 | 258.19 ± 163.80 | Low |
| 336.11 ± 164.31 | 353.76 ± 160.46 | Moderate | ||
| 402.767 ± 173.20 | 420.77 ± 178-37 | High | ||
|
CO (ppm) |
20.50 ± 13.93 | 14.10 ± 11.27 | 14.45 ± 12.09 | Low |
| 18.83 ± 13,20 | 19.91 ± 14.40 | Moderate | ||
| 22.49 ± 14,64 | 23.11 ± 13.63 | High | ||
|
COHb (%) |
3.81 ± 2.05 | 2.78 ± 1.76 | 2.82 ± 1.86 | Low |
| 3.55 ± 1.97 | 3.71 ± 2.12 | Moderate | ||
| 4.12 ± 2.13 | 4.22 ± 1.99 | High | ||
|
Fagerström (FTND) |
6.68 ± 1.91 | |||
|
Heavy Smoking Index (HSI) |
3.97 ± 1.30 |
Table 2.
Correlation between biochemical markers and dependence according to FTND and HSI at the start of the study.
Table 2.
Correlation between biochemical markers and dependence according to FTND and HSI at the start of the study.
| Cotinina | Fagerström | Fagerström simplificado | CO | %COHb | ||
|---|---|---|---|---|---|---|
|
Cotinina |
Pearson correlation (r) | 1 | 0.302 | 0.301 | 0.333 | 0.345 |
| Sig. (bilateral) | 0.000 | 0.000 | 0.000 | 0.000 | ||
| N | 3563 | 3563 | 3482 | 3482 | ||
|
CO |
Pearson correlation (r) | 0.333 | 0.219 | 0.192 | 1 | 0.996 |
| Sig. (bilateral) | 0.000 | 0.000 | 0.000 | 0.000 | ||
| N | 3482 | 3648 | 3649 | 3655 | ||
|
COHb |
Pearson correlation (r) | 0.345 | 0.234 | 0.210 | 0.996 | 1 |
| Sig. (bilateral) | 0.000 | 0.000 | 0.000 | 0.000 | ||
| N | 3482 | 3648 | 3649 | 3655 | ||
Table 3.
Statistical significance of the relationship between biochemical markers and dependence levels according to the FTND scale.
Table 3.
Statistical significance of the relationship between biochemical markers and dependence levels according to the FTND scale.
| Multiple comparisons | ||||||||
|---|---|---|---|---|---|---|---|---|
| Difference of means (I-J) | Desv. Error | Sig. | 95% Confidence Interval | |||||
| Lower limit | Upper limit | |||||||
| Cotinine | Bonferroni | Low | Moderate | -73.94 | 9.51 | 0.000 | -96.72 | -51.15 |
| High | -140.60 | 8.92 | 0.000 | -161.96 | -119.24 | |||
| Moderate | Low | 73.94 | 9.51 | 0.000 | 51.15 | 96.72 | ||
| High | -66.66 | 6.27 | 0.000 | -81.67 | -51.65 | |||
| High | Low | 140.60 | 8.92 | 0.000 | 119.24 | 161.96 | ||
| Moderate | 66.66 | 6.27 | 0.000 | 51.65 | 81.67 | |||
| t de Dunnett (bilateral)a | Moderate | Low | 73.94 | 9.51 | 0.000 | 53.36 | 94.51 | |
| High | Low | 140.60 | 8,92 | 0.000 | 121.31 | 159.88 | ||
| t de Dunnett (bilateral)a | Moderate | Low | 4.40 | 1.27 | 0.001 | 1.66 | 7.14 | |
| High | Low | 18.59 | 1.19 | 0.000 | 16.03 | 21.16 | ||
| CO | Bonferroni | Low | Moderate | -4.72 | 0.77 | 0.000 | -6.56 | -2.88 |
| High | -8.39 | 0.72 | 0.000 | -10.12 | -6.66 | |||
| Moderate | Low | 4.72 | 0.77 | 0.000 | 2.88 | 6.56 | ||
| High | -3.67 | 0.51 | 0.000 | -4.89 | -2.45 | |||
| High | Low | 8.39 | 0.72 | 0.000 | 6.66 | 10.12 | ||
| Moderate | 3.67 | 0.51 | 0.000 | 2.45 | 4.89 | |||
| t de Dunnett (bilateral)a | Moderate | Low | 4.72 | 0.77 | 0.000 | 3.06 | 6.39 | |
| High | Low | 8.39 | 0.72 | 0.000 | 6.83 | 9.95 | ||
| %COHb | Bonferroni | Low | Moderate | -0.77 | 0.11 | 0.000 | -1.05 | -0.50 |
| High | -1.34 | 0.11 | 0.000 | -1.59 | -1.08 | |||
| Moderate | Low | 0.77 | 0.11 | 0.000 | 0.50 | 1.05 | ||
| High | -0.56 | 0.08 | 0.000 | -0.75 | -0.39 | |||
| High | Low | 1.34 | 0.11 | 0.000 | 1.08 | 1.59 | ||
| Moderate | 0.57 | 0.08 | 0.000 | 0.39 | 0.75 | |||
| t de Dunnett (bilateral)a | Moderate | Low | 0.77* | 0,1135 | 0,000 | 0,528 | 1,019 | |
| High | Low | 1.33* | 0,1063 | 0,000 | 1,108 | 1,568 | ||
Table 4.
Statistical significance of the relationship between biochemical markers and dependence levels according to the HSI.
Table 4.
Statistical significance of the relationship between biochemical markers and dependence levels according to the HSI.
| Difference of means (I-J) | Desv. Error | Sig. | 95% Confidence Interval | |||||
|---|---|---|---|---|---|---|---|---|
| Lower limit | Límite superior | |||||||
| Cotinine | Bonferroni | Low | Moderate | -95.57 | 8.74 | 0.000 | -116.51 | -74.63 |
| High | -162.59 | 9.17 | 0.000 | -184.54 | -140.62 | |||
| Moderate | Low | 95.57 | 8.74 | 0.000 | 74.63 | 116.51 | ||
| High | -67.01 | 6.14 | 0.000 | -81.72 | -52.31 | |||
| High | Low | 162.58 | 9.17 | 0.000 | 140.62 | 184.54 | ||
| Moderate | 67.01 | 6.14 | 0.000 | 52.31 | 81.72 | |||
| t de Dunnett (bilateral)a | Moderate | Low | 95.57 | 8.74 | 0.000 | 76.66 | 114.49 | |
| High | Low | 162.58 | 9.17 | 0.000 | 142.74 | 182.42 | ||
| CO | Bonferroni | Low | Moderate | -5.46 | 0.71 | 0.000 | -7.16 | -3.76 |
| High | -8.66 | 0.74 | 0.000 | -10.44 | -6.88 | |||
| Moderate | Low | 5.46 | 0.71 | 0.000 | 3.76 | 7.16 | ||
| High | -3.20 | 0.50 | 0.000 | -4.40 | -2.00 | |||
| High | Low | 8.66 | 0.74 | 0.000 | 6.88 | 10.44 | ||
| Moderate | 3.20 | 0.50 | 0.000 | 2.00 | 4.40 | |||
| t de Dunnett (bilateral)a | Moderate | Low | 5.46 | 0.71 | 0.000 | 3.93 | 6.99 | |
| High | Low | 8.66 | 0.74 | 0.000 | 7.05 | 10.27 | ||
| %COHb | Bonferroni | Low | Moderate | -0.89 | 0.10 | 0.000 | -1.14 | -0.64 |
| High | -1.40 | 0.11 | 0.000 | -1.66 | -1.13 | |||
| Moderate | Low | 0.89 | 0.10 | 0.000 | 0.64 | 1.14 | ||
| High | -0.51 | 0.07 | 0.000 | -0.68 | -0.33 | |||
| High | Low | 1.40 | 0.11 | 0.000 | 1.13 | 1.66 | ||
| Moderate | 0.51 | 0.07 | 0.000 | 0.33 | 0.68 | |||
| t de Dunnett (bilateral)a | Moderate | Low | 0.89 | 0.10 | 0.000 | 0.66 | 1.12 | |
| High | Low | 1.40 | 0.11 | 0.000 | 1.16 | 1.63 | ||
Disclaimer/Publisher’s Note: The statements, opinions and data contained in all publications are solely those of the individual author(s) and contributor(s) and not of MDPI and/or the editor(s). MDPI and/or the editor(s) disclaim responsibility for any injury to people or property resulting from any ideas, methods, instructions or products referred to in the content. |
© 2025 by the authors. Licensee MDPI, Basel, Switzerland. This article is an open access article distributed under the terms and conditions of the Creative Commons Attribution (CC BY) license (https://creativecommons.org/licenses/by/4.0/).
Copyright: This open access article is published under a Creative Commons CC BY 4.0 license, which permit the free download, distribution, and reuse, provided that the author and preprint are cited in any reuse.


