
Submitted:
25 April 2025
Posted:
28 April 2025
You are already at the latest version
Abstract
Although electronic cigarettes have been banned in Brazil since 2009, their use is increasing, particularly among youth. We conducted a biomarker-based study to profile exclusive e-cigarette users in São Paulo and examine associations with salivary nicotine and cotinine levels. Population-based, cross-sectional study conducted between April and September 2024 in six municipalities in São Paulo, Brazil. Random subjects who reported exclusive use of electronic cigarette completed a questionnaire and provided oral fluid samples for determination of nicotine and cotinine concentrations using LC-MS/MS. The cohort consisted of N=417 participants. Significant associations were found between nicotine and cotinine concentrations and variables such as knowledge of nicotine content and product type. Addiction status significantly influenced nicotine and cotinine concentrations, as well as smoking history, last consumption, recharge/purchase frequency, and consumption duration (all p<0.001). Participants who perceived moderate or severe addiction exhibited higher nicotine and cotinine concentrations compared to those without a perception of dependence (p<0.001). Most participants were young, predominantly White, highly educated and with elevated incomes. Findings revealed a correlation between perceived nicotine dependence and salivary nicotine and cotinine concentrations, underscoring the physiological and behavioral markers of electronic cigarette addiction. High salivary concentrations of nicotine appear to be independent of duration of e-cigarette use, smoking history, and age. These findings underscore the urgent need for surveillance and public health interventions, even in jurisdictions where these products remain illegal. Limitations include cross-sectional design and potential selection bias due to convenience sampling.
Keywords:
electronic cigarettes
; nicotine or derivatives
; toxicology
1. Introduction
The characterization of electronic cigarette (e-cigarette) users in São Paulo, Brazil, requires a comprehensive analysis of sociodemographic characteristics, usage patterns, motivations, and potential health impacts. In Brazil, the sale and marketing of e-cigarettes has been prohibited since 2009. Nevertheless, the use of these products continues to rise, especially among youth and young adults. This regulatory paradox highlights the urgent need to better understand e-cigarette use patterns and associated health risks in this unregulated market. Although commercialization of these products has been prohibited in the country since 2009 by the National Health Surveillance Agency (ANVISA, Ministry of Health, Brazil) [1], a perceived increase in consumption was observed following COVID-19 pandemics, particularly among young adults. This trend was captured by VIGITEL (Vigilância de Fatores de Risco e Proteção para Doenças Crônicas por Inquérito Telefônico [Surveillance of Risk and Protective Factors for Chronic Diseases by Telephone Survey]), an annual survey conducted since 2006 that includes all Brazilian states; prevalence of e-cigarette use increased from 2.3% in 2019 to 2.5% in 2020 [2]. In 2024, an increase in young adults seeking treatment for nicotine dependence at specialized smoking cessation centers in São Paulo was reported. The small sample, comprising 26 exclusive e-cigarette users, revealed that all participants reported a high level of nicotine dependence. This was evidenced by urinary cotinine levels of up to 600 ng/mL in semiquantitative tests, while carbon monoxide concentrations in exhaled air were below 3 ppm [3].
There is scant information on nicotine dependence in e-cigarette users not seeking smoking cessation treatment. Thus, study analyses on nicotine consumption biomarkers in e-cigarette users is essential for informing public health policies and intervention strategies aimed at curbing the use of such devices. The correlation between user characteristics and nicotine concentration, and that of its primary metabolite - cotinine, offers valuable insights into usage behaviors and associated health risks, including nicotine dependence and acute toxicity [4].
High cotinine concentrations are strongly associated with higher nicotine dependence and greater challenges regarding smoking cessation [5]. Furthermore, exceptionally high nicotine concentrations may indicate hazardous usage patterns or improper exposure, especially among young adults; this population is particularly vulnerable to addiction and frequently exhibits biochemical markers indicative of problematic use, even when self-reported consumption is described as “casual” [6].
The aim of this study was to characterize exclusive e-cigarette users in terms of user sociodemographic data, e-cigarette consumption patterns, perception of addiction and health risks, device accessibility, health and environmental impact, government regulations, attempts to quit vaping, future perspectives and social implications of e-cigarette use, and to correlate these variables with nicotine and cotinine concentrations in oral fluid samples.
2. Materials and Methods
2.1. Study Design and Procedures
This is a population-based, cross-sectional survey designed to characterize e-cigarette users in six different municipalities (São Paulo, Santo Andre, Campos do Jordão, Ribeirão Preto, Campinas, and Santos) in the state of São Paulo, Brazil. Participants aged 18 years and over reporting exclusive e-cigarette use were recruited from April to September 2024. Exclusion criteria included smoking of tobacco (to eliminate dual-users) and non-tobacco products (such as marijuana) and carbon monoxide concentration in exhaled air of 4 ppm or higher [7]. Consent for study participation was obtained by signing an Informed Consent Form approved by the Local Ethics Committee of the Hospital das Clínicas da Faculdade de Medicina da Universidade de São Paulo (Opinion #6.775.610). The data underlying this article are available in the article and in its online supplementary material.
Field data were collected in diverse public settings—including nightlife venues, gyms, universities, and workplaces—by trained health surveillance staff. Site selection was based on the official inspection schedule provided by the Health Surveillance Center of the State Department of Health of São Paulo. As such, these locations were already scheduled to receive technical inspections regardless of the research, which characterizes the sample as a random selection. This strategy was designed to reflect real-world exposure and access patterns among active e-cigarette users. Data collection included a self-administered questionnaire, measurement of carbon monoxide concentration in exhaled air, and oral fluid sample collection using Salivette [8] for determination of nicotine and cotinine concentration. Samples were kept at 4 °C during shipping to the Laboratory of Toxicology at the University of São Paulo Medical School, then frozen at −20 °C and thawed prior to analysis, carried out no more than 10 days after sampling to ensure analyte stability [9].
2.2. Questionnaire Information
Information gathered by the questionnaire included sociodemographic profile (gender, age, race, years spent on education, monthly earning income), weight, height—Mass Body Index (MBI), physical and mental health conditions, and smoking history (former smokers, naïve smokers). Regarding e-cigarette use, participants were inquired about how they were first introduced to the product (Introduction to e-cigarettes), the reasons for using it (Reasons for use), what type of device they use for vaping (Product type), for how long they have been using them (Consumption duration) and when they have last used it prior to the survey (Last consumption), where or how they usually acquire the device (Place of purchase), how frequently they recharge or buy it (Recharge/purchase frequency), as well as how much money they spend on it (Monthly expenses). Participants were also asked if they are aware of the presence of nicotine in their e-cigarettes (Knowledge of nicotine content), the form of nicotine present in the device (Nicotine form) and its concentration (Nicotine salt/free-base concentration). Information on participant perception regarding health impact (Perception of impact on health status), risks associated to consumption (Knowledge of risks) and exposure (Knowledge of passive exposure), perception of the intensity of nicotine dependence (Perception of addiction), and impact on social relations (Social impact) were also collected. At last, participants were questioned if they put themselves at risk in order to acquire e-cigarettes (Exposure to risk), if they have tried to stop using them (Attempts to quit vaping), whether they intend to continue using them (Future perspectives on e-cigarette use), and how they feel about the prohibition of e-cigarette commercialization in Brazil (Opinion on government regulations).
2.3. Nicotine and Cotinine Determination in Oral Fluid
Nicotine and cotinine were measured by liquid chromatography-tandem mass spectrometry (LC-MS/MS) [10]. For sample preparation, 100 µL of oral fluid were added to 400 µL of methanol plus cotinine-D3 Internal Standard (Cerilliant Corporation, Round Rock, TX, USA), with final concentration of 10 ng/mL. Samples were mixed for 30 seconds followed by centrifugation at 2000 g for 10 minutes. The supernatant was filtered using a 22-µm polytetrafluoroethylene hydrophobic membrane and 20 µL were injected into the LC-MS/MS system (Shimadzu Corporation, Kyoto, Japan) with quadrupoles operating in Multiple Reaction Monitoring mode. For separation of nicotine, cotinine and cotinine-D3, Shim-pack Velox Biphenyl (2.7 μm 2.1 × 100 mm) column was used (Shimadzu Corporation, Kyoto, Japan). Analyte concentration was calculated using calibrations curves ranging from 5 to 2000 ng/mL and 1 to 2000 ng/mL for nicotine and cotinine, respectively. To ensure reliability of results, dilution integrity was validated for 5000, 10000 and 15000 ng/mL.
2.4. Data Analysis and Statistics
Initially, descriptive analyses were conducted. Absolute and relative frequencies were presented for categorical variables, while summary measures (mean, quartiles, minimum, maximum, standard error, and standard deviation) were used for numerical variables.
Mean comparisons between groups were performed using the Kruskal-Wallis test, given that there was no normal distribution of data, verified using the Kolmogorov-Smirnov test. When significant differences in means were identified in the Kruskal-Wallis test, pairwise group comparisons were conducted using the Dunn-Bonferroni method to maintain global significance level. For categorical variables, p-values correspond to the descriptive levels of the Chi-Square test and Fisher’s exact test. For numerical variables, the Mann-Whitney test was used to compare non-normally distributed variables between groups, while the t-test was applied to normally distributed numerical variables.
To simultaneously assess the effects of demographics, clinical characteristics, and smoking history (explanatory variables) on each dependent variable (cotinine and nicotine), univariate and multivariate linear regression analyses were performed. Initially, all predictor variables were included in the model. Later, non-significant variables at 5% significance level were removed sequentially using the backward elimination method.
Missing data were addressed by excluding cases where specific information was unavailable, as the absence of data could compromise the analysis.
A 5% significance level was adopted for all statistical tests. Analyses were conducted using the statistical software packages SPSS 20.0 (IBM Corp, Armonk, NY, USA) and STATA 17 (StataCorp LLC, College Station, TX, USA).
3. Results
3.1. Screening
Initially, 9099 individuals were approached and the final cohort comprised N = 417. The selection process and applied exclusion criteria are detailed in Figure 1.
3.2. Sociodemographic Characteristics and Smoking History
Table 1 presents participant sociodemographic profile, physical characteristics, and health conditions according to smoking history.
No significant differences were observed between men and women, neither with respect to body mass index. The predominant population consisted of White participants under 25 years old, with high educational level and monthly earning income. Clinical conditions and mental disorders were reported by less than 32% of participants included in the analyses. Among participants affected by psychiatric disorders, anxiety was prevalent.
Based on smoking history, distinct distributions (p < 0.05) were observed for gender, age, and presence of asthma. Former smokers were mostly males, much older than naïve smokers, with a higher incidence of asthma.
3.3. E-cigarette Consumption and Biomarker Concentrations
Table 2 presents information on e-cigarette consumption pattern, product characteristics, purchase and expenses, and nicotine and cotinine concentrations according to smoking history.
Based on smoking history, distinct distributions (p < 0.05) were observed for the following parameters: Introduction to e-cigarette (self-interest), Reasons for use (out of curiosity, influence of friends and/or family, tobacco smoking cessation, alternative to traditional cigarettes), Consumption duration, Place of purchase (abroad), Recharge/purchase frequency, Monthly expenses, Nicotine form (Nicotine free-base), and nicotine and cotinine mean concentrations.
Higher proportions of former smokers (compared to naïve smokers) were introduced to e-cigarettes due to their own interest and research on the subject, and currently use the product to help in the smoking cessation treatment or as an alternative to traditional cigarettes; they purchase their devices abroad at a weekly basis, with monthly expenses up to BRL 500.00. Also, former smokers use more nicotine free-base products when compared to naïve smokers. Nicotine and cotinine mean concentrations are higher in former smokers than in naïve smokers.
Conversely, higher proportions of naïve smokers (compared to former smokers) use e-cigarettes out of curiosity or due to the influence of friends and/or family, and have been vaping for up to 1 year, with occasional recharges/purchases. Much more naïve smokers spend up to BRL 100.00 with e-cigarettes per month when compared to former smokers.
No statistical differences were observed between smoking history groups regarding type of e-cigarette device, time of last consumption, knowledge of nicotine content, and nicotine salt/free-base concentrations in the e-cigarettes.
3.4. Nicotine and Cotinine Concentrations in Oral Fluid
Nicotine and cotinine concentrations detected in the saliva of former smokers and naïve smokers are presented with respect to the time of e-cigarette last consumption (Figure 2) and e-cigarette recharge/purchase frequency (Figure 3).
In multivariate linear regression analyses, dependent variables (nicotine and cotinine concentrations) were evaluated according to sociodemographic data, participant characteristics, clinical and mental conditions, e-cigarette device features and use patterns (Tables S1 and S2, respectively).
Nicotine concentration was significantly influenced exclusively by the time of e-cigarette last consumption; nicotine mean concentrations in participants who used e-cigarettes within 30 minutes and 1 hour prior to the questionnaire application were significantly higher than those who had used e-cigarettes more than 48 hours before (Table S1), with no significant difference between groups (p = 0.274). Regarding cotinine concentration, variables that remained significant in the statistical model (p < 0.001) were last consumption, recharge/purchase frequency, and perception of addiction; participants who recharged/purchased their e-cigarettes daily, weekly, every two weeks, and monthly showed higher cotinine mean concentrations compared to those who did it occasionally, and participants who perceived mild, moderate, and severe addiction also showed higher cotinine mean concentrations compared to those who reported no addiction (Table S2), with no significant differences among addiction categories (p = 0.077).
Nicotine and cotinine concentrations in oral fluid were also evaluated according to participants’ knowledge of the nicotine content present in e-cigarettes, the forms of nicotine encountered, and their concentrations (Table S3). For both nicotine and cotinine, significant differences were observed for knowledge of nicotine content and nicotine form.
Nicotine and cotinine concentrations for participants reporting being unaware of the presence of nicotine in e-cigarettes were similar to those thinking e-cigarettes do not contain nicotine, both lower than those for participants completely aware of e-cigarette nicotine content (Table S3). Toxicological analysis showed that 55.2% of samples from participants who thought e-cigarettes do not contain nicotine (N = 29) had detectable concentrations of the substance. Moreover, nicotine and cotinine concentrations were higher for participants who reported using nicotine salt e-cigarettes compared to those reporting nicotine free-base and nicotine-free e-cigarettes, as well as those who were unsure about nicotine content. These lower concentrations groups exhibited similar mean concentrations (Table S3).
3.5. Participants’ Perception of Nicotine Addiction
Table 3 presents sociodemographic data, participant characteristics, clinical and smoking history, e-cigarette use patterns, and nicotine and cotinine concentrations according to participants’ perception of addiction.
Significant differences (p < 0.005) were observed for smoking history, consumption duration, recharge/purchase frequency, last consumption, and nicotine and cotinine mean concentrations. No statistical differences were observed with respect to gender, age, age range, body mass index, and presence of anxiety or depression.
In the group of participants who perceived no nicotine addiction, nicotine and cotinine mean concentrations were lower. In the moderate and severe addiction groups, there were higher proportions of former smokers, participants who last consumed e-cigarettes recently, and those who have been vaping for over 4 years, when compared to participants with no perception of addiction. In the severe addiction group, daily e-cigarette recharge/purchase frequency was more prevalent when compared to the group with no perception.
3.6. Subgroup Analysis of E-Cigarette Users with Nicotine Concentrations Above 400 ng/mL
Sociodemographic data, smoking history, e-cigarette use patterns, perception of addiction, and cotinine concentrations were evaluated in a subgroup of e-cigarette users with nicotine concentrations of 400 ng/mL or higher (Table S4), which corresponds to nicotine levels typically found in individuals who smoke over 20 cigarettes per day.
Among 376 participants with measurable nicotine concentrations, 49 exhibited levels exceeding 400 ng/mL, with significantly higher prevalence of devices based on nicotine salts, leading to significantly higher cotinine levels. Of these 49 participants, 15 showed nicotine levels above 1000 ng/mL; the highest level registered was 4557 ng/mL, and mean levels were 2400 ng/mL, which is six times the threshold of 400 ng/mL.
3.7. Participant Perception of Health and Social Impact, Addiction, Associated Risks, Attempts to Quit Vaping, Future Perspectives, and Government Regulations
Participants’ perception of impact on health status and social interactions, knowledge of risks and environmental consequences, perception of nicotine addiction, exposure to risk, attempts to quit vaping, future perspectives on e-cigarette use, and opinion on government regulations were evaluated according to smoking history (Table S5).
Distinct distributions were observed for perception of impact on health status, knowledge of risks, perception of addiction, and opinion on government regulations with respect to smoking history. In the former smoker group, higher proportions were observed for perceived health improvement. Conversely, in the naïve smoker group, there were higher proportions of no change in health impact. However, almost 25% of participants in both groups were capable of perceiving health deterioration.
Former smokers showed some knowledge of the risks involved in vaping, and perception of moderate and severe addiction compared to naïve smokers. A higher proportion of former smokers (compared to naïve smokers) disagree with current regulations and believe regulated commercialization of e-cigarettes should be authorized by the government. Naïve smokers showed no perception of nicotine addiction and uncertainty about current regulations when compared to former smokers.
No significant differences were observed between groups for the remaining variables (knowledge of environmental consequences, exposure to risk, social impact, attempts to quit vaping, and future perspectives on e-cigarette use).
4. Discussion
Although there has been an increase in e-cigarette use among Brazilian young adults following COVID-19 pandemics, data from national surveys [2] indicate that prevalence of e-cigarette use in the country has fluctuated between 2019 and 2023 [2]; it prevalence rose to 2.5% in 2020 and then stabilized at 2.1% by 2023 [2]. Such behavior is likely attributable to extensive public debate on the issue, particularly following discussions regarding the application of ANVISA’s Resolution of Collegiate Board of Directors (RDC) #46/2009, which prohibited the commercialization of e-cigarettes in Brazil [1]. In 2024, RDC #855/2024 [11] was published, and it maintains the prohibition on manufacturing, importation, commercialization, distribution, storage, transportation, and advertising of all electronic smoking devices. Consequently, all forms of importation are banned, including for personal use and in travelers’ hand luggage. This decision was strongly supported by Brazilian medical societies, including the Brazilian Society of Cardiology, which issued a position statement advocating for maintenance of the ban [12]. One of the 10 justifications in this statement was the comparison of prevalence rates between countries where e-cigarettes are permitted and where they are prohibited [13].
Our research brings knowledge about the profile of e-cigarette users in the state of São Paulo, revealing that these individuals tend to be young adults with middle to upper-class background, with access to education and high earning incomes. As such, they are less likely to rely on the Brazilian public healthcare system in Brazil [14] for treatment of nicotine dependence or related clinical complications. This suggests that e-cigarettes use in this population imposes a lower direct burden on the public health system compared to other regions or socioeconomic groups with more limited access to private healthcare.
Additionally, approximately 61.8% of users are either completely unaware or have limited knowledge regarding the nicotine content of the products. Alarmingly, among participants who claimed to know that the product did not contain nicotine, 55% were found to have measurable concentrations of nicotine and cotinine (Table S3). These findings highlight the critical role of product composition and user awareness in determining e-cigarette biomarker concentrations.
Some authors argue that, at most, the use of e-cigarettes by experienced users might be equivalent to the consumption of a pack of cigarettes [15]. However, our real-world study reveals alarming findings. Nicotine concentrations among e-cigarette users have reached unprecedented levels compared to those of conventional cigarette smokers. Approximately 13% (N = 49) of users exhibited nicotine levels exceeding 400 ng/mL, with 15 individuals recording concentrations above 1000 ng/mL. In this subset of individuals with extreme nicotine exposure, average nicotine concentration was six times higher than 400 ng/mL, that is typically observed in heavy conventional smokers [16]. Interestingly, in this subgroup, there was no linear relationship with cotinine concentration, which was significantly higher than in participants with nicotine levels below 400 ng/mL, although not in the same proportion. Cotinine, the primary metabolite of nicotine, serves as a robust and reliable biomarker for nicotine exposure. Approximately 75–80% of nicotine is metabolized into cotinine [17] and its stability in biological fluids makes it an essential tool for evaluating nicotine consumption. Previous studies have demonstrated that cotinine concentrations in e-cigarette users are often comparable to those in traditional cigarette smokers, indicating significant nicotine exposure from vaping [18,19,20,21]. However, none of these studies simultaneously evaluated nicotine and cotinine levels in e-cigarette users.
We understand that this condition of extremely high nicotine levels, as well as cotinine levels, although not in the same proportion, may be attributed to the type of nicotine most used, such as nicotine salts. The dynamics of nicotine and cotinine in vapers using nicotine salt formulations have garnered significant scientific interest due to the distinctive pharmacokinetic properties of nicotine salts compared to traditional free-base nicotine. Nicotine salts, commonly found in pod-based e-cigarettes, particularly disposable devices, offer a smoother inhalation experience and enable the delivery of higher nicotine concentrations without the harsh throat irritation associated with higher pH of nicotine free-base formulations [22]. This may also occur in users who have never smoked before or have only recently started using the product occasionally and, therefore, lack an adjusted capacity for nicotine metabolism.
These findings emphasize the risks associated with electronic nicotine delivery systems, particularly those using nicotine salts [23]. High nicotine concentrations not only increase the potential for addiction [24] but also raise serious concerns about toxicological impact at such elevated doses [19].
These levels surpass those typically reported in conventional tobacco users, reinforcing the urgent need for international attention to nicotine salts and their use in unregulated markets [4].
Moreover, studies indicate that vapers often self-regulate nicotine intake, maintaining stable salivary cotinine levels even when reducing nicotine concentration in e-liquids [25]. This behavior suggests that users adjust their vaping patterns to achieve a consistent nicotine intake, highlighting the adaptability of consumption patterns. Variability in nicotine and cotinine levels can be attributed to factors such as e-liquid nicotine concentration, frequency of vaping, device type, and individual metabolic differences [26].
In adolescents, cotinine concentrations among e-cigarette users have been reported to exceed those observed in conventional cigarette smokers, raising serious concerns about nicotine dependence and associated health risks [27].
In summary, vapers using nicotine salt formulations are exposed to high levels of nicotine, which is reflected in nicotine and cotinine levels. The ability to self-titrate nicotine intake, combined with the pharmacokinetic advantages of nicotine salts, results in significant nicotine exposure that parallels or exceeds that of traditional cigarette smoking. This underscores the need for continued research into vaping health implications, particularly among vulnerable populations such as adolescents.
Nicotine and cotinine concentrations are dependable on: a) device type—advanced devices (such as mods or pods) allow greater control over temperature and power, leading to increased nicotine absorption (Table S3); b) e-liquid nicotine levels—liquids with high nicotine concentrations (including nicotine salts) are associated with higher salivary nicotine levels; c) Time of last consumption—nicotine levels drop quickly within hours (half-life of 2 hours), whereas cotinine, with a longer half-life (16–20 hours), remains detectable for a longer period; d) recharge/purchase frequency for disposable devices—frequent users tend to have higher levels of nicotine and cotinine in their saliva, and also, refer higher degrees of nicotine dependence; and e) perception of nicotine addiction—dependence was significantly related with nicotine and cotinine concentrations (Table 3).
Study Limitations
Our study could be affected by selection bias due to convenience sampling. Participants were limited to adults aged ≥18 years, which excludes a critical population of e-cigarette users, particularly among adolescents at middle school and high school. Inclusion criteria included exclusive e-cigarette users who were former smokers and quit smoking at least 1 month prior to the study; smoking cessation was confirmed through carbon monoxide concentration in exhaled air, and those with 4 ppm or higher were excluded. Passive smoking exposure was not evaluated. Marijuana consumption in electronic smoking devices was excluded based solely on self-reports, whereas smoked marijuana was captured through measurement of carbon monoxide concentration in exhaled air. At last, 41 samples were lost due to insufficient oral fluid volume, and retesting was not possible.
5. Conclusions
Most e-cigarette users in the study population sample in the state of São Paulo, Brazil, belong to middle or upper classes, are predominantly White, with access to education and high earning incomes.
Salivary nicotine and cotinine levels have proven to be robust and non-invasive biomarkers for assessing smoking status and nicotine dependence. These biomarkers are critical in both clinical and epidemiological research, providing reliable measures for monitoring nicotine exposure and its associated health impacts.
Disposable devices containing nicotine salts were the most commonly used products among participants. A strong correlation was observed between perceived level of nicotine dependence and salivary concentrations of nicotine and cotinine. Higher perceived dependence was associated with elevated biomarker levels, as well as higher rates of moderate to severe addiction, particularly among individuals with longer durations of use.
High salivary concentrations of nicotine appear to be independent of duration of e-cigarette use, smoking history, and age. This highlights the significant risks of nicotine intoxication, even for younger individuals or first-time users.
These findings underscore the urgent need for public health initiatives to address the accessibility of these devices and to raise awareness about the rapid onset of nicotine dependence and its potential links to mental health disorders. These results offer strong empirical support for ANVISA’s continued prohibition of e-cigarettes, and highlight the need for enhanced enforcement and public awareness campaigns to curb widespread illicit access.
Supplementary Materials
The following supporting information can be downloaded at the website of this paper posted on Preprints.org, Table S1: Results for multivariate linear regression for nicotine analysis; Table S2: Results for multivariate linear regression for cotinine analysis; Table S3: Nicotine and cotinine concentrations in oral fluid according to devices characteristics products and about nicotine; Table S4: Sociodemographic data, smoking history, e-cig use patterns, perception of addiction, and cotinine concentrations according to nicotine concentrations; Table S5: Participants’ perception of health and social impact, knowledge of risks and environmental consequences, perception of addiction, exposure to risk, attempts to quit vaping, future perspectives on e-cigarette use, and opinion on government regulations according to smoking history.
Author Contributions
J.R.S., conceptualized the study and conducted the statistical analyses. E.C.D’A. and M.C.M. coordinated and supervised data collection. J.T. and D.M.S. were responsible for receiving and organizing the collected samples and toxicological results, in addition to contributing to the manuscript writing. J.M.C.-M. contributed to the interpretation of results, manuscript writing and revision. V.L., Head of the Laboratory of Toxicology, provided expertise in toxicological analysis, which were performed by M.F.d.S. and R.A.O. G.V.M., E.N.L., D.F.L.R. and S.D.V.Z. helped with data organization and performed data input. All authors participated in the manuscript review.
Funding
This research received no external funding.
Institutional Review Board Statement
The study was conducted in accordance with the Declaration of Helsinki, and approved by the Ethics Committee of the Hospital das Clínicas da Faculdade de Medicina da Universidade de São Paulo (Opinion #6.775.610; date of approval: 19 April 2024).
Informed Consent Statement
Informed consent was obtained from all subjects involved in the study.
Data Availability Statement
The original contributions presented in this study are included in the article/supplementary material. Further inquiries can be directed to the corresponding author(s).
Acknowledgments
The authors express their sincere gratitude to the technicians from the Health Surveillance Center of the State Department of Health of São Paulo, for their dedication and commitment in conducting the field data collection, which was essential for the success of this study. We also extend our appreciation to Mônica Andreis, Mariana Pinho, and Juliana Waetge from ACT Promoção da Saúde for their invaluable support to the Laboratory of Toxicology of the Rede PREMIUM de Equipamentos Multiusuários at Faculdade de Medicina da Universidade de São Paulo (LIM-40). Their contributions significantly enhanced the development and execution of this research.
Conflicts of Interest
The authors declare no conflicts of interest.
Abbreviations
The following abbreviations are used in this manuscript:
| LC-MS/MS | Liquid Chromatography-tandem Mass Spectrometry |
| ANVISA | National Health Surveillance Agency |
| VIGITEL | Surveillance of Risk and Protective Factors for Chronic Diseases by Telephone Survey |
| MBI | Mass Body Index |
References
- Resolução Diretoria Colegiada da Agência Nacional de Vigilância Sanitária do (ANVISA) Ministério da Saúde do Brasil. RDC Resolução-RDC n. 46/2009, de 28 de agosto de 2009. Proíbe a comercialização, a importação e a propaganda de quaisquer dispositivos eletrônicos para fumar, conhecidos como cigarro eletrônico. Brasília, 2009. Acessado 12 jan/2025 www://pesquisa.in.gov.br/imprensa/jsp/visualiza/index.jsp?data=31/08/2009&jornal=1&pagina=45&totalArquivos=120.
- Brasil. Ministério da Saúde. Secretaria de Vigilância em Saúde e Ambiente. Departamento de Análise Epidemiológica e Vigilância de Doenças Não Transmissíveis. Vigitel Brasil 2006-2023 : tabagismo e consumo abusivo de álcool:– Brasília: Ministério da Saúde, 2023. 70 p.: il. Acessado 12 jan 2024: www: http://bvsms.saude.gov.br/bvs/publicacoes/vigitel_tabagismo_consumo_abusivo_alcool.pdf ISBN 978-65-5993-525-3 1. Doença crônica. 2. Fatores de risco. 3. Vigilância sanitária de serviços de saúde. I. Título.
- Scholz JR; Valente GV; Hashimoto A; Marques G; Nagamine E; Abe TMO. Cotinine Urinary level in Eletronic Cigarettes Ysers. Serie cases in São Paulo= Brazil. SRNT 2024, March 22. POS3-40, pg 202.
- Kim S. Overview of Cotinine Cutoff Values for Smoking Status Classification. Int J Environ Res Public Health. 2016 Dec 14;13(12):1236. PMID: 27983665; PMCID: PMC5201377. [CrossRef]
- Fu, Marcela; Martínez-Sánchez, Jose M; Agudo, Antonib,d; Pascual, José AFG; Ariza, Carlesh,I; Moncada, Albertj; Fernández, Estevea. The DCOT Study Investigators. Nicotine dependence and salivary cotinine concentration in daily smokers. European Journal of Cancer Prevention 21(1):p 96-102, January 2012. |. [CrossRef]
- John P. Pierce, Eric C. Leas, David R. Strong; Biochemical Validation of Dependence on JUUL and Other E-Cigarettes Among Youth. Pediatrics April 2023; 151 (4): e2022059158. [CrossRef]
- Issa JS, Abe TMO, Pereira AC, et al. The effect of São Paulo’s smoke-free legislation on carbon monoxide concentration in hospitality venues and their workers. Tobacco Control 2011;20:156-162. [CrossRef]
- Salivate SARSTEDT AG & Co. Available: https://www.sarstedt.com/en/products/diagnostic/salivasputum/product/51.1534/ ???
- Stability of Varenicline Concentration in Saliva Over 21 Days at Three Storage Temperatures Maria Novalen, Meghan J. Chenoweth, Bin Zhao, Larry W. Hawk Jr., Rachel F. Tyndale. Nicotine & Tobacco Research, 2022, 270–274.
- American Academy of Forensic Sciences. Available: https://www.aafs.org/sites/default/files/media/documents/036_Std_e1.pdf.
- Resolução Diretoria Colegiada da Agência Nacional de Vigilância Sanitária do (ANVISA) Ministério da Saúde do Brasil. RDC Resolução-RDC n. 855/2024, de 23 de abril de 2024. Proíbe a fabricação, a importação, a comercialização, a distribuição, o armazenamento, o transporte e a propaganda de dispositivos eletrônicos. Acessado 12 jan 2025. Available: https://www.in.gov.br/en/web/dou/-/resolucao-da-diretoria-colegiada-rdc-n-855-de-23-de-abril-de-2024-555721206.
- Scholz, J. R., Malta, D. C., Fagundes Júnior, A. A. P., Pavanello, R., Bredt Júnior, G. L., & Rocha, M. S. (2024). Brazilian Society of Cardiology Position Statement on the Use of Electronic Nicotine Delivery Systems – 2024. Arq. Bras. Cardiol., 121(2), e20240063.
- Sreeramareddy, C.T., Acharya, K. & Manoharan, A. Electronic cigarettes use and ‘dual use’ among the youth in 75 countries: estimates from Global Youth Tobacco Surveys (2014–2019). Sci Rep 12, 20967 (2022). [CrossRef]
- Brasil. Ministério da Saúde. Portaria Nº 2.436, de 21 de setembro de 2017. Aprova a Política Nacional de Atenção Básica, estabelecendo a revisão de diretrizes para a organização da Atenção Básica, no âmbito do Sistema Único de Saúde (SUS). [Acessed in 2025 jan. 20]. Available at: https://bvsms.saude.gov.br/bvs/saudelegis/gm/2017/prt2436_22_09_2017.html.
- Prochaska, J., Vogel, E., Benowitz, N. (2021). Nicotine delivery and cigarette equivalents from vaping a JUULpod. Tobacco Control, 31, e88–e93. [CrossRef]
- O’Connor RJ, Giovino GA, Kozlowski LT, et al. Changes in nicotine intake and cigarette use over time in two nationally representative cross-sectional samples of smokers. Am J Epidemiol. 2006;164(8):750-759. [CrossRef]
- Yildiz, Deniz. “Nicotine, its metabolism and an overview of its biological effects.” Toxicon 43.6 (2004): 619-632. [CrossRef]
- Schroeder MJ, Hoffman AC. Electronic cigarettes and nicotine clinical pharmacology Tobacco Control 2014;23:ii30-ii35.
- Göney, G., Cok, I., Tamer, U., Burgaz, S., Şengezer, T. (2016). Urinary cotinine levels of electronic cigarette (e-cigarette) users. Toxicology Mechanisms and Methods, 26, 441–445. [CrossRef]
- Etter, J. (2016). A longitudinal study of cotinine in long-term daily users of e-cigarettes. Drug and alcohol dependence, 160, 218-21. [CrossRef]
- Marsot, A., & Simon, N. (2016). Nicotine and Cotinine Levels With Electronic Cigarette. International Journal of Toxicology, 35, 179–185. [CrossRef]
- Bowen A, Xing C. Nicotine salt formulations for aerosol devices and methods thereof. San Francisco, CA: Pax Labs, Inc, 2015. https://patents.google.com/patent/US9215895B2/e.
- Jackler, R., & Ramamurthi, D. (2019). Nicotine arms race: JUUL and the high-nicotine product market. Tobacco Control, 28, 623–628. [CrossRef]
- Zhang H, Han S, Fan L, et al. The Difference of Addictive Behavior of Free-Base Nicotine and Nicotine Salts in Mice Base on an Aerosol Self-Administration Model. Nicotine Tob Res. 2024;26(12):1626-1635. [CrossRef]
- Soar, K., Kimber, C., McRobbie, H.J., & Dawkins, L. (2019). Nicotine absorption from e-cigarettes over 12 months. Addictive behaviors, 91, 102-105. [CrossRef]
- Wong, L., Salim, S., Alias, H., Aghamohammadi, N., Hoe, V., Isahak, M., Mohd, A. (2020). The Association Between E-Cigarette Use Behaviors and Saliva Cotinine Concentration Among Healthy E-Cigarette Users in Malaysia. Journal of Addictions Nursing. [CrossRef]
- Dai, H.D., Michaud, T.L., Guenzel, N., Morgan, M., & Cohen, S.M. (2024). Biomarker Assessment of Nicotine Exposure Among Adolescent E-Cigarette Users: 2018-2019. Pediatrics. [CrossRef]
Figure 1.
Flowchart depicting participant selection and the corresponding exclusion criteria applied at each stage of data collection.
Figure 1.
Flowchart depicting participant selection and the corresponding exclusion criteria applied at each stage of data collection.
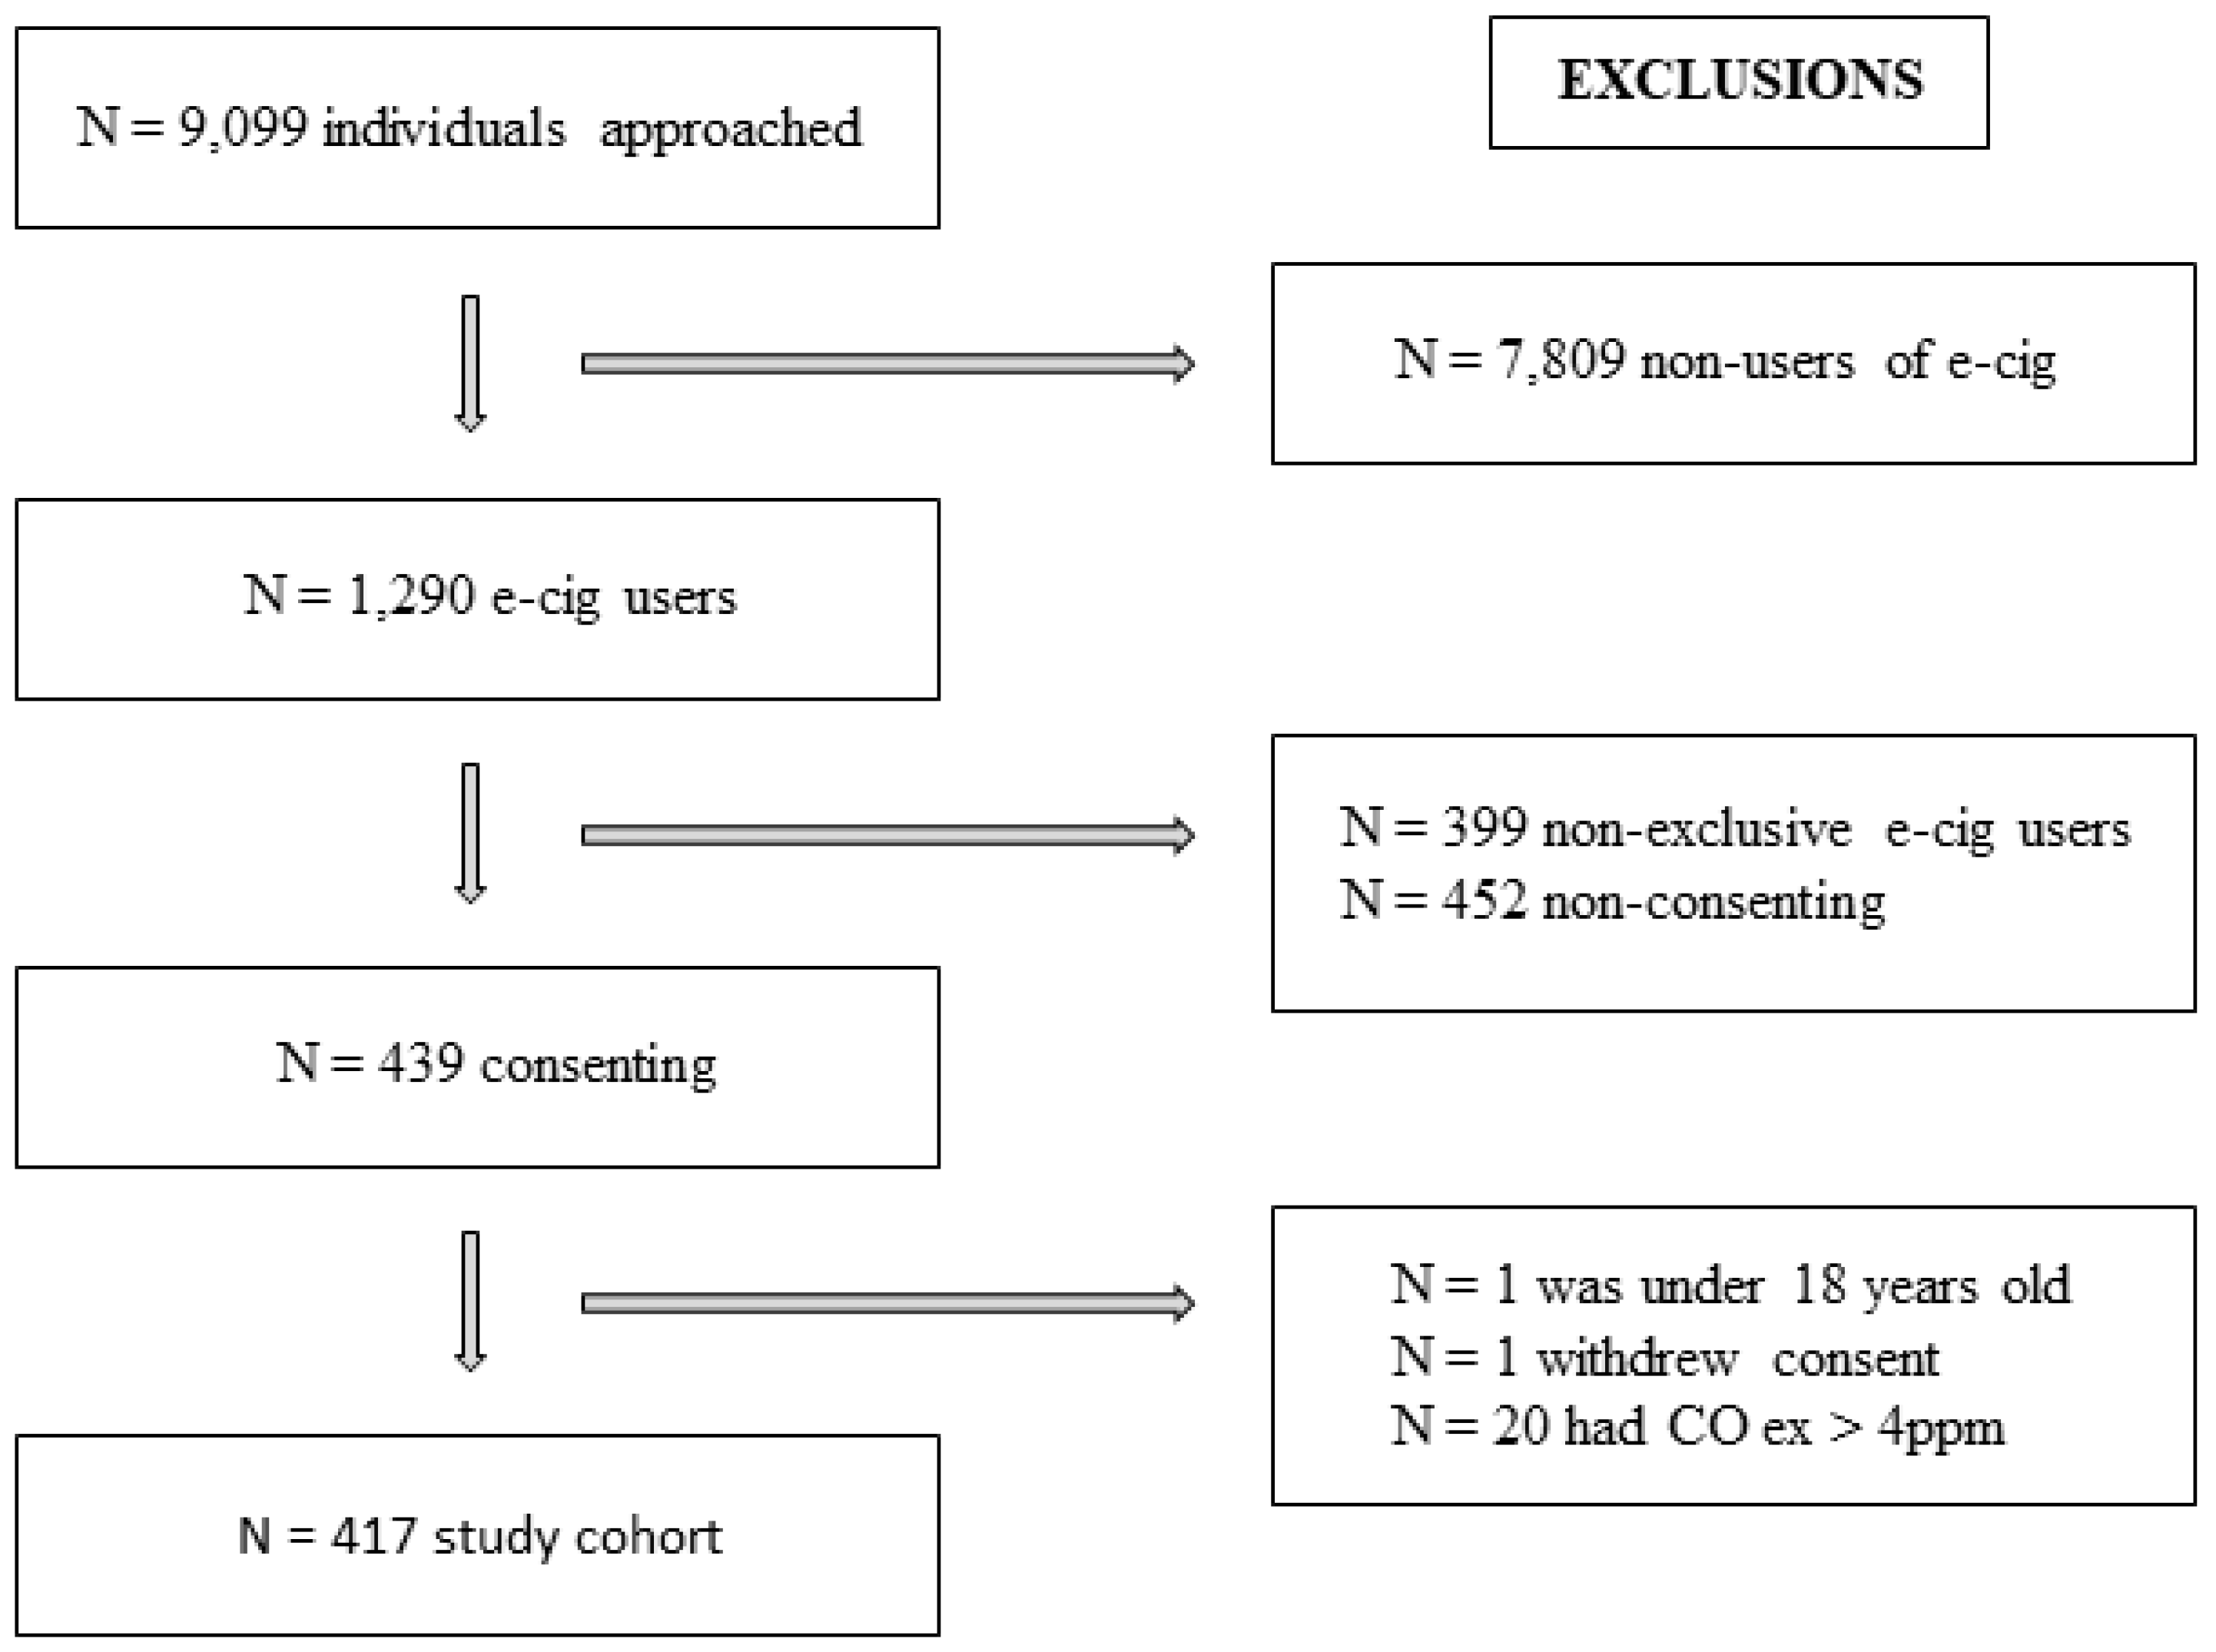
Figure 2.
Dot plot for nicotine and cotinine concentrations with respect to time of last consumption of e-cigarettes in former smokers and naïve smokers. Data are presented as mean ± standard deviation.
Figure 2.
Dot plot for nicotine and cotinine concentrations with respect to time of last consumption of e-cigarettes in former smokers and naïve smokers. Data are presented as mean ± standard deviation.
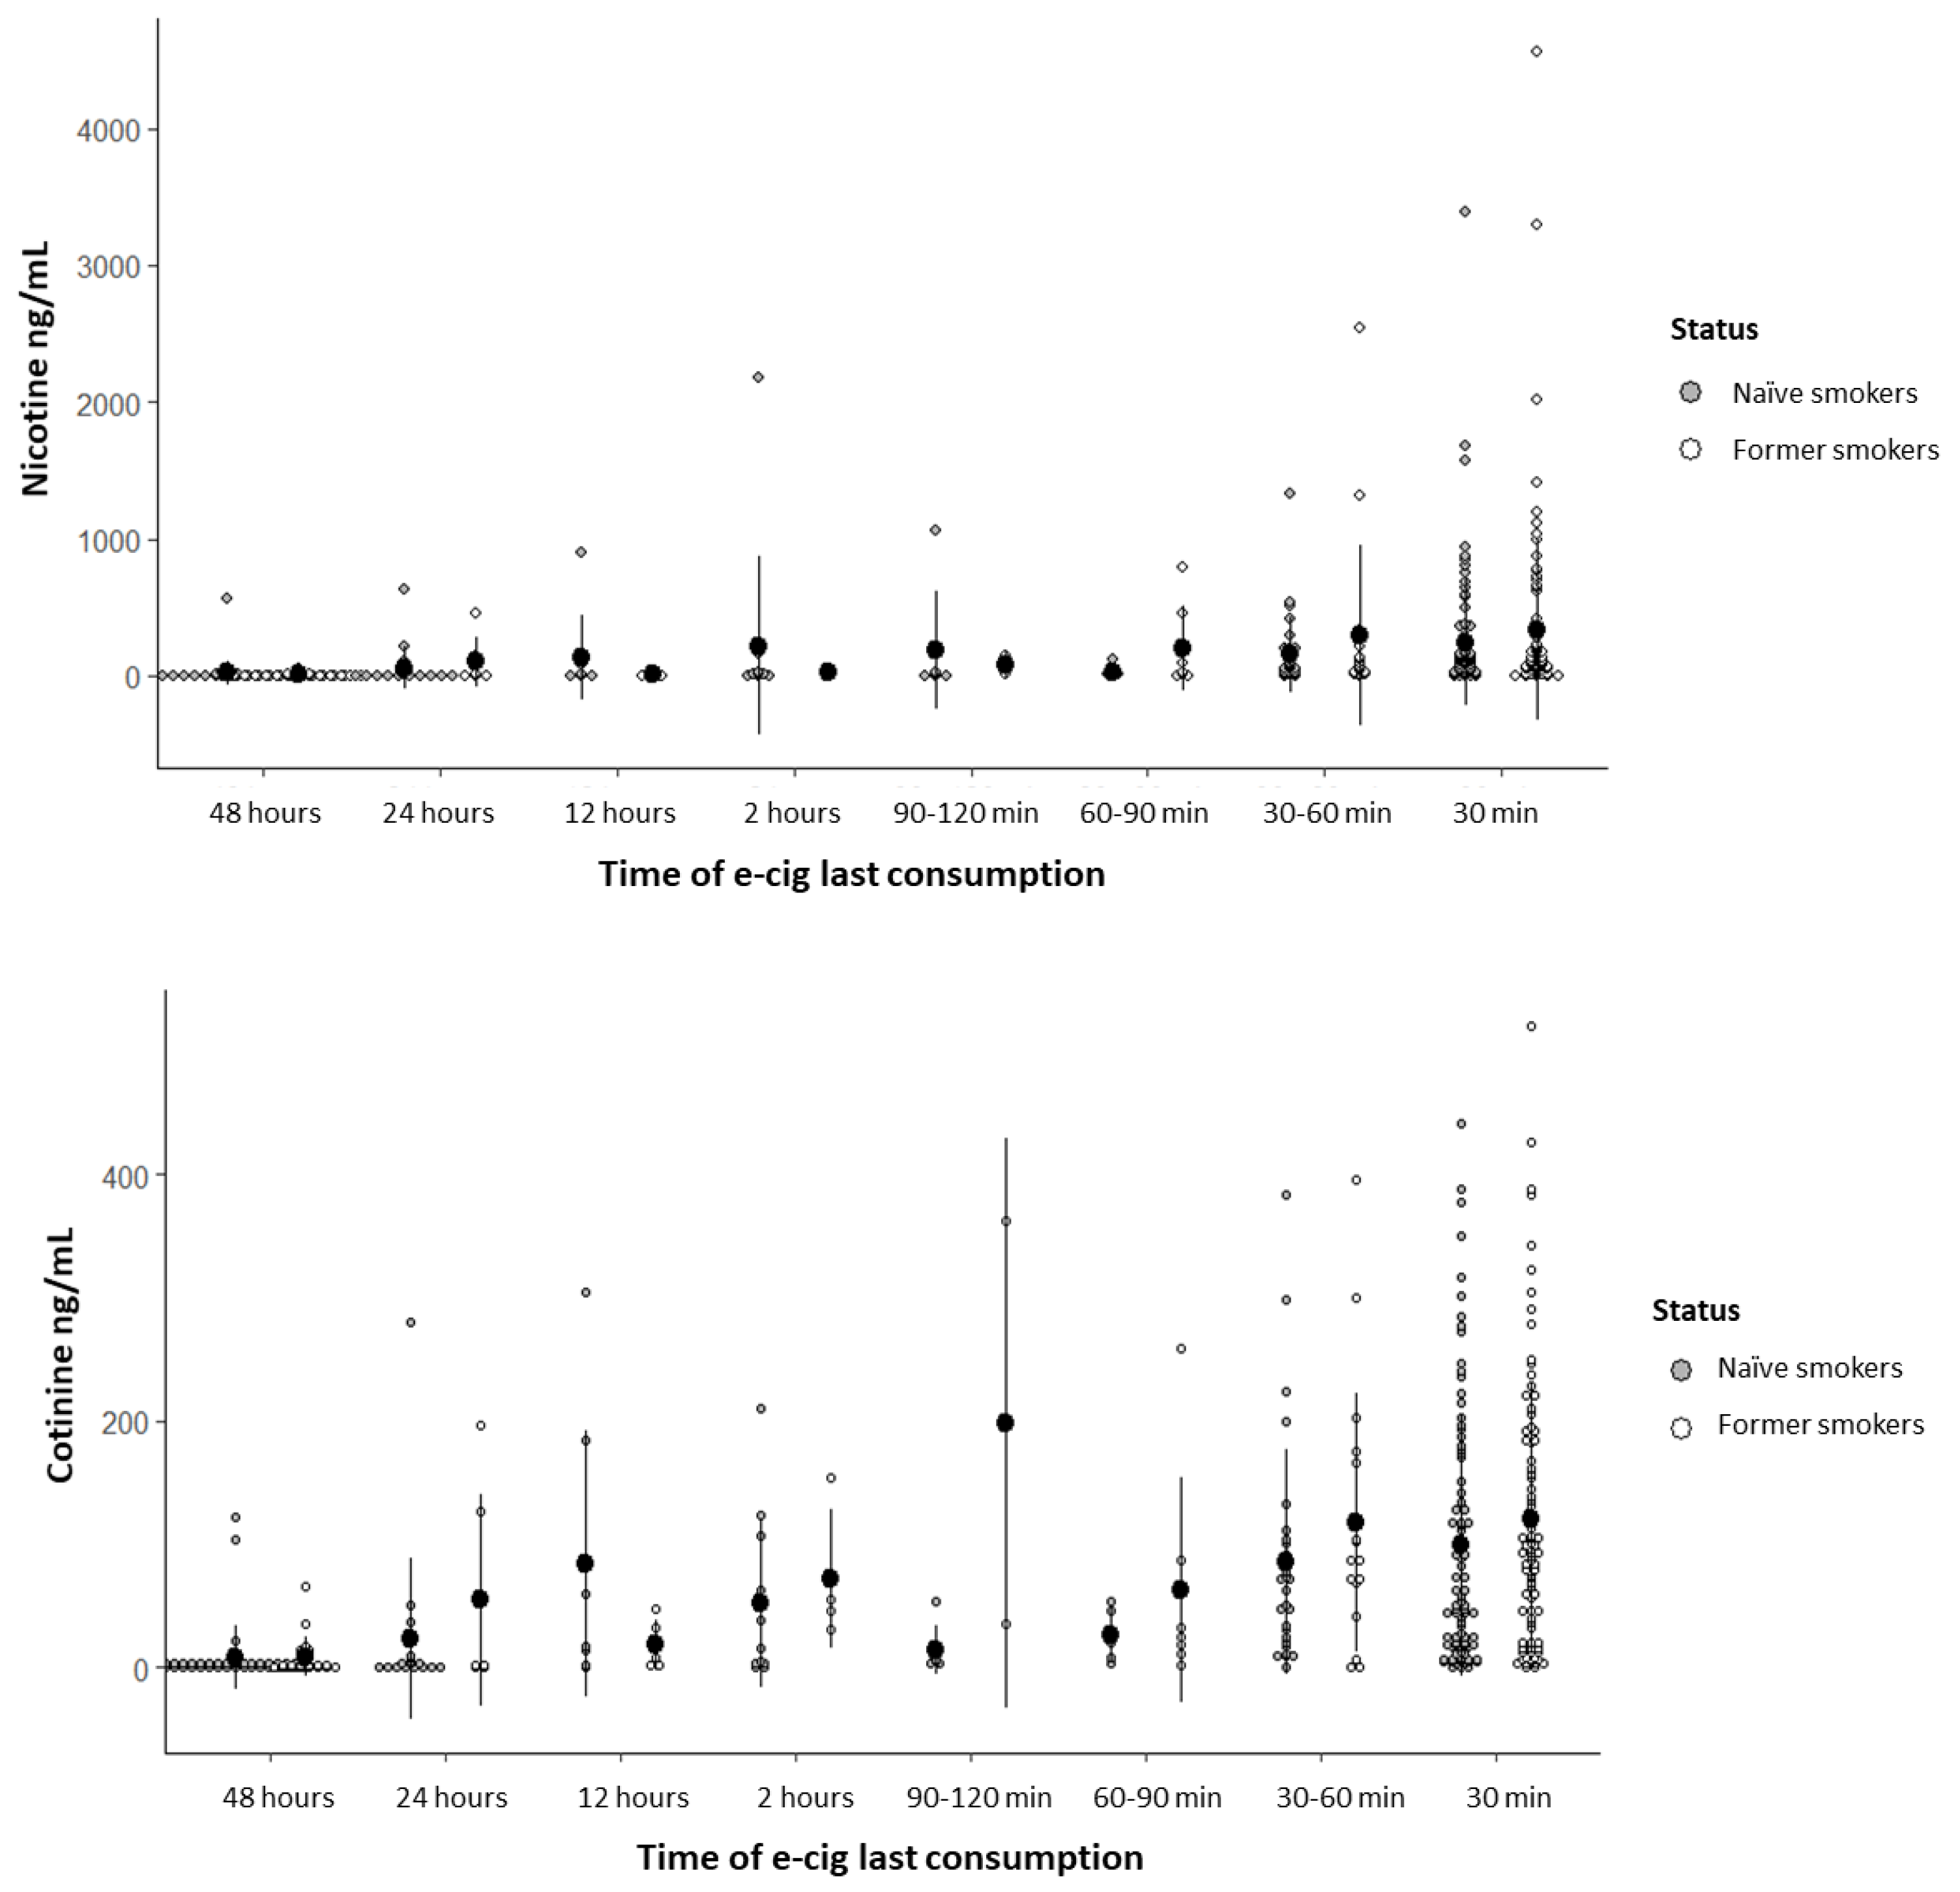
Figure 3.
Dot plot for nicotine and cotinine concentrations with respect to e-cigarettes recharge/ purchase frequency in former smokers and naïve smokers. Data are presented as mean ± standard deviation.
Figure 3.
Dot plot for nicotine and cotinine concentrations with respect to e-cigarettes recharge/ purchase frequency in former smokers and naïve smokers. Data are presented as mean ± standard deviation.
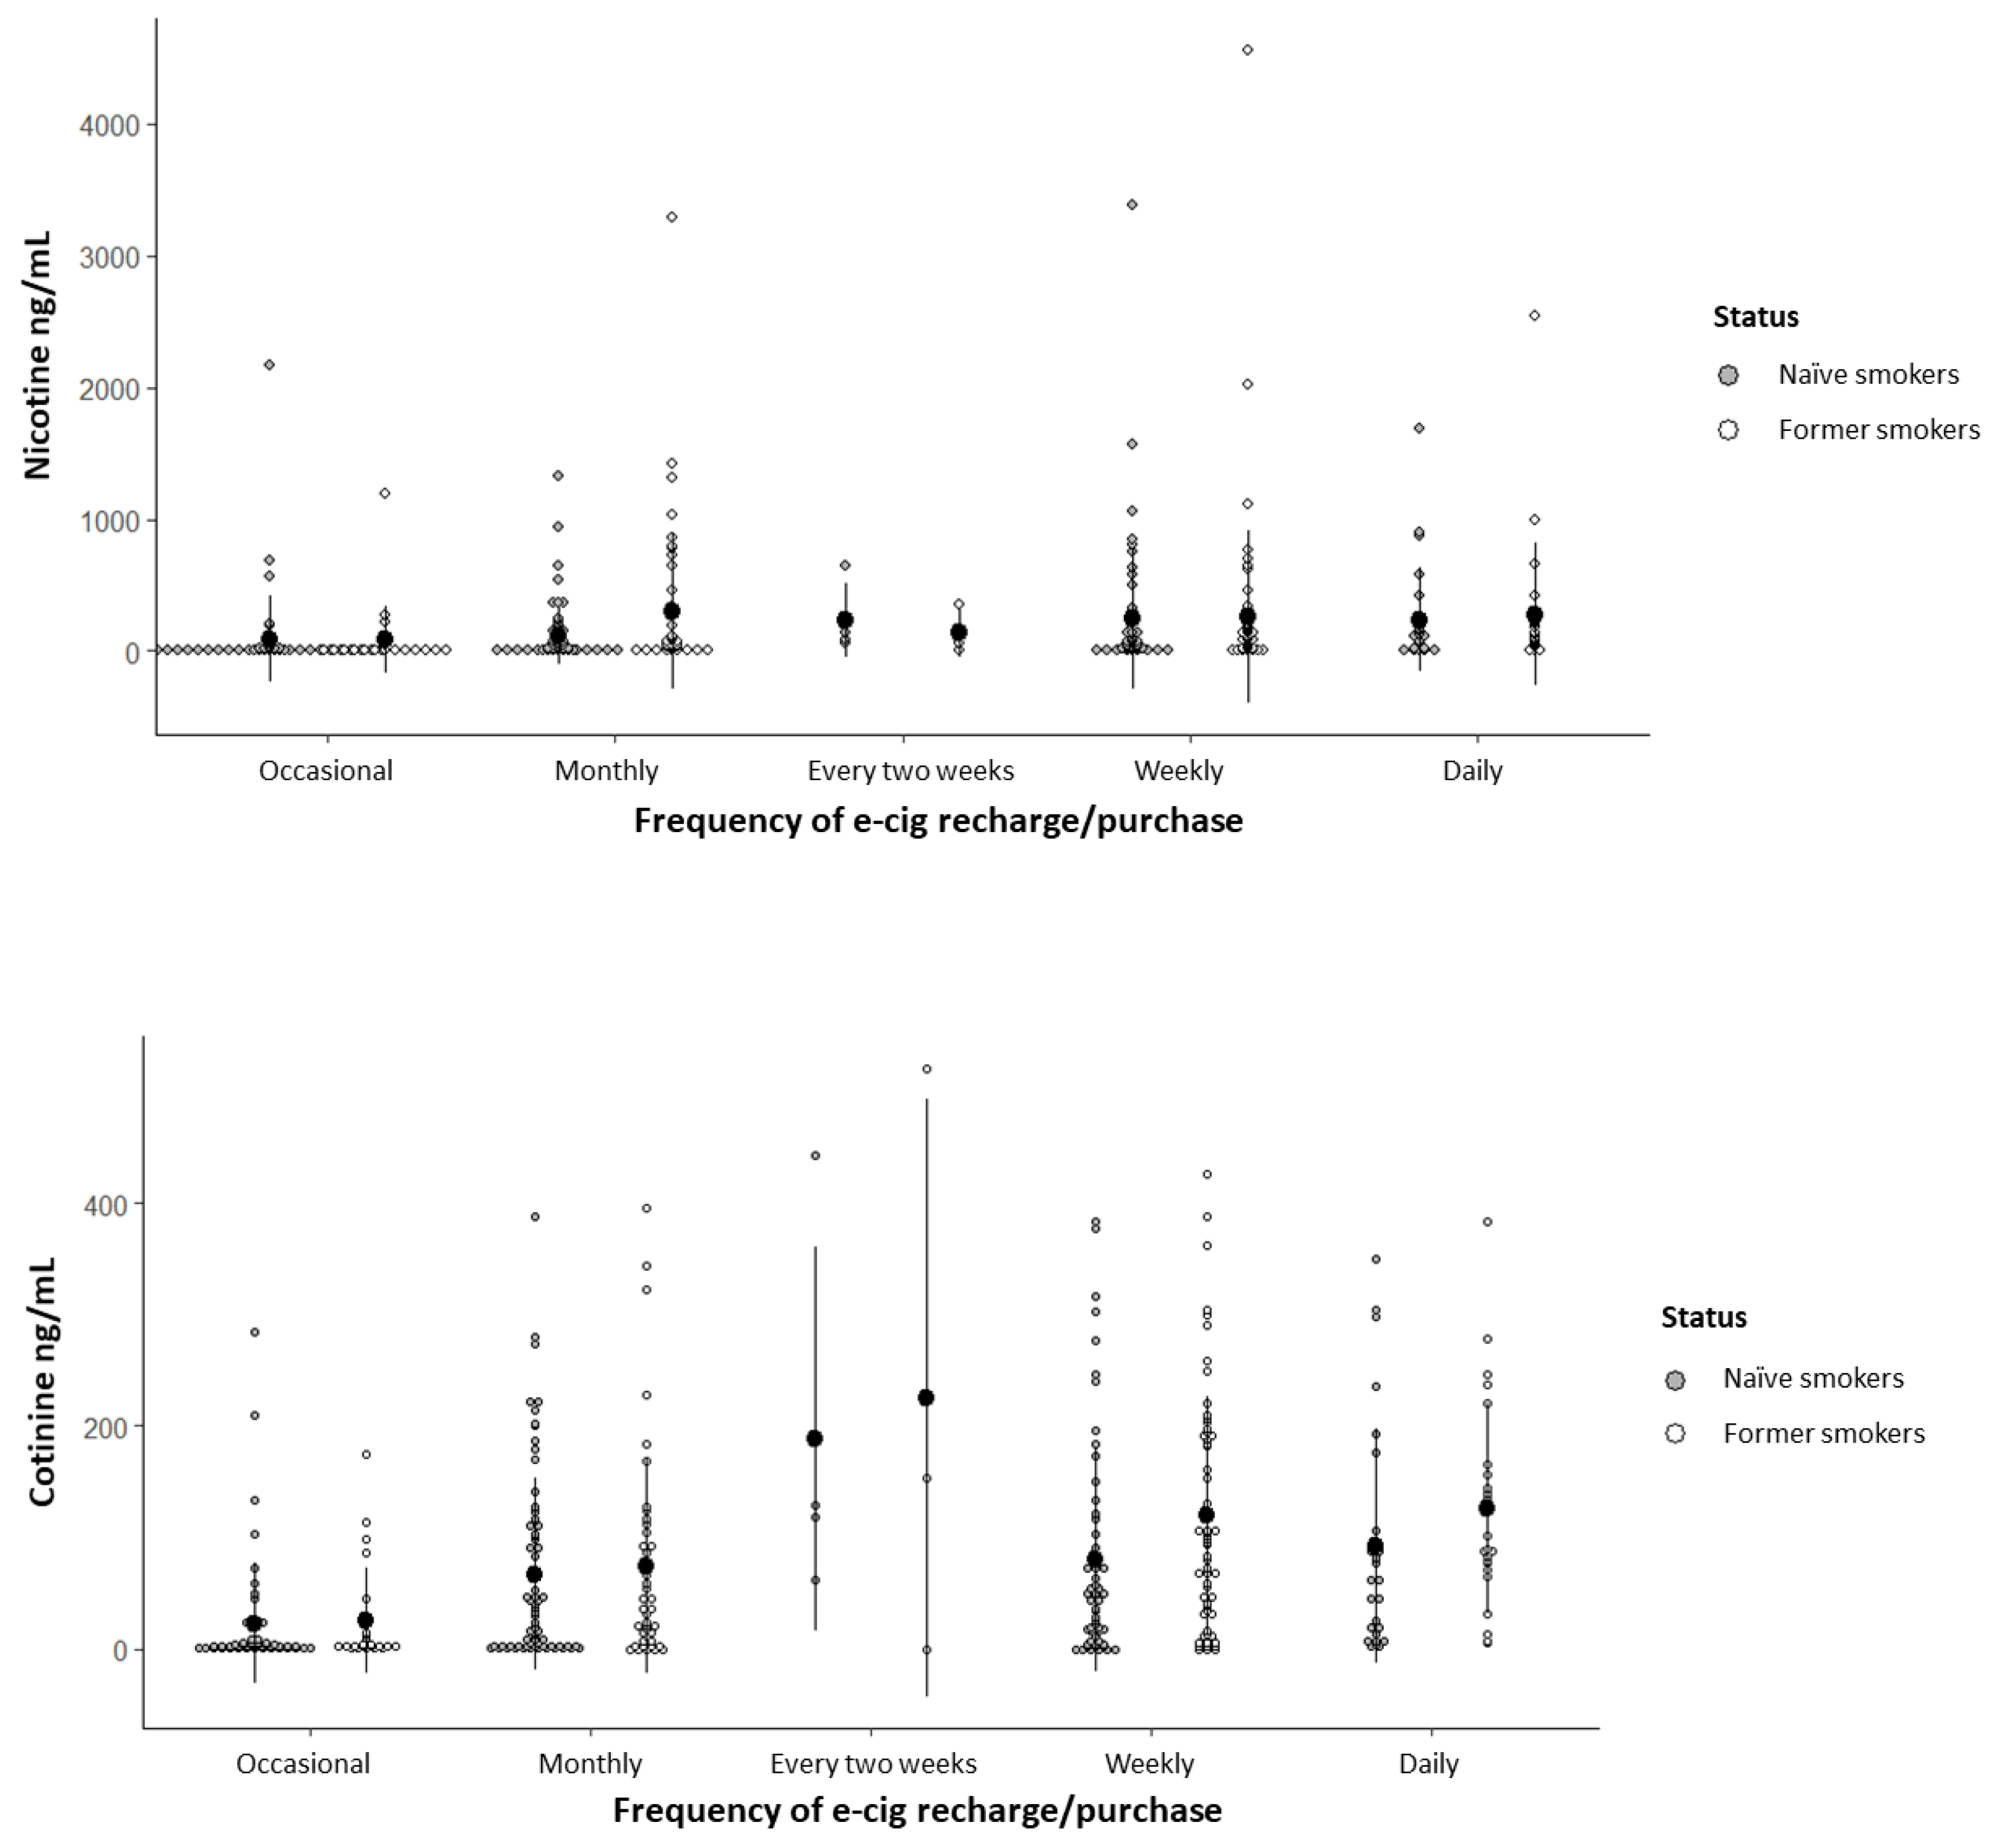

Table 1.
Participant sociodemographic profile, physical characteristics, and health conditions according to smoking history.
Table 1.
Participant sociodemographic profile, physical characteristics, and health conditions according to smoking history.
| Overall | Smoking History | p * | ||
|---|---|---|---|---|
| Naïve Smokers | Former Smokers | |||
| Gender, n (%) | N=403 | N=230 | N=173 | 0.021 a |
| Male | 211 (52.4) | 109 (47.4) | 102 (59.0) | |
| Female | 192 (47.6) | 121 (52.6) | 71 (41.0) | |
| Age, years | N=403 | N=230 | N=173 | <0.001 b |
| Mean ± SD | 28.0 ± 9.4 | 25.5 ± 7.8 | 31.3 ± 10.3 | |
| Age range, n (%) | N=403 | N=230 | N=173 | <0.001 a |
| ≤25 years | 207 (51.4) | 147 (63.9) | 60 (34.7) | |
| 26–35 years | 111 (27.5) | 54 (23.5) | 57 (32.9) | |
| 36–45 years | 63 (15.6) | 22 (9.6) | 41 (23.7) | |
| ≥46 years | 22 (5.5) | 7 (3.0) | 15 (8.7) | |
| Race, n (%) | N=399 | N=228 | N=171 | 0.094 c |
| White | 273 (68.4) | 157 (68.9) | 116 (67.8) | |
| Black | 30 (7.5) | 11 (4.8) | 19 (11.1) | |
| Asian | 7 (1.8) | 5 (2.2) | 2 (1.2) | |
| Multiracial | 89 (22.3) | 55 (24.1) | 34 (19.9) | |
| Years spend on education, n (%) | N=399 | N=229 | N=170 | 0.180 a |
| ≤9 years | 14 (3.5) | 6 (2.6) | 8 (4.7) | |
| 10–15 years | 169 (42.4) | 105 (45.9) | 64 (37.6) | |
| ≥16 years | 215 (53.9) | 117 (51.1) | 98 (57.6) | |
| Monthly earning income, n (%) | N=352 | N=202 | N=150 | 0.125 a |
| ≤BRL 1,000.00 | 3 (0.9) | 2 (1.0) | 1 (0.7) | |
| BRL 1,001.00–2,500.00 | 54 (15.3) | 36 (17.8) | 18 (12.0) | |
| BRL 2,501.00–5,000.00 | 98 (27.8) | 62 (30.7) | 36 (24.0) | |
| BRL 5,001.00–10,000.00 | 89 (25.3) | 50 (24.8) | 39 (26.0) | |
| ≥BRL 10,000.00 | 108 (30.7) | 52 (25.7) | 56 (37.3) | |
| Mean body mass index (BMI), kg/m2 | 21.81 ± 4.58 | 20.8 ± 4.21 | 22.15 ± 4.9 | |
| Presence of clinical conditions, n (%) | N=400 | N=228 | N=172 | 0.895 c |
| Yes | 71 (17.8) | 42 (18.4) | 29 (16.9) | |
| Allergy | 17 (23.9) | 11 (26.2) | 6 (20.7) | 0.593 a |
| Asthma | 16 (22.5) | 6 (14.3) | 10 (34.5) | 0.045 a |
| Hypertension | 12 (16.9) | 5 (11.9) | 7 (24.1) | 0.209 c |
| Diabetes mellitus | 5 (7.0) | 2 (4.8) | 3 (10.3) | 0.393 c |
| Other | 26 (36.6) | 18 (42.9) | 8 (27.6) | 0.189 a |
| Presence of mental disorders, n (%) | N=398 | N=227 | N=171 | 0.536 c |
| Yes | 125 (31.4) | 67 (29.5) | 58 (33.9) | |
| Anxiety | 94 (75.2) | 48 (71.6) | 46 (79.3) | 0.322 a |
| Depression | 39 (31.2) | 16 (23.9) | 23 (39.7) | 0.058 a |
| Bipolar disorder | 8 (6.4) | 5 (7.5) | 3 (5.2) | 0.724 a |
| Personality disorder | 4 (3.2) | 3 (4.5) | 1 (1.7) | 0.623 c |
| Schizophrenia | 1 (0.8) | 1 (1.5) | 0 (0.0) | 1.000 c |
| Other | 6 (4.8) | 5 (7.5) | 1 (1.7) | 0.215 c |
N: total number of participants considered in the analysis; n: number of participants within a subgroup; SD: standard deviation; IQR: interquartile range. * p values are descriptive levels for: a Chi-Square test, b Mann-Whitney test, c Fisher exact test.
Table 2.
Information on e-cigarette consumption pattern, product characteristics, purchase and expenses, and nicotine and cotinine concentrations according to smoking history.
Table 2.
Information on e-cigarette consumption pattern, product characteristics, purchase and expenses, and nicotine and cotinine concentrations according to smoking history.
| Overall | Smoking History | p * | ||
|---|---|---|---|---|
| Naïve Smokers | Former Smokers | |||
| Introduction to e-cigarette, n (%) | N=399 | N=227 | N=172 | |
| By friends and/or family | 264 (66.2) | 156 (68.7) | 108 (62.8) | 0.215a |
| Self-interest | 74 (18.5) | 32 (14.1) | 42 (24.4) | 0.009a |
| Through advertising | 65 (16.3) | 40 (17.6) | 25 (14.5) | 0.408a |
| Other | 14 (3.5) | 10 (4.4) | 4 (2.3) | 0.264a |
| Reasons for use, n (%) | N=402 | N=230 | N=172 | |
| Out of curiosity | 163 (40.5) | 125 (54.3) | 38 (22.1) | <0.001a |
| Influence of friends and/or family | 116 (28.9) | 86 (37.4) | 30 (17.4) | <0.001a |
| Tobacco smoking cessation | 71 (17.7) | 0 (0) | 71 (40.1) | <0.001a |
| Alternative to traditional cigarettes | 59 (14.7) | 16 (7.0) | 43 (25.0) | <0.001a |
| Advertising | 16 (4.0) | 8 (3.5) | 8 (4.7) | 0.552a |
| Other | 65 (16.2) | 38 (16.5) | 27 (15.7) | 0.824a |
| Product type, n (%) | N=401 | N=229 | N=172 | |
| Disposable | 297 (74.1) | 175 (76.4) | 122 (70.9) | 0.215a |
| Rechargeable | 100 (24.9) | 55 (24.0) | 45 (26.2) | 0.623a |
| E-liquid vaporization | 42 (10.5) | 21 (9.2) | 21 (12.2) | 0.325a |
| Heated tobacco | 3 (0.7) | 1 (0.4) | 2 (1.2) | 0.579b |
| Consumption duration, n (%) | N=396 | N=226 | N=170 | 0,013a |
| ≤1 year | 154 (38.8) | 102 (44,7) | 52 (30,8) | |
| 2–3 years | 172 (43.3) | 92 (40,4) | 80 (47,3) | |
| ≥4 years | 71 (17.9) | 34 (14.9) | 37 (21.9) | |
| Last consumption, n (%) | N=397 | N=228 | N=169 | 0.116b |
| 30 minutes ago | 197 (49.6) | 99 (43.4) | 98 (58.0) | |
| 31–60 minutes ago | 51 (12.8) | 33 (14.5) | 18 (10.7) | |
| 61–90 minutes ago | 16 (4.0) | 7 (3.1) | 9 (5.3) | |
| 90–120 minutes ago | 9 (2.3) | 6 (2.6) | 3 (1.8) | |
| >2 hours ago | 16 (4.0) | 12 (5.3) | 4 (2.4) | |
| ~12 hours ago | 16 (4.0) | 10 (4.4) | 6 (3.6) | |
| ~24 hours ago | 25 (6.3) | 18 (7.9) | 7 (4.1) | |
| ~48 hours ago | 64 (16.1) | 40 (17.5) | 24 (14.2) | |
| Last week | 2 (0.5) | 2 (0.9) | 0 (0.0) | |
| Last month | 1 (0.3) | 1 (0.4) | 0 (0.0) | |
| Place of purchase, n (%) | N=398 | N=227 | N=171 | |
| Internet | 102 (25.6) | 54 (23.8) | 48 (28.1) | 0.333a |
| Tobacco shop | 278 (69.8) | 161 (70.9) | 117 (68.4) | 0.590a |
| Abroad | 9 (2.3) | 2 (0.9) | 7 (4.1) | 0.042b |
| Gift from friends and/or family | 36 (9.0) | 22 (9.7) | 14 (8.2) | 0.604a |
| Recharge/purchase frequency, n (%) | N=396 | N=226 | N=170 | 0.029a |
| Daily | 54 (13.6) | 29 (12.8) | 25 (14.7) | |
| Weekly | 128 (32.3) | 60 (26.5) | 68 (40.0) | |
| Every two weeks | 9 (2.3) | 5 (2.2) | 4 (2.4) | |
| Monthly | 127 (32.1) | 79 (35.0) | 48 (28.2) | |
| Occasional | 78 (19.7) | 53 (23.5) | 25 (14.7) | |
| Monthly expenses, n (%) | N=395 | N=225 | N=170 | <0.001b |
| ≤BRL 50.00 | 57 (14.4) | 36 (16.0) | 21 (12.4) | |
| BRL 51.00–100.00 | 109 (27.6) | 77 (34.2) | 32 (18.8) | |
| BRL 101.00–300.00 | 162 (41.0) | 88 (39.1) | 74 (43.5) | |
| BRL 301.00–500.00 | 47 (11.9) | 14 (6.2) | 33 (19.4) | |
| BRL 501.00–1,000.00 | 16 (4.1) | 8 (3.6) | 8 (4.7) | |
| ≥BRL 1,000.00 | 2 (0.5) | 0 (0.0) | 2 (1.2) | |
| None (provided by friends and/or family) | 2 (0.5) | 2 (0.9) | 0 (0.0) | |
| Knowledge of nicotine content, n (%) | N=400 | N=228 | N=172 | 0.091a |
| No knowledge | 215 (53.8) | 130 (57.0) | 85 (49.4) | |
| Aware of nicotine content | 153 (38.3) | 77 (33.8) | 76 (44.2) | |
| Unaware of nicotine content | 32 (8.0) | 21 (9.2) | 11 (6.4) | |
| Nicotine form, n (%) | N=400 | N=228 | N=172 | |
| Nicotine salt | 110 (27.5) | 58 (25.4) | 52 (30.2) | 0.288a |
| Nicotine free-base | 50 (12.5) | 22 (9.6) | 28 (16.3) | 0.047a |
| No knowledge | 217 (54.3) | 132 (57.9) | 85 (49.4) | 0.092a |
| No nicotine | 29 (7.3) | 20 (8.8) | 9 (5.2) | 0.177a |
| Nicotine salt concentration, n (%) | N=110 | N=58 | N=52 | 0.929b |
| 3 mg/mL | 1 (0.9) | 1 (1.7) | 0 (0.0) | |
| 20 mg/mL | 18 (16.4) | 10 (17.2) | 8 (15.4) | |
| 35 mg/mL | 24 (21.8) | 11 (19.0) | 13 (25.0) | |
| 50 mg/mL | 58 (52.7) | 31 (53.4) | 27 (51.9) | |
| Unknown | 9 (8.2) | 5 (8.6) | 4 (7.7) | |
| Nicotine free-base concentration, n (%) | N=50 | N=22 | N=28 | 0.193b |
| 3 mg/mL | 30 (60.0) | 15 (68.2) | 15 (53.6) | |
| 6 mg/mL | 16 (32.0) | 5 (22.7) | 11 (39.3) | |
| 12 mg/mL | 1 (2.0) | 1 (4.5) | 0 (0.0) | |
| 18 mg/mL | 0 (0.0) | 0 (0.0) | 0 (0.0) | |
| >20 mg/mL | 1 (2.0) | 1 (4.5) | 0 (0.0) | |
| Unknown | 2 (4.0) | 0 (0.0) | 2 (7.1) | |
| Nicotine, ng/mL | N=362 | N=208 | N=154 | 0.023c |
| Mean ± SD | 194.90 ± 466.49 | 158.99 ± 373.86 | 243.39 ± 565.88 | |
| Median (IQR) | 38.50 (6.00–148.50) | 25.00 (5.00–137.75) | 62.00 (9.75–178.50) | |
| Cotinine, ng/mL | N=362 | N=208 | N=154 | 0.001c |
| Mean ± SD | 76.90 ± 98.70 | 64.52 ± 91.85 | 93.61 ± 105.27 | |
| Median (IQR) | 36.00 (3.00–111.00) | 20.00 (2.25–91.00) | 67.00 (8.00–140.25) | |
N: total number of participants considered in the analysis; n: number of participants within a subgroup; SD: standard deviation; IQR: interquartile range. * p values are descriptive levels for: a Chi-Square test, b Fisher exact test, c Mann-Whitney test.
Table 3.
Sociodemographic data, participant characteristics, clinical and smoking history, e-cigarette use patterns, and nicotine and cotinine concentrations according to participants’ perception of addiction.
Table 3.
Sociodemographic data, participant characteristics, clinical and smoking history, e-cigarette use patterns, and nicotine and cotinine concentrations according to participants’ perception of addiction.
| Participants’ Perception of Nicotine Addiction | p * | |||||
|---|---|---|---|---|---|---|
| None | Mild | Moderate | Severe | Unsure | ||
| Gender, n (%) | N=154 | N=88 | N=94 | N=70 | N=9 | 0.883a |
| Male | 83 (53.9) | 45 (51.1) | 47 (50.0) | 36 (51.4) | 6 (66.7) | |
| Female | 71 (46.1) | 43 (48.9) | 47 (50.0) | 34 (48.6) | 3 (33.3) | |
| Age, years | N=154 | N=88 | N=94 | N=70 | N=9 | 0.458b |
| Mean ± SD | 27.01 ± 9.48 | 28.16 ± 8.75 | 28.15 ± 10.06 | 28.49 ± 9.03 | 29.44 ± 9.89 | |
| Median (IQR) | 24.00 (20.00–30.25) | 26.00 (21.00–34.75) | 24.00 (21.00–32.25) | 26.00 (21.00–34.25) | 25.00 (21.50–40.00) | |
| Age range, n (%) | N=154 | N=88 | N=94 | N=70 | N=9 | 0.806c |
| ≤25 years | 87 (56.5) | 41 (46.6) | 52 (55.3) | 34 (48.6) | 5 (55.6) | |
| 26–35 years | 39 (25.3) | 27 (30.7) | 21 (22.3) | 21 (30.0) | 1 (11.1) | |
| 36–45 years | 22 (14.3) | 16 (18.2) | 14 (14.9) | 11 (15.7) | 2 (22.2) | |
| ≥46 years | 6 (3.9) | 4 (4.5) | 7 (7.4) | 4 (5.7) | 1 (11.1) | |
| Body mass index, kg/m2 | N=154 | N=87 | N=94 | N=69 | N=9 | 0.207c |
| Mean ± SD | 21.78 ± 4.41 | 21.16 ± 4.09 | 22.13 ± 5.29 | 21.89 ± 4.60 | 24.36 ± 3.60 | |
| Median (IQR) | 20.96 (18.56–25.03) | 20.59 (18.13–23.88) | 21.16 (18.99–24.39) | 21.25 (18.37–24.92) | 24.17 (21.42–27.79) | |
| Smoking history, n (%) | N=150 | N=86 | N=91 | N=66 | N=8 | <0.001a |
| Naïve smoker | 107 (71.3) | 50 (58.1) | 37 (40.7) | 30 (45.5) | 4 (50.0) | |
| Former smokers | 43 (28.7) | 36 (41.9) | 54 (59.3) | 36 (54.5) | 4 (50.0) | |
| Consumption duration, n (%) | N=151 | N=87 | N=93 | N=70 | N=8 | <0.001a |
| ≤1 year | 82 (54.3) | 42 (48.3) | 22 (23.7) | 10 (14.3) | 2 (25.0) | |
| 2–3 years | 58 (38.4) | 36 (41.4) | 45 (48.4) | 34 (48.6) | 4 (50.0) | |
| ≥4 years | 11 (7.3) | 9 (10.3) | 26 (28.0) | 26 (37.1) | 2 (25.0) | |
| Recharge/purchase frequency, n (%) | N=152 | N=87 | N=92 | N=69 | N=8 | <0.001a |
| Daily | 11 (7.2) | 13 (14.9) | 17 (18.5) | 16 (23.2) | 1 (12.5) | |
| Frequent** | 86 (56.6) | 59 (67.8) | 64 (69.6) | 49 (71.0) | 3 (37.5) | |
| Occasional | 55 (36.2) | 15 (17.2) | 11 (12.0) | 4 (5.8) | 4 (50.0) | |
| Last consumption, n (%) | N=152 | N=88 | N=92 | N=70 | N=7 | <0.001a |
| Recent (<24 hours ago) | 105 (69.1) | 76 (86.4) | 85 (92.4) | 70 (100.0) | 5 (71.4) | |
| Not recent (>24 hours ago) | 47 (30.9) | 12 (13.6) | 7 (7.6) | 0 (0.0) | 2 (28.6) | |
| Presence of anxiety or depression, n (%) | N=146 | N=88 | N=94 | N=68 | N=9 | 0.252a |
| No | 111 (76.0) | 66 (75.0) | 64 (68.1) | 44 (64.7) | 8 (88.9) | |
| Yes | 35 (24.0) | 22 (25.0) | 30 (31.9) | 24 (35.3) | 1 (11.1) | |
| Nicotine, ng/mL | N=139 | N=79 | N=82 | N=65 | N=9 | <0.001b |
| Mean ± SD | 127.68 ± 310.46 | 219.89 ± 493.33 | 201.55 ± 532.08 | 324.48 ± 589.12 | 26.67 ± 41.29 | |
| Median (IQR) | 10.00 (0.00–80.00) | 44.00 (9.00–142.00) | 69.50 (14.75–190.25) | 99.00 (38.00–362.00) | 0.00 (0.00–62.50) | |
| Cotinine, ng/mL | N=139 | N=79 | N=82 | N=65 | N=9 | <0.001b |
| Mean ± SD | 37.72 ± 74.43 | 81.28 ± 92.61 | 103.17 ± 102.23 | 127.15 ± 112.81 | 45.44 ± 96.75 | |
| Median (IQR) | 4.00 (0.00–35.00) | 46.00 (15.00–107.00) | 72.50 (19.75–155.75) | 96.00 (41.00–194.00) | 6.00 (2.00–45.00) | |
N: total number of participants considered in the analysis; n: number of participants within a subgroup; SD: standard deviation; IQR: interquartile range. * p values are descriptive levels for: a Chi-Square test, b Mann-Whitney test, c Fisher exact test. ** Frequent means “weekly, every two weeks and monthly”.
Disclaimer/Publisher’s Note: The statements, opinions and data contained in all publications are solely those of the individual author(s) and contributor(s) and not of MDPI and/or the editor(s). MDPI and/or the editor(s) disclaim responsibility for any injury to people or property resulting from any ideas, methods, instructions or products referred to in the content. |
© 2025 by the authors. Licensee MDPI, Basel, Switzerland. This article is an open access article distributed under the terms and conditions of the Creative Commons Attribution (CC BY) license (http://creativecommons.org/licenses/by/4.0/).
Copyright: This open access article is published under a Creative Commons CC BY 4.0 license, which permit the free download, distribution, and reuse, provided that the author and preprint are cited in any reuse.


