Submitted:
02 July 2025
Posted:
03 July 2025
You are already at the latest version
Abstract
Mercury methylation is the harmful process by which mercury (Hg) is converted to methylmercury (MeHg). Biotically, this is done by mercury-methylating microbes such as sulfate-reducing bacteria (SRB) in ecosystems such as wetlands and aquatic sediments. Due to legacy Hg and sulfate deposition along the eastern US, there likely remains a moderate concentration of Hg in Winooski River (W) and Englesby Brook (E), sites which have been identified as having relatively higher mercury concentrations in Vermont. If the microbial community consists partially of mercury-methylating microbes, there is a higher potential of conversion of Hg to MeHg. To investigate this potential, sediment cores were taken from the sites to analyze microbial community composition, the presence of hgcA genes within sample metagenomes, and concentrations of Hg, C, and N. Results suggest that the microbial communities of Winooski River and Englesby Brook are different. Further, the Riparian Land samples had a significantly greater relative abundance of 16S rRNA ASVs that matched to Hg-methylating genera compared to Riparian Water samples, with greater THg concentrations in Englesby Brook. hgcA genes were present within samples from all locations and sampling sites, although Winooski Riparian Water and Winooski Bay had the greatest number of amino acid sequence hits.
Keywords:
microbial mercury methylation
; community composition
; river
; sediments
; Vermont
; 16S rRNA
; metagenome
1. Introduction
Mercury (Hg) is a toxic environmental contaminant that bioaccumulates in the food web, posing risks to both ecosystems and human health [1]. Major anthropogenic sources of Hg include industrial activities, coal burning, and gold mining [1,2]. Over the past several decades, studies have highlighted mercury’s detrimental effects on neurodevelopment, cognition, and cardiovascular health [3]. Furthermore, Hg interacts synergistically with other contaminants such as polychlorinated biphenyls (PCBs) and other metals, amplifying its toxic impact on organisms [2,4].
Methylmercury (MeHg), produced via mercury methylation, is the only form of Hg that biomagnifies in the food web. Unlike Hg(0), Hg(II), and Me2Hg, which are non-reactive and easily diffuse, MeHg is more readily incorporated into biota [1]. Mercury methylation occurs in aquatic ecosystems, including wetlands, sediments, benthic surfaces, pelagic environments, and flooded or inundated areas like rice paddies [5,6,7]. This process is most prominent at oxic-anoxic boundaries [8,9,10].
In microbes, mercury methylation serves as a detoxification mechanism, enabling microbes to resist Hg toxicity [11,12,13]. Methylating microbes, previously identified as mainly facultative and obligate anaerobes such as sulfate-reducing and iron-reducing bacteria, are responsible for biotic mercury methylation [7,14]. Microbial uptake and release of MeHg is rapid, unlike higher organisms, which tend to bioaccumulate it [15]. Sulfate-reducing bacteria, in particular, have been identified as the primary methylators in environments such as estuary sediments [16]. These microbes likely utilize a corrinoid-containing sulfur or iron protein that acts as a methyl group donor in the acetyl-CoA pathway in the cytoplasm, and thus methylmercury synthesis likely competes with acetyl-CoA for methyl groups [17].
The hgcA and hgcB genes have been identified as essential for mercury methylation in Desulfovibrio desulfuricans ND132 and Geobacter sulfurreducens PCA [14]. The proteins encoded by these genes facilitate the methylation process by producing the corrinoid protein carrying out methyl transfer (HgcA) and creating 2[4Fe-4S] ferredoxin for corrinoid reduction (HgcB). Deletion of these genes reduced methylmercury production by over 99%, and reintroduction restored methylation activity. These genes are predominantly found in the phyla Proteobacteria and Firmicutes and across other bacterial and archael strains, such as Deltaproteobacteria, Clostridia, and Methanomicrobia [14,18]. In Geobacter sulfurreducens PCA, deletion of the hgcAB genes caused minimal growth disruption but altered metal ion homeostasis [19]. The presence of the hgcAB genes can predict Hg-methylating potential, as demonstrated by their detection in 15 previously untested bacteria with hgcAB homologues [20].
Uncertainties persist regarding the effects of climate change and land use on mercury cycling and methylation. Climate change, particularly temperature increases and altered hydrological fluxes due to flooding and drought, may exacerbate mercury methylation and bioaccumulation [2,7]. Predicted to intensify due to climate change, flooding and drought can trigger redox oscillations, enhancing methylation by sulfate-reducing bacteria through increased sulfide oxidation [21,22,23]. In the Cottage Grove Reservoir, Oregon, USA seasonally inundated sediments had significantly higher mercury methylation activity compared to permanently inundated areas [21]. Another study of the Upper St. Lawrence River, New York, USA wetland sediments estimated significant Hg mobilization from a government plan to restore river fluctuation to pre-Moses-Saunders hydropower dam oscillations, due to the presence of mercury-methylating microbes [5]. Intense flooding in Vermont in July of 2023 may play a role in THg load in sediments sampled for this study [24].
In the Lake Champlain Basin of Vermont, USA, Malletts Bay has been identified as an area with high concentrations of total mercury (THg) and MeHg [25]. The Winooski River and Englesby Brook have also been notable for relatively high Hg concentrations and were classified as impaired under Vermont’s Water Quality Standards for mercury [26,27,28]. Both sites were heavily flooded in July 2023, which likely intensified mercury mobilization and methylation in these areas, marking them as important sites of investigation [29]. This study seeks to uncover the potential consequences of legacy mercury deposition on microbial mercury methylation in Winooski River and Englesby Brook. Sediment samples from different zones (Riparian Land, RL; Riparian Water, RW; Bay, B) were analyzed to understand community composition and the likelihood of mercury methylation. To identify Hg-methylating microbes and quantify hgcA genes, we employed 16S rRNA amplicon sequencing and metagenomic analysis, respectively, as described by previous studies [30,31,32] and followed previously published sediment sampling and elemental analysis protocols [5].
2. Materials and Methods
2.1. Experimental Design
Samples were collected at two primary sites in Vermont: Winooski River in Colchester on October 28, 2023 (44.524444, -73.256389) and Englesby Brook in Burlington on November 4, 2023 (44.457778, -73.219722). At both Winooski River and Englesby Brook, there were three separate locations: the sediment within the inundated river (Riparian Water, RW), the riparian land at the edge of the river not covered at the time of sampling by water (Riparian Land, RL), and the bay area (Winooski Bay, WB and Englesby Bay, EB), which is the river mouth that feeds into Lake Champlain (Figure 1). For WB we sampled at Delta Park (44.5375323069514, -73.27796273800251). Meanwhile, we sampled for EB at Blanchard Beach (44.45819838869913, -73.2240284237561). From the RW and RL regions of each site, three cores from three plots of 1 m2 were collected (Downstream 1, D1; Downstream 2, D2; Upstream, U) (Figure 1), whereas three cores in total were collected from a 1 m2 plot at each bay area.
2.2. Sample Collection
Sediment and hydric soil cores were taken with a polycarbonate tube (1.5 m long, 2.54 cm external diameter, 2 cm internal diameter), hammering with a rubber hand mallet when necessary. After reaching a depth of around 10 cm, a vacuum was created inside the tubing by placing one hand tightly on top of the tube, then pulling the corer straight out of the ground and immediately transferring to a clean and labeled air-tight polyethylene bag by releasing the sealing hand. If the sediment was particularly loose, a 3D-printed plug was inserted at the bottom of the tube to avoid loss of sediment. Prior to sample collection, corers were acid-washed with 3% HCl for 15 minutes and DI water for 15 minutes. At the field sites, soil corers were equilibrated by rinsing with river water three times prior to taking the samples as well as between the samples. Samples were stored in a cooler during transport to the lab until further processing.
2.3. Sample Processing and Storage
Excess water was removed from polyethylene bags after the samples had settled and a clear separation between the sediment and water was visible. Within 1-3 days of sampling, samples were cleared of large debris (>3 mm) by sifting through using stainless-steel tweezers and homogenized using a stainless-steel coffee grinder (Cuisinart Grind Central; Stamford, CT) or acid-washed mortar and pestle, transferred to polypropylene tubes, then stored frozen at -20° C until further analysis. Subsamples of 1 g each were removed from homogenized sediment samples for carbon and nitrogen analysis. From each site in each location (D1 RL, D1 RW, D2 RL, D2 RW, U RL, U RW, and B for both Winooski (W) and Englesby (E)) subsamples of 2 g from each of the three cores were removed from thawed homogenized sediment samples, then pooled and homogenized again for DNA extraction.
2.4. DNA Extraction and Sequencing
DNA was extracted using the Zymo Research Soil Microbe DNA Microprep kit, following the protocols by the manufacturer (Zymo Research, Irvine, CA, USA). Duplicate extractions were performed for each of the 15 samples. Briefly, 0.25 g of each homogenized sample was lysed in a bead-beating tube, centrifuged, filtered through DNA-binding spin columns, eluted with nuclease-free water, and then transferred to a clean 1.5 mL microcentrifuge tube after filtering through a Spin II-microHRC Filter. A negative control of 0.25 mL of sterile nuclease-free H2O was also extracted through the kit [35]. A Quant-iT™ PicoGreen™ dsDNA Assay (Thermo Fisher Scientific,Waltham, MA, USA) was conducted following DNA extraction to quantify the amount of DNA in each sample and the negative control. All 14 extracted DNA samples and one negative control were sent to Novogene (Sacramento, CA, USA) for Illumina 16S rRNA amplicon library prep and Illumina Miseq PE250 sequencing. Sequenced data were sent back as raw reads, then processed and analyzed using the DADA2 pipeline. Three extracted DNA samples (D1, D2, U) from each site (Englesby RL, Englesby RW, Englesby Bay, Winooski RL, Winooski RW, Winooski B) were pooled and shipped to Novogene for NovoSeq PE150 metagenomic sequencing.
2.5. Mercury Analysis
Total mercury content in the sediment samples was quantified in approximately 1 g of wet sediment from each core, using a Milestone (Sorisole, Italy) Direct Mercury Analyzer (DMA-80 evo). The instrument was initially calibrated using aqueous mercury standards and verified with duplicate measurements of IAEA-456: Coastal Sediment (International Atomic Energy Agency). Samples were dried at 200 C for one and a half minutes and combusted at 650°C for three minutes; the instrument was purged for 75 seconds and the amalgamator heated for 12 seconds within a 30 second signal recording window. Samples were analyzed in duplicate with relative standard deviations of less than 10%. In addition to IAEA-456, an instrument blank, ultrapure water blank, a procedural blank, and a matrix-spike were analyzed every 10 samples (20 boats). Acceptable percent recovery for a matrix spike was between 80-120%. The limit of detection was defined as three standard deviations above the mean of ultrapure water blanks, and the limit of quantification as defined as ten standard deviations above the mean. All samples were above the limit of quantification.
2.6. Carbon & Nitrogen (CN) Analysis
Subsamples (~1 g) of each sediment sample were freeze-dried and then ground with a mortar and pestle. A standard curve was created using four masses of aspartic acid: ~0.5 mg, ~2.5 mg, ~4.5 mg, and ~6.5 mg. These resulted in masses of nitrogen of 0.041 mg, 0.253 mg, 0.458 mg, and 0.672 mg, and masses of carbon of 0.171 mg, 0.917 mg, 1.617 mg, and 2.337 mg. The area of the lowest calibration for nitrogen was 90,234.5 mV*sec, while the area of lowest calibration for carbon was 872,005 mV*sec. A standard reference material, sCNS, was used during each analysis to confirm that the standard curve was accurate. Around 30.0 mg of each sample were analyzed using a Flash 2000 CNS-analyzer (Thermo Fisher Scientific, Waltham, MA, USA).
2.7. Data Analysis of Elemental Concentrations
All statistical analyses were conducted using Microsoft Excel and R Studio software (v. 4.3.1). The elemental concentration value from the three cores of each 1 m2 plot (Figure 1) were averaged prior to analysis using dplyr (v. 1.1.4) [36]. Data normality and homogeneity was assessed using the Shapiro Wilk test stats package (v. 4.3.3) in base R [37]. The car package (v. 3.1.2) was used to perform a Levene test [38]. An ANOVA test was used to compare elemental concentrations between the sites, followed by a post-hoc Tukey’s (stats package, v. 4.3.3). The correlation between different elements (carbon and nitrogen) and the concentration of total mercury at each site was determined using a Pearson’s product-moment correlation test using the stats package (v. 4.3.3) [37].
2.8. 16S rRNA Amplicon Analysis
DADA2 (v. 1.6) was used to demultiplex, quality control (QC), merge paired-end reads, and assign amplicon sequence variants (ASVs) and taxonomic assignments to all samples and the blank [39]. After creating quality profiles for each forward and reverse .fastq sequence, we trimmed from 150 nucleotides to the end for the forward reads, and from 220 nucleotides to the end for the reverse reads. An ASV table was created using dereplicated unique sequences from merged forward and reverse reads. Chimeras were removed, and taxonomy was assigned to the species level using DECIPHER (v. 2.20.0), referencing the SILVA_SSU_r138 training set [40]. Taxonomic composition and diversity of samples were visualized using phyloseq (v. 1.42.0)[41]. Non-metric dimensional scaling (NMDS) using ASV relative abundance Bray-Curtis dissimilarity distance was used to compare dissimilarity in microbial community composition among the different sampling locations (RL, RW, Bay) in Winooski River and Englesby Brook. Differences between the Hg-methylating microbial community composition between the different sites were compared by an ANOVA test followed by a post-hoc Tukey’s test. Previously identified Hg-methylating taxa were filtered for and analyzed further [42]. Differences between the Hg-methylating microbial community composition between the different sites were compared by an ANOVA test followed by a post-hoc Tukey’s test.
2.9. Metagenome Analysis
Raw metagenomic reads were quality filtered and trimmed using trimmomatic (v 0.39) [43], then assembled using megahit (v1.2.9) [44]. Open reading frames (ORFs) within the assembled contigs were identified using prodigal (v2.6.3) [45] and converted to an amino acid sequence file (.faa). HMMER (v3.4) [46] was used to search for sequences that matched the Oak Ridge National Lab (ORNL) Hg-methylating database [47]. Following the ORNL README file, we placed aligned sequences onto a maximum likelihood reference HgcA tree and assigned taxonomy to sequences based on their placement on the tree. Contigs identified via HMMER as HgcA sequences were also classified using the Basic Local Alignment Search Tool (BLAST) [48], and the top hits were recorded.
3. Results
3.1. Carbon, Nitrogen, and Hg Analyses
Although average THg concentrations (ng/g) were low overall (~10-40 ng/g), the Englesby Brook Riparian Land (ERL) region had greater average total Hg (THg) concentration (ng/g) than any of the other sampling sites in both Winooski River and Englesby Brook (Figure 2). Englesby Brook samples also had greater average THg concentrations (41.93 ng/g) overall compared to Winooski River. In Winooski River, average THg concentrations were significantly positively correlated with average carbon concentrations (mg/g) (p=0.02415), but not with average nitrogen concentrations (mg/g) (Table A1, Figure 3). However, there was no significant relationship between average THg and either average carbon or nitrogen in Englesby Brook (Table A2).
There was no significant difference in carbon or nitrogen mean concentrations between Winooski River and Englesby Brook (respectively, p=0.1009, p=0.2223) (Figure A2.1; Figure A2.2). Winooski Bay had a mean carbon concentration of 36 mg/g dry weight, significantly greater than both Winooski RL (4.5 mg/g dry weight) and Winooski RW (6.9 mg/g dry weight) (p=0.0264) (Table A1, Figure A2.1A). However, there was no significant difference in mean nitrogen concentrations between sampling sites in Winooski River (p=0.3733) (Figure A2.2A). Meanwhile, for Englesby Brook there was no significant difference in the mean carbon (p=0.4701) or nitrogen concentrations (p=0.4273) between the sampling sites (Table A2, Figure A2.1B, Figure A2.1B). Overall, nitrogen concentrations were low, and many were below detection (detection limit = 0 mg/g, calculated as [mean of blanks + standard deviation +/-3]) for all sampling sites in both Winooski River and Englesby Brook).
3.2. Microbial Community Structure Based on 16S rRNA
Non-metric multidimensional scaling (NMDS) analysis of 16S rRNA data showed microbial community differences between Winooski River and Englesby Brook (Figure 4). No clear trends by sampling site were observed, though Englesby Brook Riparian Land samples clustered together, while others were scattered. Notably, the Winooski Riparian Water sample was distant from other Winooski samples, likely due to the dominance of Gammaproteobacteria abundance compared to other Winooski samples (Figure 5).
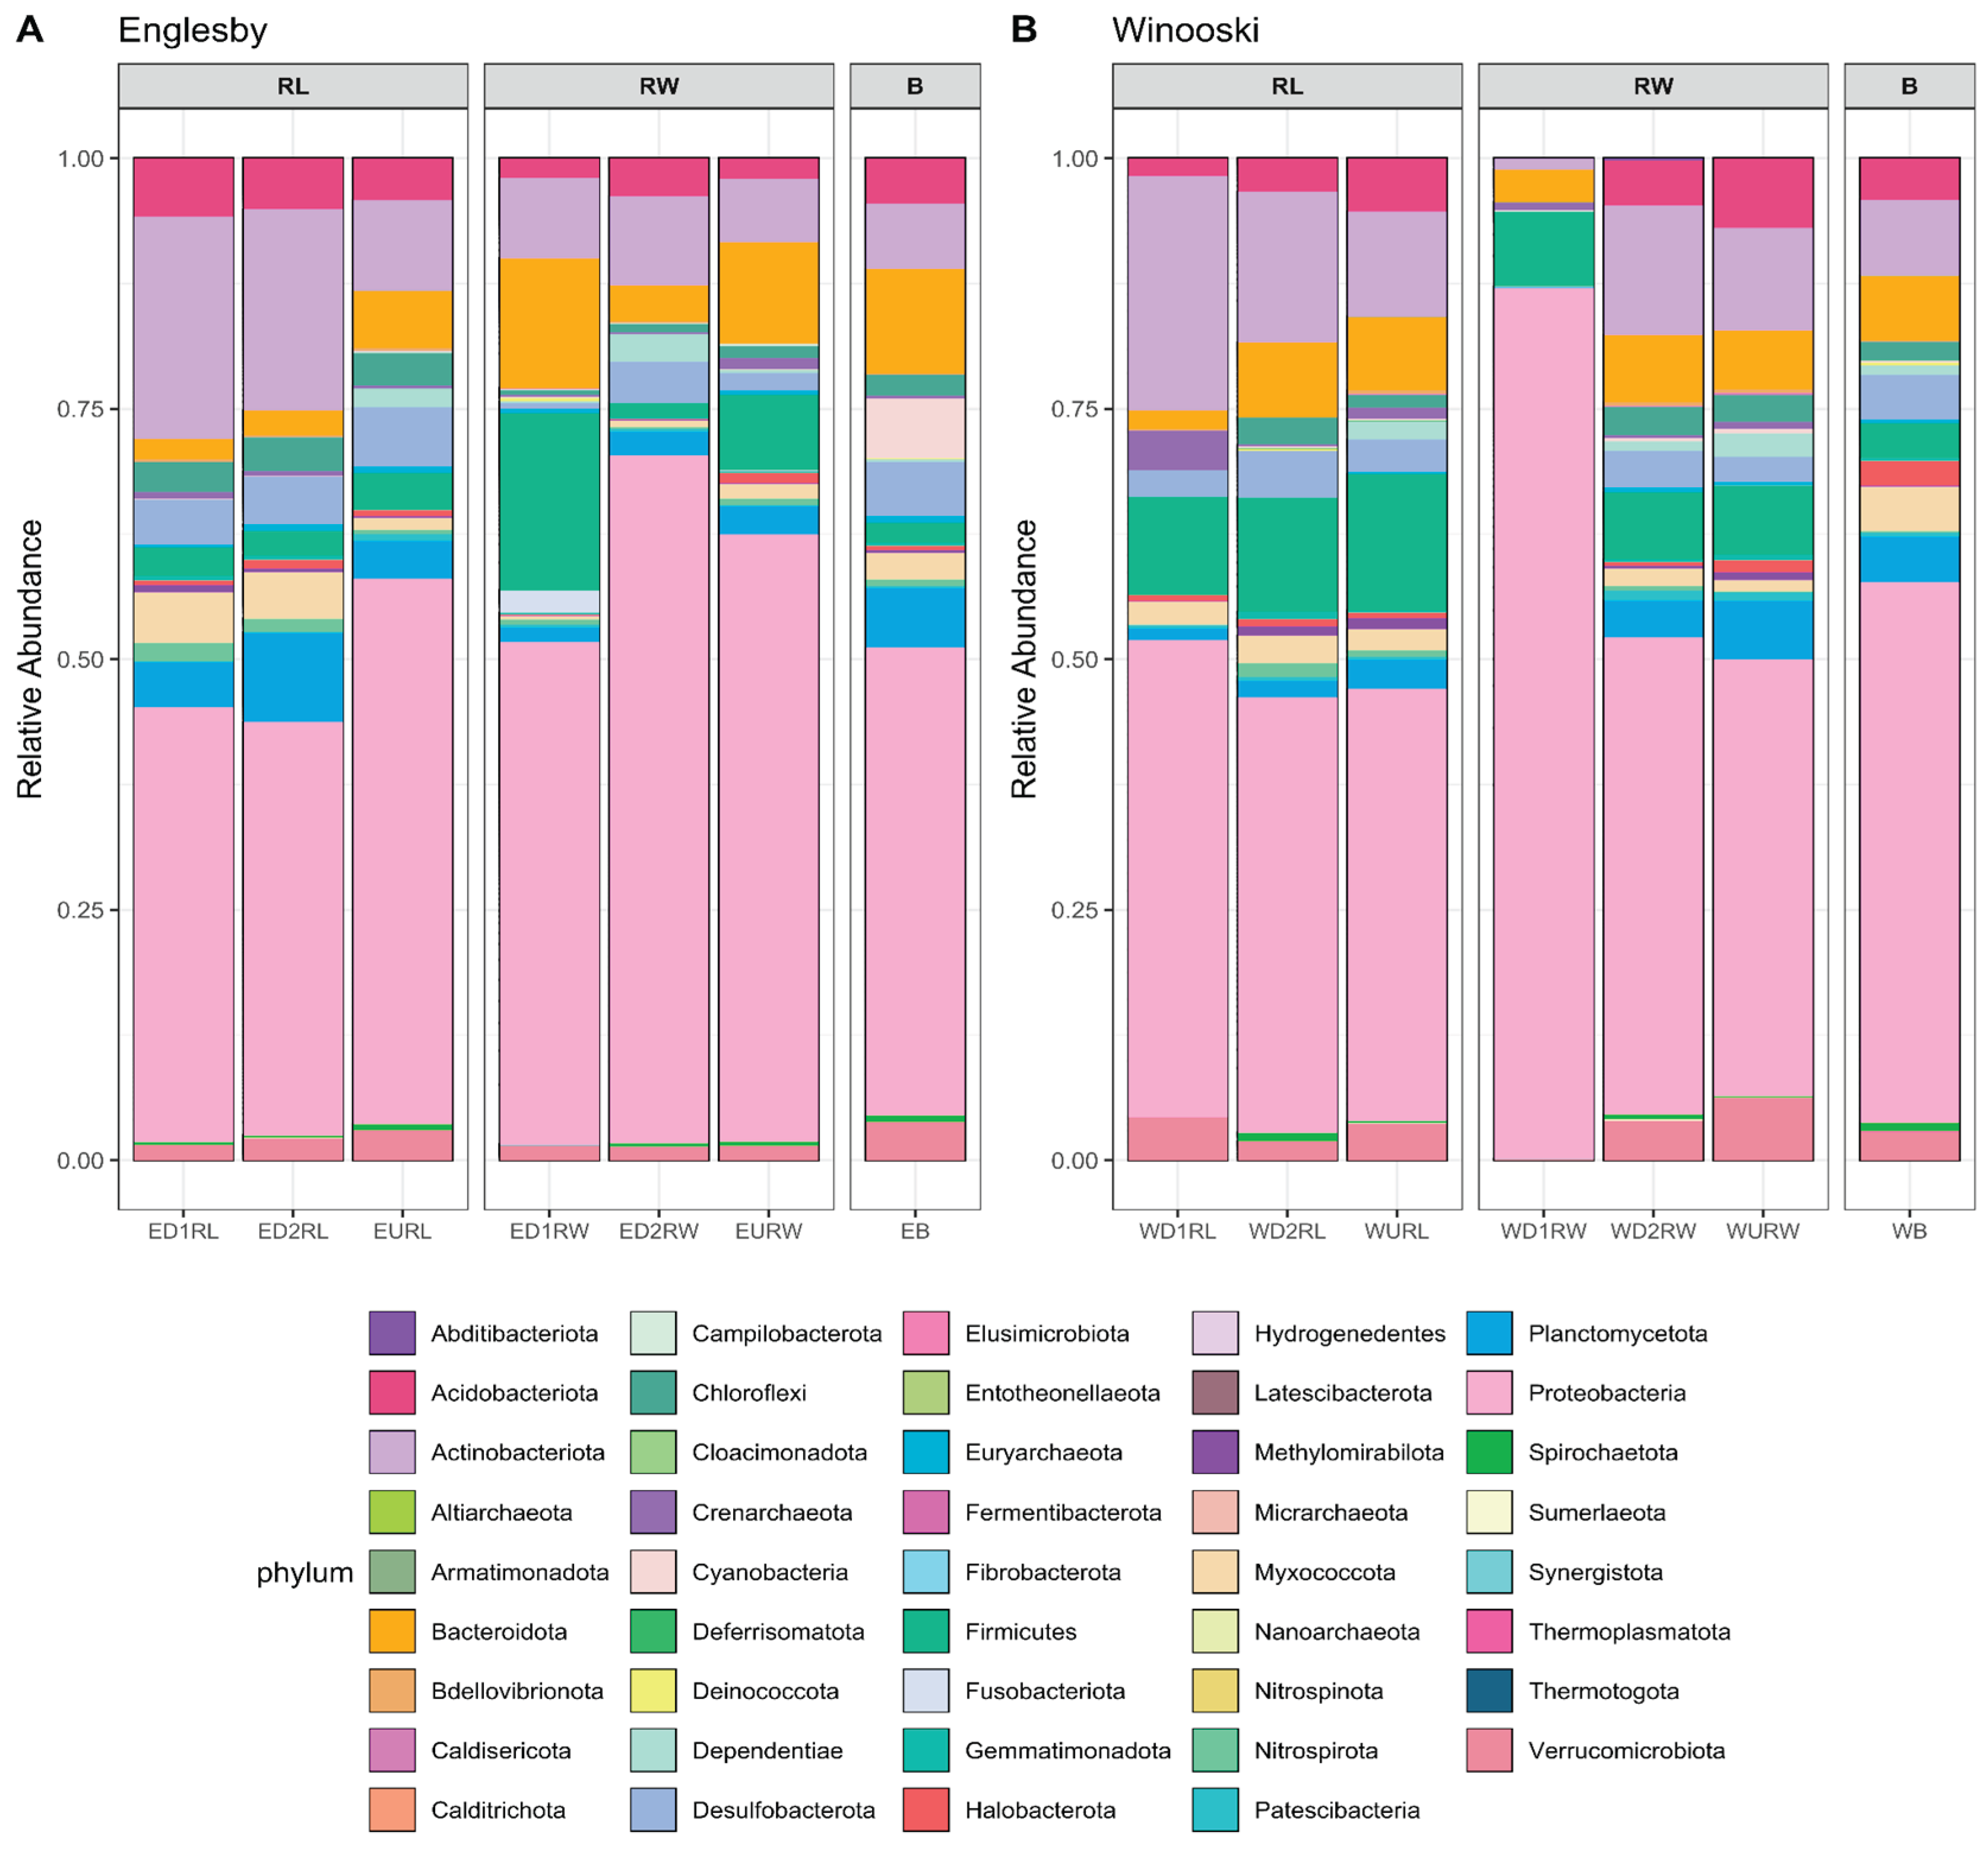
A high diversity of microbes was identified at the phylum level at all sites. Proteobacteria was the most abundant phylum across all 10 sites (Figure A2.3). Other abundant phyla included Actinobacteria, Firmicutes, and Bacteroidota. One Winooski RW site, WD1 RW, had the least observed phylum-level diversity for the 16S rRNA data sets. At the class level, the most abundant taxa across all 10 sites were Gammaproteobacteria, Desulfomonilia, and Bacilli (Figure 5). Overall, genera identified as being capable of Hg-methylation were potentially quite high in abundance in all sampling sites, ranging from 0-5% of ASVs within the samples (Figure 6). Winooski D1 RL and Englesby URL had the greatest abundance of taxa identified as Hg-methylating. Highly abundant genera of Hg-methylators across all sampling sites included Geobacter and Syntrophales. Meanwhile, the phylum of Hg-methylators greatest in abundance across sampling sites was Desulfobacterota (Figure 6).
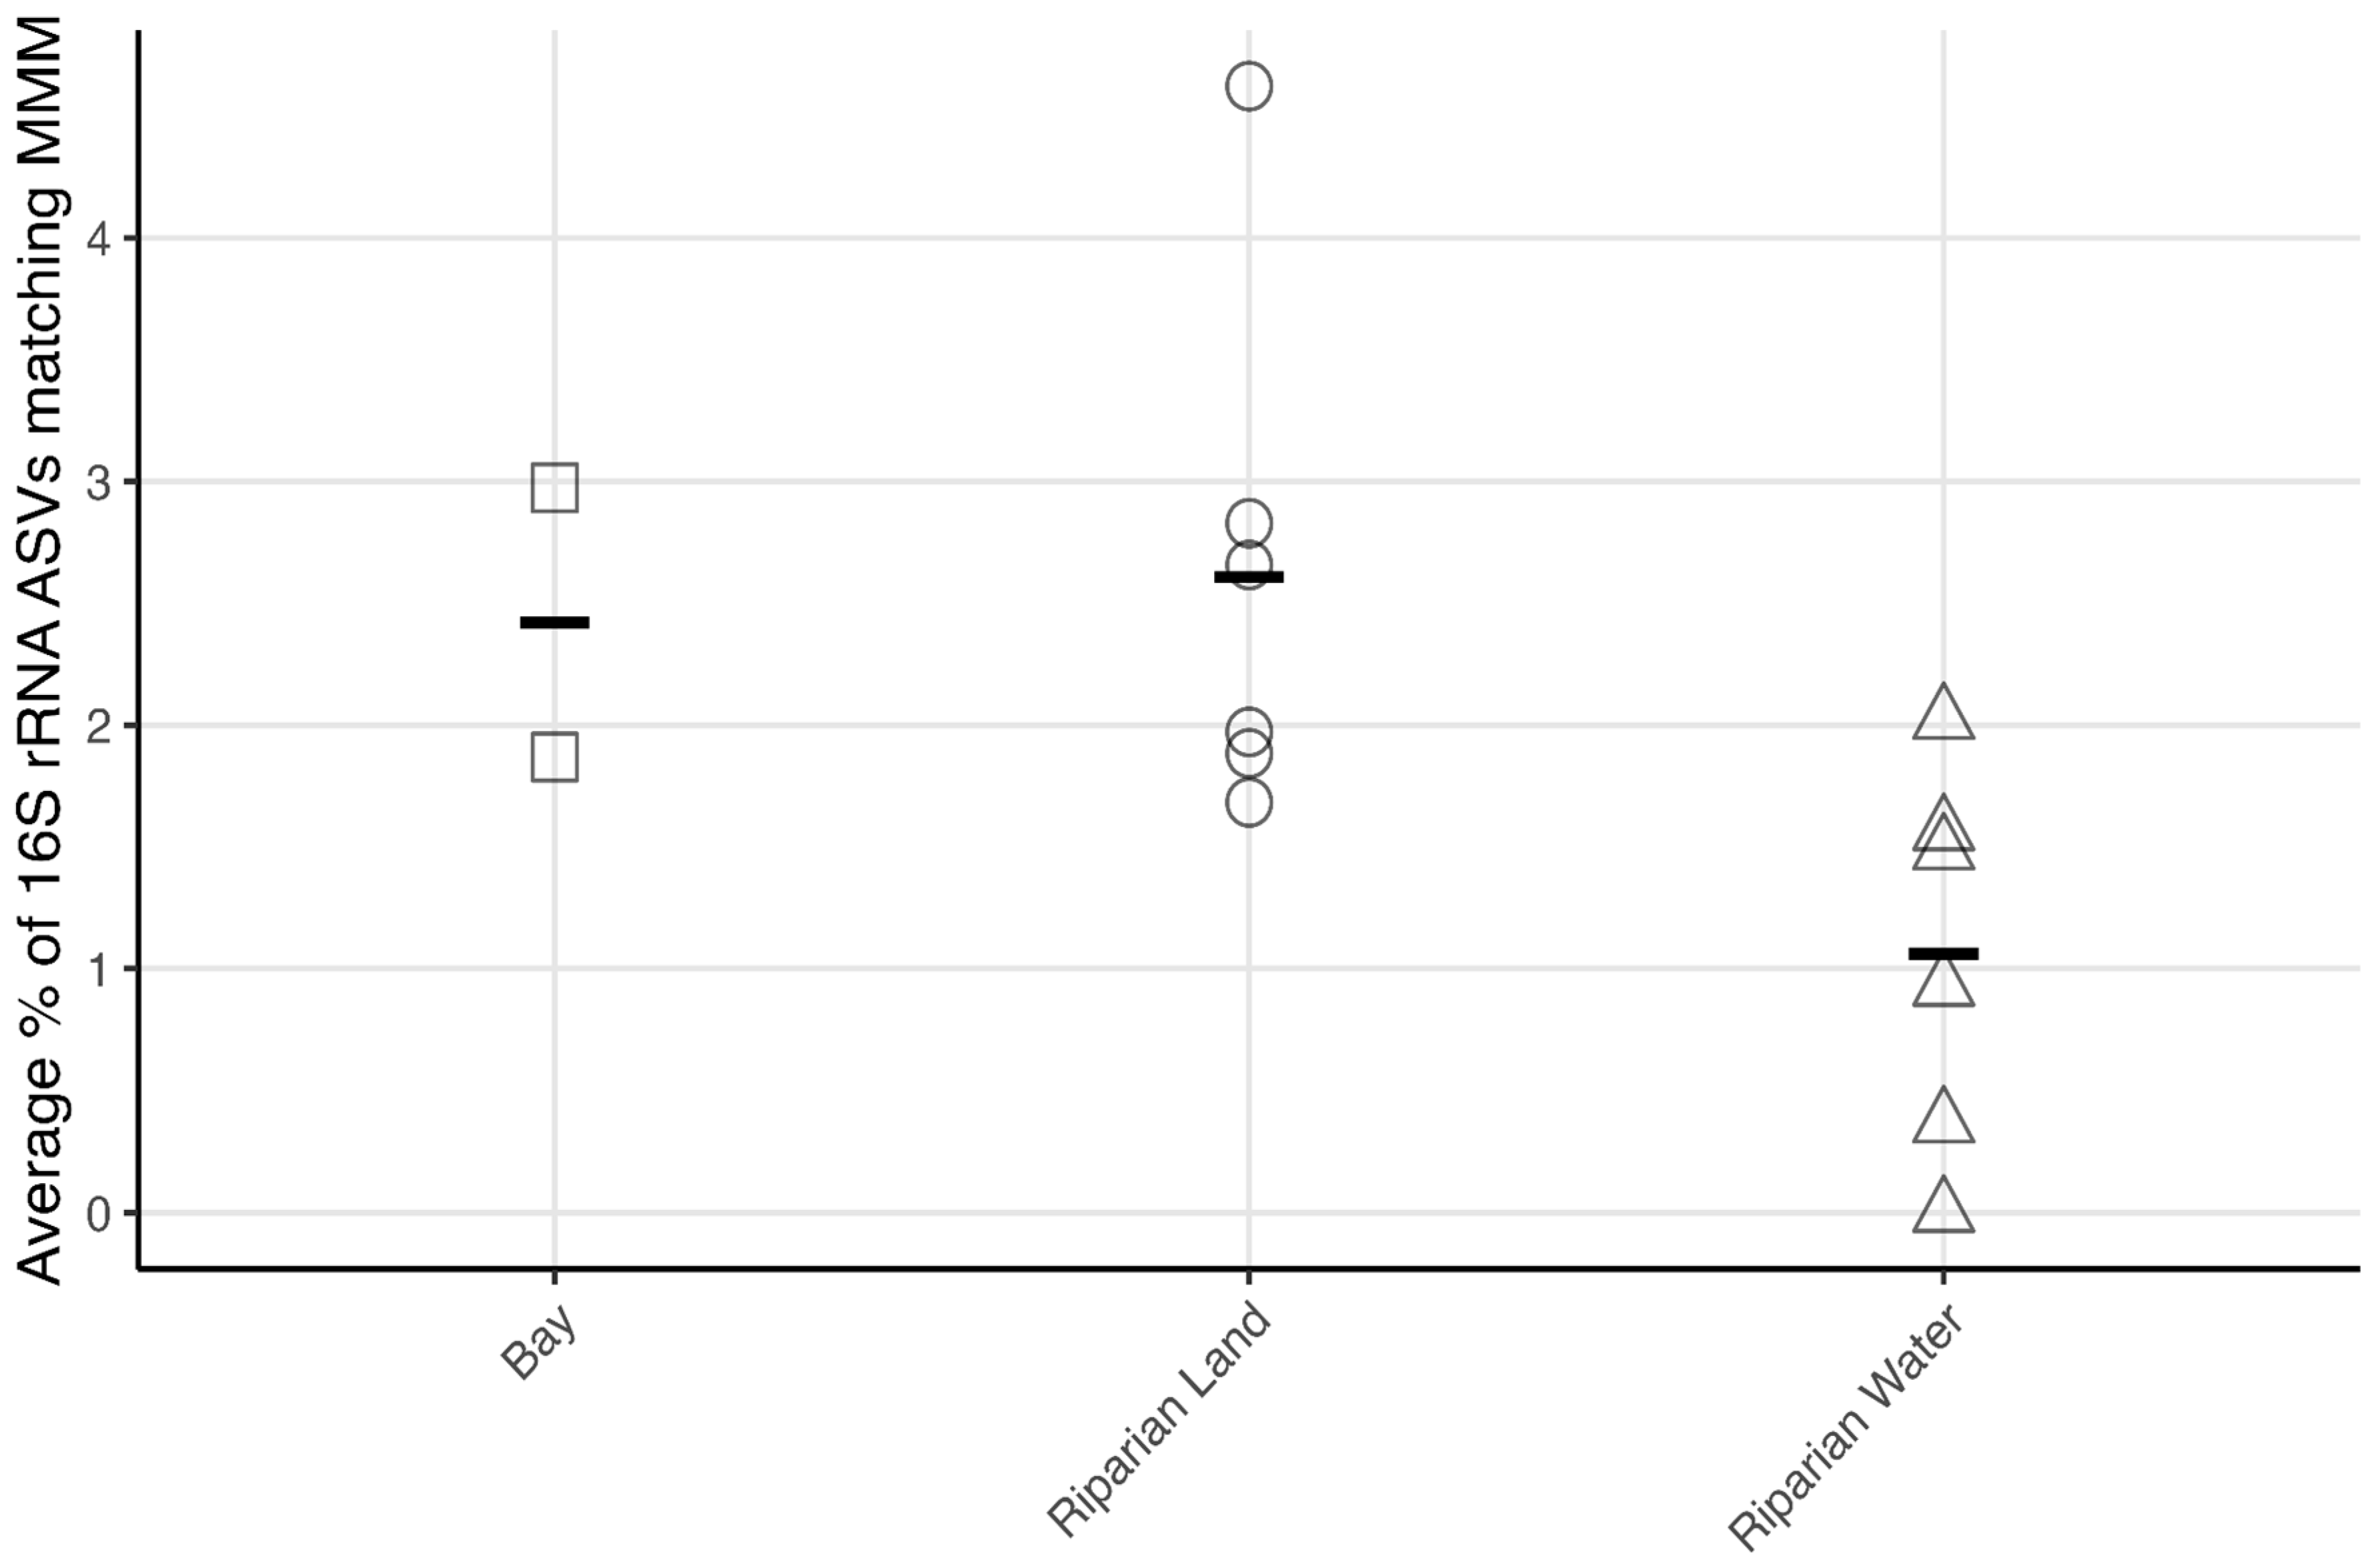
There was no significant difference in the average percentage of 16S rRNA ASVs that matched to Hg-methylating genera between Winooski River and Englesby Brook (p=0.3701). However, among all samples from both streams, the Riparian Land sites had significantly greater average percentage of 16S rRNA ASVs that matched to previously reported Hg-methylating genera (2.6%) compared to Riparian Water (1.0%) (p=0.03731), but not compared to Bay (2.4%) (Figure 7) [42]. While the negative control had some contaminants, there were only 13 ASVs found, as compared to an average of 1580 ASVs for the 15 samples from various sites (Figure 5), and no ASV contaminants found were identified as Hg-methylating genera.
3.3. Metagenome Analysis
Of the total 4,738,586 contigs assembled from our 6 metagenome samples, 5,426,668 genes were annotated. Of these, 46 genes (~0.001%) were identified as HgcA proteins using HMMER (v3.4) analysis (Table A3; Table A4; Table A5) [46]. These protein sequences were classified based on where they had been placed on the maximum likelihood reference HgcA tree. This analysis revealed that half of the sequences could only be identified to a superkingdom level (Table A5). Most of the assigned taxonomy of these proteins were Bacteria, PVC group, and “unclassified Deltaproteobacteria (miscellaneous).” Genera identified from four of the sequences were Clostridium, Syntrophus, Geobacter, and Methanoregula. The classifications of these sequences did not fully match the classifications identified through BLAST.
BLAST search of the identified protein sequences revealed that only 15 out of these 46 protein sequences had a top hit matching an existing HgcA protein sequence within the NCBI database (Table A4). Winooski RW and Winooski Bay had the greatest number of contigs matching to HgcA taxonomy. However, there was only one contig with 100% identity to the HgcA taxonomy identified. Some of the top hits for the protein sequences were mercury methylation corrinoid protein HgcA. However, there were also several top hits described as acetyl-CoA decarbonylase/synthase complex subunit gamma, acetyl-CoA synthase, acetyl- CoA synthase subunit gamma, carbon monoxide dehydrogenase, and “hypothetical protein.” The most abundant taxon identified as having HgcA proteins based on the metagenome analysis were Vicinamibacteria bacterium, with four contigs across the sampling sites being identified as matching to that species. Following that, contigs identified as having hgcA genes also frequently matched to Coriobacteriia bacterium and Deltaproteobacteria bacterium.
4. Discussion
4.1. Mercury Concentrations in Winooski River and Englesby Brook
THg concentrations within sediment samples were generally low and there was no significant difference in THg concentrations between the Riparian Land, Riparian Water, and Bay sites (Figure 2). THg concentrations reported in soil samples from other studies, such as sites near historical point sources of pollution, were around 1000 ng/g [9,49]. THg concentrations found in Vermont sediment samples were also typically higher than those from our study, though such studies are not directly comparable as they did not take sediment samples [26,50]. A possible reason for the generally low THg concentrations is that we sampled during the autumn season, when temperature and stream discharge are the lowest in the year, which are factors predicted to influence THg concentrations [26,51]. It is also possible that the intense floods of July 2023 may have resulted in deposition of sediments with low THg concentrations if any of the flood sediments were derived from a source area with low THg [52].
Comparing the two streams, Englesby Brook sites had higher THg concentrations with a mean of 41.94 ng/g. These results are consistent with previous findings which reported Englesby Brook as having the highest median THg concentration among 18 Lake Champlain tributary sites, as well as the highest annual areal flux at an average of 9.3 µg/m2 from 2001-2009 [53]. Englesby Brook is also situated in a more urban location, and so has increased exposure to industrial sources of Hg, as well as concrete and asphalt surfaces increasing runoff of Hg and other environmental contaminants into the brook. In 2011, Burlington, the city in which 84% of the watershed of Englesby Brook falls into, was categorized as one of the municipalities in Vermont regulated by the Environmental Protection Agency and under the National Pollutant Discharge Elimination System (NDPES) [27]. Finally, due to being a much smaller stream compared to Winooski River, Englesby Brook likely experiences water level fluctuations at a much greater extent than Winooski Brook. This might increase Hg methylation because during conditions of low water level, sulfide can be oxidized to sulfate, which is then mobilized by potentially mercury-methylating SRB during conditions of high-water level [21,22].
4.2. Carbon and Nitrogen Concentrations in Winooski River and Englesby Brook
Overall, average carbon and nitrogen concentrations in dried sediment samples were slightly lower than previously described [5,54]. In Winooski River, the mean carbon concentration in sediment samples (9.97 mg/g dry wt) was an order of magnitude lower than that in wetland sediments [5], while Englesby Brook’s mean carbon concentration (24.3 mg/g dry wt) was similar (Table A1; Table A2). Nitrogen concentrations across all samples averaged 0.85 mg/g, with many samples below the detection limit, aligning with previous river floodplain studies, such as the Thur River [54], where the maximum nitrogen content was 1.8 g/kg. Most nitrogen-deficient samples were from Winooski River, suggesting it is more nitrogen-limited than Englesby Brook, likely due to Winooski River’s sandier sediment composition, as supported by previous research which found that sandy sediments contained less nitrogen [54]. In contrast, Englesby Brook sediment had more silt and clay.
There was no significant difference in average carbon concentration between the streams, but significant differences were observed between Winooski Bay compared to both Winooski Riparian Land and Winooski Riparian Water (Table A1). This was likely due to the high carbon content in Winooski Bay, where debris like wood pieces were present in the sediment samples. This higher carbon content in Winooski Bay suggests potential for elevated mercury (Hg) levels, as indicated by the positive correlation between total Hg (THg) and carbon (Figure 2) and the greater number of Hg-methylating contigs identified in the bay (Table A3 and A4). This significant positive relationship is consistent with previous studies showing a correlation between organic carbon and MeHg in sediments [49,55,56]. This relationship may also be explained through bioaccumulation [1]. Prior research [9] observed a positive correlation between MeHg and total carbon in a sediment site with decomposed fiber accumulation, where microbial processes such as carbon-fixation and sulfide oxidation were likely involved in MeHg production. Although there were significant differences in carbon concentration between Winooski sampling sites, no significant differences in mean THg concentrations were observed. This suggests that future studies should increase sample size and consider sampling at different seasons, to further determine the relationship between carbon and THg concentrations [26,51].
While there was a positive relationship between THg and carbon concentration in Englesby Brook sediment samples, it was not significant (Figure 3B), and the slope was less steep than in Winooski River. This could suggest that most mercury in Englesby Brook sediment remains inorganic, with less conversion to methylmercury (MeHg) and bioaccumulation compared to Winooski River. This is consistent with prior work[26] that found Englesby Brook had one of the lowest methylmercury fractions in the Lake Champlain basin. Our findings also show that Hg-methylating genes were more abundant and the percentage of 16S rRNA ASVs matching Hg-methylating microbes were greater in Winooski River sediments (Table A3; Figure 6).
4.3. Microbial Mercury Methylating Potential in Winooski River and Englesby Brook
The microbial community in the sediment samples showed high diversity at both the phylum and class level, similar to previous studies on Hg-methylating microbes in soil [57,58], with Gammaproteobacteria and Desulfomonilia being the most abundant classes. Several Hg-methylating genera were identified in the sediment samples through 16S rRNA ASVs (Figure 6), consistent with findings in contaminated sediments, which also showed a diverse range of Hg-methylating microbes at the class or genus level. The relative abundance of Hg-methylating genera in our samples was moderately high, exceeding 0.1% in relative abundance, which is considered significant in diverse communities like soil [59]. The most abundant Hg-methylating phylum was Desulfobacterota (Figure 6), which aligns with similar studies on Hg-methylating microbes within soil sediments [5,32,60]. Meanwhile the most abundant Hg-methylating genera were Geobacter, previously also found to be capable of Hg-methylation, and Syntrophales (Figure 6) [61].
The NMDS plot showed no clear microbial community differences between sites within each river (Figure 4), but 16S rRNA analysis revealed that Riparian Land and Bay areas had the highest relative abundance of Hg-methylating microbes, with RL having significantly greater relative abundance than RW (p=0.03731) (Figure 7). Previous studies show a significant correlation between Hg-methylating communities in sediment and MeHg concentration [58], suggesting that the presence of these microbes leads to increased MeHg production. While RL samples in Englesby Brook had higher THg concentrations than RW and Bay, no such difference was observed in Winooski River, likely due to lower carbon concentrations in the sediment, which may hinder the detection of bioaccumulated MeHg (Figure 2; Table A1).
In contrast to the 16S rRNA results, metagenomic analysis showed that RW samples had the most amino acid sequences matching Hg-methylating proteins, not RL samples (Table A3). This discrepancy may be due to the pooling of sediment samples for sequencing, which reduced the granularity of microbial diversity from different sites. The large number of sequences only classified at the superkingdom level when placing sequences on the maximum likelihood reference HgcA tree suggests that the HgcA proteins identified from HMMER search are highly divergent from known HgcA sequences. Meanwhile, the sequences matching to an unclassified Deltaproteobacteria aligns with our current knowledge about Hg-methylating microbes being dominated by sulfate-reducing bacteria [16,57,58].
The differing taxonomic classifications generated through placement of sequences onto a reference tree as compared to a BLAST search might lie in the differing algorithms used to obtain taxonomy. While pplacer aligns sequences of our samples to an existing model only limited to Hg-methylating taxa, BLAST uses pairwise alignment to compare two sequences [62]. Even top hits for BLAST searches were not very high, ranging from 69-100%, with only one sequence having 100% sequence identity (Table A4; Table A5). Further, phylogenetic placement onto a reference tree can be more accurate compared to similarity-based methods when dealing with sequences from metagenome samples with no exact or close matches within the existing database [63]. Phylogenetic placement can also account for greater variability of genes due evolutionary history and events such as horizontal gene transfer, gene duplication, etc. [64].
One surprising finding from the BLAST search of identified HgcA sequences was that the greatest number of sequences matched Vicinamibacteria, a genus recently identified as Hg-methylating [65]. This was not one of the genera detected during the 16S rRNA analysis using originally reported HgcA orthologs [14]. Vicinamibacteria, typically aerobic and neutrophilic [66], have been found in diverse environments, including peat fens [67], cadmium-polluted fields [68], and wastewater treatment plants [59]. Additionally, the abundant Deltaproteobacteria in our samples was expected, as this genus is well-known for Hg-methylation [5,58,69]. The wide distribution of hgcAB sequences supports the hypothesis of horizontal gene transfer of these genes among microbes [32]. This could be tested by analyzing the surrounding ATCG composition to determine if the genes are located on plasmids or areas susceptible to conjugation, transformation, or transduction.
Although only hgcA genes were analyzed to identify Hg-methylating microbes in sediment samples, as the presence of hgcA strongly correlates with Hg-methylating activity [58], hgcB genes are also essential for Hg-methylation. A positive correlation between hgcA abundance and MeHg content has been observed [70], and MeHg levels are significantly linked to sulfate-reducing bacteria (SRB) in other environments [69]. However, the presence of hgcAB genes doesn’t always indicate active Hg-methylation, as some microbes, like Acidobacteria, may have hgcA but not express it [32], highlighting the need for confirmation of methylating activity in a future study. Previous studies have also shown that the hgcAB genes are not crucial for survival or growth of the microbes capable of methylating, and mercury methylation cannot occur without the presence of mercury [14]. Additionally, several metagenomic contigs matched proteins linked to the acetyl-CoA pathway, likely due to the overlap between the Hg-methylation and acetyl-CoA pathways, as the corrinoid protein involved in Hg-methylation is also used in acetyl-CoA metabolism [14,17,32].
5. Conclusions
This study aimed to understand the presence of Hg-methylating microbes and key nutrients in sediment samples impacted by legacy mercury and sulfate deposition. By characterizing microbial communities, searching for Hg-methylating genes in sediment samples from Winooski River and Englesby Brook, Vermont, and analyzing the concentrations of total mercury (THg), carbon, and nitrogen, we gained insights into the relationship between mercury methylation and sediment nutrients. Notably, we discovered a positive correlation between carbon concentration and total mercury concentration in the Winooski River. Winooski River and Englesby Brook had a differentiated microbial community, with Winooski River having a higher relative abundance of Hg-methylating microbes based on 16S rRNA analysis. Additionally, while 16S rRNA analysis suggested that Riparian Land and Bay areas had a greater relative abundance of Hg-methylating microbes, metagenomic analysis indicated that Riparian Water samples had a greater number of sequences identified as hgcA genes. Metagenomics analysis also showed divergent Hg-methylating genes from taxa that were not previously categorized as Hg-methylating from the 16S rRNA analysis. Our study reveals the need for further investigation into mercury-methylating microbes as well as their functional capabilities to better understand these populations and their role in mercury cycling. These findings contribute to the growing understanding of mercury pollution in freshwater ecosystems and provide guidance for future studies on microbial mercury methylation.
Author Contributions
Conceptualization, H.S.F. and E.M.E.; methodology, H.S.F., E.M.E., and S.C.B.; software, H.S.F., E.M.E., and S.C.B.; validation, E.M.E., S.C.B., P.C.R.; formal analysis, H.S.F. and E.M.E.; investigation, H.S.F.; resources, E.M.E., S.C.B., and P.C.R.; data curation, H.S.F.; writing—original draft preparation, H.S.F.; visualization, H.S.F.; supervision, E.M.E.; project administration, H.S.F. and E.M.E.; funding acquisition, H.S.F. and E.M.E. All authors reviewed and edited the manuscript. All authors have read and agreed to the published version of the manuscript.
Funding
This research was funded by the Middlebury College Senior Research Project Supplement, the Lake Champlain Research Consortium, and the Middlebury College Biology Department. Bioinformatic analyses were conducted on the Middlebury College High Performance Computing cluster supported by the National Science Foundation under Grant No. 1827373.
Institutional Review Board Statement
Not applicable since the study did not involve animal or human subjects.
Informed Consent Statement
Data Availability Statement
Raw amplicon and metagenomic sequence reads are available through the NCBI BioProject PRJNA 1277296. R code for sample processing and visualizations can be found here: https://github.com/eme47/MMM.
Acknowledgments
We are grateful to Jeffrey Munroe, Kevin Booth, and Jody Smith (Middlebury College, Middlebury, Vermont, USA) for their assistance on CN analysis of sediment samples.
Conflicts of Interest
The authors declare no conflicts of interest.
Appendix A

Table A1.
Summary of elemental carbon and nitrogen analyses of soil samples in Winooski River. Mean carbon and nitrogen concentration of the 3 site types (RL, RW, B), standard deviation, the correlation coefficient with mean THg concentration, and the results of the ANOVA test between the site types presented.
| Mean (mg/g dry weight) | Standard Deviation (mg/g dry weight) | [THg] Correlation Coefficient | [THg] Correlation p-value | ANOVA of site type (RL, RW, B) p-value | |
| Carbon | 9.97 | 12.4 | 0.819 | 0.02415* | 0.0264* |
| Nitrogen | 0.465 | 0.54 | 0.720 | 0.06799 | 0.3733 |
Table A2.
Summary of elemental carbon and nitrogen analyses of soil samples in Englesby Brook. Mean carbon and nitrogen concentration of the 3 site types (RL, RW, B), standard deviation, the correlation coefficient with mean THg concentration, and the results of the ANOVA test between the site types presented.
| Mean (mg/g dry weight) | Standard Deviation (mg/g dry weight) |
[THg] Correlation Coefficient | [THg] Correlation p-value | ANOVA of site type (RL, RW, B) p-value | |
| Carbon | 24.3 | 17.3 | 0.609 | 0.147 | 0.4701 |
| Nitrogen | 1.23 | 0.99 | 0.611 | 0.1448 | 0.4273 |
Table A3.
Genes identified as HgcA through HMMER search of ORNL Hg-methylator database, followed by placement of sequences on maximum likelihood HgcA reference tree. Metagenome samples from each sampling site within each river were pooled (see Methods). Metagenome samples: 1) Winooski RL; 2) Winooski RW; 3) Winooski Bay; 4) Englesby RL; 5) Englesby RW; 6) Englesby Bay. *Note that Deltaproteobacteria in this class are now classified as Myxococcia [71].
| Metagenome Sample | Gene Identifier | Taxa | Rank |
| 1 | k127_249317_1/32-98 | unclassified Deltaproteobacteria* (miscellaneous) | class |
| 1 | k127_128388_1/54-88 | unclassified Deltaproteobacteria (miscellaneous) | class |
| 1 | k127_514746_1/32-93 | PVC group | superkingdom |
| 1 | k127_359497_1/14-80 | unclassified Deltaproteobacteria (miscellaneous) | class |
| 1 | k127_115407_1/36-100 | Bacteria | superkingdom |
| 2 | k127_543503_1/64-123 | unclassified Aminicenantes | phylum |
| 2 | k127_113881_1/28-94 | Bacteria candidate phyla | superkingdom |
| 2 | k127_41359_2/81-142 | PVC group | superkingdom |
| 2 | k127_105381_1/6-70 | unclassified Aminicenantes | phylum |
| 2 | k127_518700_1/103-169 | Bacteria candidate phyla | superkingdom |
| 2 | k127_74396_1/69-124 | Bacteria | superkingdom |
| 2 | k127_215905_1/26-92 | Clostridium | genus |
| 2 | k127_377289_2/17-79 | PVC group | superkingdom |
| 2 | k127_558869_1/81-122 | Syntrophus | genus |
| 2 | k127_475689_1/46-112 | Desulfuromonadales | order |
| 2 | k127_71277_1/71-134 | Bacteria | superkingdom |
| 3 | k127_871999_2/119-181 | Bacteria | superkingdom |
| 3 | k127_227989_1/42-99 | PVC group | superkingdom |
| 3 | k127_183458_1/81-107 | unclassified Nitrospirae | phylum |
| 3 | k127_534465_1/70-136 | Desulfuromonadales | order |
| 3 | k127_84606_1/76-142 | Geobacter | genus |
| 3 | k127_227221_1/29-92 | PVC group | superkingdom |
| 3 | k127_965374_1/84-113 | Chlorobi | phylum |
| 3 | k127_701156_1/32-97 | Bacteria | superkingdom |
| 3 | k127_773411_1/66-111 | Desulfuromonadaceae | family |
| 3 | k127_559882_1/46-103 | PVC group | superkingdom |
| 3 | k127_476835_1/10-76 | unclassified Syntrophobacterales | order |
| Metagenome Sample | Gene Identifier | Taxa | Rank |
| 3 | k127_137838_1/58-124 | unclassified Deltaproteobacteria (miscellaneous) | class |
| 3 | k127_418219_1/74-109 | unclassified Syntrophobacterales | order |
| 3 | k127_565953_2/4-66 | Bacteria | superkingdom |
| 3 | k127_585427_1/30-87 | PVC group | superkingdom |
| 4 | k127_81980_2/43-107 | PVC group | superkingdom |
| 4 | k127_453491_1/26-87 | PVC group | superkingdom |
| 4 | k127_398936_1/78-113 | unclassified Elusimicrobia | phylum |
| 5 | k127_523515_1/39-100 | PVC group | superkingdom |
| 5 | k127_547747_1/104-158 | Bacteria | superkingdom |
| 5 | k127_245078_1/1-60 | unclassified Bdellovibrionales | order |
| 5 | k127_463503_1/2-50 | unclassified Lentisphaerae (miscellaneous) | phylum |
| 5 | k127_139044_1/77-122 | Desulfobulbaceae | family |
| 6 | k127_701584_1/55-121 | Methanoregula | genus |
| 6 | k127_345503_1/369-433 | Bacteria | superkingdom |
| 6 | k127_250083_1/13-73 | Bacteria | superkingdom |
| 6 | k127_282016_2/2-53 | Bacteria | superkingdom |
| 6 | k127_558855_1/86-152 | unclassified Deltaproteobacteria (miscellaneous) | class |
| 6 | k127_617542_1/81-147 | unclassified Deltaproteobacteria (miscellaneous) | class |
| 6 | k127_203177_1/42-103 | Bacteria | superkingdom |
Table A4.
Taxonomy of top BLAST hits of proteins identified as HgcA through HMMER search of ORNL Hg-methylator database, including E-value and percent identity. Metagenome samples from each sampling site within each river were pooled (see Methods). Metagenome samples: 1) Winooski RL; 2) Winooski RW; 3) Winooski Bay; 4) Englesby RL; 5) Englesby RW. *Note that Deltaproteobacteria in this class are now classified as Myxococcia [71].
| Metagenome Sample | Gene Identifier | HgcA Taxonomy | E-value | Percent Identity (%) |
| 1 | k127_249317_1/32-98 | Vicinamibacteria bacterium | 4.00×10-61 | 82.11 |
| 1 | k127_359497_1/14-80 | Thermodesulfobacteriota bacterium | 4.00×10-62 | 93.46 |
| 2 | k127_543503_1/64-123 | Coriobacteriia bacterium | 5.00×10-56 | 73.77 |
| 2 | k127_105381_1/6-70 | Candidatus Desulfaltia sp. | 1.00×10-47 | 79 |
| 2 | k127_475689_1/46-112 | Deltaproteobacteria bacterium* | 2.00×10-63 | 89.47 |
| 3 | k127_183458_1/81-107 | Nitrospirota bacterium | 1.00×10-55 | 80.56 |
| 3 | k127_534465_1/70-136 | Vicinamibacteria bacterium | 3.00×10-80 | 78.12 |
| 3 | k127_965374_1/84-113 | Vicinamibacteria bacterium | 2.00×10-48 | 73.45 |
| 3 | k127_773411_1/66-111 | Coriobacteriia bacterium | 4.00×10-50 | 76.58 |
| 3 | k127_137838_1/58-124 | Planctomycetia bacterium | 5.00×10-87 | 78.92 |
| 3 | k127_418219_1/74-109 | Spriochaetia bacterium | 2.00×10-50 | 75.23 |
| 4 | k127_398936_1/78-113 | Deltaproteobacteria bacterium | 2.00×10-65 | 89.38 |
| 5 | k127_245078_1/1-60 | Vicinamibacteria bacterium | 1.00×10-54 | 93.88 |
| 5 | k127_463503_1/2-50 | Deltaproteobacteria bacterium | 1.00×10-130 | 90.56 |
| 5 | k127_139044_1/77-122 | Desulfobulbus sp. | 4.00×10-74 | 95.08 |
Table A5.
Genes with potential match to Hg-methylating amino acid sequence based on HMMER search of ORNL Hg-methylator database, followed by BLAST search. Metagenome samples from each sampling site within each river were pooled (see Methods). Metagenome samples: 1) Winooski RL; 2) Winooski RW; 3) Winooski Bay; 4) Englesby RL; 5) Englesby RW; 6) Englesby Bay. *Note that Deltaproteobacteria in this class are now classified as Myxococcia [71].
| Sample | Contig Identifier |
HgcA Taxonomy |
E-value |
Percent Identity (%) |
Description |
| 1 | k127_128388_1/54-88 | Smithella sp. PtaU1.Bin162 | 6.00×10-47 | 87.5 | acetyl-CoA decarbonylase/synthase complex subunit gamma |
| k127_514746_1/32-93 | Candidatus Deferrimicrobium sp. | 4.00×10-70 | 95.54 | hypothetical protein | |
| k127_115407_1/36-100 | Desulfobacterales bacterium | 1.00×10-66 | 91.59 | acetyl-CoA decarbonylase/synthase complex subunit gamma | |
| 2 | k127_113881_1/28-94 | Coriobacteriia bacterium | 3.00×10-77 | 82.14 | acetyl-CoaA synthase subunit gamma |
| k127_518700_1/103-169 | Coriobacteriia bacterium | 5.00×10-117 | 79.25 | acetyl-CoaA synthase subunit gamma | |
| k127_215905_1/26-92 | Spirochaetes bacterium | 2.00×10-54 | 71.07 | acetyl-CoaA synthase subunit gamma | |
| k127_558869_1/81-122 | Methanomassiliicoccaceae archaeon | 4.00×10-54 | 69.17 | carbon monoxide dehydrogenase | |
| k127_41359_2/81-142 | Candidatus Deferrimicrobium sp. | 4.00×10-107 | 96.27 | hypothetical protein | |
| k127_74396_1/69-124 | Anaerolineae bacterium | 7.00×10-71 | 82.4 | hypothetical protein | |
| 2 | k127_377289_2/17-79 | Pseudomonadota bacterium | 6.00×10-54 | 97.83 | acetyl-CoA decarbonylase/synthase complex subunit gamma |
| k127_71277_1/71-134 | Thermoleophilia bacterium | 2.00×10-85 | 85.42 | acetyl-CoA decarbonylase/synthase complex subunit gamma | |
| Sample | Contig Identifier |
HgcA Taxonomy |
E-value |
Percent Identity (%) |
Description |
| 3 | k127_84606_1/76-142 | Deltaproteobacteria bacterium | 3.00×10-103 | 76.04 | acetyl-CoaA synthase subunit gamma |
| k127_871999_2/119-181 | Miltoncostaeaceae bacterium | 1.00×10-48 | 82.52 | Fe-S cluster assembly protein SufD | |
| k127_227989_1/42-99 | Thermoproteota archaeon | 6.00×10-66 | 97.25 | acetyl-CoA decarbonylase/synthase complex subunit gamma | |
| k127_227221_1/29-92 | Methanomicrobiales archaeon HGW-Methanomicrobiales-5 | 1.00×10-62 | 92.16 | acetyl-CoA synthase | |
| k127_701156_1/32-97 | Deltaproteobacteria bacterium | 2.00×10-62 | 90.83 | acetyl-CoA decarbonylase/synthase complex subunit gamma | |
| k127_559882_1/46-103 | Candidatus Bathyarchaeia archaeon | 7.00×10-70 | 93.81 | hypothetical protein | |
| k127_476835_1/10-76 | Syntrophus sp. GWC2_56_31 | 4.00×10-81 | 91.85 | acetyl-CoaA synthase subunit gamma | |
| k127_565953_2/4-66 | Deltaproteobacteria bacterium | 6.00×10-39 | 85.33 | acetyl-CoA decarbonylase/synthase complex subunit gamma | |
| k127_585427_1/30-87 | Candidatus Acidoferrales bacterium | 8.00×10-57 | 100 | acetyl-CoA decarbonylase/synthase complex subunit gamma | |
| 4 | k127_81980_2/43-107 | Coriobacteriia bacterium | 1.00×10-64 | 85.34 | acetyl-CoA decarbonylase/synthase complex subunit gamma |
| k127_453491_1/26-87 | Candidatus Deferrimicrobium sp. | 6.00×10-64 | 97.09 | hypothetical protein | |
| Sample | Contig Identifier |
HgcA Taxonomy |
E-value |
Percent Identity (%) |
Description |
| 5 | k127_523515_1/39-100 | Candidatus Deferrimicrobium sp. | 1.00×10-70 | 97.27 | hypothetical protein |
| k127_547747_1/104-158 | Desulfobaccales bacterium | 1.00×10-106 | 98.1 | acetyl-CoA decarbonylase/synthase complex subunit gamma | |
| 6 | k127_617542_1/81-147 | Deltraproteobacteria bacterium | 2×10-128 | 92.27 | hypothetical protein |
| k127_701584_1/55-121 | Methanoregulaceae archaeon | 2.00×10-104 | 89.41 | carbon monoxide dehydrogenase | |
| k127_250083_1/13-73 | Chloroflexota bacterium | 2.00×10-47 | 81.72 | acetyl-CoA decarbonylase/synthase complex subunit gamma | |
| k127_282016_2/2-53 | Rubrobacteridae bacterium | 3.00×10⁻²⁷ | 77.05 | acetyl-CoA decarbonylase/synthase complex subunit gamma | |
| k127_558855_1/86-152 | Desulfobacteraceae bacterium | 0 | 86.84 | acetyl-CoaA synthase subunit gamma | |
| k127_203177_1/42-103 | Chloroflexota bacterium | 5.00×10-64 | 97.09 | acetyl-CoA decarbonylase/synthase complex subunit gamma |
Figure A2.1.
Carbon concentration (mg/g dry weight) in soil samples taken from Winooski River (A) and Englesby Brook (B). Each color represents one sampling site (D1=Downstream 1, D2=Downstream 2, U=Upstream). B=Bay, RL=Riparian Land, RW=Riparian Water.
Figure A2.1.
Carbon concentration (mg/g dry weight) in soil samples taken from Winooski River (A) and Englesby Brook (B). Each color represents one sampling site (D1=Downstream 1, D2=Downstream 2, U=Upstream). B=Bay, RL=Riparian Land, RW=Riparian Water.
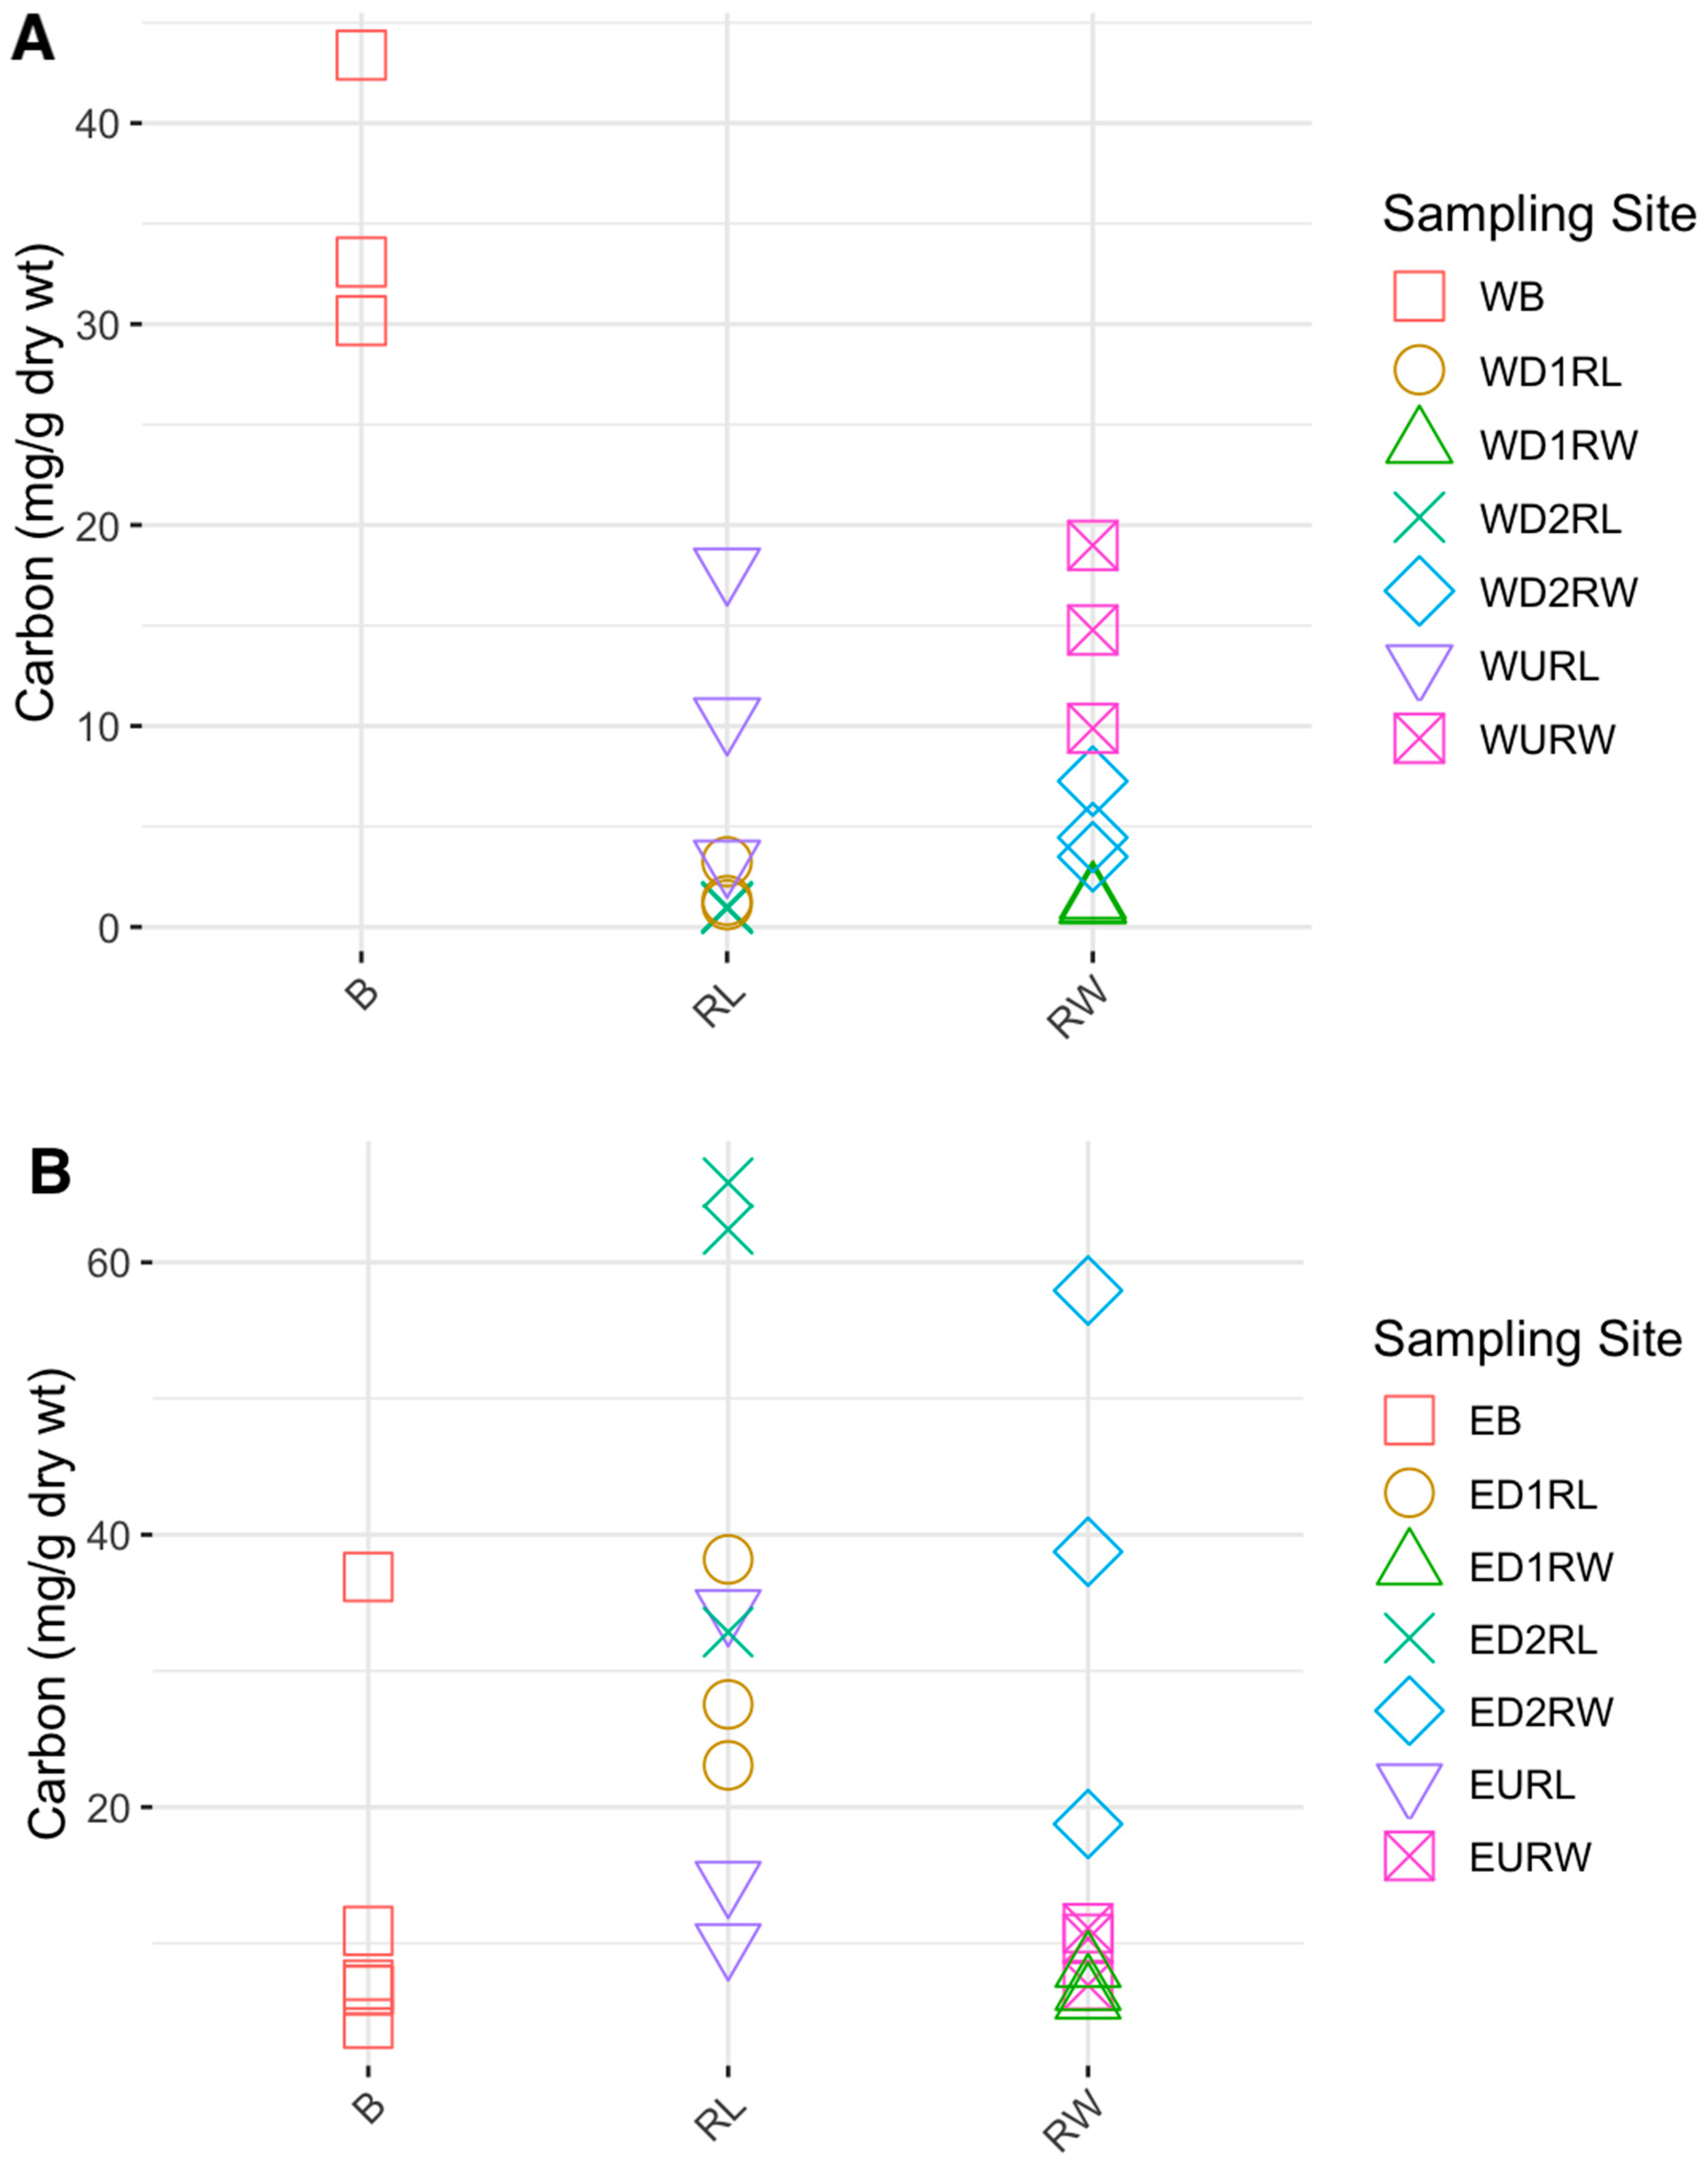
Figure A2.2.
Nitrogen concentration (mg/g dry weight) in soil samples taken from Winooski River (A) and Englesby Brook (B). Each color represents one sampling site (D1=Downstream 1, D2=Downstream 2, U=Upstream). B=Bay, RL=Riparian Land, RW=Riparian Water.
Figure A2.2.
Nitrogen concentration (mg/g dry weight) in soil samples taken from Winooski River (A) and Englesby Brook (B). Each color represents one sampling site (D1=Downstream 1, D2=Downstream 2, U=Upstream). B=Bay, RL=Riparian Land, RW=Riparian Water.
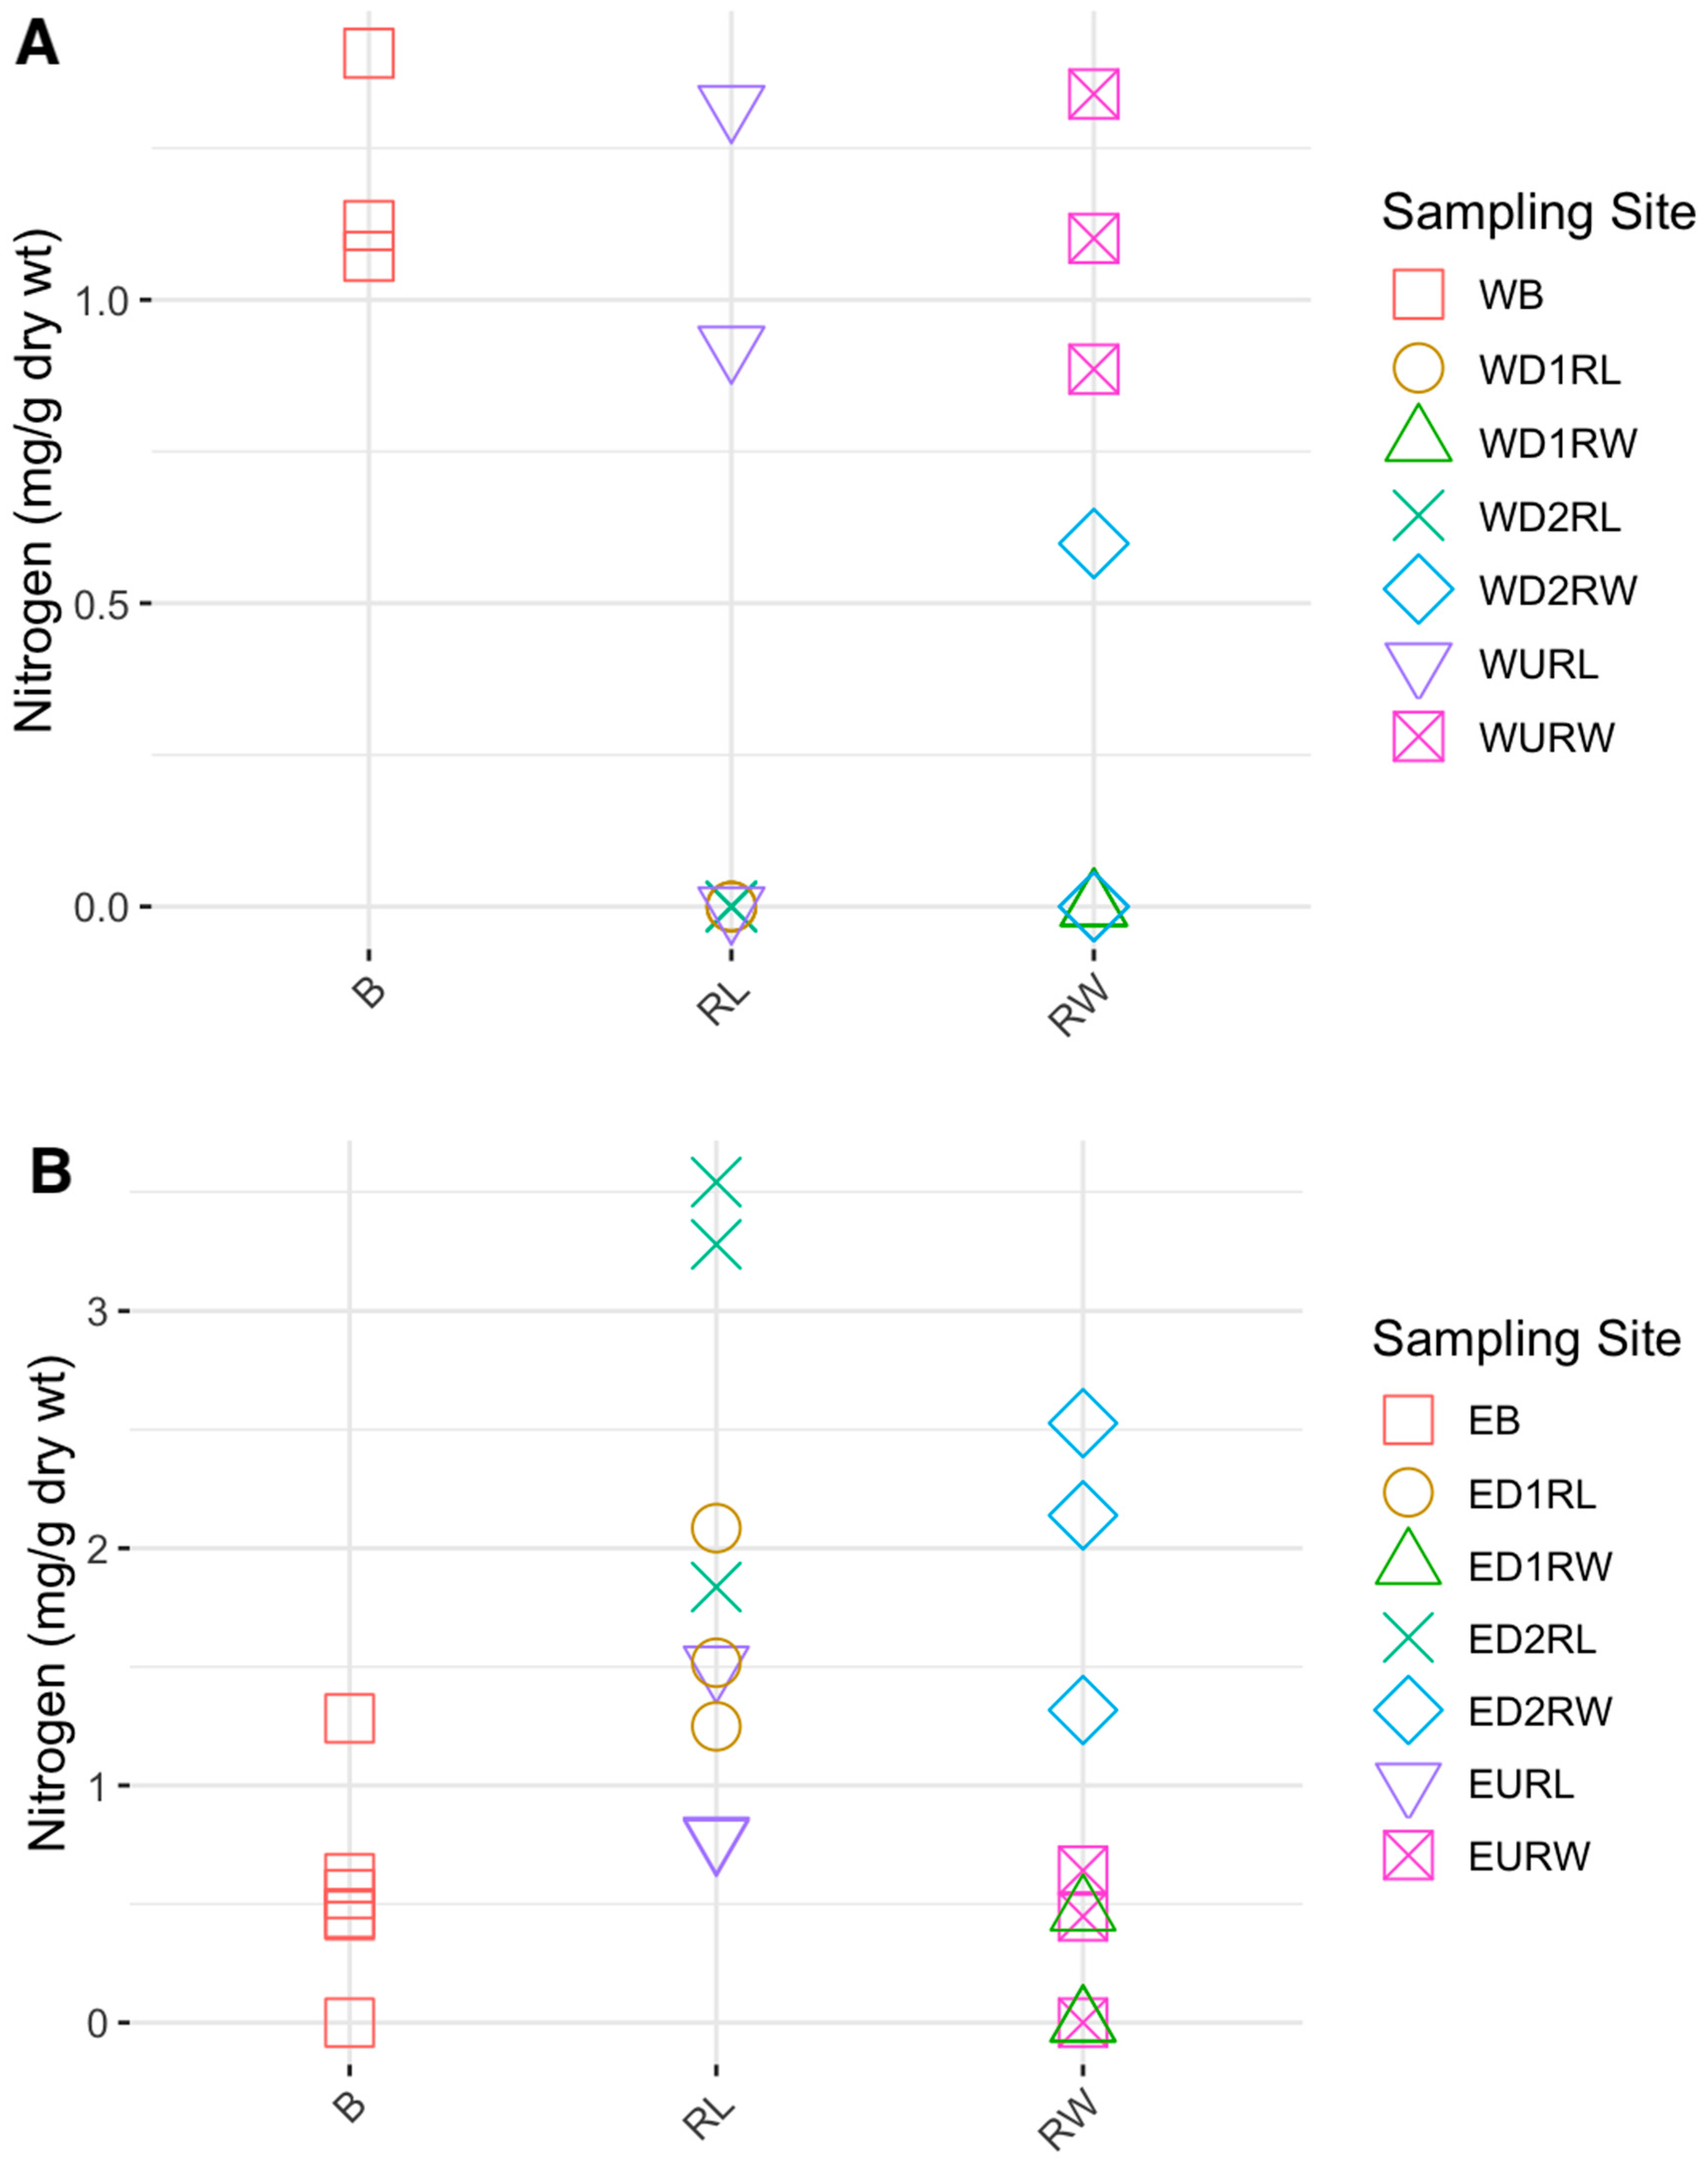
Figure A2.3.
Microbial community distribution in the Englesby Brook (A) and Winooski River (B) sediment samples. Relative abundances of microbial phyla based on 16S rRNA ASVs for Englesby Brook and Winooski River at the three sampling sites within each (RL, RW, Bay). Relative abundance scale 0-1, with 1 equal to 100%.
References
- Morel, F.M.M.; Kraepiel, A.M.L.; Amyot, M. The Chemical Cycle and Bioaccumulation of Mercury. Annu. Rev. Ecol. Syst. 1998, 29, 543–566. [Google Scholar] [CrossRef]
- Chen, C.Y.; Driscoll, C.T.; Eagles-Smith, C.A.; Eckley, C.S.; Gay, D.A.; Hsu-Kim, H.; Keane, S.E.; Kirk, J.L.; Mason, R.P.; Obrist, D.; et al. A Critical Time for Mercury Science to Inform Global Policy. Environ. Sci. Technol. 2018, 52, 9556–9561. [Google Scholar] [CrossRef] [PubMed]
- Basu, N.; Bastiansz, A.; Dórea, J.G.; Fujimura, M.; Horvat, M.; Shroff, E.; Weihe, P.; Zastenskaya, I. Our Evolved Understanding of the Human Health Risks of Mercury. Ambio 2023, 52, 877–896. [Google Scholar] [CrossRef] [PubMed]
- Tong, S.; Li, H.; Wang, L.; Tudi, M.; Yang, L. Concentration, Spatial Distribution, Contamination Degree and Human Health Risk Assessment of Heavy Metals in Urban Soils across China between 2003 and 2019—A Systematic Review. Int. J. Environ. Res. Public. Health 2020, 17, 3099. [Google Scholar] [CrossRef] [PubMed]
- Brahmstedt, E.S.; Zhou, H.; Eggleston, E.M.; Holsen, T.M.; Twiss, M.R. Assessment of Mercury Mobilization Potential in Upper St. Lawrence River Riparian Wetlands under New Water Level Regulation Management. J. Gt. Lakes Res. 2019, 45, 735–741. [Google Scholar] [CrossRef]
- Leclerc, M.; Harrison, M.C.; Storck, V.; Planas, D.; Amyot, M.; Walsh, D.A. Microbial Diversity and Mercury Methylation Activity in Periphytic Biofilms at a Run-of-River Hydroelectric Dam and Constructed Wetlands. mSphere 2021, 6, e00021-21. [Google Scholar] [CrossRef] [PubMed]
- Paranjape, A.R.; Hall, B.D. Recent Advances in the Study of Mercury Methylation in Aquatic Systems. FACETS 2017, 2, 85–119. [Google Scholar] [CrossRef]
- Eckley, C.S.; Hintelmann, H. Determination of Mercury Methylation Potentials in the Water Column of Lakes across Canada. Sci. Total Environ. 2006, 368, 111–125. [Google Scholar] [CrossRef] [PubMed]
- Regnell, O.; Elert, M.; Höglund, L.O.; Falk, A.H.; Svensson, A. Linking Cellulose Fiber Sediment Methyl Mercury Levels to Organic Matter Decay and Major Element Composition. AMBIO 2014, 43, 878–890. [Google Scholar] [CrossRef] [PubMed]
- Watras, C.; Bloom, N.S. The Vertical Distribution of Mercury Species in Wisconsin Lake: Accumulation in Plankton Layers. In; 1994; pp. 137–152 ISBN 978-1-56670-066-5.
- Graham, A.M.; Bullock, A.L.; Maizel, A.C.; Elias, D.A.; Gilmour, C.C. Detailed Assessment of the Kinetics of Hg-Cell Association, Hg Methylation, and Methylmercury Degradation in Several Desulfovibrio Species. Appl. Environ. Microbiol. 2012, 78, 7337–7346. [Google Scholar] [CrossRef] [PubMed]
- Hamdy, M.K.; Noyes, O.R. Formation of Methyl Mercury by Bacteria. Appl. Microbiol. 1975, 30, 424–432. [Google Scholar] [CrossRef] [PubMed]
- Silver, S.; Phung, L.T. A Bacterial View of the Periodic Table: Genes and Proteins for Toxic Inorganic Ions. J. Ind. Microbiol. Biotechnol. 2005, 32, 587–605. [Google Scholar] [CrossRef] [PubMed]
- Parks, J.M.; Johs, A.; Podar, M.; Bridou, R.; Hurt, R.A.; Smith, S.D.; Tomanicek, S.J.; Qian, Y.; Brown, S.D.; Brandt, C.C.; et al. The Genetic Basis for Bacterial Mercury Methylation. Science 2013, 339, 1332–1335. [Google Scholar] [CrossRef] [PubMed]
- Gilmour, C.C.; Elias, D.A.; Kucken, A.M.; Brown, S.D.; Palumbo, A.V.; Schadt, C.W.; Wall, J.D. Sulfate-Reducing Bacterium Desulfovibrio Desulfuricans ND132 as a Model for Understanding Bacterial Mercury Methylation. Appl. Environ. Microbiol. 2011, 77, 3938–3951. [Google Scholar] [CrossRef] [PubMed]
- Compeau, G.C.; Bartha, R. Sulfate-Reducing Bacteria: Principal Methylators of Mercury in Anoxic Estuarine Sediment. Appl. Environ. Microbiol. 1985, 50, 498–502. [Google Scholar] [CrossRef] [PubMed]
- Choi, S.-C.; Chase, T.; Bartha, R. Metabolic Pathways Leading to Mercury Methylation in Desulfovibrio Desulfuricans LS. Appl. Environ. Microbiol. 1994, 60, 4072–4077. [Google Scholar] [CrossRef] [PubMed]
- Regnell, O.; Watras, Carl. J. Microbial Mercury Methylation in Aquatic Environments: A Critical Review of Published Field and Laboratory Studies. Environ. Sci. Technol. 2019, 53, 4–19. [Google Scholar] [CrossRef] [PubMed]
- Qian, C.; Johs, A.; Chen, H.; Mann, B.F.; Lu, X.; Abraham, P.E.; Hettich, R.L.; Gu, B. Global Proteome Response to Deletion of Genes Related to Mercury Methylation and Dissimilatory Metal Reduction Reveals Changes in Respiratory Metabolism in Geobacter Sulfurreducens PCA. J. Proteome Res. 2016, 15, 3540–3549. [Google Scholar] [CrossRef] [PubMed]
- Gilmour, C.C.; Podar, M.; Bullock, A.L.; Graham, A.M.; Brown, S.D.; Somenahally, A.C.; Johs, A.; Hurt, R.A.Jr.; Bailey, K.L.; Elias, D.A. Mercury Methylation by Novel Microorganisms from New Environments. Environ. Sci. Technol. 2013, 47, 11810–11820. [Google Scholar] [CrossRef] [PubMed]
- Eckley, C.S.; Luxton, T.P.; McKernan, J.L.; Goetz, J.; Goulet, J. Influence of Reservoir Water Level Fluctuations on Sediment Methylmercury Concentrations Downstream of the Historical Black Butte Mercury Mine, OR. Appl. Geochem. 2015, 61, 284–293. [Google Scholar] [CrossRef]
- Sorensen, J.A.; Kallemeyn, L.W.; Sydor, M. Relationship between Mercury Accumulation in Young-of-the-Year Yellow Perch and Water-Level Fluctuations. Environ. Sci. Technol. 2005, 39, 9237–9243. [Google Scholar] [CrossRef] [PubMed]
- Watras, C.J.; Morrison, K.A. The Response of Two Remote, Temperate Lakes to Changes in Atmospheric Mercury Deposition, Sulfate, and the Water Cycle. Can. J. Fish. Aquat. Sci. 2008, 65, 100–116. [Google Scholar] [CrossRef]
- Smith, T.L.; Olson, S.A.; LeNoir, J.M.; Kalmon, R.D.; Ahearn, E.A. Flood of July 2023 in Vermont, U.S. Geological Survey, 2025.
- Chen, C.; Kamman, N.; Williams, J.; Bugge, D.; Taylor, V.; Jackson, B.; Miller, E. Spatial and Temporal Variation in Mercury Bioaccumulation by Zooplankton in Lake Champlain (North America). Environ. Pollut. 2012, 161, 343–349. [Google Scholar] [CrossRef] [PubMed]
- Shanley, J.B.; Chalmers, A.T. Streamwater Fluxes of Total Mercury and Methylmercury into and out of Lake Champlain. Environ. Pollut. 2012, 161, 311–320. [Google Scholar] [CrossRef] [PubMed]
- Vermont Department of Environmental Conservation Bacteria TMDL Englesby Brook. 2011.
- Vermont Department of Environmental Conservation 2018 Winooski River TBP. 2018.
- National Oceanic and Atmospheric Administration National Water Prediction Service Available online: https://water.weather.gov/ahps2/.
- Christensen, G.A.; Wymore, A.M.; King, A.J.; Podar, M.; Hurt, R.A.; Santillan, E.U.; Soren, A.; Brandt, C.C.; Brown, S.D.; Palumbo, A.V.; et al. Development and Validation of Broad-Range Qualitative and Clade-Specific Quantitative Molecular Probes for Assessing Mercury Methylation in the Environment. Appl. Environ. Microbiol. 2016, 82, 6068–6078. [Google Scholar] [CrossRef] [PubMed]
- Liu, Y.-R.; Delgado-Baquerizo, M.; Bi, L.; Zhu, J.; He, J.-Z. Consistent Responses of Soil Microbial Taxonomic and Functional Attributes to Mercury Pollution across China. Microbiome 2018, 6, 183. [Google Scholar] [CrossRef] [PubMed]
- McDaniel, E.A.; Peterson, B.D.; Stevens, S.L.R.; Tran, P.Q.; Anantharaman, K.; McMahon, K.D. Expanded Phylogenetic Diversity and Metabolic Flexibility of Mercury-Methylating Microorganisms. mSystems 2020, 5, 10.1128/msystems.00299-20. [Google Scholar] [CrossRef] [PubMed]
- U.S. Census Bureau US Regions Boundary File [Cb_2018_us_region_20m.Zip] 2018.
- QGIS Development Team QGIS Geographic Information System.
- Salter, S.J.; Cox, M.J.; Turek, E.M.; Calus, S.T.; Cookson, W.O.; Moffatt, M.F.; Turner, P.; Parkhill, J.; Loman, N.J.; Walker, A.W. Reagent and Laboratory Contamination Can Critically Impact Sequence-Based Microbiome Analyses. BMC Biol. 2014, 12, 87. [Google Scholar] [CrossRef] [PubMed]
- Wickham, H.; François, R.; Henry, L.; Müller, K.; Vaughan, D.; Software, P. ; PBC Dplyr: A Grammar of Data Manipulation 2023.
- R Core Team R: A Language and Environment for Statistical Computing 2024.
- Fox, J.; Weisberg, S.; Price, B.; Adler, D.; Bates, D.; Baud-Bovy, G.; Bolker, B.; Ellison, S.; Firth, D.; Friendly, M.; et al. Car: Companion to Applied Regression 2024.
- Callahan, B.J.; McMurdie, P.J.; Rosen, M.J.; Han, A.W.; Johnson, A.J.A.; Holmes, S.P. DADA2: High-Resolution Sample Inference from Illumina Amplicon Data. Nat. Methods 2016, 13, 581–583. [Google Scholar] [CrossRef] [PubMed]
- Wright, E.S. Using DECIPHER v2.0 to Analyze Big Biological Sequence Data in R. R J. 2016, 8, 352–359. [Google Scholar] [CrossRef]
- McMurdie, P.J.; Holmes, S. Phyloseq: An R Package for Reproducible Interactive Analysis and Graphics of Microbiome Census Data. PLOS ONE 2013, 8, e61217. [Google Scholar] [CrossRef] [PubMed]
- Parks, J.M.; Johs, A.; Podar, M.; Bridou, R.; Hurt, R.A.; Smith, S.D.; Tomanicek, S.J.; Qian, Y.; Brown, S.D.; Brandt, C.C.; et al. The Genetic Basis for Bacterial Mercury Methylation. Science 2013, 339, 1332–1335. [Google Scholar] [CrossRef] [PubMed]
- Bolger, A.M.; Lohse, M.; Usadel, B. Trimmomatic: A Flexible Trimmer for Illumina Sequence Data. Bioinforma. Oxf. Engl. 2014, 30, 2114–2120. [Google Scholar] [CrossRef] [PubMed]
- Li, D.; Liu, C.-M.; Luo, R.; Sadakane, K.; Lam, T.-W. MEGAHIT: An Ultra-Fast Single-Node Solution for Large and Complex Metagenomics Assembly via Succinct de Bruijn Graph. Bioinformatics 2015, 31, 1674–1676. [Google Scholar] [CrossRef] [PubMed]
- Hyatt, D.; Chen, G.-L.; LoCascio, P.F.; Land, M.L.; Larimer, F.W.; Hauser, L.J. Prodigal: Prokaryotic Gene Recognition and Translation Initiation Site Identification. BMC Bioinformatics 2010, 11, 119. [Google Scholar] [CrossRef] [PubMed]
- Finn, R.D.; Clements, J.; Eddy, S.R. HMMER Web Server: Interactive Sequence Similarity Searching. Nucleic Acids Res. 2011, 39, W29-37. [Google Scholar] [CrossRef] [PubMed]
- Gionfriddo, C.; Podar, M.; Gilmour, C.; Pierce, E.; Elias, D. ORNL Compiled Mercury Methylator Database; ORNLCIFSFA (Critical Interfaces Science Focus Area); Oak Ridge National Lab. 2019. [Google Scholar]
- Altschul, S.F.; Gish, W.; Miller, W.; Myers, E.W.; Lipman, D.J. Basic Local Alignment Search Tool. J. Mol. Biol. 1990, 215, 403–410. [Google Scholar] [CrossRef] [PubMed]
- Schartup, A.T.; Mason, R.P.; Balcom, P.H.; Hollweg, T.A.; Chen, C.Y. Methylmercury Production in Estuarine Sediments: Role of Organic Matter. Environ. Sci. Technol. 2013, 47, 695–700. [Google Scholar] [CrossRef] [PubMed]
- Chen, C.; Kamman, N.; Williams, J.; Bugge, D.; Taylor, V.; Jackson, B.; Miller, E. Spatial and Temporal Variation in Mercury Bioaccumulation by Zooplankton in Lake Champlain (North America). Environ. Pollut. 2012, 161, 343–349. [Google Scholar] [CrossRef] [PubMed]
- Keeler, G.J.; Gratz, L.E.; Al-wali, K. Long-Term Atmospheric Mercury Wet Deposition at Underhill, Vermont. Ecotoxicology 2005, 14, 71–83. [Google Scholar] [CrossRef] [PubMed]
- Bradley, P.M.; Journey, C.A.; Chapelle, F.H.; Lowery, M.A.; Conrads, P.A. Flood Hydrology and Methylmercury Availability in Coastal Plain Rivers. Environ. Sci. Technol. 2010, 44, 9285–9290. [Google Scholar] [CrossRef] [PubMed]
- Shanley, J.B.; Chalmers, A.T. Streamwater Fluxes of Total Mercury and Methylmercury into and out of Lake Champlain. Environ. Pollut. 2012, 161, 311–320. [Google Scholar] [CrossRef] [PubMed]
- Shrestha, J.; Niklaus, P. a.; Frossard, E.; Samaritani, E.; Huber, B.; Barnard, R.L.; Schleppi, P.; Tockner, K.; Luster, J. Soil Nitrogen Dynamics in a River Floodplain Mosaic. J. Environ. Qual. 2012, 41, 2033–2045. [Google Scholar] [CrossRef] [PubMed]
- Furutani, A.; Rudd, J.W.M. Measurement of Mercury Methylation in Lake Water and Sediment Samples. Appl. Environ. Microbiol. 1980, 40, 770–776. [Google Scholar] [CrossRef] [PubMed]
- Hsu-Kim, H.; Kucharzyk, K.H.; Zhang, T.; Deshusses, M.A. Mechanisms Regulating Mercury Bioavailability for Methylating Microorganisms in the Aquatic Environment: A Critical Review. Environ. Sci. Technol. 2013, 47, 2441–2456. [Google Scholar] [CrossRef] [PubMed]
- Begmatov, S.; Savvichev, A.S.; Kadnikov, V.V.; Beletsky, A.V.; Rusanov, I.I.; Klyuvitkin, A.A.; Novichkova, E.A.; Mardanov, A.V.; Pimenov, N.V.; Ravin, N.V. Microbial Communities Involved in Methane, Sulfur, and Nitrogen Cycling in the Sediments of the Barents Sea. Microorganisms 2021, 9, 2362. [Google Scholar] [CrossRef] [PubMed]
- Yuan, K.; Chen, X.; Chen, P.; Huang, Y.; Jiang, J.; Luan, T.; Chen, B.; Wang, X. Mercury Methylation-Related Microbes and Genes in the Sediments of the Pearl River Estuary and the South China Sea. Ecotoxicol. Environ. Saf. 2019, 185, 109722. [Google Scholar] [CrossRef] [PubMed]
- Kristensen, J.M.; Singleton, C.; Clegg, L.-A.; Petriglieri, F.; Nielsen, P.H. High Diversity and Functional Potential of Undescribed “Acidobacteriota” in Danish Wastewater Treatment Plants. Front. Microbiol. 2021, 12, 643950. [Google Scholar] [CrossRef] [PubMed]
- Bae, H.-S.; Dierberg, F.E.; Ogram, A. Syntrophs Dominate Sequences Associated with the Mercury Methylation-Related Gene hgcA in the Water Conservation Areas of the Florida Everglades. Appl. Environ. Microbiol. 2014, 80, 6517–6526. [Google Scholar] [CrossRef] [PubMed]
- Kerin, E.J.; Gilmour, C.C.; Roden, E.; Suzuki, M.T.; Coates, J.D.; Mason, R.P. Mercury Methylation by Dissimilatory Iron-Reducing Bacteria. Appl. Environ. Microbiol. 2006, 72, 7919–7921. [Google Scholar] [CrossRef] [PubMed]
- Czech, L.; Stamatakis, A.; Dunthorn, M.; Barbera, P. Metagenomic Analysis Using Phylogenetic Placement—A Review of the First Decade. Front. Bioinforma. 2022, 2, 871393. [Google Scholar] [CrossRef] [PubMed]
- Matsen, F.A.; Kodner, R.B.; Armbrust, E.V. Pplacer: Linear Time Maximum-Likelihood and Bayesian Phylogenetic Placement of Sequences onto a Fixed Reference Tree. BMC Bioinformatics 2010, 11, 538. [Google Scholar] [CrossRef] [PubMed]
- Ma, B.; Lu, C.; Wang, Y.; Yu, J.; Zhao, K.; Xue, R.; Ren, H.; Lv, X.; Pan, R.; Zhang, J.; et al. Author Correction: A Genomic Catalogue of Soil Microbiomes Boosts Mining of Biodiversity and Genetic Resources. Nat. Commun. 2023, 14, 8079. [Google Scholar] [CrossRef] [PubMed]
- Huber, K.; Overmann, J. Vicinamibacteraceae Fam. Nov., the First Described Family within the Subdivision 6 Acidobacteria. Int. J. Syst. Evol. Microbiol. 2018, 68. [Google Scholar] [CrossRef] [PubMed]
- Dedysh, S.N.; Ivanova, A.A.; Begmatov, Sh.A.; Beletsky, A.V.; Rakitin, A.L.; Mardanov, A.V.; Philippov, D.A.; Ravin, N.V. Acidobacteria in Fens: Phylogenetic Diversity and Genome Analysis of the Key Representatives. Microbiology 2022, 91, 662–670. [Google Scholar] [CrossRef]
- Zhu, Y.; An, M.; Anwar, T.; Wang, H. Differences in Soil Bacterial Community Structure during the Remediation of Cd-Polluted Cotton Fields by Biochar and Biofertilizer in Xinjiang, China. Front. Microbiol. 2024, 15. [Google Scholar] [CrossRef] [PubMed]
- Liu, Y.-R.; Zheng, Y.-M.; Zhang, L.-M.; He, J.-Z. Linkage between Community Diversity of Sulfate-Reducing Microorganisms and Methylmercury Concentration in Paddy Soil. Environ. Sci. Pollut. Res. 2014, 21, 1339–1348. [Google Scholar] [CrossRef] [PubMed]
- Liu, Y.-R.; Yu, R.-Q.; Zheng, Y.-M.; He, J.-Z. Analysis of the Microbial Community Structure by Monitoring an Hg Methylation Gene (hgcA) in Paddy Soils along an Hg Gradient. Appl. Environ. Microbiol. 2014, 80, 2874–2879. [Google Scholar] [CrossRef] [PubMed]
- Schoch, C.L.; Ciufo, S.; Domrachev, M.; Hotton, C.L.; Kannan, S.; Khovanskaya, R.; Leipe, D.; Mcveigh, R.; O’Neill, K.; Robbertse, B.; et al. NCBI Taxonomy: A Comprehensive Update on Curation, Resources and Tools. Database J. Biol. Databases Curation 2020, 2020, baaa062. [Google Scholar] [CrossRef] [PubMed]
Figure 1.
Map of sampling sites at Winooski River and Englesby Brook made on QGIS (v.3.36.2) using OpenStreetMap and shapefile of Vermont state [33,34]. Zoom-in represents our sampling scheme, taking three Riparian Land (RL) and three Riparian Water (RW) cores per plot. WD1-Winooski Downstream 1. WD2- Winooski Downstream 2. WU- Winooski Upstream. WB - Winooski Bay. ED1-Englesby Downstream 1. ED2- Englesby Downstream 2. EU- Englesby Upstream. EB - Englesby Bay.
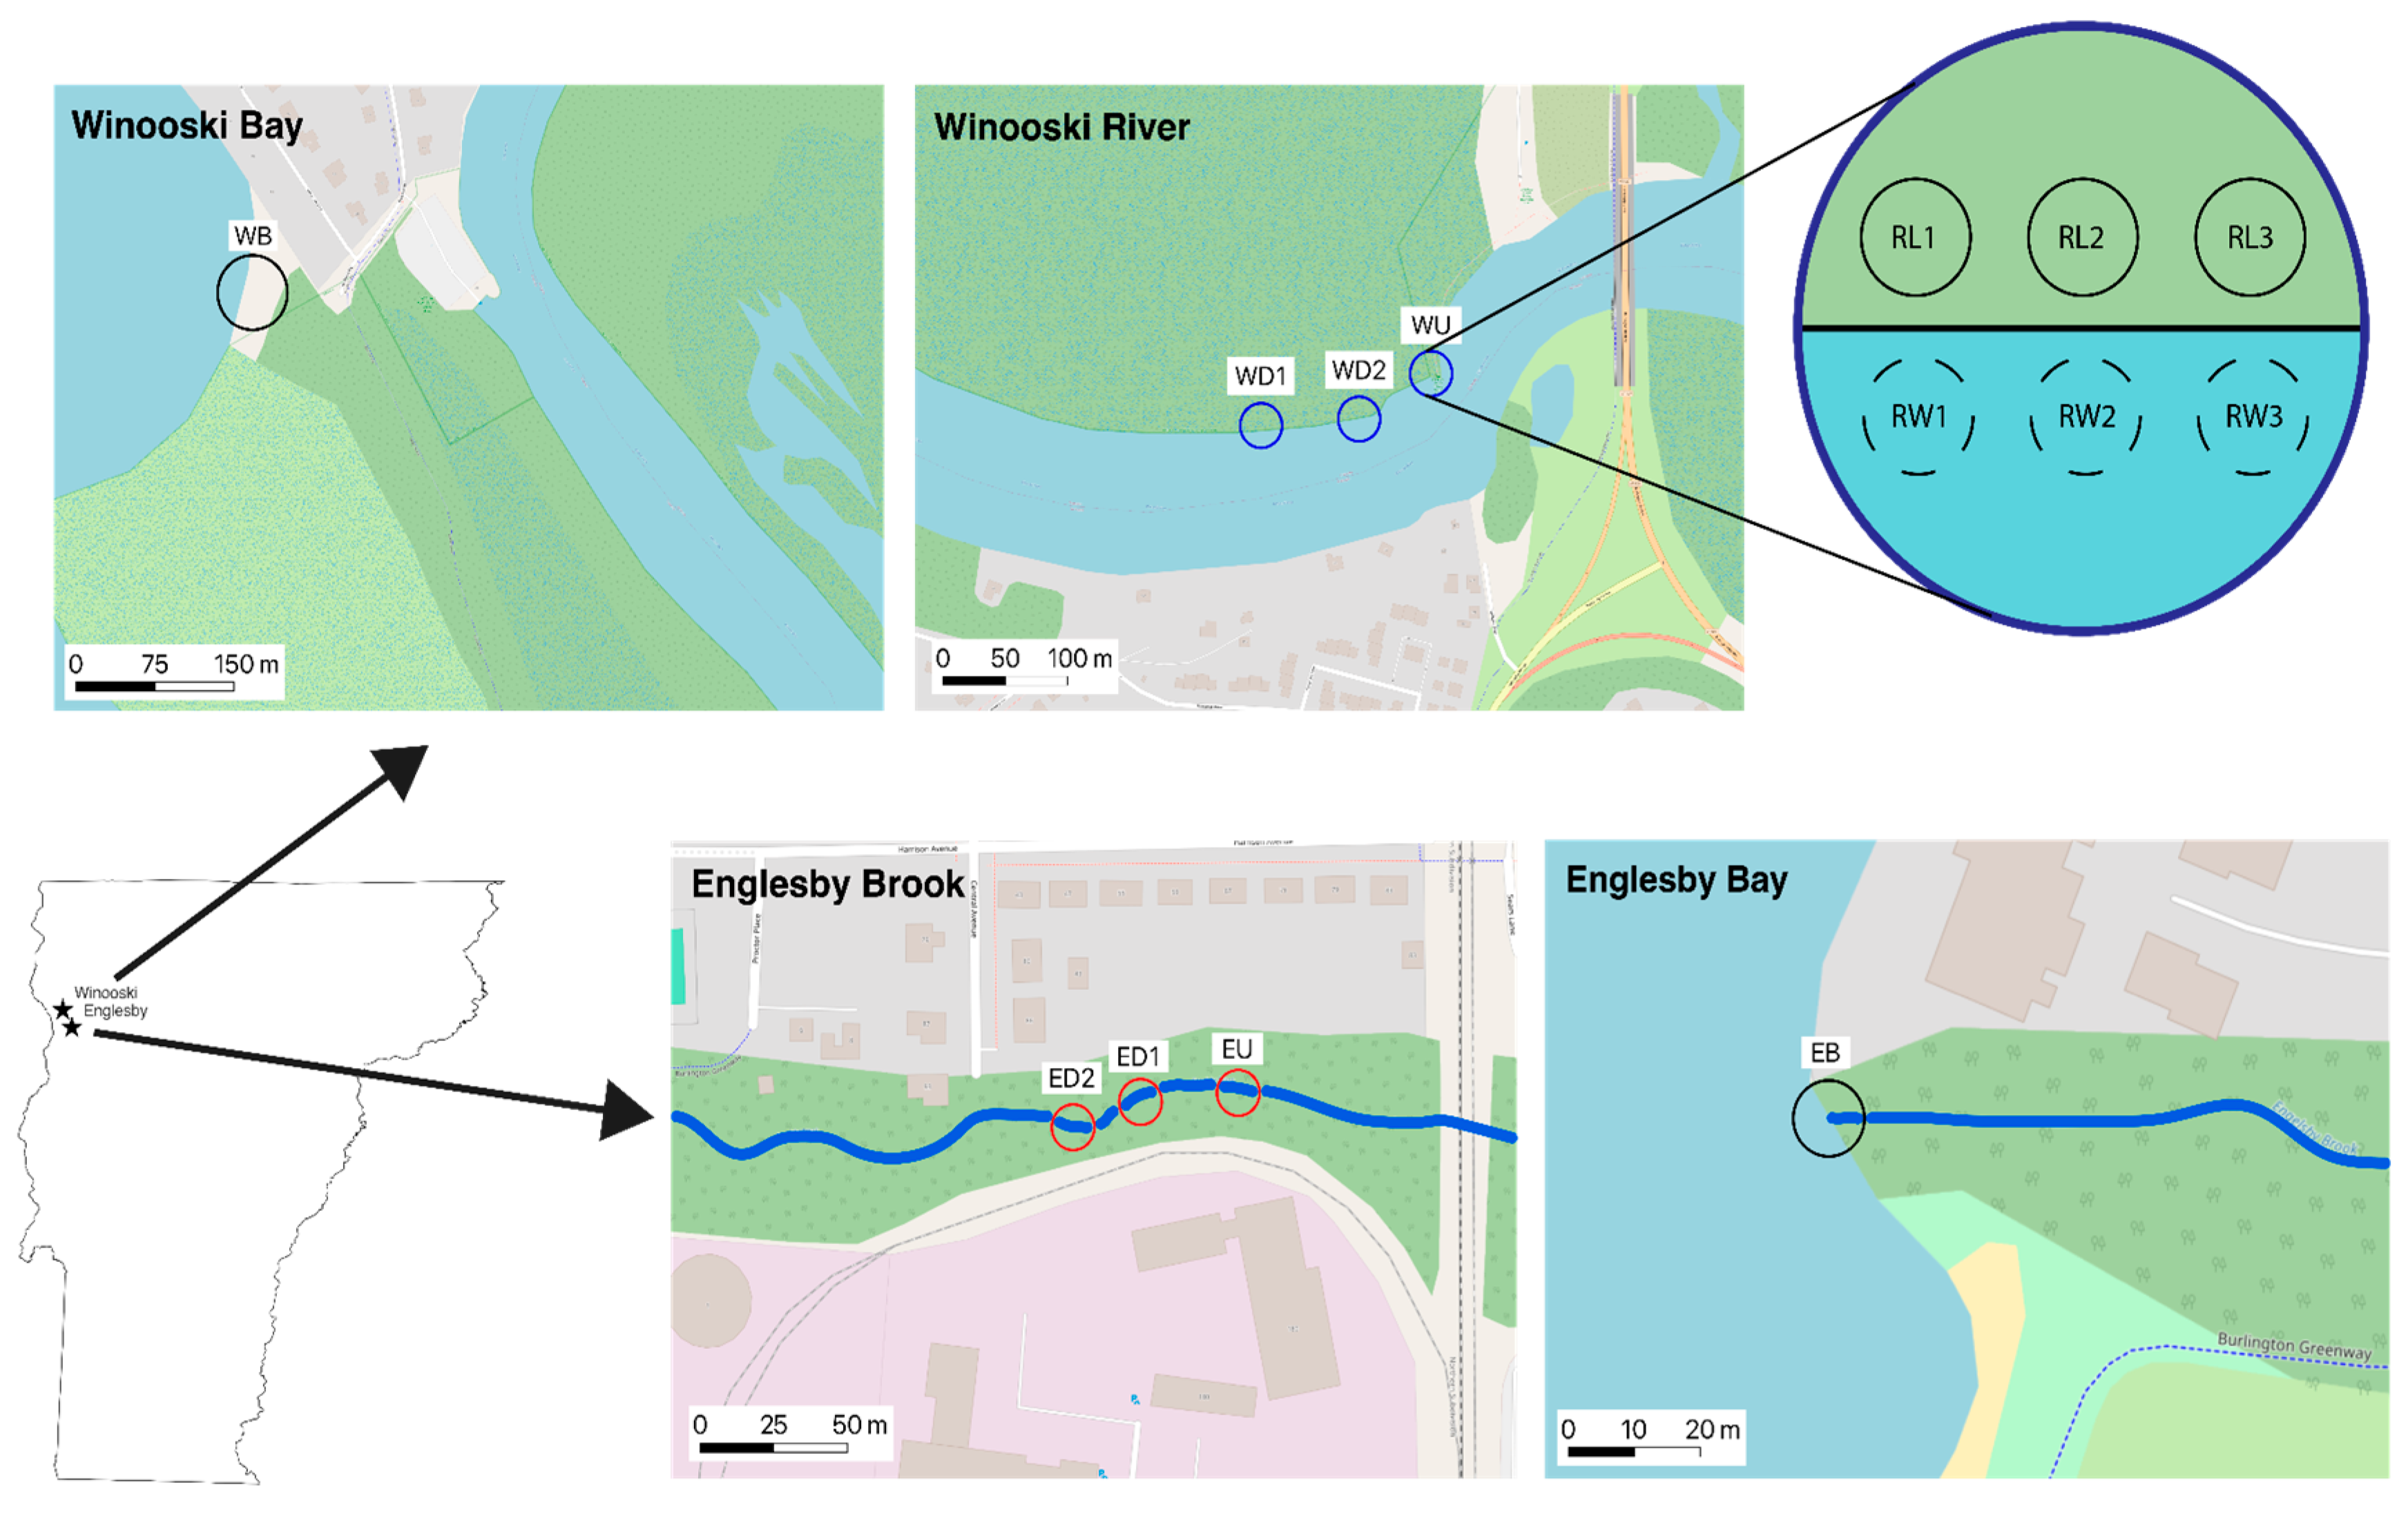
Figure 2.
Total mercury concentration [THg] (ng/g) in hydric sediments at each of the sampling sites. Bars represent mean THg concentration.
Figure 2.
Total mercury concentration [THg] (ng/g) in hydric sediments at each of the sampling sites. Bars represent mean THg concentration.
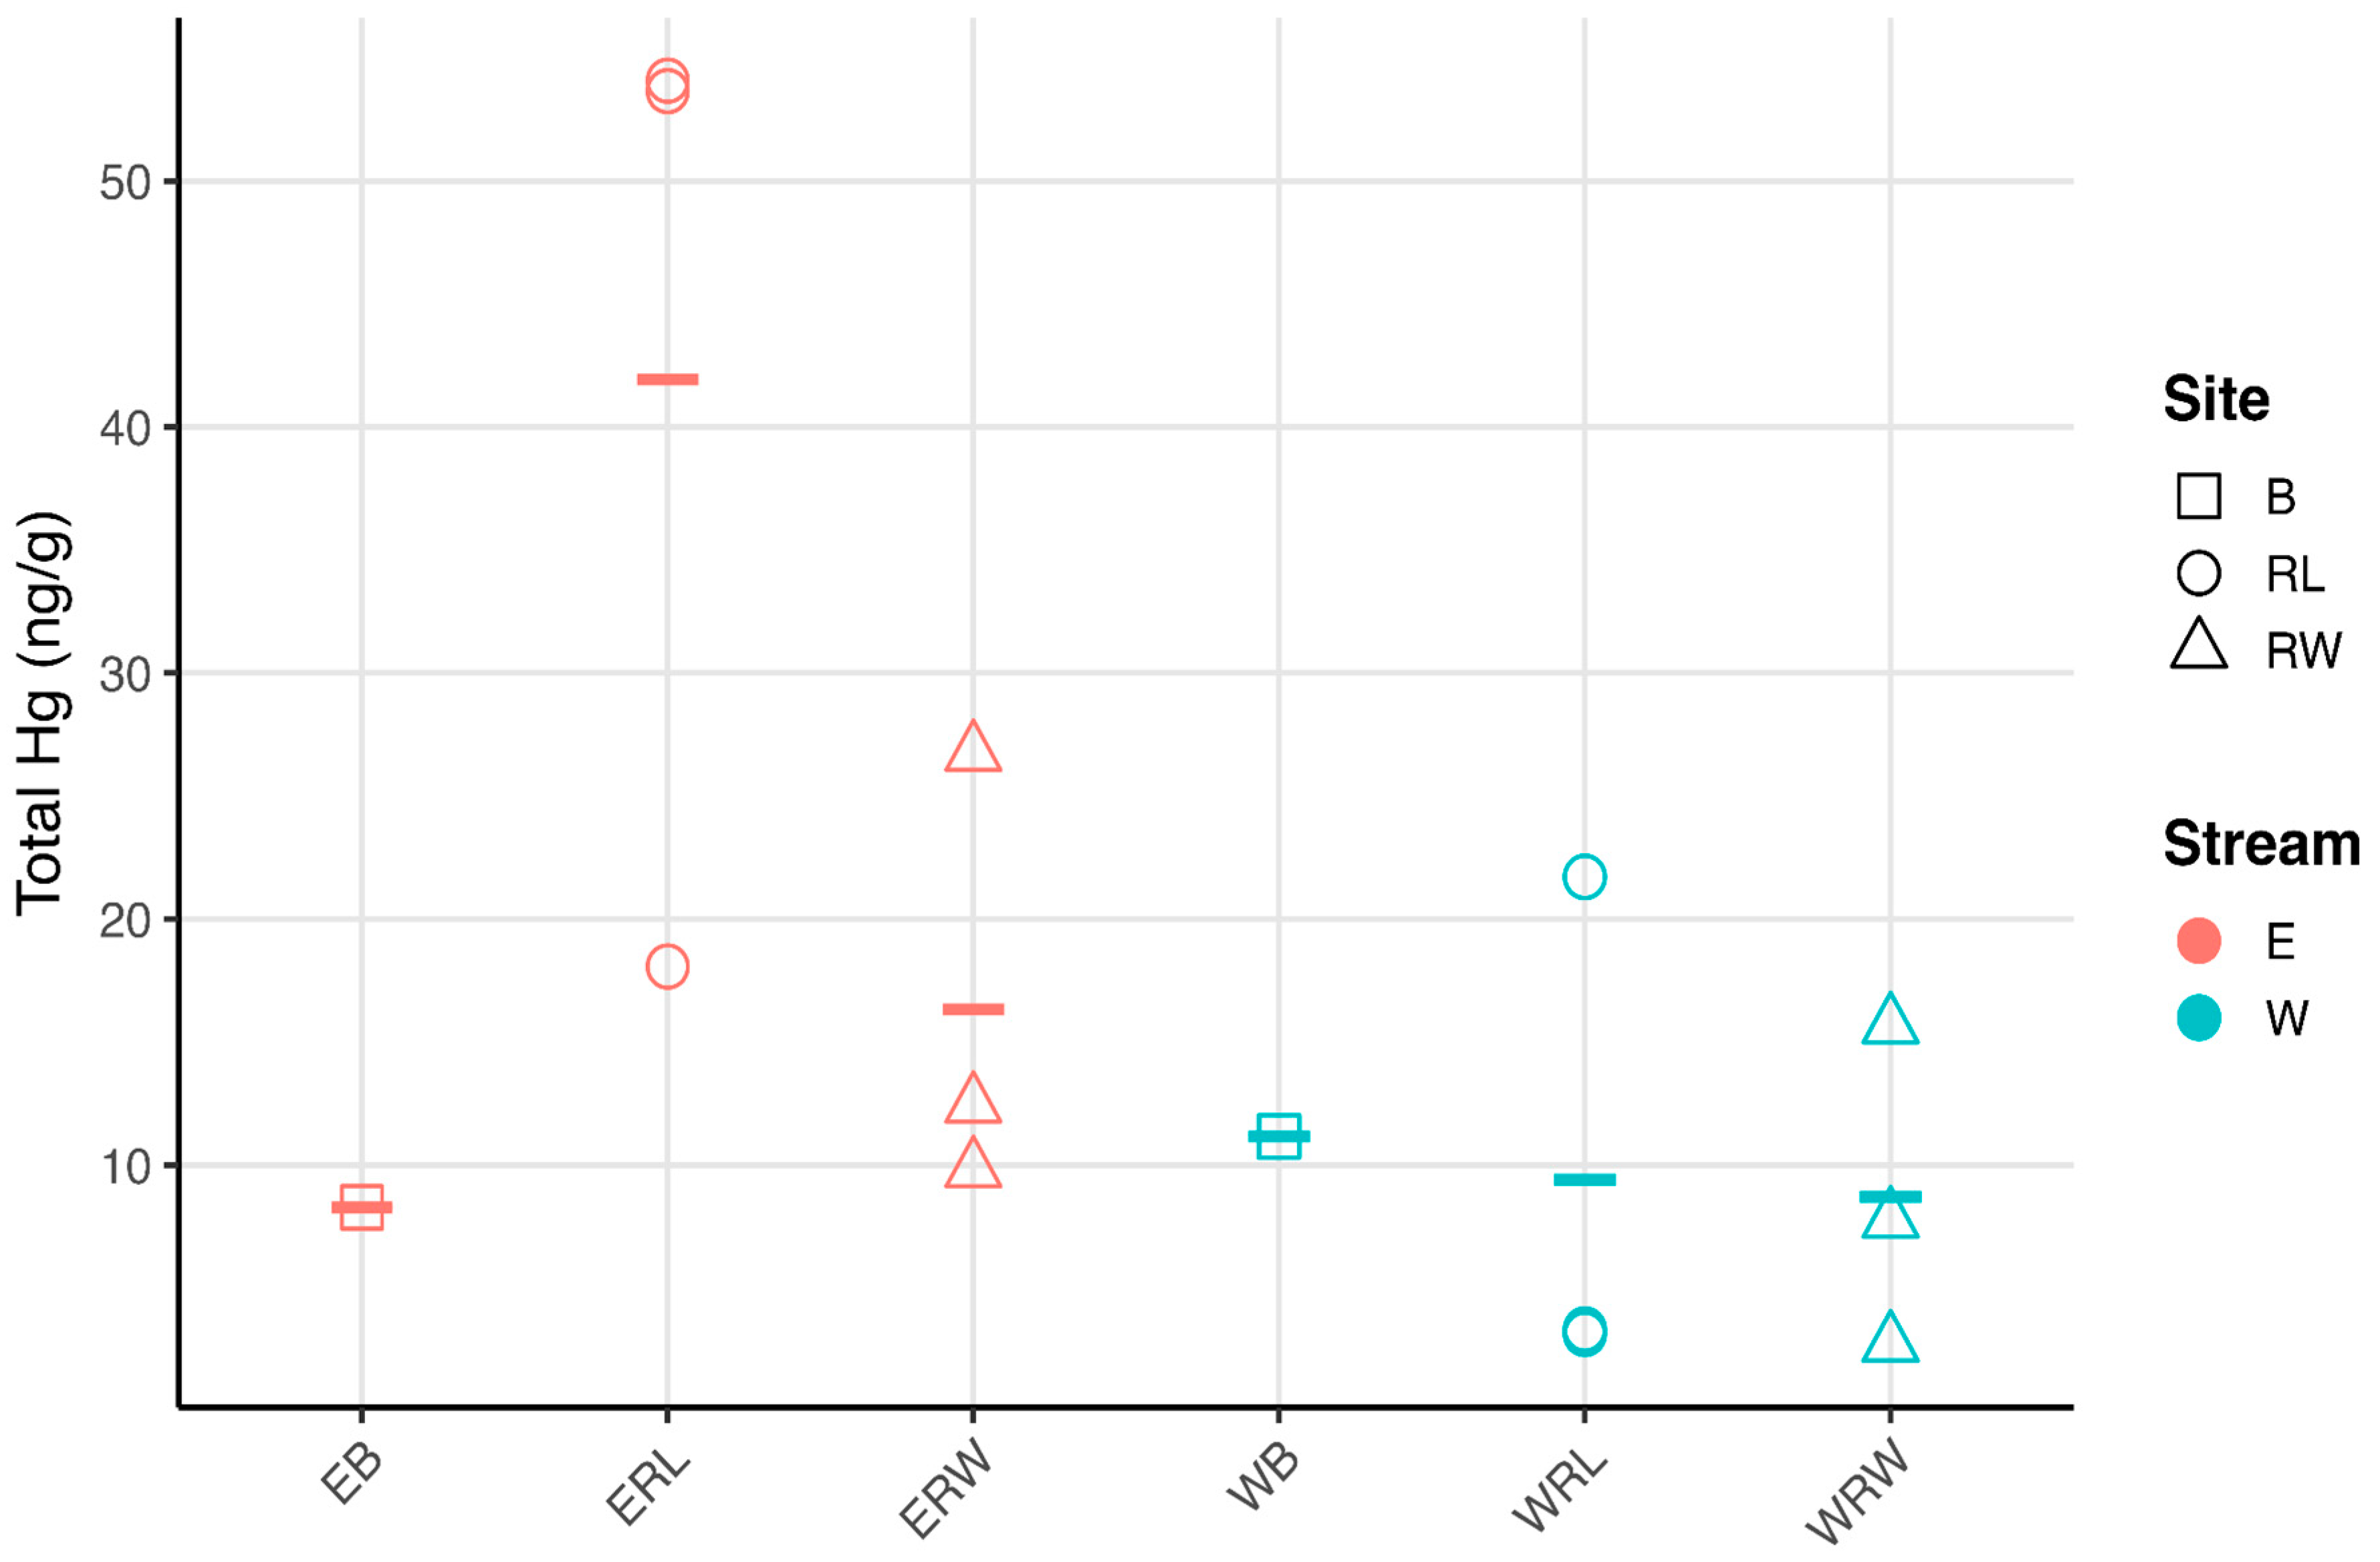
Figure 3.
Relationship between sediment average carbon concentration (mg/g dry weight) and average THg concentration (ng/g) (p=0.0264) in Winooski River (A) and Englesby Brook (B) dried sediment samples. Gray shading indicates 95% CI.
Figure 3.
Relationship between sediment average carbon concentration (mg/g dry weight) and average THg concentration (ng/g) (p=0.0264) in Winooski River (A) and Englesby Brook (B) dried sediment samples. Gray shading indicates 95% CI.
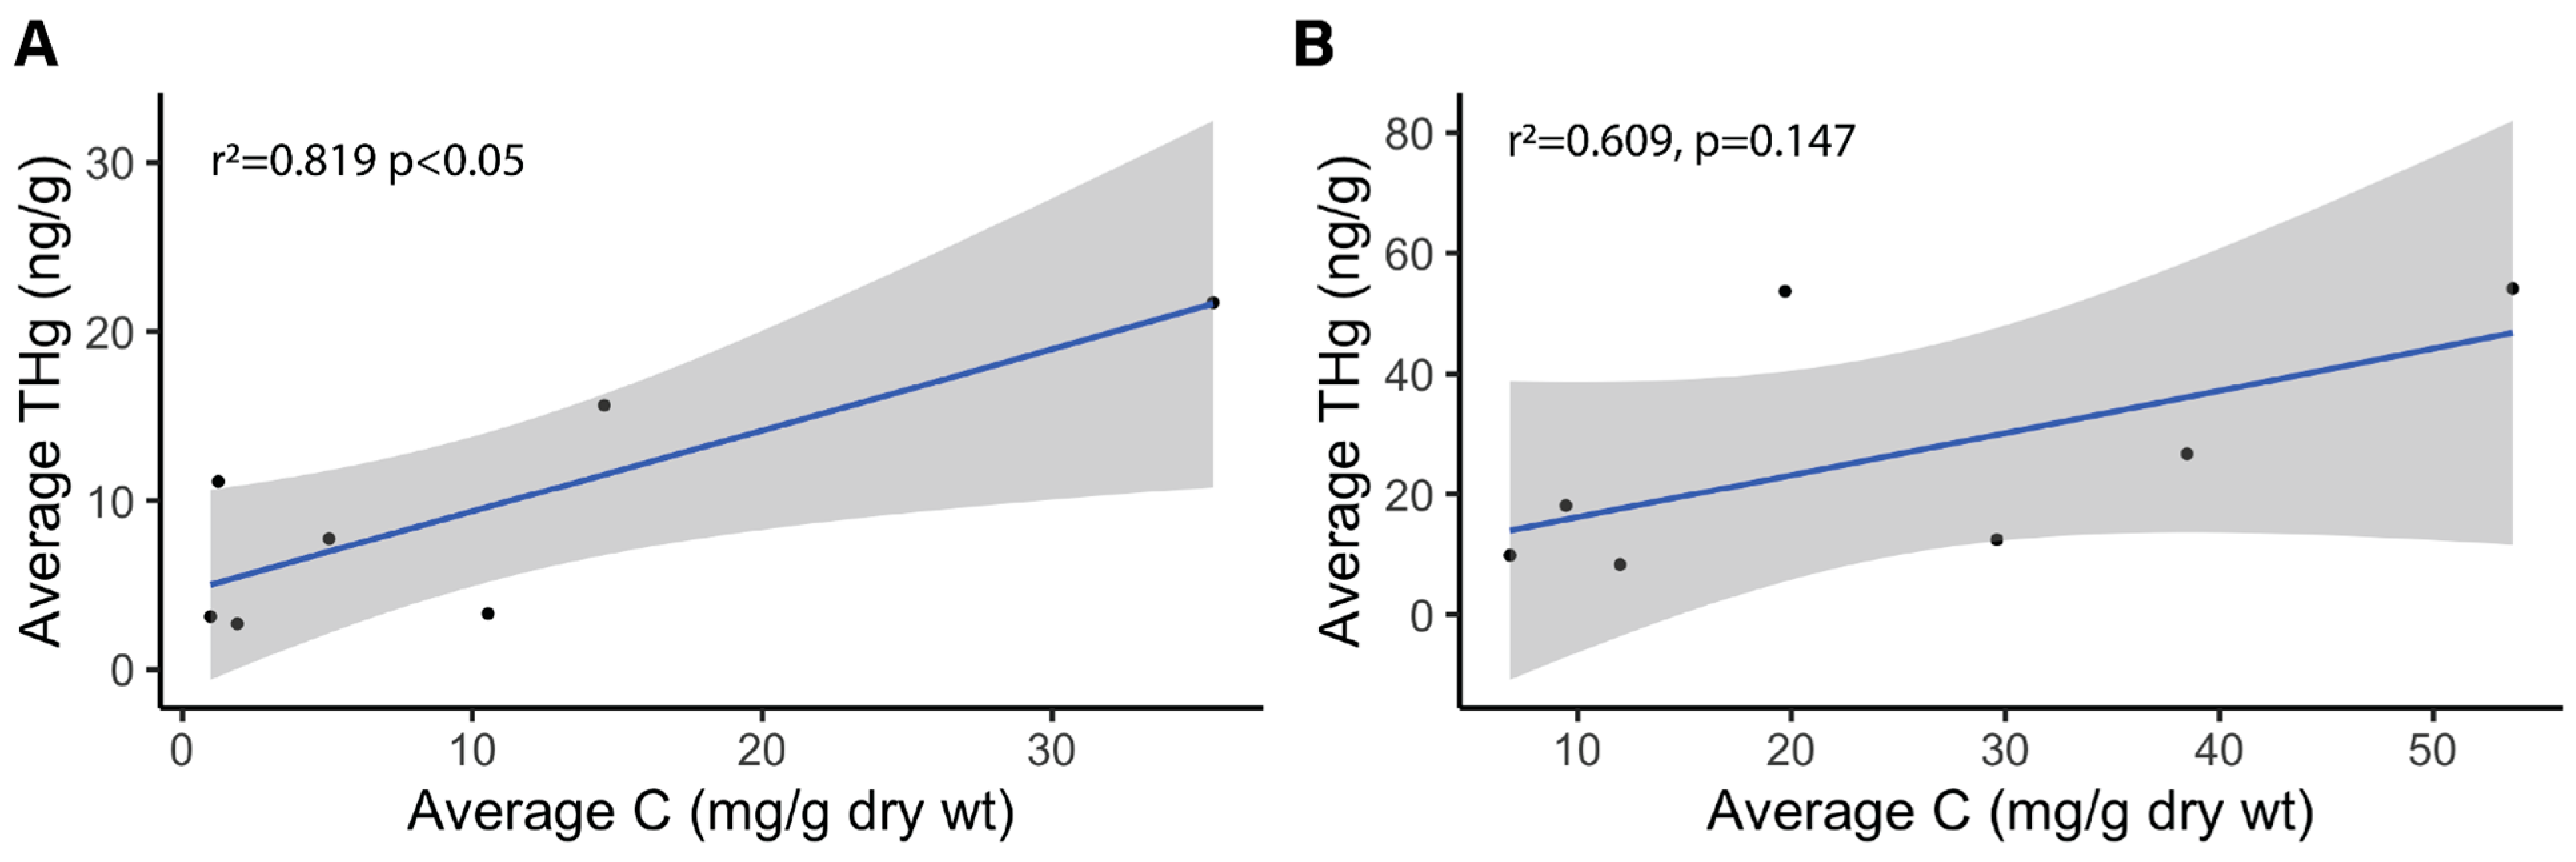
Figure 4.
Non-metric Multidimensional Scaling (NMDS) based on Bray-Curtis dissimilarity matrices of 16S rRNA ASVs, where red and blue represent Englesby and Winooski respectively. Circles represent the Bay, triangles represent Riparian Land, and squares represent Riparian Water.
Figure 4.
Non-metric Multidimensional Scaling (NMDS) based on Bray-Curtis dissimilarity matrices of 16S rRNA ASVs, where red and blue represent Englesby and Winooski respectively. Circles represent the Bay, triangles represent Riparian Land, and squares represent Riparian Water.
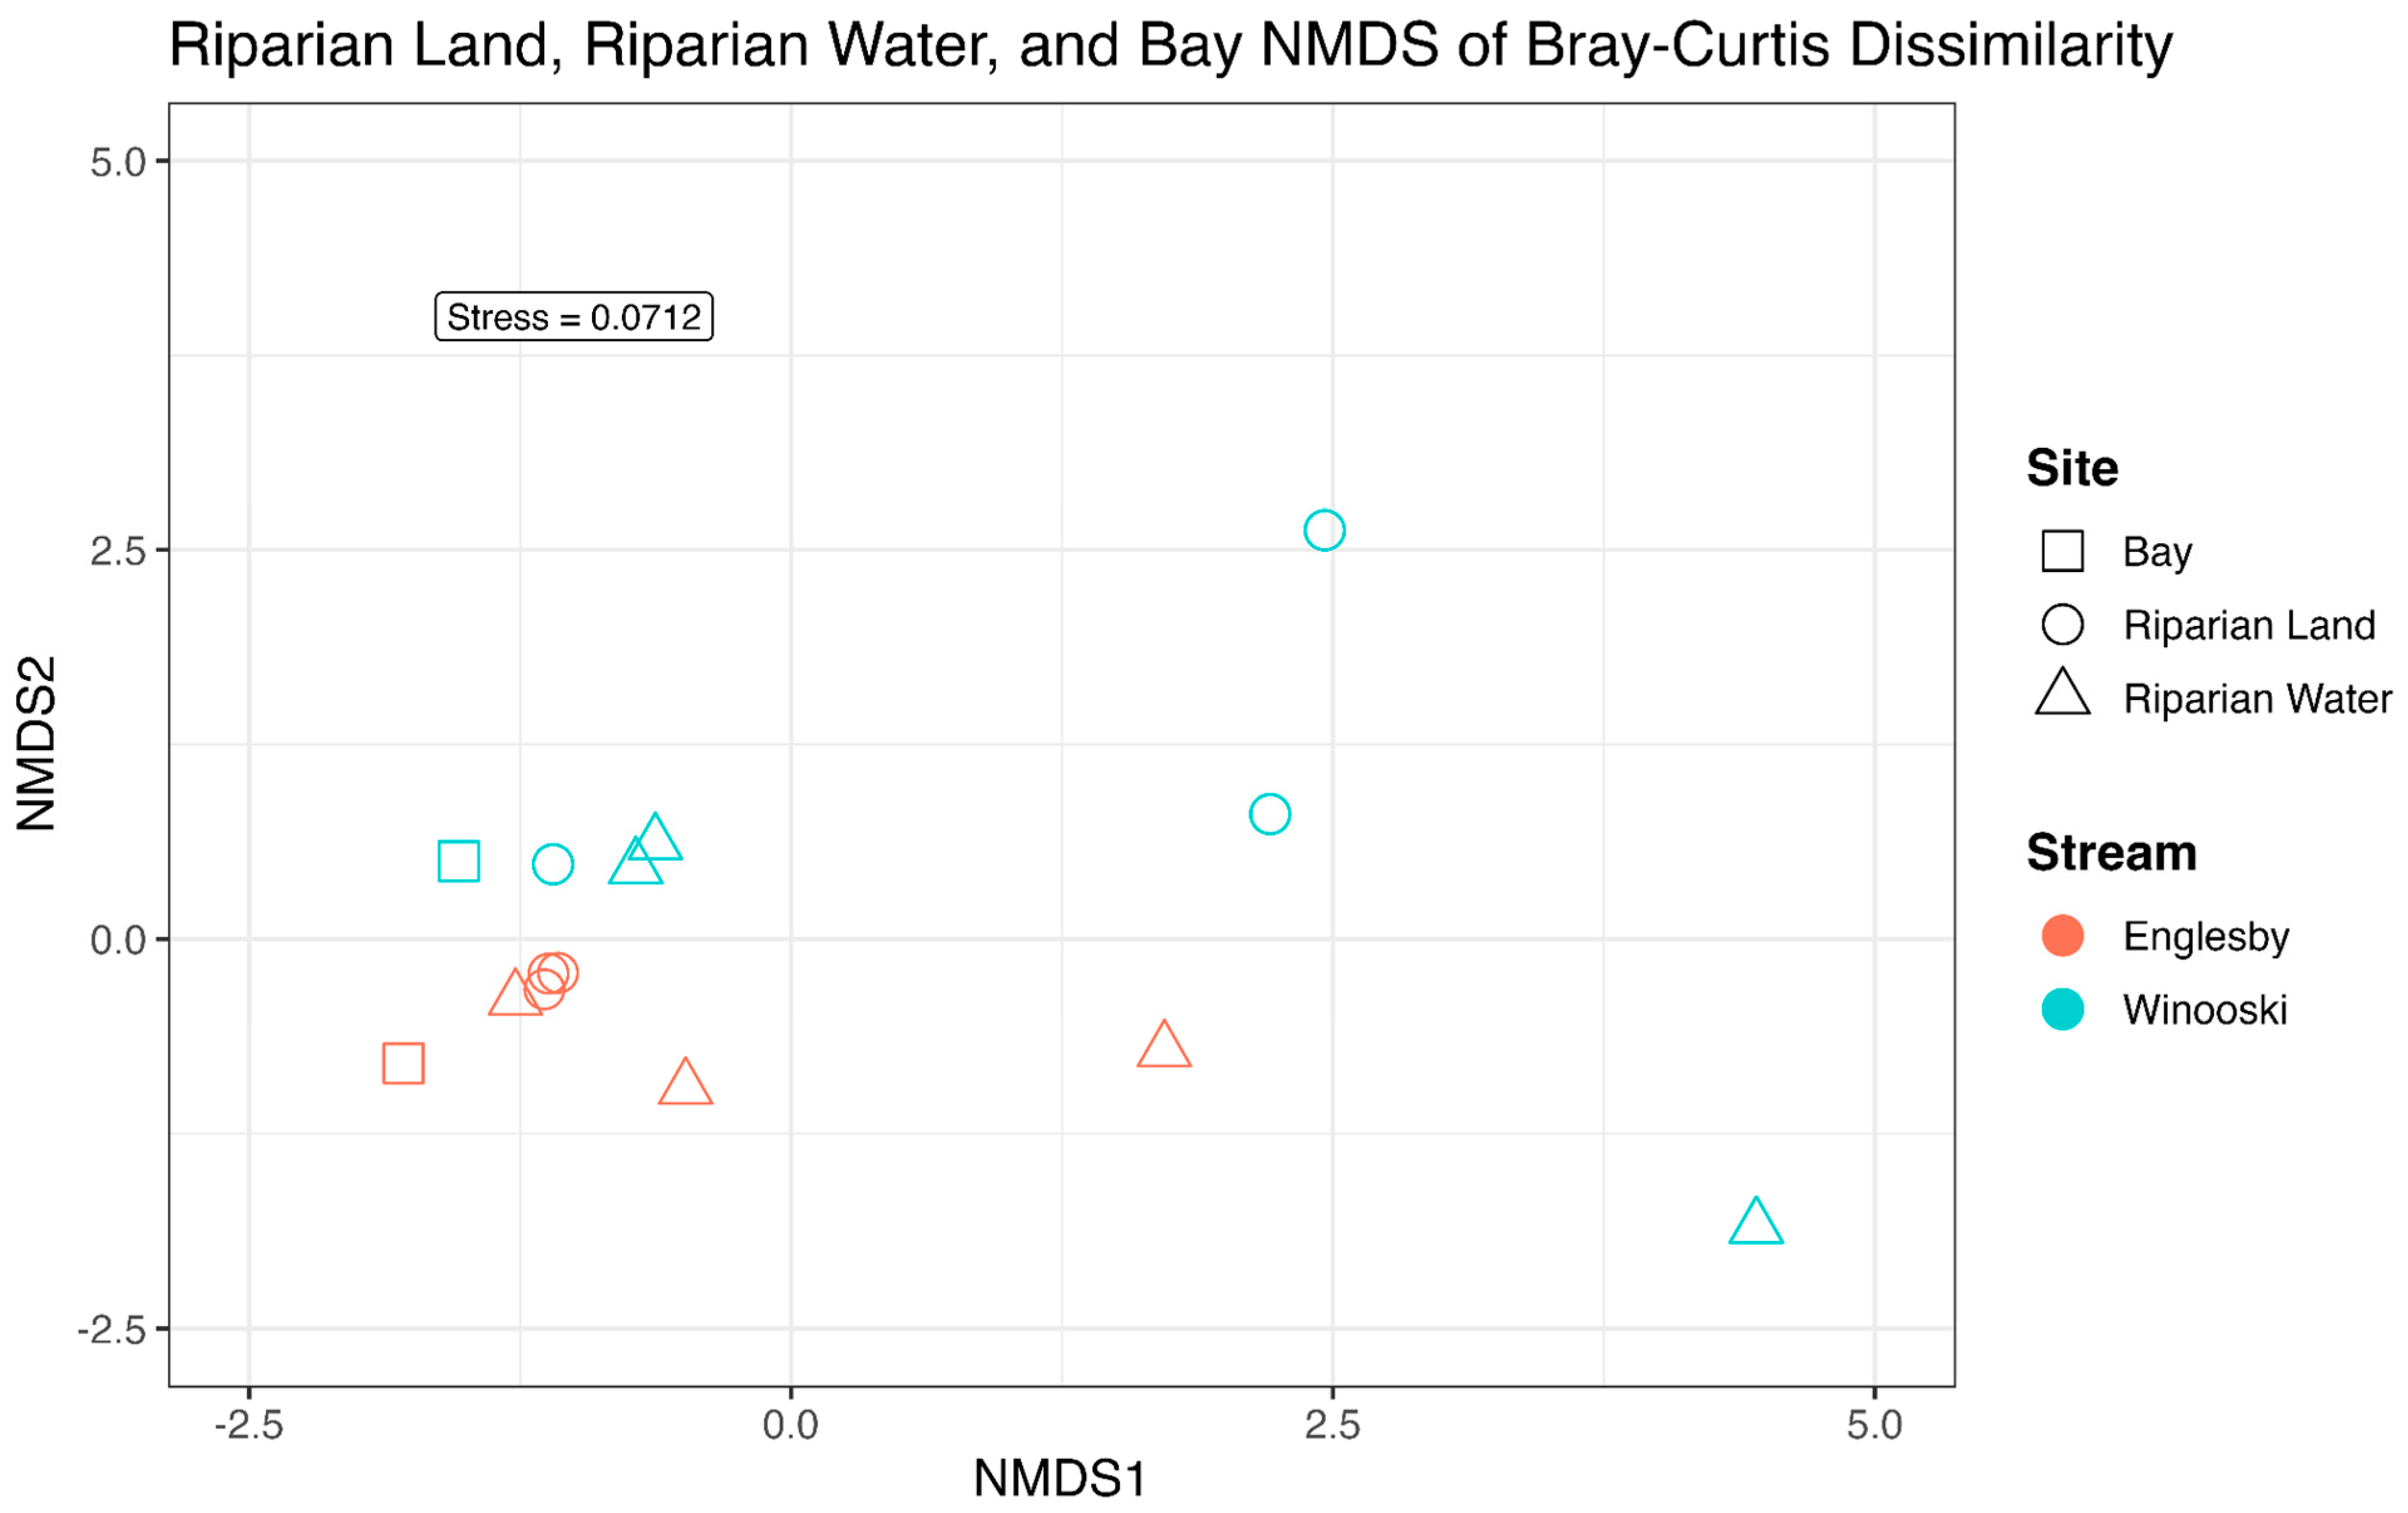
Figure 5.
Microbial community distribution in the Englesby Brook (A) and Winooski River (B) sediment samples. Relative abundances of microbial classes was based on 16S rRNA ASVs for Englesby Brook and Winooski River at the three sampling sites within each category (RL, RW, Bay). Only taxa with >0.5% ASV relative abundance across all samples are shown at the class level.
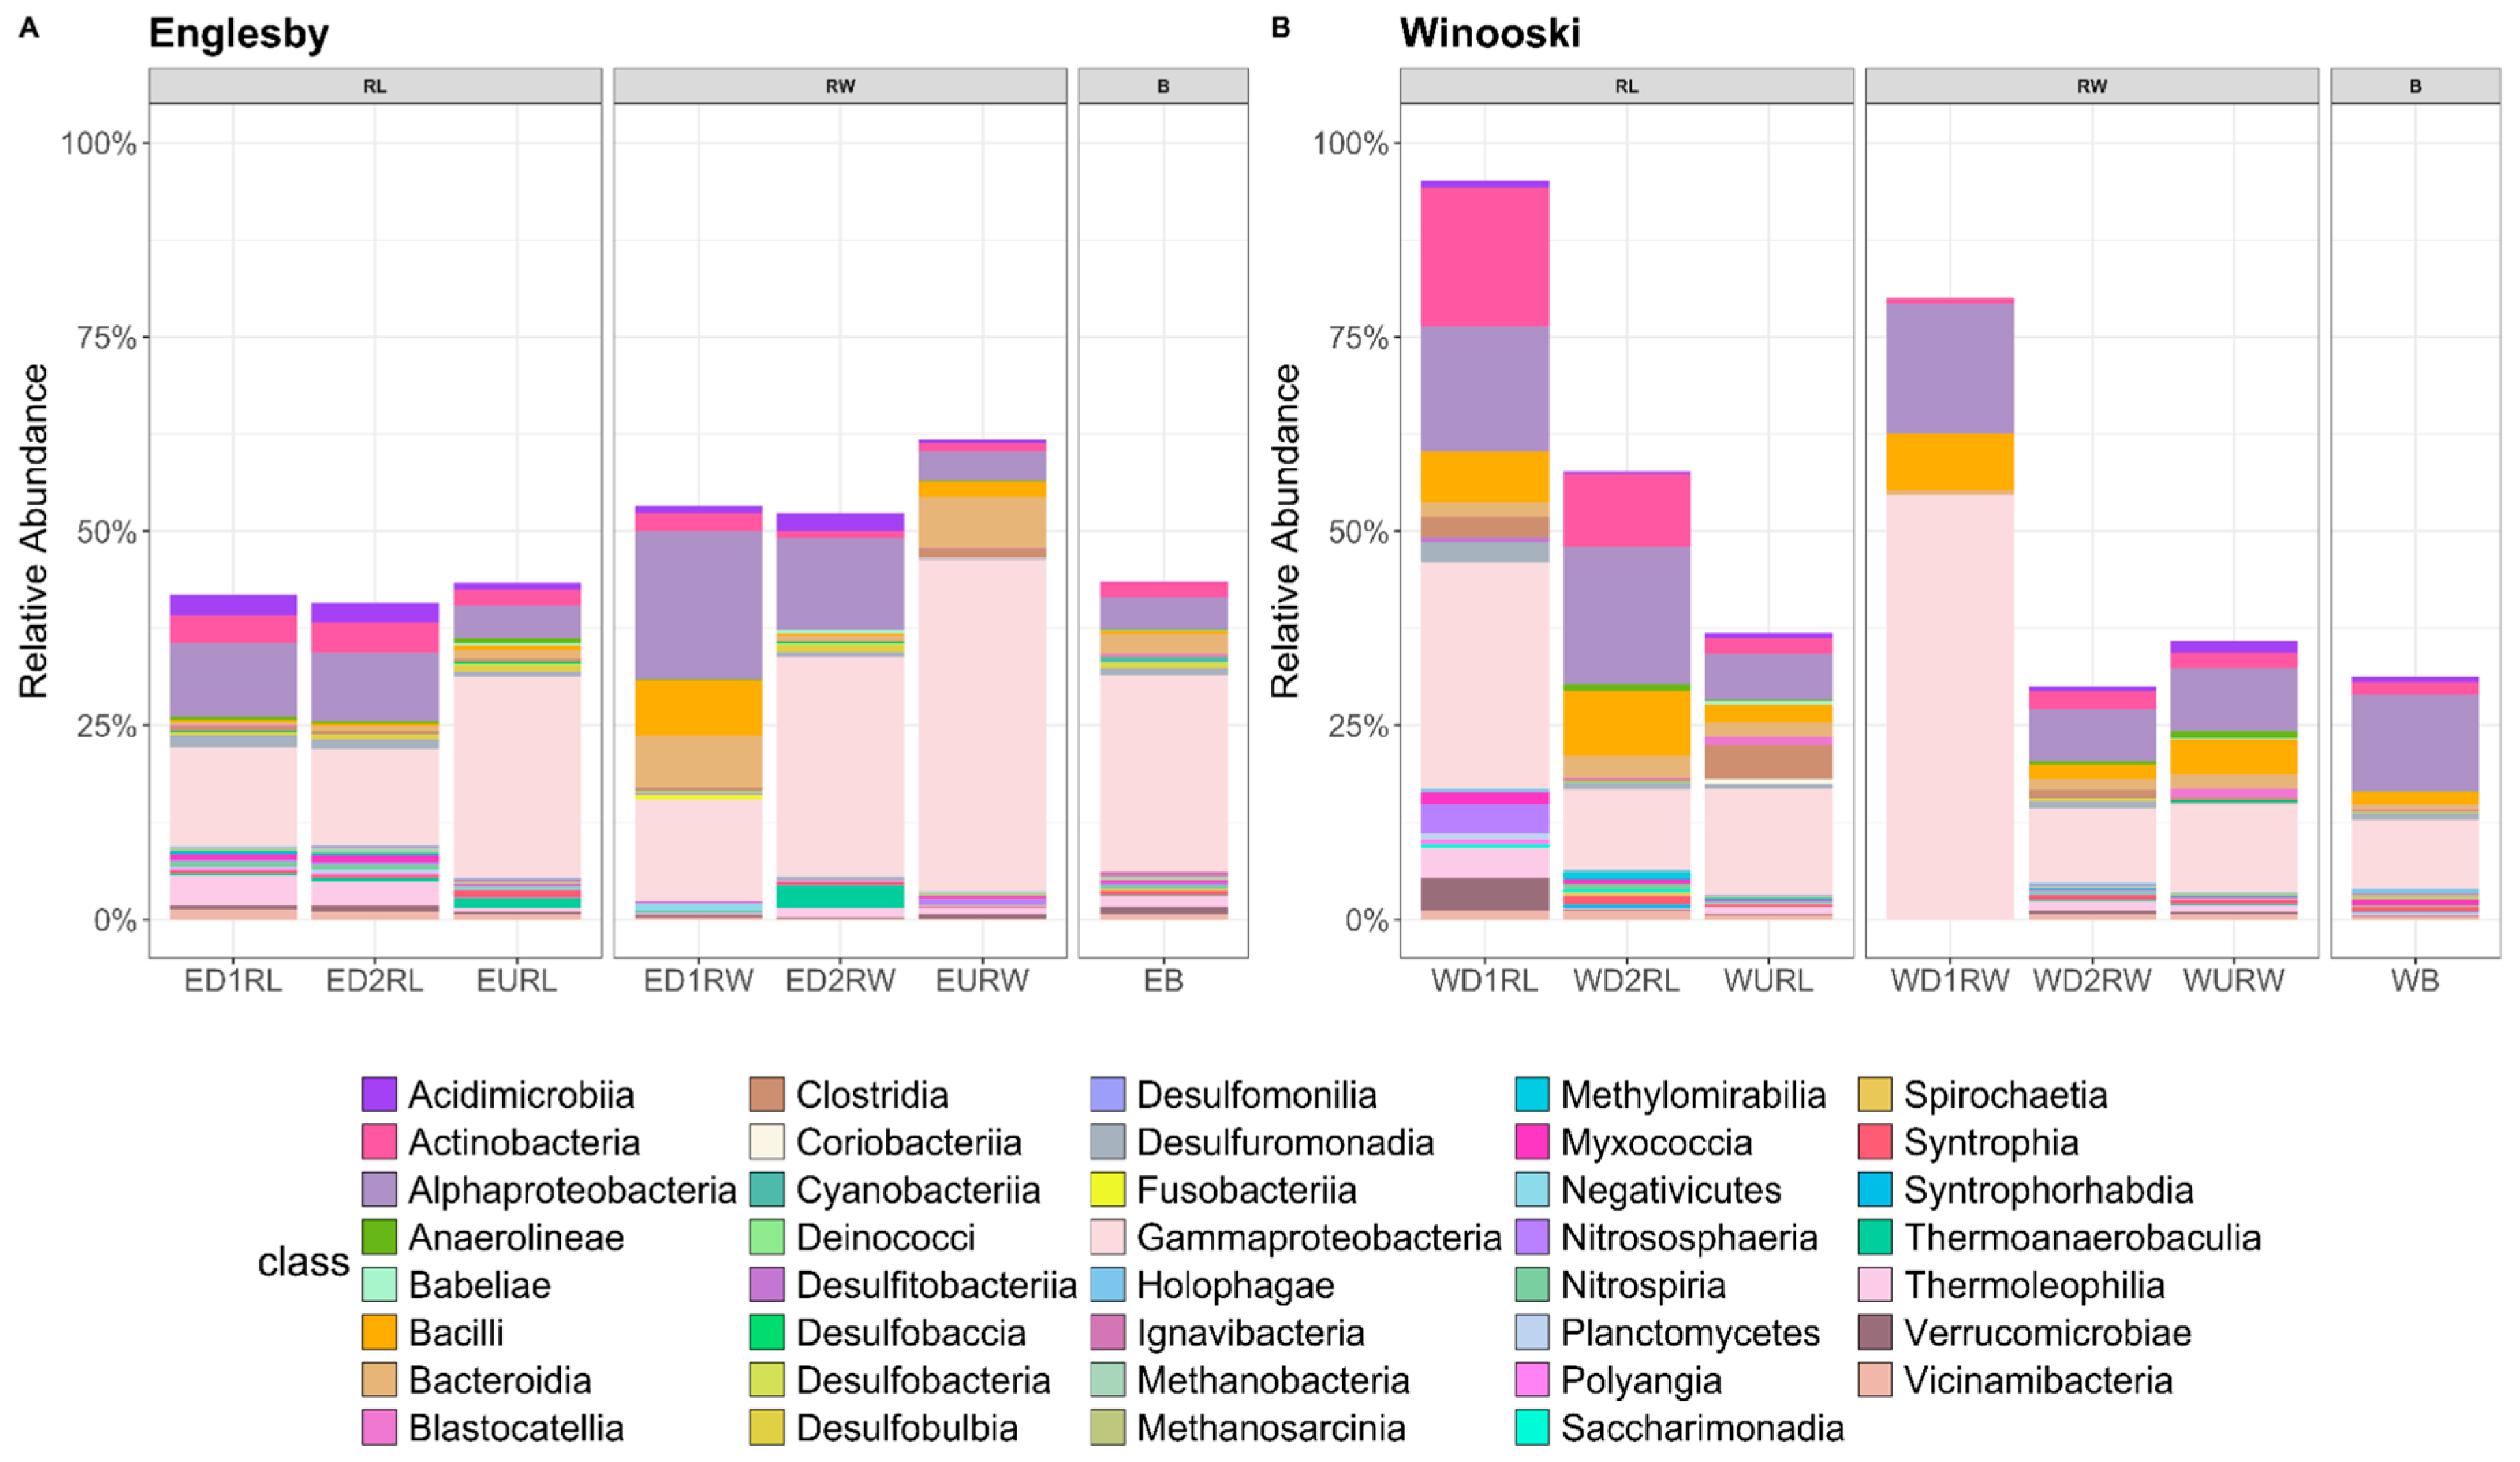
Figure 6.
Mercury-methylating microbes in Winooski River and Englesby Brook sediment samples at the phylum and genus level. Relative abundance of Hg-methylating microbes was based on 16S rRNA ASVs for Englesby Brook and Winooski River.
Figure 6.
Mercury-methylating microbes in Winooski River and Englesby Brook sediment samples at the phylum and genus level. Relative abundance of Hg-methylating microbes was based on 16S rRNA ASVs for Englesby Brook and Winooski River.
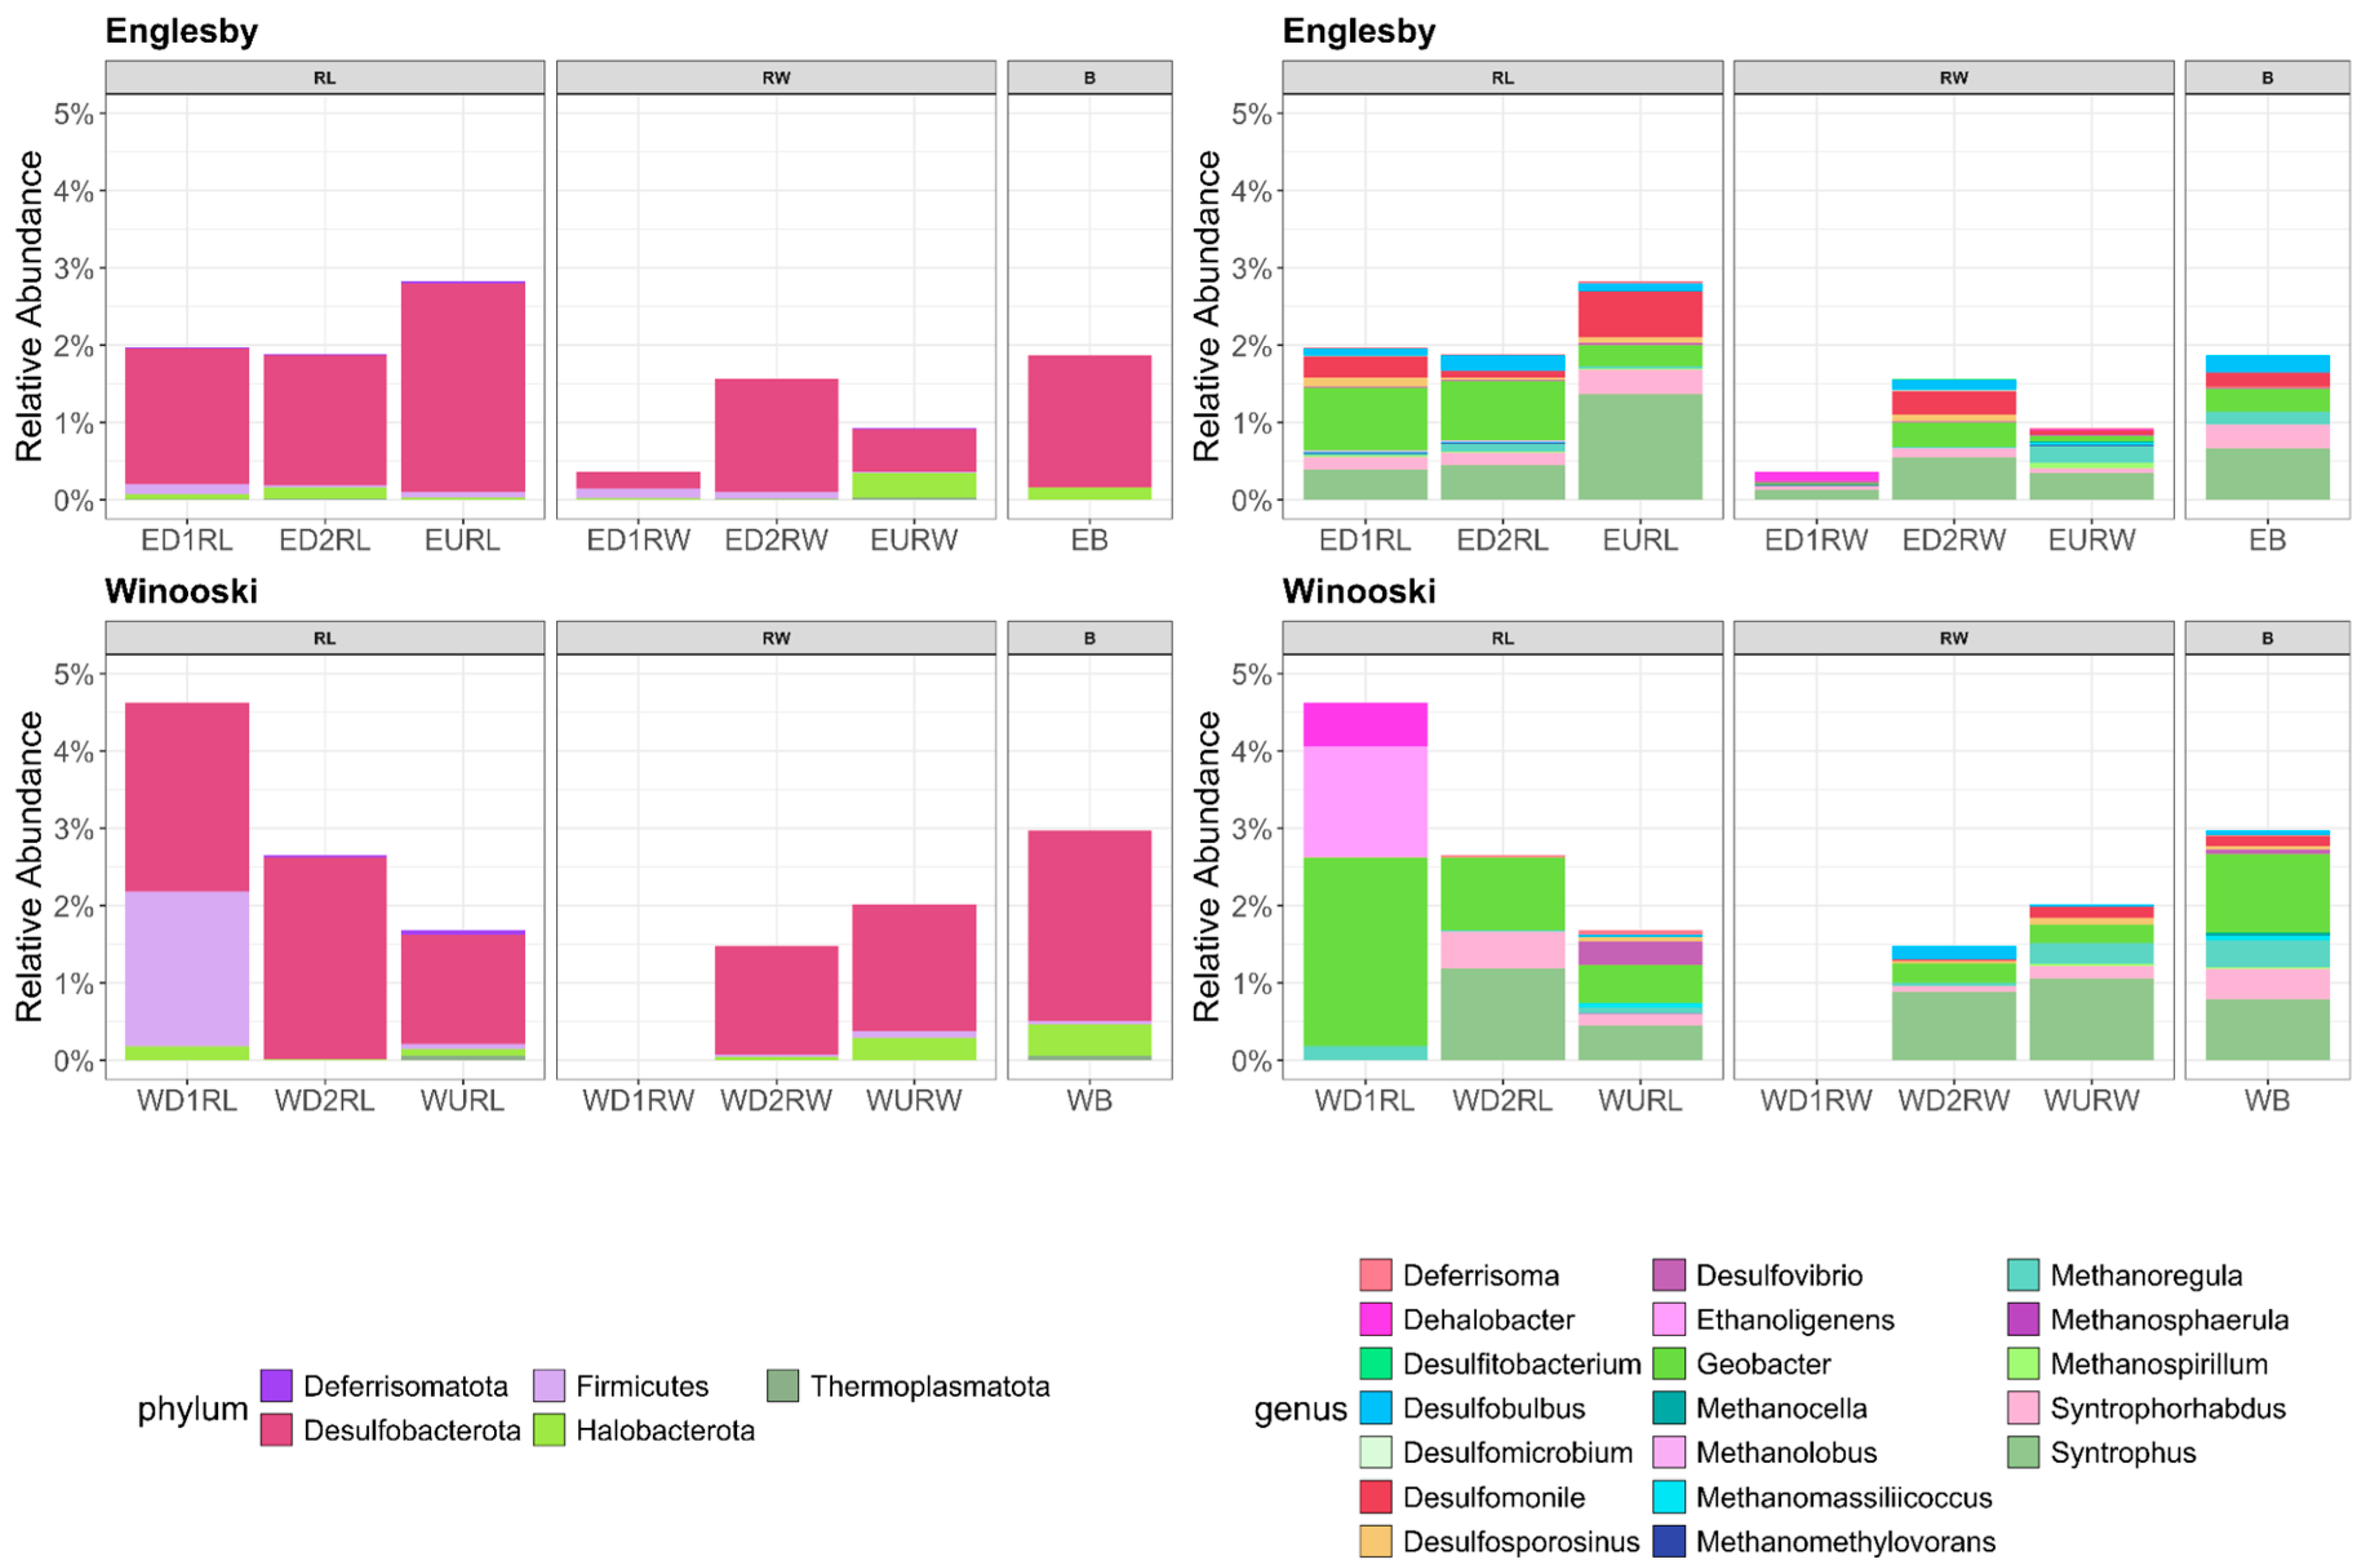
Figure 7.
Percentage of Hg-methylating microbes from identified 16S rRNA ASVs at different sampling sites in Winooski River and Englesby Brook, Vermont. Match was determined based on BLAST analysis of ASVs matching to Hg-methylating clades. (Riparian Land & Riparian Water n=6;Bay n=2). Bars represent mean MMM ASVs.
Disclaimer/Publisher’s Note: The statements, opinions and data contained in all publications are solely those of the individual author(s) and contributor(s) and not of MDPI and/or the editor(s). MDPI and/or the editor(s) disclaim responsibility for any injury to people or property resulting from any ideas, methods, instructions or products referred to in the content. |
© 2025 by the authors. Licensee MDPI, Basel, Switzerland. This article is an open access article distributed under the terms and conditions of the Creative Commons Attribution (CC BY) license (http://creativecommons.org/licenses/by/4.0/).
Copyright: This open access article is published under a Creative Commons CC BY 4.0 license, which permit the free download, distribution, and reuse, provided that the author and preprint are cited in any reuse.


