
Submitted:
02 July 2025
Posted:
04 July 2025
You are already at the latest version
Preprints on COVID-19 and SARS-CoV-2
Abstract
CD9 protein belongs to a family of proteins called tetraspanins, so named for their four-transmembrane spanning architectures. These proteins are located to domains in the plasmatic membrane, called tetra-spanin-enriched microdomains (TEMs). Several proteases and cellular receptors for virus entry cluster into TEMs, suggesting that TEMs are preferred virus entry portals. Severe Acute Respiratory syndrome coro-navirus 2 (SARS-CoV-2) spike (S) protein mediates virus attachment and entry into cells by binding to human angiotensin converting enzyme 2 (ACE-2). In addition, the secretory, type-I membrane-bound, SARS-CoV-2 S protein is synthesized as a precursor (proS) that undergoes posttranslational cleavages by host cell proteases, such as furin and TMPRSS2. Moreover, it has been shown that neuropilin-1 (NRP1), which is known to bind furin-cleaved substrates, potentiates SARS-CoV-2 infectivity. Our results indicate that CD9 facilitates SARS-CoV-2 infection. In addition, we show how knocking-out CD9 leads to a decrease in the expression of NRP1, a protein improving SARS-CoV-2 infection. Furthermore, we show that CD9 colocalizes with ACE-2, NRP1, furin, and TMPRSS2 at the plasma membrane; that the absence of CD9 decreases the expression of these proteins on the plasma membrane CD9-enriched microdomains, and that CD9 interacts with ACE2. In conclusion, our data suggest that CD9 facilitates SARS-CoV-2 infection and that CD9 brings together different host proteins involved in SARS-CoV-2 attachment and entry into host cells, such as ACE2, NRP1, furin, and TMPRSS2. Importantly, the fact that a blocking antibody targeting CD9 can effectively reduce SARS-CoV-2 titers highlights not only the mechanistic role of CD9 in viral entry but also offers translational potential, suggesting that tetraspanin-targeting antibodies could be developed as therapeutic agents against SARS-CoV-2 and possibly other coronaviruses, with meaningful implications for clinical intervention.
Keywords:
CD9
; SARS-CoV-2
; virus entry
; virus-host interactions
; proteases TMPRSS2 and furin
; ACE2
; NRP1
; tetraspanins
1. Introduction
Enveloped viruses, such as Severe Acute Respiratory Syndrome coronavirus 2 (SARS-CoV-2), require the fusion of viral and host membranes to deliver the viral genetic material inside the cells, initiating viral infections. In the case of SARS-CoV-2, this process involves the binding of the spike (S) protein to its receptor, angiotensin-converting enzyme 2 (ACE2) [1,2,3,4,5,6], and the proteolytic activation of the S protein, which is divided in two domains, named S1 and S2. For this proteolytic activation, two proteolytic cleavage steps following ACE2 engagement are needed. The first of these is located to the S1–S2 boundary, and the second is localized to the S2′ site in the S2 subunit. In the case of SARS-CoV-2, the S1–S2 boundary contains a multibasic site (Arg-Arg-Ala-Arg) that is cleaved by furin in the virus-producer cell [3,4,7,8,9,10,11]. After the S1–S2 boundary is cleaved, the S2′ site must also be proteolytically cleaved to fully activate the fusion process either by proteases of the type II transmembrane serine protease (TTSP) family, mainly the TTSP member transmembrane protease serine 2 (TMPRSS2) on the cell surface [12,13,14], or by cathepsins in the endosomes [15]. Cell entry by SARS-CoV-2 is therefore dependent on the target-cell proteases, and TMPRSS2 and cathepsin L are the two major proteases involved in S protein activation. As TMPRSS2 is present at the cell surface, TMPRSS2-mediated S protein activation occurs at the plasma membrane, whereas cathepsin-mediated activation occurs in the endolysosome (reviewed in [16]). In addition to the proteolytic cleavages by proteases, neuropilin 1 (NRP1) was shown to enhance TMPRSS2-mediated entry of SARS-CoV-2 [17,18]. NRP1 was also shown to bind S1 through the multibasic furin-cleavage site and to promote S1 shedding and to expose the S2′ site to TMPRSS2 [19].
CD9 belongs to a family of proteins called tetraspanins (Tspans). Tspans are small proteins embedded in the membrane through four transmembrane domains, belonging to the large tetraspanin family [20]. Tspans contain four α-helical transmembrane (TM) regions (TM1–TM4), two extracellular (EC) domains (EC1 and EC2), and three cytoplasmic (CP) regions, comprising N-terminus, C-terminus and a short loop that connects TM2 and TM3. These topological domains contribute differently to the structure of tspans and to their ability to undergo intramolecular and intermolecular interactions [20], interacting with membrane-associated proteins, including cell receptors, transmembrane proteases and other Tspans, to provide platforms critical for viral entry [21,22]. Tspan encriched microdomains (TEMs) are associated with the entry sites of several viruses, including coronaviruses, as TEMs contain the CoV receptors dipeptidyl-peptidase 4 (DPP4), which is the receptor for Middle East Respiratory Syndrome coronavirus (MERS-CoV) [23], aminopeptidase N (APN), the receptor for HCoV-229E [24], ACE2, the receptor for SARS-CoV and SARS-CoV-2 [1,2,3,4,5,6], and APN and DPP4 [25]. For example, the Tspan CD9 positions DPP4, APN and TMPRSS2 into TEMs, facilitating MERS-CoV and HCoV-229E entry [26], the Tspans CD9, CD63 and CD81 facilitate the entry of the CoVs murine hepatitis virus (MHV), MERS-CoV, HCoV-229E, and SARS-CoV-2 [25], and Tspan8 facilitates SARS-CoV-2 infection rates independently of ACE2-Spike interaction [27]. Related with other viruses, the Tspans CD9, CD63 and CD81 facilitate the entry of influenza A virus (IAV) [25], tetraspanin CD151 mediates papillomavirus endocytosis [28], tetraspanin CD81 mediates hepatitis C virus (HCV) entry [29], Tspans CD9 and CD81 modulate HIV-1-induced membrane fusion [30]. In addition, CD81 plays a role during influenza virus budding, as influenza virus infection recruits CD81 on the plasma membrane to the concentrated budding sites where other viral proteins are located [31].
In this work, we evaluated the role of the Tspan CD9 on SARS-CoV-2 infection. Using CD9 KO cells and anti-CD9 antibody, we found that CD9 positively affects SARS-CoV-2 infection. In addition, we show how knocking-out CD9 leads to a decrease in the expression of NRP1, a protein improving SARS-CoV-2 infection. Furthermore, we show that CD9 colocalizes with ACE-2, NRP1, furin, and TMPRSS2 at the plasma membrane; and that CD9 is present in the same plasmatic membrane domains as ACE-2, NRP1, furin, and TMPRSS2, leading the absence of CD9 to a decrease in the expression of these proteins on the CD9-enriched microdomains.
2. Materials and Methods
Cells and viruses. SW480 WT (ATCC CCL-228), A549 (ATCC CCL-185) cells, 293T cells (ATCC CRL-1573), and Vero E6 (ATCC CRL-1586) cells were obtained from the ATCC. A549 and SW480 CD9 knock-out cells were generated using CRISPR-Cas9 guide RNAs designed with the CRISPOR tool [32]. Briefly, three candidate guide RNAs (gRNAs) targeting distinct exons (exons 1, 3, and 4) of the CD9 gene were designed using the CRISPOR platform. After in silico evaluation of potential off-target effects and on-target scores, the guide targeting exon 1 was selected for further experiments due to its optimal balance between predicted efficiency and minimal off-target activity. The selected guide sequence for exon 1 was GCCCTCACCATGCCGGTCAA, adjacent to the protospacer adjacent motif (PAM) AGG. The PAM motif is critical as it is required for the Cas9 endonuclease to bind the target DNA and introduce a double-strand break three nucleotides upstream of the PAM. The CRISPR/Cas9 machinery, including the gRNA and Cas9, was co-transfected into the target cells using a plasmid that also expresses GFP as a reporter. This allowed for the selection of successfully transfected cells based on GFP expression via fluorescence-activated cell sorting (FACS). GFP-positive cells were isolated by cell sorting and subsequently subjected to clonal dilution to establish single-cell-derived clones for further validation of CD9 knockout efficiency. WT and CD9 KO A549 cells overexpressing human ACE2 (A549-ACE2), and 293T cells overexpressing ACE2 were obtained by transducing the cells with a retrovirus expressing human ACE2 and a blasticidin resistance gene (kindly provided by Pablo Gastaminza, National Center for Biotechnology, Madrid, Spain). These cells were grown in the presence of 2.5 ug/ml of blasticidin (ThermoFisher Scientific).
SARS-CoV-2 (kindly provided by prof. Luis Enjuanes, at Centro Nacional de Biotecnología, CNB-CSIC, Spain) [33] was grown in Vero E6 cells. SARS-CoV-2 was titrated by plaque assay (plaque forming units, PFU/ml) in confluent monolayers of Vero E6 cells seeded in 24-well plates, as previously described [34].
Plasmids. Polymerase II expression pcDNA3.1 plasmids encoding CD9 (GenBank accession number NM_022873) were generated by synthesizing the open reading frame of CD9 (IDT DNA, Inc) flanked by the unique restriction sites for BamHI and NheI and cloning this fragment in the pCAGGs plasmid cut with the same enzymes.
SARS-CoV-2 infections. WT and CD9 KO SW480 and A549-ACE2 cells were infected with SARS-CoV-2 at a multiplicity of infection (MOI) of 0.2. At 24, 48, and 72 hpi, cell culture supernatants were collected and titrated in Vero E6 cells as previously described [34].
Infection in the presence of tetraspanin antibodies. SW480 and A549-ACE2 cells grown in 96-well plates were incubated for 30 min at 37°C with an anti-CD9 antibody (clone M-L13, Fisher scientific) or a control antibody (mouse IgG1 kappa isotype control (P3.6.2.8.1)) at 0.12 ug/ul. Afterwards, SARS-CoV-2 was added for 2 h at 37°C, and then the cells were rinsed, and incubated at 37°C for 24 h. Viral titers at 24 hpi were measured by a plaque lysis assay in Vero E6 cells, as previously described [34].
Silencing of NRP1. Human A549-ACE2 cells were transfected with a small interfering RNA specific for human NRP1 (ThermoFisherScientific, s16843) or with the non-targeting (NT) negative control (ThermoFisher Scientific, AM4635), twice, 24 h apart. The siRNAs were transfected at a final concentration of 20 nM, using lipofectamine RNAiMax (ThermoFisher Scientific), according to the manufacturer’s instructions.
qRT-PCRs. The mRNA levels of ACE2, NRP1, furin, TMPRSS2 and actin were analyzed by RT-qPCR. To this end, total RNAs from cells were extracted using the total RNA extraction kit (Omega Biotek). The High Capacity cDNA transcription kit (ThermoFisher Scientific) was used for performing the retrotranscriptase (RT) reactions at 37ºC, for 2 h, using random hexamers and total RNA as template. qPCRs were performed using the cDNAs obtained from the RT reactions, the Power SybrGreen PCR master mix (Applied Biosystems), and primers specific for human ACE2 (Fw: 5’-CAAGAGCAAACGGTTGAACAC-3’ and Rv: 5’-CCAGAGCCTCTCATTGTAGTCT-3’), NRP1 (Fw: 5’-TTCAGGATCACACAGGAGATGG-3’ and Rv: 5’- TAAACCACAGGGCTCACCAG-3’), furin (Fw: 5’- AGATGGGTTTAATGACTGG -3’ and Rv: 5’- CATAGAGTACGAGGGTGAAC -3’), TMPRSS2 (Fw: 5’-GATGACAGCGGATCCACCAG-3’ and Rv: 5’-TTGACCCCGCAGGCTATACA-3’), and GAPDH (Fw: 5’-GCCATGGGTGGAATCATATTGGA-3’ and Rv: 5’-TCGGAGTCAACGGATTTGGGTCGT-3’) genes. Quantification was achieved using the threshold cycle (2-ΔΔCT) method [35], and normalized to actin expression levels.
Western blots. Cells were lysed in lysis buffer (0.5% NP-40, 50 mM Tris HCl pH 7.5, 250 mM NaCl, 1mM EDTA) supplemented with protease (ThermoFisher Scientific) and phosphatase (Merck) inhibitors. Then, cell lysates were mixed with Laemmli sample buffer (Biorad), containing b-mercaptoethanol (sigma), and heated at 95ºC for 5 min, before SDS-PAGE electrophoresis. Proteins were transferred to nitrocellulose membranes (Biorad), and detected using a rabbit monoclonal antibody (mAb) specific for CD9 (abcam, ab236630), rabbit mAb specific for ACE2 (abcam ab108209), a rabbit mAb specific for NRP1 (abcam, ab81321), a mouse mAb specific for furin (Santa Cruz Biotechology, sc-133142), a mouse mAb specific for TMPRSS2 (Santa Cruz Biotechnology, sc-515727), a mouse mAb specific for actin (Sigma Aldrich, A1978), a mouse mAb specific for flotillin (BD Biosciences, 610820); followed by binding to goat anti-rabbit or goat anti-mouse polyclonal antibodies conjugated to horseradish peroxidase (Sigma Aldrich). Nitrocellulose membranes were then revealed by chemiluminescence with the SuperSignal west femto maximum sensitivity substrate (Thermo Fisher Scientific). Where indicated, protein bands were quantified by densitometry using the ImageJ (Fiji) software.
Immunofluorescence. Confluent monolayers of human SW480 and A549 cells were grown on sterile glass coverslips on 24-well plates until 90% confluency. The cells were fixed and permeabilized with 10% formaldehyde and 0.1 % triton X100 during 10 min at RT. Then, the cells were blocked with PBS containing 2.5% bovine serum albumin during 1 h at RT, and the cells were incubated with the following antibodies: anti-CD9 (generated in rabbit, ab236630, abcam), anti-ACE2 (generated in mouse, sc-390851, Santa Cruz Biotechnology), anti-NRP1 (generated in mouse, sc-5307), anti-furin (generated in mouse, sc133142, Santa Cruz Biotechnology), anti-TMPRSS2 (generated in mouse, sc-515727, Santa Cruz Biotechnology), and anti-flotillin (generated in mouse, sc-7465, Santa Cruz Biotechnology). Coverslips were washed 4 times with PBS and stained with secondary anti-rabbit and anti-mouse antibodies conjugated with Alexa Fluor 594, and 647 (Invitrogen), respectively, and nuclei were stained with DAPI (Thermo Fisher Scientific), during 45 min at RT. Coverslips were washed 4 times with PBS, and mounted in ProLong Gold antifade reagent (Thermo Fisher Scientific) and analyzed on a Leica STELLARIS 5 confocal microscope. Images were acquired with the same instrument setting and analyzed using the Fiji software.
Isolation of detergent-resistant membranes. A protocol adapted from [36] was followed. For each preparation of SW480 and A549-ACE2 WT and CD9 KO cells, cells from four 10-cm culture plates were washed three times with phosphate-buffered saline (PBS), scraped off in PBS supplemented with protease inhibitors, and recovered by centrifugation. Sedimented cells were resuspended in 1 ml Raft buffer (20 mM HEPES NaOH pH 7.4, 150 mM NaCl, 1 mM EDTA) containing 1% Brij98 detergent (Thermo Scientific) and protease inhibitors, by five passages through a 25G cannula. After determining the protein concentration with the Pierce BCA Protein Assay Kit, equal protein amounts of each sample were adjusted to a total volume of 1 ml with Raft buffer containing a final concentration of 1% Brij98. Then, samples were kept at 37 C for 5 min followed by a 30 min incubation on ice. The lysates (1 ml) were adjusted to a sucrose concentration of 43% by mixing with 2 ml 65 % (w/v) sucrose in Raft buffer. To construct a discontinuous sucrose gradient, this sample was layered beneath 7 ml 35 % (w/v) and 3 ml 5 % (w/v) sucrose in Raft buffer, respectively. Separation was performed in an SW40Ti rotor (Beckman Coulter) at 263,627 x gmax for 16 h at 4 C. Fractions of 1 ml were collected from top to bottom, for a total of 12 fractions. Aliquots of each fraction were supplemented with the required amount of 5x SDS sample buffer and analyzed by Western Blotting.
DuoLink® Proximity ligation assays (PLA). SW480 and A549-ACE2 WT and CD9 KO cells were seeded in Ibidi 8-well µ-slides (Ibidi, cat. no. 80826) and fixed with 4% paraformaldehyde (PFA) for 10 minutes at room temperature. The PLA assay was subsequently performed using the Duolink® In Situ Red Starter Kit Mouse/Rabbit (DUO92101, Sigma-Aldrich-Merck), following the manufacturer’s instructions. Briefly, after fixation, cells were incubated with the blocking solution provided in the kit for 1 hour at 37 °C. Then, cells were incubated overnight at 4 °C with primary antibodies specific for CD9 (rabbit, ab236630, Abcam) in combination with either ICAM1 (mouse, clone 6.5B5, sc-18853, Santa Cruz Biotechnology) as a positive control, or antibodies against ACE2 (mouse, sc-390851), NRP1 (mouse, sc-5307), furin (mouse, sc-133142), or TMPRSS2 (mouse, sc-515727), all from Santa Cruz Biotechnology. The next day after three PBS washes, Duolink® PLA Probes Anti-Rabbit PLUS and Anti-Mouse MINUS were applied at 1:5 dilution in antibody diluent for 1 hour at 37 °C. Slides were washed with Duolink In Situ Wash Buffer A, then incubated with ligation mixture (ligation buffer and ligase) for 30 min at 37 °C, facilitating connector oligonucleotide circularization if the probes were within <40 nm proximity. After additional washes, this was followed by an amplification step using amplification buffer plus polymerase that were added for a 100 min incubation at 37 °C, yielding rolling circle amplification of each ligation product with red fluorophore incorporation. Amplified signals were washed twice with Wash Buffer B (10 min each), followed by a final wash with 0.01× Wash Buffer B. Nuclei were stained using Duolink® In Situ Mounting Medium with DAPI. Hybridization of complementary labeled oligonucleotides to the amplified product produced discrete red fluorescent signals (dots). Images were acquired using a fluorescence microscope equipped with an ApoTome.2 optical sectioning module (Axio Imager.Z2, Carl Zeiss Microscopy GmbH, Jena, Germany) using a Texas Red filter set (λ_ex = 594 nm; λ_em = 624 nm). Quantification of the number of red dots per cell was performed using Fiji (ImageJ, version 1.54f, National Institute of Health, Bethesda, MD, USA).
Co-immunoprecipitation assays. 293T-ACE2 cells (100 mm-plate format) were transfected with a plasmid expressing CD9 or the empty plasmid, using lipofectamine 3000 (Invitrogen), according to the manufacturer’s instructions. At 24 h post-transfection, the cells were lysed in the co-immunoprecipitation buffer (NaCl 250 mM; EDTA 1 mM; 50 mM TrisHCl, pH 7.5; Brij98 0.5%) containing protease (ThermoFisher Scientific) and phosphatase (Merck) inhibitors, and cleared by centrifugation. Alternatively, A549-ACE2 WT and CD9 KO cells (100 mm-plate format) were lysed in the co-immunoprecipitation buffer containing protease and phosphatase (Merck) inhibitors, and cleared by centrifugation. Protein G-dynabeads (Thermo Fisher Scientific, 1004D) were incubated with the anti-CD9 antibody (Thermo Fisher Scientific, 1004D) overnight at 4ºC, and washed three times with Tris-buffered saline (TBS). Then, the anti-CD9 antibody conjugated to protein G-dynabeads was incubated with the cleared cell lysates during 4 h, at room temperature. The cellular extracts combined with the affinity resins were washed five times in TBS buffer containing 0.05% Tween-20. The immunoprecipitated proteins were unbound using 0.1 M glycine buffer at pH 2.4, denatured in loading buffer, and incubated at 95°C, during 5 min. Then, samples were analyzed by electrophoresis and Western blot as described above.
3. Results
The tetraspanin CD9 facilitates SARS-CoV-2 infection. Tetraspanins facilitate the entry of many viruses, including hepatitis C virus [37], human papillomavirus [28], IAV [25,31], and coronaviruses, including HCoV-229E, MERS-CoV, and SARS-CoV [25,26]. To analyze whether the tretraspanin CD9 facilitates the infection by SARS-CoV-2, the colorectal SW480 WT and CD9 KO cells, and the lung adenocarcinoma A549 WT and CD9 KO cells, were generated using a home-made CRISPR/Cas9 system (see Materials and Methods section). First, we confirmed by Western blot (Figure 1A), flow cytometry (Figure 1B) and immunofluorescence (Figure 1C), using antibodies specific for CD9, that the KO cells did not express the CD9 protein. The A549 WT and CD9 KO cells, were additionally transduced to overexpress human ACE2, given that A549 cells which do not overexpress ACE2 do not get efficiently infected [38]. Then, the SW480 WT and CD9 KO cells were infected, and viral titers were determined at 24, 48 and 72 hpi. At 48, and 72 hpi, 3 and 5-fold reductions in viral titers were detected in SW480 CD9 KO cells, compared to SW480 WT cells, respectively (Figure 1D), suggesting that CD9 facilitates SARS-CoV-2 infection. To analyze whether the effect of CD9 also applies to other cell lines, similar experiments were performed in A549-ACE2 WT and CD9 KO cells, showing 5 and 4-fold reductions in viral titers in the A549-ACE2 CD9 KO cells, compared to the A549-ACE2 WT cells (Figure 1D), further confirming that CD9 facilitates SARS-CoV-2 infection. Furthermore, to reinforce these results, SW480 and A549-ACE2 cells were incubated with an anti-CD9 blocking antibody, or with an IgG isotype control, and SARS-CoV-2 titers were measured at 24 hpi, showing reduction of viral titers in the cells treated with the anti-CD9 antibody, compared to the cells treated with the isotype antibody control (Figure 1E).
Blocking CD9 expression decreases NRP1 protein levels. Given the results showing that ACE2 is essential for SARS-CoV-2 entry into the cells, that furin, TMPRSS2 and NRP1 facilitate SARS-CoV-2 cellular entry, that tetraspanin-enriched microdomains (TEMs) are known to contain a variety of cell surface proteases [36,39], and that TEMs may contain coronavirus receptors and priming proteases [25,26], we hypothesized that CD9 could be affecting the expression or the membrane localization of ACE2, furin, TMPRSS2, and NRP1. To this end, we performed Western blot assays using antibodies specific for these proteins in SW480 WT and CD9 KO cells, either mock infected or infected with SARS-CoV-2 during 24, 48 and 72 h (Figure 2A). Of note, the expression of ACE2 was slightly decreased in mock-infected, CD9 KO cells, compared to mock-infected WT cells (Figure 2A), and the expression of NRP1 diminished both in mock-infected and SARS-CoV-2-infected CD9 KO cells compared to mock-infected and SARS-CoV-2-infected WT cells (Figure 2A), suggesting that CD9 may affect the expression or stability of ACE2 and particularly NRP1. On the other hand, CD9 KO cells exhibit a slight increase in both furin and TMPRSS2, with furin upregulated at later time points and TMPRSS2 showing sustained elevation across all time points evaluated (Figure 2A), highlighting a regulatory role for CD9 in controlling the expression of SARS-CoV-2 entry factors. To further analyze whether CD9 expression increases NRP1 protein levels, the levels of NRP1 were also analyzed in A549-ACE2 WT and CD9 KO cells, showing a reduction in the NRP1 levels in the CD9 KO cells compared to the WT cells in SARS-CoV-2-infected cells (Supplementary Figure S1). To analyze whether CD9 might affect the expression of NRP1 and the other SARS-CoV-2 entry molecules at the transcriptional level, the levels of mRNA were analyzed by RT-qPCR in both WT and CD9 KO SW480 and A549-ACE2 cell lines, either mock-infected or infected with SARS-CoV-2 during 24, 48 and 72 h. No significant differences at the mRNA levels were observed between WT and CD9 KO cells, either in mock-infected conditions or in SARS-CoV-2 conditions (Figure 2B), suggesting that CD9 does not affect the transcription levels of NRP1 or any of the other entry factors.
Given that it had been shown that NRP1, which is known to bind furin-cleaved substrates, potentiating SARS-CoV-2 infectivity [17,18], we analyzed in our cell system whether the decreased expression of NRP1 decreased viral infection. To this end, A549-ACE2 cells were transfected with an siRNA specific for NRP1 and with a non-targeted siRNA as control. The efficient knocked-down of NRP1 was confirmed by Western blot (Figure 3A). Interestingly, in cells silenced for NRP1, SARS-CoV-2 titers decreased by around 10-fold at 48 and 72 hpi, in comparison with the control cells transfected with non-targeted siRNA (Figure 3B). These data correlate with previous data showing that NRP1 facilitates SARS-CoV-2 entry and infectivity, as previously described [17,18]. In addition, these data provide a molecular mechanism for the effect of CD9 on facilitating SARS-CoV-2 infection.
CD9-enriched membranes contain the SARS-CoV-2 receptor ACE2 and S-cleavage proteases. Previous results suggested that tetraspanin- and particularly CD9-enriched microdomains contained the coronavirus receptors APN, DPP4, CEACAM, and ACE2; and the protease TMPRSS2 [25], suggesting that CD9 might facilitate SARS-CoV-2 infection by bringing in proximity the SARS-CoV-2 receptor and the proteases that facilitate the viral entrance in the cellular plasmatic membrane. To this end, to analyze whether CD9, ACE2, NRP1, and the proteases furin and TMPRSS2 are located to the same membrane microdomains, a fractionation experiment using the Brij98 detergent was performed, in a similar way as previously reported [36]. Lysates from SW480 WT and CD9 KO cells were layered beneath a discontinuous sucrose step gradient, from which fractions were recovered from top to bottom after overnight ultracentrifugation for Western blot analysis, and 12 fractions were collected. Interestingly, CD9, ACE2, NRP1, and the transmembrane proteases TMPRSS2 and furin were mainly detected in the same fractions, which were the detergent-resistant membrane (DRM)-fractions, as observed by Western blot analysis using antibodies specific for each of these proteins (Figure 4A), suggesting that these proteins are located to the same membrane microdomains. As a control, we visualized the distribution of the established lipid raft marker flotillin-1 [40,41], which was also mainly present to the DRM fractions (Figure 4A), as previously reported [36]. To analyze whether CD9 affects the location or the expression levels of ACE2, NRP1, and the proteases TMPRSS2 and furin, the presence of these proteins was compared among SW480 WT and CD9 KO cells. Western blot analysis revealed that the presence of ACE2, NRP1, and the proteases TMPRSS2 and furin was significantly lower in the DRM-fractions containing CD9 (as observed in the WT cells), in the CD9 KO cells compared to the WT cells (Figure 4B). To reinforce these results, the same fractionation studies were performed in the A549 WT and CD9 KO cells (Supplementary Figure S2), showing that CD9 was mainly located at the same fractions as ACE2, NRP1, furin and TMPRSS2. However, in this case, whereas the proteins ACE2, NRP1, furin, TMPRSS2, CD9 and flotillin were preferentially expressed at fraction 5, in the A549-ACE2 WT cells, the proteins ACE2, NRP1 and furin were preferentially visualized at fraction 3 in the A549-ACE2 CD9 KO cells, and TMPRSS2 could not be detected (Supplementary Figure S2A). Furthermore, the amounts of ACE2, NRP1, furin, and TMPRSS2 were significantly lower in the CD9 KO cells, in comparison to the WT cells (Supplementary Figure S2). These results strongly suggest that CD9 affects the protein levels of ACE2, NRP1, and the proteases TMPRSS2 and furin within the cellular membranes microdomains, and suggest that CD9 likely helps to bring together the host factors ACE2, NRP1, and the proteases TMPRSS2 and furin, facilitating viral infectivity.
CD9 partially colocalizes with ACE2, NRP1, and the proteases TMPRSS2 and furin. To reinforce the results showing that CD9 likely facilitates the proximity of ACE2, NRP1, and the proteases TMPRSS2 and furin, immunofluorescence and confocal studies were assessed. To this end, SW480 cells were stained with antibodies specific for CD9, together with antibodies specific for ACE2, NRP1, TMPRSS2, furin, and flotillin, as control (Figure 5). A partial colocalization in the peri-plasmatic membrane region between CD9 and ACE2, NRP1, TMPRSS2, furin and flotillin was observed, suggesting that these proteins might be in the same membrane microdomains (Figure 5).
Furthermore, a Proximity Ligation Assay (PLA) was employed to investigate protein-protein interactions between CD9 and the proteins of interest, including NRP1, furin, ACE2, and TMPRSS2. ICAM-1 was used as a positive control, as its interaction is well-documented [42], and serves to validate the assay’s efficiency (Figure 6A). To this end, SW480 and A549-ACE2 WT (Figure 6) and CD9 KO cells (Supplementary Figure S3) were fixed and incubated with primary antibodies specific for CD9 together with antibodies specific for ICAM1 (as a positive control) (Figure 6B) or against ACE2, NRP1, furin or TMPRSS2 (Figure 6C-D), followed by an incubation with secondary antibodies conjugated to proximity ligation assay (PLA) probes. Then, an incubation with a solution containing fluorescently labelled-nucleotides, complementary oligonucleotides, and a polymerase, was applied, and finally the cells were incubated with a ligation enzyme. The results revealed a significant proximity between CD9 and both NRP1 and furin, as evidenced by the presence of PLA signal dots in both SW480 (Figure 6C) and A549-ACE2 WT cells (Figure 6D). As control, no signal dots were observed neither for SW480 nor for A549-ACE2 CD9 KO cells (Supplementary Figure S3), indicating proximity between CD9 and NRP1 and furin proteins (30-40nm). In addition, we could detect that CD9 is in close proximity to TMPRSS2 and ACE2 in the A549-ACE2 cells (Figure 6D), but not in the SW480 WT cells (Figure 6C), likely due to the fact that the expression of TMPRSS2 and ACE2 is lower in the SW480 cells compared to the A549-ACE2 cells (data not shown). These findings suggest that CD9 participates in molecular interactions with NRP1, furin, and in lesser extent with TMPRSS2, and ACE2, potentially playing a role in the regulation or modulation of their functions, possibly through membrane organization or the mediation of specific protein complexes.
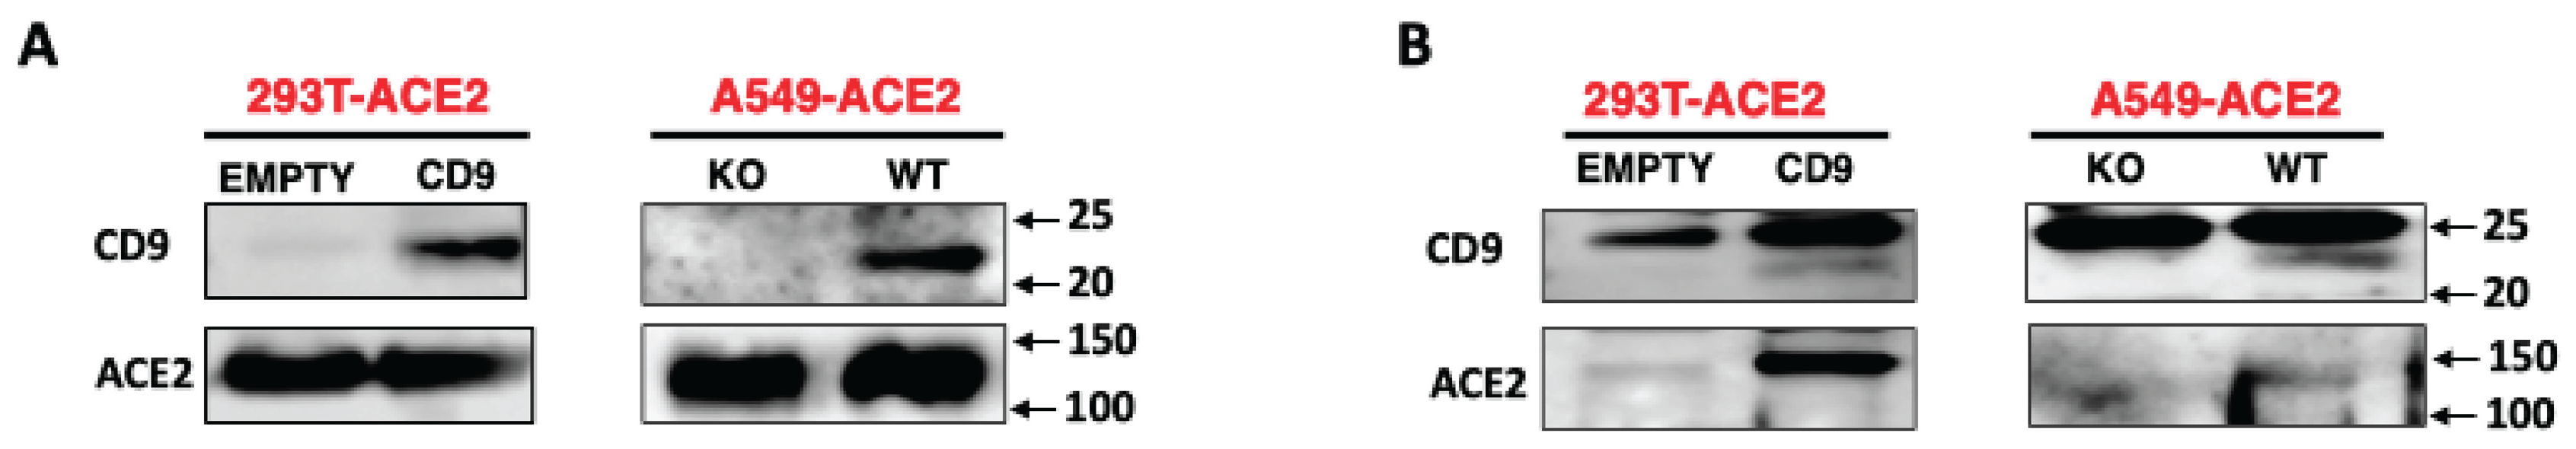
CD9 interacts with ACE2. To analyze whether CD9 interacts with NRP1, furin, ACE2, and TMPRSS2, as strongly suggested by the Duolink assays, cellular extracts from A549-ACE2 WT cells and CD9 KO cells (as control) were immunoprecipitated with an antibody specific for CD9 conjugated to protein G-dynabeads. Alternatively, 293T-ACE2 cells were transfected with a pcDNA3.1 plasmid expressing CD9 or with the empty plasmid, as control, and the cellular extracts were immunoprecipitated with the anti-CD9 antibody conjugated to protein G-dynabeads. First, we analyzed CD9 and ACE2 protein expression in the cellular extracts by Western blot (Figure 7A). Interestingly, CD9 and ACE2 co-immunoprecipitated together, both in the 293T-ACE2 cells transfected with the plasmid overexpressing CD9 or in the A549-ACE2 WT cells (Figure 7B), indicating that these two proteins interact directly or indirectly. As control, ACE2 was not detected after the co-immunoprecipitation using the A549-ACE2 CD9 KO cells (Figure 7B). However, we were not able to detect NRP1, TMPRSS2 and furin after immunoprecipitating CD9. This could be due to a low sensitivity detection of these proteins (Supplementary Figure S4), because all the proteins ACE2, NRP1, TMPRSS2 and furin are detected as in close proximity to CD9 according to the Duolink assays (Figure 6), and because NRP1, TMPRSS2 and furin are detected to lower levels than ACE2 (data not shown).
4. Discussion
In this manuscript we show that CD9 facilitates SARS-CoV-2 infection. In addition, we show how knocking-out CD9 leads to a decrease in the protein expression of NRP1, a protein improving SARS-CoV-2 infection. Furthermore, we show that CD9 colocalizes with ACE2, NRP1, furin, and TMPRSS2 at the plasma membrane; that the absence of CD9 decreases the expression of these proteins on the CD9-enriched microdomains, and that CD9 interacts with ACE2, suggesting that CD9 facilitates SARS-CoV-2 infection and that CD9 brings together different host proteins involved in SARS-CoV-2 attachment and entry into host cells, such as ACE2, NRP1, furin, and TMPRSS2.
Using two different cell lines of CD9 knock-out cells, and the treatment of WT cells with an antibody blocking CD9, we have shown that SARS-CoV-2 titers are decreased. Similarly, it was previously shown that the treatment of cells with antibodies specific for the Tspans CD9, CD63, and CD81, reduced the infection by the coronavirus MHV, and SARS-CoV, MERS-CoV, and HCoV-229E pseudovirus transductions in susceptible cells [25]. Interestingly, antibody treatment of tetraspanins did not reduce the levels of CoV binding to the entry receptor, and MHV infection and pseudovirus transductions were rescued with overexpression of TMPRSS2, thus suggesting that tetraspanin facilitation of CoV infections lies in mechanically allowing the access of receptor-bound viruses to the transmembrane proteases that speed up membrane fusion [25]. Importantly, the fact that a blocking antibody targeting CD9 can effectively reduce SARS-CoV-2 titers highlights not only the mechanistic role of CD9 in viral entry but also offers translational potential, suggesting that tetraspanin-targeting antibodies could be developed as therapeutic agents against SARS-CoV-2 and possibly other coronaviruses, with meaningful implications for clinical intervention.
Our Western blot analysis reveals that knockout of CD9 in both SW480 and A549 cells leads to a marked reduction in NRP1 expression compared to wild-type cells following SARS-CoV-2 infection. However, only a slight decrease for ACE2 was detected in mock and 24 hpi in SW480 CD9 KO cells. In contrast, the expression of the proteases furin and TMPRSS2 was increased in SW480 CD9 KO cells, with furin upregulated at later time points and TMPRSS2 elevated across all time points examined. Similarly, the expression of TMPRSS2 and furin was slightly decreased in the A549-ACE2 CD9 KO cells. The observed reduction in NRP1 and ACE2 levels in CD9-deficient cells suggests that CD9 may play a role in stabilizing or maintaining the expression of these key SARS-CoV-2 entry factors. CD9, a member of the tetraspanin family, is known to organize membrane microdomains and facilitate the assembly of protein complexes at the cell surface [43]. Loss of CD9 could disrupt these microdomains, potentially leading to increased internalization, degradation, or reduced trafficking of ACE2 and NRP1 to the plasma membrane. Interestingly, the upregulation of TMPRSS2 in CD9 KO cells may contribute to the observed decrease in ACE2. TMPRSS2 is essential for spike protein activation and viral membrane fusion [44]. TMPRSS2 can also cleave ACE2, thereby reducing its cell surface expression and promoting its shedding [45]. Additionally, CD9 is known to negatively regulate the activity of the metalloproteinase ADAM17 [46,47], which is involved in ectodomain shedding of ACE2 [45]. Loss of CD9 may therefore lead to increased ADAM17 activity and further ACE2 cleavage, contributing to lower steady-state ACE2 levels in CD9 KO cells. However, a proteolytic cleavage for NRP1 has not been described for furin nor TMPRSS2, nor ADAM17 or any other metalloproteinase regulated by CD9 [48]. Further studies will be required to assess whether CD9 differentially regulates the proteolytic processing of the diverse array of cell surface receptors involved in SARS-CoV-2 entry.
We have shown that CD9 is in the same plasma membrane microdomains as ACE2, NRP1, furin and TMPRSS2, by using a gradient ultracentrifugation. Similar to our results for TMPRSS2, it was previously shown that the tetraspanin CD9, but not the tetraspanin CD81, formed cell-surface complexes of dipeptidyl peptidase 4 (DPP4), the MERS-CoV receptor, and the type II transmembrane serine protease (TTSP) member TMPRSS2, a CoV-activating protease [26]. Furthermore, it was previously found that the CoV receptors ACE2, APN, CEACAM, and DPP4 and the protease TMPRSS2 are more abundant on TEMs than elsewhere in cell surfaces [25]. However, in this manuscript the authors only distinguish between high-density and low-density fractions, and as far as we know it was not previously described that CD9 is in the same cell surface microdomains as NRP1, and furin.
There is evidence that cathepsins are located to endosomes, and there is no evidence that cathepsins are located at TEMs, therefore, the effect of CD9 on SARS-CoV-2 entry likely applies to plasma membrane-mediated SARS-CoV-2 entry, and not to the entry via endosomes (reviewed in [16]). It seems that the SARS-CoV-2 entry at the plasma membrane via TMPRSS2 is faster than the endosomal entry route, and the first route is the preferred entry route when TMPRSS2 is expressed in the cells [14]. However, analyses of clinical SARS-CoV-2 isolates for their entry into cells reflecting in vivo infection environments, taking into account the cells in which CD9 is expressed, may be necessary to assess the importance of TEM-associated S proteolysis in natural infection and disease.
In addition, we have found by immunoprecipitation and Western blot that ACE2 co-immunoprecipitates with CD9. However, we have not been able to detect NRP1, TMPRSS2 and furin after immunoprecipitating CD9. This could be due to a low sensitivity detection of these proteins, because all the proteins ACE2, NRP1, TMPRSS2 and furin are detected as in close proximity to CD9 according to the Duolink assays, and because NRP1, TMPRSS2 and furin are detected to lower levels than ACE2. According to our results, it was previously shown that ACE2 co-immunoprecipitates with CD9 [49]. While co-IP and Western blotting confirmed a stable interaction between ACE2 and CD9, Duolink revealed more frequent or abundant proximity events between CD9 and NRP1 or furin, and ACE2 interaction was only detected in the A549-ACE2 cell line where ACE2 is overexpressed but not in the SW480 cell line. Moreover, it is surprising the relatively weaker Duolink signal for ACE2–CD9, despite co-IP detection. These could be due to the different affinities of the antibodies used, that could work better for one technique versus the other, but underscore the value of Duolink in uncovering interactions that are otherwise missed by traditional biochemical methods, such as the case for furin or NRP1, providing a more nuanced view of the interactome in its physiological context. A key advantage of the Duolink proximity ligation assay (PLA) over traditional co-immunoprecipitation (Co-IP) is its ability to detect not only stable, but also transient and low-affinity protein-protein interactions directly in situ. Unlike Co-IP, which requires cell lysis and multiple washing steps—conditions that can disrupt labile or weakly associated complexes—Duolink is performed on fixed cells or tissue. This fixation step effectively “freezes” the molecular state of the cell at a specific time point, preserving even fleeting or low-abundance interactions that may be lost during biochemical extraction [50].
In summary, our findings demonstrate that CD9 plays a central role in organizing the SARS-CoV-2 entry platform by facilitating the colocalization and functional interplay of ACE2, NRP1, furin, and TMPRSS2 within plasma membrane microdomains. The reduction in viral titers upon CD9 knockout or blockade, together with the altered expression and distribution of entry factors, underscores the importance of tetraspanin-mediated receptor-protease clustering for efficient SARS-CoV-2 infection. These results highlight the potential of targeting CD9 as a therapeutic strategy to disrupt viral entry and provide new insights into the molecular mechanisms governing coronavirus-host interactions
Supplementary Materials
The following supporting information can be downloaded at website of this paper posted on Preprints.org.
Author Contributions
Conceptualization, MLS, BSA, CLL and MLD; Methodology, VR, MLS, DT, and MLD; Validation, VR, MLS, DT, and MLD; Formal Analysis, VR, MLS, DT, and MLD; Investigation, VR, MLS, BSA, CLL, and MLD; Resources, BSA, CLL and MLD; Data Curation, VR, MLS and MLD; Writing – Original Draft Preparation, MLD; Writing – Review & Editing, VR, MLS, and MLD; Supervision, BSA, CLL, and MLD; Project Administration, BSA, CLL and MLD; Funding Acquisition, MLS, BSA, CLL, and MLD. All authors have read and agreed to the published version of the manuscript.
Funding
This work was supported by grant PID-2021-123810OB-I00, funded by MCIN/ AEI /10.13039/501100011033/ and by FEDER; and by grant CNS2022-135276, funded by MCIN/AEI/10.13039/501100011033 and the European Union NextGenerationEU/PRTR, to MLD. This work was also funded by FINBA-ISPA through the call for Early-Career Researchers, sponsored by JANSSEN (2021-050-INTRAMURAL NOV-SAALM), to MLS and by PCTI-Plan de Ciencia, Tecnología e Innovación 2024-2027 from the Gobierno del Principado de Asturias (“Ayudas para Grupos de Investigación del Principado de Asturias 2024–2027”, FICYT, Grant IDE/2024/000775 Grupo de Inmunología Traslacional), co-funded by FEDER Funding Program from the European Union and by Instituto de Salud Carlos III (ISCIII) through the projects PI22/00738 and PI23/00567 to CLL and BSA. The funders had no role in study design, data collection and analysis, decision to publish, or preparation of the manuscript.
Acknowledgments
The authors also acknowledge Danay Cibrian (Department of Immunology, IIS-Princesa), for her valuable scientific support.
Conflicts of Interest
The authors declare no conflicts of interest.
References
- Lan, J.; Ge, J.; Yu, J.; Shan, S.; Zhou, H.; Fan, S.; Zhang, Q.; Shi, X.; Wang, Q.; Zhang, L.; et al. Structure of the SARS-CoV-2 Spike Receptor-Binding Domain Bound to the ACE2 Receptor. Nature 2020, 581, 215–220. [Google Scholar] [CrossRef] [PubMed]
- Letko, M.; Marzi, A.; Munster, V. Functional Assessment of Cell Entry and Receptor Usage for SARS-CoV-2 and Other Lineage B Betacoronaviruses. Nat Microbiol 2020, 5, 562–569. [Google Scholar] [CrossRef] [PubMed]
- Shang, J.; Wan, Y.; Luo, C.; Ye, G.; Geng, Q.; Auerbach, A.; Li, F. Cell Entry Mechanisms of SARS-CoV-2. Proc. Natl. Acad. Sci. U.S.A. 2020, 117, 11727–11734. [Google Scholar] [CrossRef] [PubMed]
- Shang, J.; Ye, G.; Shi, K.; Wan, Y.; Luo, C.; Aihara, H.; Geng, Q.; Auerbach, A.; Li, F. Structural Basis of Receptor Recognition by SARS-CoV-2. Nature 2020, 581, 221–224. [Google Scholar] [CrossRef]
- Walls, A.C.; Park, Y.-J.; Tortorici, M.A.; Wall, A.; McGuire, A.T.; Veesler, D. Structure, Function, and Antigenicity of the SARS-CoV-2 Spike Glycoprotein. Cell 2020, 181, 281–292.e6. [Google Scholar] [CrossRef]
- Wang, Q.; Zhang, Y.; Wu, L.; Niu, S.; Song, C.; Zhang, Z.; Lu, G.; Qiao, C.; Hu, Y.; Yuen, K.-Y.; et al. Structural and Functional Basis of SARS-CoV-2 Entry by Using Human ACE2. Cell 2020, 181, 894–904.e9. [Google Scholar] [CrossRef]
- Coutard, B.; Valle, C.; de Lamballerie, X.; Canard, B.; Seidah, N.G.; Decroly, E. The Spike Glycoprotein of the New Coronavirus 2019-nCoV Contains a Furin-like Cleavage Site Absent in CoV of the Same Clade. Antiviral Res 2020, 176, 104742. [Google Scholar] [CrossRef]
- Hoffmann, M.; Kleine-Weber, H.; Pöhlmann, S. A Multibasic Cleavage Site in the Spike Protein of SARS-CoV-2 Is Essential for Infection of Human Lung Cells. Molecular Cell 2020, 78, 779–784.e5. [Google Scholar] [CrossRef]
- Xia, S.; Lan, Q.; Su, S.; Wang, X.; Xu, W.; Liu, Z.; Zhu, Y.; Wang, Q.; Lu, L.; Jiang, S. The Role of Furin Cleavage Site in SARS-CoV-2 Spike Protein-Mediated Membrane Fusion in the Presence or Absence of Trypsin. Signal Transduct Target Ther 2020, 5, 92. [Google Scholar] [CrossRef]
- Johnson, B.A.; Xie, X.; Bailey, A.L.; Kalveram, B.; Lokugamage, K.G.; Muruato, A.; Zou, J.; Zhang, X.; Juelich, T.; Smith, J.K.; et al. Loss of Furin Cleavage Site Attenuates SARS-CoV-2 Pathogenesis. Nature 2021, 591, 293–299. [Google Scholar] [CrossRef]
- Peacock, T.P.; Goldhill, D.H.; Zhou, J.; Baillon, L.; Frise, R.; Swann, O.C.; Kugathasan, R.; Penn, R.; Brown, J.C.; Sanchez-David, R.Y.; et al. The Furin Cleavage Site in the SARS-CoV-2 Spike Protein Is Required for Transmission in Ferrets. Nat Microbiol 2021, 6, 899–909. [Google Scholar] [CrossRef] [PubMed]
- Matsuyama, S.; Nagata, N.; Shirato, K.; Kawase, M.; Takeda, M.; Taguchi, F. Efficient Activation of the Severe Acute Respiratory Syndrome Coronavirus Spike Protein by the Transmembrane Protease TMPRSS2. J Virol 2010, 84, 12658–12664. [Google Scholar] [CrossRef] [PubMed]
- Bestle, D.; Heindl, M.R.; Limburg, H.; Van Lam van, T.; Pilgram, O.; Moulton, H.; Stein, D.A.; Hardes, K.; Eickmann, M.; Dolnik, O.; et al. TMPRSS2 and Furin Are Both Essential for Proteolytic Activation of SARS-CoV-2 in Human Airway Cells. Life Sci Alliance 2020, 3, e202000786. [Google Scholar] [CrossRef] [PubMed]
- Koch, J.; Uckeley, Z.M.; Doldan, P.; Stanifer, M.; Boulant, S.; Lozach, P.-Y. TMPRSS2 Expression Dictates the Entry Route Used by SARS-CoV-2 to Infect Host Cells. EMBO J 2021, 40, e107821. [Google Scholar] [CrossRef]
- Seyedpour, S.; Khodaei, B.; Loghman, A.H.; Seyedpour, N.; Kisomi, M.F.; Balibegloo, M.; Nezamabadi, S.S.; Gholami, B.; Saghazadeh, A.; Rezaei, N. Targeted Therapy Strategies against SARS-CoV-2 Cell Entry Mechanisms: A Systematic Review of in Vitro and in Vivo Studies. J Cell Physiol 2021, 236, 2364–2392. [Google Scholar] [CrossRef]
- Jackson, C.B.; Farzan, M.; Chen, B.; Choe, H. Mechanisms of SARS-CoV-2 Entry into Cells. Nat Rev Mol Cell Biol 2022, 23, 3–20. [Google Scholar] [CrossRef]
- Cantuti-Castelvetri, L.; Ojha, R.; Pedro, L.D.; Djannatian, M.; Franz, J.; Kuivanen, S.; van der Meer, F.; Kallio, K.; Kaya, T.; Anastasina, M.; et al. Neuropilin-1 Facilitates SARS-CoV-2 Cell Entry and Infectivity. Science 2020, 370, 856–860. [Google Scholar] [CrossRef]
- Daly, J.L.; Simonetti, B.; Klein, K.; Chen, K.-E.; Williamson, M.K.; Antón-Plágaro, C.; Shoemark, D.K.; Simón-Gracia, L.; Bauer, M.; Hollandi, R.; et al. Neuropilin-1 Is a Host Factor for SARS-CoV-2 Infection. Science 2020, 370, 861–865. [Google Scholar] [CrossRef]
- Li, Z.-L.; Buck, M. Neuropilin-1 Assists SARS-CoV-2 Infection by Stimulating the Separation of Spike Protein S1 and S2. Biophys J 2021, 120, 2828–2837. [Google Scholar] [CrossRef]
- Kummer, D.; Steinbacher, T.; Schwietzer, M.F.; Thölmann, S.; Ebnet, K. Tetraspanins: Integrating Cell Surface Receptors to Functional Microdomains in Homeostasis and Disease. Med Microbiol Immunol 2020, 209, 397–405. [Google Scholar] [CrossRef]
- Florin, L.; Lang, T. Tetraspanin Assemblies in Virus Infection. Front Immunol 2018, 9, 1140. [Google Scholar] [CrossRef] [PubMed]
- Hantak, M.P.; Qing, E.; Earnest, J.T.; Gallagher, T. Tetraspanins: Architects of Viral Entry and Exit Platforms. J Virol 2019, 93, e01429–17. [Google Scholar] [CrossRef] [PubMed]
- Le Naour, F.; André, M.; Boucheix, C.; Rubinstein, E. Membrane Microdomains and Proteomics: Lessons from Tetraspanin Microdomains and Comparison with Lipid Rafts. Proteomics 2006, 6, 6447–6454. [Google Scholar] [CrossRef]
- Rana, S.; Claas, C.; Kretz, C.C.; Nazarenko, I.; Zoeller, M. Activation-Induced Internalization Differs for the Tetraspanins CD9 and Tspan8: Impact on Tumor Cell Motility. Int J Biochem Cell Biol 2011, 43, 106–119. [Google Scholar] [CrossRef]
- Earnest, J.T.; Hantak, M.P.; Park, J.-E.; Gallagher, T. Coronavirus and Influenza Virus Proteolytic Priming Takes Place in Tetraspanin-Enriched Membrane Microdomains. J Virol 2015, 89, 6093–6104. [Google Scholar] [CrossRef]
- Earnest, J.T.; Hantak, M.P.; Li, K.; McCray, P.B.; Perlman, S.; Gallagher, T. The Tetraspanin CD9 Facilitates MERS-Coronavirus Entry by Scaffolding Host Cell Receptors and Proteases. PLoS Pathog 2017, 13, e1006546. [Google Scholar] [CrossRef]
- Hysenaj, L.; Little, S.; Kulhanek, K.; Magnen, M.; Bahl, K.; Gbenedio, O.M.; Prinz, M.; Rodriguez, L.; Andersen, C.; Rao, A.A.; et al. SARS-CoV-2 Infection of Airway Organoids Reveals Conserved Use of Tetraspanin-8 by Ancestral, Delta, and Omicron Variants. Stem Cell Reports 2023, 18, 636–653. [Google Scholar] [CrossRef]
- Scheffer, K.D.; Gawlitza, A.; Spoden, G.A.; Zhang, X.A.; Lambert, C.; Berditchevski, F.; Florin, L. Tetraspanin CD151 Mediates Papillomavirus Type 16 Endocytosis. J Virol 2013, 87, 3435–3446. [Google Scholar] [CrossRef]
- Zhu, Y.-Z.; Luo, Y.; Cao, M.-M.; Liu, Y.; Liu, X.-Q.; Wang, W.; Wu, D.-G.; Guan, M.; Xu, Q.-Q.; Ren, H.; et al. Significance of Palmitoylation of CD81 on Its Association with Tetraspanin-Enriched Microdomains and Mediating Hepatitis C Virus Cell Entry. Virology 2012, 429, 112–123. [Google Scholar] [CrossRef]
- Gordón-Alonso, M.; Yañez-Mó, M.; Barreiro, O.; Alvarez, S.; Muñoz-Fernández, M.A.; Valenzuela-Fernández, A.; Sánchez-Madrid, F. Tetraspanins CD9 and CD81 Modulate HIV-1-Induced Membrane Fusion. J Immunol 2006, 177, 5129–5137. [Google Scholar] [CrossRef]
- He, J.; Sun, E.; Bujny, M.V.; Kim, D.; Davidson, M.W.; Zhuang, X. Dual Function of CD81 in Influenza Virus Uncoating and Budding. PLoS Pathog 2013, 9, e1003701. [Google Scholar] [CrossRef] [PubMed]
- Concordet, J.-P.; Haeussler, M. CRISPOR: Intuitive Guide Selection for CRISPR/Cas9 Genome Editing Experiments and Screens. Nucleic Acids Res 2018, 46, W242–W245. [Google Scholar] [CrossRef] [PubMed]
- Wang, L.; Guzman, M.; Muñoz-Santos, D.; Honrubia, J.M.; Ripoll-Gomez, J.; Delgado, R.; Sola, I.; Enjuanes, L.; Zuñiga, S. Cell Type Dependent Stability and Virulence of a Recombinant SARS-CoV-2, and Engineering of a Propagation Deficient RNA Replicon to Analyze Virus RNA Synthesis. Front Cell Infect Microbiol 2023, 13, 1268227. [Google Scholar] [CrossRef] [PubMed]
- Saiz, M.L.; DeDiego, M.L.; López-García, D.; Corte-Iglesias, V.; Baragaño Raneros, A.; Astola, I.; Asensi, V.; López-Larrea, C.; Suarez-Alvarez, B. Epigenetic Targeting of the ACE2 and NRP1 Viral Receptors Limits SARS-CoV-2 Infectivity. Clin Epigenetics 2021, 13, 187. [Google Scholar] [CrossRef]
- Livak, K.J.; Schmittgen, T.D. Analysis of Relative Gene Expression Data Using Real-Time Quantitative PCR and the 2(-Delta Delta C(T)) Method. Methods 2001, 25, 402–408. [Google Scholar] [CrossRef]
- Leinung, N.; Mentrup, T.; Patel, M.; Gallagher, T.; Schröder, B. Dynamic Association of the Intramembrane Proteases SPPL2a/b and Their Substrates with Tetraspanin-Enriched Microdomains. iScience 2023, 26, 107819. [Google Scholar] [CrossRef]
- Bartosch, B.; Vitelli, A.; Granier, C.; Goujon, C.; Dubuisson, J.; Pascale, S.; Scarselli, E.; Cortese, R.; Nicosia, A.; Cosset, F.-L. Cell Entry of Hepatitis C Virus Requires a Set of Co-Receptors That Include the CD81 Tetraspanin and the SR-B1 Scavenger Receptor. Journal of Biological Chemistry 2003, 278, 41624–41630. [Google Scholar] [CrossRef]
- Hoffmann, M.; Kleine-Weber, H.; Schroeder, S.; Krüger, N.; Herrler, T.; Erichsen, S.; Schiergens, T.S.; Herrler, G.; Wu, N.-H.; Nitsche, A.; et al. SARS-CoV-2 Cell Entry Depends on ACE2 and TMPRSS2 and Is Blocked by a Clinically Proven Protease Inhibitor. Cell 2020, 181, 271–280.e8. [Google Scholar] [CrossRef]
- André, M.; Le Caer, J.-P.; Greco, C.; Planchon, S.; El Nemer, W.; Boucheix, C.; Rubinstein, E.; Chamot-Rooke, J.; Le Naour, F. Proteomic Analysis of the Tetraspanin Web Using LC-ESI-MS/MS and MALDI-FTICR-MS. Proteomics 2006, 6, 1437–1449. [Google Scholar] [CrossRef]
- Salzer, U.; Prohaska, R. Stomatin, Flotillin-1, and Flotillin-2 Are Major Integral Proteins of Erythrocyte Lipid Rafts. Blood 2001, 97, 1141–1143. [Google Scholar] [CrossRef]
- Slaughter, N.; Laux, I.; Tu, X.; Whitelegge, J.; Zhu, X.; Effros, R.; Bickel, P.; Nel, A. The Flotillins Are Integral Membrane Proteins in Lipid Rafts That Contain TCR-Associated Signaling Components: Implications for T-Cell Activation. Clin Immunol 2003, 108, 138–151. [Google Scholar] [CrossRef] [PubMed]
- Barreiro, O.; Yáñez-Mó, M.; Sala-Valdés, M.; Gutiérrez-López, M.D.; Ovalle, S.; Higginbottom, A.; Monk, P.N.; Cabañas, C.; Sánchez-Madrid, F. Endothelial Tetraspanin Microdomains Regulate Leukocyte Firm Adhesion during Extravasation. Blood 2005, 105, 2852–2861. [Google Scholar] [CrossRef] [PubMed]
- Charrin, S.; Jouannet, S.; Boucheix, C.; Rubinstein, E. Tetraspanins at a Glance. J Cell Sci 2014, 127, 3641–3648. [Google Scholar] [CrossRef]
- Hoffmann, M.; Kleine-Weber, H.; Schroeder, S.; Krüger, N.; Herrler, T.; Erichsen, S.; Schiergens, T.S.; Herrler, G.; Wu, N.-H.; Nitsche, A.; et al. SARS-CoV-2 Cell Entry Depends on ACE2 and TMPRSS2 and Is Blocked by a Clinically Proven Protease Inhibitor. Cell 2020, 181, 271–280.e8. [Google Scholar] [CrossRef]
- Heurich, A.; Hofmann-Winkler, H.; Gierer, S.; Liepold, T.; Jahn, O.; Pöhlmann, S. TMPRSS2 and ADAM17 Cleave ACE2 Differentially and Only Proteolysis by TMPRSS2 Augments Entry Driven by the Severe Acute Respiratory Syndrome Coronavirus Spike Protein. J Virol 2014, 88, 1293–1307. [Google Scholar] [CrossRef]
- Liu, J.; Zhu, G.; Jia, N.; Wang, W.; Wang, Y.; Yin, M.; Jiang, X.; Huang, Y.; Zhang, J. CD9 Regulates Keratinocyte Migration by Negatively Modulating the Sheddase Activity of ADAM17. Int J Biol Sci 2019, 15, 493–506. [Google Scholar] [CrossRef]
- Gutiérrez-López, M.D.; Gilsanz, A.; Yáñez-Mó, M.; Ovalle, S.; Lafuente, E.M.; Domínguez, C.; Monk, P.N.; González-Alvaro, I.; Sánchez-Madrid, F.; Cabañas, C. The Sheddase Activity of ADAM17/TACE Is Regulated by the Tetraspanin CD9. Cell Mol Life Sci 2011, 68, 3275–3292. [Google Scholar] [CrossRef]
- Yáñez-Mó, M.; Gutiérrez-López, M.D.; Cabañas, C. Functional Interplay between Tetraspanins and Proteases. Cell Mol Life Sci 2011, 68, 3323–3335. [Google Scholar] [CrossRef]
- Rouaud, F.; Méan, I.; Citi, S. The ACE2 Receptor for Coronavirus Entry Is Localized at Apical Cell-Cell Junctions of Epithelial Cells. Cells 2022, 11, 627. [Google Scholar] [CrossRef]
- Söderberg, O.; Gullberg, M.; Jarvius, M.; Ridderstråle, K.; Leuchowius, K.-J.; Jarvius, J.; Wester, K.; Hydbring, P.; Bahram, F.; Larsson, L.-G.; et al. Direct Observation of Individual Endogenous Protein Complexes in Situ by Proximity Ligation. Nat Methods 2006, 3, 995–1000. [Google Scholar] [CrossRef]
Figure 1.
The protein CD9 factilitates SARS-CoV-2 infection. SW480 and A549 WT and CD9 KO cells, previously generated, were used. (A) Cellular extracts from SW480 and A549 WT and CD9 KO cells were obtained and Western blots with antibodies specific for CD9 and actin, as control, were performed. (B) The expression of CD9 was analyzed by flow cytometry in WT and CD9 KO cells, using an anti-CD9 antibody. (C) The expression of CD9 was analyzed by immunodetection followed by fluorescence microscopy. To this end, A549 WT and CD9 KO cells were fixed and permeabilized and the cells were stained with an anti-CD9 antibody (in red). DAPI was used for nuclear staining (in blue). Representative images are included. (D) SW480 and A549 -ACE-2 WT and CD9 KO cells were infected with SARS-CoV-2, and supernatants were collected at 24, 48, and 72 hours post-infection (hpi). Viral titers were determined by a lysis plaque assay on Vero E6 cells. (E) SW480 and A549 WT cells were treated either with an antibody blocking CD9 protein, or with an isotype control antibody. Then, the cells were SARS-CoV-2-infected and viral titers at 24 hpi were determined by a lysis plaque assay on Vero E6 cells. (D and E) Error bars represent standard deviations (SD) of results of measurements performed in triplicate wells.
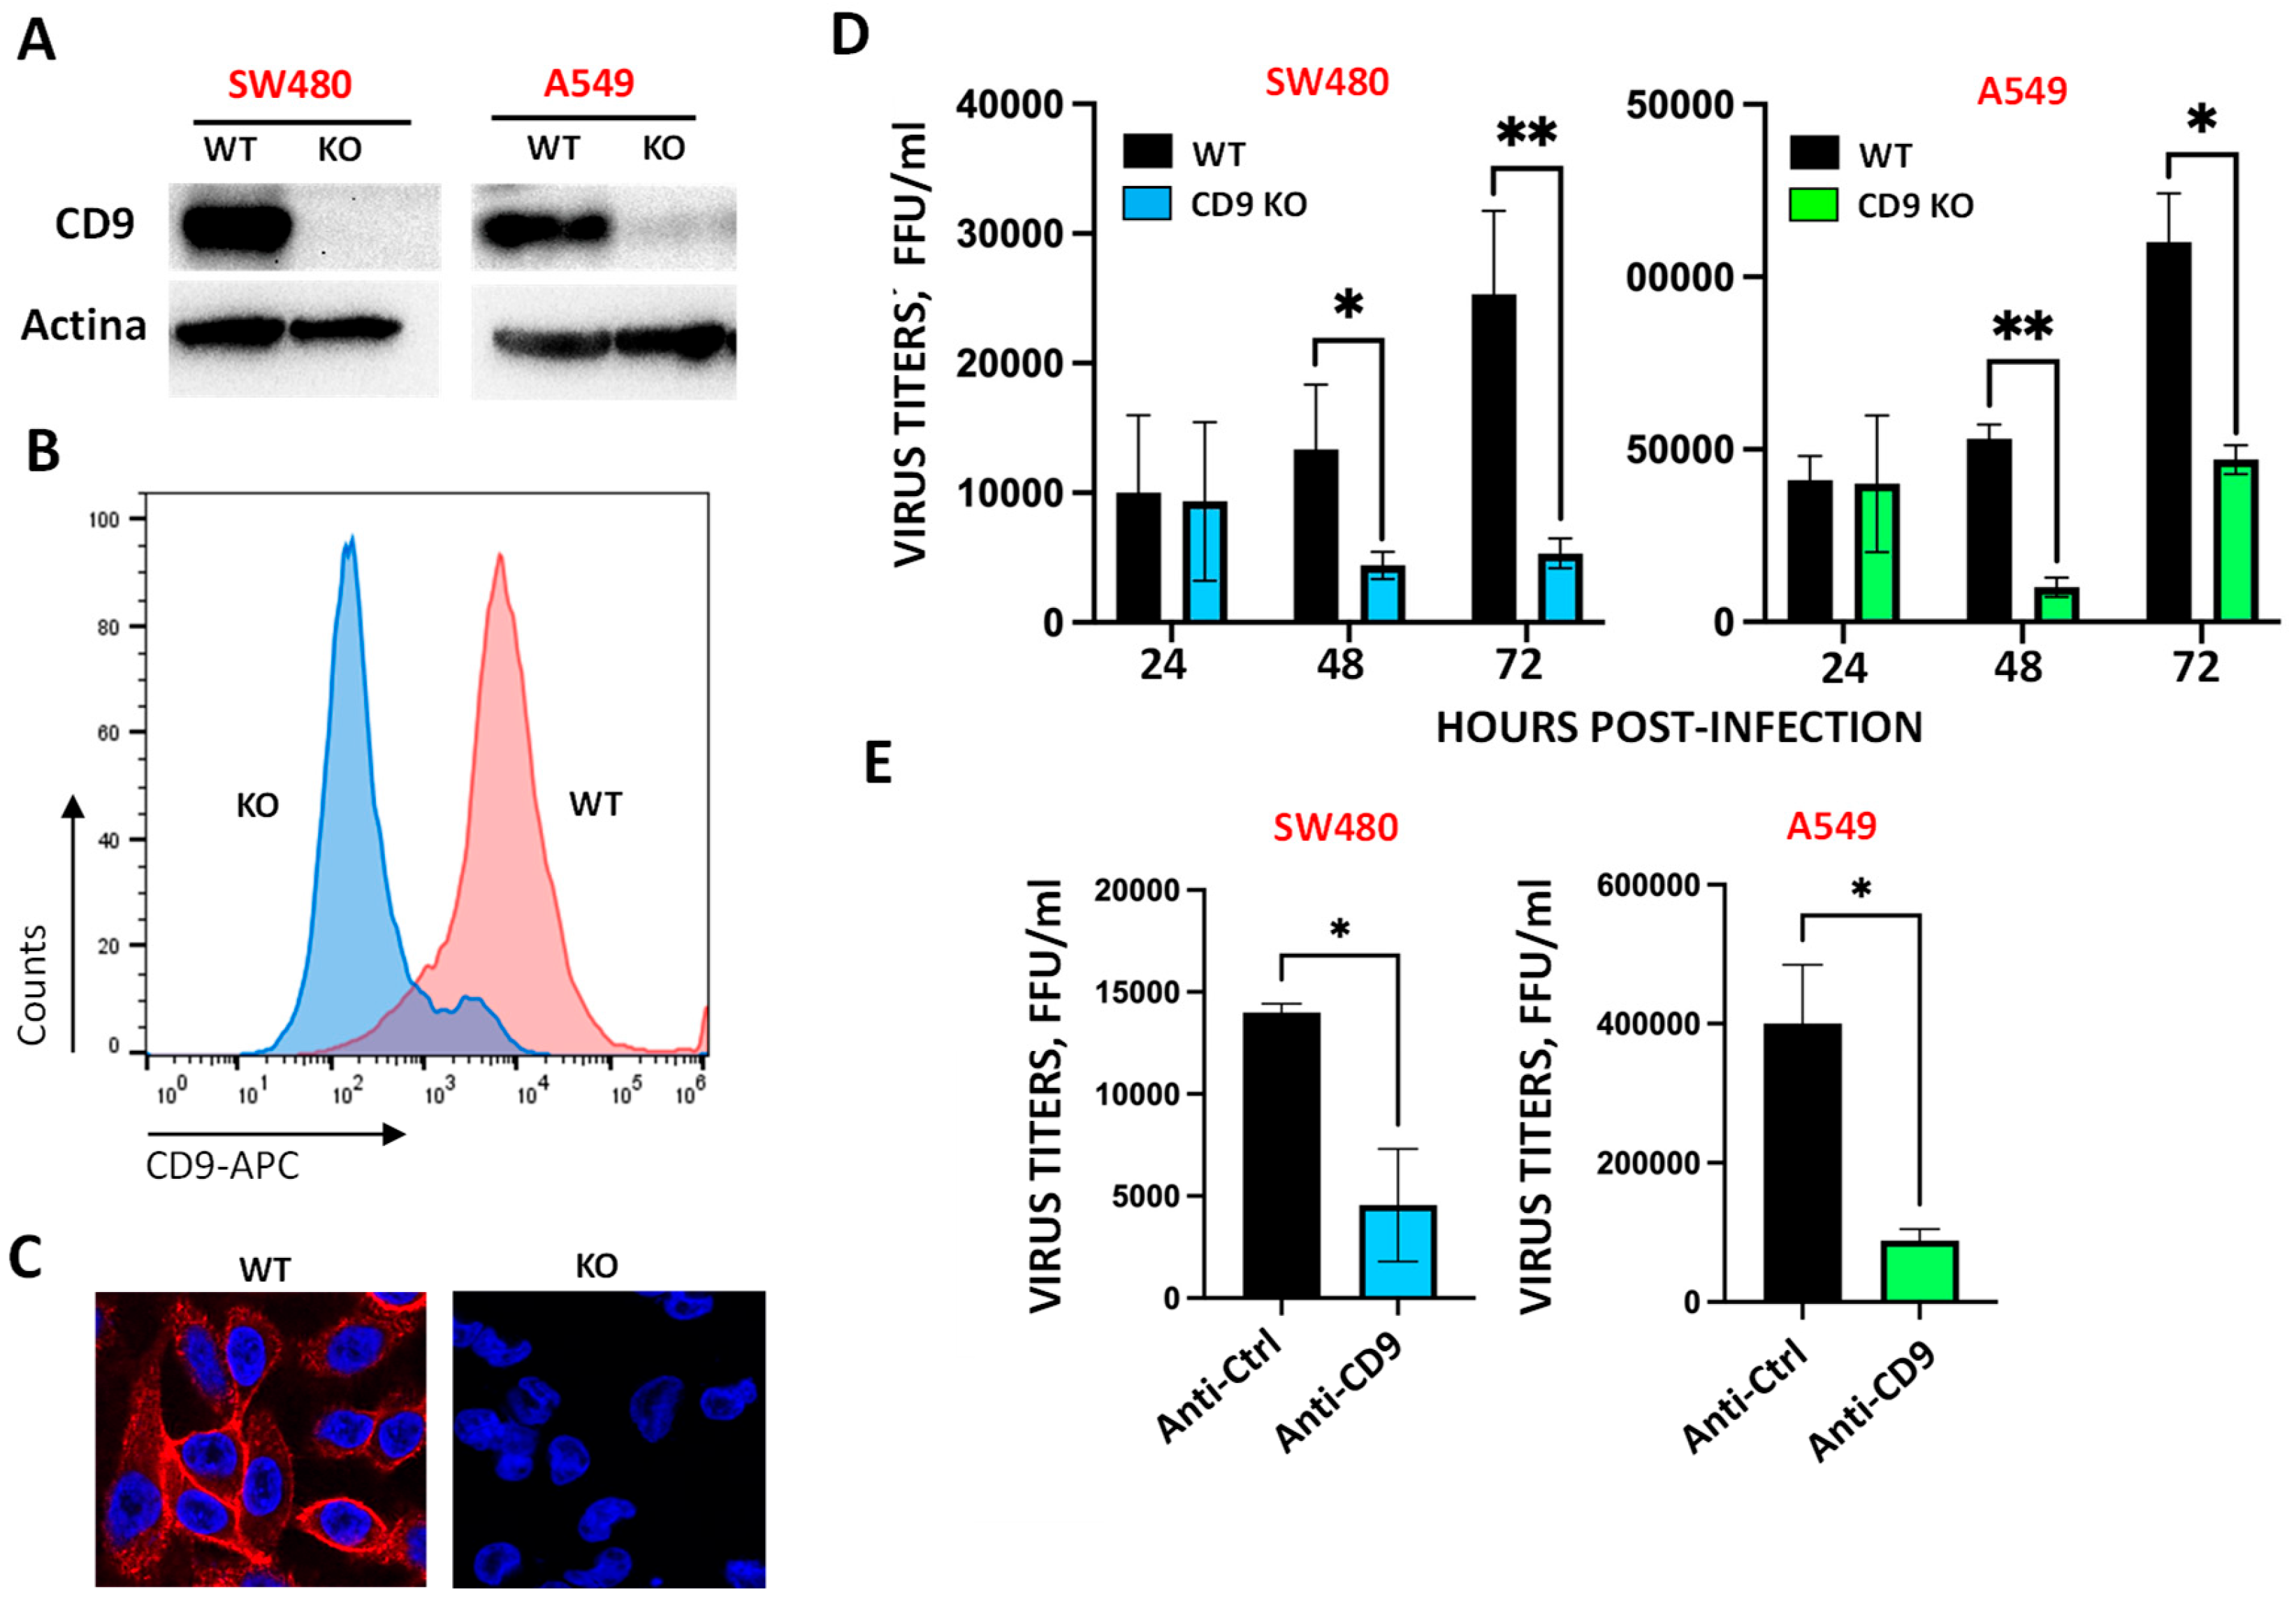
Figure 2.
CD9 expression affects NRP1 expression levels. SW480 WT and CD9 KO cells were left mock-infected or infected during 24, 48, and 72 hpi. (A) Protein extracts were obtained and the levels of NRP1, ACE2, furin, TMPRSS2, and actin, as control, were analyzed by Western blot using specific antibodies. Molecular weights (in kilodaltons) are indicated on the right. Western blots were quantified by densitometry using ImageJ software, and normalized to the levels of actin in each sample (graphs on the right). (B) Total RNAs from mock-infected or SARS-CoV-2-infected cells were purified and the expression level of ACE2, NRP1, furin, and TMPRSS2 mRNAs was quantified by retrotranscriptase (RT) reaction followed by qPCR, and quantified to the levels of actin mRNA. Error bars represent standard deviations (SD) of results of measurements performed in triplicate wells.
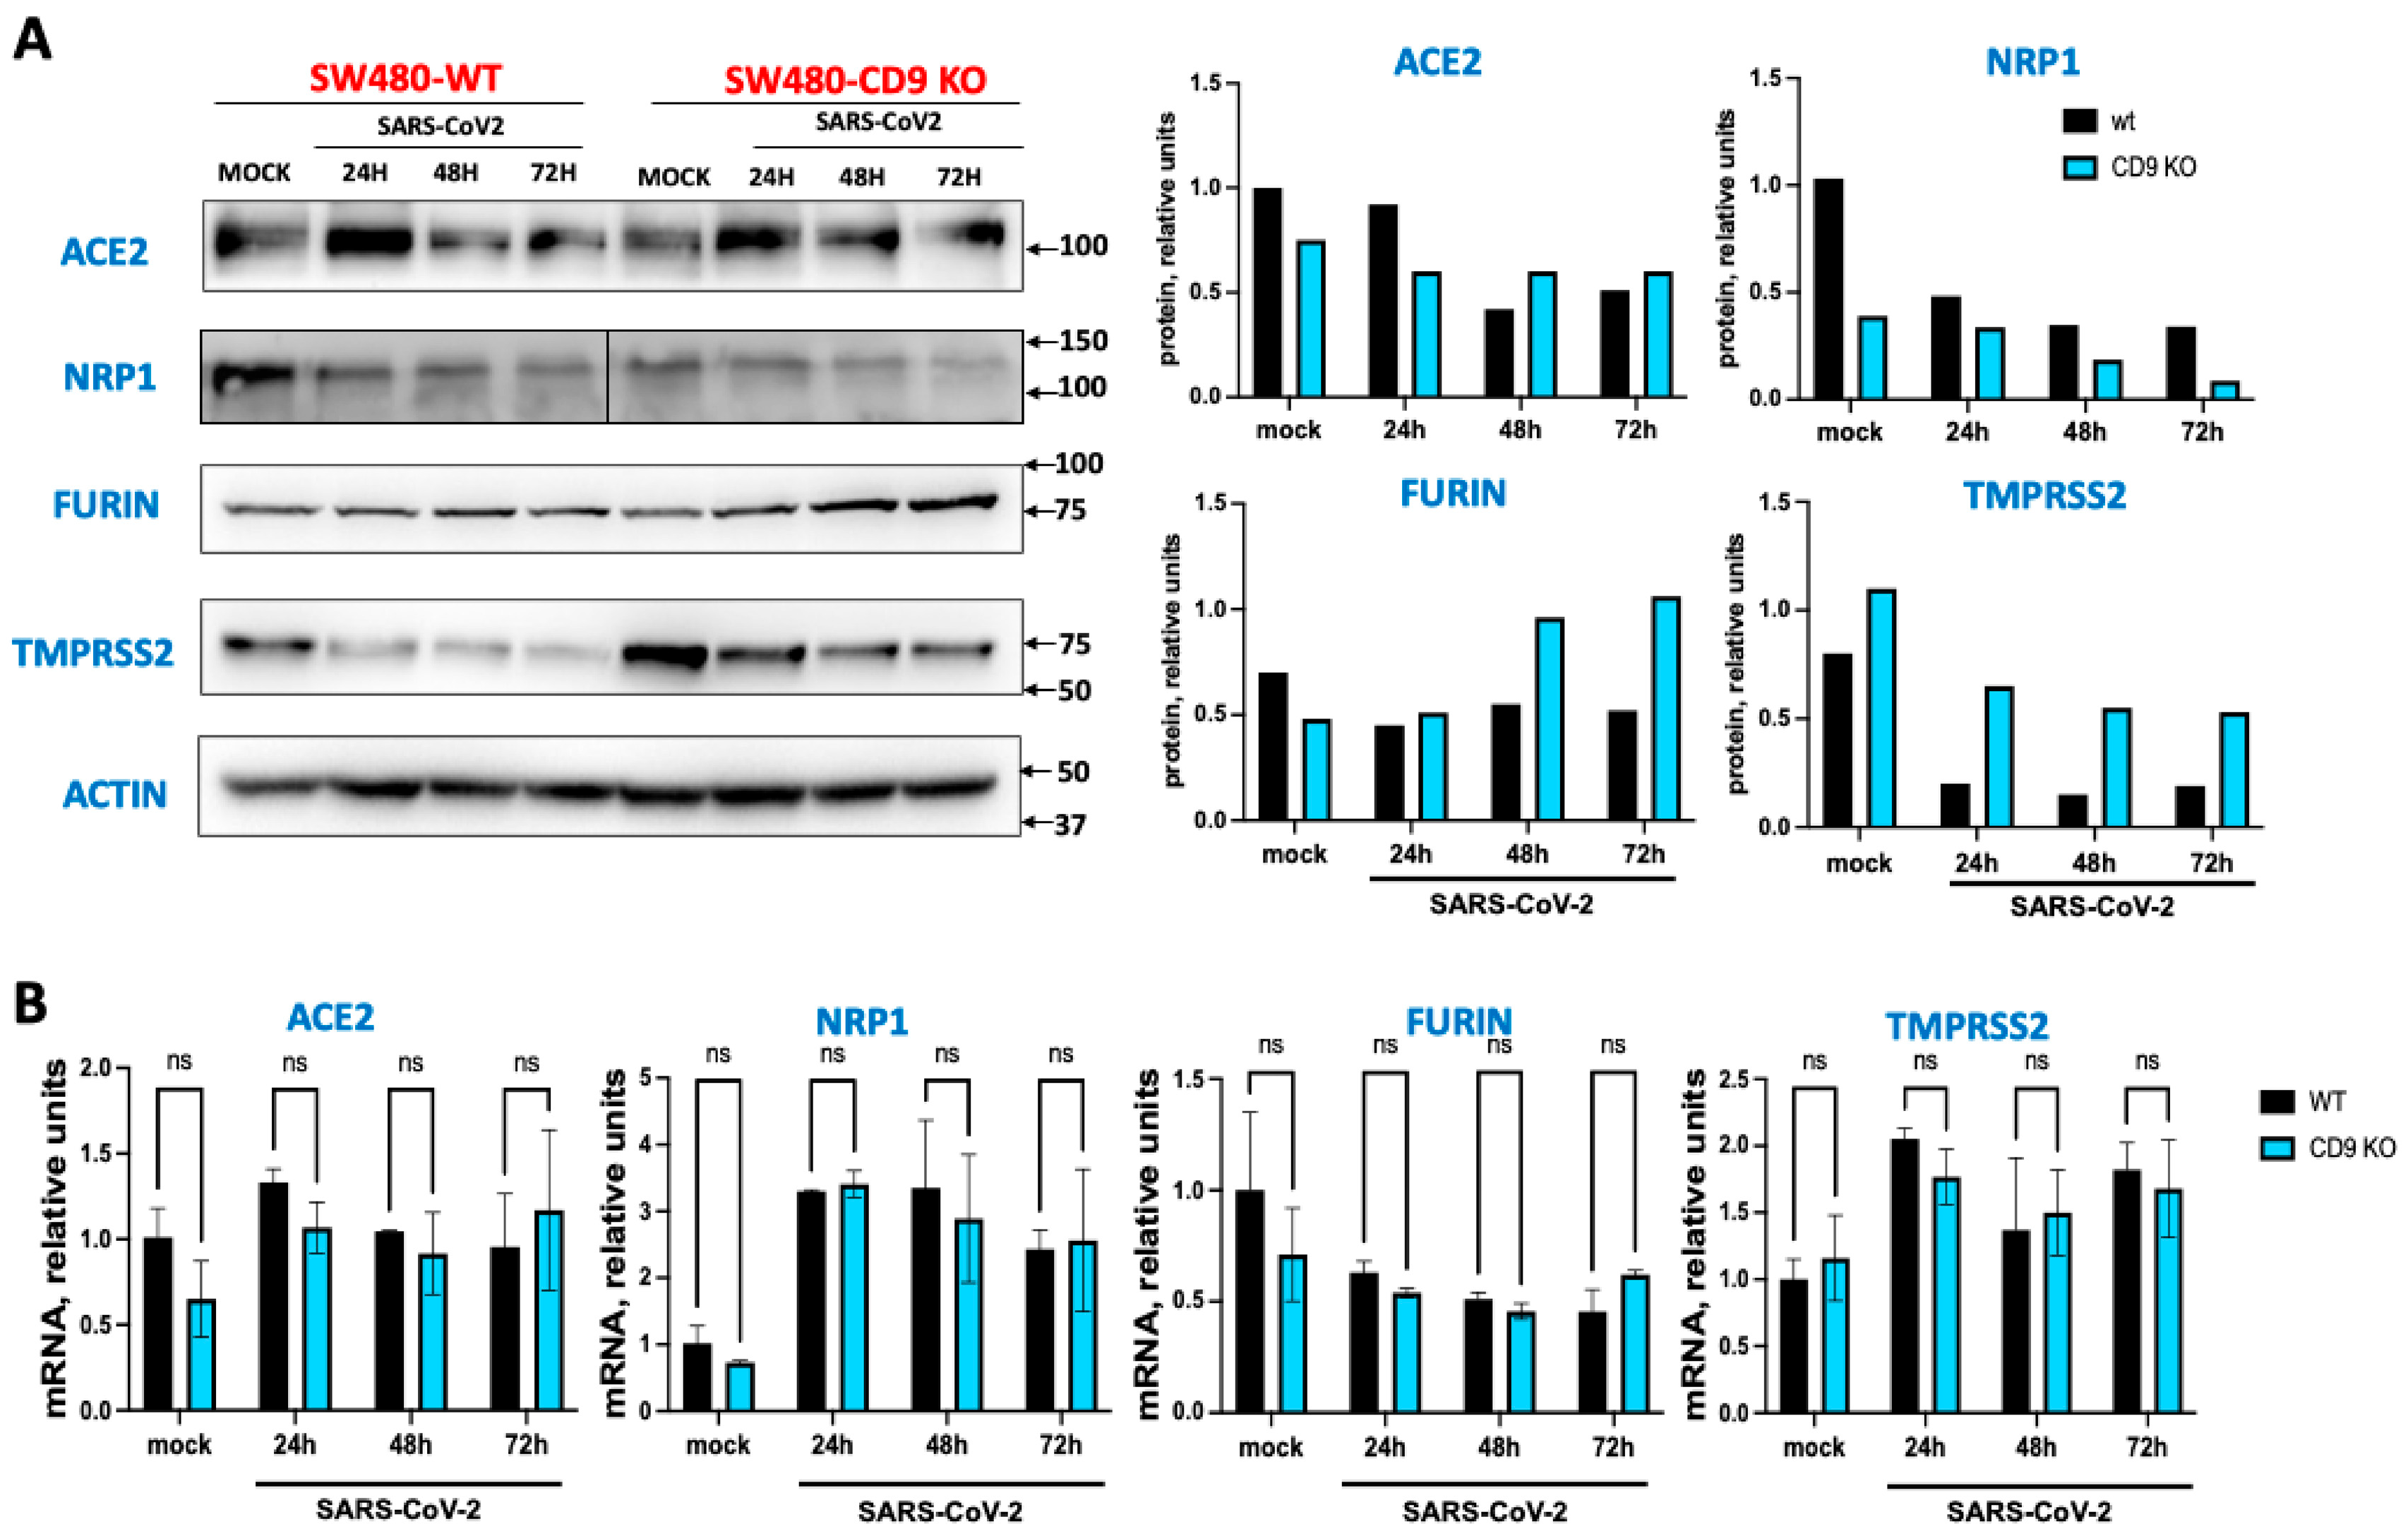
Figure 3.
NRP1 factilitates SARS-CoV-2 infection. Cells were silenced with an siRNA specific for NRP1 or with a non-targeted (NT) siRNA, as control. (A) Silencing efficiency was confirmed by Western blot in mock-infected, and SARS-CoV-2 infected cells after 24, 48 and 72 hours post-infection, using an antibody specific for NRP1, and an antibody specific for actin, as control. (B) Human A549 cells were transfected with a non-targeted (NT) or an NRP1-specific siRNA. At 24 h post-transfection, the cells were infected with SARS-CoV-2. Cell culture supernatants were collected at 24, 48, and 72 hpi and titrated by a lysis plaque assay on Vero E6 cells.
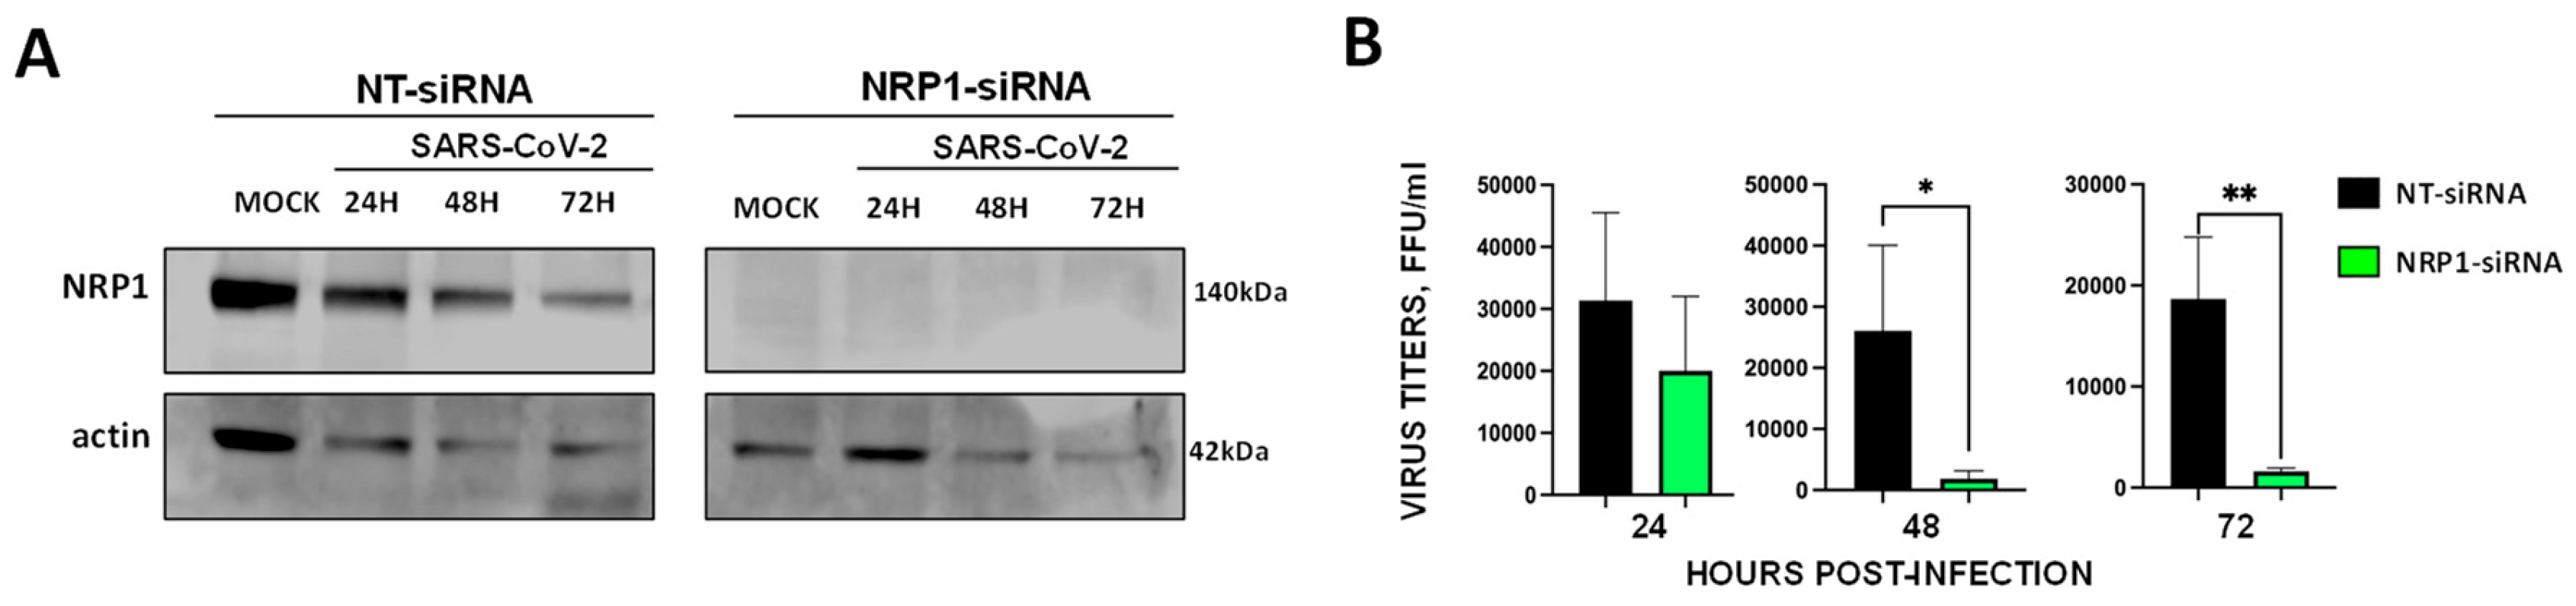
Figure 4.
CD9 localizes to the same transmembrane domains as ACE2, NRP1, furin and TMPRSS2, and increases the expression levels of these proteins. To analyze whether CD9, ACE-2, NRP1, and the proteases are located to the same membrane microdomains, a fractionation experiment using the Brij98 detergent was performed. Lysates from SW480 WT and CD9 KO cells were layered beneath a discontinuous sucrose step gradient, from which 12 fractions were collected from top to bottom after overnight ultracentrifugation. (A) Western blot analysis, using antibodies specific for ACE-2, NRP1, furin, TMPRSS2, CD9, and flotillin, as control were performed using fractions containing the same amount of protein. The molecular weights are indicated on the right (in kilodaltons). The fraction numbers are indicated at the top. (B) The fraction 3 of the Western blots, showing the highest protein amounts, were quantified by densitometry using ImageJ software. The amounts of ACE2, NRP1, furin, TMPRSS2, and CD9 were normalised by the amount of flotillin in fraction 3 in WT and CD9 KO cells. Three experiments were performed showing similar results, representative blots from the three experiments are shown.
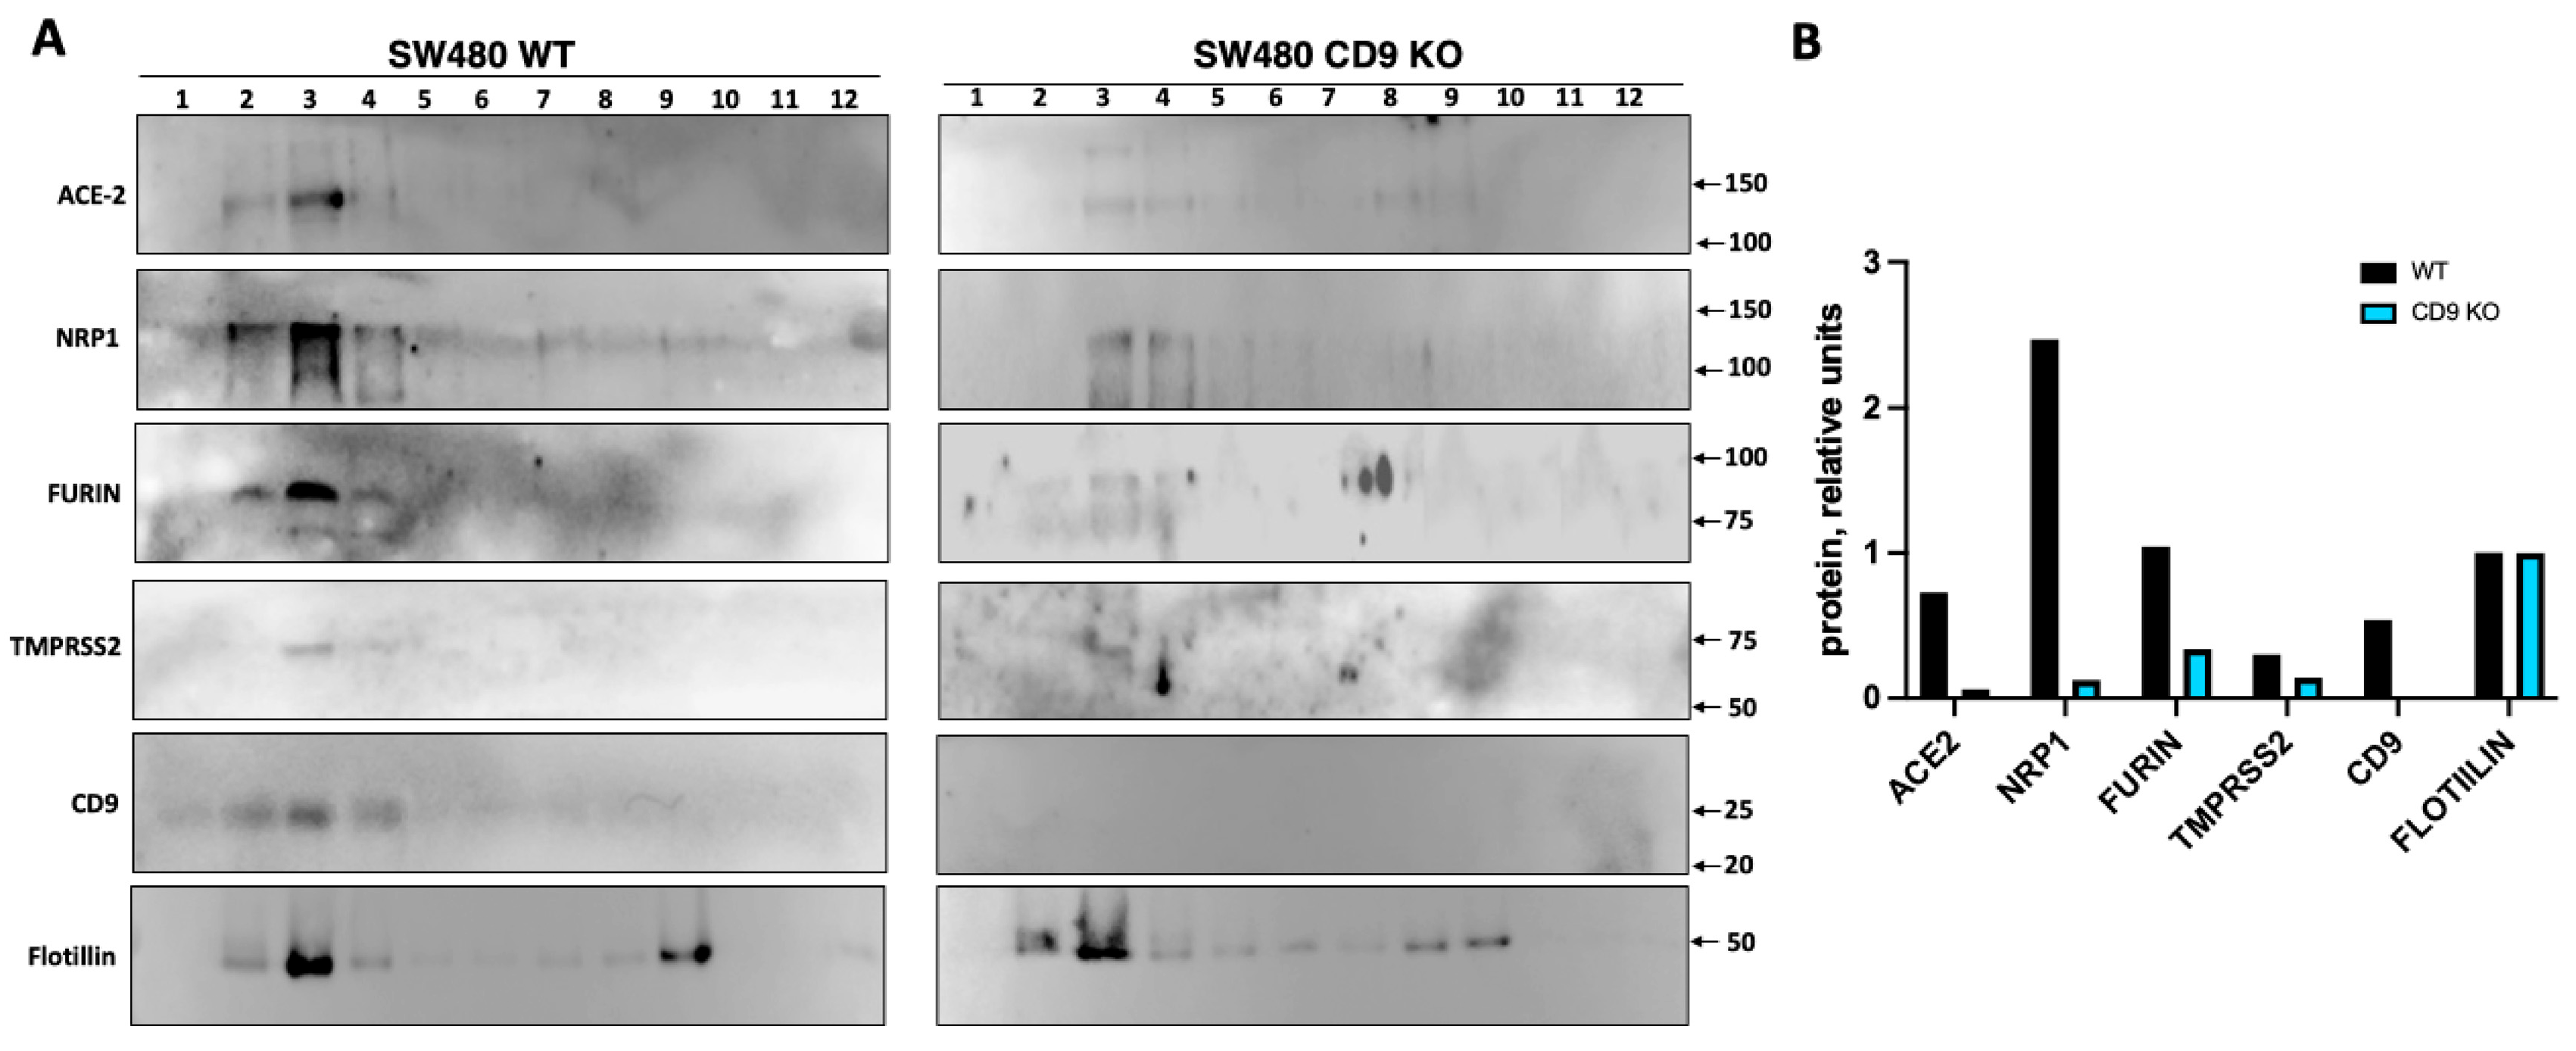
Figure 5.
CD9 partially colocalizes with furin, TMPRSS2, NRP1, and ACE2. SW480-WT cells were fixed, permeabilized and stained with antibodies specific for CD9, together with antibodies specific for ACE-2, NRP1, TMPRSS2, furin, and flotillin, as control. CD9 is shown in red, ACE2, NRP1, furin, TMPRSS2, and flotillin are shown in green, and nuclei were stained with DAPI and shown in blue. Areas of co-localization of both proteins appear in yellow in the third picture and in white in the fourth picture.
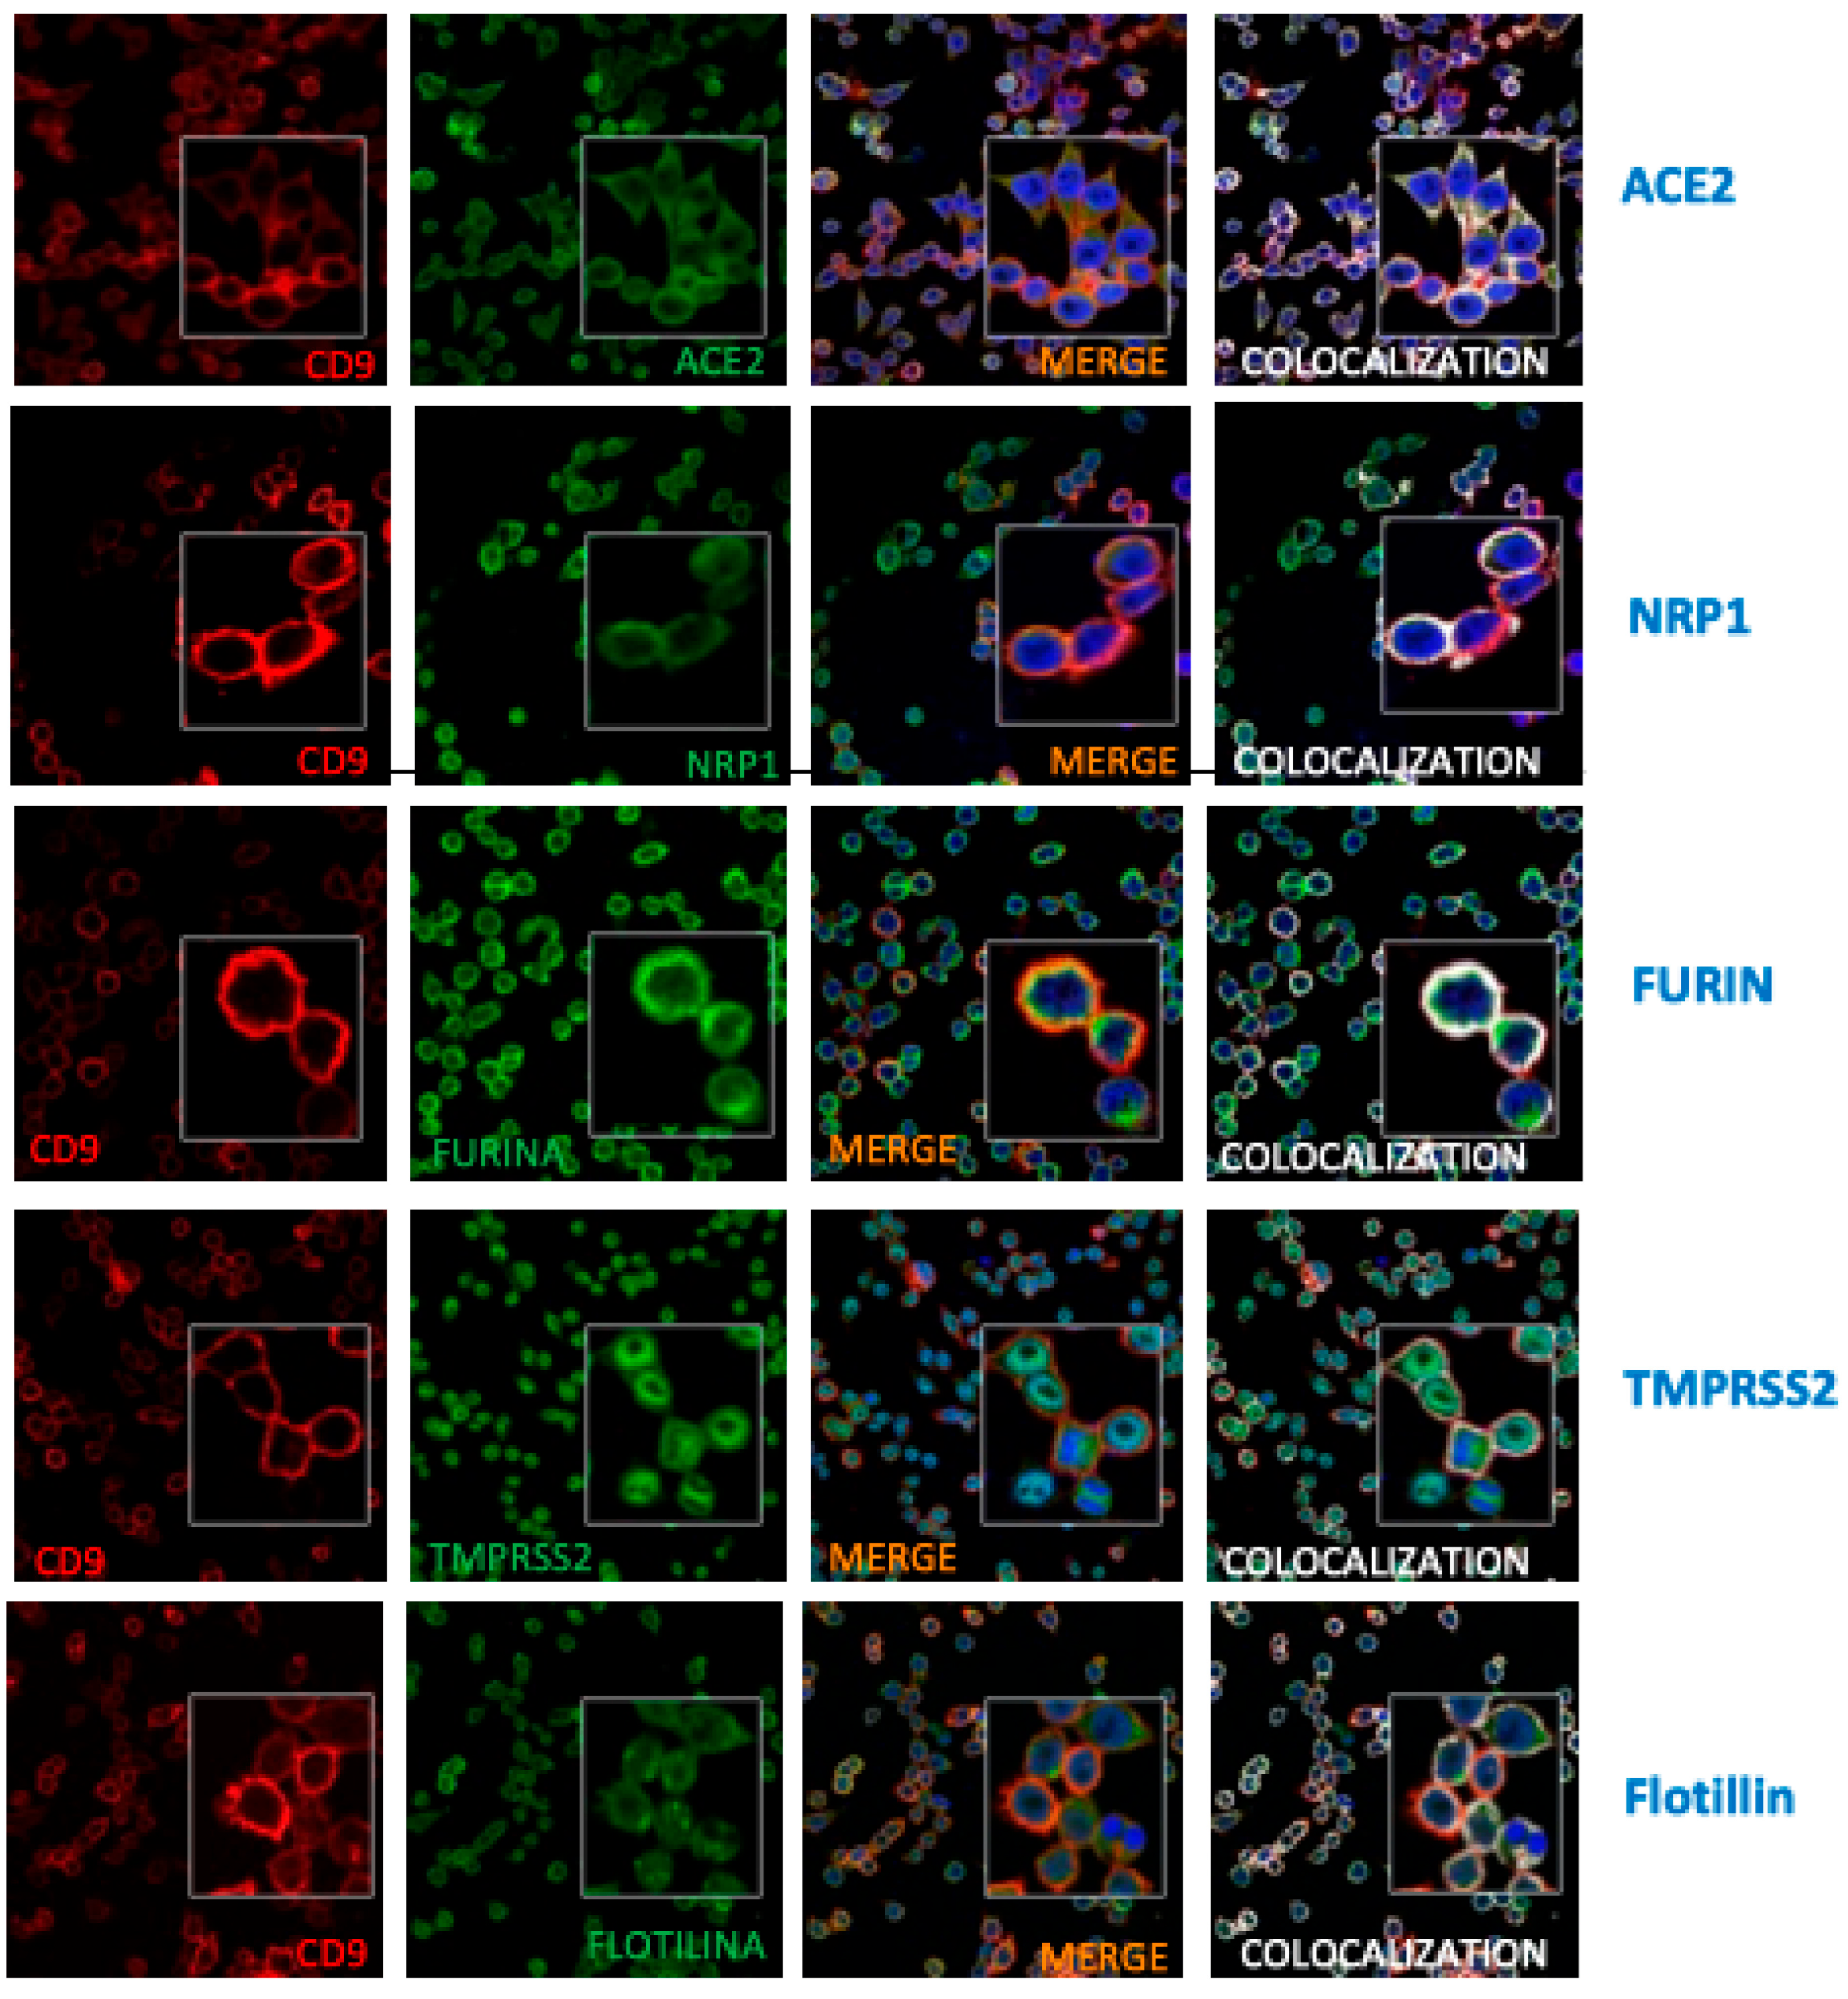
Figure 6.
CD9 is in close proximity to NRP1 and furin. (A) Schematic representation of the proximity ligation assay (PLA) technique (DuoLink). PLA detects protein-protein interactions when two target proteins are within less than 40 nm of each other. Primary antibodies bind to each target protein, and species-specific secondary antibodies are conjugated to unique oligonucleotides. If the proteins are in close proximity, the oligonucleotides are ligated and amplified via rolling circle amplification, generating a fluorescent signal (visualized as red dots). (B) Representative images and quantification of PLA signals between CD9 and ICAM-1 in wild-type (WT) and CD9 knockout (CD9 KO) SW480 (left) and A549-ACE2 (right) cells. (C-D) Representative PLA images showing interactions between CD9 and candidate SARS-CoV-2 entry factors (NRP1, ACE2, Furin, and TMPRSS2) in WT SW480 (C) and A549-ACE2 (D) cells. Nuclei are stained with DAPI (blue). Quantification of average PLA signals per cell is shown on the right of the images. Loss of PLA signal in CD9 KO cells confirms the specificity of the CD9 interactions (see Suplementary Figure 3). For all images, the quantification of the average PLA signal per cell is shown to the right. For each condition, 10 images were acquired at 40× magnification, with each image containing between 80 and 120 cells.
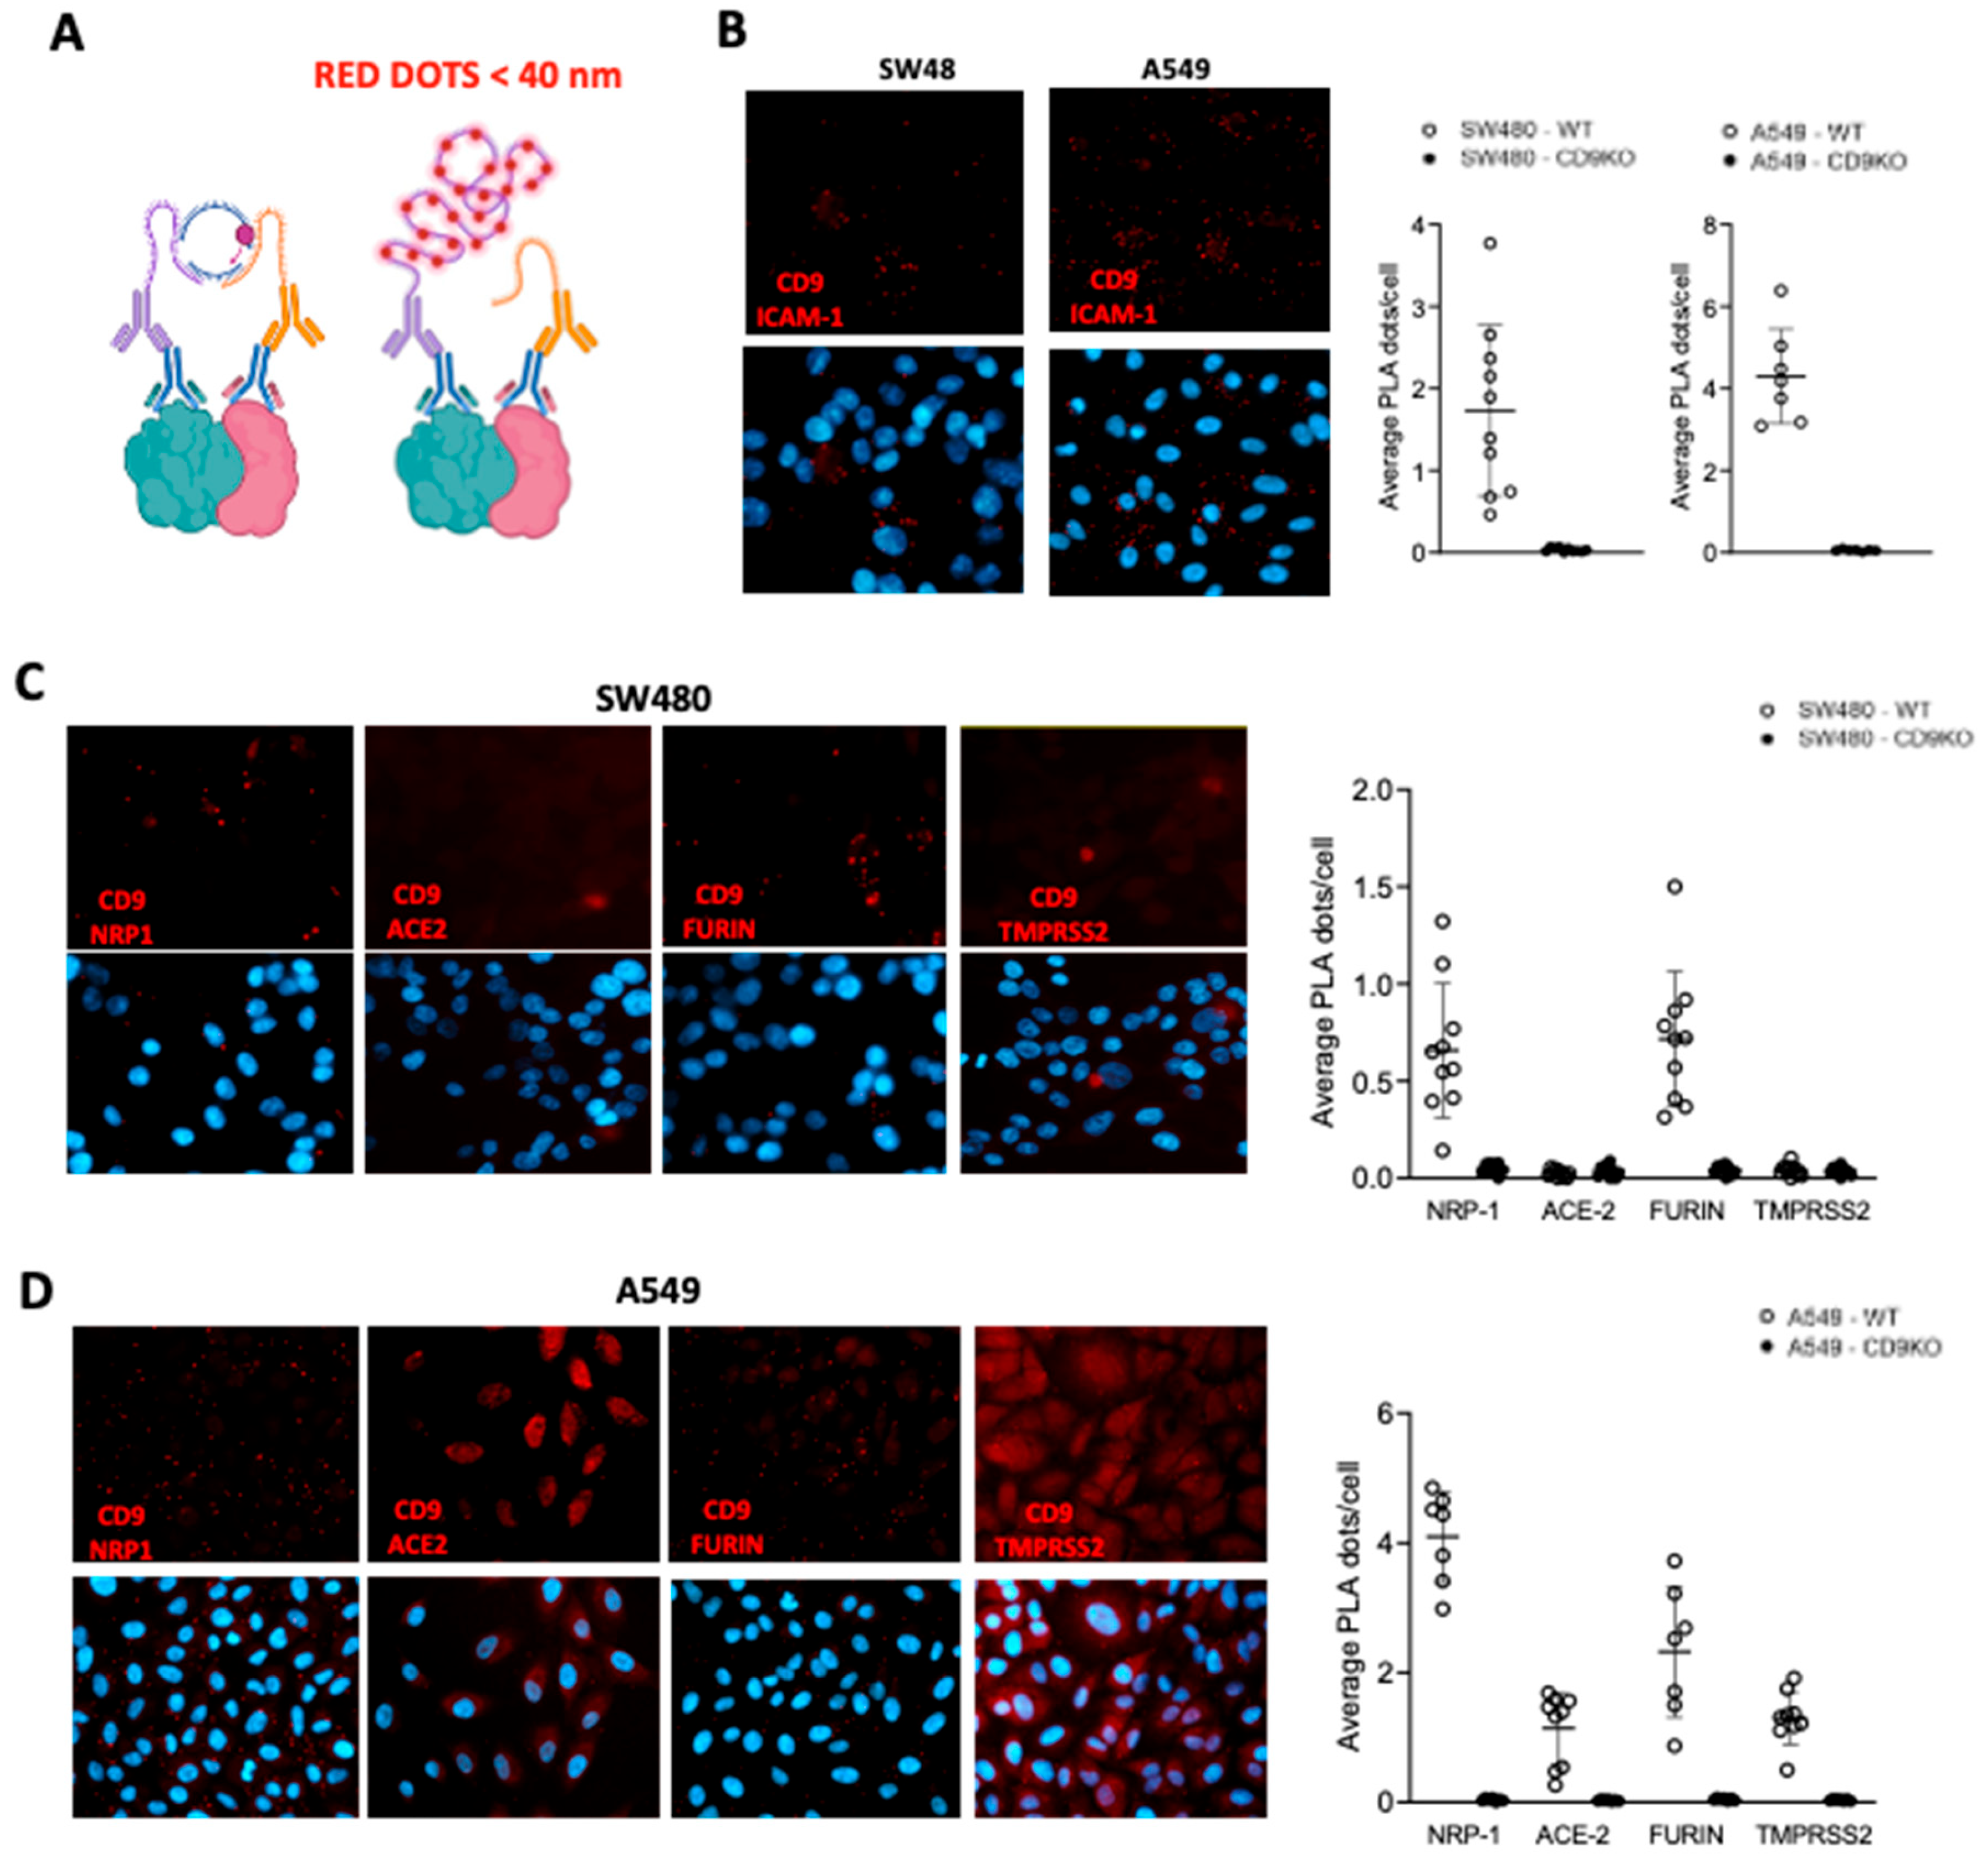
Figure 7.
CD9 binds ACE2. (A,B) Human 293T cells were transiently co-transfected with a pCAGGS plasmid encoding CD9, or with an empty plasmid. Alternatively, A549-ACE2 WT and CD9 KO cells were used. (A) The expression of CD9 and ACE2 was analyzed by Western blot in the cellular extracts. Molecular weights (in kilodaltons) are indicated on the right. (B) Cellular lysates were used for co-immunoprecipitation assays using an anti-CD9 antibody and dynabeads-conjugated protein G to pull down CD9. After the immunoprecipitation, CD9 and ACE2 were detected by Western blotting using antibodies specific for CD9 and ACE2. Molecular weight markers (in kilodaltons) are indicated on the right. The upper band in the CD9 blot in B corresponds to the light chain of the antibody used for the co-IP.
Disclaimer/Publisher’s Note: The statements, opinions and data contained in all publications are solely those of the individual author(s) and contributor(s) and not of MDPI and/or the editor(s). MDPI and/or the editor(s) disclaim responsibility for any injury to people or property resulting from any ideas, methods, instructions or products referred to in the content. |
© 2025 by the authors. Licensee MDPI, Basel, Switzerland. This article is an open access article distributed under the terms and conditions of the Creative Commons Attribution (CC BY) license (http://creativecommons.org/licenses/by/4.0/).
Copyright: This open access article is published under a Creative Commons CC BY 4.0 license, which permit the free download, distribution, and reuse, provided that the author and preprint are cited in any reuse.


