

Submitted:
21 July 2025
Posted:
22 July 2025
You are already at the latest version
Abstract
Global climate change calls for deep structural changes in both energy production and consumption. The issue of climate change affects multiple sectors, particularly ob-served in energy, industry, transport, and residential buildings. Greenhouse gases re-main a key driver of global warming. This report examines Bulgaria’s electricity mix and explores pathways for its emission factor mitigation. An approach for nuclear technologies relevance assessment is applied in order to be evaluated an optimal elec-tricity mix and percentage share of low-emission alternative technologies for electrici-ty production. To assess the applicability of different types of technologies is used the I = PAT equation, where variables are emissions (I), population (P), electricity consump-tion per capita (A) and grid emission factor (T). Scenarios model a gradual phaseout of fossil fuel based electricity generation, compensated by increases in renewable and nuclear capacity renewable and nuclear capacity. The lowest grid emission factor is observed in the scenario with the highest percentage share of nuclear power in the mix, in which 70% of the electricity is produced by nuclear plants and the rest is pro-duced by renewable energy sources. In this scenario, the emission factor decreases to 0,01 tCO2-eq/MWh compared to 0,622 tCO2-eq/MWh in scenario, which considers the production mix in the country for the period 2010-2022. The scenario in which the produced electricity is entirely from renewables, shows a higher value for the emission factor of the grid compared to the scenarios with the inclusion of NPP in the genera-tion mix, but with the exclusion of fossil fuel-fired power plants.
Keywords:
IPAT
; nuclear energy
; sustainability
; Bulgaria’s energy mix
; GHG emissions
1. Introduction
Increases in average temperatures in the Earth’s atmosphere and ocean waters are associated with global warming, which is driven by greenhouse gas emissions, changes in solar radiation, volcanic activity, and changes in Earth’s orbital dynamics [1]. A significant amount of greenhouse gases are naturally found in the Earth’s atmosphere, but human activity contributes to a significant increase in their concentration [2]. As a result, the greenhouse effect has intensified, leading to climatic anomalies such as changes in snowfall and rain patterns, rising average temperatures and extreme weather events including droughts and floods [3]. Emissions are largely generated by the combustion of fossil fuels, various industrial processes (e.g., cement and fertilizer production), agriculture, residential buildings, and the transportation sector. All these activities contribute to the concentration of naturally occurring greenhouse gases in the Earth’s atmosphere.
Each greenhouse gas contributes differently to the overall greenhouse effect. Since their warming potentials vary, their impact is assessed by equating them to the effect of carbon dioxide (CO₂-eq). Carbon dioxide accounts for nearly 80% of the total effect of emissions, while methane contributes approximately 12%. Fluorinated gases collectively account for about 2.5%, although they capture solar energy much more effectively than CO₂ [4,5]. These gases are widely used in air-conditioning systems and often serve as substitutes for ozone-depleting substances, since they do not damage the ozone layer in the atmosphere.
Two key characteristics determine the impact of different greenhouse gases on the climate: the length of time they remain in the atmosphere and their ability to absorb energy. Methane remains in the atmosphere for a shorter time than CO2, but it absorbs more solar energy and is a dangerous air pollutant [6]. To slow and mitigate the consequences of climate change, it is essential to address its root causes. The current focus is on carbon emissions, which are the primary driver of global warming. Coal-fired power plants are classified among the largest air polluters. However, carbon dioxide is also generated through natural biological processes such as animal and human respiration, the decomposition of biomass, and the combustion of fossil fuels in general—including coal, natural gas, and oil. Therefore, the transport sector is also responsible for a significant part of the emissions [7].
In its efforts to deal with greenhouse gas emissions, the European Union has introduced several measures, such as limiting emissions from transportation, promoting energy efficiency and renewable energy investments, preventing carbon leakage by discouraging the relocation of high-emission industries outside the EU, developing the EU Emissions Trading System, expanding forested areas and other green spaces that absorb carbon, revising regulations on fluorinated greenhouse gases and ozone-depleting substances, and adopting a strategy to reduce methane emissions. The main climate goal is to limit global temperature rise to below 2°C above pre-industrial levels, with the intention of keeping the increase below 1.5°C, as a 2°C rise carries considerable risks to both human health and the environment [8]. In 2021, the European Parliament adopted the Climate Law, establishing a legally enforceable objective to reduce EU greenhouse gas emissions by at least 55% by 2030 compared to 1990 levels and to achieve climate neutrality by 2050 [9]. The electricity sector is facing the challenge of meeting the growing demand for electricity while reducing its carbon footprint on the environment [10,11]. This article is focused on Bulgaria, aiming to assess the current impact of energy sources on the national carbon footprint and to model potential scenarios for its mitigation through 2050.
In 2021, Bulgaria’s greenhouse gas emissions totaled 53,917,270 tCO2-eq, without taking into account reports of sequestration from the Land Use, Land-Use Change, and Forestry (LULUCF) sector. The net emissions, including the reporting of sequestration from LULUCF sector, were 44,773,180 tCO2-eq [12]. Carbon dioxide accounts for the largest share of total greenhouse gas emissions in the country like its share accounts approximately 78.42% (excluding LULUCF) and 73.01% (including LULUCF). In absolute terms, GHG emissions have decreased by 54.08% since 1988, mainly due to the economics restructuring, as well as the increase of the energy efficiency and cleaning technologies’ advance.
The main contributor to the national GHG emissions is the energy sector with 75 % share in 2021 and the trend of different gaseous molecules emitted in the atmosphere during the investigated period is shown in Figure 1. The agricultural sector is responsible for 11.3% of the Bulgarian GHG for 2021, followed by the Industrial Processes and Product Use (IPPU) with 8.4%, and the waste sector with 5.3% [13].
As illustrated in Figure 2, the main source of emissions in the energy sector is the combustion of solid fuels, which accounts for 52.1% of the emissions from fuel combustion in 2021, followed by liquid fuels with 32.1% and gaseous fuels with 14%. The energy industry (including electricity generation, petroleum refineries, and solid fuel production) is responsible for 57.2% of emissions from fuel combustion, followed by the transport sector with 25.7% and manufacturing industries and construction with 11.8%. Public electricity and heat production alone accounts for 39.7% of total GHG from direct combustion [14].
The topic of decarbonization is extensive, the goals are ambitious, the initiatives and collective actions are in place, and the legal framework is currently being adapted. This goal is undoubtedly shared by all countries around the world, but it is also undeniable that each country must interpret and implement these goals and initiatives through the lens of its own circumstances, considering current conditions and future capabilities in addressing climate change [15]. The energy transition requires changes in many sectors [16], but the focus will be on the energy sector in this article. Bulgaria has vastly diversified energy mix that should be studied in its integrity. Fossil fuels make up a significant part in the mix, which leads to the need for major structural changes in the sector to achieve carbon neutrality. Measures must be taken to reduce emissions from facilities that rely on fossil fuels as their primary energy source. The main pathways include switching to alternative fuels, improving energy efficiency, and/or replacing conventional power units with low-emission alternative technologies.
While a broad range of low-emission technologies are available on the market, quantitatively assessing their potential effectiveness in reducing GHG and evaluating their potential integration into the existing national grid are crucial steps in devising a strategy to ensure sustainable future energy. In this context, various scenarios have been modeled to assess the environmental impact of electricity production under different energy mix configurations. Our goal is to identify an optimal mix that aligns with the anticipated electricity demand and minimizes greenhouse gas emissions.
2. Materials and Methods
2.1. Overview of the Electricity Sector
The electricity sector faces the challenge of meeting an increasing demand for electrical energy. The gradual phaseout of coal-fired power plants, which are responsible for covering the baseload and off-peak loads, represents a significant shock for countries with a high share of coal in their energy mix [17]. In this paper, the focus is on Bulgaria, aiming to assess the carbon footprint of the energy sources used at the moment and to model scenarios covering time periods up to 2050.
Data covering the period 2010-2022 were utilized to establish the initial structure of the electricity mix. Within this timeframe, the share of thermal power plants (TPPs) in gross annual electricity generation fluctuates between 39% and 50%. The share of heat production and supply power plants (HPSPPs) ranges between 4.6% and 6%, while that of factory heat power plants is between 2% and 5.5%. The nuclear power plant (NPP) share during the same period ranges from 31% to 41%. Renewable energy sources (RES) account for 7% to 16% of gross electricity production, while pumped-storage hydroelectric power plants (PSHPPs) contribute around 2%. The average gross annual electricity generation over this period is approximately 46 TWh. The data have been sourced from the annual bulletins on the state and development of the energy sector, published by the Ministry of Energy, and are presented in Figure 3 and Figure 4 [18,19,20,21,22,23,24,25,26,27,28,29,30].
2.2. IPAT Equation
For the purposes of this analysis, the general formula of the IPAT equation [31] developed by Ehrlich and Holdren will be applied, which has a wide range of applications in assessing the impact of different technologies. The formula is known as I = PAT and was derived by Paul Ehrlich and John Holdren in 1972. The equation illustrates the relationship between population change (P), affluence and lifestyle (A), technology used (T), and environmental impact (I). In other words, it serves as a mathematical model for evaluating the effects of human activity on the environment.
For instance, this equation can be used to estimate fuel consumption based on vehicle efficiency, distance traveled, and the number of vehicles, or to assess the energy required for pig iron production depending on the applied technology, and other similar cases. Given the focus of this analysis on the energy transition and global warming, the emphasis of the calculations will be on greenhouse gas emissions. For the purposes of the investigation the IPAT equation was adapted according to the description in Figure 5 and further calculations for different cases and scenarios were developed.
2.2.1. Population (P)
The level of the Earth’s population is directly related to global warming and climate change, with human activity identified as the main driver behind technological development and the increasing impact on the environment. The United Nations predicts that the global population will rise from 7.7 billion in 2019 to 9.8 billion by 2050 and approximately 11.2 billion by 2100. [32] However, the population trend in Bulgaria, over recent years and for the years ahead, is forecasted to fall, according to data from the National Statistical Institute. The demographic forecast model for the period 2020–2080 considers three scenarios for the population of the country—convergence hypothesis (Case 1), relatively accelerated development (Case 2), and relatively delayed development (Case 3) [33].
Case 1 is considered the most realistic and in compliance with the regulatory requirements of the European Union regarding demographic and socio-economic development in member states. Case 2 assumes that demographic development will occur under favorable socio-economic conditions in the country. Case 3 forecasts population development under hypotheses of unfavorable socio-economic processes in the country.
For the purposes of this document, an average value derived from the three scenarios is used.
2.2.2. Affluence (A)
The variable A measures the affluence of the population in terms of average consumption per person. A key indicator of changes in consumption is the gross domestic product (GDP) per capita. Although GDP is an indicator of a country’s production activity, it is assumed that an increase in production also leads to an increase in electricity consumption. Over the past few centuries, global gross domestic product per capita has followed an upward trend, which increases the environmental impact of human activity, even though the relationship is not strictly proportional. As GDP has grown over the years, both energy intensity and carbon intensity have decreased, as a result of a combination of changes in the economic structure and policies seeking to improve energy efficiency.
Final energy consumption is a function of the energy resources required by end-consumers and reflects sector-specific dynamics—industry, transport, households, agriculture, economy, and others. This dynamic captures not only the need for primary and secondary energy, but also the integration of new technologies and the impact of energy efficiency measures on the environment. Although the gross domestic consumption is an indicator of a country’s industrial, social, and economic progress, the production and consumption of energy resources has a direct effect on the environment. In the long term, the goal is to reduce the impact on the environment with the help of new technologies and structural changes in the energy sectors, without leading to deindustrialization and strict restrictions on the consumption of end-consumers. In other words, energy efficiency measures and the implementation of low-emission energy sources should overtake the trend of rising energy consumption.
2.2.3. Technology (T)
The variable T reflects how energy-intensive and resource-intensive a given production process is. Improving the efficiency of technological processes can significantly reduce environmental impact. For the purposes of this analysis, which focuses on electricity generation, the emission factors of the electricity generation facilities, assessed over their life cycle, will be used to account for technology. In the final calculation of the environmental impact, the grid emission factor of every electricity generation scenario will be used.
Input parameters:
- a)
-
The emission factors for each type of technology are based on average values for the EU-27 + United Kingdom, as is provided by the United Nations Economic Commission for the Europe (UNECE) Life Cycle Assessment of Electricity Generation Options [34]:
- o
- Hydroelectric power plants up to 360 MW;
- o
- Photovoltaic panels with polysilicon solar cells;
- o
- Nuclear power plants with PWR-type reactors with a capacity of 1000 MW;
- o
- Onshore wind power plants.
- b)
- Gross electricity production until 2050 is estimated based on forecasts from the Electricity System Operator of Bulgaria until 2031 [24]. Prediction modeling for the remaining period of 2032-2050 is performed by linear regression using the Forecast Function in Excel.
- c)
- Final electricity consumption in the country is projected based on the data until 2030 in the Integrated Energy and Climate Plan of the Republic of Bulgaria [25].
- d)
- The initial parameters of the first scenario reflect the actual distribution of electricity generation capacities in the mix for the period 2010–2022 (with the average value between the minimum and maximum shares of production), while each subsequent scenario assesses the impact of increasing the share of nuclear energy on the grid emission factor. The last two scenarios evaluate the potential impact of accelerated penetration of renewables in the mix, and the final scenario illustrates electricity generation entirely from renewable energy sources.
Notes on the input parameters:
- The construction of hydrogroups with a higher installed capacity may lead to significantly elevated emission factors (up to 150 gCO₂/kWh), primarily due to equipment manufacturing and long-distance transportation impacts.
- Silicon solar panels are currently the most common on the market.
- Pressurized Water Reactors (PWR) are the most commonly deployed nuclear reactor type globally. This technology is also used in Bulgaria’s existing nuclear units and planned future projects.
- For renewable energy sources and nuclear power plants, the potential environmental impact is assessed over their entire life cycle, as the aim is to evaluate the impact and relevance of these alternative low-emission technologies in their future construction and replacement of fossil fuel-fired power plants. For this reason, only the emission factor for direct emissions from electricity production was used for fossil fuel-fired power plants [26].
- Biomass included in the energy mix is treated as carbon-neutral and is therefore excluded from total emission calculations. Biomass is considered a carbon-neutral fuel and its emission factor is assumed to be zero when participating in the electricity generation, but this does not mean that no CO2 emissions are released during its combustion. Although CO₂ is emitted during combustion, the assumption of neutrality is based on the premise that the plants used for biomass absorb an equivalent amount of CO₂ through photosynthesis during their life cycle. Due to the lack of available data on the life-cycle emissions of biomass combustion installations, their emissions are not included in this analysis.
- According to the modeled scenario of the Electricity System Operator, an upward trend in gross electricity production in Bulgaria is observed, which can be explained by the electrification of a number of sectors in the country as a tool in the fight against climate change. This trend highlights the increasing importance of clean energy production in addressing the energy trilemma.
Seven scenarios with different percentage share of nuclear power in the electricity mix are modeled for the assessment of nuclear energy relevance as a low-emission energy source. At the first four scenarios, the share of the NPP production increases linearly at the expense of TPP production. At the last three it decreases because of the renewables production increase. Scenario 1, which reflects the average percentage share of power plants in the generation mix for the period 2010–2022 is chosen for reference point. The grid emission factor is obtained by taking into account the percentage share of different types of power plants in electricity mix and their emission factors, respectively. The modeled scenarios cover the period 2025-2050, with the aim of identifying the optimal electricity generation mix that meets national electricity demand and taking into account the technology emission factors. The long-term assessment approach enables the tracking of correlations between changing parameters and their environmental impact.
The calculations are based on data regarding population, final electricity consumption, and the grid emission factor for the period 2010–2050. In this way, the most effective scenario for electricity generation can be identified, which is a critical step toward achieving net-zero emissions in the context of increasing electricity production and consumption. While a wide range of low-emission generation technologies is already available on the market, a quantitative assessment of the potential effectiveness of these technologies for limiting greenhouse gas emissions and the overview of their integration feasibility within the national grid forms the foundation for a sustainable energy transition.
3. Results
The results are illustrated in the graphs below. The environmental impact is shown for the period up to 2050, taking into account the changing factors (population and electricity consumption) and the grid emission factor for each of the considered scenarios.
The statistical and forecast data from the National Statistical Institute regarding the country’s population are presented in Figure 6.
The statistical and forecast data for gross electricity production and final electricity consumption in the country are shown in Figure 7 and Figure 8, respectively.
Table 1 presents the emission factors associated with various electricity generation technologies. The emission factors for nuclear power and renewable energy sources are based on life-cycle assessments conducted by the United Nations Economic Commission for Europe for the EU-27 + United Kingdom [34]. The emission factors for thermal power plants are from data specific to Bulgaria.
The data used in the analytical calculations are presented in Table 2. These values are incorporated as variables into the I=PAT equation to evaluate the environmental impact.
As shown in Table 3, seven scenarios (S1-S7) with different percentage shares of electricity generation capacities in the mix are considered. Calculations are performed separately for each scenario in order to provide a comparison between them based on the obtained grid emission factor (EF).
The results of the calculations for each scenario, applying the IPAT approach, for the period 2025–2050 are presented in Table 4.
Figure 9 illustrates the environmental impact as greenhouse gas emissions associated with the electricity generation mix under the analyzed scenarios, relative to final electricity consumption.
4. Discussion
Solving the issue of greenhouse gas emissions involves more than just limiting emissions, reconstructing and modernizing high-emission power capacities, or replacing them with alternative low-emission options. The reliability of the electricity grid depends not only on the ability to meet electricity demand curves but also on maintaining the balance between electricity production and consumption. A key indicator of this balance in the electricity grid is the system frequency. According to the operational rules of the interconnected European electricity system, the nominal frequency must be maintained at level of 50 Hz. Any imbalance between production and consumption causes frequency deviations, which require additional actions in terms of regulation. The regulation is carried out on three levels – primary, secondary, and tertiary. In order to ensure system reliability, cold reserve capacities are also maintained to cover load demands in the event of a power shortage. Therefore, when developing forecasts for electricity production and consumption in the coming years, special attention must be paid to the power balance of the grid and the need to ensure sufficient flexibility to cover peak loads.
Although their relatively long deployment timelines the advantages of nuclear power plants over renewable energy sources in the fight against climate change are obvious. In the environmental life-cycle assessment of these two types of technologies, the average values for the EU-27 + United Kingdom show that a PWR-type nuclear power reactor of (1000 MW) has an average emission factor of 5.1 gCO₂/kWh. In comparison, photovoltaic solar power plants have an average of 37 gCO₂/kWh, with onshore wind farms exhibiting 12 gCO₂/kWh and hydropower plants 11 gCO₂/kWh.
There are several specific considerations that must be taken into account, listed as follows:
- a)
- Renewable energy sources have variable and intermittent generation profiles, and weather conditions cannot be reliably predicted over the long term. This may result in situations where electricity demand is high, but the lack of wind or sunlight results in an inability to meet the demand.
- b)
- Nuclear power plants are much more efficient, as they are characterized by a much larger installed capacity on a significantly smaller occupied area.
- c)
- If a scenario with a substantial share of renewables in the electricity mix is chosen, ensuring reliable grid operation would require the use of energy storage technologies to store the surplus energy generated during peak renewable production hours.
- d)
- Currently, the most widely used method for energy storage is by pumping water into a reservoir, after which this water is released to produce electricity when needed. For this reason, pumped-storage hydropower plants (PSHPPs) are often used as balancing facilities to meet peak loads. PSHPPs have significant potential in terms of environmental impact and efficiency, but their development is constrained by the geographical availability of water resources.
- e)
- A critical aspect of renewable energy sources is their dependence of geographical location. Some countries produce all or nearly all of their electricity from low-carbon sources. For instance, Paraguay, Iceland, Sweden, and Uruguay generate more than 95% of their electricity from such sources, while France exceeds 90%. [27] Iceland generates its electricity entirely from alternatives to fossil fuels, producing approximately 80% from hydropower and 20% from geothermal energy. However, this electricity mix is a result of the country’s favorable geographical location and is not universally applicable. In contrast, nuclear power plants—especially the small modular reactors—can be deployed almost anywhere.
- f)
- As previously mentioned, the environmental impact of low-emission technologies is mainly associated with the construction phase and the extraction of materials, as well as the management of waste at the end of the facility’s life cycle. Solar panels have an average lifespan of 25–30 years, whereas wind turbines typically last 20–25 years. In contrast, a nuclear power facility could be operated for up to 60 years, which is twice as long.
According to Ember’s Global Electricity Review 2024, in 2023, renewable energy sources provided 30% of global electricity generation, while nuclear energy contributed 9.1%. This means that a total of 39.1% of the world’s electricity was generated from low-emission sources [28]. The average annual capacity factor of the installed power generation units in Bulgaria is presented in the table below (Table 5) [29].
Based on the presented facts and the modeling results, the following conclusions could be drawn:
- If the current electricity mix remains unchanged, greenhouse gas emissions will increase significantly by 2050 due to the rising demand for electricity and production, consequently. Emissions from the production of consumed electricity in the country are expected to grow from around 17.6 million tons in 2010 to nearly 26 million tons by 2050.
- Increasing the share of nuclear energy in the electricity mix reduces the grid’s emission factor and the amount of greenhouse gas emissions.
- Producing 100% of the electricity with nuclear power plants would naturally have the least impact on the environment. However, this is not an optimal solution in terms of power system reliability, as a diversified mix of installed capacities provides greater flexibility in responding to potential problems. Bulgaria is expected to operate until 2050 its two 1000 MWe nuclear units that lack sufficient maneuverability to meet changes in the grid load. For this reason, a scenario with electricity production entirely from nuclear power plants was not considered.
- Nevertheless, nuclear energy ensures the stability of the energy supply, as it is a baseload power, which can be determined from its capacity factor of 94%. The only downtime is during the scheduled annual maintenance period.
- The scenario in which electricity is generated entirely from renewable energy sources, although highly hypothetical is possible with the current energy storage technologies. Anyway, shows a higher grid emission factor compared to scenarios that include nuclear power plants in the mix (but exclude fossil fuel plants). This result once again confirms the importance of nuclear power plants for the energy transition and their relevance for the production of “clean” and “green” energy.
The lowest emission factor of the grid is observed in Scenario 5, with Scenario 6 showing only a slightly higher value. In both scenarios, the production from fossil fuel power plants is replaced with renewable energy sources and nuclear energy. However, the scenario with a higher share of nuclear energy (Scenario 5) is the most optimal in terms of environmental impact. This scenario includes a 70% share of nuclear generation in the mix, with the remainder being produced from renewable energy sources. It could also be considered as optimal from the perspective of power system reliability, as it provides sufficient baseload capacity while ensuring the diversification of generation units. In this scenario, the emission factor drops to 0.01 tCO₂-eq/MWh, compared to 0.622 tCO₂-eq/MWh in Scenario 1, which reflects the average percentage share of power plants in the generation mix for the period 2010–2022. Accordingly, the environmental impact from electricity generation and consumption is significantly reduced. With a 70% share of nuclear power and the elimination of fossil fuels from the mix, greenhouse gas emissions decrease considerably, reaching levels sufficient to meet decarbonization targets and potentially offset by the LULUCF sector.
In 2022, thermal power plants were responsible for 45% of the electricity mix, while the share of nuclear power plants was 33% [30]. The implementation of the scenario with a 70% nuclear share for the year 2022 corresponds precisely to a hypothetical replacement of three of the country’s condensing TPPs with new nuclear units. The data on electricity production by these three power plants and the related emissions are presented in Table 6.
Therefore, replacing the electricity generation of these three condensing TPPs with nuclear power plants would reduce greenhouse gas emissions by 21.3 million tonnes annually. Table 7 presents the forecasted reductions in greenhouse gas emissions according to the Integrated Energy and Climate Plan of the Republic of Bulgaria [32].
If these 21.3 million tons are deducted from the country’s aggregated greenhouse gas emissions, taking into account LULUCF, a reduction of more than one-third in total GHG emissions is observed. This result once again demonstrates the significant contribution of thermal power plants to global warming, as well as the effectiveness and reliability of nuclear energy as a solution in the context of the energy transition.
5. Conclusions
In recent years, there has been a positive growth in the gross domestic product in Bulgaria, despite a declining population trend. It is evident that industrial production will require more electricity, even with energy efficiency measures in place. The growing demand for electricity will not come solely from industry, but also from the needs of the population. One of the tools in the fight against climate change is electrification. An example is the expected transformation of the transport sector after 2035, when the manufacturing of diesel and oil vehicles will be phased out and only electric vehicles will be available on the market. The main goal involves ensuring all vehicles are electric by 2050. The transport sector also contributes significantly to greenhouse gas emissions, so such a reform would undoubtedly mitigate the environmental impact of human activity. Electrification is expected to expand beyond the transport sector and to include other areas of daily life and industrial activity. For industries in which processes are carried out at high temperatures and require significant amounts of thermal energy, replacing fossil fuels as the primary energy source is a complex task. However, the electrification for a typical household is far simpler.
To ensure the reliable operation of the electricity grid, baseload, intermediate load, and peak load capacities are necessary. Given the growing demand for electricity, the availability of sufficient generation capacity in the country is critically for sustainable development. Thermal power plants currently cover baseload and midload demand. Eliminating this type of baseload and partially balancing capacity is a major step. Reducing the use of fossil fuels would also constitute significant advancement in the process of decarbonization, but this transition requires time for adaptation and the development of adequate strategies.
The obtained results in this study confirm the relevance of nuclear technologies and consolidate their place in the energy transition together with renewable energy sources.
Ensuring a certain baseload capacity is essential for achieving reliable energy de-velopment. From the perspective of current technologies, nuclear units have an advantage over renewable energy sources in terms of providing the baseload electricity load. One of the considered scenarios in this study in which electricity generation is achieved entirely from renewable energy sources shows a higher grid emission factor compared to scenarios that include nuclear power in the generation mix, but exclude fossil fuel-fired plants.
The global energy supply crisis highlights the importance of diversification for ensuring energy security, whether in context of energy resources, suppliers, generation units, or market relations. For this reason, it is recommended that countries focus their strategies on a diverse generation mix consisting of low-emission technologies.
According to the definition provided by Brundtland in 1987, sustainable development is a kind of development that meets the needs of the present without compromising the ability of future generations to meet their own needs. The relevance of nuclear energy in this context is supported by data for the significantly low carbon footprint of whole lifecycle of the nuclear power plants. However, the produced and remained radioactive wastes need a long-term treatment and storage. To be fully integrated to the conception of the sustainability, the nuclear industry has to overcome this challenge in the near future.
Therefore, the combination of renewable technologies with nuclear energy could be expected to be the optimal solution for low emission and stable mix in the national grid.
Author Contributions
Conceptualization, V.M., D.Z.-F., G.V. and K.F.; methodology, V.M., D.Z.-F. and G.V.; validation, K.F., G.V., M.M. and D.Z.-F.; formal analysis, K.F.; investigation, V.M. and D.Z.-F.; resources, V.M. and M.M.; data curation, D.Z.-F. and V.M.; writing—original draft preparation, V.M. and D.Z.-F.; writing—review and editing, V.M., D.Z.-F., M.M. and G.V.; visualization, D.Z.-F. and K.F.; supervision, G.V. and D.Z.-F.; project administration, G.V. and D.Z.-F.; funding acquisition, G.V. All authors have read and agreed to the published version of the manuscript.
Funding
This research was funded by the European Union—NextGenerationEU, through the National Recovery and Resilience Plan of the Republic of Bulgaria, grant number BG-RRP-2.004-0005. The APC was funded the Ministry of Education and Science of Republic of Bulgaria, through the National Program D01-99.
Institutional Review Board Statement
Not applicable.
Informed Consent Statement
Not applicable.
Data Availability Statement
No new data were created or analyzed in this study. Data sharing is not applicable to this article.
Conflicts of Interest
The authors declare no conflicts of interest. The funders had no role in the design of the study; in the collection, analyses, or interpretation of data; in the writing of the manuscript; or in the decision to publish the results.
Abbreviations
The following abbreviations are used in this manuscript:
| EU | European Union |
| FHPP | Factory Heat Power Plants |
| GDP | Gross Domestic Product |
| GHG | Greenhouse Gas |
| HPSPP | Heat Production and Supply Power Plant |
| IPCC | Intergovernmental Panel on Climate Change |
| IPPU | Industrial Processes and Product Use |
| LULUCF | Land Use, Land-Use Change and Forestry |
| NPP | Nuclear Power Plant |
| PSHPP | Pumped-Storage Hydropower Plant |
| PWR | Pressurized Water Reactor |
| RES | Renewable Energy Sources |
| TPP | Thermal Power Plant |
References
- Itxaso, I,; Faria, S. H.; Neumann M. B. Climate change perception: Driving forces and their interactions, J. Env. Sci. 2020, Volume 108, pp 112-120.
- Holmberg M.; Akujärvi A. Sources and sinks of greenhouse gases in the landscape: Approach for spatially explicit estimates, Sci. Total Environ. 2021, Volume 781.
- Abbass, K.; Qasim, M.Z. A review of the global climate change impacts, adaptation, and sustainable mitigation measures. Environ Sci Pollut Res 2022, Volume 29.
- European Parliament. (n.d.). Greenhouse gases causing global warming. https://www.europarl.europa.eu/news/en/headlines/society/20180301STO98928/greenhouse-gases-causing-global-warming,.
- Sovacool B.K.; Griffiths, S. Climate change and industrial F-gases: A critical and systematic review of developments, sociotechnical systems and policy options for reducing synthetic greenhouse gas emissions, Renew. Sustain. Energy Rev. 2021, Volume 141 {2}.
- Mar A.K; Unger C. Beyond CO2 equivalence: The impacts of methane on climate, ecosystems, and health, Environ. Sci. & Policy, 2022, Volume 134, pp 127-136.
- Lamb, W. F; Wiedmann T. A review of trends and drivers of greenhouse gas emissions by sector from 1990 to 2018, Environ. Res. Lett. 2021, Volume 16.
- IPCC. (2018). Global Warming of 1.5°C. https://www.ipcc.ch/sr15/.
- European Commission. (2021). European Climate Law. https://climate.ec.europa.eu/eu-action/european-green-deal/european-climate-law_en.
- Saraji M. K.; Streimikiene D. Challenges to the low carbon energy transition: A systematic literature review and research agenda, Energy Strat. Rev. 2023, Volume 49.
- Ćorović N.; Urošević B.G. Decarbonization: Challenges for the electricity market development — Serbian market case, Energy Rep. 2022, Volume 8, pp 2200-2209.
- Executive Environment Agency (EEA) Bulgaria. (2023). National Inventory Report 2023., https://eea.government.bg/bg/dokladi/BG_NIR_15April_2023.pdf,.
- Executive Environment Agency (EEA) Bulgaria. (2023). National Inventory Report 2023., https://eea.government.bg/bg/dokladi/BG_NIR_15April_2023.pdf.
- 1Executive Environment Agency (EEA) Bulgaria. (2023). National Inventory Report 2023., https://eea.government.bg/bg/dokladi/BG_NIR_15April_2023.pdf.
- Renou-Maissant, P.; Abdesselam, R. Trajectories for Energy Transition in EU-28 Countries over the Period 2000–2019: a Multidimensional Approach. Environ. Model. Assess. 2022, Volume 27, pp 525–551.
- Yang Y.; Xia S. Energy transition: Connotations, mechanisms and effects. Energy Strategy Rev. 2024, Volume 52.
- Moreira R.; A tale of two (un)Just Transitions: the end of the coal-fired power plants in Portugal. Energy Policy 2025, Volume 204.
- Ministry of Economy and Energy. (2010). Energy Bulletin 2010, https://www.me.government.bg/themes-c195.html.
- Ministry of Economy and Energy. (2011). Energy Bulletin 2011, https://www.me.government.bg/themes-c195.html.
- Ministry of Economy and Energy. (2012). Energy Bulletin 2012, https://www.me.government.bg/themes-c195.html.
- Ministry of Economy and Energy. (2013). Energy Bulletin 2013, https://www.me.government.bg/themes-c195.html.
- Ministry of Economy and Energy. (2014). Energy Bulletin 2014, https://www.me.government.bg/themes-c195.html.
- Ministry of Economy and Energy. (2015). Energy Bulletin 2015, https://www.me.government.bg/themes-c195.html.
- Ministry of Economy and Energy. (2016). Energy Bulletin 2016, https://www.me.government.bg/themes-c195.html.
- Ministry of Economy and Energy. (2017). Energy Bulletin 2017, https://www.me.government.bg/themes-c195.html.
- Ministry of Economy and Energy. (2018). Energy Bulletin 2018, https://www.me.government.bg/themes-c195.html.
- Ministry of Economy and Energy. (2019). Energy Bulletin 2019, https://www.me.government.bg/themes-c195.html.
- Ministry of Economy and Energy. (2020). Energy Bulletin 2020, https://www.me.government.bg/themes-c195.html.
- Ministry of Economy and Energy. (2021). Energy Bulletin 2021, https://www.me.government.bg/themes-c195.html.
- Ministry of Economy and Energy. (2022). Energy Bulletin 2022, https://www.me.government.bg/themes-c195.html.
- Ehrlich P.R.; Holdren J.P. Impact of Population Growth, Science, New Series, 1971 Volume 171, No. 3977 pp. 1212-1217.
- United Nations. (2017). World population projected to reach 9.8 billion in 2050, and 11.2 billion in 2100. https://www.un.org/development/desa/en/news/population/world-population-prospects-2017.html.
- National Statistical Institute. (n.d.). Population forecast by gender and age. https://www.nsi.bg/.
- United Nations Economic Commission for Europe (UNECE). (2021). Life Cycle Assessment (LCA) of electricity generation technologies: Methodology and results (Version 1.2). https://unece.org/sites/default/files/2021-09/202109_UNECE_LCA_1.2_clean.pdf.
- Electricity System Operator (ESO). Development plan for the Bulgarian transmission electricity network for the period 2022–2031. https://www.eso.bg/fileObj.php?oid=3505.
- Ministry of Energy of Bulgaria. (2020). National Energy and Climate Plan of Bulgaria. https://ec.europa.eu/energy/sites/default/files/documents/national_energy_and_climate_plan_bulgaria_clear_22.02.20.pdf.
- Ministry of Environment and Water of the Republic of Bulgaria. (2020). Bulgaria: Environmental Governance and Financing — Country Profile. https://www.moew.government.bg/static/media/ups/articles/attachments/Bulgaria_EGEF_2020764cac18a9d882f193fcb396cf2ff9cb.pdf.
- Our World in Data. (n.d.). Which countries get the most electricity from low-carbon sources? https://ourworldindata.org.
- Ember. (2024). Global Electricity Review 2024. Retrieved from https://ember-energy.org/app/uploads/2024/05/Report-Global-Electricity-Review-2024.pdf.
- Electricity System Operator (ESO). Development plan for the Bulgarian transmission electricity network for the period 2022–2031. https://www.eso.bg/fileObj.php?oid=3505.
- Executive Environment Agency. (2022). Environmental reports archive by plant operators. Retrieved from https://eea.government.bg/bg/dokladi/okolosredovni-dokladi-2022.
- Executive Environment Agency. (2023). Verified reports on GHG emissions. Retrieved from https://eea.government.bg/bg/r-r/r-te/verifitsirani-dokladi-23.
- Ministry of Energy of Bulgaria. (2020). National Energy and Climate Plan of Bulgaria. https://ec.europa.eu/energy/sites/default/files/documents/national_energy_and_climate_plan_bulgaria_clear_22.02.20.pdf.
Figure 1.
Total GHG emissions in thousands tCO2-eq. for 1988 – 2021.
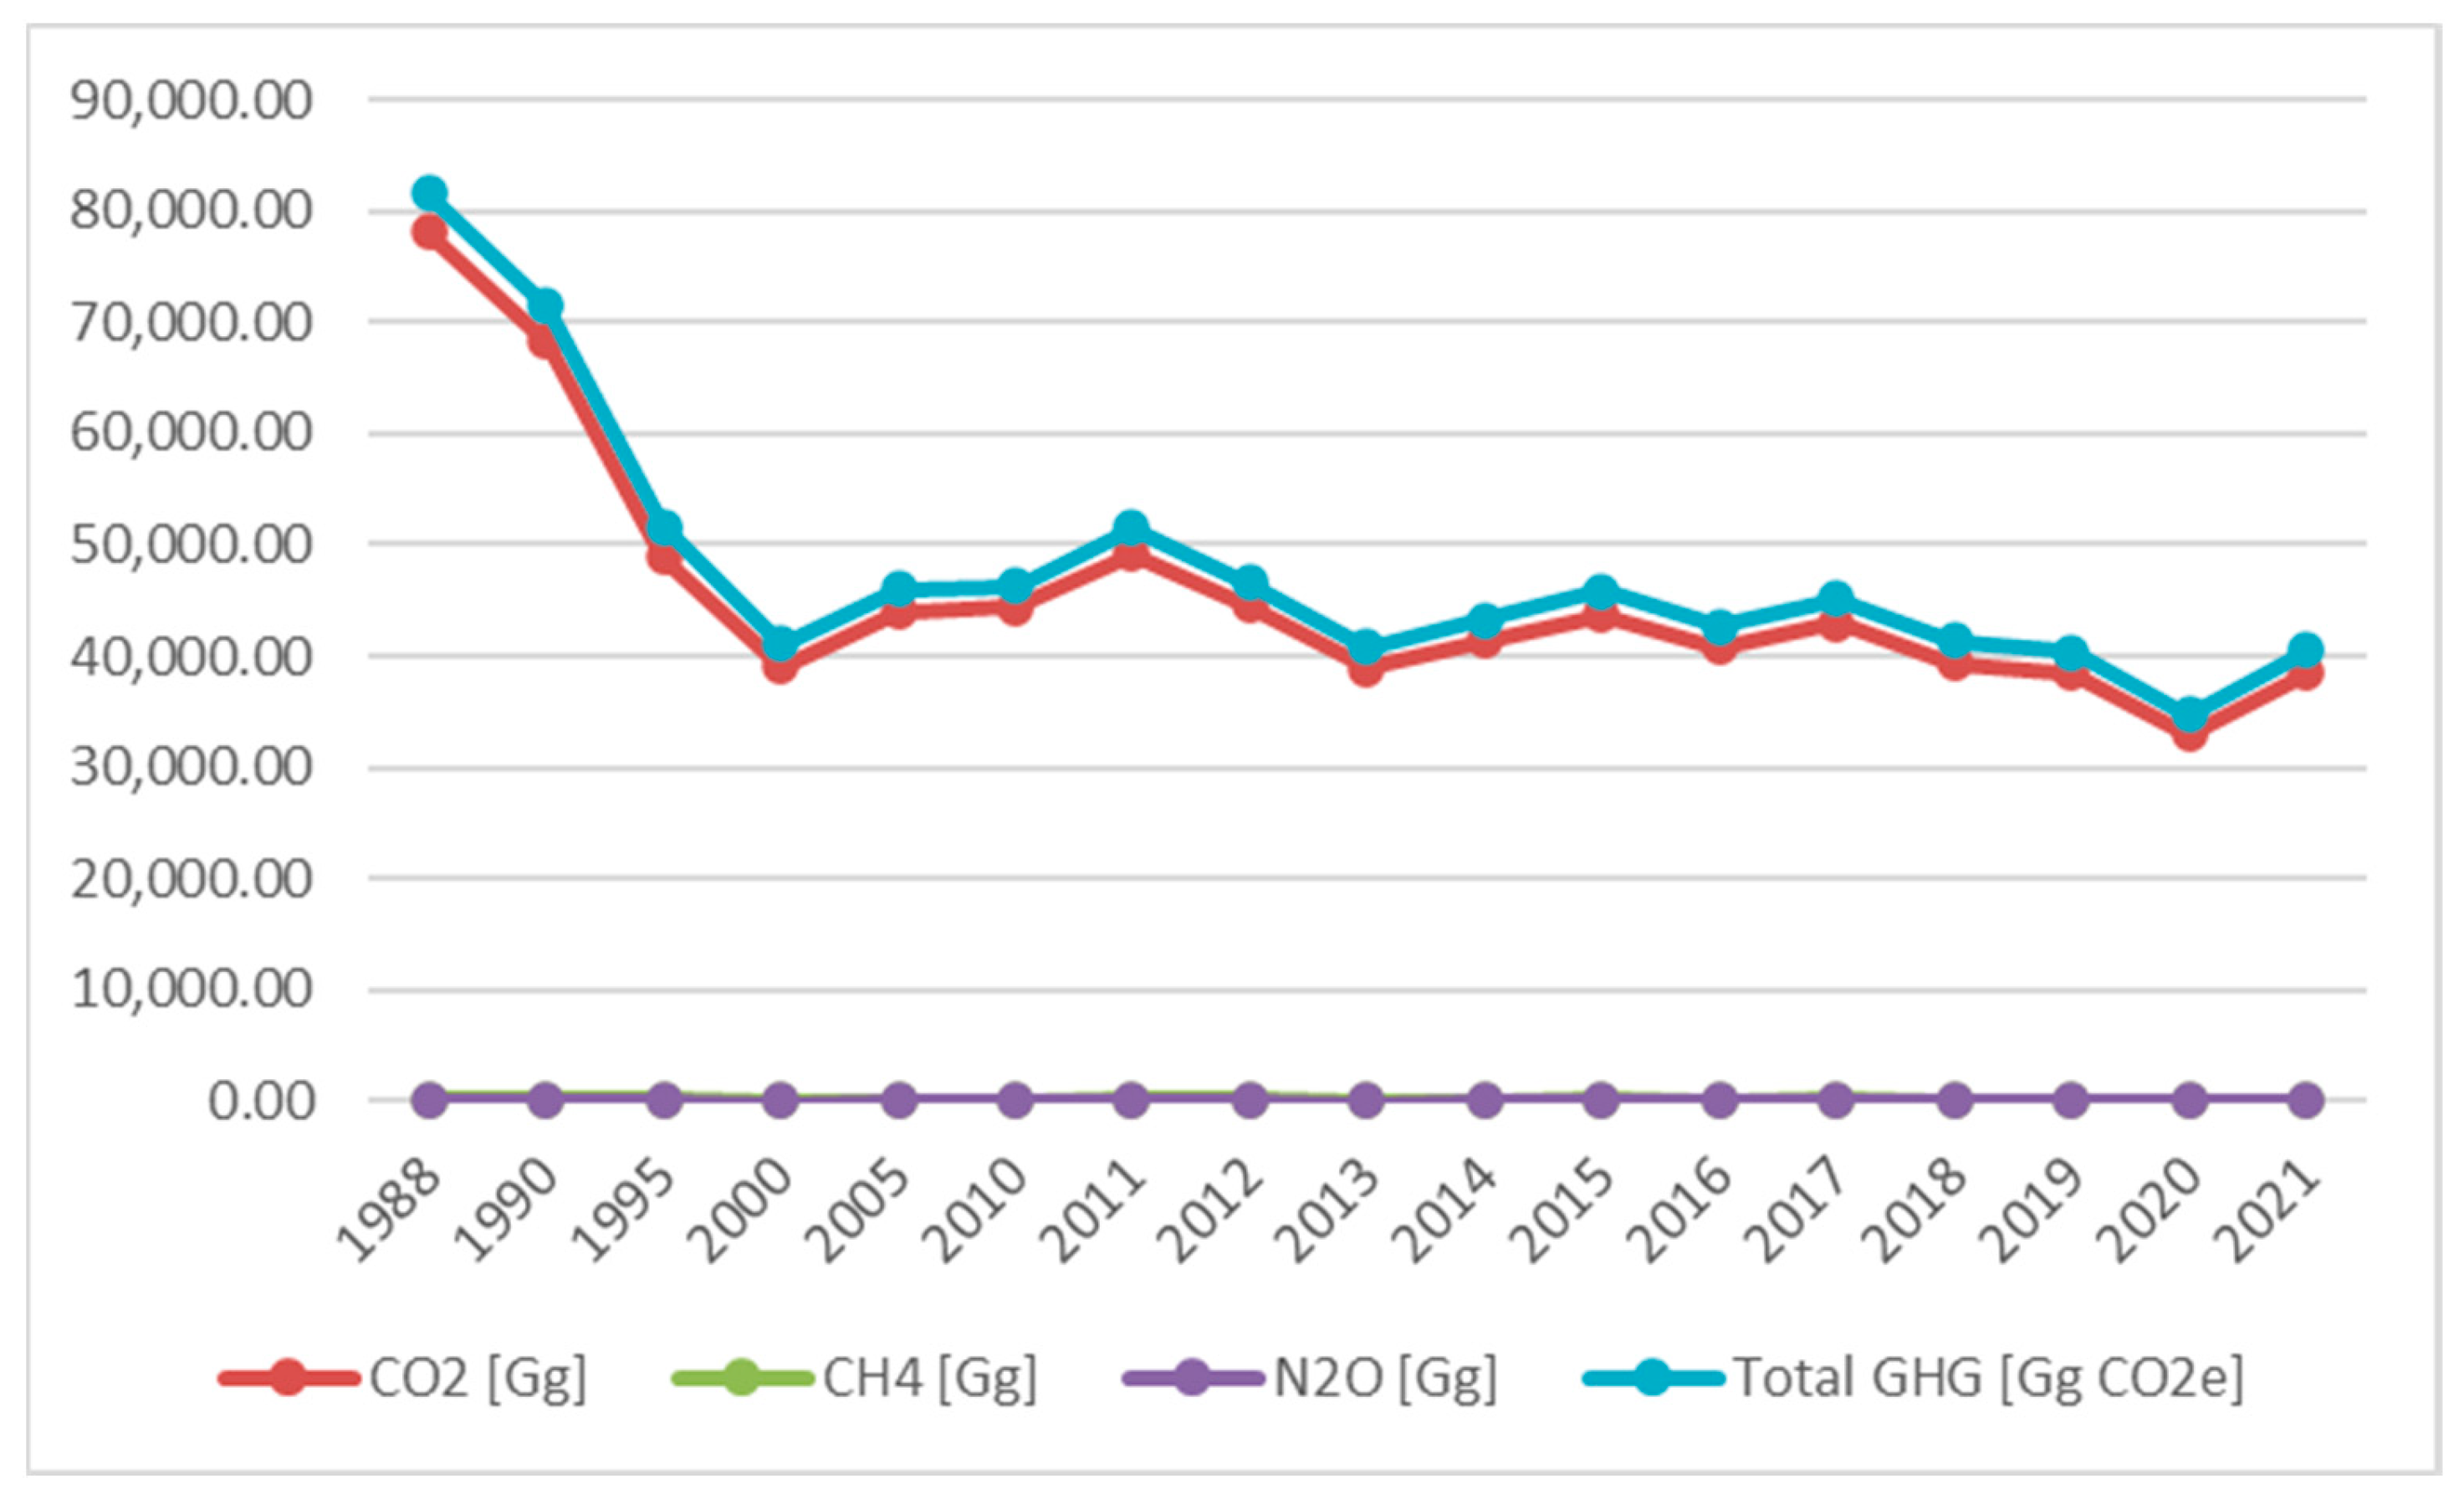
Figure 2.
GHG emissions in thousands tCO2-eq. from fuel combustions by fuel type.
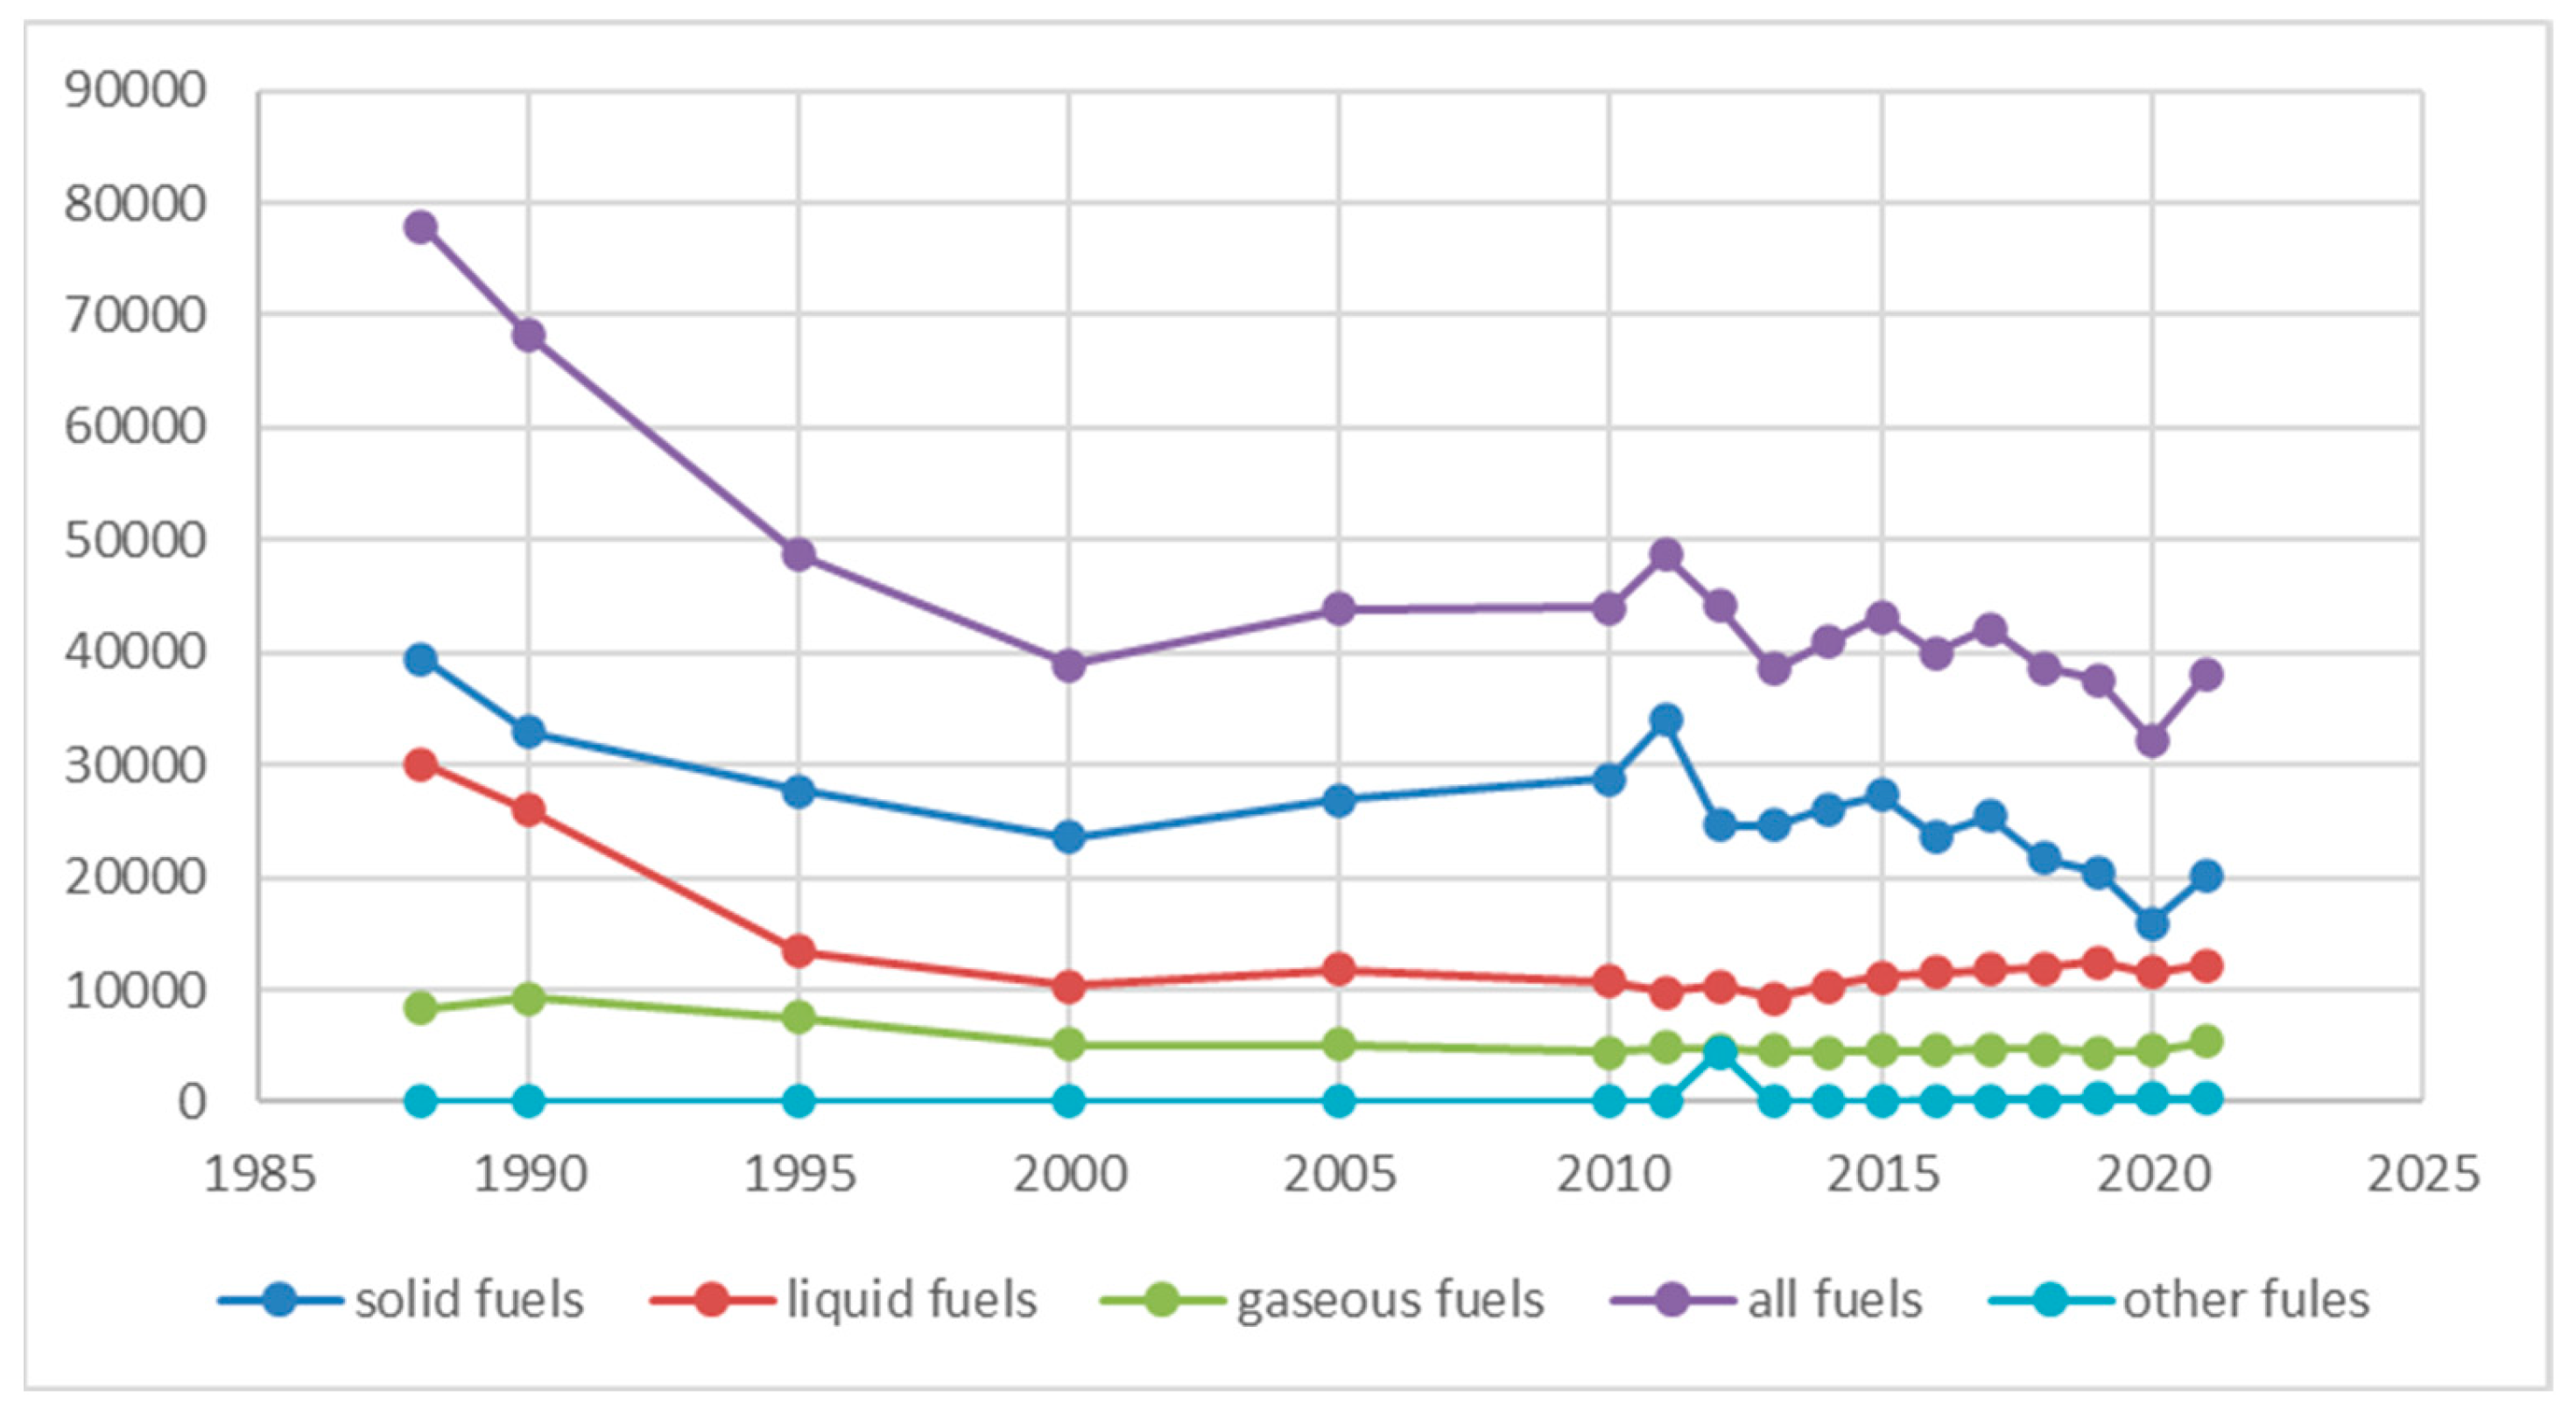
Figure 3.
Share of power plant types in the national gross electricity production.
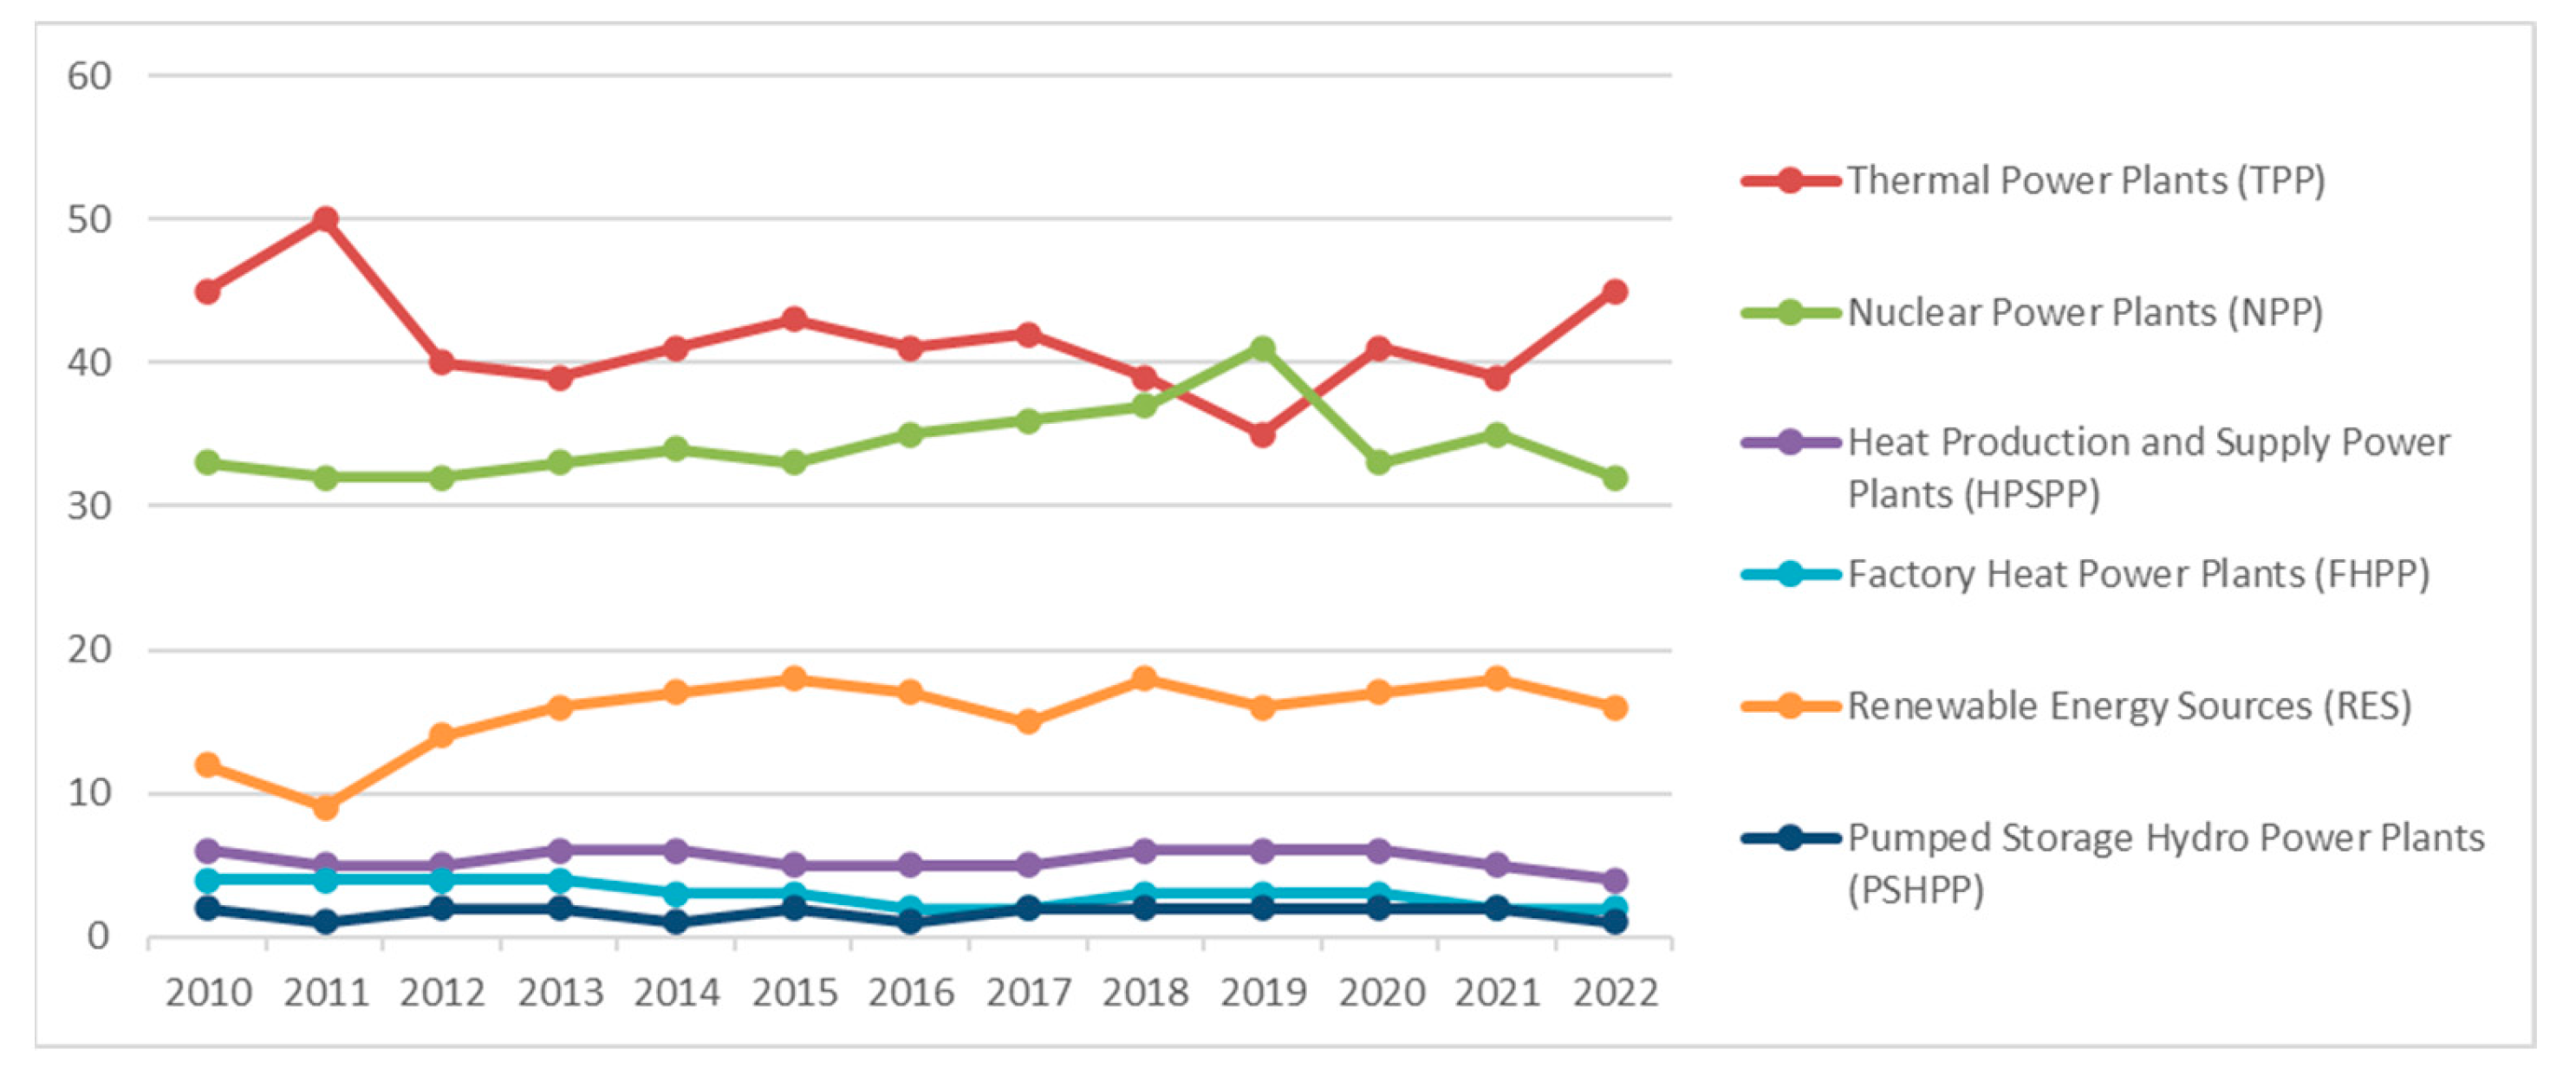
Figure 4.
Bulgaria’s gross electricity production.
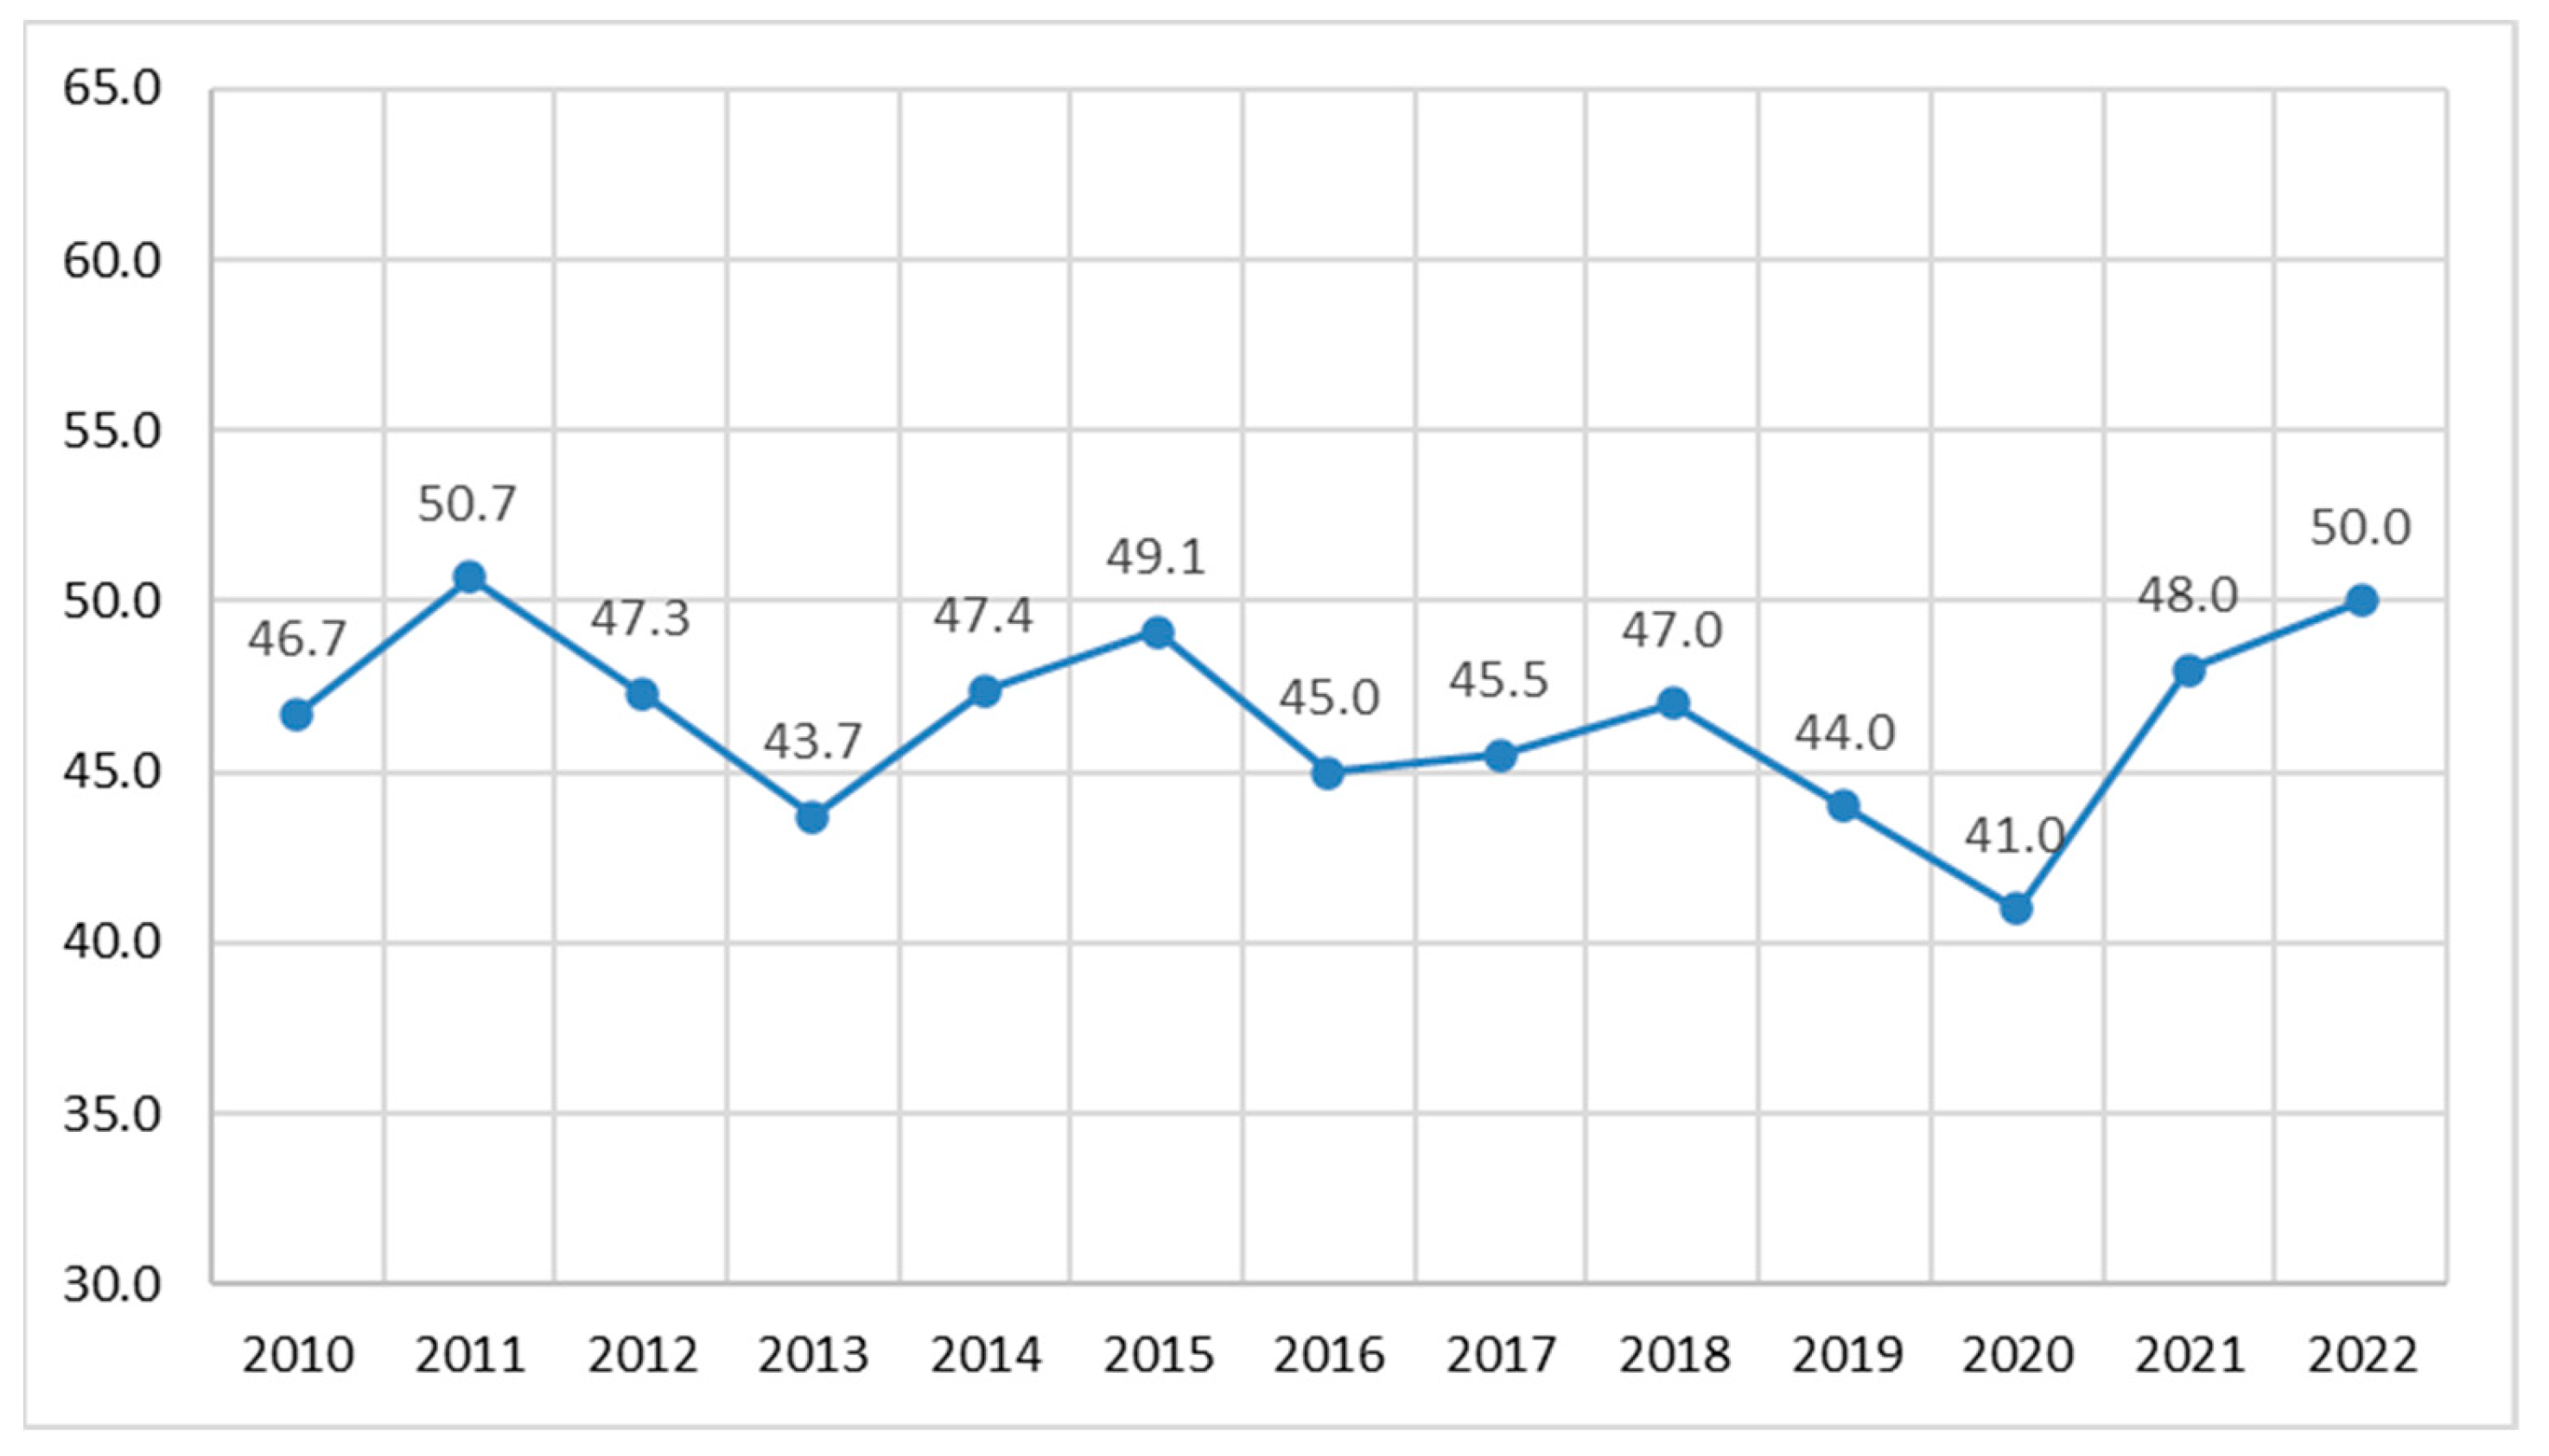
Figure 5.
An adaptation of the IPAT equation used in modeling relationships.
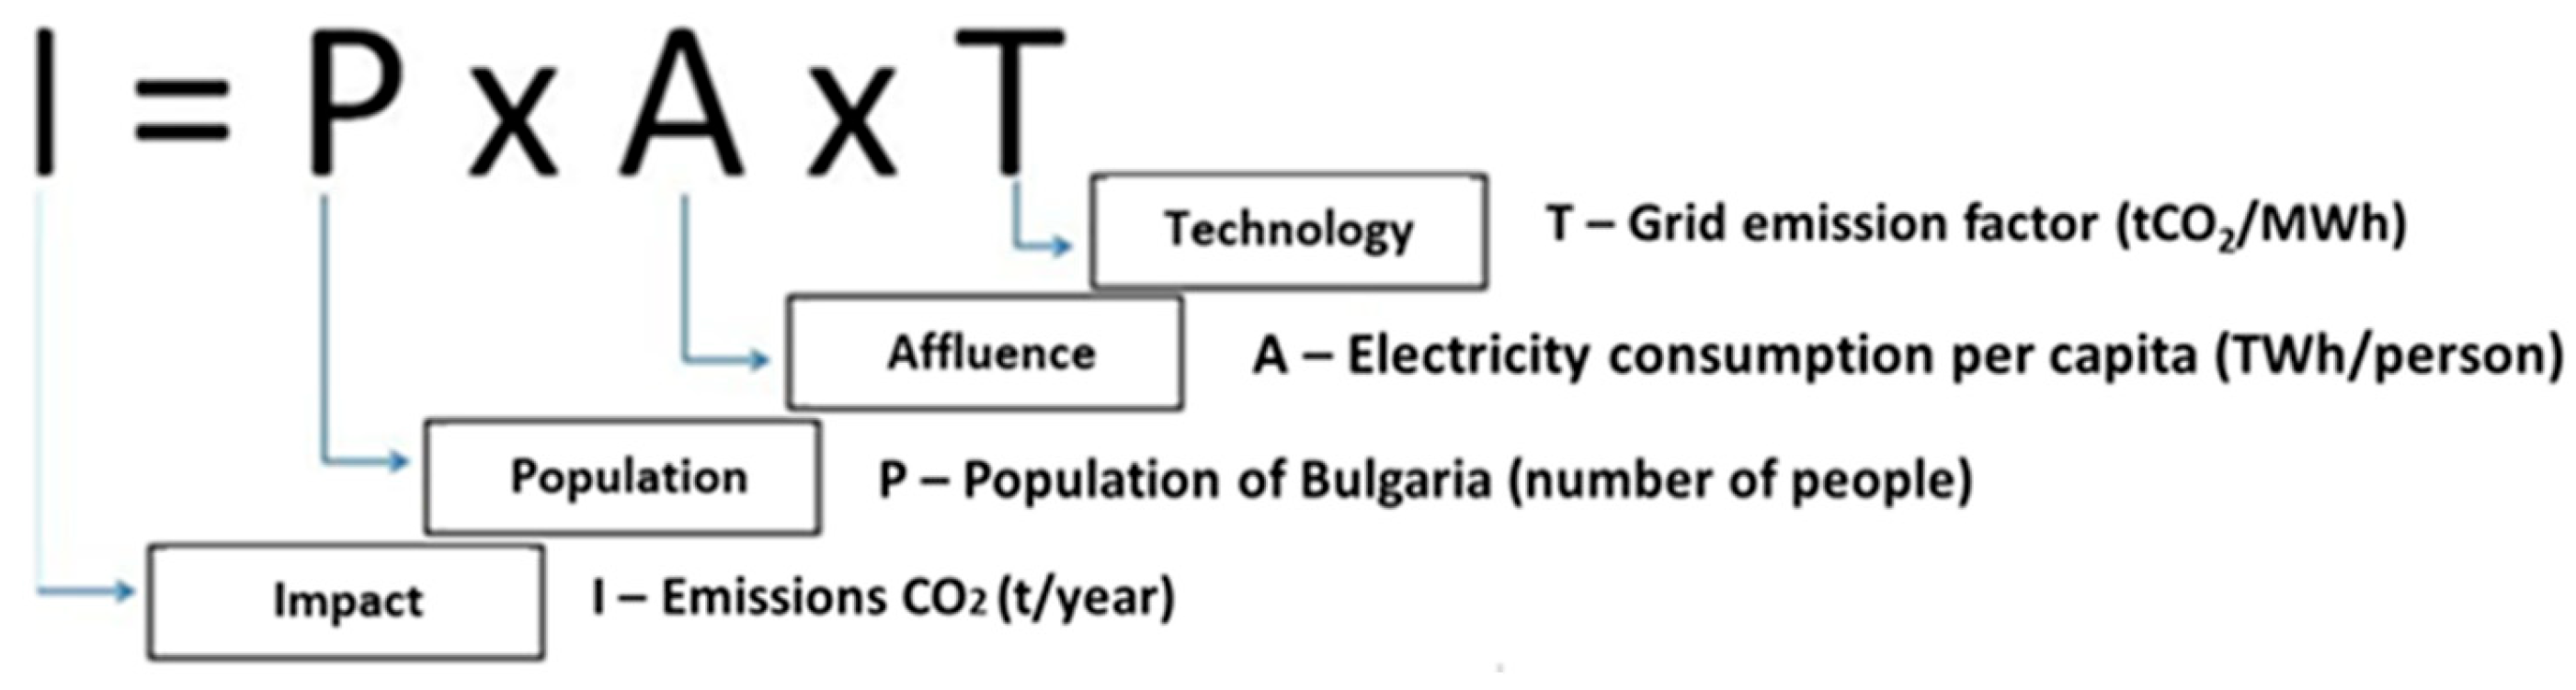
Figure 6.
Statistical and forecasted population of Bulgaria.
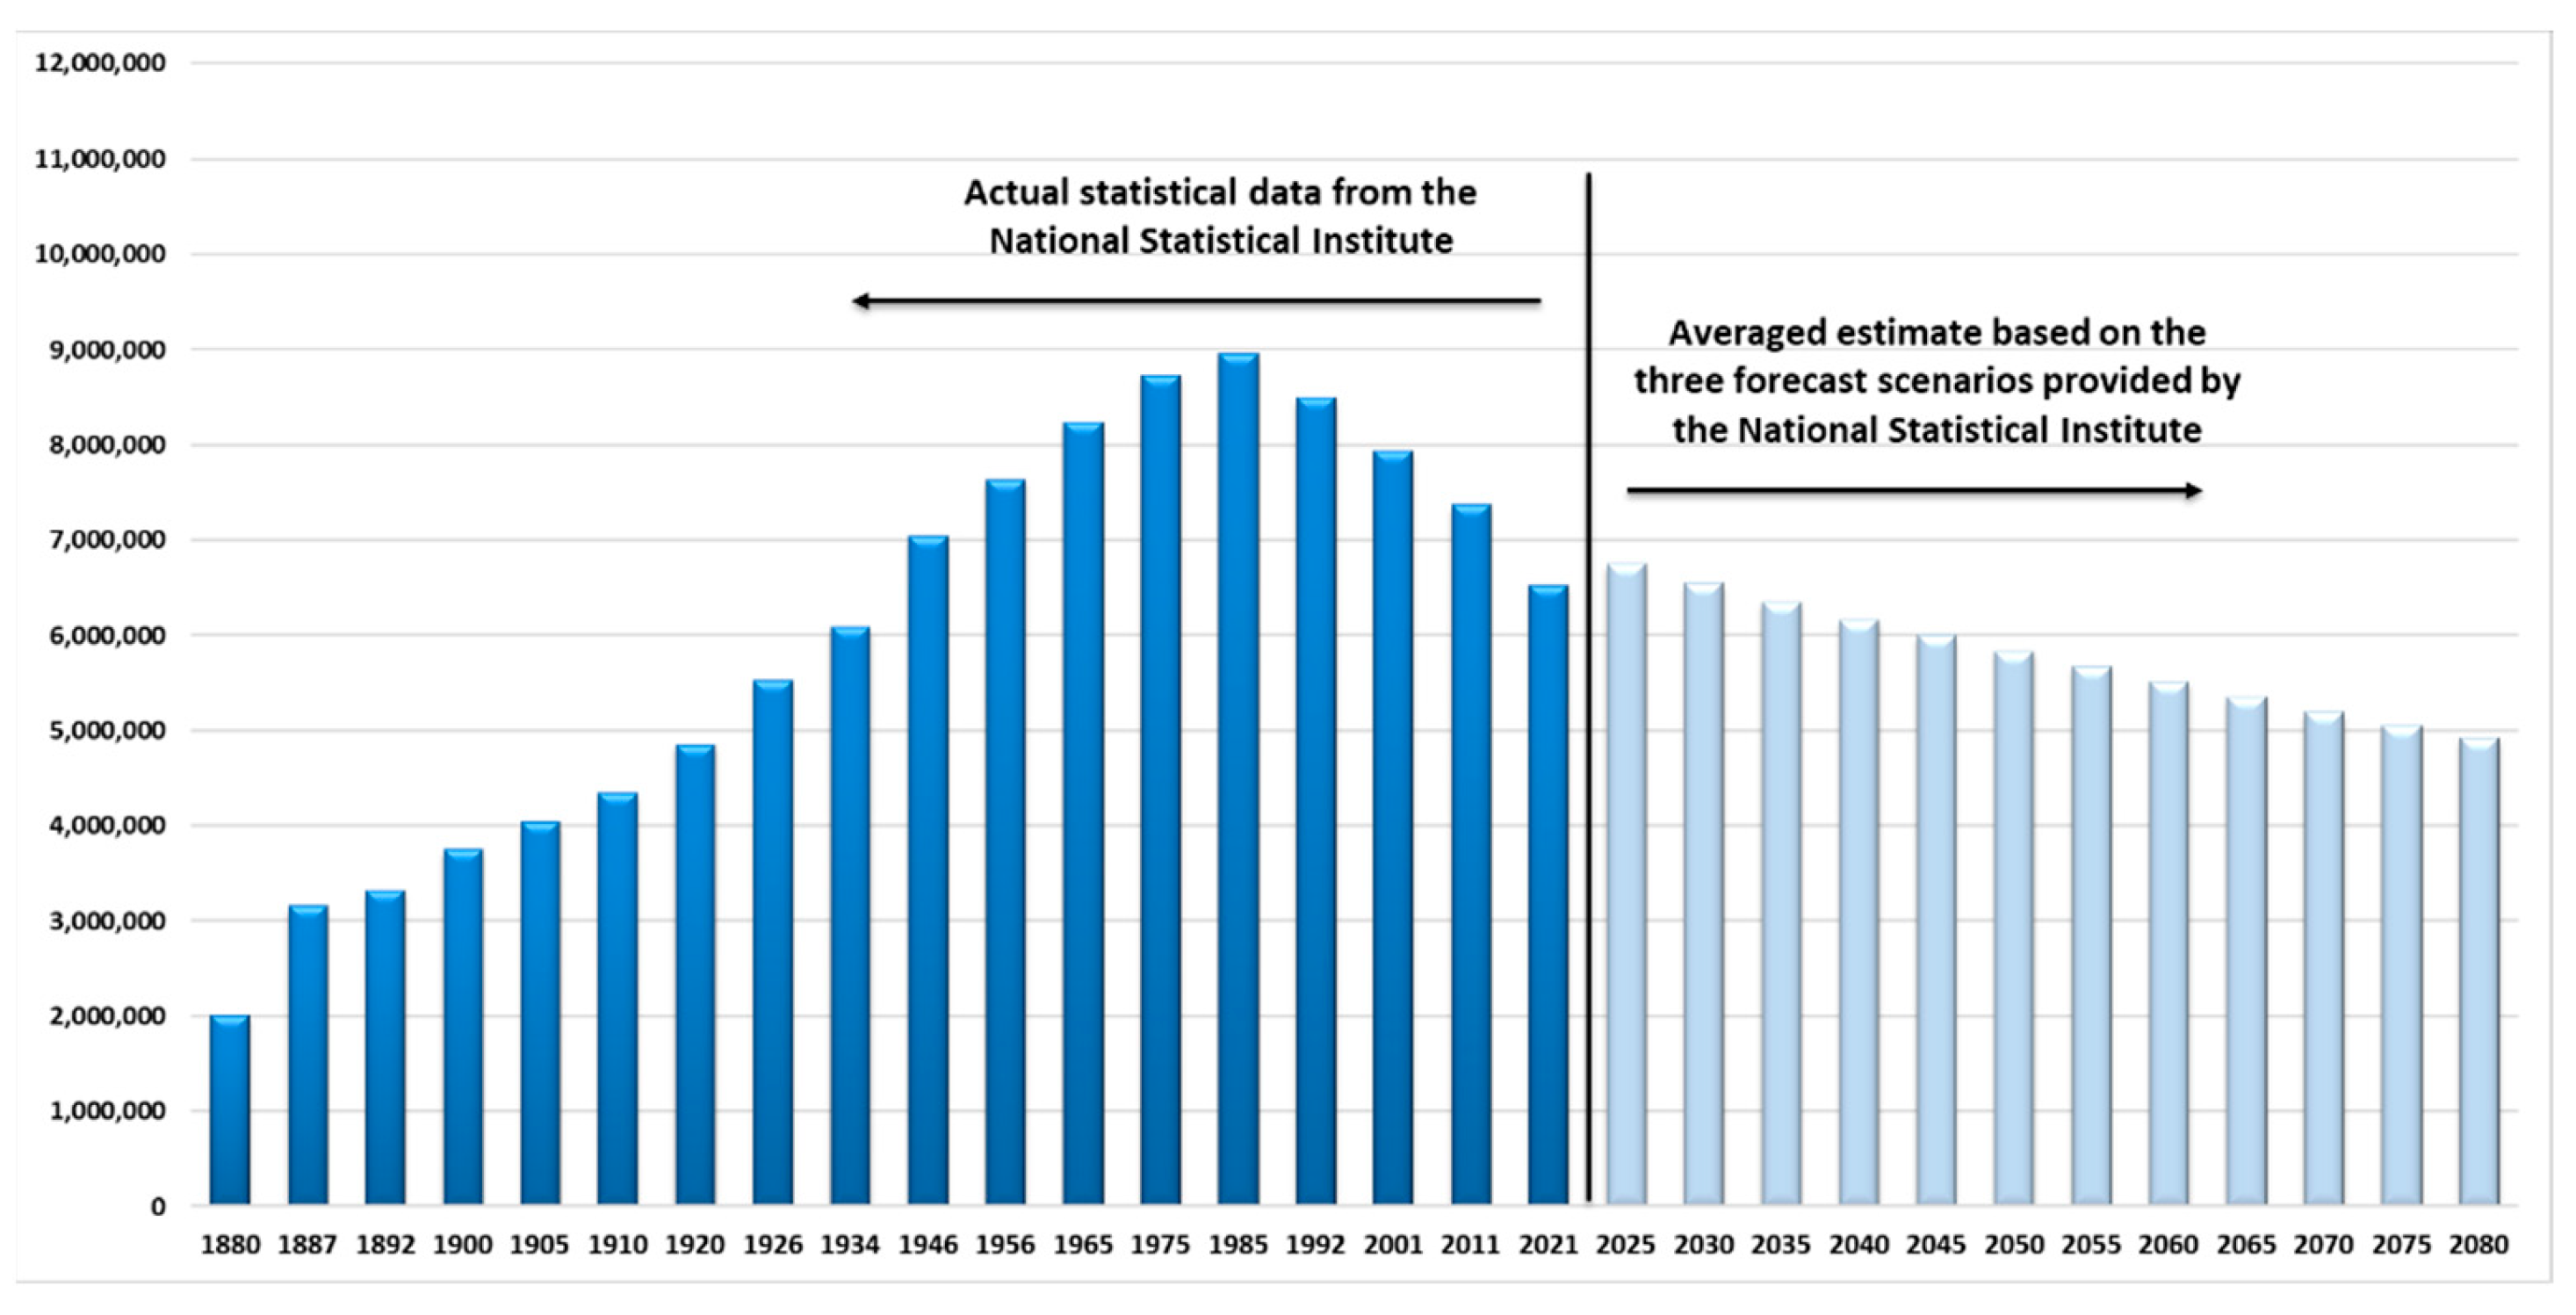
Figure 7.
Estimated gross electricity production (TWh) for the period 2022-2050 according to Electricity System Operator data until 2031 and modeled until 2050.
Figure 7.
Estimated gross electricity production (TWh) for the period 2022-2050 according to Electricity System Operator data until 2031 and modeled until 2050.
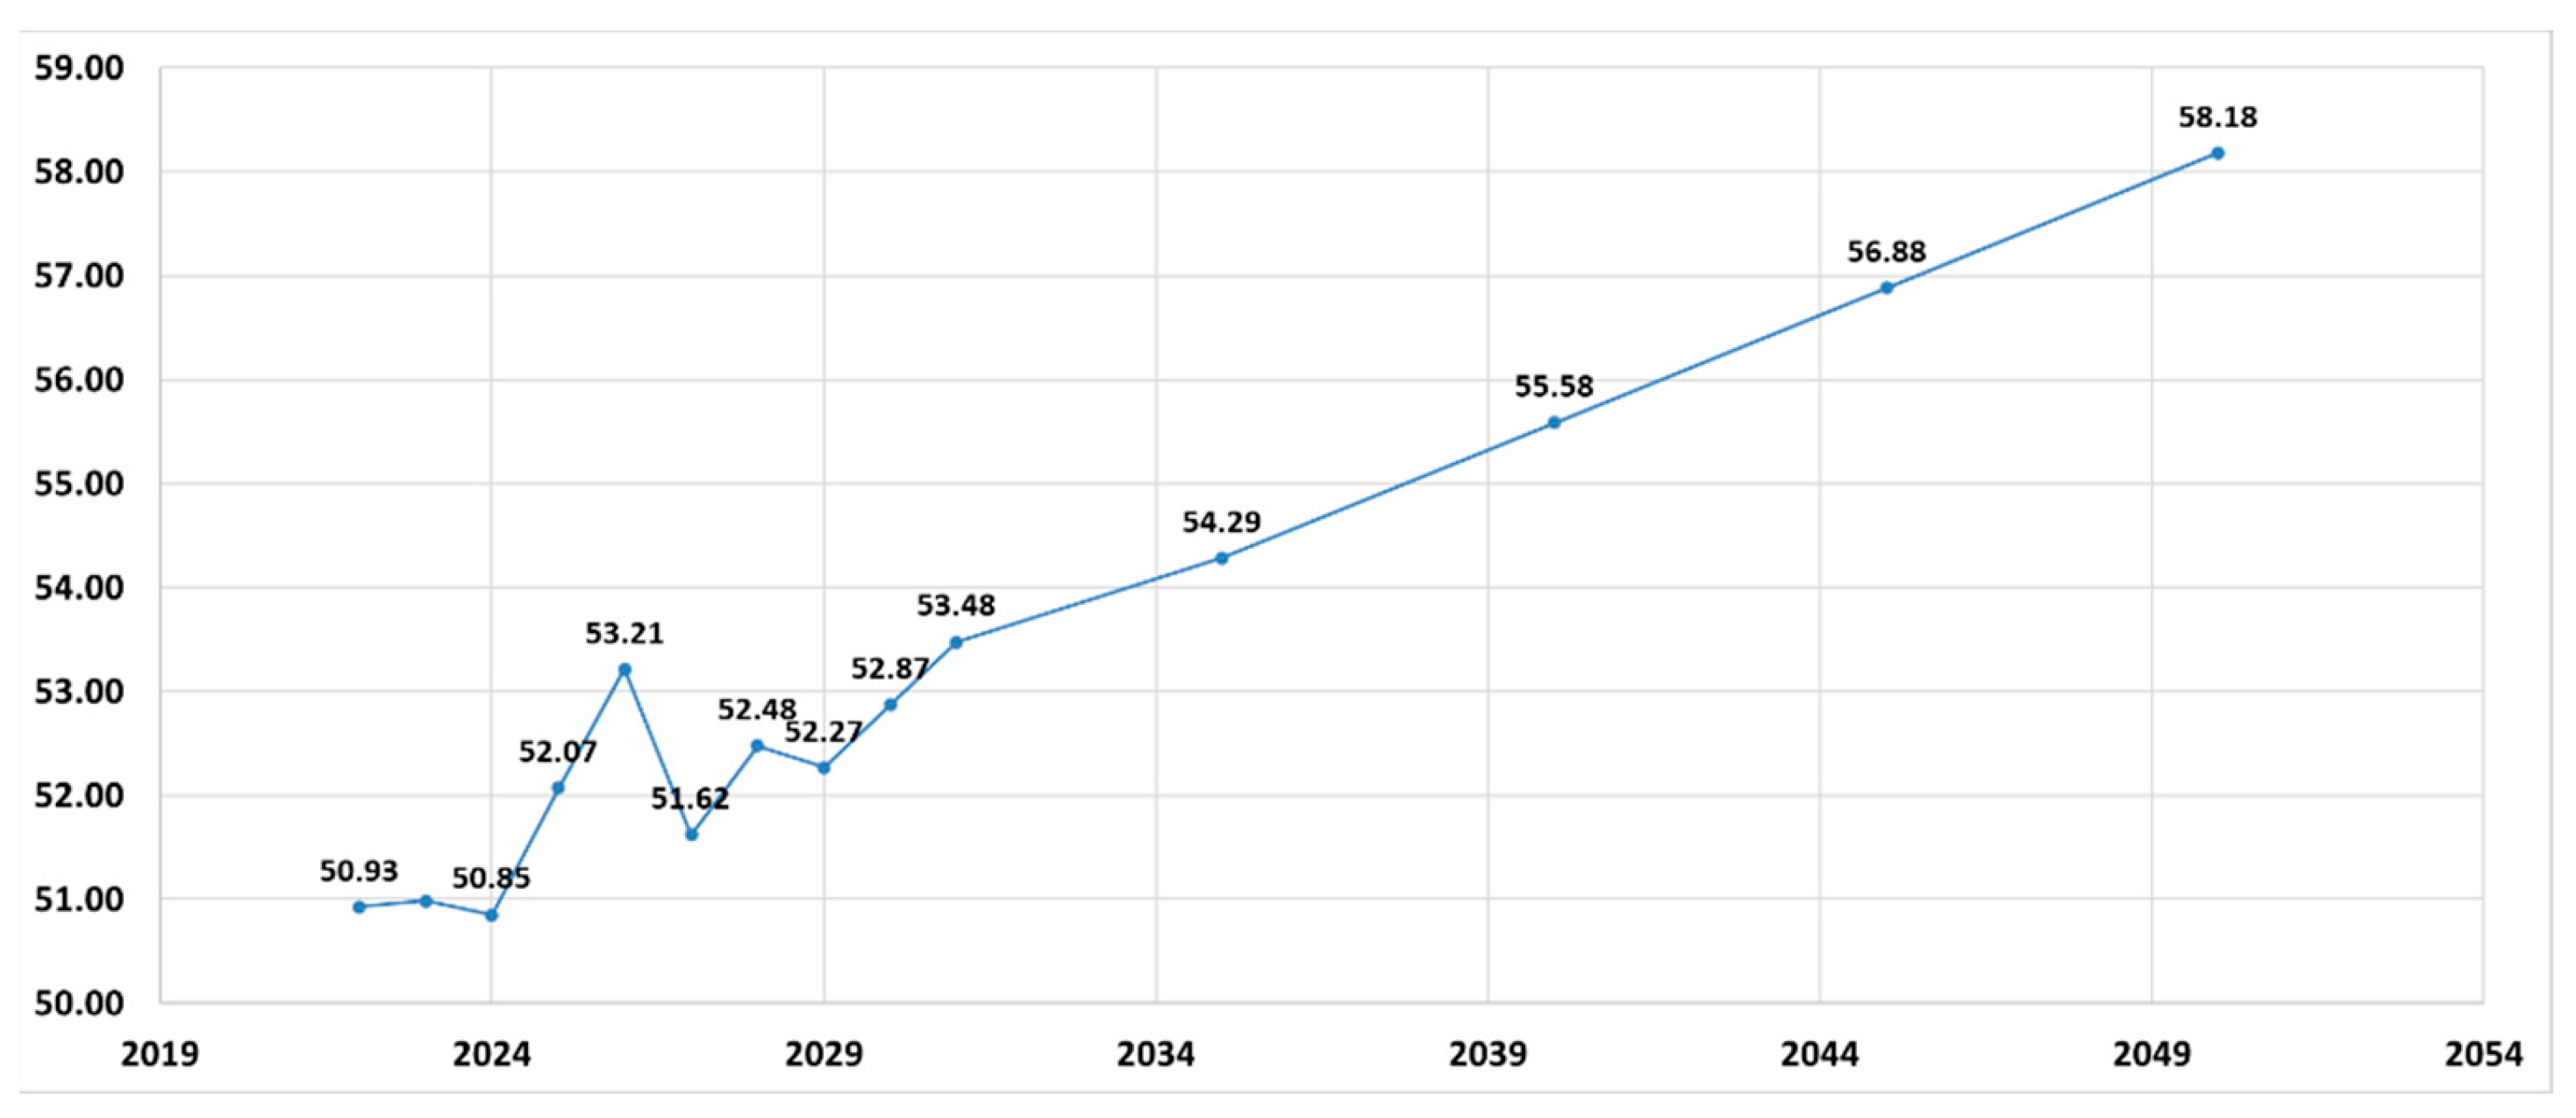
Figure 8.
Estimated growth of the final consumption of electricity according to actual data until 2020, estimated by the Integrated National Energy and Climate Plan of Bulgaria until 2030 and modeled until 2050.
Figure 8.
Estimated growth of the final consumption of electricity according to actual data until 2020, estimated by the Integrated National Energy and Climate Plan of Bulgaria until 2030 and modeled until 2050.
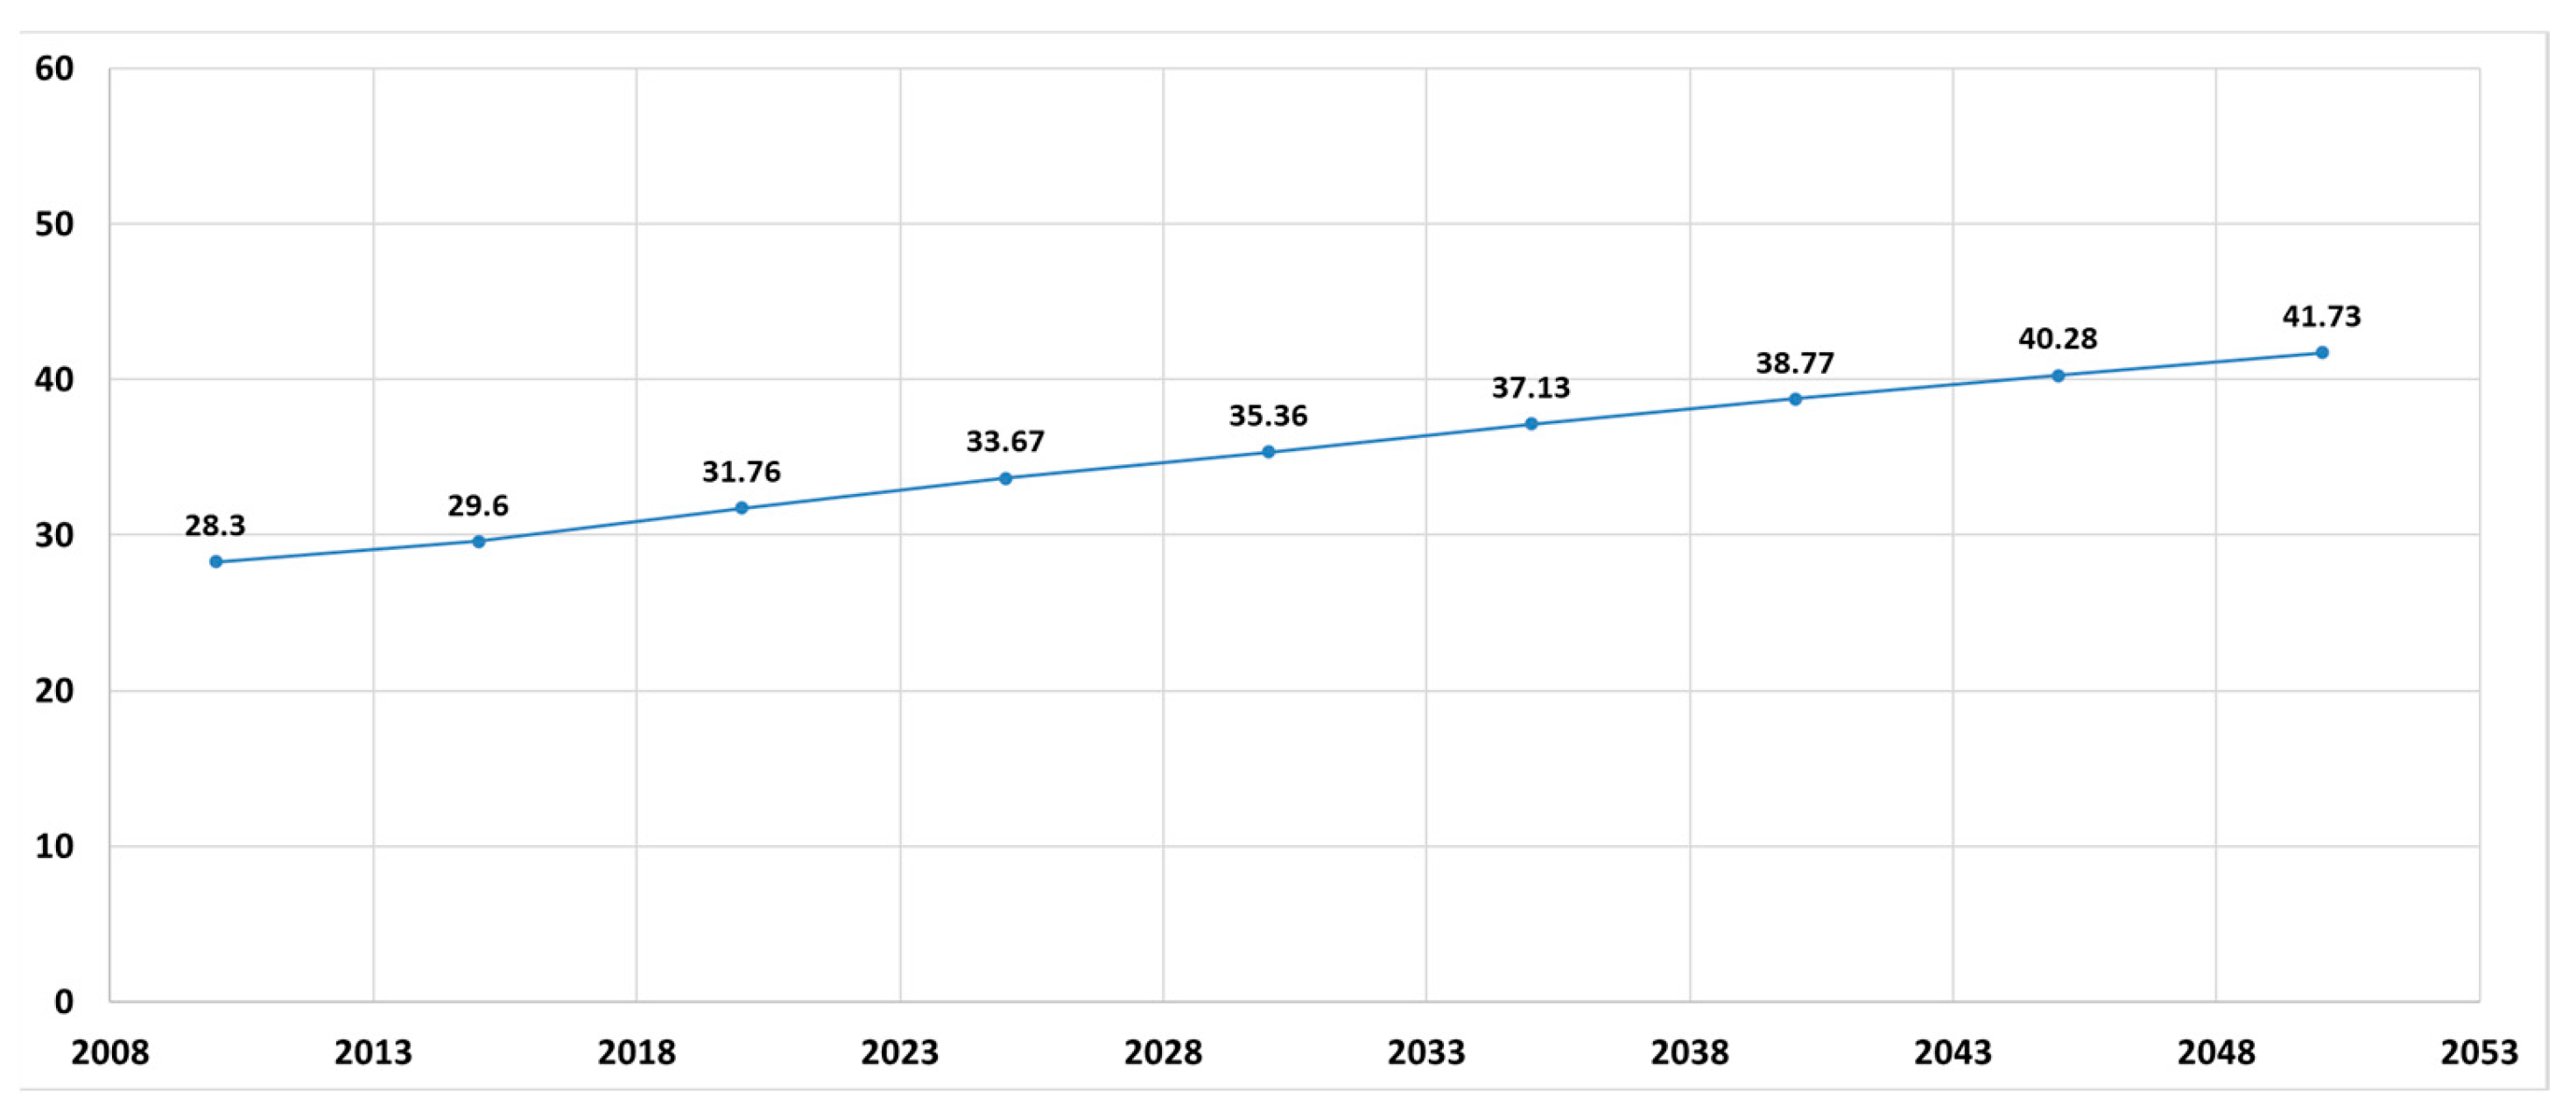
Figure 9.
Comparison of greenhouse gas emissions versus final electricity consumption.
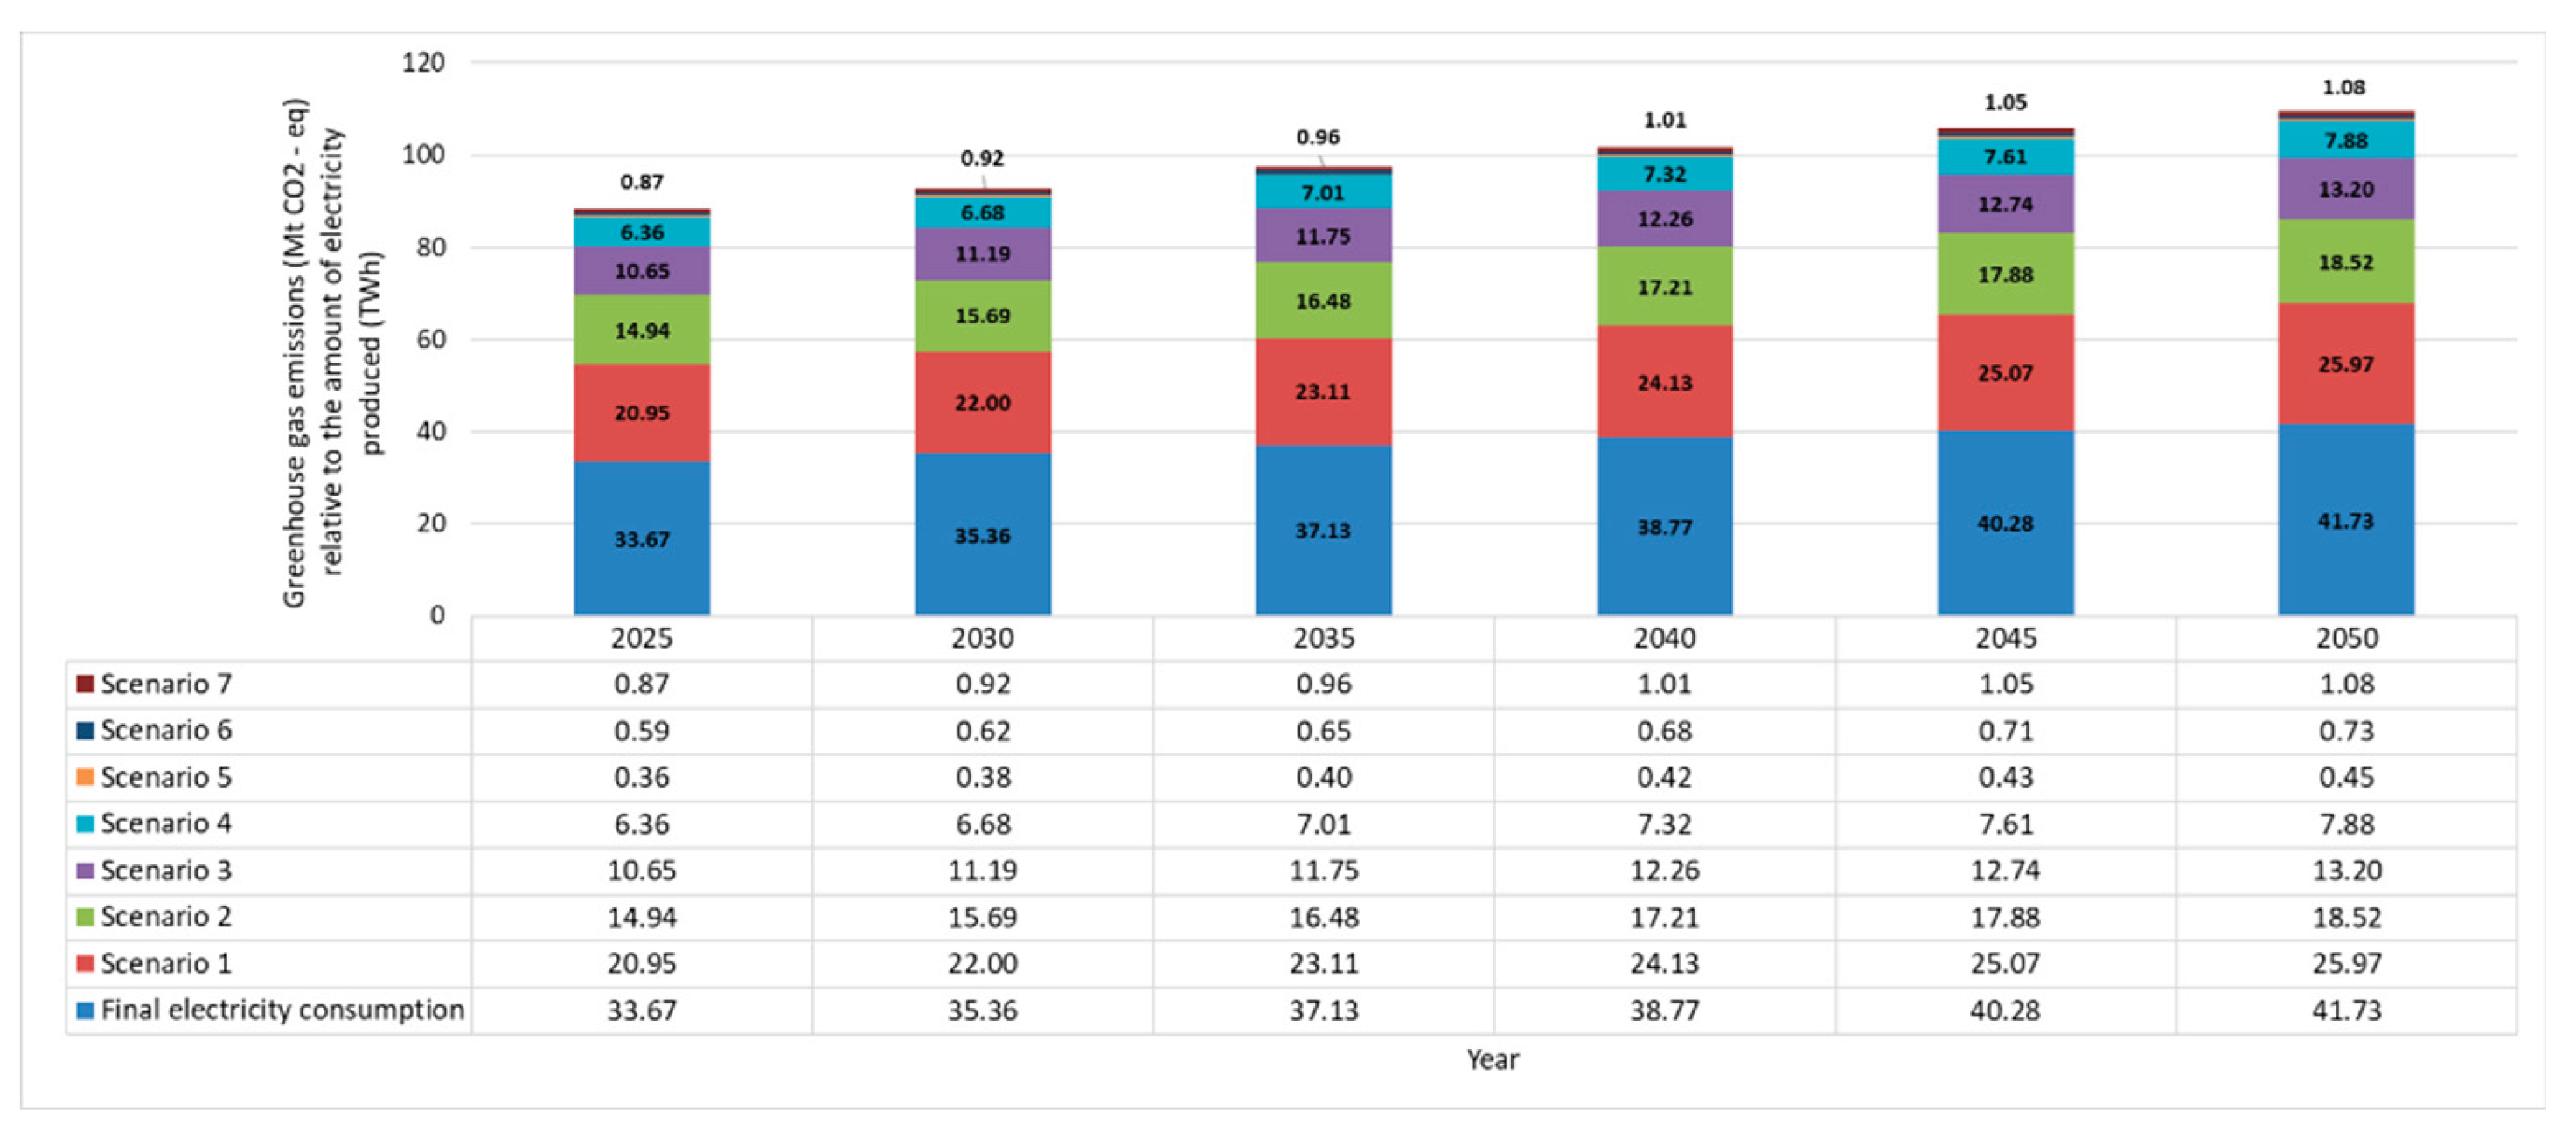

Table 1.
The emission factors of the different types of power plants.
| Emission factor in gCO2/kWh | ||||||
|---|---|---|---|---|---|---|
| TPP | HPSPP | FHPP | NPP | PV | Wind | Hydro |
| 1283 | 531 | 721 | 5 | 37 | 12 | 11 |
Table 2.
Values used for variables in the calculation of environmental impact.
| Year | Final electricity consumption, TWh | Population (P) | Electricity consumption per capita (A), MWh/person | Technology (T), tCO2-eq/MWh |
|---|---|---|---|---|
| 2010 | 28.30 | 7,396,000 | 3.83 | The grid emission factor of the considered scenarios |
| 2015 | 29.60 | 7,178,000 | 4.12 | |
| 2020 | 30.00 | 6,943,999 | 4.32 | |
| 2025 | 33.67 | 6,742,721 | 4.99 | |
| 2030 | 35.36 | 6,541,233 | 5.41 | |
| 2035 | 37.13 | 6,346,422 | 5.85 | |
| 2040 | 38.77 | 6,163,898 | 6.29 | |
| 2045 | 40.28 | 5,993,914 | 6.72 | |
| 2050 | 41.73 | 5,831,730 | 7.16 |
Table 3.
Scenarios (S) for the electricity generation mix.
| Type of power plant |
Share of national electricity production, % | ||||||
|---|---|---|---|---|---|---|---|
| S 1 | S 2 | S 3 | S 4 | S 5 | S 6 | S 7 | |
| TPP | 44 | 30 | 20 | 10 | 0 | 0 | 0 |
| HPSPP | 5.3 | 5.3 | 5.3 | 5.3 | 0 | 0 | 0 |
| FHPP | 3.7 | 3.7 | 3.7 | 3.7 | 0 | 0 | 0 |
| NPP | 36 | 50 | 60 | 70 | 70 | 45 | 0 |
| PV | 4.8 | 4.8 | 4.8 | 4.8 | 14.8 | 34.8 | 59.1 |
| Wind | 2.5 | 2.5 | 2.5 | 2.5 | 7.8 | 12.8 | 26.5 |
| Hydro | 3.7 | 3.7 | 3.7 | 3.7 | 7.4 | 7.4 | 8.4 |
| Biomass | 0 | 0 | 0 | 0 | 0 | 0 | 6 |
| Grid EF, tCO2/MWh | 0.6223 | 0.4439 | 0.3164 | 0.1889 | 0.0108 | 0.0175 | 0.0260 |
Table 4.
I=PAT equation results by years and scenarios.
| Year | Impact of tCO2-eq | ||||||
|---|---|---|---|---|---|---|---|
| S 1 | S 2 | S 3 | S 4 | S 5 | S 6 | S 7 | |
| 2025 | 20,952,287 | 14,943,199 | 10,650,993 | 6,358,787 | 363,469 | 589,880 | 874,366 |
| 2030 | 22,004,662 | 15,693,754 | 11,185,963 | 6,678,172 | 381,725 | 619,508 | 918,283 |
| 2035 | 23,110,294 | 16,482,292 | 11,748,005 | 7,013,718 | 400,905 | 650,635 | 964,422 |
| 2040 | 24,125,023 | 17,205,999 | 12,263,838 | 7,321,678 | 418,508 | 679,203 | 1,006,768 |
| 2045 | 25,070,038 | 17,879,984 | 12,744,232 | 7,608,479 | 434,901 | 705,808 | 1,046,205 |
| 2050 | 25,971,690 | 18,523,044 | 13,202,582 | 7,882,121 | 450,543 | 731,193 | 1,083,832 |
Table 5.
Average annual capacity factors of the types of power plants in Bulgaria.
| Capacity factor in % | |||||||
|---|---|---|---|---|---|---|---|
| TPP | HPSPP | FHPP | NPP | PV | Wind | Hydro | Biomass |
| 48.6 | 46.7 | 34.8 | 94.1 | 14.4 | 23.2 | 18.2 | 44.1 |
Table 6.
Electricity production and GHG from the three largest condensing thermal power plants in Bulgaria.
Table 6.
Electricity production and GHG from the three largest condensing thermal power plants in Bulgaria.
| TPP | Gross electricity production, MWh |
GHG emissions, tCO2/year |
|---|---|---|
| TPP Maritsa East 2 | 9,665,636 | 10,198,045 |
| TPP ContourGlobal Maritsa East 3 | 6,400,018 | 6,752,548 |
| TPP AES-3C Maritsa East 1 | 4,131,370 | 4,358,937 |
| Total | 20,197,024 | 21,309,530 |
Table 7.
Forecasts for reducing greenhouse gas emissions.
| GHG emissions, tCO2-eq/year | 2015 | 2020 | 2025 | 2030 |
|---|---|---|---|---|
| Including LULUCF | 54,656,000 | 53,495,000 | 53,117,000 | 47,553,000 |
| LULUCF | -8,489,000 | -8,641,000 | -8,594,000 | -8,593,000 |
| Excluding LULUCF | 63,145,000 | 62,136,000 | 61,711,000 | 56,146,000 |
| Total emissions from energy sector | 44,574,000 | 44,014,000 | 42,707,000 | 36,500,000 |
Disclaimer/Publisher’s Note: The statements, opinions and data contained in all publications are solely those of the individual author(s) and contributor(s) and not of MDPI and/or the editor(s). MDPI and/or the editor(s) disclaim responsibility for any injury to people or property resulting from any ideas, methods, instructions or products referred to in the content. |
© 2025 by the authors. Licensee MDPI, Basel, Switzerland. This article is an open access article distributed under the terms and conditions of the Creative Commons Attribution (CC BY) license (http://creativecommons.org/licenses/by/4.0/).
Copyright: This open access article is published under a Creative Commons CC BY 4.0 license, which permit the free download, distribution, and reuse, provided that the author and preprint are cited in any reuse.


