
Submitted:
01 July 2025
Posted:
02 July 2025
You are already at the latest version
Abstract
Carbon dots (CDs) derived from renewable biomass are emerging as sustainable alternatives to traditional nanomaterials for applications in bioimaging, sensing, and photonics. In this study, we report a one-step hydrothermal synthesis of photoluminescent CDs from Laurus nobilis leaves particularly spread in the Mediterranean area. The resulting nanoparticles exhibited average diameters of 3–5 nm and high colloidal stability in water. Structural analysis by XRD revealed the presence of amorphous graphitic domains, while FTIR spectroscopy confirmed oxygenated functional groups on the CD surface. Spectrofluorimetric analysis showed excitation-dependent blue–green emission with a maximum at 490 nm that can be applied also as label agents for cells. The environmental sustainability of the synthesis was evaluated through a Life Cycle Assessment (LCA), highlighting that the current impacts are primarily associated with electricity consumption, due to the laboratory-scale nature of the process. These impacts are expected to decrease significantly with future scale-up and process optimization.
Keywords:
c-dots
; Laurus Nobilis
; physico-chemical properties assessment
; Life Cycle Assessment
1. Introduction
Carbon dots (CDs) represent an emerging class of zero-dimensional carbon-based nanomaterials, typically exhibiting lateral dimensions below 10 nm [1]. Their unique combination of tunable photoluminescence, high aqueous dispersibility, outstanding chemical stability, and inherently low cytotoxicity has positioned them at the forefront of advanced applications in bioimaging, fluorescent sensing, photocatalysis, energy storage, and optoelectronic devices. Structurally, CDs are composed of a disordered or partially graphitized carbonaceous core, surrounded by a heterogeneous shell enriched with oxygenated functional groups—such as hydroxyl, carboxyl, and carbonyl moieties—which play a crucial role in modulating surface reactivity, colloidal stability, and emissive behavior. Owing to their remarkable photoluminescence properties, chemical stability, water dispersibility, and low cytotoxicity, CDs are increasingly explored for diverse applications, including bioimaging, fluorescent sensing, catalysis, batteries and optoelectronics [2,3]. Structurally, CDs consist of a disordered graphitic core surrounded by functional groups such as hydroxyl, carboxyl, and carbonyl moieties, which impart surface reactivity and enhance colloidal stability [4]. In addition, the versatility of carbon—an earth-abundant element capable of forming sp, sp², and sp³ hybridized bonds—enables the formation of nanostructures with tunable optoelectronic properties [5]. The photoluminescent behavior of CDs is influenced by a combination of quantum confinement, edge effects, and surface defect states. These properties can be modulated by the synthetic strategy and the nature of the carbon precursor [6]. The development of green synthesis routes is essential to support the large-scale deployment of CDs in environmental and energy applications [7].
In recent years, a major thrust in CD research has shifted toward the development of environmentally benign and cost-effective synthesis routes, in alignment with the principles of green chemistry and circular economy. In this context, the valorization of renewable biomass—particularly agri-food waste streams—has emerged as a compelling alternative to traditional synthetic methods, offering abundant carbon sources naturally enriched in heteroatoms (e.g., N, S, O) and aromatic systems conducive to in situ doping and enhanced carbonization efficiency [8]. These routes drastically reduce the need for toxic reagents or high-temperature treatments typical of bottom-up synthetic methods [9,10,11,12]. Laurus nobilis pruning residues represent an underutilized biomass stream rich in phenolic compounds, lignin, and terpenoids [13]. In this study, we presented a reproducible synthesis of c-dots by one-pot hydrothermal carbonization of biomass, i.e Laurus Nobilis leaves obtaining photoluminescent NPs without the need for external dopants or passivating agents. The resulting CDs exhibited average diameters of 3–5 nm. These nanomaterials were deeply characterized to understand their physico-chemical properties. In addition to the physicochemical characterization, a Life Cycle Assessment (LCA) of the developed synthesis pathway was conducted to assess its environmental performance and investigate the potential advantages and limitations of producing CDs from waste materials on a laboratory scale. The LCA methodology makes it possible to objectively quantify the environmental impacts associated with a product or service, from raw material extraction to final disposal. Particularly in chemistry and emerging technologies, LCA is a crucial tool for comparing the sustainability of new products against those already on the market [14].
However, the analysis of laboratory-scale processes presents significant challenges. As highlighted by Piccinno et al. [15], the use of laboratory-scale data in environmental assessments often leads to an overestimation of impacts when compared to commercially available materials. This discrepancy arises from the fact that industrial processes benefit from optimization and scale effects, which improve material and energy efficiency. Consequently, such comparisons may not accurately reflect the true potential of the newly developed material or process. Performing a scale-up is therefore essential to enable a more realistic and meaningful comparison with existing technologies at the commercial level
2. Materials and Methods
2.1. Synthesis of c-dots
The synthesis of CDs was carried out as follows: Laurus Nobilis leaves provided by the company by Radice Cubica s.rl. were thoroughly washed to remove dust and pollutants. They were then air-dried at room temperature, chopped, and 3 grams were weighed and placed into a glass flask with 20 mL of ultrapure water. The glass flask was then placed in a microwave oven for approximately 3 minutes at maximum power. Afterward, the solution was transferred into centrifuge tubes and centrifuged at 10.000 rpm for 30 minutes. The pellet was collected and dried in an oven at 40 °C for 24 hours to eliminate all organic residues. A graphical representation of the synthesis was shown in Figure 1.
2.2. Characterization of CDs
Transmission electron microscopy (TEM) images were obtained using a HITACHI 7700 transmission electron microscope operating at 120 Kv. The solutions containing NPs were dropped onto a standard carbon supported 600-mesh copper grid. The DLS and ζ-potential acquisitions were recorded by a Zetasizer Nano-ZS, with a HeNe laser (4.0 mW) working at 633 nm detector (ZEN3600, Malvern Instruments Ltd., Malvern, UK), in aqueous solutions (25 °C, pH 7). The NP size statistical distribution was measured on 100 CDs fitted by a normal Gaussian function. UV-vis were recorded using a Shimadzu-2550 with 1 cm quartz cuvettes. The FTIR spectra over a range of 400–4000. cm−1 of the NPs were obtained at a resolution of 4 cm−1 using a Jasco-670 Plus FTIR spectrometer (Jasco, Tokyo, Japan). The photoluminescence measurements have been performed in solutions by exciting the samples with a continuous wave laser diode with a wavelength of 405 nm and a maximum power of 20 mW. The photoluminescence signal has been detected by a Spectral Product SM442 CCD spectrometer with a spectral resolution of 0.6 nm. X-ray diffraction analysis was performed in Bragg–Brentano reflection geometry using filtered Cu-Ka radiation. The X-ray diffraction data were collected at a scanning rate of 0.02 degrees per second in 2θ ranging from 20° to 80° by step scanning.
2.3. Cell Culture
Human breast cancer cells (MCF-7, ATCC HTB-22TM) were cultured in Dulbecco’s Modified Eagle Medium (DMEM) (Sigma Aldrich, Dorset, UK) supplemented with 2 mM L-glutamine, 100U/ml of penicillin–streptomycin (Sigma-Aldrich, Dorset, UK) and 10% (v/v) fetal bovine serum (FBS, Sigma Aldrich, Dorset, UK). The cells were incubated in a humidified controlled atmosphere at 37°C in 5% CO2.
2.4. Confocal Images
Laser scanning confocal microscopy was used on a Zeiss LSM700 (Zeiss) confocal microscope equipped with an Axio Observer Z1(Zeiss) inverted microscope using ×100, 1.46 numerical aperture oil immersion lens for imaging. Confocal data were processed using ZEN2010 software (Zeiss). Prior to confocal analysis, 6.2 x 10⁴ MCF-7 cells/petri were seeded in 50 x 7 mm glass petri dishes (WillCo Wells B.V., 1054SE Amsterdam). After 24 h the cells were incubated with c-dots (1 μg/mL) for 24 h. Then, the cells were washed with PBS (Sigma-Aldrich, Dorset, UK), fixed with 0.25% glutaraldehyde (Sigma-Aldrich, Dorset, UK) for 20 min at room temperature and permeabilized with 0.1% Triton X (Sigma-Aldrich, Dorset, UK) for 5 min. the images were acquired by using an ATTO 488 laser.
2.5. Life Cycle Assessment (LCA)
To assess the environmental impact of the CDs produced from Laurus nobilis leaves, an LCA study was carried out using the SimaPro 10.2 Software [16]. The analysis uses the production of 1 kg of CDs as the functional unit, and the system boundaries follow a "cradle-to-gate" approach. This means that all life cycle stages, from raw material supply to the point where the final product leaves the production site, are included. The latter stages, such as application (e.g., in electrodes), use phase and end-of-life, are not considered. Transport phases are also excluded, assuming the raw material comes from local sources, and to keep the focus on the production process.
Environmental impacts were assessed using the ReCiPe 2016 Endpoint (H) method, which evaluates damage at the endpoint level. This helps to interpret the results by grouping them into three main areas of protection: human health, ecosystem, and resource. The impact categories analysed include climate change, human toxicity, fossil resource depletion, terrestrial ecotoxicity, and land use. These categories were selected because they are particularly relevant to the life cycle of the studied system.
The study is based on data representative of the Italian context in 2025.
2.5.1. Life Cycle Inventory (LCI)
The data used in the study include both primary and secondary data depending on the stage of analysis considered. The laurel leaves used in this study come from the essential oil extraction chain. After the steam distillation process, they are no longer suitable for food consumption and must therefore be disposed of. Since this is a waste with no economic value, and in accordance with the recommendations of ISO 14044, which recommends avoiding allocation procedures [17], these leaves were included in the system under study with zero environmental load.
A critical aspect in laboratory-scale LCA analysis concerns the correct quantification of energy consumption of the instrumentation used. Since small quantities of material are often processed, attributing total energy consumption to them can lead to a significant overestimation of impact. For this reason, a weighted energy allocation criterion was adopted, assuming that the instrumentation is filled and distributing consumption over the entire theoretical capacity per cycle. This approach provides more realistic energy estimates, facilitating more reliable comparisons.
2.5.2. Microwaves Oven
To calculate the energy consumption associated with microwave use, it was assumed that 6 test tubes with a maximum capacity of 85 ml were placed inside, corresponding to the maximum capacity of the centrifuge that is used next. Each test tube was assumed to contain 6g of leaves and 40 ml of water (corresponding to 2 times the doses used in experimentation), for a total of about 46 g of solution per tube (versus the original 23). The total amount processed per cycle is 276 g.
The total energy consumption, calculated as the product of power and operating time was 0.035 kWh. By dividing the energy value obtained by the total mass processed, a specific energy consumption of about 0.000127 kWh per gram of solution is obtained. Finally, relating this data to the actual reference quantity, consisting of 3 g of leaves and 20 ml of water (23 g), we estimate an energy consumption of about 0.00292 kWh.
2.5.3. Centrifugation Process
For the centrifugation process, on the other hand, it was more complicated, since the centrifuge was operated at less than the maximum number of revolutions per minute, calculating power consumption considering the rated power would have been an overestimate. Therefore, the power consumption was estimated based on the number of revolutions per minute.
The centrifuge was operated at 10000 rpm for 30 minutes. To estimate the power absorbed by the centrifuge during operation at 10000 rpm, the cubic law was applied, according to which the power required by a centrifugal load varies proportionally to the cube of the speed (P ∝ rpm³). Assuming a power of 2.5 kW (208 V, 12 A) at 30,000 rpm, the theoretical power related to rotation at 10,000 rpm alone results:
However, for a more realistic estimate of power consumption, it is also necessary to consider a base power, independent of rotational speed, attributable to the electronic, control and cooling systems. This has been estimated at 10% of the rated power, or 250 W. Therefore, the total estimated power at 10000 rpm is:
Ptot = P base + P rot = 250 W + 92,6 W = 342,6 W
Considering then these powers, the consumption is 0.1713 kWh. This was then allocated by assuming to totally fill the centrifuge with 6 tubes of 46 g of solution each, for a total solution mass of 276 g and a consumption per unit mass of 0.000621 kWh/g. For the experimental unit mass of 23 g, the consumption is therefore 0.0142 kWh.
2.5.4. Oven
The nominal power rating of the oven is 1.2 kW, but by operating at much lower temperatures than the maximum power rating, the actual energy consumption is lower.
Assuming that the oven power is proportional to the operating temperature, and considering a maximum temperature of 230 °C, the estimated power at 40 °C is 0.21 kW.
The oven has a volumetric capacity of 56 liters, so 108 tubes per cycle (arranged in 3 levels of 36 tubes respectively), each containing 6 g of leaves and 40 ml of water, were considered to fill it. The total amount treated in one cycle is therefore about 4.968 kg. Specific energy consumption was calculated by dividing the total energy consumption by the total mass treated, yielding a value of about 0,00101 kWh/g of treated solution. For 23 g, an energy consumption of about 0.0232 kWh is obtained.
These integrated estimates represent a reasonable compromise, providing greater transparency and repeatability in the context of a laboratory-scale LCA evaluation.
Input and output data are shown in Table 1.
3. Results and Discussion
The TEM image showed nearly spherical, well-dispersed nanoparticles with high density. The uniform contrast suggests a homogeneous carbon core; the 100 nm scale bar indicated individual diameters of only a few nanometers. The absence of aggregation highlights good colloidal stability, likely due to hydrophilic surface functional groups on the CDs (Figure 2a). The histogram showed a population centered around ~4 nm with a relatively narrow size spread (ranging from 2 to 6 nm); the red Gaussian fit aligned well with the data, confirming a quasi-monodisperse distribution and a low polydispersity index (Figure 2b). Such small sizes were typical of CDs synthesized via bottom-up approaches and were favorable for both quantum fluorescence and interactions with polymeric or biological systems. In Figure 2c was reported the absorbance spectrum depicted an intense peak at 270–280 nm attributed to π→π* transitions of aromatic/sp² domains in the CD core; the shoulder around ~220 nm corresponded to n→π* transitions (C=O). The low absorbance above 400 nm, with a slight tail, indicated surface states or defects with a narrow bandgap, contributing to visible emission. The solid line represents the freshly prepared CDs, while the dashed line showed the UV–Vis spectrum after 96 hours. The minimal shift and retention of peak intensity suggest excellent temporal stability, with the CDs maintaining their optical properties over time. In the FTIR spectra (Figure 2c), several peaks were observed. In particular, a broad OH/NH stretching band appeared at 3400–3200 cm⁻¹, indicating the presence of hydroxyl and amine groups. These functionalities likely derive from polyphenols, flavonoids, tannins, and amino acids naturally present in the Laurus nobilis extract.
They are responsible for the high hydrophilicity of the carbon dots (CDs) and favor good water dispersibility. Aliphatic CH₂ stretching bands, originating from residual organic precursors, were visible at 2920 and 2850 cm⁻¹ . This indicated that some aliphatic chains from the biomass precursors were retained in the final structure. Peaks in the 1650–1550 cm⁻¹ range corresponded to C=O/C=C and C–N stretching vibrations, suggesting the presence of amide bonds or conjugated graphitic domains probably formed through reactions between amines and carbonyls from proteins, sugars, or other natural biomolecules in the extract. The C–N stretching band at 1380 cm⁻¹ further confirmed the presence of amine functionalities. Finally, signals in the 1100–1000 cm⁻¹ range were attributed to C–O–C vibrations, typical of oxidized epoxide or ether groups.⁻¹. The last signals indicated a certain degree of oxidation of the precursor molecules, contributing to reactive surface functionalities suitable for further chemical modification.
DLS measurements on c-dots in water confirmed the TEM data and showed NPs with a hydrodynamic radius of (3 ± 3) nm A negative surface charge was observed (-30 ± 3) mV and (−30 ± 5) mV indicated a good colloidal stability. (Table 2)
The optical and structural characterization of the synthesized c-dots confirmed their successful formation and reveals features consistent with amorphous, fluorescent carbon-based nanomaterials. As shown in Figure 3a, the fluorescence emission spectrum displays a broad and intense peak centered around 510 nm when excited under UV light (laser 405 nm, 20 mW power), indicating strong visible-range photoluminescence. The observed emission profile, with its wide full width at half maximum (FWHM), was indicative of a heterogeneous distribution of emissive sites or surface states, which is a common characteristic of c-dots derived from green or biomass-based precursors [17,18]. The visual confirmation of this luminescence was provided by the inset photographs, where the aqueous c-dots suspension exhibited a pale-yellow color under ambient light and a bright blue-green fluorescence under UV illumination (365 nm) [19]. This behavior confirmed the effective incorporation of optically active functional groups or passivating agents on the surface of the CDs. To evaluate their potential as fluorescent agents, we incubated breast cancer cells (MCF-7) with the nanoparticles at a concentration of 1 μg/mL for 24 hours. As shown in Figure 3b, the labeled cells exhibited a markedly higher fluorescence compared to the control group, clearly indicating their promising applicability in nanomedicine. Complementary structural analysis was conducted via X-ray diffraction (XRD) (Figure 3b). The diffraction pattern reveals a broad, featureless peak centered around 22° in 2θ, corresponding to the (002) plane of graphitic carbon. The absence of sharp crystalline peaks confirmed the predominantly amorphous nature of the synthesized CDs. This carbon structure was typically observed in nanocarbons produced under mild hydrothermal or microwave-assisted conditions, particularly when using natural precursors. The combination of strong photoluminescence and amorphous structural characteristics was in line with previously reported CDs and supports their potential application in fields such as fluorescence imaging, biosensing, and optoelectronics.
3.1. Life Cycle Impact Assessment (LCIA)
The environmental impacts are presented in Figure 4, aggregated into the three endpoint categories: Human Health, Ecosystem, and Resources. The results show that the largest impact is attributable to energy consumption. For human health, it accounts for about 90% of the total impact, with tap and ultrapure water contributing an additional 10%. In the ecosystem area, electricity remains the main source of impact, though wastewater treatment provides a small environmental credit. Resource depletion is almost entirely driven by electricity, with negligible input from ultrapure water.
However, these results should not be interpreted as indicative of the unsustainability of the process, as they largely reflect the operating conditions of a system still confined to the laboratory scale. Although normalization criteria have been adopted to account for this limitation, it is reasonable to assume that moving to a pilot scale, and subsequently to industrial production, may result in substantial optimization of energy efficiency, with a consequent reduction in associated environmental impacts. For this reason, future LCA studies on larger-scale systems will be important to improve impact estimates and allow fair comparisons with similar commercial products. Until the process becomes more technologically mature, direct comparisons with existing market alternatives would be premature and possibly misleading.
4. Conclusions
In this study, we successfully demonstrated the green synthesis of carbon dots (CDs) from Laurus nobilis leaves via a one-step hydrothermal method, yielding photoluminescent nanoparticles with average diameters of 3–5 nm and excellent colloidal stability in aqueous media. Structural and spectroscopic analyses confirmed the presence of amorphous graphitic domains and surface oxygenated functional groups, which contribute to the observed excitation-dependent blue–green fluorescence. These features render the obtained CDs promising candidates for bioimaging and sensing applications, without the need for additional passivating or doping agents. Importantly, we integrated a Life Cycle Assessment (LCA) to preliminarily evaluate the environmental sustainability of the proposed synthetic route. Although current environmental impacts are mainly attributed to electricity consumption typical of laboratory-scale operations, the analysis suggests that these impacts could be significantly reduced through process scale-up and optimization. This work not only underlines the potential of agri-food residues, such as Laurus nobilis pruning waste, as valuable carbon sources for nanomaterial synthesis, but also emphasizes the importance of embedding sustainability assessments early in the development of novel materials. Overall, the combination of renewable biomass valorisation, straightforward synthesis, and integration of environmental evaluation frameworks positions this approach as a promising step toward the scalable and sustainable production of carbon-based nanomaterials for future technological applications
Acknowledgements
Project “BOtanical REsources for ALternative battEries” (acronym “BO.RE.AL.E.”), within the framework of the PNRR (National Recovery and Resilience Plan), Mission 4 “Education and Research” – Component 2 “From Research to Business” – Investment Line 1.4 “Enhancement of research infrastructures and creation of national R&D champions in key enabling technologies” – Research and Development Program “National Research Centre for Agricultural Technologies - AGRITECH”, CN 00000022 – SPOKE 8 – CUP: J73C24000260003.
Conflicts of Interest
The authors declare no conflict of interest
References
- Mkhari, O.; Ntuli, T.D.; Coville, N.J.; Nxumalo, E.N.; Maubane-Nkadimeng, M.S. Supported carbon-dots: A review. J. Lumin. 2023, 255, 119552. [Google Scholar] [CrossRef]
- Tavan, M.; Yousefian, Z.; Bakhtiar, Z.; Rahmandoust, M.; Mirjalili, M.H. Carbon quantum dots: Multifunctional fluorescent nanomaterials for sustainable advances in biomedicine and agriculture. Ind. Crops Prod. 2025, 231, 121207. [Google Scholar] [CrossRef]
- Pandit, S.; Ranjan, N.; Verma, R.; Sharma, K.; Tomar, R.; Hamzah, F.M. Exploring the multifunctionality of carbon dots: Advances in synthesis, properties, and applications. Curr. Appl. Phys. 2025, 71, 106–119. [Google Scholar] [CrossRef]
- Ding, H.; Li, X.H.; Chen, X.B.; Wei, J.S.; Li, X.B.; Xiong, H.M. Surface states of carbon dots and their influences on luminescence. J. Appl. Phys. 2020, 127. [Google Scholar] [CrossRef]
- Zhang, Y.Y.; Chen, S.; Xiang, H.; Gong, X.G. Hybrid crystalline sp23 carbon as a high-efficiency solar cell absorber. Carbon N. Y. 2016, 109, 246–252. [Google Scholar] [CrossRef]
- Qureshi, Z.A.; Dabash, H.; Ponnamma, D.; Abbas, M.K.G. Carbon dots as versatile nanomaterials in sensing and imaging: Efficiency and beyond. Heliyon 2024, 10, e31634. [Google Scholar] [CrossRef] [PubMed]
- Varma, R.S. Biomass-Derived Renewable Carbonaceous Materials for Sustainable Chemical and Environmental Applications. ACS Sustain. Chem. Eng. 2019, 7, 6458–6470. [Google Scholar] [CrossRef]
- Aksu, M.; Güzdemir, Ö. Food Waste-Derived Carbon Quantum Dots and Their Applications in Food Technology: A Critical Review. Food Bioprocess Technol. 2025. [Google Scholar] [CrossRef]
- De Matteis V, Rizzello L, Di Bello MP, R. R. One-step synthesis, toxicity assessment and degradation in tumoral pH environment of SiO2@Ag core/shell nanoparticles. J. Nanoparticle Res. 2017, 19, 14. [Google Scholar] [CrossRef]
- Lvov, Y.; Abdullayev, E. Functional polymer–clay nanotube composites with sustained release of chemical agents. Prog. Polym. Sci. 2013, 38, 1690–1719. [Google Scholar] [CrossRef]
- Adeyemi, J.O.; Oriola, A.O.; Onwudiwe, D.C.; Oyedeji, A.O. Plant Extracts Mediated Metal-Based Nanoparticles: Synthesis and Biological Applications. Biomolecules 2022, 12. [Google Scholar] [CrossRef] [PubMed]
- De Matteis, V.; Rizzello, L.; Ingrosso, C.; Rinaldi, R. Purification of olive mill wastewater through noble metal nanoparticle synthesis: waste safe disposal and nanomaterial impact on healthy hepatic cell mitochondria. Environ. Sci. Pollut. Res. 2021, 28, 26154–26171. [Google Scholar] [CrossRef] [PubMed]
- Awada, F.; Hamade, K.; Kassir, M.; Hammoud, Z.; Mesnard, F.; Rammal, H.; Fliniaux, O. Laurus nobilis Leaves and Fruits: A Review of Metabolite Composition and Interest in Human Health. Appl. Sci. 2023, 13. [Google Scholar] [CrossRef]
- Liu, M.; Zhu, G.; Tian, Y. The historical evolution and research trends of life cycle assessment. Green Carbon 2024, 2, 425–437. [Google Scholar] [CrossRef]
- Piccinno, F.; Hischier, R.; Seeger, S.; Som, C. From laboratory to industrial scale: a scale-up framework for chemical processes in life cycle assessment studies. J. Clean. Prod. 2016, Volume 135, Pages 1085-1097.
- SimaPro 10.2, PRé Sustainability, Stationsplein 121, 3818. Amersfoort, The Netherlands.
- I SO 14044:2006. Environmental management - Life cycle assessment - Requirements and guidelines. International Organization for Standardization, Geneva.
- Sharma, A.; Das, J. Small molecules derived carbon dots: Synthesis and applications in sensing, catalysis, imaging, and biomedicine. J. Nanobiotechnology 2019, 17, 1–24. [Google Scholar] [CrossRef] [PubMed]
- Principles of Fluorescence Spectroscopy; Joseph R. Lakowicz, Ed.; Springer New York, NY, 2007; ISBN 978-0-387-46312-4.
Figure 1.
Schematic representation of CDs synthetic route.
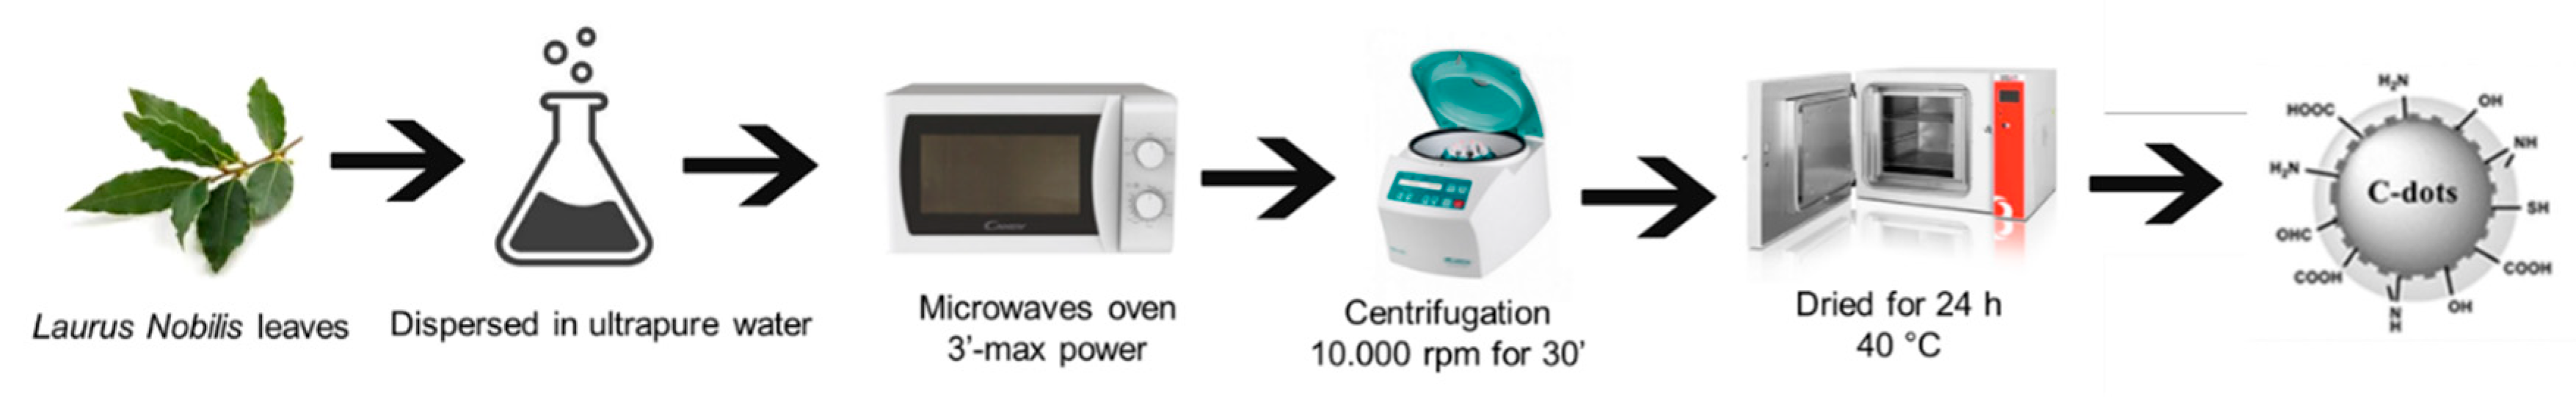
Figure 2.
Representative TEM images of c-dots (a) and (b) statistical analysis with Gaussian fit (black line) c. UV-vis of c-dots immediately after synthesis (black line) and after one week ( dashed line); (d) and FTIR measurements.
Figure 2.
Representative TEM images of c-dots (a) and (b) statistical analysis with Gaussian fit (black line) c. UV-vis of c-dots immediately after synthesis (black line) and after one week ( dashed line); (d) and FTIR measurements.
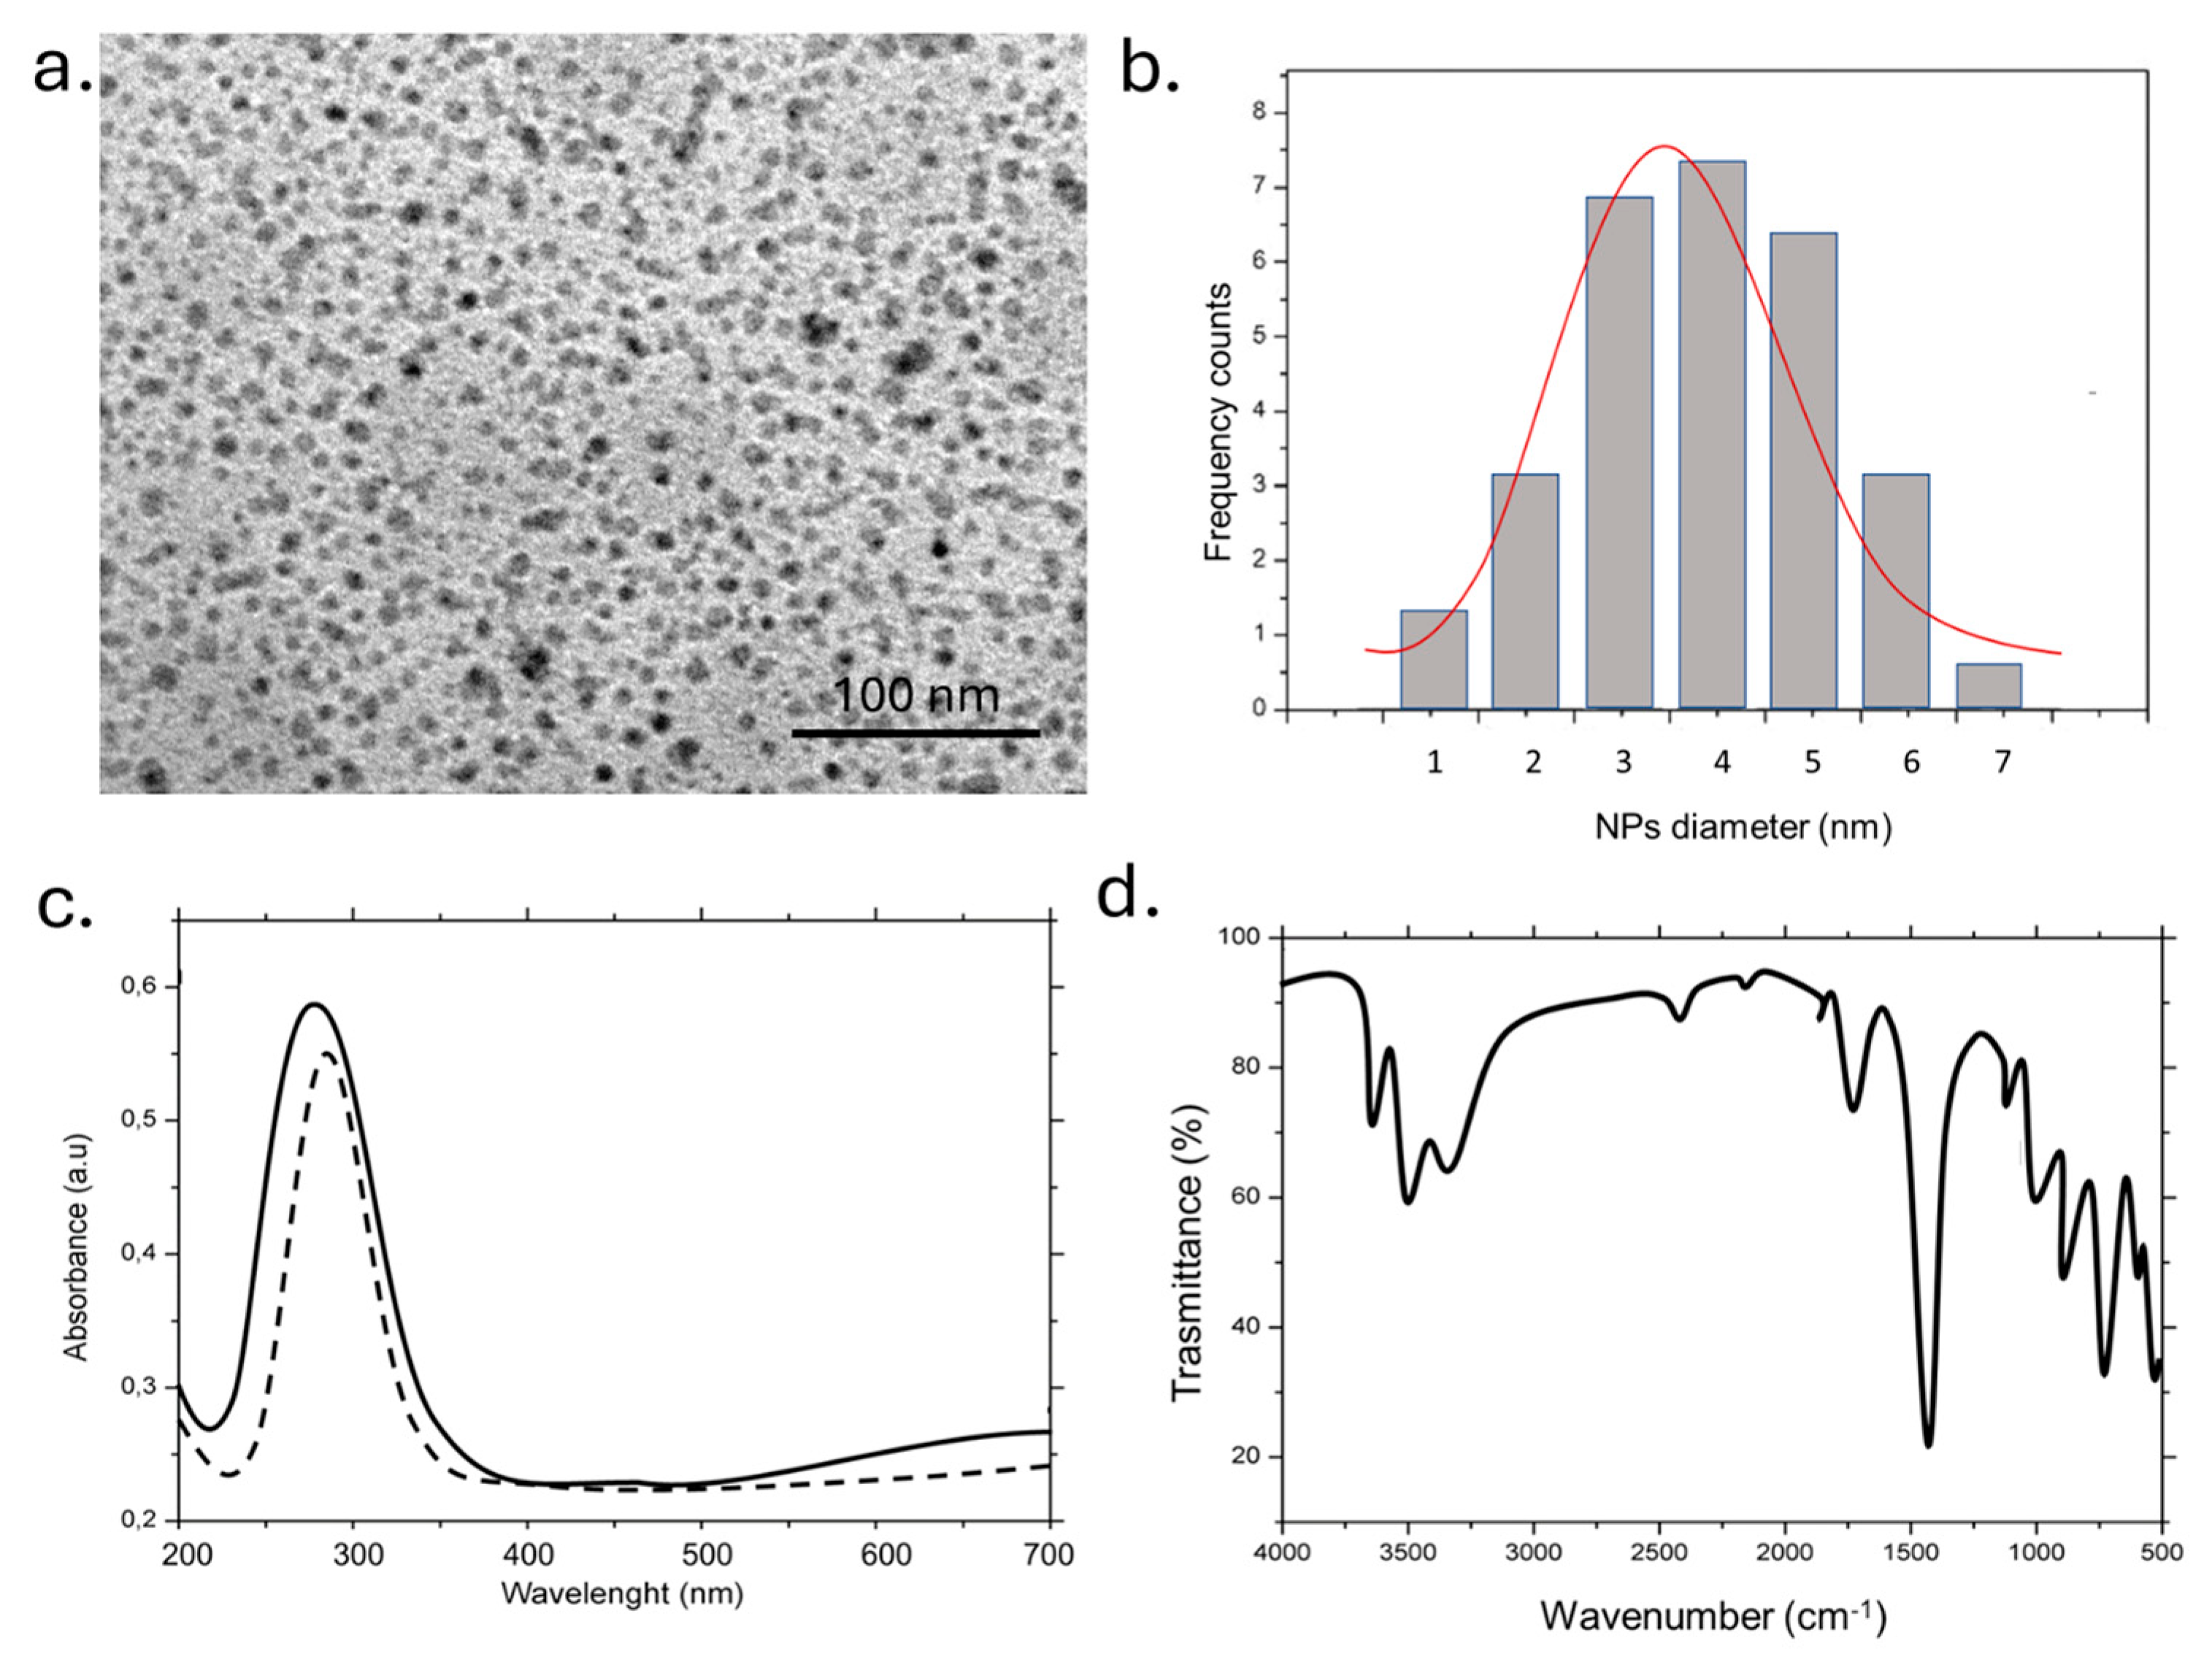
Figure 3.
Florescence analysis (a) Representative confocal analysis of fixed MCF-7 cells (left) untreated and (right) treated with 1ug/ml for 24 h of c-dots. c. XRD pattern of c-dots.
Figure 3.
Florescence analysis (a) Representative confocal analysis of fixed MCF-7 cells (left) untreated and (right) treated with 1ug/ml for 24 h of c-dots. c. XRD pattern of c-dots.
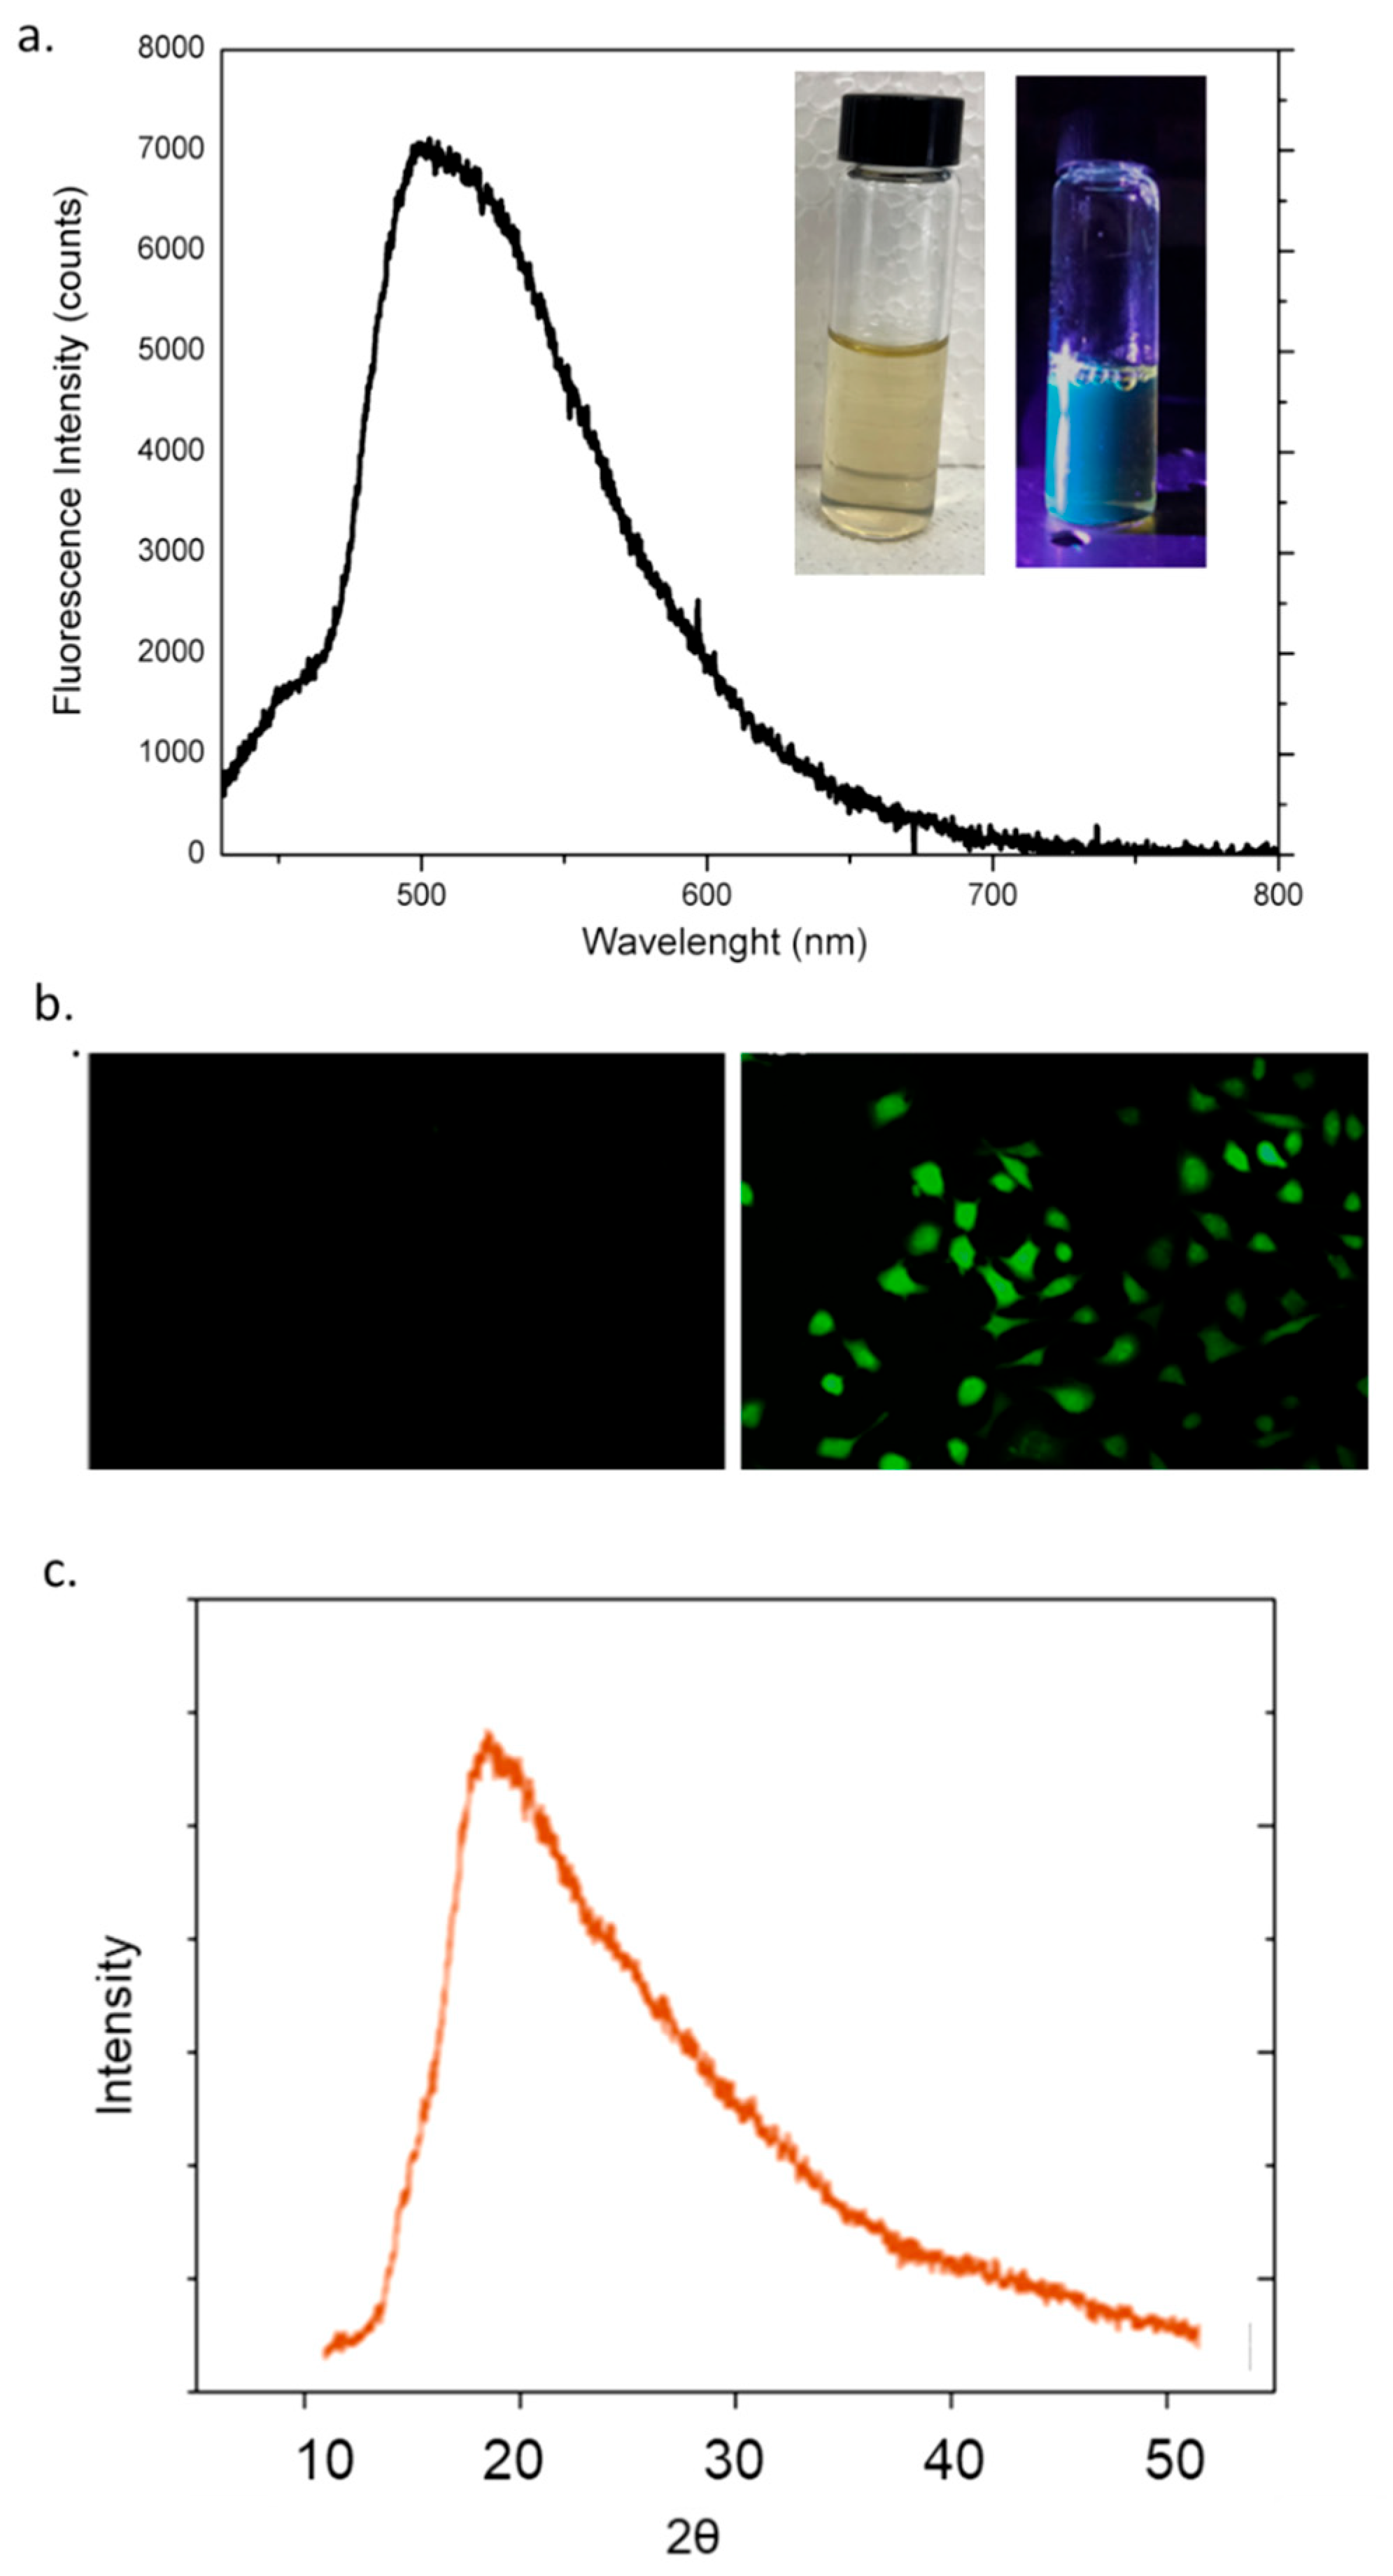
Figure 4.
Aggregated results of the endpoint Life Cycle Assessment (ReCiPe 2016 H/A) for the production of 1 kg of Carbon Dots (CDs) from Laurus nobilis.
Figure 4.
Aggregated results of the endpoint Life Cycle Assessment (ReCiPe 2016 H/A) for the production of 1 kg of Carbon Dots (CDs) from Laurus nobilis.
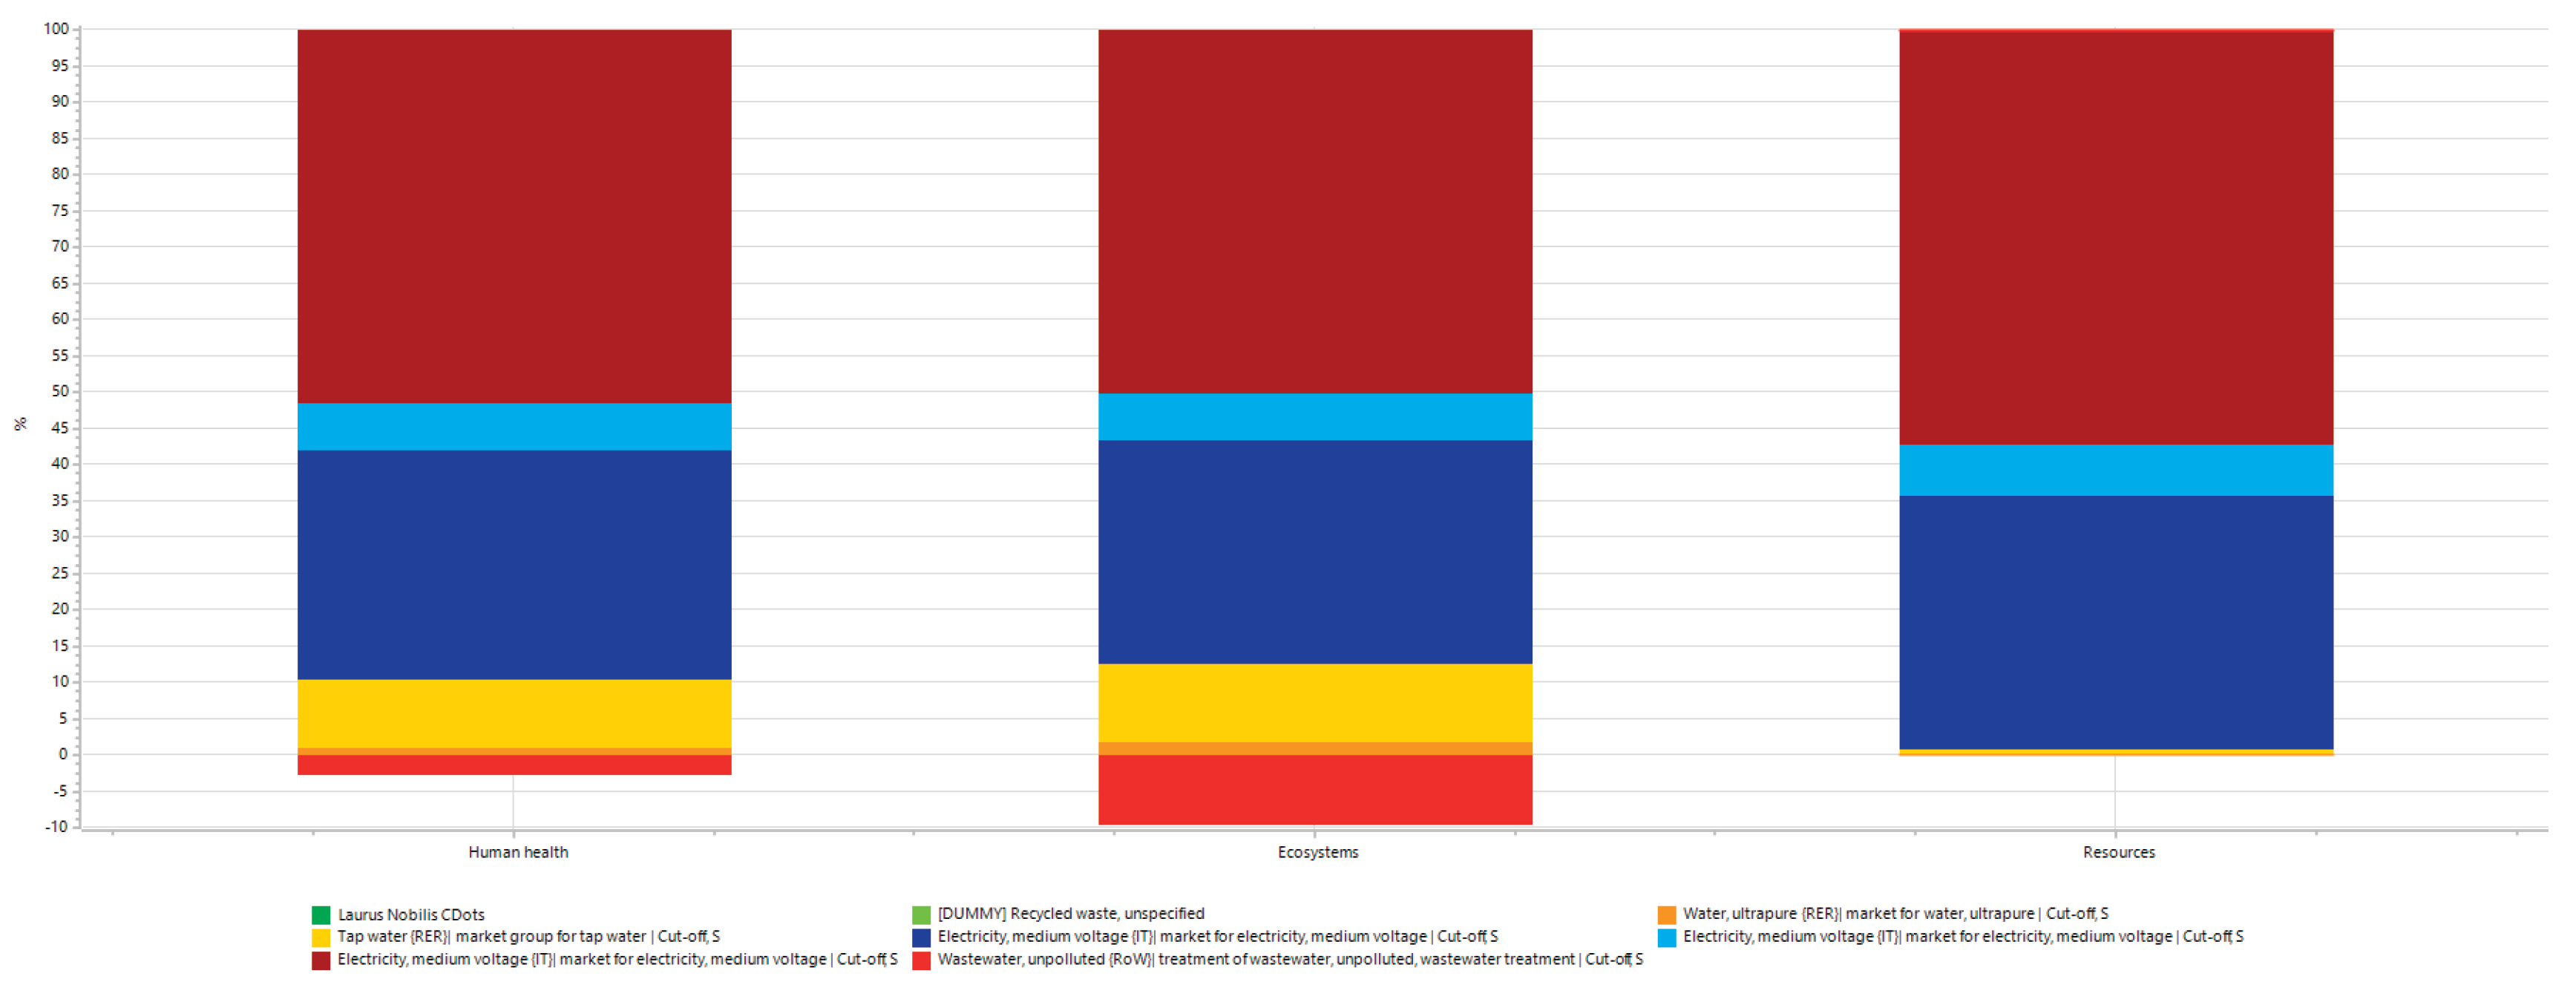

Table 1.
Inputs and Outputs for the production of 55 mg of CDs from Laurus Nobilis.
| Laurus Nobilis | ||||
| Unite of Measure | Quantity | Data | Comment | |
| Input | ||||
| [DUMMY] Recycled waste, unspecified | g | 3 | I | Laurus Nobilis Leaves |
| Water, ultrapure {RER}| market for water, ultrapure | Cut-off, S | g | 20 | I | |
| Tap water {RER}| market group for tap water | Cut-off, S | g | 500 | I | Wash Water |
| Electricity, medium voltage {IT}| market for electricity, medium voltage | Cut-off, S | kWh | 0,00292 | II | Microwaves Oven Midea MM720CTB; 700 W; 3’ |
| Electricity, medium voltage {IT}| market for electricity, medium voltage | Cut-off, S | kWh | 0,0142 | II | Centrifuge Beckman Coulter Allegra 64R; 208 V; 12 A; 10000 rpm; 30’ |
| Electricity, medium voltage {IT}| market for electricity, medium voltage | Cut-off, S | kWh | 0,0232 | II | Oven; 56 L; 1,2 kW; 40°C for 24 h |
| Output | ||||
| Wastewater, unpolluted {RoW}| treatment of wastewater, unpolluted, wastewater treatment | Cut-off, S | L | 0,51 | II | Wash water + supernatant |
| Laurus Nobilis CDots | mg | 55 | I | |
Table 2.
DLS and ζ-potential (mV) measurements on freshly prepared c-dots in water.
| Dynamic Light Scattering (DLS) | Zeta Potential |
| 3 nm |
- 30 mV |
Disclaimer/Publisher’s Note: The statements, opinions and data contained in all publications are solely those of the individual author(s) and contributor(s) and not of MDPI and/or the editor(s). MDPI and/or the editor(s) disclaim responsibility for any injury to people or property resulting from any ideas, methods, instructions or products referred to in the content. |
© 2025 by the authors. Licensee MDPI, Basel, Switzerland. This article is an open access article distributed under the terms and conditions of the Creative Commons Attribution (CC BY) license (http://creativecommons.org/licenses/by/4.0/).
Copyright: This open access article is published under a Creative Commons CC BY 4.0 license, which permit the free download, distribution, and reuse, provided that the author and preprint are cited in any reuse.


