
Submitted:
30 June 2025
Posted:
02 July 2025
You are already at the latest version
Abstract
The production of winter wheat, spring barley, spring oilseed rape and field beans requires detailed experimental data studies to analyze the quality and productivity of spring barley grain under different cultivation and tillage conditions. Tillage has a long-term impact on agroecosystems. As the world’s population grows, more food is required to maintain a stable food supply chain. For many years, intensive farming systems have been used to meet this need. Today, intensive climate change events and other global environmental challenges are driving to a shift towards sustainable use of natural resources and simplified cultivation methods that produce high-quality and productive food. The impact of reduced tillage on these indicators in spring barley production is still insufficiently investigated and requires further analysis at a global level. This study was carried out at Vytautas Magnus University Agriculture Academy (Lithuania) in 2022–2024. The soil of the experimental site is classified as Epieutric Endocalcaric Planosol (Endoclayic, Episiltic, Aric, Drainic, Endoraptic, Uterquic), according to the World Reference Base [1]. Treatments were arranged using a split-plot design. Based on a long-term tillage experiment, five tillage systems were tested: deep and shallow plowing, deep cultivation, chiseling, shallow cultivation-disking, and no-tillage. In 2022–2024, the results of the current study show that the hectoliter weight and moisture content of spring barley grains increased, but protein content and germination decreased in shallowly plowed fields. In deeply plowed fields, the protein content of spring barley grains decreased, and in shallowly plowed fields, the moisture content decreased. In all fields, the simplified tillage systems applied reduced spring barley germination.
Keywords:
soil tillage
; spring barley
; yield
; crop productivity
; complex analysis
; CEI
1. Introduction
Spring barley is an important crop in agriculture, as it is widely used for animal feed, food, and malt production. However, the crop is highly susceptible to climate change, which can have a direct impact on both its yield and grain quality parameters. Yield quantity and quality are affected not only by long-term climatic changes but also by short-term adverse meteorological conditions such as drought periods, heavy rains, or temperature fluctuations [2]. In recent years, an increasing number of farms have opted for less intensive, reduced tillage techniques that reduce input and conserve soil. As a result of this trend, the area under reduced tillage is increasing. Research is active in Europe to assess the impact of conservation tillage systems on soil physical and mechanical properties and greenhouse gas emissions, in particular CO2 [3]. One of the main objectives of modern agriculture is to reduce the intensity of tillage to preserve soil fertility in the long term and to conserve natural resources. Reduced tillage, including direct sowing, allows for more efficient use of time and financial costs [4], and helps to maintain a higher moisture content in the soil [5,6]. Both the chemical and physical properties of soil determine its fertility potential and plant productivity [7].
Other researchers have found that reduced tillage includes techniques such as surface tillage, e.g., cultivation of the soil with disk or colter cultivators, direct sowing with minimum tillage, where the soil surface is only cultivated at the point where the seed is inserted, or direct sowing into the stubble. These methods stimulate the biological activity of the soil and improve its structure, allowing it to retain moisture reserves [8], reduce evaporation, and minimize erosion [9]. Consequently, plant productivity and quality indicators are improved [5,10].
The choice of the right tillage system is one of the key factors in the formation of healthy and high-quality yields. Objective: to compare the effects of different tillage practices on the productivity and grain quality of spring barley crops.
2. Materials and Methods
2.1. Study Sites
The experimental site is a long-term stationary field experiment at the Experimental Station of Vytautas Magnus University Agriculture Academy. The station is located on the left bank of the Nemunas River, Ringaudai municipality, Kaunas district, south-western side of Kaunas city. The long-term field experiment is led by V. Bogužas. For more than 20 years, various experimental agronomic research has been carried out here under a uniform and well-established tillage system. The field soil of the experiment is a deeper gleyic saturated loamy soil according to the Lithuanian soil classification (LTDK–99) [11,12], and according to the international classification [12] it is Epieutric Endocal-caric Endogleyic Planosol (Endoclayic, Aric, Drainic, Humic, Episiltic).
Experimental variants:
1. Normal deep plowing at a depth of 23–25 cm (DP) (control—comparative variant);
2. Shallow plowing at a depth of 12–14 cm (SP);
3. Deep cultivation (with a cultivator with arrow-shaped cultivator points) at a depth of 23–25 cm (DC);
4. Shallow cultivation (with a disk cultivator) at a depth of 8–10 cm (SC);
5. No-tillage (NT).
Crop rotation in the experiment: 1) winter oilseed rape; 2) winter wheat; 3) beans; 4) spring barley.
The experiment is set up in four replicates. The initial size of the fields was 126 m2 (14 × 9 m) and the reference size was 70 m2 (10 × 7 m). The experimental fields are laid out in a randomized manner. The total number of fields in the experiment is 20. The buffer zone is 1 m wide per field and 9 m wide between replicates.

Table 1.
Agro-technical measures and timing for spring barley cultivation.
| Operation | Year | ||
|---|---|---|---|
| 2022 | 2023 | 2024 | |
| Cultivated 1st time | 04/13/2022 | 04/07/2023 | 04/07/2024 |
| Cultivated 2nd time | 04/18/2022 | 04/14/2023 | 04/10/2024 |
| Sprayed with “Glyphogan” 360 SL 3 l ha-1 5 var. (direct sowing) | 04/19/2022 | 04/11/2023 | 04/10/2024 |
| Sown spring barley ‘Crescendo’, seed rate 180 kg ha-1, sowing depth 3 cm | 04/21/2022 | 04/19/2023 | 04/11/2024 |
| Fertilized with N16P16K16 300 kg ha-1 | 04/21/2022 | 04/18/2023 | 04/11/2024 |
| Fertilized with N34.4 125 kg ha-1 ammonium nitrate | 05/15/2022 | 06/01/2023 | 05/03/2024 |
| Sprayed with “Elegant® 2FD” 0.4 l ha-1 | 05/10/2022 | 05/11/2023 | 05/17/2024 |
| Sprayed with “MCPA 750” 1.0 l ha-1 (in a collection with an undersown) | 05/10/2022 | 05/22/2023 | 05/17/2024 |
| Sprayed with “Mirador 250 SC” 0.8 l ha-1 | - | 06/14/2023 | 05/29/2024 |
| Spring barley harvested | 08/04/2024 | 08/10/2024 | 08/10/2024 |
The experimental fields are arranged in a randomized way. There are 20 fields in total in the experiment.
2.2. Meteorological Conditions
In 2022, the precipitation at the beginning (121.6 mm in May) and at the end (122.2 mm in August) of the crop vegetation period was higher (59.9 mm and 33.3 mm, respectively), and the temperature (11.0 °C in May) was lower than the long-term average (2.2 °C). The temperature in August (20.9 °C) was higher than the long-term average (3.6 °C) (Figure 1; Figure 2).
In 2023, precipitation at the beginning of the crop vegetation period in May was 14.3 mm lower and in August—96.2 mm higher than the long-term average (47.4 and 7.3 mm). Temperature (12.6 °C in May) was lower than the long-term average (0.6 °C), while at the end of the vegetation period in August, the temperature (20.2 °C) was higher than the long-term average (2.9 °C) (Figure 1; Figure 2).
In 2024, precipitation at the beginning (25.1 mm in May) and at the end (40.9 mm in August) of the crop vegetation period was lower (36.6 and 48.0 mm), and the temperature (15.5 °C in May to 20.1 °C in August) was higher than the long-term average (2.3 and 1.4).
Summarising the meteorological conditions for the study years, the 2022–2023 study years show higher precipitation in April and August and lower precipitation in May, June, and July compared to the long-term average. Over the whole study period, the most abundant precipitation was in May 2022, July 2024, and August 2022–2023 (Figure 1; Figure 2). In 2022–2024, temperatures were highest in June and August compared to the long-term average.
2.3. Crop Productivity and Quality Indicators
Crop germination. Germination is determined once: on the tenth day after the beginning of germination (BBCH 10). In each field, the density of seedlings was counted at ten randomly selected points in a 1-meter-long row. Seedling density was converted into pieces m-2.
Seedling density. For spring barley (number of productive stems) was determined at maturity, in 50 × 50 cm frames, at 4 locations in the field and expressed in pieces m-2.
Determination of grain yield, t ha-1. The grain yield of each field was calculated using a computerized weighing system on the combine harvester. Yields were converted at 14% moisture content into absolute clean weight of grain.
Determination of grain quality. Grain quality parameters were determined in the laboratory of the elevator in Radžiūnai, Alytus district. Methods for determining quality indicators:
- Protein content: the method is given in standard LST 1593:2000. “Determination of protein content of whole barley by near-infrared spectroscopy”.
- Gluten content: determined according to ISO 21415-1:2007. “Gluten content. Part 1. Determination of wet gluten by manual method”.
- Sedimentation (mL)—Zeleny method (LST ISO 5529:2007) in absolute dry medium. The INFRATEC device was used to determine the sedimentation values.
- Starch content (%) was determined by “INFRATEC” device;
- Hectolitre mass (kg hl-1) was determined using a liter stigma device.
2.4. Comprehensive Evaluation
A comprehensive assessment of the impact of tillage technologies of varying intensities on the agroecosystem was conducted using the methodologies developed by G. Lohmann (1994) and K. U. Heyland (1998) [13,14]. The following studies and mathematical calculations were carried out: 1) to determine the values of different indicators; 2) to calculate the evaluation points (EP) of the different indicators expressed in different units of measurement to convert the values into a single scale. On this scale, a score of 1 represents the poorest (minimum) value, while a score of 9 reflects the best (optimum) value. Intermediate scores for each indicator were calculated using the following formula:
EPi = (Xi − Xmin)·(Xmax − Xmin) − 1 · 8 + 1,
where Epi represents the evaluation point for a given indicator; Xi is the observed value of that indicator; Xmax and Xmin are the maximum and minimum values recorded for that indicator, respectively; 3) the converted indicator values are presented on radial grids, with the radius scaled from 1 to 9, reflecting the evaluation points; 4) the scale also shows the average value of the individual indicators—the score threshold, which is equal to 5 and distinguishes between the high and the low scores. The effectiveness of the measure will be indicated by the area bounded by the scores of all its indicators; 5) the complex evaluation index (CEI), which consists of the average of the evaluation points, the standard deviation of the evaluation points, and the standard deviation of the average of the points below the evaluation threshold, is calculated.
2.5. Statistical Analysis
The research data were analyzed using a one-way analysis of variance (ANOVA) applying the F test via the SPSS Statistics I software package [15]. The research data were processed by the method of analysis of variance using the computer program SYSTAT 12. Differences between the means of the treatment variants were evaluated using the Least Significant Difference (LSD) test at confidence levels of 95.99% and 99.9% [16]. Correlations between variables were assessed using correlation analysis, which involved calculating the correlation coefficient (r) and its statistical significance at 95% and 99% probability levels. Regression equations were also generated using the STAT program from the SELECTION software package [16].
Standard errors of the means are represented by whiskers on the graphs. Statistically significant differences between a given treatment and the control are marked with confidence levels as follows:
* for p ≤ 0.050 > 0.010 (the differences are significant at the 95% confidence level);
** for p ≤ 0.010 > 0.001 (differences are significant at the 99% confidence level);
*** for p ≤ 0.001 (differences are significant at the 99.99% confidence level);
p > 0.050, no significant differences (differences significant at less than 95% confidence level).
3.1. Crop Productivity Indicators
In 2022, when calculated after 10 days, the crop germination did not differ significantly between tillage systems. Reduced tillage systems (SP, DC, SC, NT) reduced crop emergence by a factor of 1.0 to 1.2 compared to deep plowing (DP) (Figure 3).
In 2023, when calculated after ten days, reduced tillage (SP, DC, SC, NT) reduced crop emergence by a factor of 1.0 to 1.2. Conventional tillage (DP) increased crop germination.
In 2024, all reduced tillage practices (SP, DC, SC, NT) reduced spring barley crop germination by 0.44 to 8.81% compared to deep plowing (DP). The lowest spring barley germination was found in direct sowing into no-till fields (NT).
All of the reduced tillage systems reduced the germination of spring barley crops in the years 2022–2024.
In 2024, a linear average negative and statistically significant correlation was established between the germination of the spring barley crop (r = -0.543, y = 669.047 − 4.526x, P < 0.05) and the number of productive stems.
Calculations carried out in 2022 showed that there was no significant effect on crop density under the different tillage systems (Figure 4). Reduced tillage increased crop density by up to 1.2 times compared to deep plowing. Shallow-plowed, chiseled, and disked fields showed a higher crop density of up to 1.0 times higher than in fields with conventional tillage. In the direct sowed fields (400 pieces m-2), the crop density was very similar to that in the deep plowed fields (402 pieces m-2).
The calculations carried out for 2023 showed that no significant effect on crop density was observed with the different tillage systems. The highest crop density was found in direct sowing fields with 525 pieces m-2 and the lowest density was found in fields with shallow cultivation with 424 pieces m-2. Different tillage treatments had different effects on crop density (Figure 4).
The analysis of the number of productive stems of the spring barley crop showed that all the reduced tillage treatments increased the number of productive stems by between 6.92 and 16.88% compared to the control (DP). The highest number of productive stems of spring barley was found in the directly sown fields (NT).
In 2022 and 2024, the reduced tillage systems (SP, DC, SC) increased the density of the spring barley crop, while in 2023 it decreased it. The application of direct sowing (DS) decreased the spring barley density in 2022 and increased it in 2023–2024.
In 2022, the analysis showed that different tillage effects had a significant impact on spring barley yields (Figure 5). Conventional tillage resulted in a maximum grain yield of 7.2 t ha-1 for spring barley.
In all fields with reduced tillage systems, spring barley yields decreased by a factor of 1.0 to 1.4 compared to deep plowing fields. The lowest yield of 4.97 t ha-1 was found in the deep cultivation fields. Deep cultivation technology resulted in a 1.4-fold decrease in spring barley yield compared to the deep plowing technology. Direct sowing technology resulted in a yield reduction of spring barley of about 2 tons, or 1.4 times compared to deep plowing.
In 2023, the evaluation of the effect of different tillage technologies on spring barley yields shows that, in all fields, the use of reduced tillage technologies increased spring barley yields compared to deep plowing fields. Except for the direct sowing fields, where spring barley yields were significantly lower (by a factor of 1.1) compared to the deep plowing fields (Figure 5). In 2023, the lowest spring barley grain yields were found in the deep plowing fields.
The calculation of spring barley yields for 2024 shows a trend toward higher yields with reduced tillage. However, there was a significant increase in yield of 7.69, in the deep cultivation (DC) fields compared to the control (DP). The lowest yields were found in fields where direct sowing (NT) was applied.
In 2023, a linear mediocre positive and statistically reliable correlation was established between spring barley grain yield (r = 0.507, y = 35.51+ 3.543x, P < 0.05) and hectoliter weight.
In 2024, a linear mediocre negative and statistically significant correlation was established between spring barley grain yield (r = -0.545, y = 19.29 − 1.027x, P < 0.05) and protein content.
In 2022, all the reduced tillage systems (SP, DC, SC, NT) decreased the yield of the spring barley crop. In the years 2023–2024, the tillage systems (SP, DC, SC) increased the yield of the spring barley crop. The application of direct sowing (NT) decreased the yield of spring barley in all the years studied.
3.2. Quality Indicators of Spring Barley
Based on the data from the 2022 survey, it can be concluded that the different tillage practices did not have a significant effect on the grain protein content. The results show that the fields with conventional tillage had the highest protein content compared to the reduced tillage systems (Figure 6). Grain protein content in the years studied was low at 10.1%, equivalent to Grade 3 in terms of grain quality indicators.
In 2023, the study found that the grain protein content was 0.3% higher in fields with shallow cultivation compared to deep plowing (DP).
In 2024, the analysis of spring barley grain quality showed a significant decrease of 0.12 and 0.85% in protein content in the deep cultivation (DC) and shallow plowing (SP) fields compared to the deep plowing (DP) (Figure 6).
In 2022–2024, the reduced tillage systems (SP, DC, SC, NT) reduced the grain starch content of the spring barley crop, except for shallow cultivation (SC) in 2023. In 2023, when SC was applied, the starch content of the grain increased.
In 2022, a linear, mediocre negative and significant reliable correlation was established between the protein content of spring barley grains (r = -0.576, y = 67.995 − 0.549x, P < 0.01) and starch content.
In 2023, a linear, very strong negative and significant reliable correlation was established between the protein content of spring barley grains (r = -0.9, y = 72.453 − 0.876x, P < 0.01) and starch content.
In 2024, a linear strong negative and statistically reliable correlation was established between the protein content of spring barley grains (r = -0.733, y = 65.504 − 0.353x, P < 0.01) and starch content.
The starch analysis in 2022 showed that the starch content was 1.0 times higher in the fields with deep cultivation compared to the fields with conventional plowing (Figure 7). Reduced tillage did not have a significant effect on the grain starch content.
The starch analysis in 2023 showed that the fields with shallow plowing had the highest starch content (61.8%). Other reduced tillage systems reduced the starch content by up to 1.0 times compared to conventional tillage. Summarizing the results of 2022 and 2023 it can be stated that shallow plowing (SP) increased the grain starch content.
In 2024, a significant increase of 0.55% in starch content was observed in the deep-cultivated (DC) fields compared to the control (DP) (Figure 7).
In 2023, a linear, mediocre positive and significant reliable correlation was established between spring barley grain yield (r = 0.555, y = 55.39 + 0.957x, P < 0.05) and starch content.
In 2023, a linear, very strong positive and significant reliable correlation was established between the starch content of spring barley grains (r = 0.91, y = -192.382 + 4.082x, P < 0.01) and hectoliter weight.
In 2024, a linear mediocre positive and statistically significant correlation was established between the starch content of spring barley grains (r = 0.508, y = 58.012 + 0.461x, P < 0.05) and yield.
The analysis showed that no significant differences were found in 2022 in the fields with different tillage technologies. Reduced tillage increased the hectoliter mass of spring barley grain by 1.0% compared to fields with deep plowing (DP) (Figure 8). The highest spring barley hectoliter mass was found in the deep-cultivated (DC) and shallow-cultivated (SC) fields at 59.7 kg hl-1.
The data from 2023 showed that spring barley hectoliter mass was highest in the shallow plowed (SP) fields, with a result of up to 1.0 times higher compared to conventional plowing (DP). Barley is classified as high-quality when the hectoliter mass is 60.0 kg hl-1 and above, and poor-quality when it is lower. The hectoliter mass of spring barley grain is variable under different reduced tillage systems.
In 2024, shallow plowing (SP), deep cultivation (DC), and direct sowing (NT) resulted in a higher grain hectoliter mass of between 0.16 and 1.17% compared to deep plowed (DP) fields.
In 2022, a linear, mediocre positive and significant reliable correlation was established between spring barley grain yield (r = 0.618, y = 47.093 + 1.751x, P < 0.01) and hectoliter weight.
In 2023, a linear strong negative and significant reliable correlation was established between the protein content of spring barley grains (r = -0.794, y = 102.035 − 3.469x, P < 0.01) and hectoliter weight.
In all the years studied (2022–2024), shallow plowing showed an increase in spring barley grain hectoliter mass. All other reduced tillage systems used did not show clear trends.
In 2022, no significant differences in spring barley grain moisture content were detected in the fields with different tillage systems (Figure 9). Shallow plowing (SP) fields maintained the highest grain moisture content (13.8%). In all the fields studied, the grain moisture content in 2022 was good, the grain was storable and dry.
No significant differences in the moisture content of spring barley grain were found between the different tillage systems in the 2023–2024 period. In 2023, the wettest grain remained in the shallow plowed fields. In the fields, the grain moisture content did not exceed 13.0%, indicating that the production was suitable for storage, a trend that was also evident in 2024.
In the years 2022–2024, shallow plowing (SP) increased the yield of spring barley grain, while shallow cultivation (SC) decreased it. All other conservation tillage systems (DC, NT) did not show consistent trends.
In summary, in 2022, shallow plowing (SP), deep cultivation (DC) and shallow cultivation (SC) increased the starch content and the hectoliter mass of spring barley but decreased the germination and yield of the crop and the grain‘s protein content. In 2023, deep cultivation (DC) increased grain yield. In 2024, the analysis of spring barley crop germination showed that the fields under direct sowing (NT) had the lowest emergence compared to the fields under deep plowing (DP). However, in the direct sowing fields (NT), the number of productive stems was higher compared to the fields with conventional tillage (DP). In the fields with deep cultivation (DC), the highest yields were found but the protein content was lower compared to deep plowing (DP).
In 2022, a linear, mediocre negative and significant reliable correlation was established between spring barley grain moisture content (r = -0.611, y = 75.465 − 1.311x, P < 0.01) and hectoliter weight.
3.3. Comprehensive Evaluation of the Long-Term Effects of Tillage Technologies on the Agroecosystem
The most important objective of tillage is to minimize the intensive technological impact on the soil and crops and to create the right conditions for them to grow, to ensure a steady renewal of the soil‘s productivity, and to maintain cost-effective production. Continuous deep plowing adversely affects many soil properties and promotes compaction of the subsoil [17]. Each tillage technology has its advantages and disadvantages. Deep plowing has a high probability of producing higher yields. However, due to the low productivity of tillage operations and the need for high-powered implements, these tillage technologies are the most expensive. In addition, deep plowing has negative impacts on the environment, soil, and biodiversity [18]. It is very difficult to decide which indicator has a greater or lesser impact on the crop agroecosystem. An integrated assessment system would solve this problem.
The results of the integrated assessment of the long-term impact of tillage technologies on the agroecosystem, taking into account 7 indicators, are presented in the figures below (Figure 10, Figure 11, Figure 12, Figure 13 and Figure 14).
In 2022, the evaluation of the indicators studied in the spring barley crop showed that the shallow plowing (SP) tillage technique was superior to the other techniques used, as all the indicators studied were above the assessment threshold (5 points) (Figure 10). Deep cultivation (DC) and shallow cultivation (SC) technologies had a more positive impact on the hectoliter mass of spring barley grain, with the highest scores obtained (9 points).
In 2023, the deep plowing (DP) technology scored higher or close to the assessment threshold (4.76) (Figure 11). For spring barley, a hectoliter mass of grain below the assessment threshold of 4.76 points was found for deep plowing technology.
Shallow plowing (SP) technology increased spring barley grain yield, starch content, protein content, and hectoliter mass, with a score threshold of 9 points.
In 2024, different tillage technologies and the evaluation of the indicators under study resulted in different evaluation scores (Figure 12).
When the impact of the technologies on the different indicators studied was assessed, no-tillage technology increased the scores to bring all the indicators studied above the assessment threshold. The deep cultivation (DC) technology increased spring barley grain yield, starch content, protein content, and hectoliter mass, the evaluation threshold increased to 9 points.
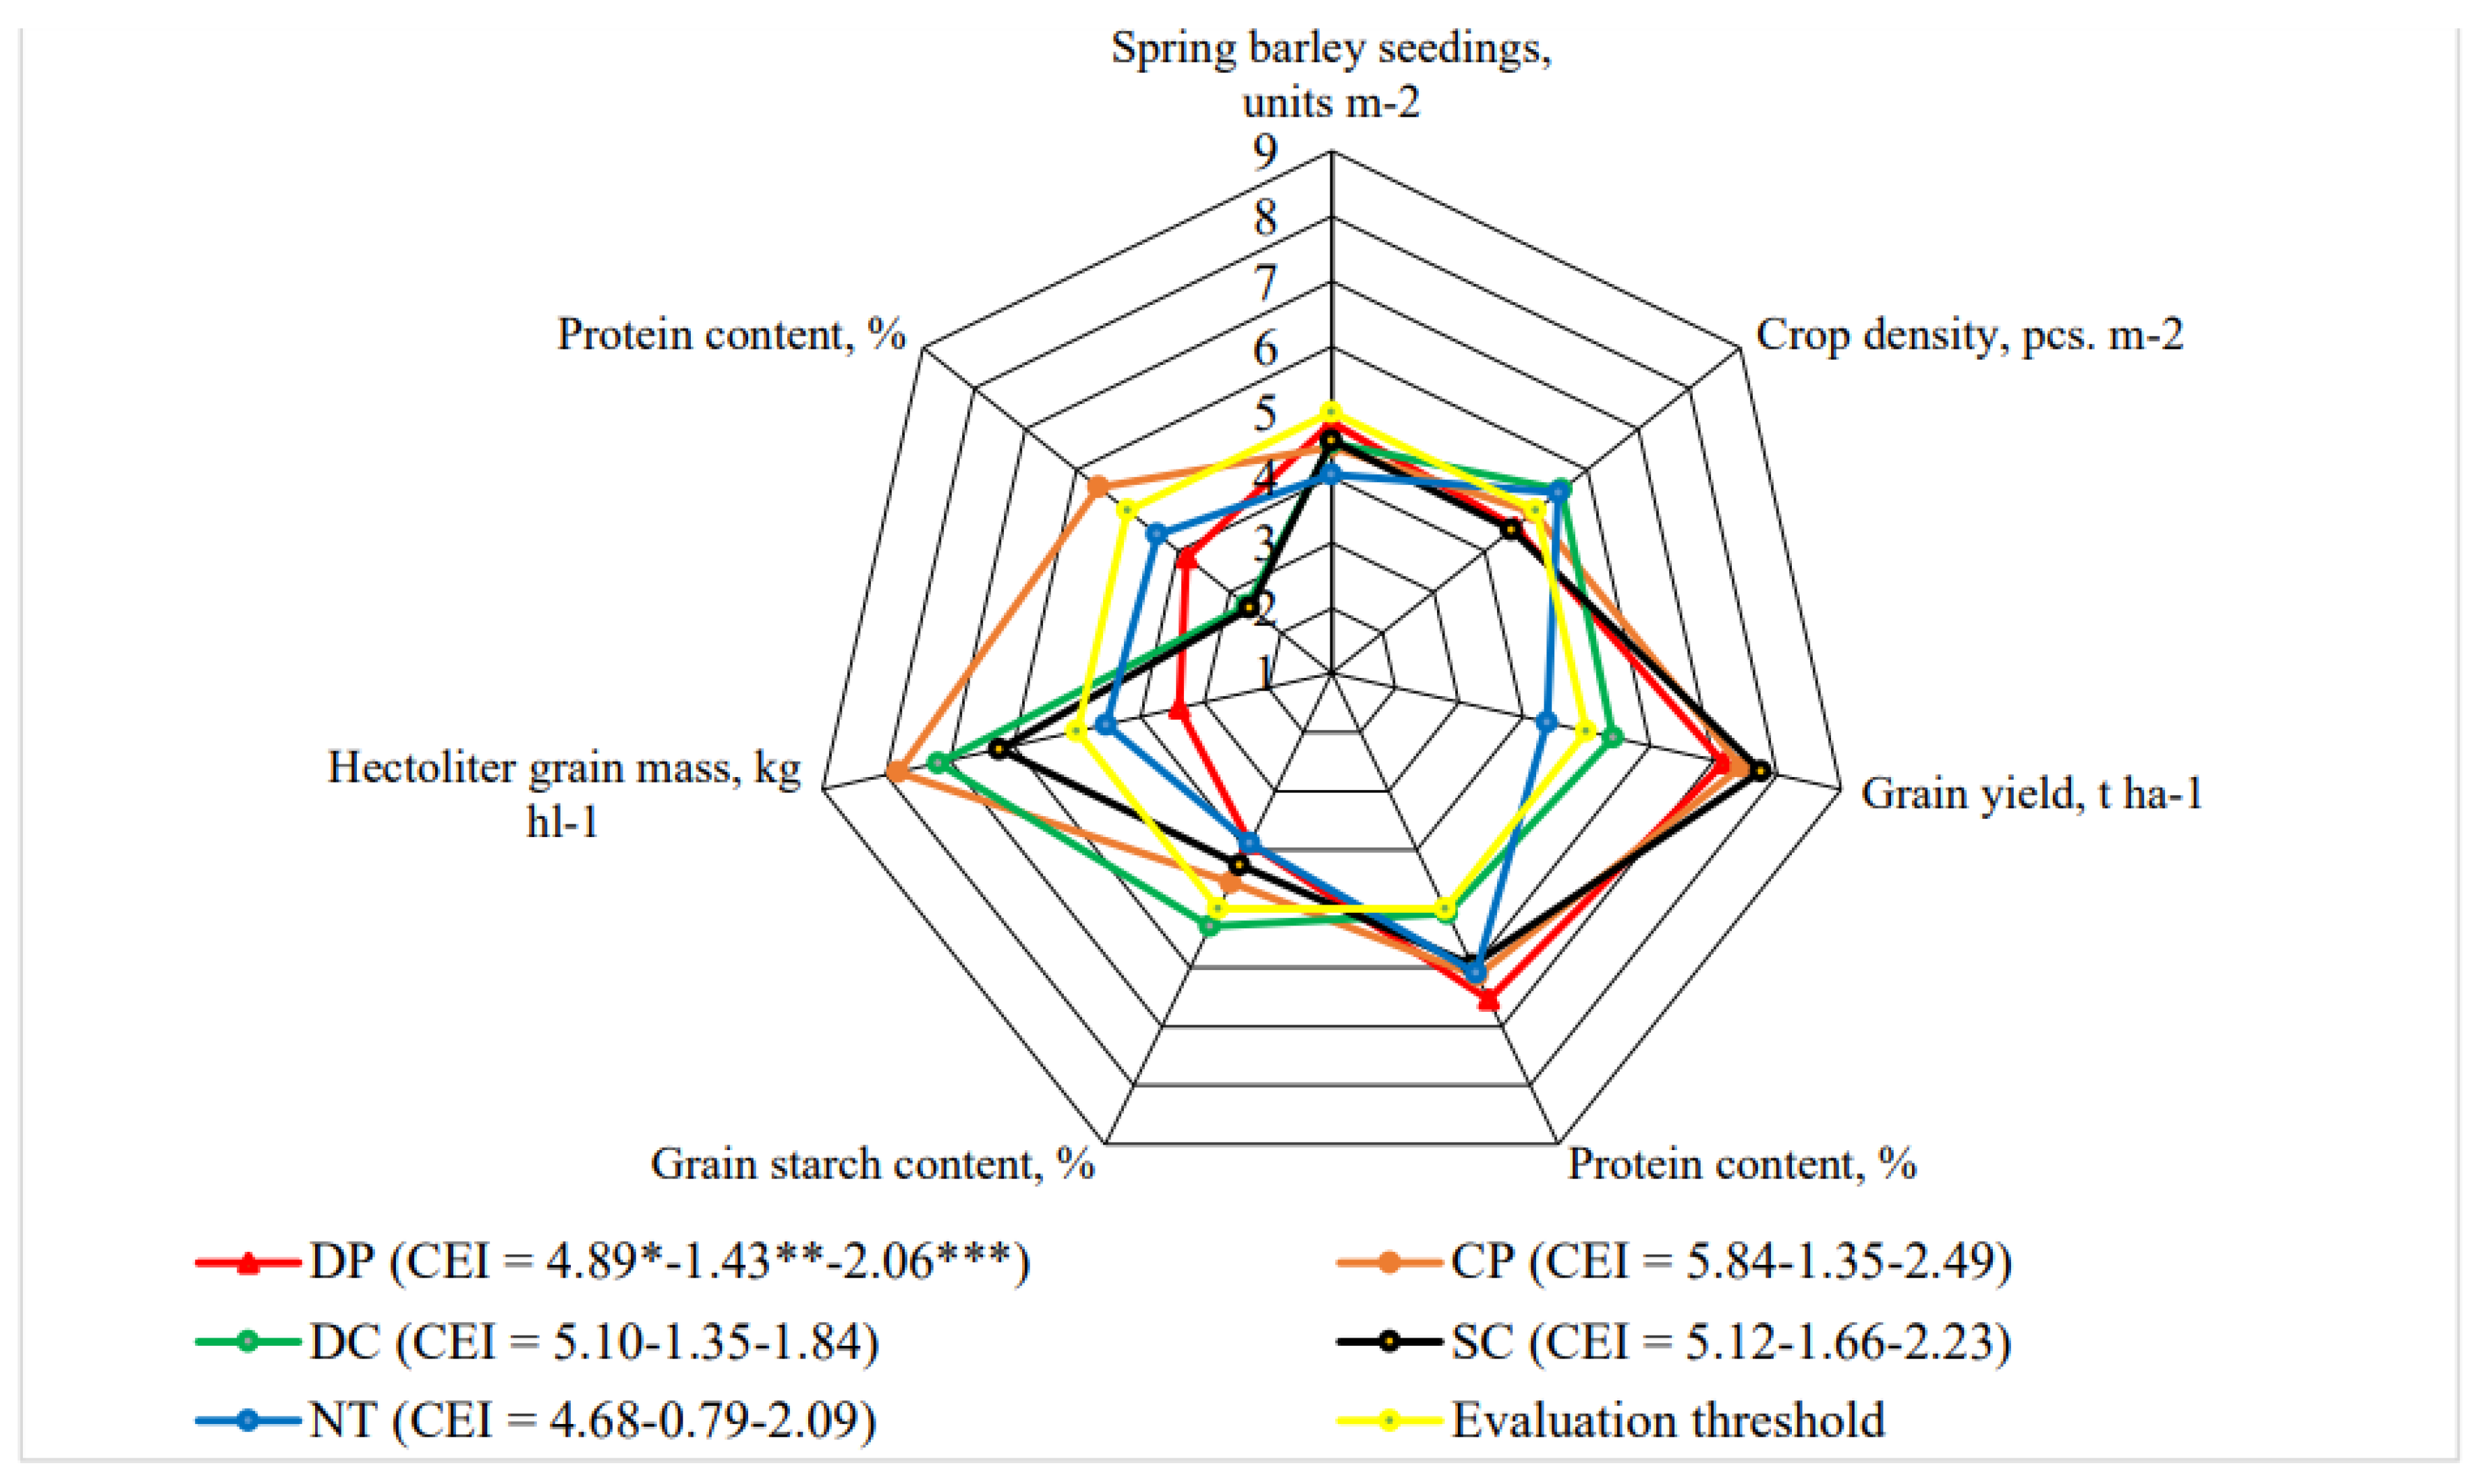
The calculated complex evaluation indices and areas limited by assessment scores for 2022–2024 showed that the impact of shallow cultivation (SC) technology on the agroecosystem was greater than that of other comparative technologies (Figure 13).
Summary. The calculated complex evaluation indices (CEI), consisting of the average, standard deviation and CEI of all evaluation points (EP) not exceeding the evaluation threshold, standard deviation, and areas limited by EP, show that the positive impact of reduced tillage technologies on the agroecosystem is greater than that of deep plowing technologies.
4. Discussion
4.1. Crop Productivity Indicators
The changing climate affects the countries of Northern Europe, which includes Lithuania, and inevitably affects the productivity of agricultural plants. The physiological processes of cultivated plants that control the phenological characteristics of the plant are adapted to natural climatic conditions [19]. Optimal environmental conditions are necessary for the growth and development of cultivated plants and physiological processes. The productivity of crop biomass depends on the optimal operation of the plant’s photosynthetic system [20]. Crop density determines yield and crop productivity [21]. Crop density affects the light extinction coefficient and its distribution in the crop [22]. The denser the crop, the less light falls on each plant, which reduces carbon fixation. Cultivated plants begin to grow more slowly, and the size of some of their organs may decrease [23]. The leaf index is determined by the amount of photosynthetically active radiation absorbed by the plant, its spatial arrangement, the amount and ratio of photosynthetic pigments, and the angle of inclination to the sun [24]. Under adverse environmental factors, the productivity of cultivated plants decreases, and the quality of production deteriorates. Grain quality indicators are determined by the genetic potential of the variety, environmental conditions, applied cultivation agrotechnics, and soil [25].
Quite a few factors determine crop density. In more weedy fields, we will have a lower crop density, because weeds prevent wheat from growing and developing normally, and competition arises for nutrients, light, and moisture [26].
Choosing reduced tillage and direct sowing into uncultivated soil, abandoning plowing and deep cultivation, increases the number of weeds [5,27]. To form a dense crop with many productive stems after reduced tillage, sowing at the optimal time and using herbicides is necessary [28]. Seed germination determines the crop density, the number of productive stems, the number of grains per ear, and the weight of 1000 grains. These listed indicators are also determined by environmental conditions, the prevailing soil type, and the applied agrotechnical measures [29].
Allelopathic processes occurring in agroecosystems affect crop productivity, the preservation of genetic diversity, and at the same time the naturally occurring control of weeds and pests [30]. The formation of productive stems of spring barley is also conditioned by sufficient supply of nutrients, favorable environmental conditions, light, weediness of the crop, etc. If the conditions are favorable at that time, the plant forms enough productive stems [31].
Spring barley grain is harvested when the plants reach hard or full maturity. According to research conducted in 2005–2006 at the Bariūnai Agricultural Company, the yield of spring barley decreases when the harvest time is delayed by 5–15 days, respectively from 4.26 to 14.18% [32]. It is known that grain yield is influenced not only by the time of harvest but also by different tillage technologies used. The best crop yield potential is achieved when plants can grow and develop in favorable environmental conditions [33]. Applying different agrotechnical measures creates more favorable conditions for plant productivity and at the same time improves photosynthesis by plants [34].
4.2. Crop Quality Indicators
The protein content in spring barley is determined by many factors that are quite closely related to each other. Typically, the chemical composition of spring barley contains about 12% protein [35]. The protein content in grains determines the nitrogen supply of plants. The main factors are the amount and timing of nitrogen fertilizer use, the time of harvest, and climatic conditions during the vegetation period. Spring barley contains a significant amount of protein and starch in its chemical composition, which allows the grown raw material to be used for full-fledged feed production [36]. Starch in spring barley is found in about 60.5–65.2% of dry matter. According to G. Juodeikienė et al. [37], starch in barley is approximately the same as in rye. The gelatinization temperature of barley starch reaches 51–60 °C. The amylose content in barley starch varies from 0 to 45%, depending on the variety. Barley starch is similar in appearance to wheat starch, but it has fewer small granules. In addition, two types of starch granules have been identified in barley (as well as wheat and corn)—A and B granules. These granules are round or elliptical in shape. Starch consisting of large elliptical type A granules and small round type B granules may contain 22–23% amylose or a high amylopectin content. Starch consisting of smaller type A granules and larger type B granules contains a high amylose content (more than 22–23%). The optimal moisture content of spring barley grains should be about 14%, but at a moisture content higher than 14.6%, the grains transition from the dormant period to the execution of biological processes, thus deteriorating the quality of the stored crop [38]. The harvesting of grains may determine the quality of their indicators. According to the literature, the hectoliter mass of grain may decrease with delayed harvest because the surface of grains that dry out and rewet becomes rough and when measuring the hectoliter mass, they do not fill the measuring vessel as compactly as the grains of barley that were filled on time [39]. Hectoliter or otherwise measured mass shows how much 1l of spring barley weighs in grams, usually measured mass is expressed in hectoliter per kilogram [40,41]. Based on the LST 1797:2003 standard and considering the quality indicator of the hectoliter mass of purchased or supplied barley, barley can be of class 1 (food) and the hectoliter mass can reach 62 kg hl-1, while for class 2 (feed) barley, the hectoliter mass in grains is not limited. The safe moisture content suitable for long-term storage of barley grains is 14% or less [38]. In grains with a moisture content of ≤13.0%, the probability of toxin accumulation is reduced even if toxin producers are present [42].
Tillage is among the most energy-intensive and expensive processes in agricultural production. When applying minimal tillage, the moisture content is often not optimal, which can make it more difficult for crops to absorb phosphorus and other nutrients, which can lead to a deterioration in crop productivity and quality indicators. When there is a lack of moisture on the soil surface [43,44], this effect often becomes apparent only in long-term field experiments. The changing climate has an impact on the countries of Northern Europe, which includes Lithuania, and inevitably affects the productivity of agricultural plants. The physiological processes of cultivated plants that control the phenological characteristics of the plant are adapted to natural climatic conditions [19]. Optimal environmental conditions are necessary for the growth and development of cultivated plants and physiological processes [45,46]. The productivity of crop biomass depends on the optimal operation of the plant’s photosynthesis system [20]. Crop density determines yield and crop productivity [47]. In the presence of unfavorable environmental factors, the productivity of cultivated plants decreases, and the quality of production deteriorates. Grain quality indicators are determined by the genetic potential of the variety, environmental conditions, and the applied agricultural techniques for tillage and cultivation, as well as the soil [25]. The yield results presented in the scientific literature using minimum tillage are quite contradictory. Long-term (8-year) scientific studies conducted in Great Britain show that using direct sowing into uncultivated soil reduced the yield of spring barley by 15% compared to deep plowing technology [48,49]. Other scientists claim that using direct sowing into uncultivated soil resulted in a similar yield of winter wheat as in deep plowing fields [50]. Cesevičius et al. [51] claim that in direct sowing fields, the yield of spring barley decreased by 8.5% compared to traditional tillage.
The reaction of plants to environmental factors depends on many components: soil properties, air temperature, mineral nutrition, water regime, light, plant species, variety, physiological state, and selected tillage [52]. Higher air temperature accelerates plant growth, shortens development duration, and reduces productivity [53]. Not only environmental conditions determine the yield of cultivated plants, but also tillage, which affects the water regime and plant nutrition [54]. Leaf assimilation area and density are very important for cultivated plants; it is directly related to plant productivity. Scientists claim that lack of moisture and high temperature negatively affect the assimilation area of seeded pea leaves [46].
5. Conclusions
In 2022–2023, spring barley crop germination after 10 days decreased when applying shallow plowing (SP), shallow cultivation (SC), and direct sowing (NT) to uncultivated soil. Spring barley yield decreased in direct sowing (NT) fields. In the study years, the starch content, moisture content, and hectoliter mass of spring barley grains increased in shallow plowing (SP) fields. In 2022, the protein content of spring barley increased in deep plowing (DP) fields, and in 2023 in shallow cultivation (SC) fields. In 2024, lower crop germination (from 0.44 to 8.81%), but higher productivity (from 6.92 to 16.88%) was determined in all reduced tillage (SP, DC, SC, NT) fields compared to deep plowing (DP). Spring barley yield was significantly higher in fields with deep cultivation (DC) (7.28 t ha-1). Although spring barley grain protein content (11.55%) was significantly lower in fields with deep cultivation (DC), starch content (61.6%) and hectoliter mass (60.25 kg hl-1) were the highest compared to deep plowing (DP).
Author Contributions
Conceptualization, A.S.; K.R.; R.K., and E.M.; methodology, A.S.; software, R.K.; formal analysis, A.S.; investigation, K.R. and E.M.; data curation, K.R.; writing—original draft preparation, A.S. and R.K.; writing—review and editing, K.R.; visualization, R.K. All authors have read and agreed to the published version of the manuscript.
Funding
This research received no external funding.
Institutional Review Board Statement
Not applicable.
Informed Consent Statement
Not applicable.
Data Availability Statement
Data is contained within the article.
Conflicts of Interest
The authors declare no conflict of interest.
References
- Mantel, S.; Dondeyne, S.; Deckers, S. World reference base for soil resources (WRB). In Encyclopedia of Soils in the Environment. Elsevier. 2023. pp. 206–217.
- Šabajevienė, G. Aplinkos temperatūros ir substrato drėgmės poveikis vasarinių miežių fiziologiniams rodikliams. Žemdirbystė-Agriculture. 2008, 95(4), 71–80.
- Lenssen, A.W.; John Son, G.D.; Carl Son, G.R. Cropping sequence and tillage system influences annual crop production and water use in semiarid Montana. Field Crop Research 2007, 100, 32–43. [Google Scholar] [CrossRef]
- Chetan, F.; Chetan, C. Improvement of the Water Management by Applying the No Tillage System for the Winter Wheat Production. Agriculture 2021, 78(1), 22–27. [Google Scholar] [CrossRef]
- Maikštienė, S.; Velykis, A.; Arlauskienė, A. Tausojamoji žemdirbystė našiuose dirvožemiuose: monografija. 2008. Lietuvos žemdirbystės institutas. Akademija, Kėdainių r., pp.327.
- Šimanskaitė, D. Arimo ir beplūgio žemės dirbimo įtaka dirvožemio fizikinėms savybėms ir augalų produktyvumui. Žemės ūkio mokslai. 2007, 14(1), 9–19.
- Jodaugienė, D. Ilgamečio arimo ir purenimo įtaka dirvožemiui ir žemės ūkio augalų pasėliams supaprastinto žemės dirbimo sistemoje. 2002. (Doctoral dissertation, Aleksandro Stulginskio universitetas). pp. 166.
- Kalnin, A.; Kalinina, V.; Teplinsky, I.; Ruzhev, V. Selection and justification of potato inter row tillage systems based on development of dynamic model of heat and moisture transfer between soil layers. Engineering for Rural Development 2020, 19, 819–825. [Google Scholar] [CrossRef]
- Chetan, F.; Chetan, C.; Muresanu, F.; Suciu, L.; Crisan, I. Research regarding the efficiency of soybean cultivation in different tillage systems and their influence on soil compaction, acumulation and water storage. Romanian Journal for Plant Protection 2021, 14, 1–8. [Google Scholar] [CrossRef]
- Juchnevičienė, A.; Raudonius, S.; Avižienytė, D.; Romaneckas, K.; Bogužas, V. Ilgalaikio supaprastinto žemės dirbimo ir tiesioginės sėjos įtaka žieminių kviečių pasėliui. Žemės ūkio mokslai. 2012, 19(3), 139–150. [CrossRef]
- Volungevičius, J.; Kavaliauskas, P. Lietuvos dirvožemiai. 2014. Vilnius. pp. 23.
- IUSS Working Group WRB. World Reference Base for Soil Resources 2023. International Soil Classification System for Naming Soils and Creating Legends for Soil Maps; Update 2023. World Soil Resources Report; FAO: Rome, Italy, 186(2), p. 151–163.
- Lohmann, G. 1994. Entwicklung eines Bewertungsverfahrens für Anbausysteme mit differenzierten Aufwandmengen ertragssteigernder und ertragssichernder Betriebsmittel: doctoral dissertation. Bonn.
- Heyland, K.U. 1998. Zur methodik einer integrierten darstellung und bewertung der produktionsverfahren im pflanzenbau. Pflanzenbauwissenschaften, Bd. 2, S. 145–159.
- Leonavičienė, T. SPSS programų paketo taikymas statistiniuose tyrimuose. Vilnius: Vilniaus pedagoginio universiteto leidykla, 2007. pp. 126.
- Raudonius, S. Application of statistics in plant and crop research: important issues. Zemdirbyste-Agriculture, 2017. 104(4). 377‒382. [CrossRef]
- Parvin, N.; Coucheney, E.; Gren, M.; Andersson, H.; Elofsson, K. On the relationships between the size of agricultural machinery, soil quality and net revenues for farmers and society. Soil Security 2022, 6, 1–8. [Google Scholar] [CrossRef]
- Sae-Tun, O.; Bodner, G.; Rosinger, C.; Zechmeister-Boltenstern, S.; Mentler, A.; Keiblinger, K. Fungal biomass and microbial necromass facilitate soil carbon sequestration and aggregate stability under different soil tillage intensities. Applied Soil Ecology 2022, 179, 1–10. [Google Scholar] [CrossRef]
- Feiza, V.; Šlepetienė, A.; Feizienė, D.; Liaudanskienė, I.; Deveikytė, I.; Pranaitienė, S. Ilgalaikio įvairaus intensyvumo išteklių naudojimo poveikis skirtingos genezės dirvožemiams ir kitiems agroekosistemų komponentams. 2019. Agrariniai ir miškininkystės mokslai: naujausi tyrimų rezultatai ir inovatyvūs sprendimai: mokslinės konferencijos pranešimai. Lithuania, Academy, 9, p. 8–9.
- Long, S. P.; Zhu, X.G.; Naidu, S.L.; Ort, D.R. Can improvement in photosynthesis increase crop yields? Plant, Cell & Environment. 2006, 29(3), 315–330. [CrossRef]
- Pyrantienė, D.; Savilionis, A.; Liakas, V. Kompiuterinio modeliavimo panaudojimas žieminių kviečių derlingumui prognozuoti. Vagos, 2002, 56(9), 100–104.
- Del Pozo, A.; Dennett, M.D. Analysis of the distribution of light, leaf nitrogen, and photosynthesis within the canopy of Vicia faba L. at two contrasting plant densities. Australian Journal of Agricultural Research 1999, 50(2), 183–190. [Google Scholar] [CrossRef]
- Nakano, S.; Purcell, L.C.; Homma, K.; Shiraiwa, T. Modeling leaf area development in soybean (Glycine max L.) based on the branch growth and leaf elongation. Plant Production Science. 2020, 23(3), 247–259. [CrossRef]
- Balčiūnas, M.; Jankauskienė, Z.; Brazaitytė, A., Duchovskis, P. Lapų indekso ir fotosintezės pigmentų dinamika įvairaus tankumo pluoštinių linų pasėlyje. Žemdirbystė, 2008, t. 95(4), 97–109.
- Butkutė, B.; Cesevičienė, J. Lygčių kūrimas kviečių grūdų kokybę vertinant spektrometru NIRS6500I. Grūdų kokybės ir optinių duomenų bazės charakteristika. Žemdirbystė-Agriculture. 2009, 96(4), 62–77.
- Marcinkevičienė, A.; Keidan, M.; Pupalienė, R.; Velička, R.; Kriaučiūnienė, Z.; Butkevičienė, L.M.; Kosteckas, R. Nonchemical weed control in winter oilseed rape crop in the organic farming system. In Organic Agriculture, 2020, 121–131.
- Mass, M.T.; Verdu, A.M. Tillage system effects on weed communities in a 4-year crop rotation under Mediterranean dryland conditions. Soil and Tillage Research, 2003, 74(2), 15–24. [CrossRef]
- Melander, B.; Rasmussen, J.; Sørensen, P. Cover crop effects on the growth of perennial weeds in two long-term organic crop rotations. Renewable Agriculture and Food Systems 2024, 39, 1–20. [Google Scholar] [CrossRef]
- Petraitis, V.; Semaškienė, R. 2005. Vasariniai kviečiai. Akademija, 78.
- Gelsomino, A.; Araniti, F.; Lupini, A.; Princi, G.; Petro-Vičova, B.; Abenovoli, M. R. Phenolic acids in plant-soil interactions: a microcosm experiment. Journal of Allelochemical Interactions. 2015, 1(1), 25–38 https://www.academia.edu/download/39224415/544692f20cf2f14fb80f8097.pdf.
- Triboi, E.; Triboi-Blondel, A.M. Productivity and grain or seed composition: a new approach to an old problem—invited paper. European Journal of Agronomy 2002, 16, 163−186. [Google Scholar] [CrossRef]
- Šiuliauskas, A. 2015. Praktinė augalininkystė. Javai ir rapsai. Vilnius, pp. 10−95.
- Zhu, X.G.; Long, S.; Ort, D. What is the maximum efficiency with which photosyntesis can corvert solar energy into biomass? Current Opinion in Biotechnology 2008, 19, 1−7. [Google Scholar] [CrossRef] [PubMed]
- Sharma–Natu, P.; Ghildiyal, M. Potential targets for improving photosynthesis and crop yield. Current Science. 2005, 88(12), p. 1918−1928. http://www.jstor.org/stable/24110618.
- Žekonienė, V.; Daugėlienė, N.; Bakutis, B. 2006. Mokslinių rekomendacijų taikymo ekologiniame ūkyje pagrindai. Lithuania, Akademija, Lietuvos žemės ūkio universitetas. pp. 32.
- Mašauskienė, A.; Mašauskas, V. Žieminių kviečių derlingumo potencialas ir grūdų baltymingumas. Maisto chemija ir technologija 2005, 39(1), 38–45. [Google Scholar]
- Juodeikienė, G.; Bašinskienė, L.; Repečienė, A. Grūdų cheminės sudėties ir technologinių savybių nustatymas: mokomoji knyga. Kauno technologijos universitetas. 2008. Maisto produktų technologijos katedra. Kaunas. pp. 134.
- Cesevičienė, J., Mašauskienė, A. Žieminių kviečių grūdų technologinių savybių kitimas sandėliavimo metu. Žemdirbystė: mokslo darbai. 2009, 154-169. https://zemdirbyste-agriculture.lt/96(1)tomas/96_1_tomas_154_169.pdf.
- Lloyd, B.J.; Siebenmorgen, T.J.; Bacon, R.K.; Vories, E. Harvest date and conditioned moisture content effects on test weight of soft red winter wheat. Applied Eng. Agriculture 1999, 15, 525–534. [Google Scholar] [CrossRef]
- Kassam, A. Conservation agriculture for regenerative and resilient production systems. In Biological Approaches to Regenerative Soil Systems. 2023. pp. 251–264. CRC Press.
- Vagusevičienė, I.; Romaneckas, K.; Lekas, V.; Uselis, N.; Kriaučiūnienė, Z.; Duchovskis, P.; Kadžiulienė, Ž.; Jankauskienė, J. 2024. Augalų produktyvumas. Lithuania, LAMMC, VDU ŽŪA. pp. 304.
- Lõiveke, H.; Ilumäe, E.; Laitamm, H. Microfungi in grain and grain feeds and their potentialtoxicity. Agronomy Research 2004, 1, 195–206. [Google Scholar]
- Feiza, V.; Feizienė, D.; Auškalnis, A.; Kadžienė, G. Sustainable tillage: results from long-term field experiments on Cambisol. Žemdirbystė-Agriculture. 2010, 97(2), 3–14.
- Bashandy, S. O.; Sarhan, M. Response of Soybean (Glycine max L.) Plant and Soil Properties to NPK Fertilization and Humate Substances Application under Different Tillage Systems. Journal of Soil Sciences and Agricultural Engineering. 2021. 12(7), 469–479. [CrossRef]
- Kochiieru, M.; Veršulienė, A.; Feiza, V.; Feizienė, D. Trend for soil CO2 efflux in grassland and forest land in relation with meteorological conditions and root parameters. Sustainability 2023, 15(9), 7193. [Google Scholar] [CrossRef]
- Sinkevičius, A. Žemės dirbimo technologijų ilgalaikis poveikis agroekosistemų tvarumui. 2023. (Doctoral dissertation, Vytauto Didžiojo universitetas, Žemės ūkio akademija). pp. 275.
- Pyrantienė, D.; Savilionis, A.; Liakas, V. Kompiuterinio modeliavimo panaudojimas žieminių kviečių derlingumui prognozuoti. Vagos 2002, 56(9), 100–104. [Google Scholar]
- Kanapickas, A.; Vagusevičienė, I.; Sujetovienė, G. The effects of different sowing dates on the autumn development and yield of winter wheat in Central Lithuania. Atmosphere, 2024, 15(6), 738. [CrossRef]
- Miller, G.A.; Rees, R.M.; Griffiths, B.S.; Ball, B.C.; Cloy, J.M. The sensitivity of soil organic carbon pools to land management varies depending on former tillage practices. Soil and Tillage Research 2019, 194, 1–7. [Google Scholar] [CrossRef]
- Šimanskaitė, D. Arimo ir beplūgio žemės dirbimo įtaka dirvožemio fizikinėms savybėms ir augalų produktyvumui. Žemės ūkio mokslai. 2007, 14(1), 9–19.
- Cesevičius, G.; Janušauskaitė, D. Dirvožemio mikrobiologinės ir fizikinės savybės įvairiose žemės dirbimo sistemose. Žemdirbystė. 2006, 93(3), 18–34.
- Poorter, H.; Navas, M. L. Plant growth and competition at elevated CO2: on winners, losers and functional groups. New Phytologist 2003, 157(2), 175–198. [Google Scholar] [CrossRef] [PubMed]
- Jaleel, C.A.; Manivannan, P.; Sankar, B.; Kishorekumar, A.; Gopi, R. Water deficit stress mitigation by calcium chloride in Catharanthus roseus: Effects on oxidative stress, proline metabolism and indole alkaloid accumulation. Colloids and surfaces B: Biointerfaces. 2007, 60(1), 110–116. [CrossRef]
- Velykis, A.; Satkus, A. Supaprastinto sunkių priemolių dirbimo įtaka vasarinių miežių piktžolėtumui ir derlingumui. Žemės ūkio mokslai. 2012, 19(4), 236–248.
Figure 1.
Average precipitation at Kaunas Meteorological Station in 2022–2024.
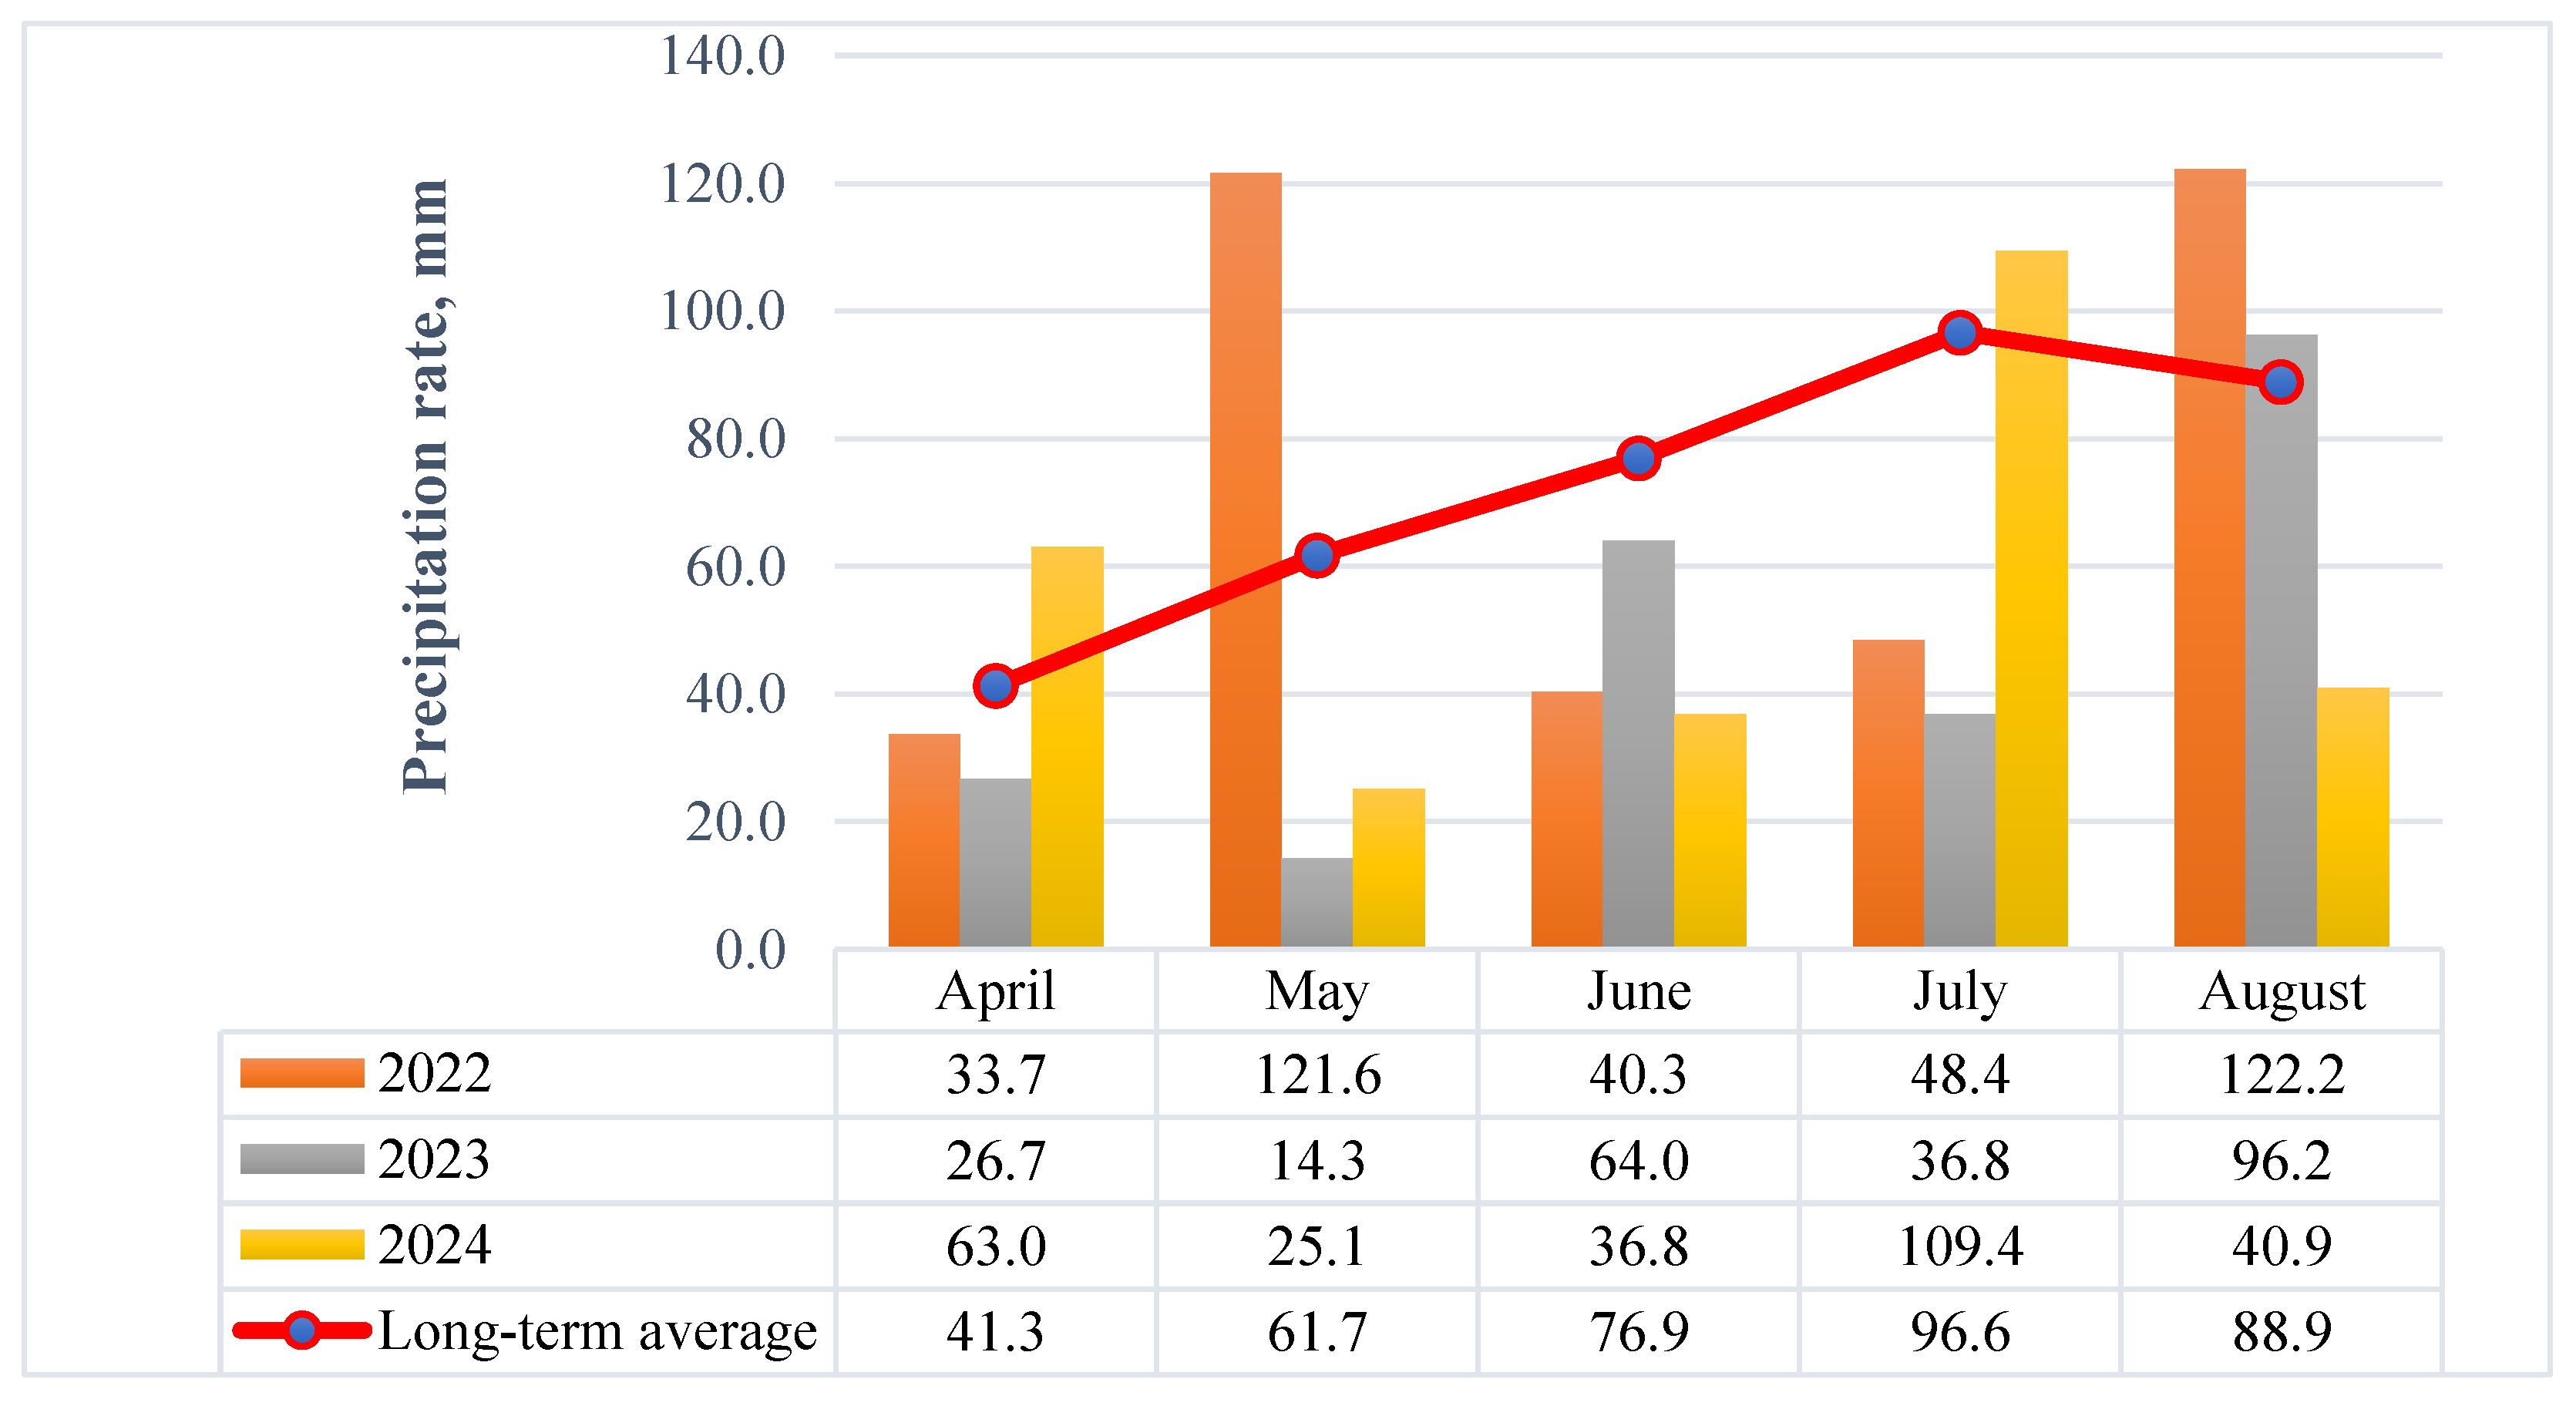
Figure 2.
Average air temperature at Kaunas Meteorological Station in 2022–2024.
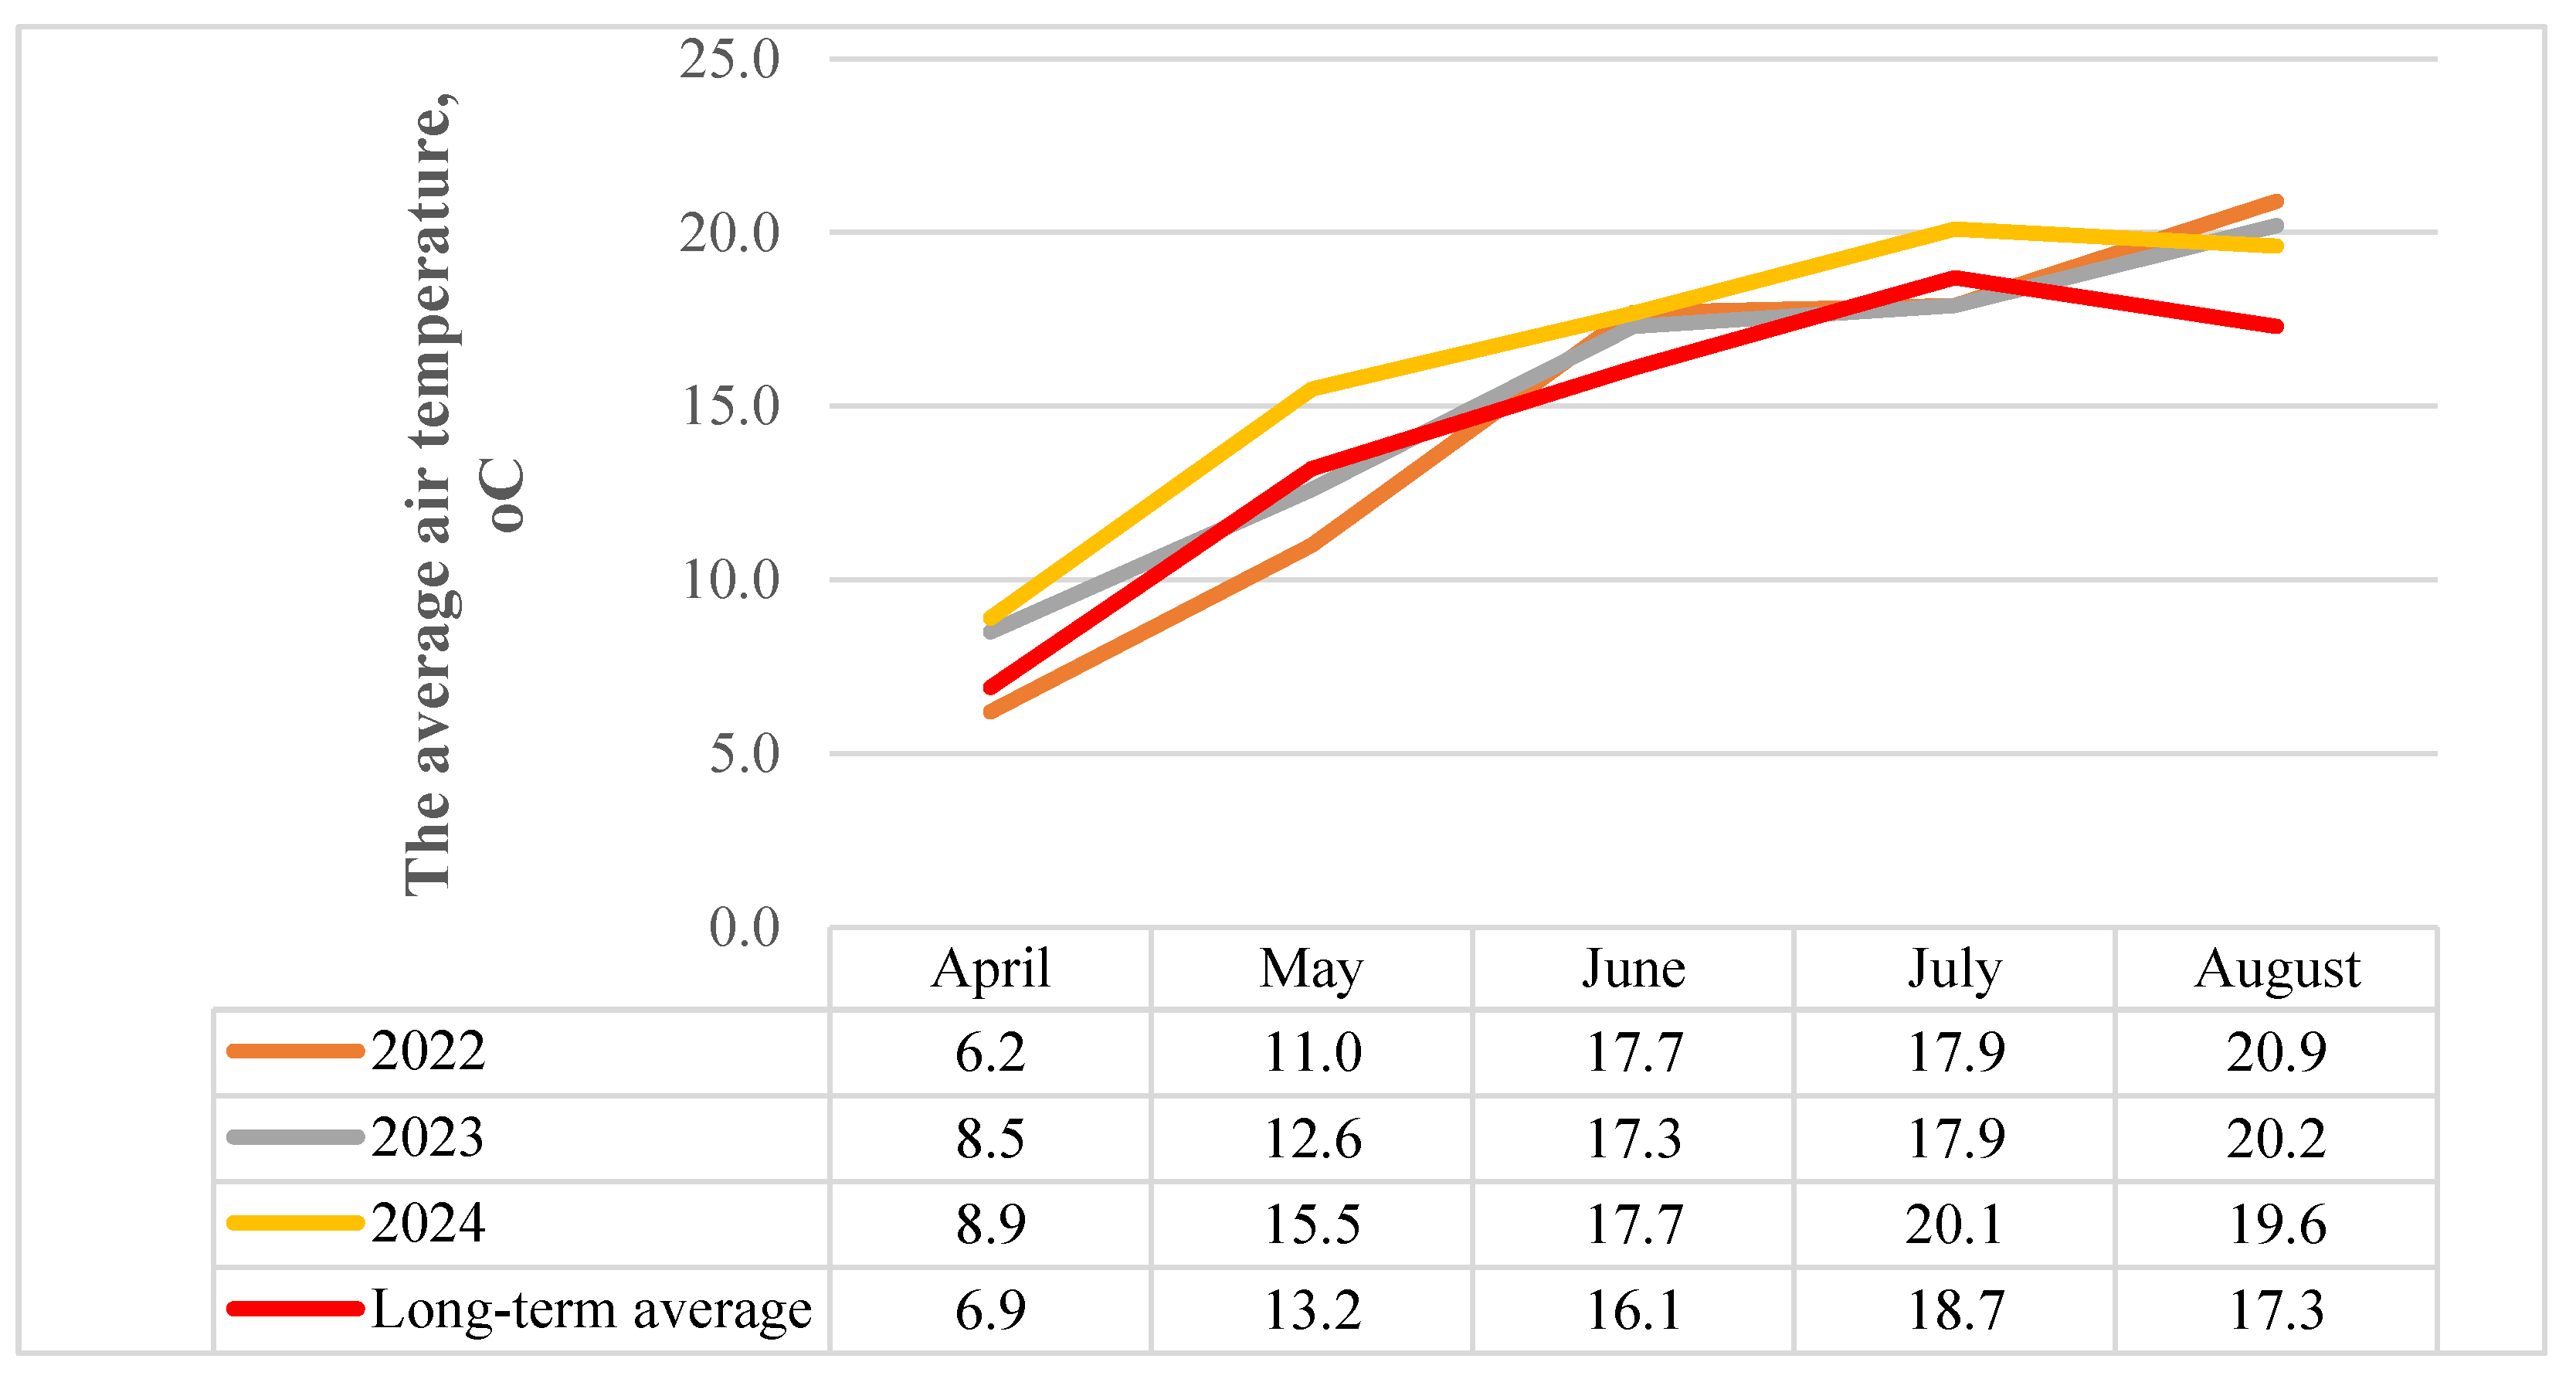
Figure 3.
Spring barley crop germination after 10 days, under different tillage systems, 2022–2024. Note: DP—Deep plowing, SP—Shallow plowing; DC—Deep cultivation, chiseling, SC—Shallow cultivation-disking, NT—No-tillage. No significant differences at P > 0.05. Whiskers indicate standard errors of the means.
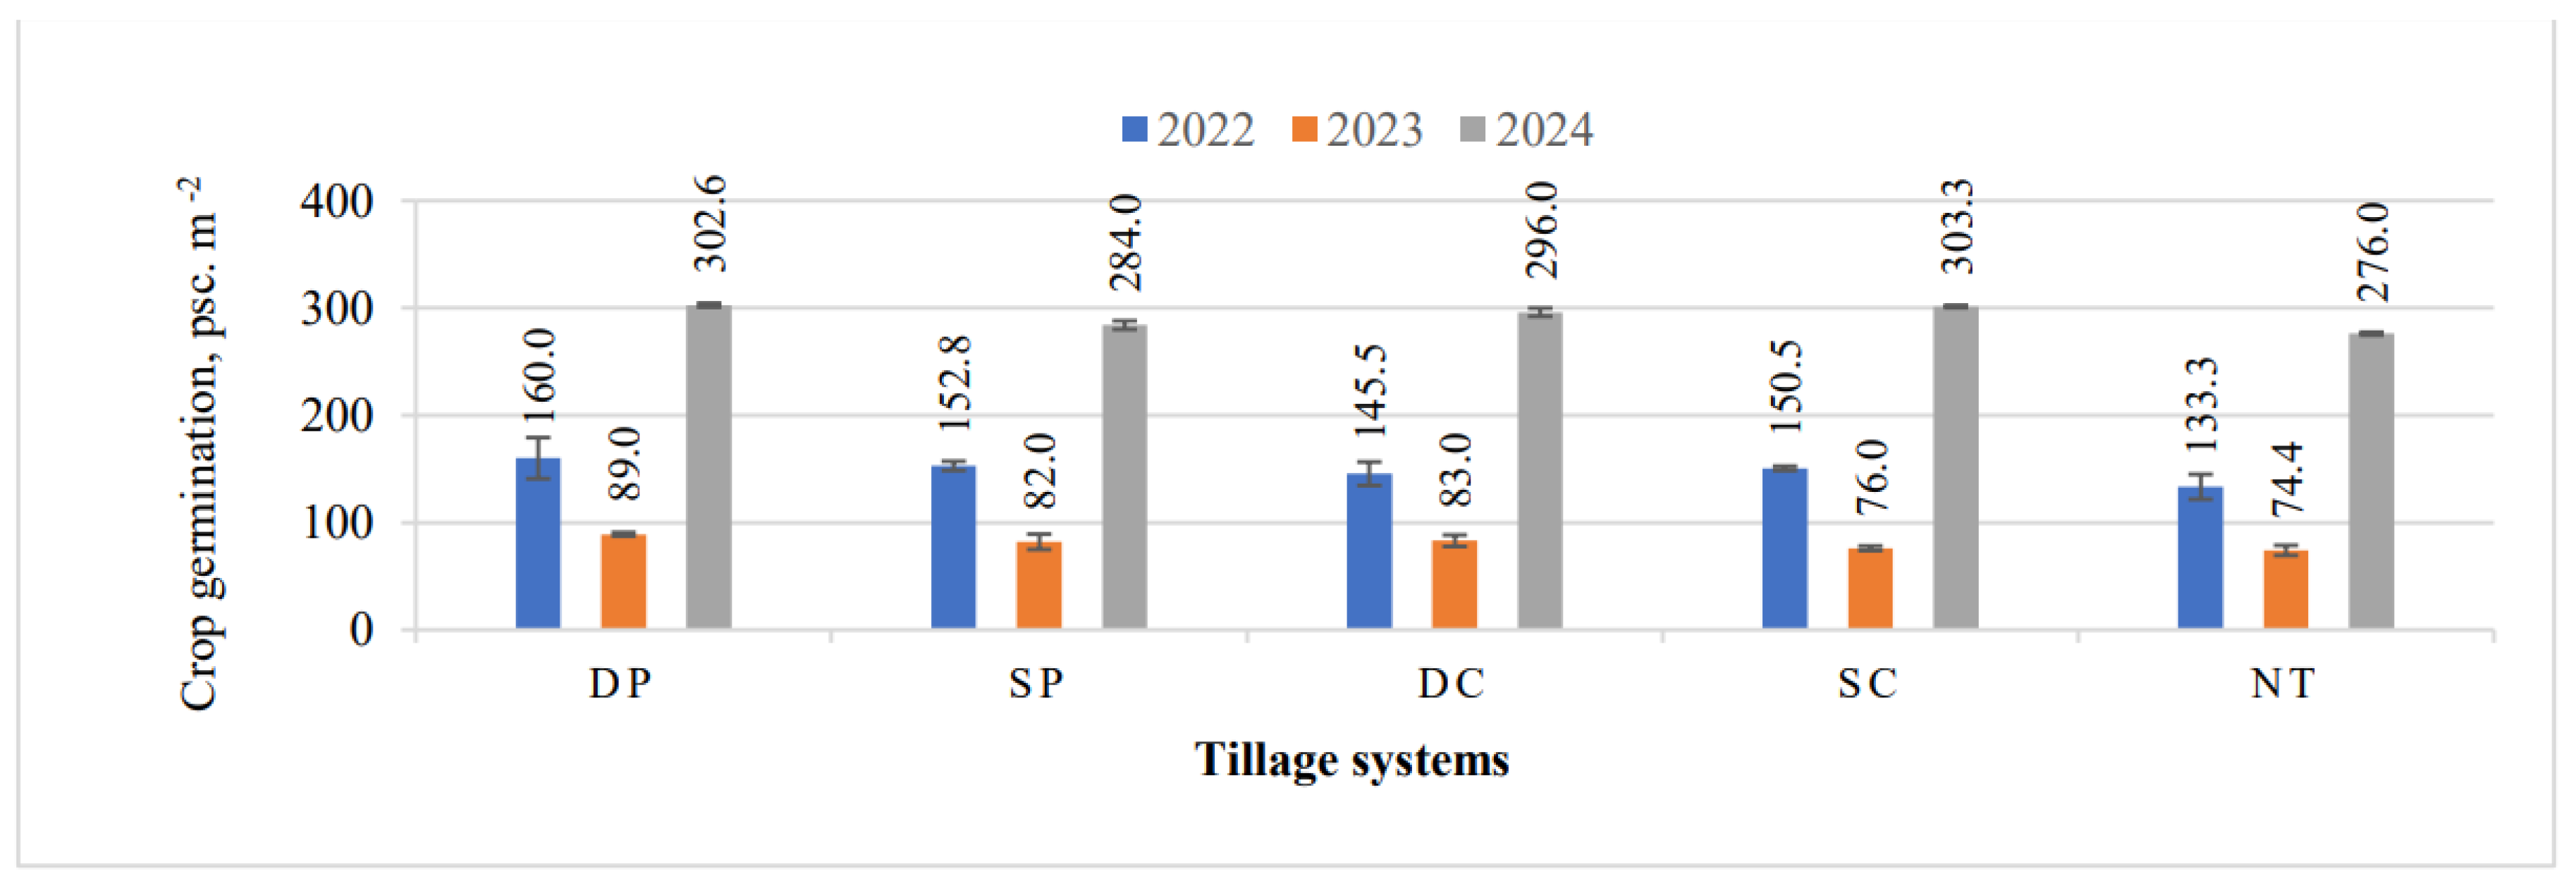
Figure 4.
Spring barley crop density under different tillage systems, 2022–2024. Note: DP—Deep plowing, SP—Shallow plowing; DC—Deep cultivation, chiseling, SC—Shallow cultivation-disking, NT—No-tillage. No significant differences at P > 0.05. Whiskers indicate standard errors of the means.
Figure 4.
Spring barley crop density under different tillage systems, 2022–2024. Note: DP—Deep plowing, SP—Shallow plowing; DC—Deep cultivation, chiseling, SC—Shallow cultivation-disking, NT—No-tillage. No significant differences at P > 0.05. Whiskers indicate standard errors of the means.
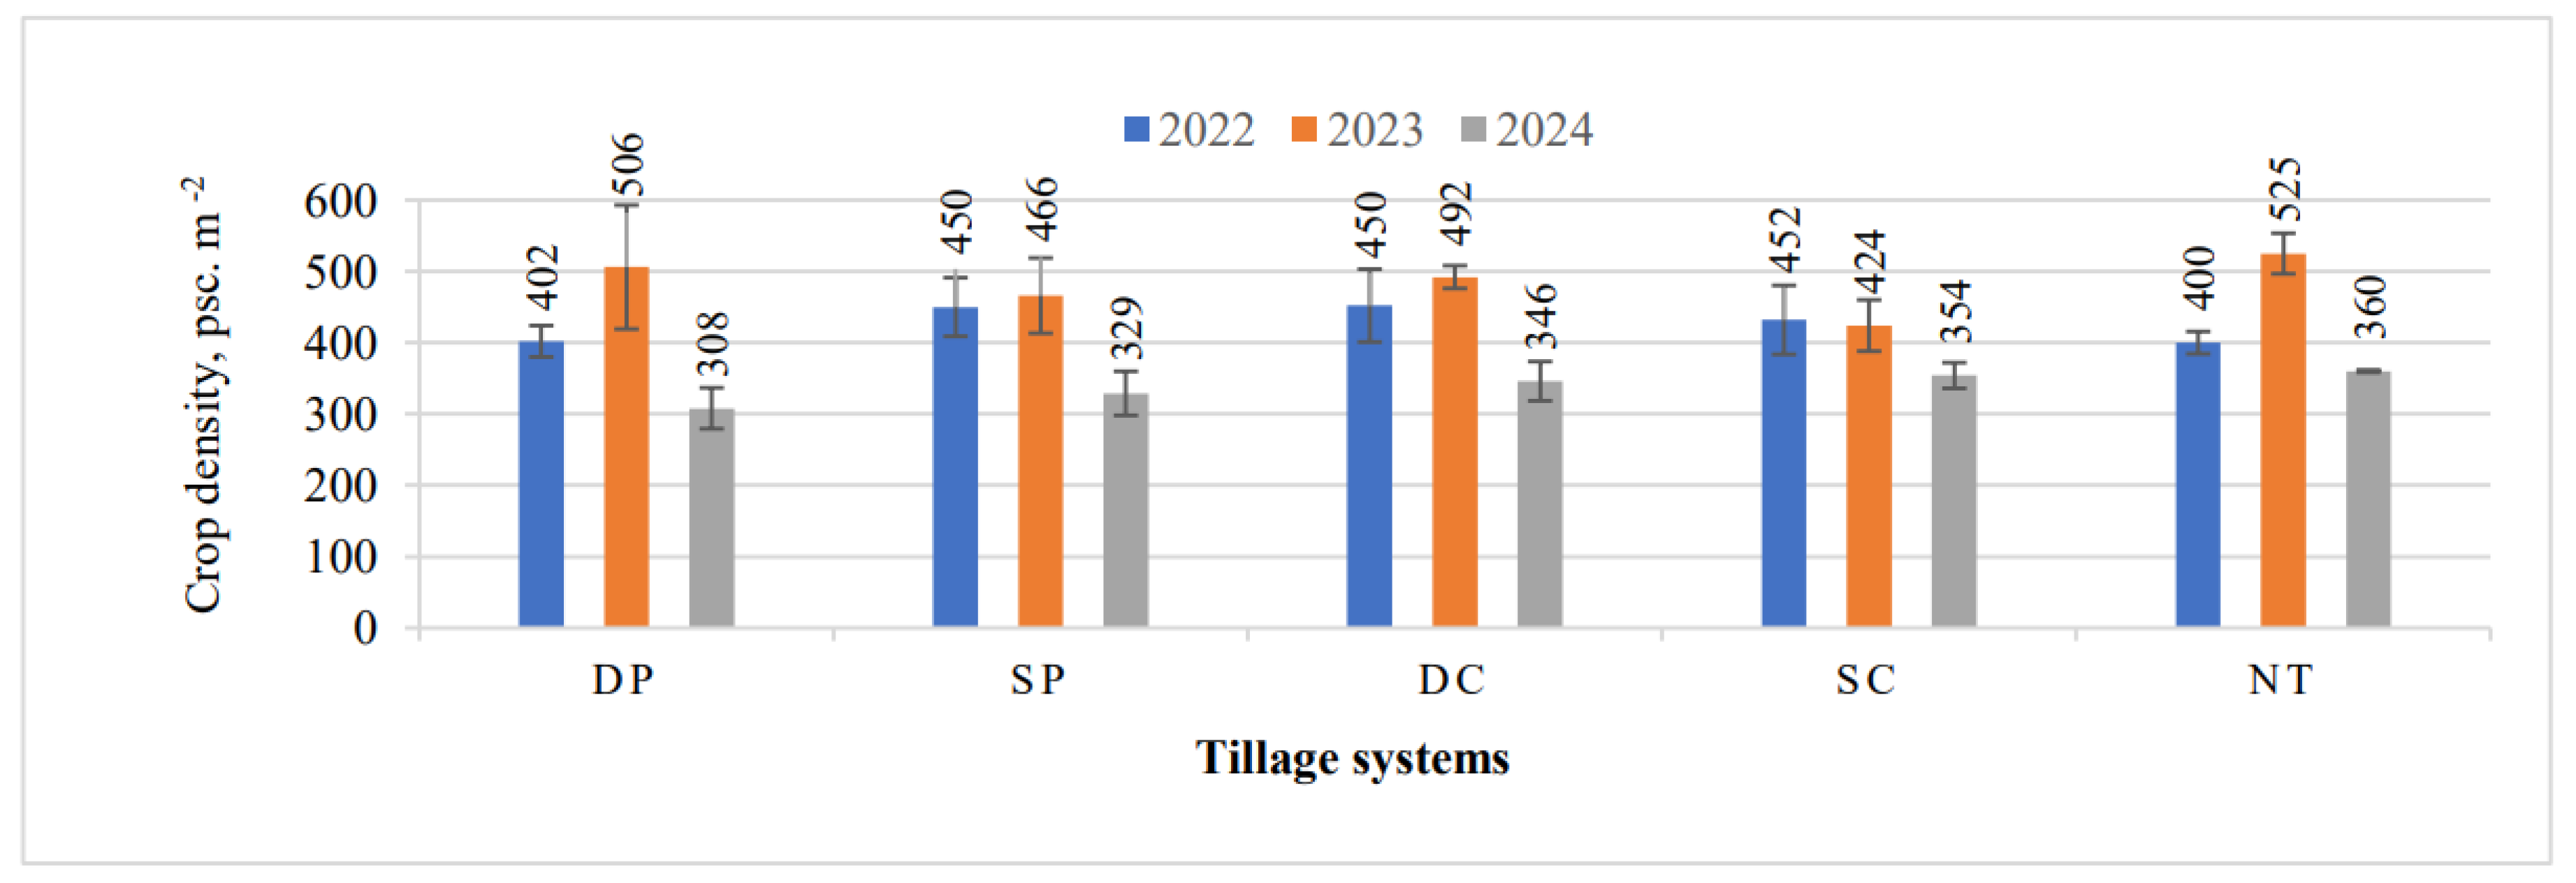
Figure 5.
Spring barley crop yield under different tillage systems, 2022–2024. Note: DP—Deep plowing, SP—Shallow plowing; DC—Deep cultivation, chiseling, SC—Shallow cultivation-disking, NT—No-tillage. Differences significant at *—P ≤ 0.05 > 0.01. Whiskers indicate standard errors of the means.
Figure 5.
Spring barley crop yield under different tillage systems, 2022–2024. Note: DP—Deep plowing, SP—Shallow plowing; DC—Deep cultivation, chiseling, SC—Shallow cultivation-disking, NT—No-tillage. Differences significant at *—P ≤ 0.05 > 0.01. Whiskers indicate standard errors of the means.
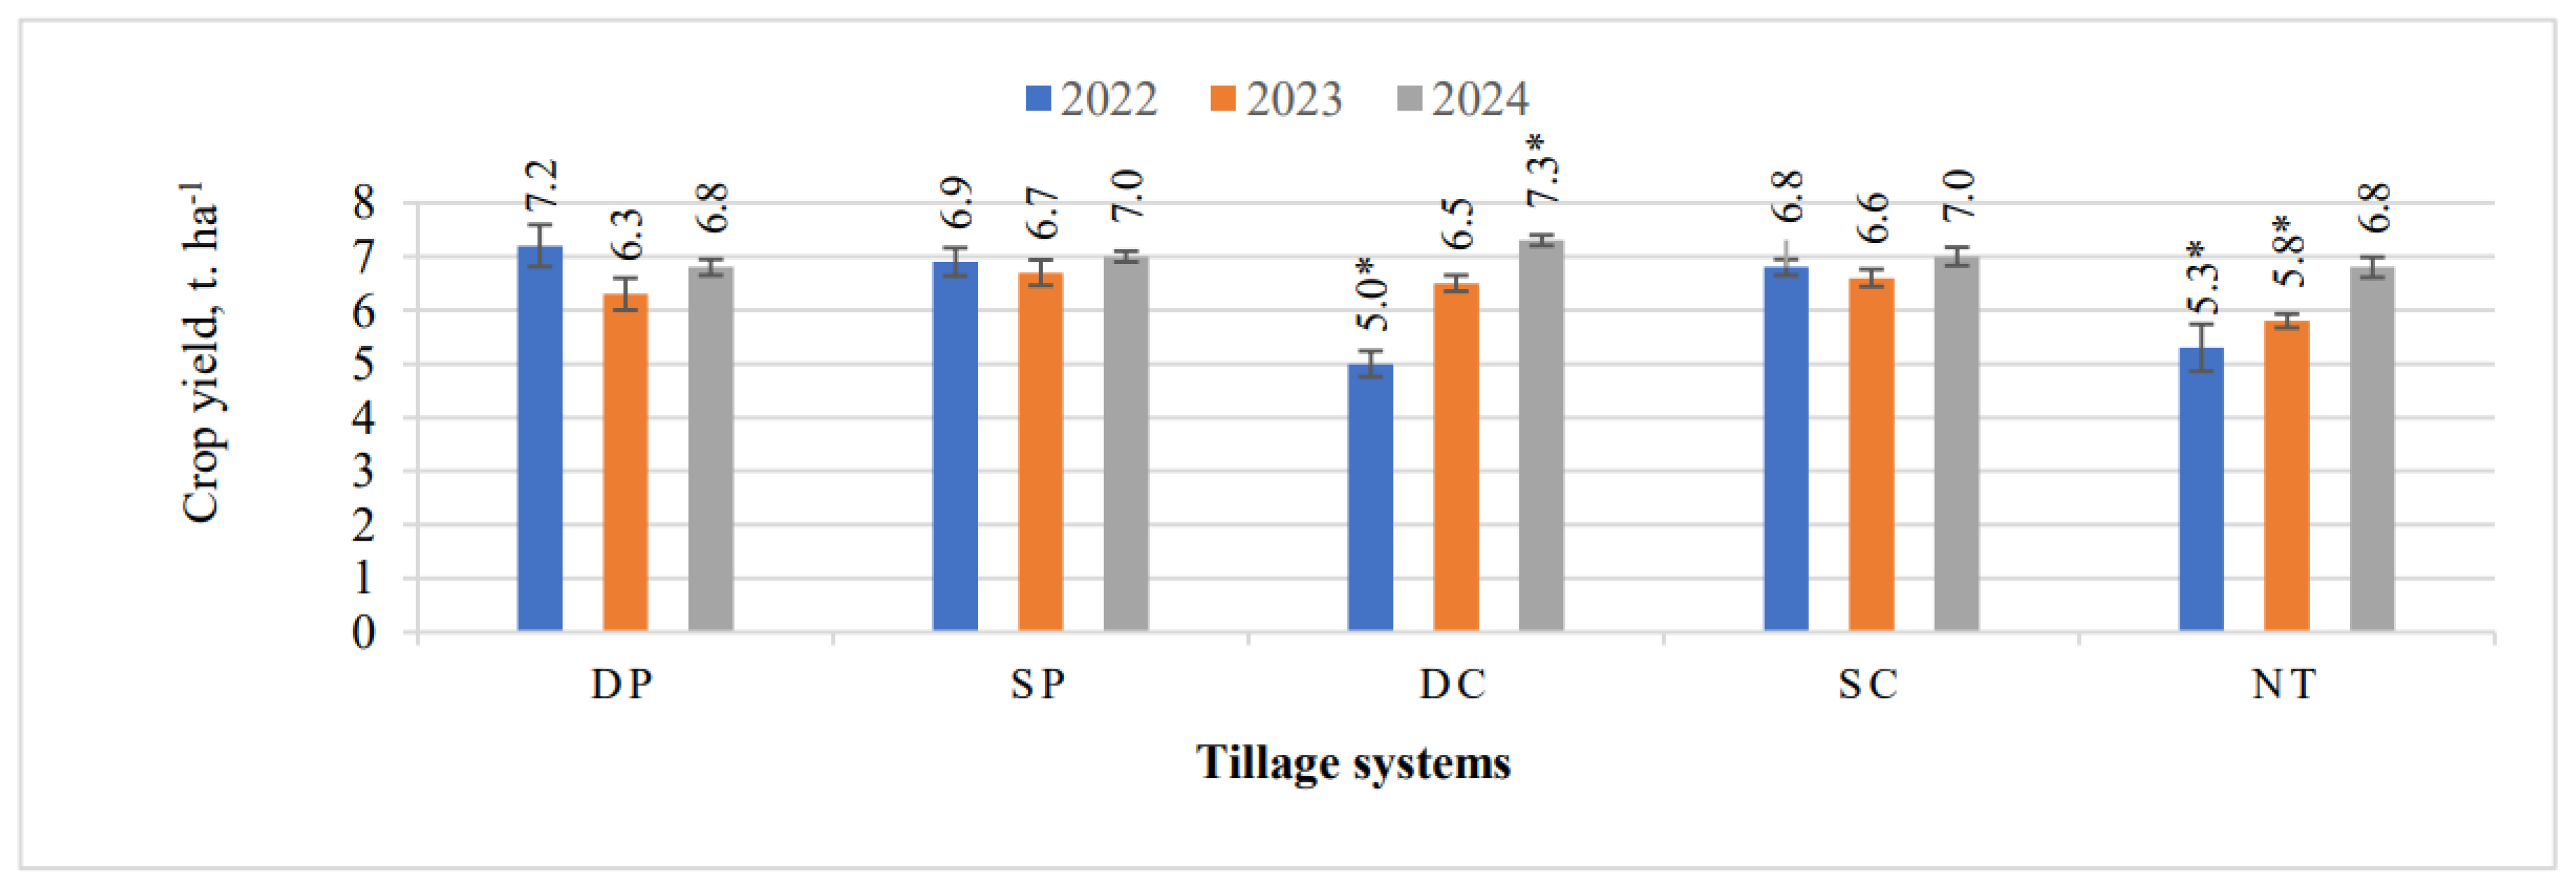
Figure 6.
Protein content of spring barley grains under different tillage systems, 2022–2024. Note: DP—Deep plowing, SP—Shallow plowing; DC—Deep cultivation, chiseling, SC—Shallow cultivation-disking, NT—No-tillage. Differences significant at *—P ≤ 0.05 > 0.01, **—P ≤ 0.01 > 0.001. Whiskers indicate standard errors of the means.
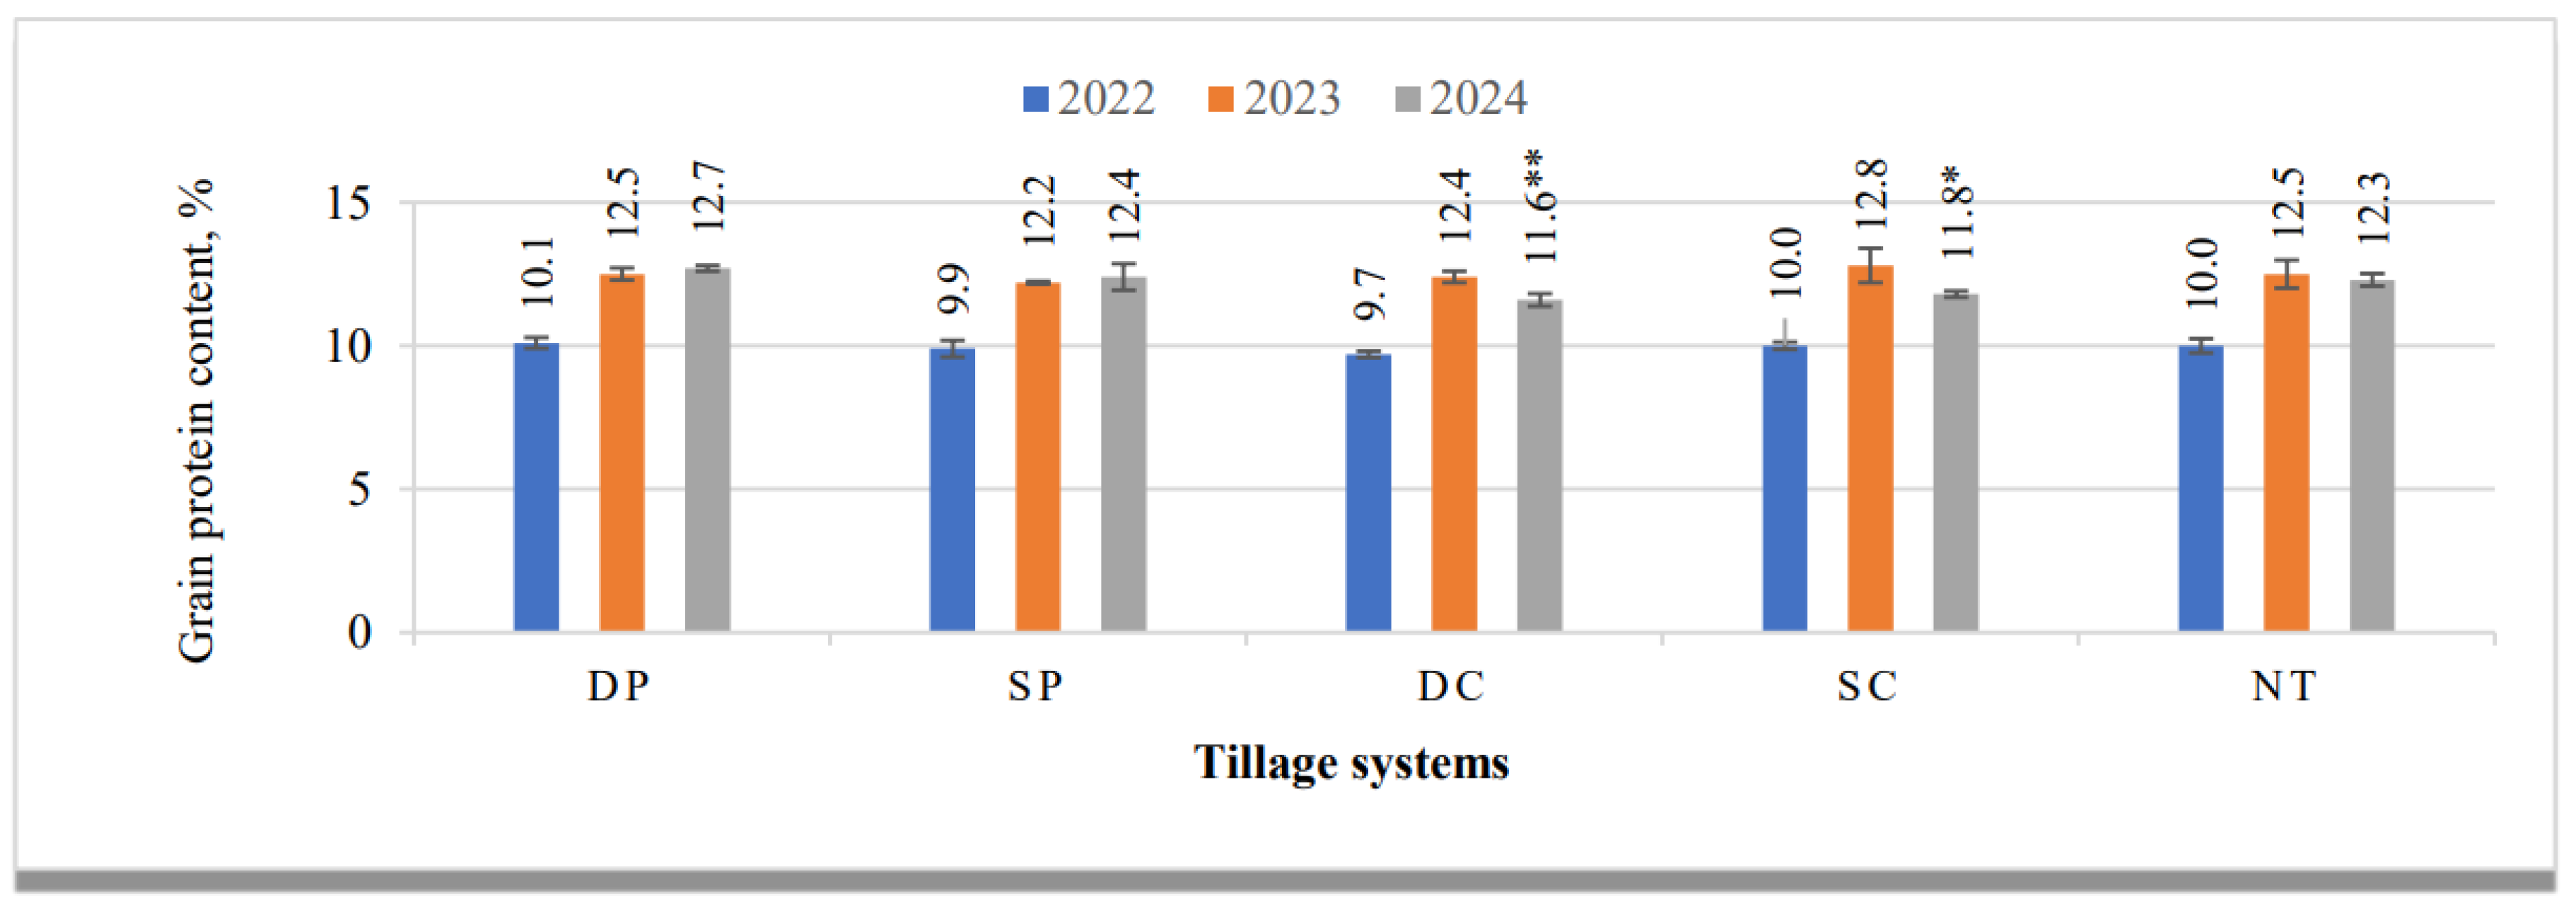
Figure 7.
Starch content of spring barley grains under different tillage systems, 2022–2024. Note: DP—Deep plowing, SP—Shallow plowing; DC—Deep cultivation, chiseling, SC—Shallow cultivation-disking, NT—No-tillage. Differences significant at ***—P ≤ 0.001. Whiskers indicate standard errors of the means.
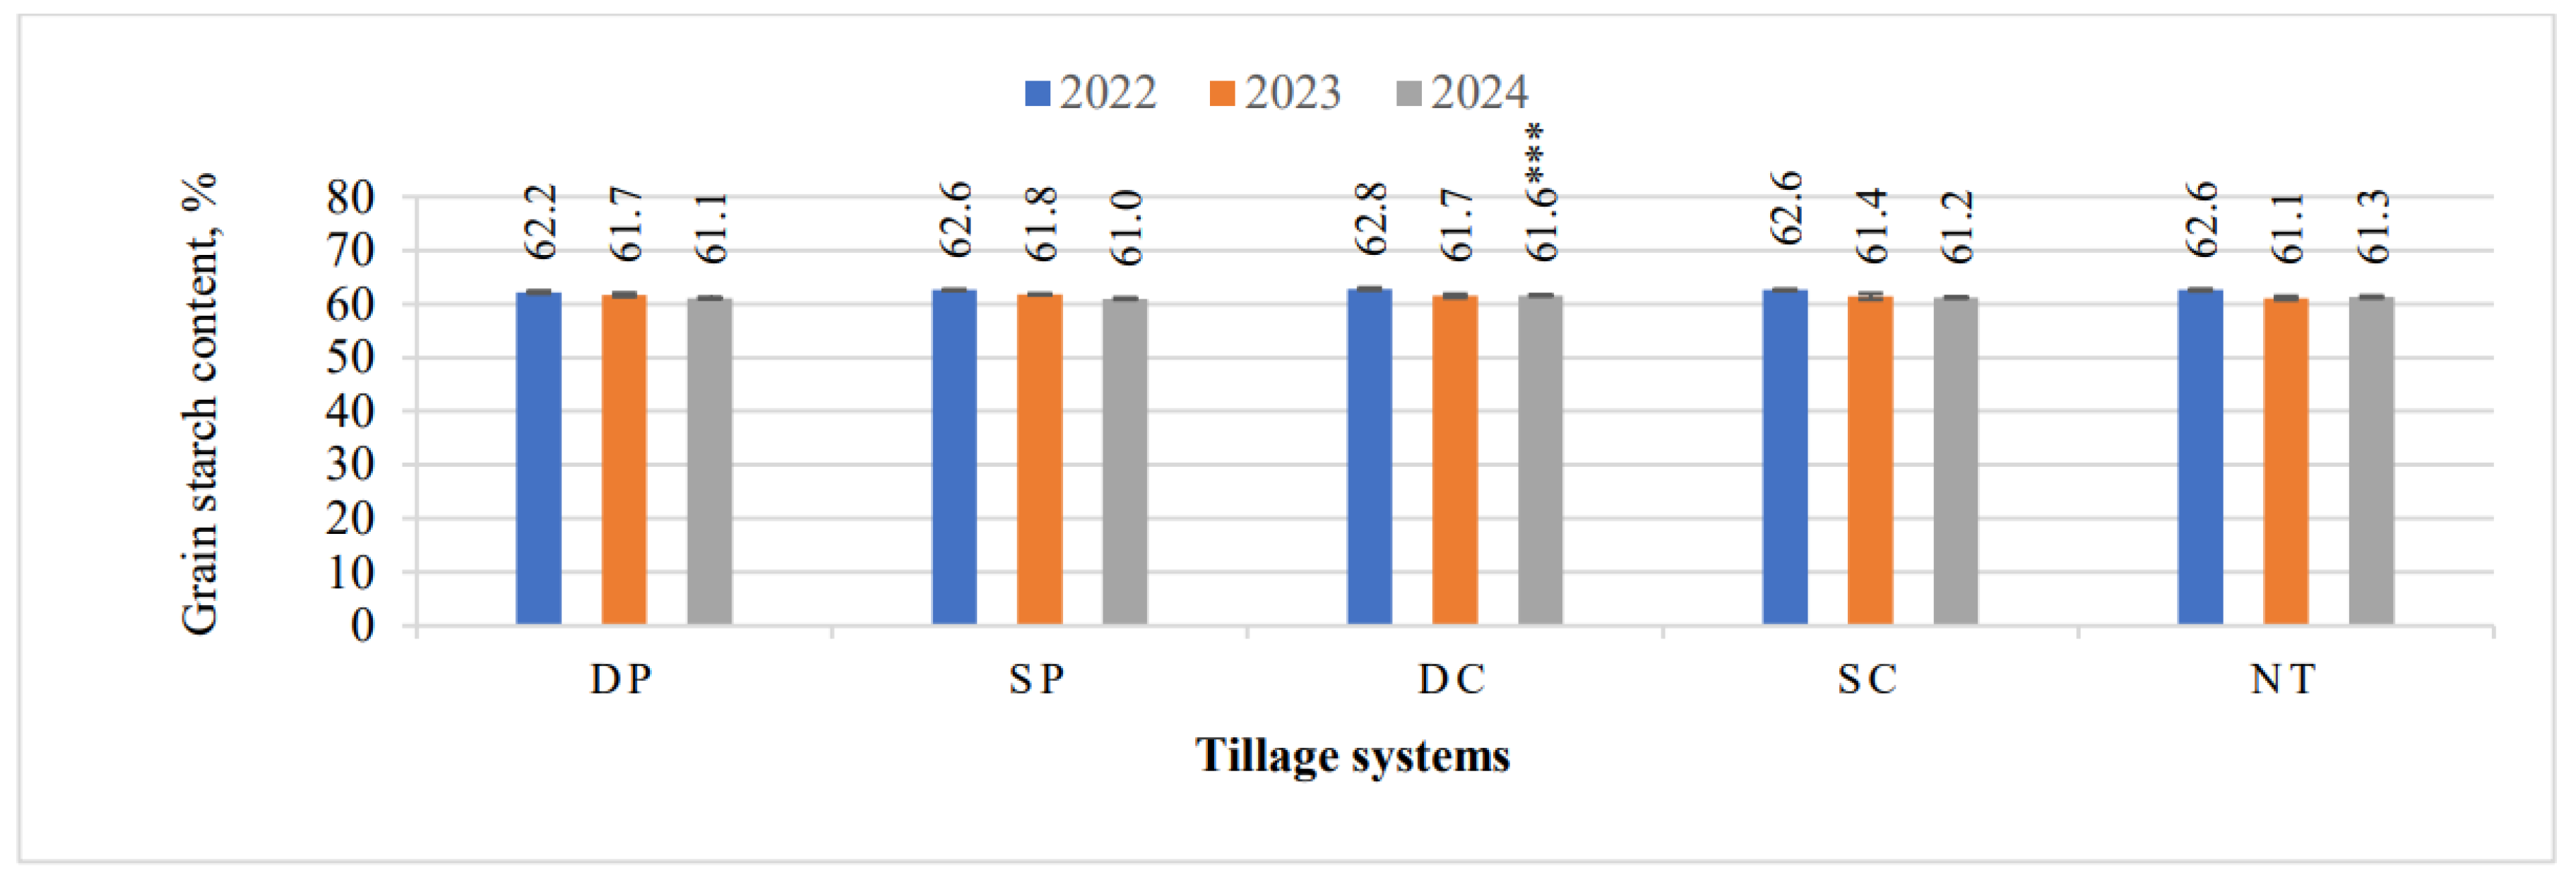
Figure 8.
Hectoliter mass of spring barley grain under different tillage systems, 2022–2024. Note: DP—Deep plowing, SP—Shallow plowing; DC—Deep cultivation, chiseling, SC—Shallow cultivation-disking, NT—No-tillage. No significant differences at P > 0.05. Whiskers indicate standard errors of the means.
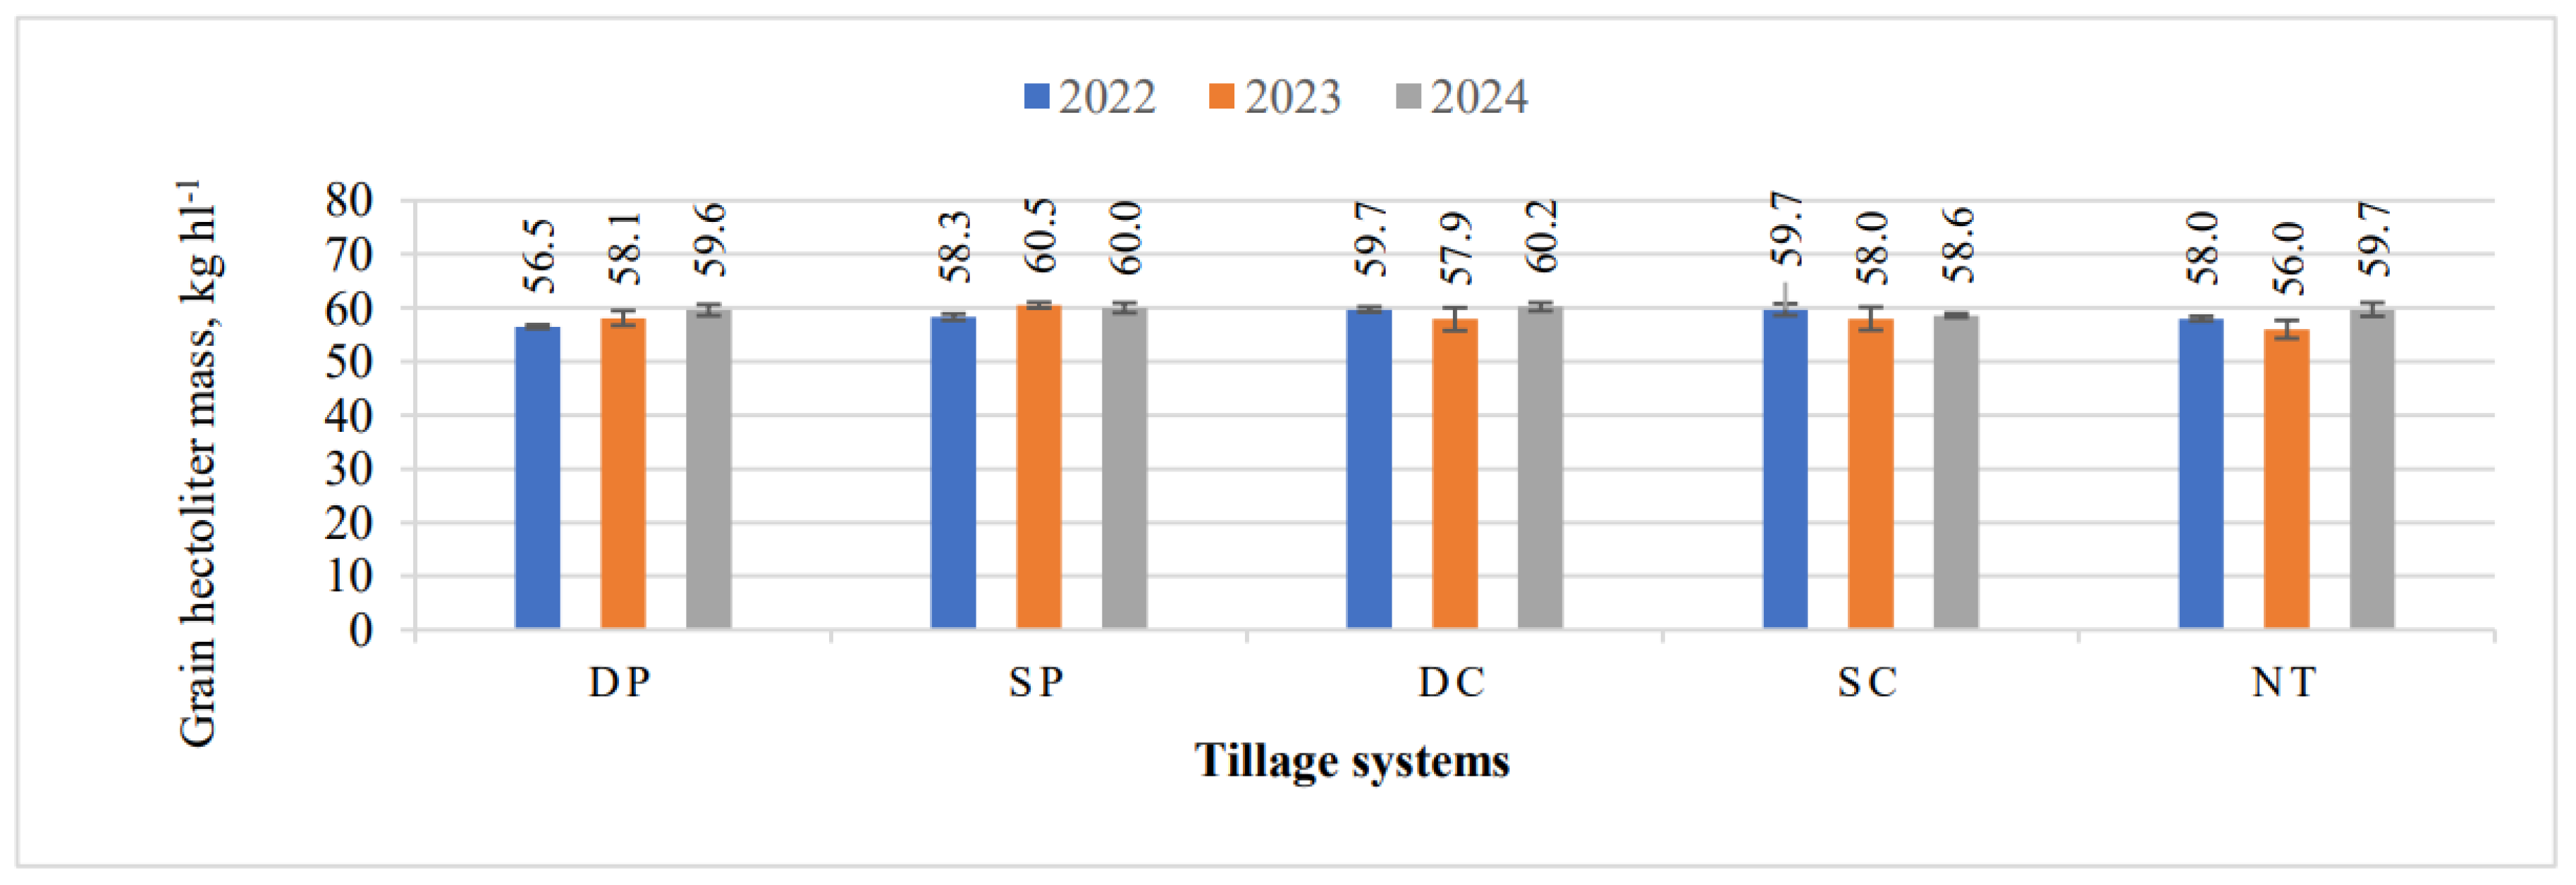
Figure 9.
Spring barley grain moisture content under different tillage systems, 2022–2024. Note: DP—Deep plowing, SP–Shallow plowing; DC—Deep cultivation, chiseling, SC—Shallow cultivation-disking, NT—No-tillage. No significant differences at P > 0.05. Whiskers indicate standard errors of the means.
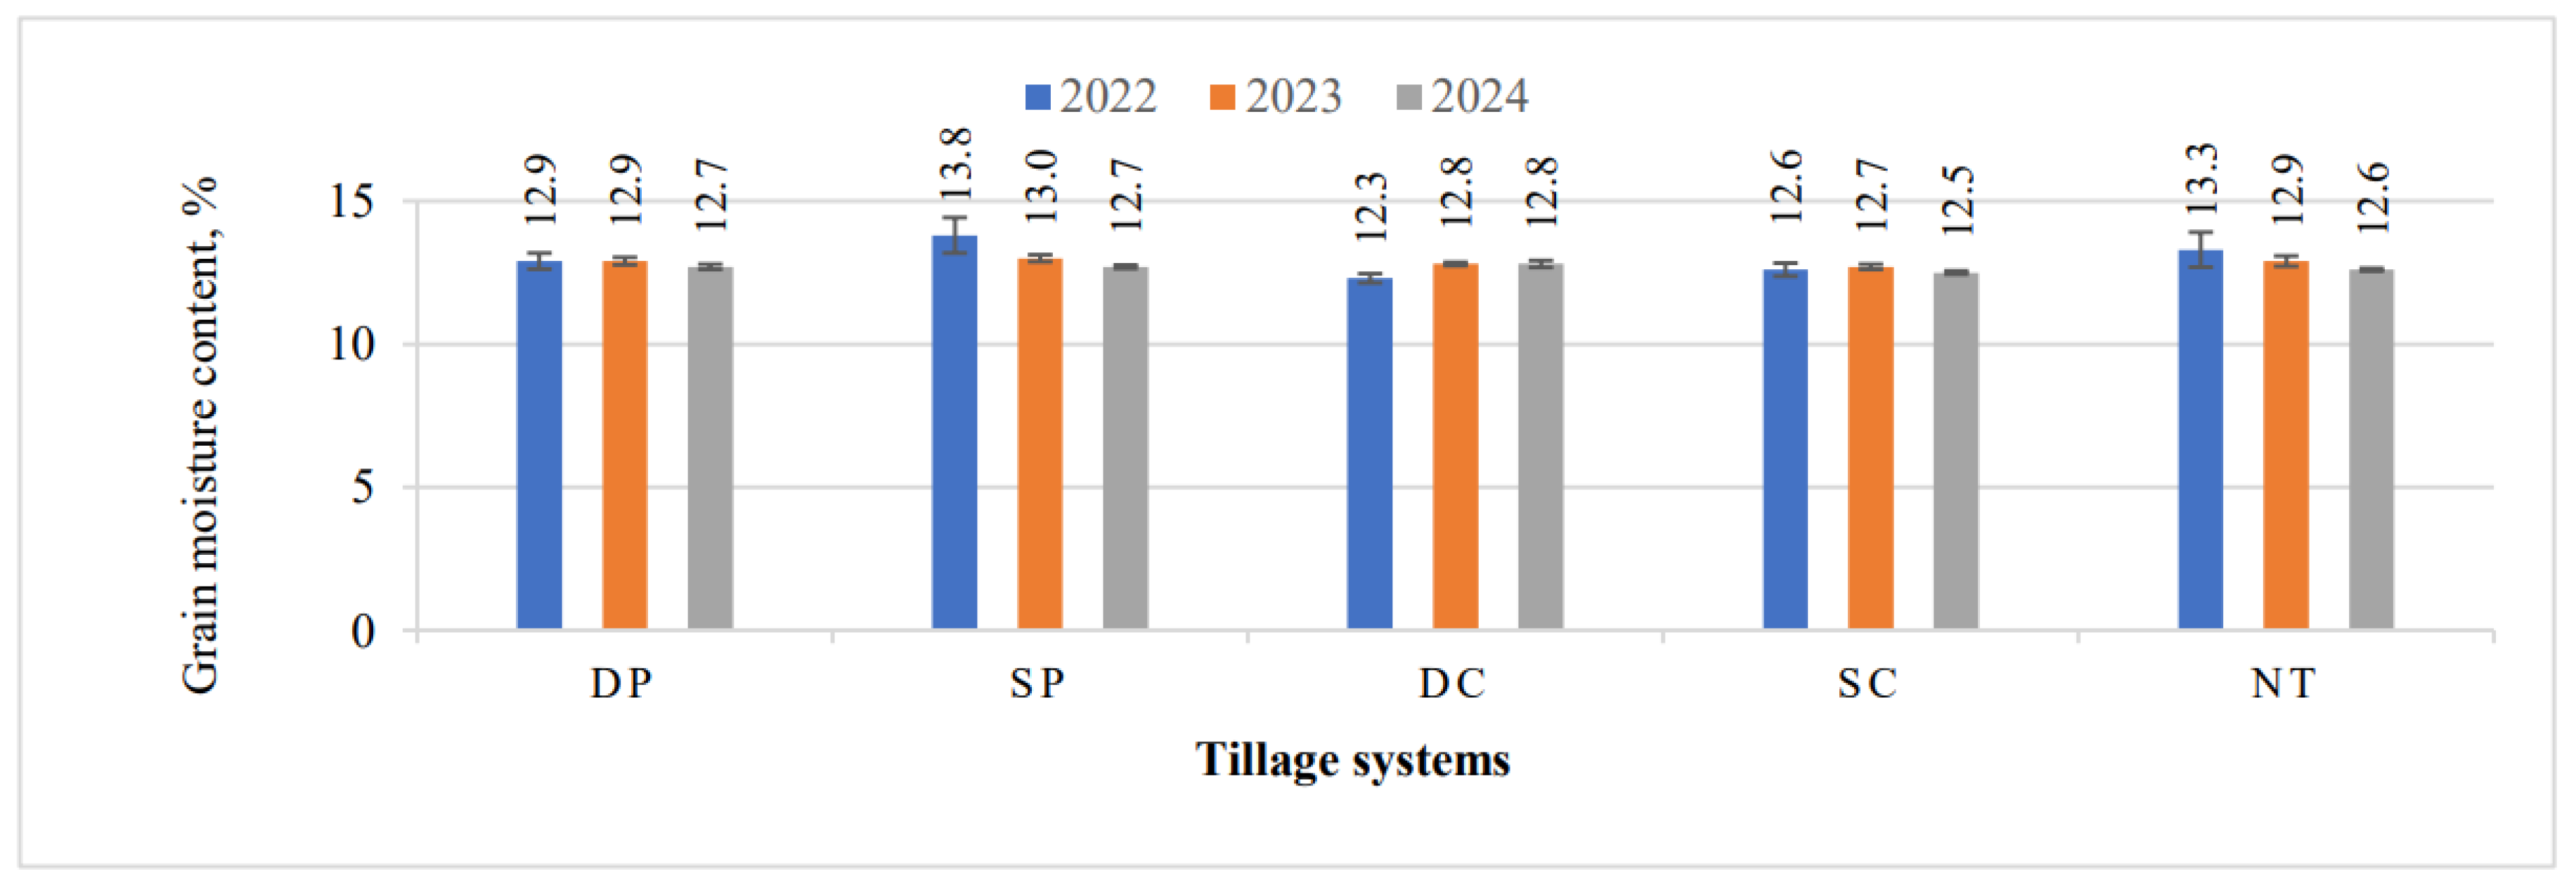
Figure 10.
Complex assessment of long-term effects of tillage technologies 2022. Note: DP—Deep plowing, SP—Shallow plowing; DC—Deep cultivation, chiseling, SC—Shallow cultivation-disking, NT—No-tillage. CEI—complex evaluation indices, *—an average of evaluation points (EP), **—standard deviation of EP, ***—standard deviation of the average of the evaluation points below the evaluation threshold.
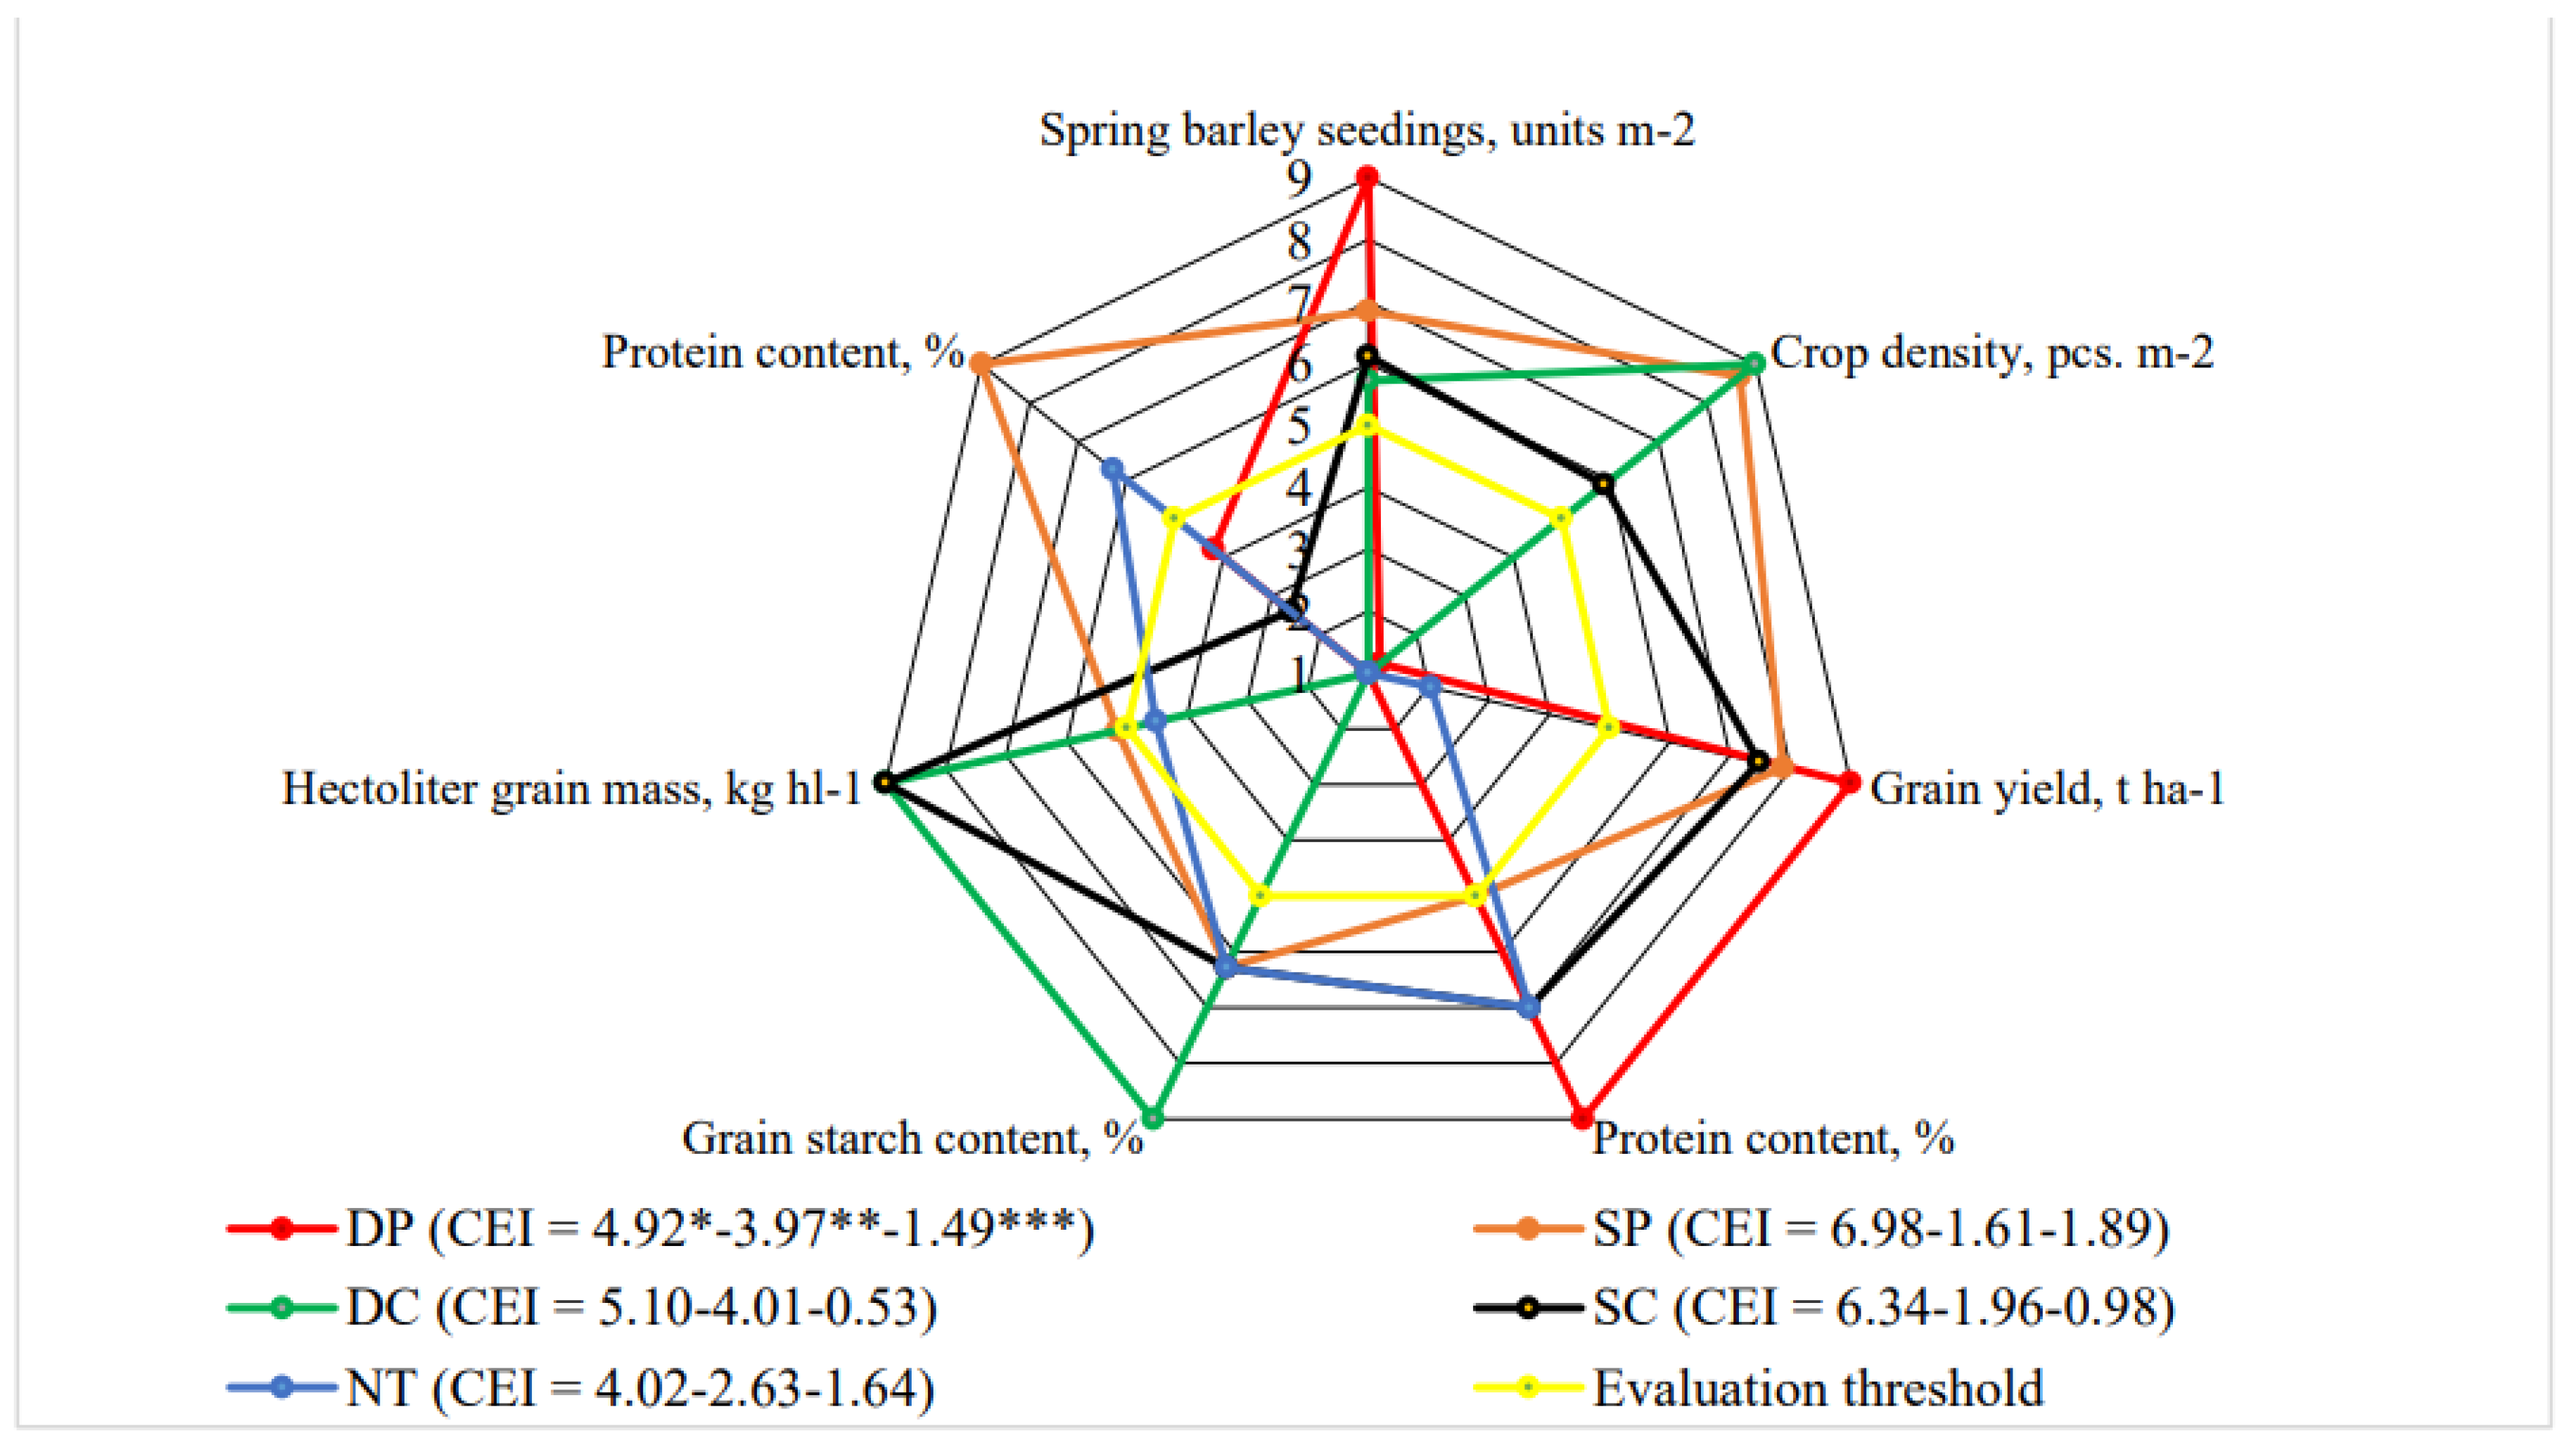
Figure 11.
Complex assessment of long-term effects of tillage technologies 2023. Note: DP—Deep plowing, SP—Shallow plowing; DC—Deep cultivation, chiseling, SC—Shallow cultivation-disking, NT—No-tillage. CEI—complex evaluation indices, *—an average of evaluation points (EP), **—standard deviation of EP, ***—standard deviation of the average of the evaluation points below the evaluation threshold.
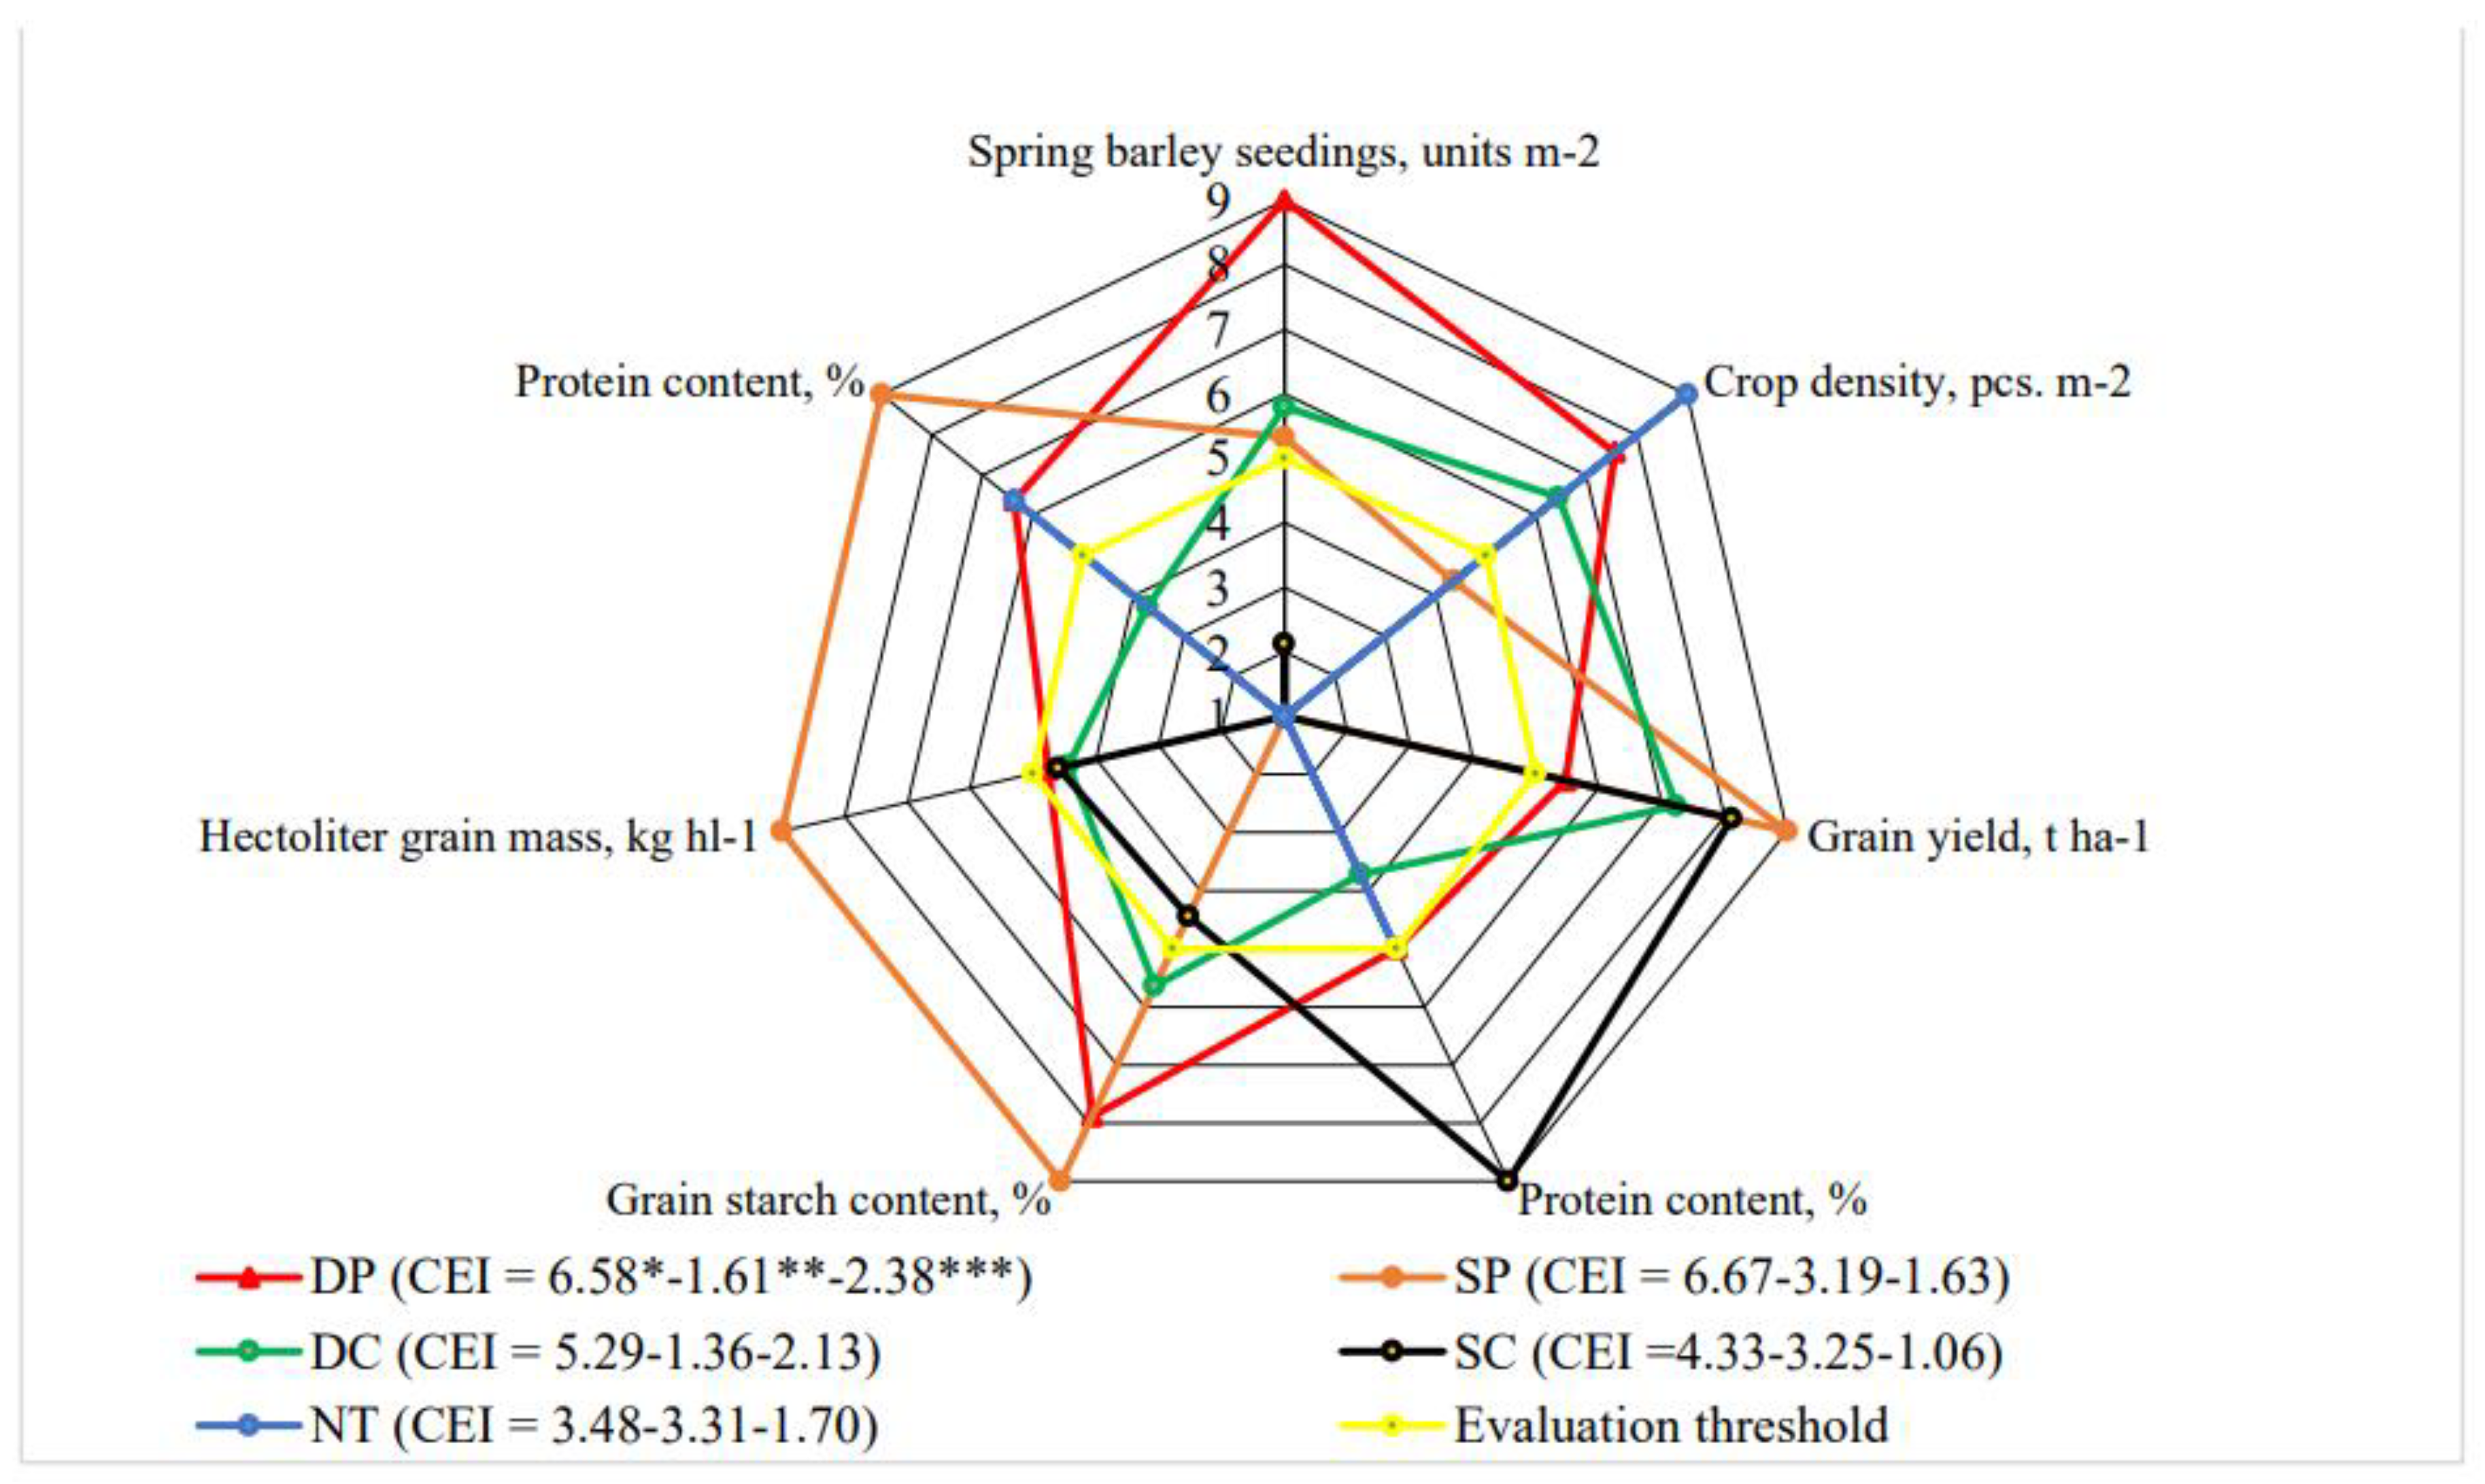
Figure 12.
Complex assessment of long-term effects of tillage technologies 2024. Note: DP—Deep plowing, SP—Shallow plowing; DC—Deep cultivation, chiseling, SC—Shallow cultivation-disking, NT—No-tillage. CEI—complex evaluation indices, *—an average of evaluation points (EP), **—standard deviation of EP, ***—standard deviation of the average of the evaluation points below the evaluation threshold.
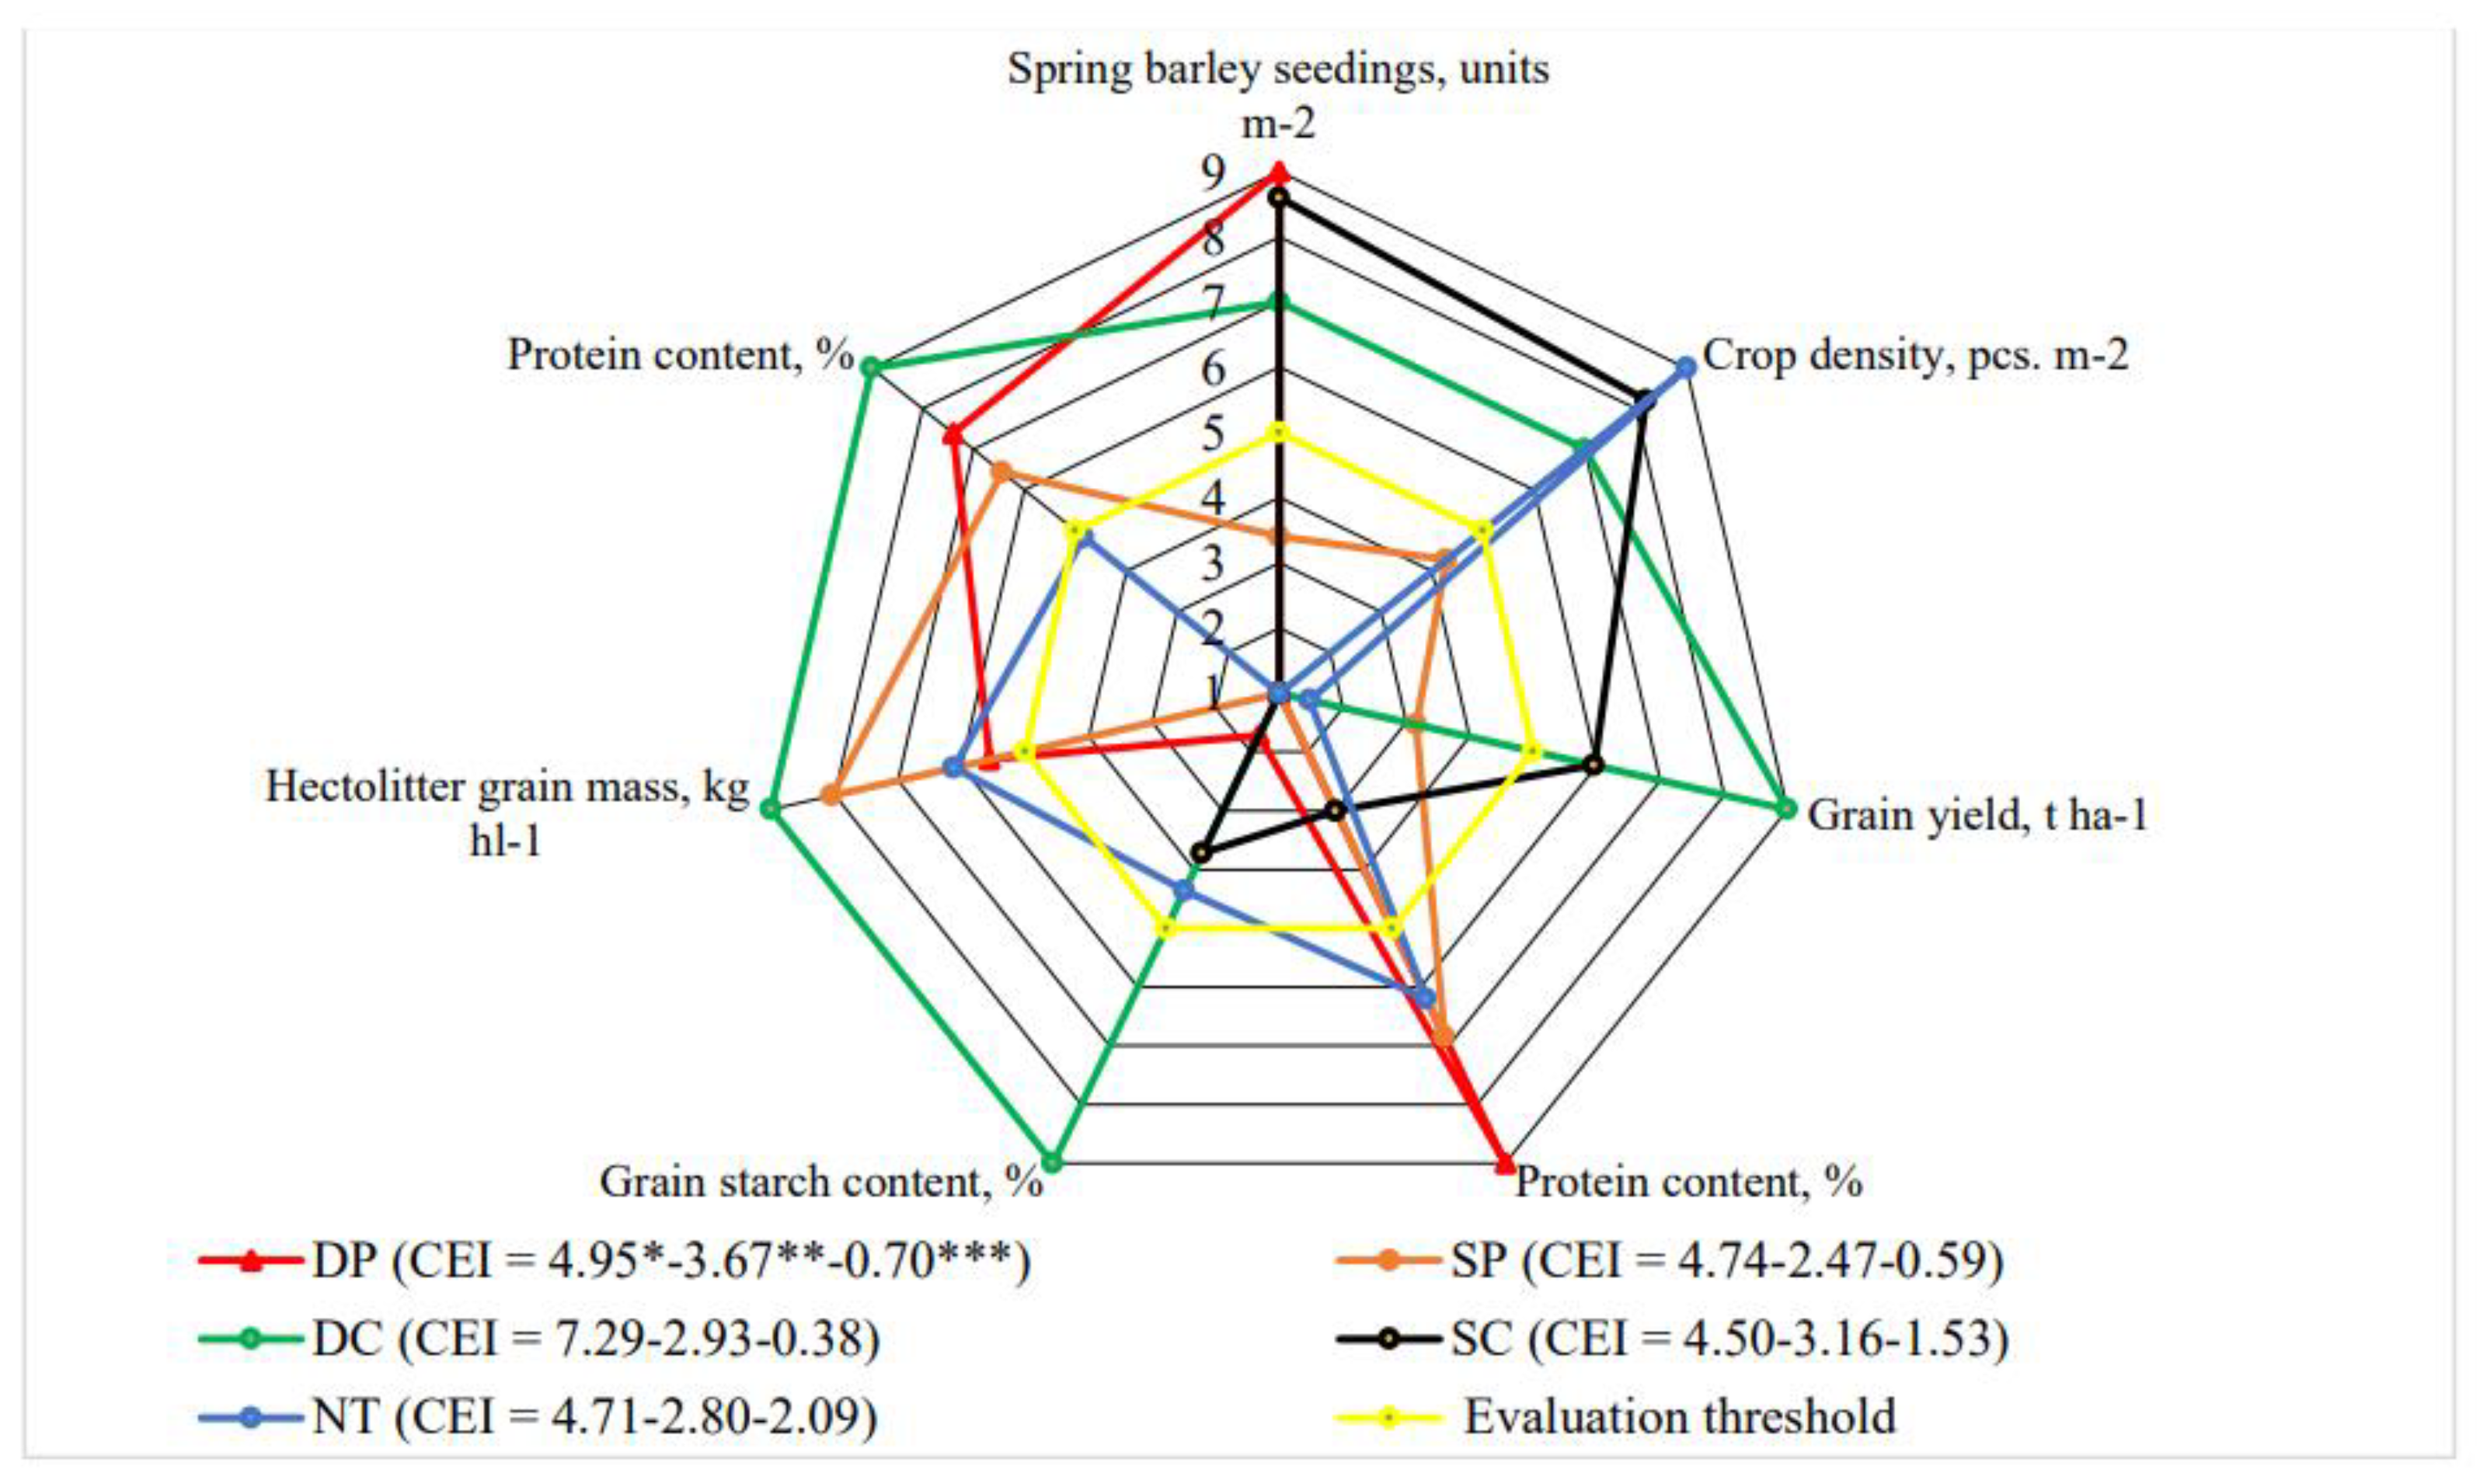
Figure 13.
Complex assessment of long-term effects of tillage technologies 2022–2024. Note: DP—Deep plowing, SP—Shallow plowing; DC—Deep cultivation, chiseling, SC—Shallow cultivation-disking, NT—No-tillage. CEI—complex evaluation indices, *—an average of evaluation points (EP), **—standard deviation of EP, ***—standard deviation of the average of the evaluation points below the evaluation threshold.
Disclaimer/Publisher’s Note: The statements, opinions and data contained in all publications are solely those of the individual author(s) and contributor(s) and not of MDPI and/or the editor(s). MDPI and/or the editor(s) disclaim responsibility for any injury to people or property resulting from any ideas, methods, instructions or products referred to in the content. |
© 2025 by the authors. Licensee MDPI, Basel, Switzerland. This article is an open access article distributed under the terms and conditions of the Creative Commons Attribution (CC BY) license (http://creativecommons.org/licenses/by/4.0/).
Copyright: This open access article is published under a Creative Commons CC BY 4.0 license, which permit the free download, distribution, and reuse, provided that the author and preprint are cited in any reuse.


