Submitted:
30 June 2025
Posted:
01 July 2025
You are already at the latest version
Abstract
Background/Objectives: The quality of clinical studies is largely determined by the bi-oanalytical methods used for testing study samples. Rigorous assay validation following the criteria defined for example by the European Medicines Agency guideline for bio-analytical method validation is a prerequisite for such assays. Alpha1-antitrypsin (AAT) measurement, i.e., the specific measurement of AAT protein and its associated elastase inhibitory activity, is an integral part of assay panels for clinical studies addressing AAT deficiency. Specifically, AAT must be measured in the matrix of citrated human plasma as well as in diluted solutions with high salt concentrations obtained through bron-choalveolar lavage (BAL). Sensitive and selective measurement methods are required as BAL has a low level of AAT. Methods: We present the validation data obtained for three AAT measurement methods. Two of them, nephelometry and the enzyme-linked im-munosorbent assay, which clearly differ in their sensitivity, provide AAT protein con-centrations, while the highly sensitive elastase complex formation immunosorbent as-say specifically measures the inhibitory activity of AAT against its pivotal target pro-tease neutrophil elastase. Using samples with relevant AAT concentrations, we ad-dressed the assay characteristics accuracy, precision, linearity, selectivity, specificity, limit of quantification and short-term analyte stability Results: Overall, the three methods demonstrated low total errors even at low analyte concentrations, adequate linearity over the required assay range and acceptable selectivity and specificity, while the short-time stability of the analyte could be shown. Conclusions: All three AAT measurement methods met the acceptance criteria defined by current guidelines on bioanalytical assay validation, which qualifies them to be used for the measurement of clinical samples.
Keywords:
alpha1-proteinase inhibitor
; alpha1-anitrypsin
; clinical sample testing
; bioanalytical method validation
; assay accuracy
; assay precision
1. Introduction
Human alpha1-antitrypsin (AAT) [1], also known by its synonym alpha1-proteinase inhibitor, circulates at serum levels of 17 to 34 µM (0.9 to 1.75 g/L) with a half-life of 3 -5 days [2]. The single chain, 52-kDa glycoprotein, containing 394 amino acids, is decorated with three complex type N-glycans on asparagine 46, 83 and 247. N-glycan branching and associated sialylation as well as protein truncation described to occur at the protein’s N- and C-terminus [3-7] result in a characteristic pattern on isoelectric focusing. AAT is a member of the serine proteinase inhibitor superfamily and is considered to be the prototype of this large family. After passive diffusion from the circulation, it is responsible for more than 90% of the anti-elastase activity of the lower respiratory tract. The earliest evidence for protease inhibitory activity in serum/plasma dates back to the late 19th century [8,9]. Systematic studies on this trypsin inhibitory activity contained in the α-globulin fraction of human serum [10,11] finally resulted in successful purification of trypsin inhibiting activity from human plasma. The authors suggested naming the protein alpha1-antitrypsin [12]. Deficiency of this abundant α1-globulin was first detected by Laurell and Eriksson in 1963 [13,14]. They associated AAT deficiency (AATD) in five individuals with the early occurrence of emphysema, after having analyzed approximately 1,500 serum samples with serum electrophoresis [15]. Owen et al. [16] and Jeppsson [17] set further landmarks in the history of AATD, because they described the amino acid substitutions E264V and E342K for the AATD-linked AAT variants, later termed Pi*S and Pi*Z, respectively. Pi*ZZ AAT accounts for more than 96% of AATD cases. Progress in nonclinical research peaked in the first clinical trial, in which five Pi*ZZ patients were treated with a human plasma-derived AAT preparation [18]. The study was designed only to show the biochemical efficacy of what is today called AATD augmentation therapy [19-21]. Nevertheless, it specified the AAT dose and the dosing interval that are still used today. Modern X-ray lung imaging techniques combined with advanced computational models have demonstrated the efficacy of AATD augmentation therapy [22-24]. To date, four plasma-derived AAT concentrates have received FDA approval. AATD patients are treated with a weekly intravenous infusion of 60 mg AAT per kg of body weight.
Clinical studies for the refinement of AAT augmentation or to investigate new therapeutic applications of AAT in human diseases, including diabetes type-1 [25] and graft-versus-host disease [26], call for measurement of AAT activity and AAT protein concentrations in biological specimens. So-called bioanalytical methods are required for these analyses. This term [27,28], coined in the 1970s, covers analytical methods that are used to determine the concentration of drugs or their metabolites in the biological fluids blood, serum, saliva, urine, BAL, sputum, and other tissues. Parallel to the development of bioanalytical methods predominantly used to learn about the pharmacokinetic features of drug candidates or drugs, discussion on their performance characterization and associated regulatory topics took place [29]. One of the first guidance documents on bioanalysis was published by the FDA as part of the “Bioequivalence and Bioavailability” regulations in 1977 [30]. Discussions on bioanalytical criteria between scientists from the pharmaceutical industry and regulatory agencies at a meeting, titled “Analytical methods validation, bioavailability, bioequivalence and pharmacokinetic studies” were summarized in a conference report [31]. Subsequently, the FDA published the “Draft guidance for industry: Bioanalytical method validation” in 1999. Further discussion focused especially on the validation acceptance criteria for immunoassays [32], until the FDA issued its “Guidance for industry on bioanalytical method validation” in 2001. This document covered primarily the quantification of small molecules with chromatography but has also been applied to large molecules and a variety of analytical techniques. Today, the EMA guideline, issued in 2011 [33], and the FDA guidance for industry, finally released in 2018 [34], provide the regulatory framework for bioanalysis. They are not identical, but are similar [35], discriminating, for example, between ligand-binding assays (LBAs) and others. This discrimination highlights the predominant role of LBAs in bioanalysis for measuring protein concentrations, as most of the pharmacokinetic data for therapeutic proteins were obtained by using LBAs [36].
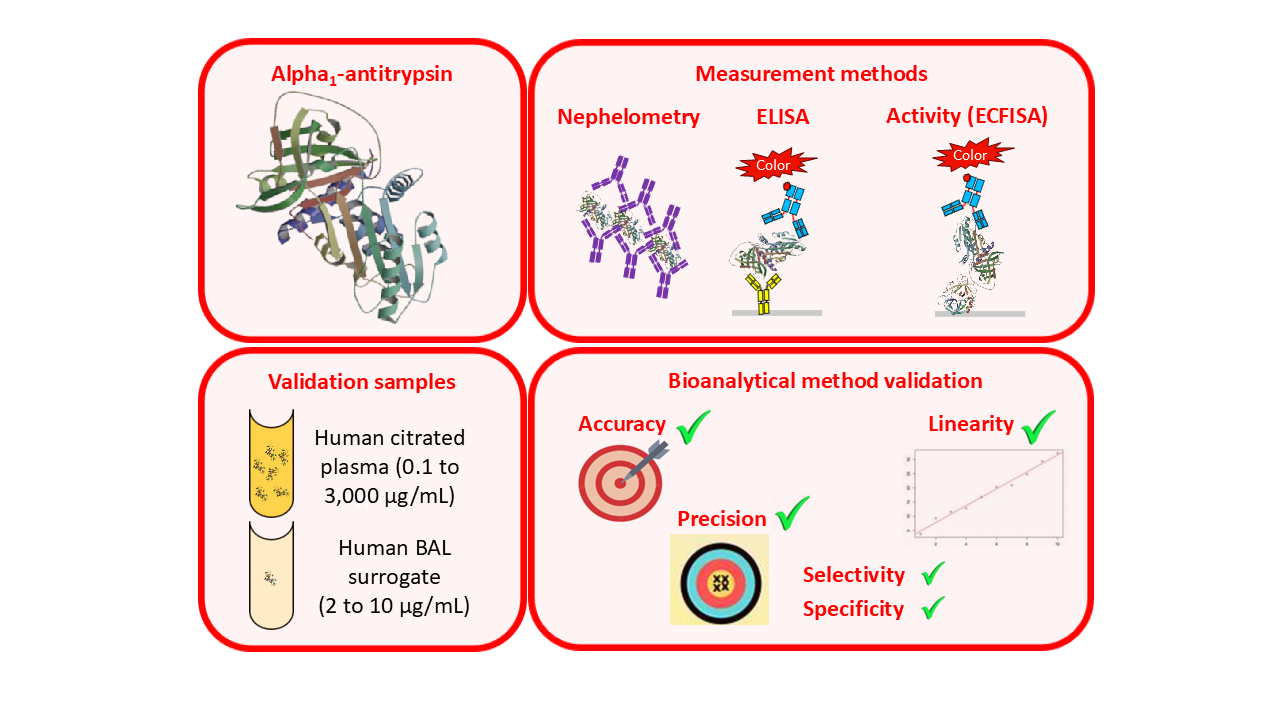
Analysis of AAT-related samples from clinical studies likewise relies on using LBAs. As well as measurement of AAT protein levels using immunological methods such as nephelometry or the enzyme-linked immunosorbent assay (ELISA), determination of functional AAT activity, expressed as (neutrophil) elastase inhibitory activity, is also of interest. This can be achieved by using an elastase inhibition assay which measures residual elastase activity in AAT samples that have been incubated with an excess of elastase. Specifically, N-succinyl-(L-alanyl)3-p-nitroanilide, a chromogenic substrate with selectivity for elastase, is used [37]. The release of p-nitroanilide is monitored photometrically and allows the residual activity of elastase, which itself is inversely proportional to the AAT activity of the sample, to be calculated. Standard assay formats using this chromogenic approach have a quantification limit of about 3-10 µg active AAT/mL. From the perspective of bioanalytical validation, this activity assay is classified as an LBA due to the involvement of binding reactions. In addition to measuring functional AAT activity in citrated plasma samples, samples obtained by BAL are also of interest. Given that the transfer of AAT from the bloodstream to the lung relies solely on diffusion, BAL samples typically exhibit AAT levels close to or even below the lower level of quantification of elastase inhibition assays. This peculiarity presents a unique challenge for analytical support of such studies, which might be overcome with the new type of functional AAT activity assay termed elastase complex formation immunosorbent assay (ECFISA) [38].
Here, we present the bioanalytical validation data of three methods used for measuring AAT levels in human citrated plasma and BAL-mimicking samples. Functional AAT activity was determined with the ECFISA in both sample types, while the AAT protein levels of citrated plasma and BAL samples were measured with nephelometry and the ELISA, respectively, depending on the expected concentrations. In summary, all three AAT measurement methods met the acceptance criteria defined by current guidelines on bioanalytical assay validation, which qualifies them to be used for the measurement of clinical samples.
2. Results
2.1. Assay Calibration Curves
The mean calibration curves for the ECFISA, the AAT ELISA and the nephelometric AAT assay are shown. The calibration models for the ECFISA and ELISA calibration curves relied on linear regression of the (pseudo)linear part of the dose-response curves, obtained after log-transformation of both the blank-corrected optical densities (ODs) and the AAT concentrations of the assay calibrators. The calibration curve for the nephelometric assay is constructed by the nephelometer, based on a logarithmic regression analysis.
2.1.1. AAT Activity Measurement with the ECFISA
Neither the EMA guideline for bioanalytical method validation nor the FDA guidance document provide preferences for the calibration curve fitting of LBAs. Based on our experiences with the development of the ELISA for measuring plasma proteins [39], we relied on a log-log fitting linear calibration model and defined a six-point calibration curve ranging from 6 to 192 ng functionally active AAT/mL. The AAT activity of the assay standard that we used for establishing the calibration curve was assigned with reference to the 1st international WHO standard for AAT. Figure 1 shows the mean calibration curve obtained in 59 independent runs [38]. The mean slope showed a relative standard deviation (RSD) of 3.1%, demonstrating the low variability of these curves. Furthermore, the quality of curve fitting was reliable, as shown by the high correlation coefficients and the low relative total errors, with a mean relative total error (RTE) of 11.9%. RTE was calculated as follows: The mean blank-corrected ODs of the individual assay calibrators D1 to D6 were back-fitted on the curve. The AAT levels obtained were then normalized by multiplication with the respective dilution and averaged to obtain the measured mean concentration of the assay standard. Then, the absolute difference between the measured mean concentration of the assay standard and its nominal concentration was calculated and added to the double standard deviation, determined for the mean. The sum obtained was then expressed as a percent of the nominal concentration of the assay standard to yield RTE. The insert shows the good agreement of the back-fitted assay calibrators with their nominal concentrations: All individual data points were within a 100 ± 20% agreement indicating a valid calibration curve.
2.1.2. AAT Protein Measurement with Nephelometry
The calibration curve of the nephelometric AAT measurement was generated by the device, automatically checked for its quality and released for use before any sample analysis was carried out. The six-point logarithmic calibration curve covered an AAT range from 9.69 to 310 µg/mL. It was obtained by preparing a dilution series using the reference standard supplied with the kit together with a labeled AAT concentration. Figure 2 shows the mean calibration curve obtained in 12 independent runs. The insert entitled “Back-fitted assay calibrators” presents the agreement of the back-fitted assay calibrators with their nominal concentrations. All individual values were within a 100 ± 5% range, demonstrating the adequate accuracy of the calibration curve fitting.
2.1.3. AAT Protein Measurement with the ELISA
Figure 3 shows the mean calibration curve (n=29) of the AAT ELISA based on using a commercially available polyclonal anti-AAT capturing antibody and a polyclonal anti-AAT antibody peroxidase conjugate. The calibration curve was established by fitting the logarithms of the blank-corrected signals and the AAT concentrations of the assay calibrators. These calibrators, prepared by diluting an in-house secondary reference standard, calibrated against the international reference preparation ERM DA470k, covered a range from 1.75 to 28 ng AAT/mL. The calibration curves showed low variability, with an RSD of 2.8% for the mean slope. Furthermore, the quality of curve fitting was good, as shown by the high correlation coefficients and the low relative total errors, with a mean relative total error of 11.9%. The insert entitled “Back-fitted assay calibrators” shows the satisfactory agreement of the back-fitted assay calibrators with their nominal concentrations: All individual data points were within a 100 ± 10% agreement indicating a valid calibration curve.
2.2. Accuracy Investigation
The assays’ accuracy was investigated using several approaches. Figure 4 summarizes the recovery data obtained in the two sample types of the validation showing relevant concentrations of human AAT. First, validation samples with a human citrated plasma-like matrix were generated. These samples showed AAT concentrations ranging from 10 to 3,000 µg AAT/mL and were obtained by either diluting the human normal plasma pool with 5% HSA or adding purified AAT. By contrast, samples with low protein content, mimicking samples obtained by BAL in terms of their AAT levels and salt concentration, contained AAT concentrations from 0.2 to 10 µg/mL. The data shown represent the means of six independent measurements. Figure 4a,b show the recovery of AAT activity as measured with the ECFISA in BAL-mimicking samples and human citrated plasma, respectively. All mean AAT activity recoveries were within an 85.0% to 107.4% range, thus complying with the 100 ± 20% acceptance range promoted by the EMA guideline and the FDA guidance document. Expectedly, we determined the lowest recovery of 85.0% at the lowest AAT activity level, i.e., 0.2 µg/mL, spiked to the sample with low protein content, while the recovery of 0.1 µg active AAT/mL in citrated plasma was 95.6%, suggesting a general stabilizing effect of the plasma proteins. It should be noted, however, that such low AAT levels cannot be measured with conventional chromogenic or fluorogenic AAT elastase inhibition assays. In samples mimicking BAL fluid, the recovery of AAT activity exhibited a positive correlation, with increasing AAT concentrations ranging from 0.2 to 10 µg/mL. Conversely, this trend was not observed in citrated plasma samples. The mean recoveries of AAT protein, measured with nephelometry in citrated plasma samples containing 0.05 to 2 mg AAT/mL, ranged from 100.0% to 107.5% (Figure 4c). For samples with low protein content and AAT protein levels ranging from 0.2 to 10 µg/mL, we found recoveries ranging from 88.9% to 99.2% as measured with the ELISA (Figure 4d). In contrast to the activity data obtained for the same samples with the ECFISA, these recoveries did not correlate with the AAT protein levels.
Furthermore, we confirmed the accuracy of the AAT activity and the ELISA protein measurement by analyzing the 1st WHO standard for AAT with a labelled AAT concentration of 12.4 mg/mL. In doing so, we found a mean AAT activity and AAT protein concentration of 98.0% ± 4.8% (n = 12) and of 100.1% ± 7.2% (n = 6), respectively. These good agreements with the labelled concentration were obtained despite the high sample dilutions required for the measurement due to the high sensitivity of both assays. Similarly, we measured the AAT protein concentration of the international standard ERM-DA470k with nephelometry. The mean AAT protein concentration (n = 6) we found corresponded to 91.5% ± 6.5% of its defined AAT protein concentration. Thus, these data also demonstrated the adequate accuracy of the three tests.
Finally, the AAT activity concentrations measured for 25 samples of purified AAT with a conventional validated chromogenic AAT activity assay and the ECFISA were compared by means of the Bland-Altman plot [38,40]. The mean relative bias between the standard test and the ECFISA results was -0.64% ± 0.78%, resulting in 95% levels of agreement from -2.2% to 0.9%. This evidenced adequate agreement between the AAT activity measurement methods, with slightly higher values obtained for the ECFISA, which is remarkable, as we had to prepare high sample dilutions because of the ECFISA’s sensitivity.
2.3. Precision Investigation
We also used the samples prepared for the accuracy studies to determine the assays’ precision. Thus, we determined the methods’ precision profiles by measuring the intra-run (repeatability) and the inter-run (intermediate) precision, using each six tests carried out in either one or six separate runs, the latter done by different operators. Figure 5 summarizes the data obtained. Figure 5a,b show the precision of the activity measurement in samples with low protein content and citrated plasma, covering AAT activity ranges from 0.2 to 10 and from 0.1 to 3,000 µg/mL, respectively, while Figure 5c,d present the precision data obtained for the AAT protein measurement with nephelometry in citrated plasma samples and ELISA in BAL-mimicking samples. Overall, for all three methods, we found RSDs not exceeding 10.5%, thus clearly complying with the acceptance criteria of the EMA guideline and the FDA guidance which requires RSDs not exceeding 20% or 25% at the limit of quantification. In addition, the data did not identify any correlation between RSDs and analyte concentrations within the analyte ranges investigated. Remarkably, the three samples with AAT activities below 1 µg/mL showed RSDs not exceeding 4.4%, evidencing the excellent precision of the AAT activity measurement with the ECFISA, even for concentrations close to the assay’s lower limit of quantification. It seems reasonable to conclude that at all AAT levels and in both types of samples, intra-run precision was evidently better than inter-run precision.
Apart from these data, obtained during the assay validation study in a short period of time, we determined the AAT activity and AAT protein concentrations for the assay control, a lyophilized reference plasma preparation, with the three assays over an extended time of at least six months. Thus in 59 ECFISA runs, we found a mean ± SD AAT activity of 1046 ± 51.9 µg/mL, while the mean AAT protein concentrations, determined in each 29 runs with the nephelometric method and ELISA, were 1.09 ± 0.05 mg/mL and 996 ± 57.9 µg/mL, respectively. This translated to RSDs of 4.0%, 4.5% and 5.8%, respectively, which were in the same order of magnitude as those observed during the precision analysis carried out in six runs. These data also demonstrated the good precision of the three assays over extended time.
2.4. Total Error and Quantitation Limits of the Assays
The overall assay performance characteristic total error (TE) was defined by the EMA guideline for bioanalytical method validation as the sum of accuracy and precision. It should not exceed 30% and 40%, respectively, at the assay’s lower limit of quantitation. Table 1 summarizes the total errors determined for the three methods at different AAT levels. TEs were calculated as the sum of the absolute difference of 100 - recovery in % and the RSD describing the inter-run precision. None of the total errors determined exceeded 18.7%. All thus met the acceptance criteria of the EMA guideline for valid assays. The AAT activity measurement in citrated plasma and BAL-mimicking samples demonstrated mean TEs of 10.0% (range: 5.6% to 12.2%) and 11.7% (range: 9.3% to 18.7%), respectively. The mean TEs determined for the nephelometric and the ELISA AAT protein measurement were 7.3% (range: 3.5% to 12.9%) and 12.3% (range: 8.9% to 18.1%), respectively. The quantitation limits of the ECFISA and the ELISA were 0.1 and 0.2 µg/mL, respectively, while the less sensitive the nephelometric method had a limit of quantitation of 0.05 mg/mL.
2.5. Linearity Analysis Investigation
Figure 6 shows the results of the linearity analysis carried out for the three methods. Figure 6a and 6b provide the regression curves between the nominal AAT activities and those found in samples with low protein content and citrated plasma, respectively. The AAT activity ranges, covered by the regression curves, were 0.2 to 10 µg/mL and 10 to 3,000 µg/mL. Both regression curves had determination coefficients exceeding 0.999. Similarly, Figure 6c,d present the results of the AAT protein measurement with the nephelometric method in citrated plasma and the ELISA in samples with low protein content. The regression curves with determination coefficients higher than 0.999 ranged from 0.05 to 2 mg/mL and from 0.2 to 10 µg/mL for the nephelometric and the ELISA method, respectively. These data demonstrated linearity. Furthermore, the ECFISA and ELISA dose-response curves obtained for the samples’ geometric 1+1 dilution series were checked for their parallelism with those of the respective assay calibration curves. The samples’ dose-response curves showed good linearity with slopes that were highly similar to those of the respective calibration curves.
2.6. Specificity and Selectivity Investigation
Specificity is the ability of a binding reagent to bind only to its target analyte. Selectivity describes how well a LBA quantifies the target analyte even when unrelated compounds are present. In this regard, we primarily investigated the AAT activity assay ECFISA for two reasons: To exclude unwanted interferences by other plasma protein inhibitors and to confirm its exclusive specificity for active AAT. In contrast to the ECFISA, which applies the formation of an elastase-AAT complex for measuring the elastase inhibitory activity of AAT, both AAT protein measurement methods are well established and are based on using commercially available antibodies against human AAT. These antibodies have a certified specificity for AAT minimizing the importance of specificity/selectivity testing during the validation. Nevertheless, we checked the AAT ELISA for a possible influence of hyaluronic acid and human immunoglobulin G present in high excess over AAT.
The ECFISA detects the AAT-elastase complex formed using an AAT-specific antibody. Accordingly, we thought to rigorously rule out that functionally inactive AAT could be erroneously detected. Oxidation or moderate heat treatment was used to prepare functionally inactive AAT. As expected, analysis with a validated chromogenic elastase inhibition assay demonstrated that both preparations almost completely lost their inhibitory activity without obvious effects on the AAT ELISA reactivity. This activity loss was also mirrored by the ECFISA. Moreover, we prepared mixtures of heat-treated and active AAT and analyzed them with the ECFISA. The data obtained clearly demonstrated that (i) the ECFISA measured functionally active AAT as intended and (ii) the presence of high excesses of functionally inactive AAT did not interfere with the measurement [38].
Human plasma contains several proteinase inhibitors which have been shown to form complexes with neutrophil elastase. Although the AAT-elastase complex formation rate constant is about 25-fold higher than those measured for other inhibitors, we nevertheless investigated whether or not the presence of the abundant plasma proteinase inhibitors alpha1-antichymotrypsin, alpha2-macroglobulin, alpha2-antiplasmin, antithrombin, C1-inhibitor and inter-alpha-trypsin inhibitor affected AAT activity measurement by the ECFISA in human plasma. All six inhibitors demonstrated only marginal, if any, complex formation with neutrophil elastase: Maximum signals were found for alpha2-macroglobulin and alpha1-antichymotrypsin, counting for 6.0% and 3.9%, respectively, of that measured for AAT [38]. This allowed us to conclude that elastase complex formation with plasma inhibitors other than AAT does not interfere with the ECFISA by competing for the immobilized elastase. Moreover, these non-AAT-elastase complexes formed at low abundancy will not be detected because elastase-AAT complex is detected by using the specific anti-AAT antibody.
The AAT ELISA was checked for a possible influence of bovine serum albumin (BSA), hyaluronic acid and human immunoglobulin G. Accordingly, we measured samples with AAT concentrations close to the lower limit of quantitation (0.1 µg AAT/mL), containing at least a 400-times excess of BSA, human immunoglobulin, or hyaluronic acid. The mean AAT recoveries (n = 6; mean ± SD) in these samples were 96.3 ± 6.0%, 93.0 ± 7.0%, and 91.4 ± 4.9%, respectively, which ruled out that these compounds exerted substantial influence on the AAT ELISA despite their high excess over the analyte. Also, the dilution-response curves obtained for these samples were highly parallel to that of the assay standard (data on file). Finally, a human purified albumin preparation was shown to yield no signal in the nephelometric AAT protein assay.
2.7. Analyte Stability
2.7.1. Short-Term Stability
We subjected the two sample types, citrated plasma and BAL-mimicking samples, to short-term stability studies, keeping them at room temperature (RT) for up to 48 hours. The stability samples thus obtained were measured with the ECFISA, AAT ELISA and AAT nephelometry. AAT activity was measured for the citrated plasma samples, containing 10 and 1,000 µg active AAT/mL, and the BAL-mimicking samples with active AAT levels of 0.2 and 10 µg/mL. These samples, kept at RT for up to four hours, were also measured with the AAT ELISA. The samples, analysed with AAT nephelometry, were kept at RT even for 48 hours. Table 2 summarizes the data obtained, expressed as a percent of the respective initial concentration, determined at the start of the study.
AAT activity and AAT protein were demonstrated to be stable at RT over four hours in citrated plasma as well as in BAL-mimicking low protein content samples. All but one of the relative concentrations measured differed by less than 10% from the initially determined ones. Consequently, we concluded that neither the AAT concentration nor the sample type had an influence on short-term stability. For the nephelometric AAT protein assay, we could even show RT stability of the samples over 48 h.
2.7.2. Stability on Repeated Freeze-Thaw Cycles
Repeated freezing-thawing of test samples can sometimes be required if only low quantities of clinical samples are available for analysis. We therefore investigated the effects of up to three repeated freeze-thaw cycles on AAT activity and AAT protein. Table 3 presents the results of this study, which we carried out for the two sample types of citrated plasma and BAL-mimicking samples with low protein content.
All samples demonstrated acceptable stability, i.e., concentration changes of less than 20%, on repeated freezing-thawing with the highest change in AAT activity observed for the sample with the lowest AAT activity in the BAL-mimicking sample.
4. Discussion
The term bioanalysis was devised in the 1970s and describes the quantification of drug candidates or drugs in biological fluids such as plasma, serum, urine, feces, saliva, BAL, and other tissues. Unsurprisingly, the particular composition of biological fluids, unique even for each individuum, poses specific analytical challenges typically not encountered during testing drugs for manufacturing surveillance and release. After a series of conferences, workshops, and draft documents, international consent was reached on bioanalytical method validation and its associated terminology. Important method characteristics to be addressed in the validation of a bioanalytical method include accuracy, the degree of closeness of the determined value to the nominal or known true value, and precision, the degree of scatter between a series of measurements obtained from multiple sampling of the same sample. In addition, selectivity, describing the method’s ability to measure unambiguously and differentiate the analyte in the presence of components that may be expected to be present, stability, and the lower limit of quantification are to be addressed. Both the EMA guideline and the FDA guidance document recognize LBAs as a particular bioanalytical method type and provide separate acceptance criteria for LBAs as opposed to methods not further specified by the EMA guideline or chromatographic methods mentioned by the FDA guidance document. Activity assays are not explicitly mentioned in either document, but it seems reasonable that such specialty assays are regarded as LBAs because any activity assay definitively requires the highly specific interaction between the reaction partners.
Functional AAT activity is usually measured with elastase inhibition assays that either use chromogenic or fluorogenic low-molecular weight peptide substrates or high-molecular weight substrates such as labeled elastins. In both cases, however, functional AAT activity is inversely proportional to the residual elastase activity measured with these assays. The basis for measuring functionally active AAT was laid down by the work of Bieth et al., who described the synthesis of the chromogenic substrate N-succinyl-(L-alanyl)3-p-nitroanilide that shows good selectivity for elastase [41]. Standard assay formats using this substrate have a quantification limit of about 3-10 µg AAT/mL. This is adequate for the analysis of plasma/serum samples but does not allow direct measurement of AAT activity in BAL samples, where concentrations of about 2 µg/mL of partially inactive AAT have been found [42]. Thus, a concentration step is required before AAT activity can be measured. Unfortunately, there is evidence that such a concentrating procedure could cause differential protein loss and functional AAT inactivation [43]. The ECFISA, we validated here as an AAT activity assay, does not rely on measuring the residual elastase activity, which is not inhibited by the action of AAT, but rather measures the amount of the complex formed between the two active reaction partners, AAT and elastase. The latter is immobilized by passive adsorption to the wells of a microplate and remains active, so that complex formation with active AAT can take place. Sample components not involved in the inhibition reaction are removed by washing and the immobilized elastase-AAT complex is then immunologically detected by a specific anti-AAT peroxidase conjugate. This last assay step additionally increases the selectivity of the assay’s selectivity because only AAT-elastase complexes will be detected, even if other plasma protein inhibitor-elastase complexes are formed despite the high complex formation rate of the AAT-elastase complex. Rationally, other plasma protein inhibitors that present in abundance such as alpha2-macroglobulin could compete for binding to the immobilized elastase and thus interfere with the assay. However, the selectivity study demonstrated that alpha2-macroglobulin-elastase complex formation had a negligible influence on the AAT activity measurement, carried out in samples with plasma matrix. This contrasts with the chromogenic elastase inhibition assay, where the presence of alpha2-macroglobulin erroneously increases AAT activity levels because alpha2-macroglobulin-bound elastase remains active when low molecular weight substrates are used for its measurement and cannot be inhibited by AAT due to steric hindrance. Similarly, the data confirmed that inactive AAT, generated either by heat treatment or oxidation of native AAT, did not interfere with the ECFISA AAT activity measurement. The ECFISA’s major advantage over the chromogenic assay is its almost 1,000-fold increased sensitivity. On the one hand, this increased sensitivity is reflected by the calibration curve which ranges down to one digit ng/mL functional AAT levels. These curves could be obtained reproducibly with high accuracy and acceptable precision, as demonstrated by the good agreement of the back-fitted assay calibrators with their nominal concentrations. In addition, these curves were characterized by low relative total errors. On the other hand, the sample with an AAT activity of 0.2 µg/mL, representing the assay’s lower limit of quantification, was measured with acceptable accuracy and precision, resulting in a total error of 18.7%. This is clearly below the acceptance criterion of 40%, required for valid LBAs. All other validation samples, irrespective of their type being either citrated plasma or BAL-mimicking samples, showed lower total errors, not exceeding 12.2%. Furthermore, there was no obvious correlation with the AAT activity levels. These low total errors, being the composite of accuracy and precision, mirror the assay’s good accuracy and precision in both sample types and over all the concentrations investigated. Thus, the mean RSDs describing the assay’s inter-run precision in six runs were 6.3% and 4.5% for the citrated plasma and BAL-mimicking samples, respectively. None of the RSDs exceeded 8.4%. The results, obtained for the assay control over six months confirmed the short-term precision analysis data. Furthermore, repeated analysis of the 1st WHO standard for AAT resulted in a mean AAT activity that did not differ significantly from its labelled one, despite the high dilutions required to measure this sample. This result further highlights that the ECFISA method provides accurate AAT activities. A direct comparison of the AAT activities, determined for 25 lots of a purified AAT preparation with a validated standard chromogenic test, used for the release testing, and the ECFISA resulted in an absolute bias of 0.6%. Again, this confirmed the accuracy of the AAT activity measurement with the ECFISA. Finally, adequate short-term stability for up to four hours at RT was shown for samples with relevant AAT levels in both matrices, citrated plasma and BAL-mimicking samples, and on repeated freezing-thawing. The results of long-term stability studies for samples kept over two years and measured with the ECFISA and the two other methods have recently been published [44].
The two other methods validated here, AAT nephelometry and the AAT ELISA, both measure AAT protein levels, and follow the principles of LBAs. While the measuring signal in the nephelometric assay, i.e., the turbidity of the solution caused by the antigen-antibody complex, is dependent on the binding to only one polyclonal antibody, the AAT ELISA is a conventional sandwich test, where AAT, bound to the plate-immobilized polyclonal antibody, is then detected by the binding of a second polyclonal antibody, labeled with peroxidase. The strict specificity of all test antibodies for human AAT is certified by their manufacturer. Both methods have clearly different sensitivities, as indicated by their calibration curves which cover AAT levels in the low µg/mL (about 10 to 300) and the low ng/mL (about 2 to 30) range for the nephelometric assay and the ELISA, respectively. Rationally, this sensitivity profile qualifies the nephelometric method not only for the analysis of plasma samples obtained during the AAT augmentation therapy but also for identifying AAT-deficient patients. Further advantages of this method include the low operational effort required because analysis is largely automated, the short time for obtaining results and the automatic identification of samples, in which turbidity, lipidic material or other effects could interfere with the AAT protein determination. The validation data obtained for AAT concentrations ranging from 50 to 3,000 µg/mL demonstrated the adequate performance of the nephelometric method: total errors did not exceed 12.9% with a mean of 7.3% and the mean inter-run precision was 4.1%. Also, this good precision determined over a short period of time was confirmed by the data obtained over six months, in which the assay control showed an RSD of 4.5%. The AAT concentration determined for the international immunological reference preparation ERM DA470-k corresponded to 91.5% of its labelled AAT protein value, thus confirming the AAT concentration of the assay standard supplied with the nephelometric kit.
The ELISA method requires much more operational effort than the nephelometric method, and more time to obtain results. These disadvantages are counteracted by the method’s higher sensitivity, which is clearly required for analyzing BAL samples. Usually, BAL samples have total protein levels of less than 100 µg/mL. Albumin (~ 50% of total protein), the immunoglobulins G and A (together ~ 30%) and transferrin (~ 5%) account for almost 90% of the low total protein content [45,46]. Mean AAT levels of 1.8 and 3.1 µg/mL were reported for nonsmokers (n=10) and smokers (n=11), respectively [47], representing not more than 3% of the total protein present in BAL. Such AAT concentrations can be accurately and precisely measured as shown by the validation data obtained for samples with AAT concentrations ranging from 0.2 to 10 µg/mL. The mean total error was 12.4% with all results not exceeding 18.1%, which clearly meets the acceptance criterion of not higher than 30%. Interestingly, the highest total error was not determined for the lowest AAT concentration. The mean inter-run precision determined for these six BAL-mimicking samples was 7.0%, with all samples showing RSDs not exceeding 10.5%. Furthermore, we found the AAT protein concentration for the 1st WHO standard for AAT corresponded to 100.1% of its labelled concentration of 12.4 mg/mL. This shows that accurate and precise data can be obtained with the ELISA even for samples with such high AAT levels, despite the high dilutions required (the dilution series started at a dilution of 1/500,000). Interference by human immunoglobulin G and hyaluronic acid on the performance of the AAT ELISA could be ruled out by the data obtained in the spiking experiment.
A probable limitation of our validation studies is that we were unable to use human BAL samples. Such samples, however, can only be obtained under a clinical protocol, which requires validated methods. The BAL-mimicking samples that we prepared and used showed low total protein - mainly human albumin and AAT concentrations, thus resembling real-life BAL samples as close as possible regarding these characteristics. Another point to consider is that the AAT ELISA calibration curve comprises five points only, instead of six as promoted for LBAs. The AAT ELISA calibration curve, however, is not obtained by a 4/5-parameter fitting algorithm as usually done for ELISAs but by a less complex linear regression analysis of the log-transformed blank-corrected ODs and the AAT concentrations of the assay calibrators. This curve-fitting model, which was shown by the data of the back-fitting analysis to be highly accurate and precise, reduces the number of calibrators needed as it relies only on the (pseudo)linear part of the dose-response curve only. Furthermore, we learned in a small experiment that adding up to two additional calibration points without changing the AAT concentration range of the calibration curve had no effect on the characteristics of the calibration curve (data on file).
Overall, the data demonstrated the three bioanalytical methods elastase complex formation immunoassay, AAT nephelometry and AAT ELISA to be accurate, precise, and selective bioanalytical methods for measuring functionally active AAT and AAT protein, even at low AAT concentrations which were previously inaccessible for direct activity measurement without a preceding concentration step.
4. Materials and Methods
4.1. Materials
Chemicals from VWR (Vienna, Austria) were used: NaHCO3, Na2CO3, KCl, NaCl, KH2PO4, Na2HPO4 × 2 H2O, H2SO4 (95-97%), water (HPLC grade) and HCl (25%). Tween 20 (EIA grade) was obtained from Bio-Rad (Vienna, Austria), bovine serum albumin (BSA, A0281), porcine elastase (E7885) and benzamidine hydrochloride monohydrate (B6506) from Sigma (Vienna, Austria), sodium hyaluronate (part 81; Lifecore Biomedical, Minneapolis, US), non-fat dry milk from Maresi (Vienna, Austria), Patentblau V from Chroma-Waldeck (Münster, Germany) and the tetramethylbenzidine peroxidase substrate SureBlue from KPL (Medac; Hamburg, Germany). The citrated lyophilized human reference normal plasma pool, comprising plasma from at least 100 healthy donors, was purchased from Technoclone (Vienna, Austria). The purified human plasma proteins serum albumin (5%; #0100301A; HSA), human alpha1-proteinase inhibitor (Aralast NP, 20 mg/mL; #VNB5K036) and the human immunoglobulin preparation (Gammagard Liquid, 100 mg/mL; #LE12E003) were from Takeda Manufacturing (Vienna, Austria). All other biological reagents and standards used are described with the respective methods (see Supplemental Material).
4.2. Preparation of Validation Samples
We prepared two types of validation samples substantially differing in their matrix. For the first type, we either diluted the human reference plasma with the purified 5% human serum albumin preparation or we added the purified human AAT preparation Aralast NP to obtain samples with AAT levels ranging from 0.01 to 3 mg AAT/mL. The second type of validation samples, designed to mimic samples obtained by the BAL procedure, showed low AAT levels ranging from 0.2 to 10 µg/mL in the presence of 0.9% NaCl and 50 µg/mL HSA. After preparation, samples were divided into aliquots of 500 µL, which were immediately frozen at –20°C and stored frozen at –20°C until analysis.
4.3. Performance of the Validation
Our validation studies addressed the method characteristics accuracy, precision, as intra- and inter-run precision as well as precision over an extended time, linearity, specificity and selectivity. Furthermore, we investigated the stability of AAT activity and AAT protein at the bench at RT for up to 48 hours and during up to three repeated freezing-thawing cycles. In particular, we determined the methods’ accuracy by evaluating the quality of the calibration models, by spike-recovery studies and by measurement of international reference preparations, where we determined the agreement of the AAT concentrations found with their labelled values. Intra- and inter-run precision was determined by performing six repetitions in one or six different test units. The results for the assay controls were used to estimate the assay precision over an extended period. Selectivity and specificity were confirmed for the ECFISA by preparing and analyzing inhibitory inactive AAT, obtained by heat aggregation or oxidation. In addition, we checked the matrix of citrated plasma for a possible interfering influence of the abundant human plasma proteinase inhibitors, including alpha2-macroglobulin, alpha1-antichymotrypsin, antithrombin, C1-inhibitor, inter-alpha-trypsin inhibitor and alpha2-antiplasmin, on the ECFISA. To detect the formation of the respective elastase-inhibitor complexes in the presence of plasma AAT levels, we used polyclonal antibody-peroxidase conjugates from The Binding Site (Thermo Fisher Scientific, Birmingham, UK: alpha2-macroglobulin: PP039; alpha1-antichymotrypsin: PP033; antithrombin: PP040; C1-inhibitor: PP019.X; inter-alpha-trypsin inhibitor: PP060; alpha2-antiplasmin: PC038; the latter peroxidase conjugate was prepared using the activated peroxidase from Roche [11428861001; Sigma, Vienna, Austria]. Functionally inactive AAT was prepared by heat treatment and oxidation using purified plasma-derived AAT Aralast NP. For the heat treatment, the reconstituted AAT was kept at 60°C for 15 min, generating a maximum level of aggregated AAT. Oxidation with H2O2 was carried out as described [48].
4.4. AAT Measurement Methods
Functional AAT activity was determined with the elastase complex formation immunosorbent assay ECFISA [38] as recently described [44]. Briefly, we coated porcine elastase (E7885; Sigma, Vienna, Austria) to Maxisorp F96 plates. The AAT-elastase complex formed by functionally active AAT was detected using sheep anti-human AAT peroxidase (The Binding Site PP034, Thermo Fisher Scientific, Birmingham, UK). Bound peroxidase was measured with the peroxidase substrate SureBlue. The assay standard was calibrated against the WHO 1st international standard for alpha1-antitrypsin [49]. The AAT protein measuring methods, i.e., the AAT ELISA and the AAT nephelometric test, are also detailled described in [44]. Briefly, the AAT ELISA applied Maxisorp F96 plates and commercially available polyclonal antibodies: Rabbit anti-human AAT IgG A0012 (DakoCytomation A0012, Agilent, Glostrup, Denmark) as the capturing antibody and sheep anti-human AAT IgG peroxidase (The Binding Site PP034; Thermo Fisher Scientific, Birmingham, UK] as the detection antibody. The assay was calibrated using the international reference preparation ERM DA 470k [50]. For the nephelometric AAT protein determination, the clinical test available for the ProSpec BN nephelometer (Siemens, Vienna, Austria) was used. Detailled assay protocols for the three assays validated here can be found in [44] and in the Supplemental Material.
Finally, the AAT elastase inhibitory activity of the purified plasma-derived AAT preparation Aralast NP was determined with a chromogenic elastase inhibition assay during its release testing as described [38]. The calibration curve of this chromogenic assay ranges from 4.4 to 11 µg functionally active AAT/mL.
Supplementary Materials
The following supporting information can be downloaded at the website of this paper posted on Preprints.org.
References
- Carrell, R.W.; Jeppsson, J.O.; Laurell, C.B.; Brennan, S.O.; Owen, M.C.; Vaughan, L.; Boswell, D.R. Structure and variation ofhuman alpha 1-antitrypsin. Nature 1982, 298, 329–334. [Google Scholar] [CrossRef] [PubMed]
- Janciauskiene, S.M.; Bals, R.; Koczulla, R.; Vogelmeier, C.; Köhnlein, T.; Welte, T. The discovery of 1-antitrypsin and its rolein health and disease. Respir Med 2011, 105, 1129–1139. [Google Scholar] [CrossRef] [PubMed]
- Kolarich, D.; Weber, A.; Turecek, P.; Schwarz, H.-P.; Altmann, F. Comprehensive glyco-proteomic analysis of human 1-antitrypsin and its charge isoforms. Proteomics 2006, 6, 3369–3380. [Google Scholar] [CrossRef]
- Jeppsson, J.-O.; Lilja, H. Johansson, M. Isolation and characterization of two minor fractions of alpha1-antitrypsin by high-performance liquid chromatographic chromatofocusing. J. Chromatogr. 1985, 327, 173–177. [Google Scholar] [CrossRef]
- Weber, A.; Engelmaier, A.; Owen, M.C.; Schwarz, H.-P; Turecek, P.L. Convenient high-resolution isoelectric focusing (IEF)method for the separation of alpha1-proteinase inhibitor (A1PI) isoforms in A1PI concentrates. J. Pharm. Biomed. Anal. 2007, 45, 107–111. [Google Scholar] [CrossRef]
- Kolarich, D.; Turecek, P.L.; Weber, A.; Mitterer, A.; Graninger, M.; Matthiessen, P.; Nicolaes, G.A.F.; Altmann, F.; Schwarz, H.P. Biochemical, molecular characterization, and glycoproteomic analyses of 1-proteinase inhibitor products used for re-placement therapy. Transfusion 2006, 46, 1959–1977. [Google Scholar] [CrossRef]
- Matthiessen, H.P.; Willemse, J.; Weber, A.; Turecek, P.L.; Deiteren, K.; Hendriks, D.; Ehrlich, H.J.; Schwarz, H.-P. Ethanoldependence of 1-antitrypsin C-terminal Lys truncation mediated by basic carboxypeptidases. Transfusion 2008, 48, 314–320; https://. [Google Scholar] [CrossRef] [PubMed]
- Hahn, M. Berlin. Klin. Wochenschr. 1897, 34, 499-501. Zur Kenntnis der Wirkungen des extravasculären Blutes [Knowledgeof the effects of extravascular blood]; https://archive.org/details/BerlinerKlinischeWochenschrift 189734Teil1Bis576/page /n521 /mode/2up (retrieved May 6, 2025).
- Camus, L.; Gley, E. Action du serum sanguine sur quelques ferments digestifs [Action of blood serum on some digestiveenzymes]. C.R.Soc.Biol. (Paris) 1897, 4, 825. [Google Scholar]
- Schultze, H.E.; Göllner, I.; Heide, K.; Schönenberger, M.; Schwick, G. Zur Kenntnis der alpha-Globuline des menschlichenNormalserums [Knowledge of the alpha-globulins of human normal serum]. Z Naturforschg 1955, 10b, 463–473. [Google Scholar] [CrossRef]
- Bundy, H.F.; Mehl, J.W. Trypsin inhibitors of human serum. I. Standardization, mechanism of reaction, and normal values. J Clin Invest 1958, 37, 947–955. [Google Scholar] [CrossRef]
- Schultze, H.E.; Heide, K.; Haupt, K. alpha1-antitrypsin aus Humanserum [alpha1-antitrypsin from human serum]. Klinische Wochenschrift 1962, 40, 427–429. [Google Scholar] [CrossRef] [PubMed]
- Laurell, C.-B.; Eriksson, S. The electrophoretic a1- globulin pattern of serum in a1-antitrypsin deficiency. Scand J Clin LabInvest 1963, 15, 132–40; [Google Scholar] [CrossRef]
- Carrell, R.W. What we owe to α1-antitrypsin and to Carl-Bertil Laurell. COPD: Journal of Chronic Obstructive PulmonaryDisease 2004, 1, 71–84. [Google Scholar] [CrossRef]
- Stoller, J.K.; Aboussouan, L.S. A review of a1-antitrypsin deficiency. Am J Respir Crit Care Med 2012, 185, 246–259. [Google Scholar] [CrossRef] [PubMed]
- Owen, M.C.; Carrell, R.W.; Brennan, S.O. The abnormality of the S variant of human α-1-antitrypsin. BBA 1976, 453, 257–261. [Google Scholar] [CrossRef]
- Jeppsson, J.-O. Amino acid substitution Glu → Lys in alpha1-antitrypsin PiZ. FEBS Letters 1976, 65, 195–197. [Google Scholar] [CrossRef]
- Gadek, J.E.; Klein, H.G.; Holland, P.V.; Crystal, R.G. Replacement therapy of alpha-1-antitrypsin deficiency. Reversal ofprotease-antiprotease imbalance within the alveolar structures of PiZ subjects. J Clin Invest 1981, 68, 1158–1165. [Google Scholar] [CrossRef]
- Brantly, M.L.; Lascano, J.E.; Shahmohammadi, A. Intravenous alpha-1 antitrypsin therapy for alpha-1 antitrypsin defi-ciency: the current state of the evidence. Chronic Obstr Pulm Dis 2019, 6, 100–114; [Google Scholar] [CrossRef]
- Bianchera, A.; Alomari, E.; Bruno, S. Augmentation therapy with alpha 1-antitrypsin: present and future of production,formulation, and delivery. Curr Med Chem 2022, 29, 385–410. [Google Scholar] [CrossRef]
- Ellis, P.R.; Holm, K.E.; Choate, R.; Mannino, D.M.; Stockley, R.A.; Sandhaus, R.A.; Turner, A.M.L. Quality of life and mor-tality outcomes for augmentation naïve and augmented patients with severe alpha-1 antitrypsin deficiency. Chronic Obstr Pulm Dis 2023, 10, 139–147. [Google Scholar] [CrossRef]
- Dirksen, A.; Piitulainen, E.; Parr, D.G.; Deng, C.; Wencker, M.; Shaker, S.B.; Stockley, R.A. Exploring the role of CT densi-tometry: a randomised study of augmentation therapy in alpha1-antitrypsin deficiency. Eur Respir J 2009, 33, 1345–1353. [Google Scholar] [CrossRef] [PubMed]
- Stockley, R.A.; Parr, D.G.; Piitulainen, E.; Stolk, J.; Stoel, B.C.; Dirksen, A. Therapeutic efficacy of -1 antitrypsin augmen-tation therapy on the loss of lung tissue: an integrated analysis of 2 randomised clinical trials using computed tomography densitometry. Respir Res 2010, 11, 136–144. [Google Scholar] [CrossRef] [PubMed]
- Chapman, K.R.; Burdon, J.G.W.; Piitulainen, E.; Sandhaus, R.A.; Seersholm, N.; Stocks, J.M.; Stoel, B.C.; Huang, L.; Yao, Z.; Edelman, J.; McElvaney, N.G.; on behalf of the RAPID Trial Study Group. Intravenous augmentation treatment and lung den-sity in severe α1 antitrypsin deficiency (RAPID): a randomised, double-blind, placebo-controlled trial. Lancet 2015, 386, 360–368. [Google Scholar] [CrossRef] [PubMed]
- Lagarde, W.H.; Courtney, K.L.; Reiner, B.; Steinmann, K.; Tsalikian, E.; Willi, S.M. Human plasma-derived alpha1-protein-ase inhibitor in patients with new-onset type 1 diabetes mellitus: a randomized, placebo-controlled proof-of-concept study. Pediatr Diabetes 2021, 22, 192–201. [Google Scholar] [CrossRef]
- Magenau, J.M.; Goldstein, S.C.; Peltier, D.; Soiffer, R.J.; Braun, T.; Pawarode, A.; Riwes, M.M.; Kennel, M.; Antin, J.H.; Cutler, C.S.; Ho, V.T.; Alyea, E.P.; Parkin, B.L.; Yanik, G.A.; Choi, S.W.; Lewis, E.C.; Dinarello, C.A.; Koreth, J.; Reddy, P. 1-antitrypsininfusion for treatment of steroid resistant acute graft-versus-host disease. Blood 2018, 131, 1372–1379. [Google Scholar] [CrossRef]
- Pandey, S.; Pandey, P.; Tiwari, G.; Tiwari, R. Bioanalysis in drug discovery anddevelopment. Pharmaceutical Methods 2010, 1, 14–24. [Google Scholar] [CrossRef]
- Zhang, Y.J.; An, H.J. Technologies and strategies for bioanalysis of biopharmaceuticals. Bioanalysis 2017, 9, 1343–1347. [Google Scholar] [CrossRef]
- Skelly, J.P. A History of Biopharmaceutics in the Food and Drug Administration 1968–1993. The AAPS Journal 2010, 12, 44–50. [Google Scholar] [CrossRef]
- Federal Register; Bioavailability and Bioequivalence Requirements; July 7, 1977. 42:1624–53.
- Shah, V.P.; Midha, K.K.; Dighe, S.; McGilveray, I.J.; Skelly, J.P.; Yacobi, A.; Layloff, T.; Viswanathan, C.T.; Edgar, C.C.; Mcdowall, R.D.; Pittman, K.A.; Spector, S. Analytical methods validation: bioavailability, bioequivalence and pharmacokinetic studies. J Pharm Science 1992, 81, 309–312; [Google Scholar] [CrossRef]
- Findlay, J.W.A; Smith, W.C.; Lee, J.W.; Nordblom, G.D.; Das, I.; DeSilva, B.S.; Khan, M.N.; Bowsher, R.R. Validation ofimmunoassays for bioanalysis: a pharmaceutical industry perspective. J Pharm Biomed Anal 2000, 21, 1249–1273. [Google Scholar] [CrossRef]
- European Medicines Agency. Guideline on bioanalytical method validation. EMEA/CHMP/EWP/192217/ 2009; 2011.
- U.S. Food and Drug Administration, Bioanalytical Method Validation. Guidance for Industry, 2018.
- Kaza, M.; Karazniewicz-Lada, M.; Kosicka, M.; Siemiatkowska, A.; Rudzki, P.J. Bioanalytical method validation: new FDAguidance vs. EMA guideline. Better or worse? J Pharm Biomed Anal 2019, 165, 381–385; [Google Scholar] [CrossRef] [PubMed]
- Ezan, E. Pharmacokinetic studies of protein drugs: past, present and future. Adv. Drug Deliv. Rev. 2013, 65, 1065–1073. [Google Scholar] [CrossRef]
- Travis, J.; Johnson, D. Human 1-proteinase inhibitor. Methods Enzymol. 1981, 80, 754–764. [Google Scholar]
- Engelmaier, A.; Weber, A. Sensitive and specific measurement of alpha1-antitrypsin activity with an elastase complex for-mation immunosorbent assay (ECFISA). J Pharm Biomed Anal 2022, 209, 114476. [Google Scholar] [CrossRef]
- Weber, A.; Butterweck, H.; Mais-Paul, U.; Teschner, W.; Lei, L.; Muchitsch, E.-M.; Kolarich, D.; Altmann, F.; Ehrlich, H.J.; Schwarz, H.-P. Biochemical, molecular, and preclinical characterization of a double-virus-reduced human butyrylcholinester-ase preparation designed for clinical use. Vox Sang. 2011, 100, 285–297. [Google Scholar] [CrossRef] [PubMed]
- Bland, J.M.; Altman, D.G. Statistical methods for assessing agreement between two methods of clinical measurement. Lancet 1986, 327, 307–310. [Google Scholar] [CrossRef]
- Bieth, J.; Spiess, B.; Wermuth, C.G. The synthesis and analytical use of a highly sensitive and convenient substrate of elas-tase. Biochem. Med. 1974, 11, 350–357; https://. [Google Scholar] [CrossRef]
- Boudier, C.; Pelletier, A.; Pauli, G.; Bieth, J.G. The functional activity of alpha1-proteinase inhibitor in bronchoalveolarlavage fluids from healthy human smokers and non-smokers. Clin. Chim. Acta 1983, 132, 309–315. [Google Scholar] [CrossRef]
- Afford, S.C.; Stockley, R.A.; Kramps, J.A.; Dijkman, J.H.; Burnett, D. Concentration of bronchoalveolar lavage fluid by ul-trafiltration: Evidence of differential protein loss and functional inactivation of proteinase inhibitors. Anal Biochem 1985, 151, 125–130. [Google Scholar] [CrossRef]
- Engelmaier, A; Zimmermann, M; Butterweck, H.A.; Weber, A. Clinical study support by long-term stability studies of al-pha1-proteinase inhibitor and urea in relevant biological matrices. Pharmaceuticals 2025, 18, 572. [Google Scholar] [CrossRef]
- Noel-Georis, I.; Bernard, A.; Falmagne, P.; Wattiez, R. Database of bronchoalveolar lavage fluid proteins. J Chromatogr BAnalyt Technol Biomed Life Sci. 2002, 771, 221–236. [Google Scholar] [CrossRef]
- Wattiez, R.; Falmagne, P. Proteomics of bronchoalveolar lavage fluid. J Chromatogr B Analyt Technol Biomed Life Sci. 2005, 815, 169–178. [Google Scholar] [CrossRef] [PubMed]
- Olsen, G.N.; Harris, J.O.; Castle, J.R.; Waldman, R.H.; Karmgard, H.J. Alpha-1-antitrypsin content in the serum, alveolarmacrophages and alveolar lavage fluid of smoking and nonsmoking normal subjects. J Clin Invest 1975, 55, 427–430. [Google Scholar] [CrossRef] [PubMed]
- Taggart, C.; Cervantes-Laurean, D.; Kim, G.; McElvaney, N.G.; Wehr, N.; Moss, J.; Levine, R.L. Oxidation of either methio-nine 351 or methionine 358 in 1-antitrypsin causes loss of anti-neutrophil elastase activity, J. Biol. Chem. 2000, 275, 27258–27265. [Google Scholar] [CrossRef]
- Thelwell, C.; Marszal, E.; Rigsby, P.; Longstaff, C. An international collaborative study to establish the WHO 1st interna-tional standard for alpha-1-antitrypsin. Vox Sang 2011, 101, 83–89. [Google Scholar] [CrossRef]
- Dati, F.; Schumann, G.; Thomas, L.; Aguzzi, F.; Baudner, S.; Bienvenu, J.; Blaabjerg, O.; Blirup-Jensen, S.; Carstöm, A.; Hytoft-Petersen, P.; Johnson, A.M.; Milford-Ward, A.; Ritchie, R.F.; Svendsen, P.J.; Whicher, J. Consensus of a group of profes-sional and diagnostic companies on guidelines for interim ranges for 14 proteins in serum based on the standardization against the IFCC/BCR/CAP reference material (CRM470). International Federation of Clinical Chemistry. Community Bureau of Refer-ence of the Commission of the European Communities. College of American Pathologists. Eur J Clin Chem Biochem 1996, 34, 517–520. [Google Scholar]
Figure 1.
Mean calibration curve of the ECFISA AAT activity measurement. The mean (n=59) six-point, log-log calibration ranging from 6 to 192 ng/mL functional active AAT/mL is shown. Error bars indicate the relative standard deviations. The inserts provide mean quality characteristics including the slope, correlation coefficient and RTE of the calibrations curve and the agreement of the back-fitted assay calibrators with their nominal concentration, respectively.
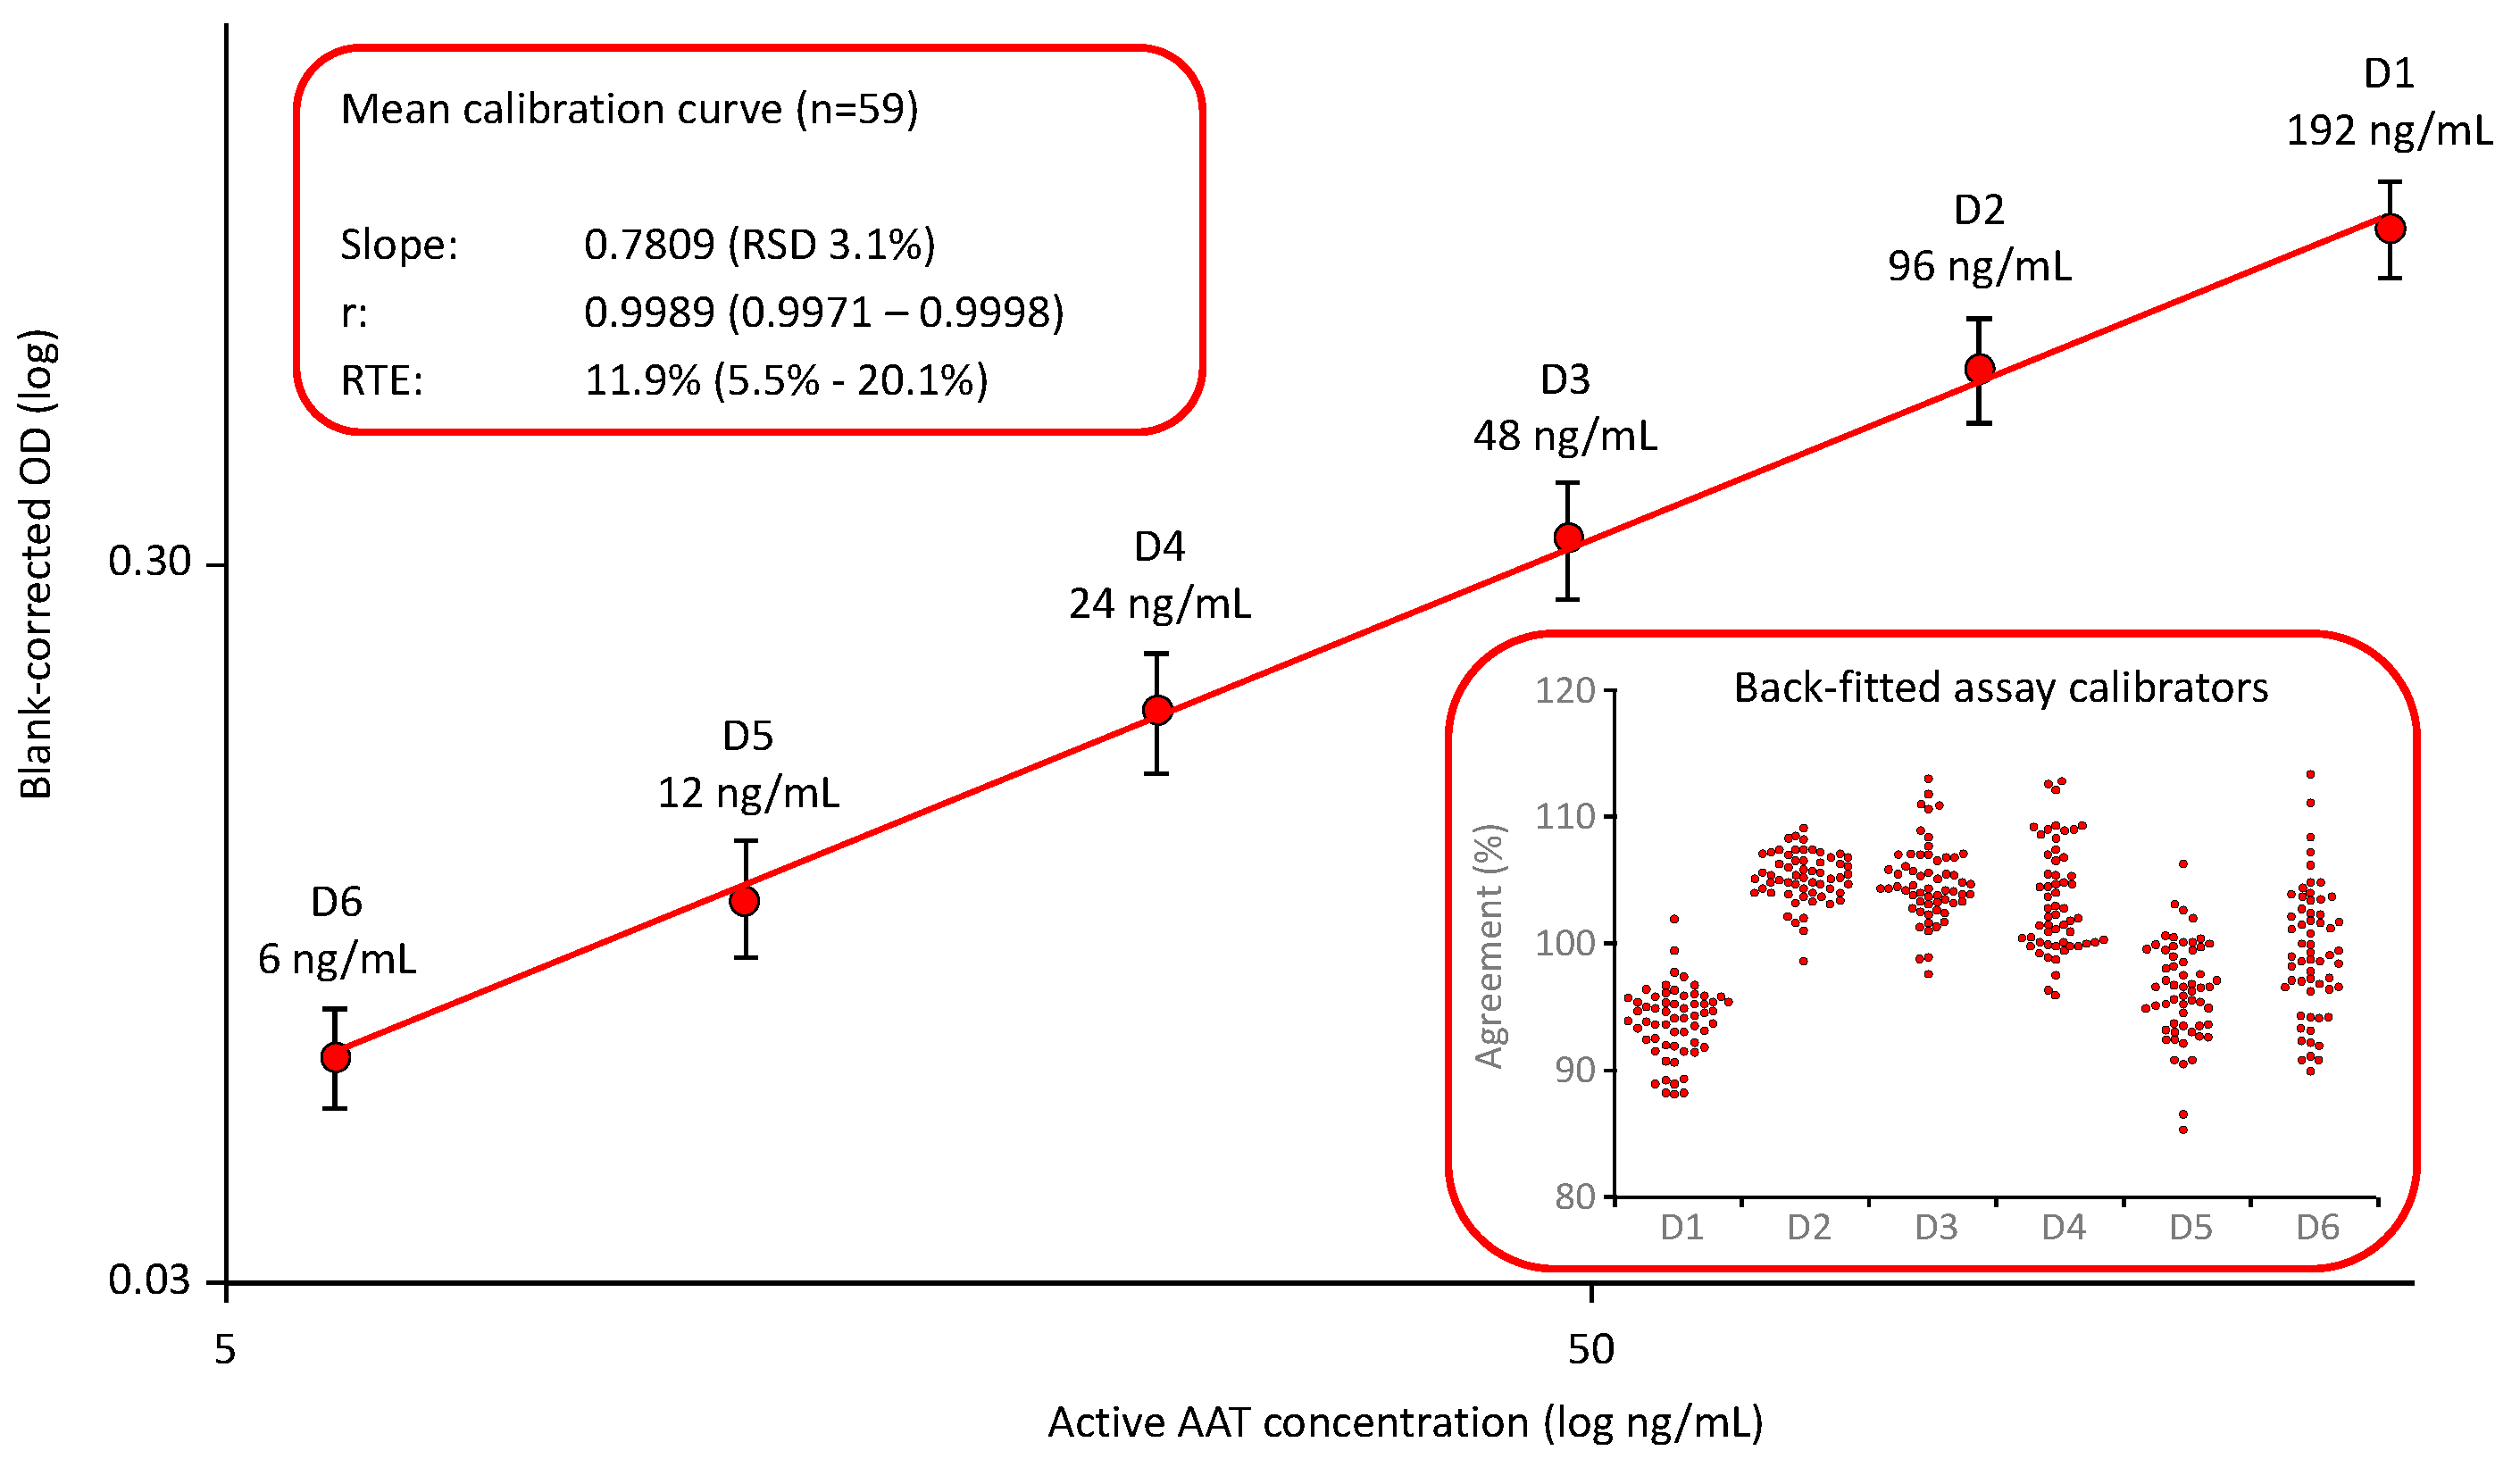
Figure 2.
Mean calibration curve of the nephelometric AAT assay. The mean six-point calibration curve (n=12) ranging from 9.69 to 310 µg AAT/mL is shown. The inserts provide the mean signals obtained for the six assay calibrators and their RSDs and the agreement of the back-fitted assay calibrators with their nominal concentration, respectively.
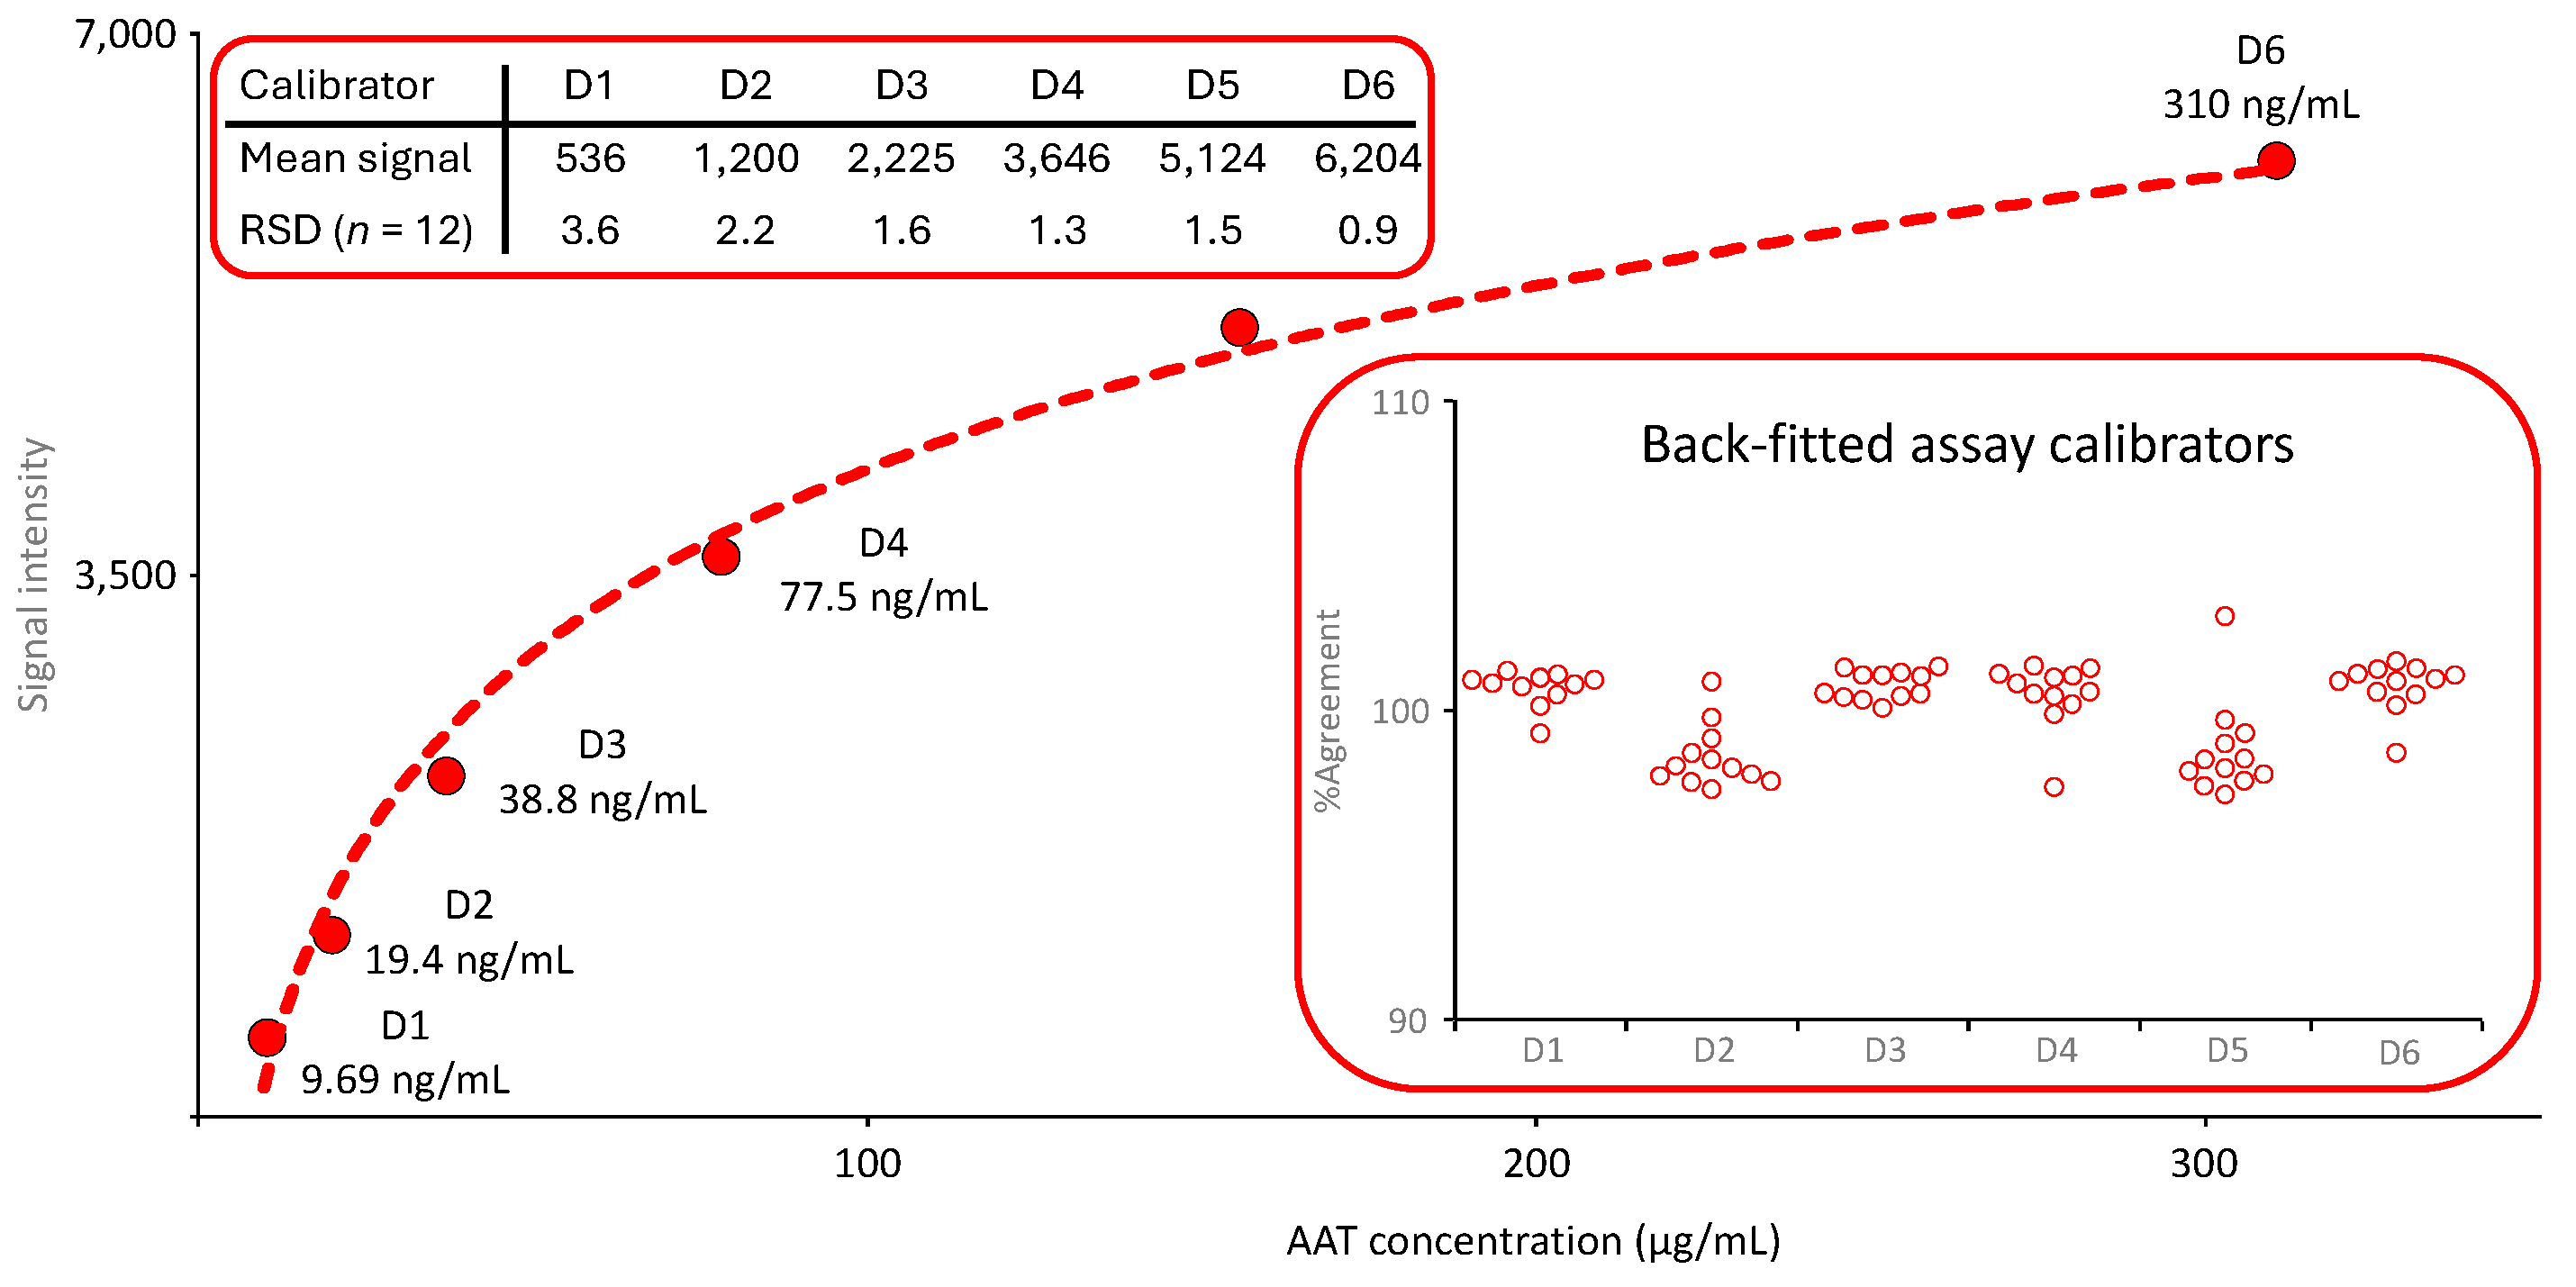
Figure 3.
Mean calibration curve of the AAT ELISA. The mean (n=29) five-point, log-log calibration ranging from 1.75 to 28 ng/mL AAT/mL is shown. Error bars indicate the relative standard deviations. The inserts provide mean quality characteristics including the slope, correlation coefficient and RTE of the calibrations curve and the agreement of the back-fitted assay calibrators with their nominal concentration, respectively.
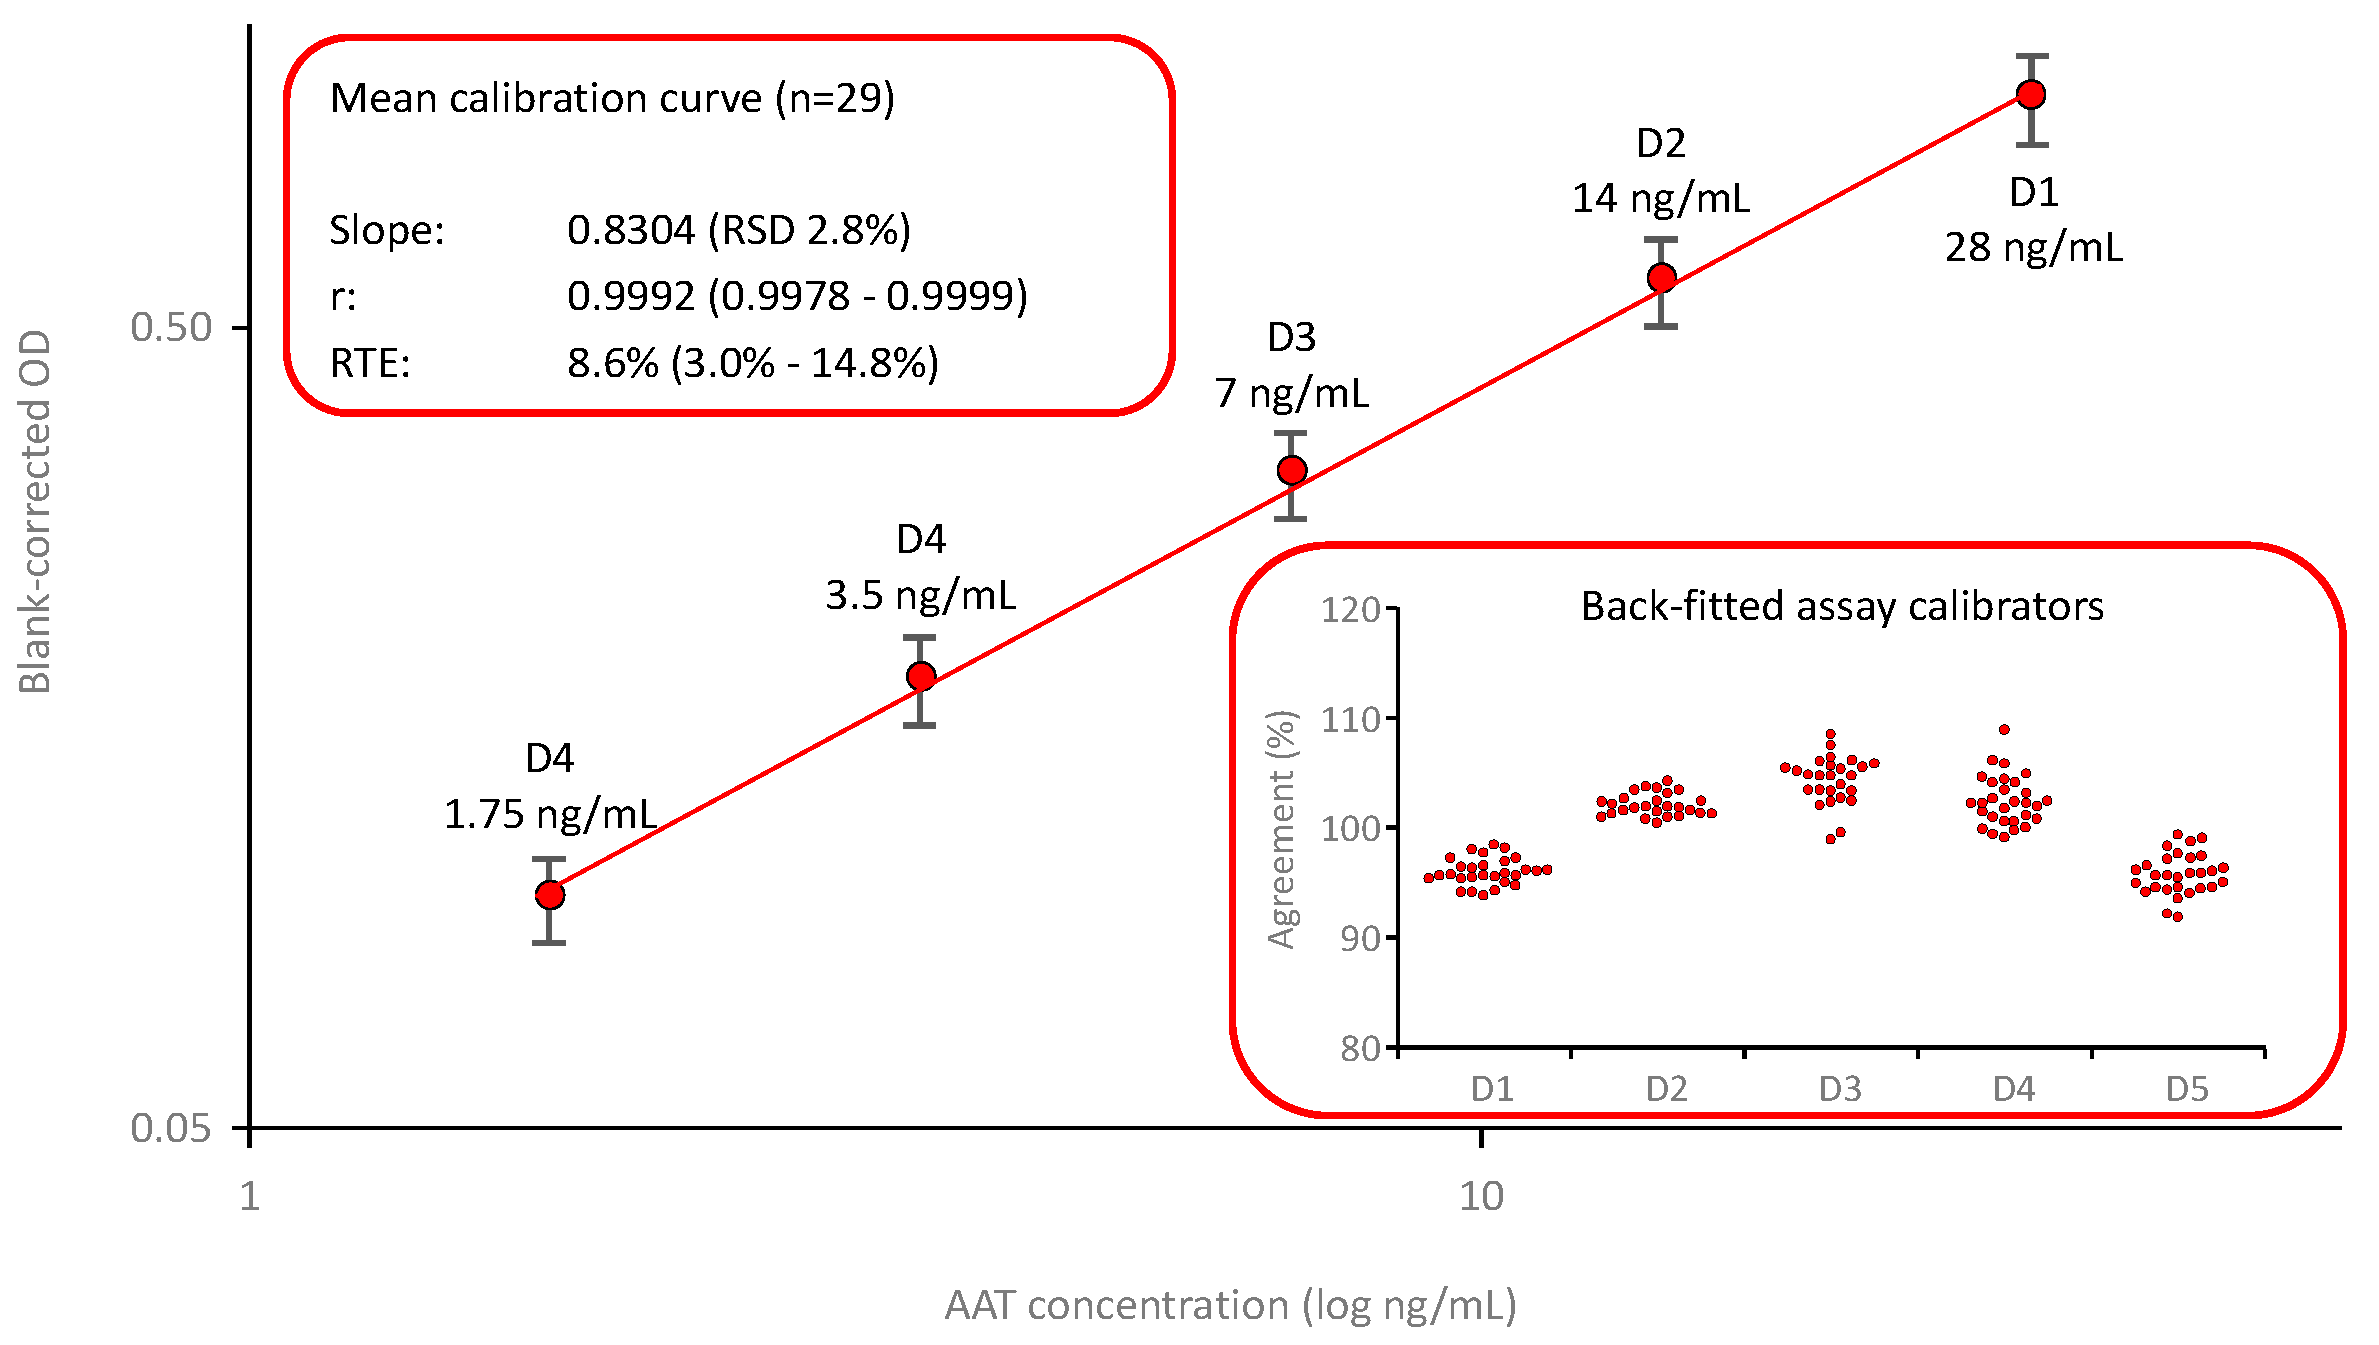
Figure 4.
Recovery of AAT activity and AAT protein in samples with low protein content and citrated plasma. The recovery of AAT is shown as a percent of the expected AAT concentration. Panels a and b show the data obtained for the AAT activity measurement in BAL-mimicking samples with a low protein content and in citrated plasma, respectively, while panels c and d provide the recoveries of AAT protein, determined with the nephelometric method and the AAT ELISA.
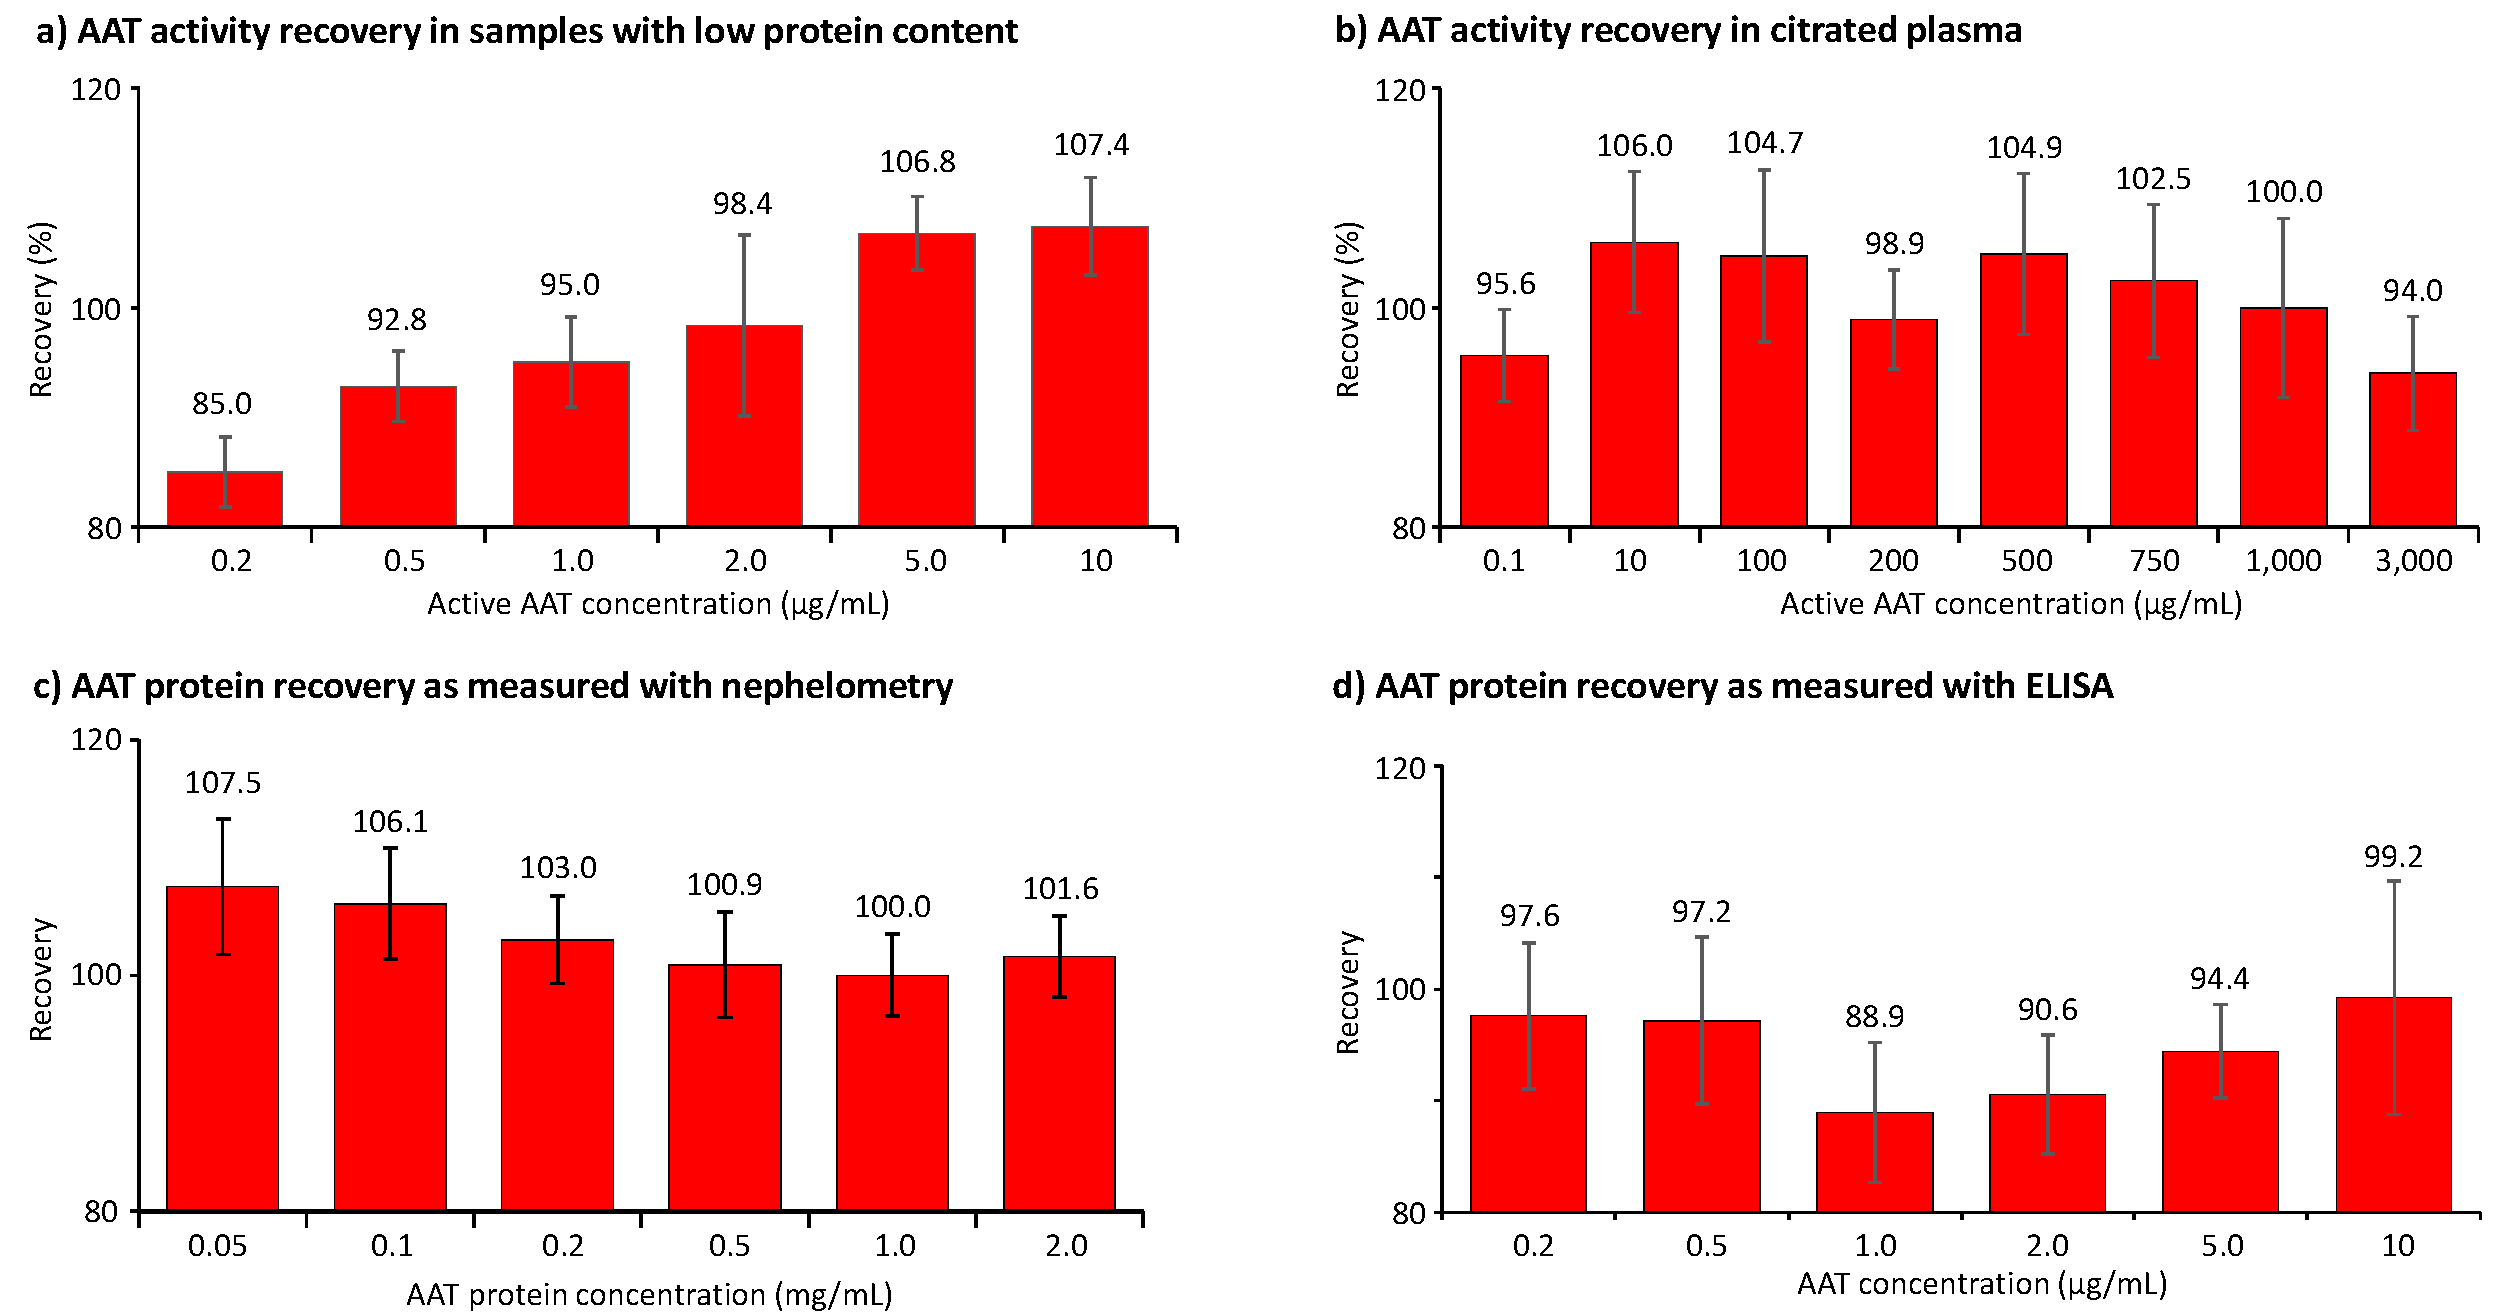
Figure 5.
Results of the precision analysis. The results of the precision analysis are expressed as the RSDs obtained for the means of six independent tests, carried out in one run (=intra-run precision) or six runs (=inter-run precision). Panels a and b show the precision data of the AAT activity measurement in BAL-mimicking samples and citrated plasma, while panels c and d show the precision data of the AAT protein measurement with the nephelometric method and the ELISA, respectively, carried out for citrated plasma and BAL-mimicking samples. ND stands for not done.
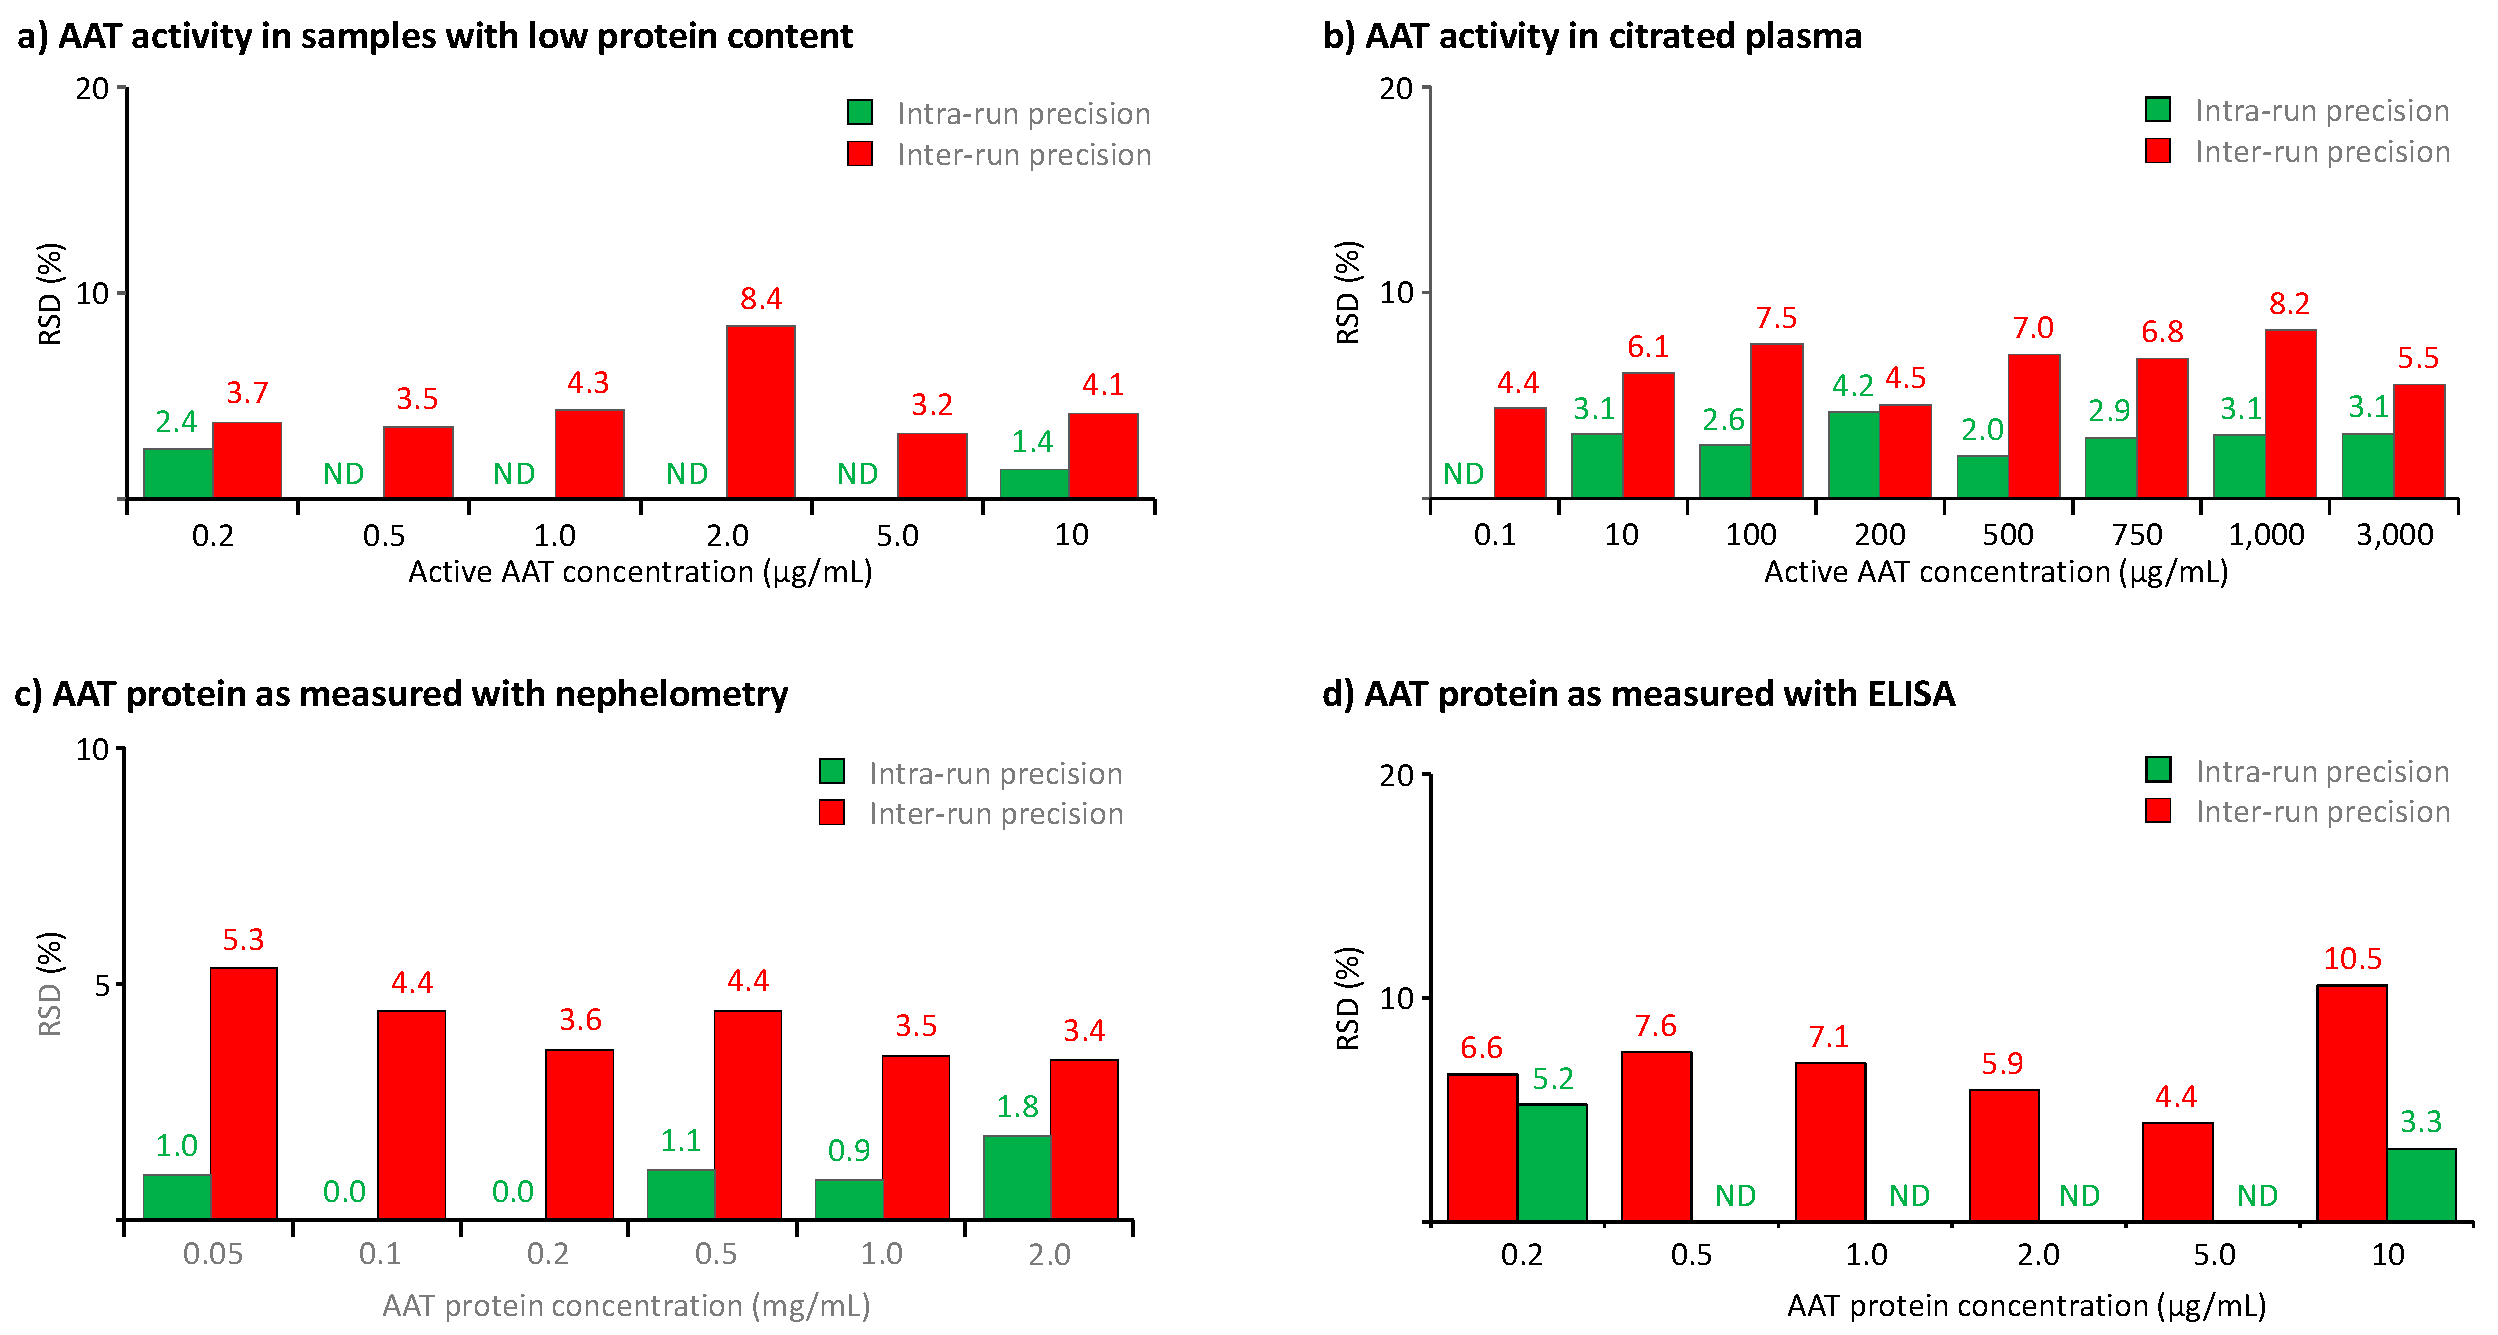
Figure 6.
Results of the linearity analysis. The linear regression curves between the AAT concentrations found and the nominal ones are shown for the AAT activity measurement in BAL-mimicking samples (panel a) and citrated plasma (panel b). Panels c and d show the regression lines obtained for the AAT protein measurement in citrated plasma and BAL-mimicking samples, respectively. The coefficient of determination R², determined for these linear regression curves is given.
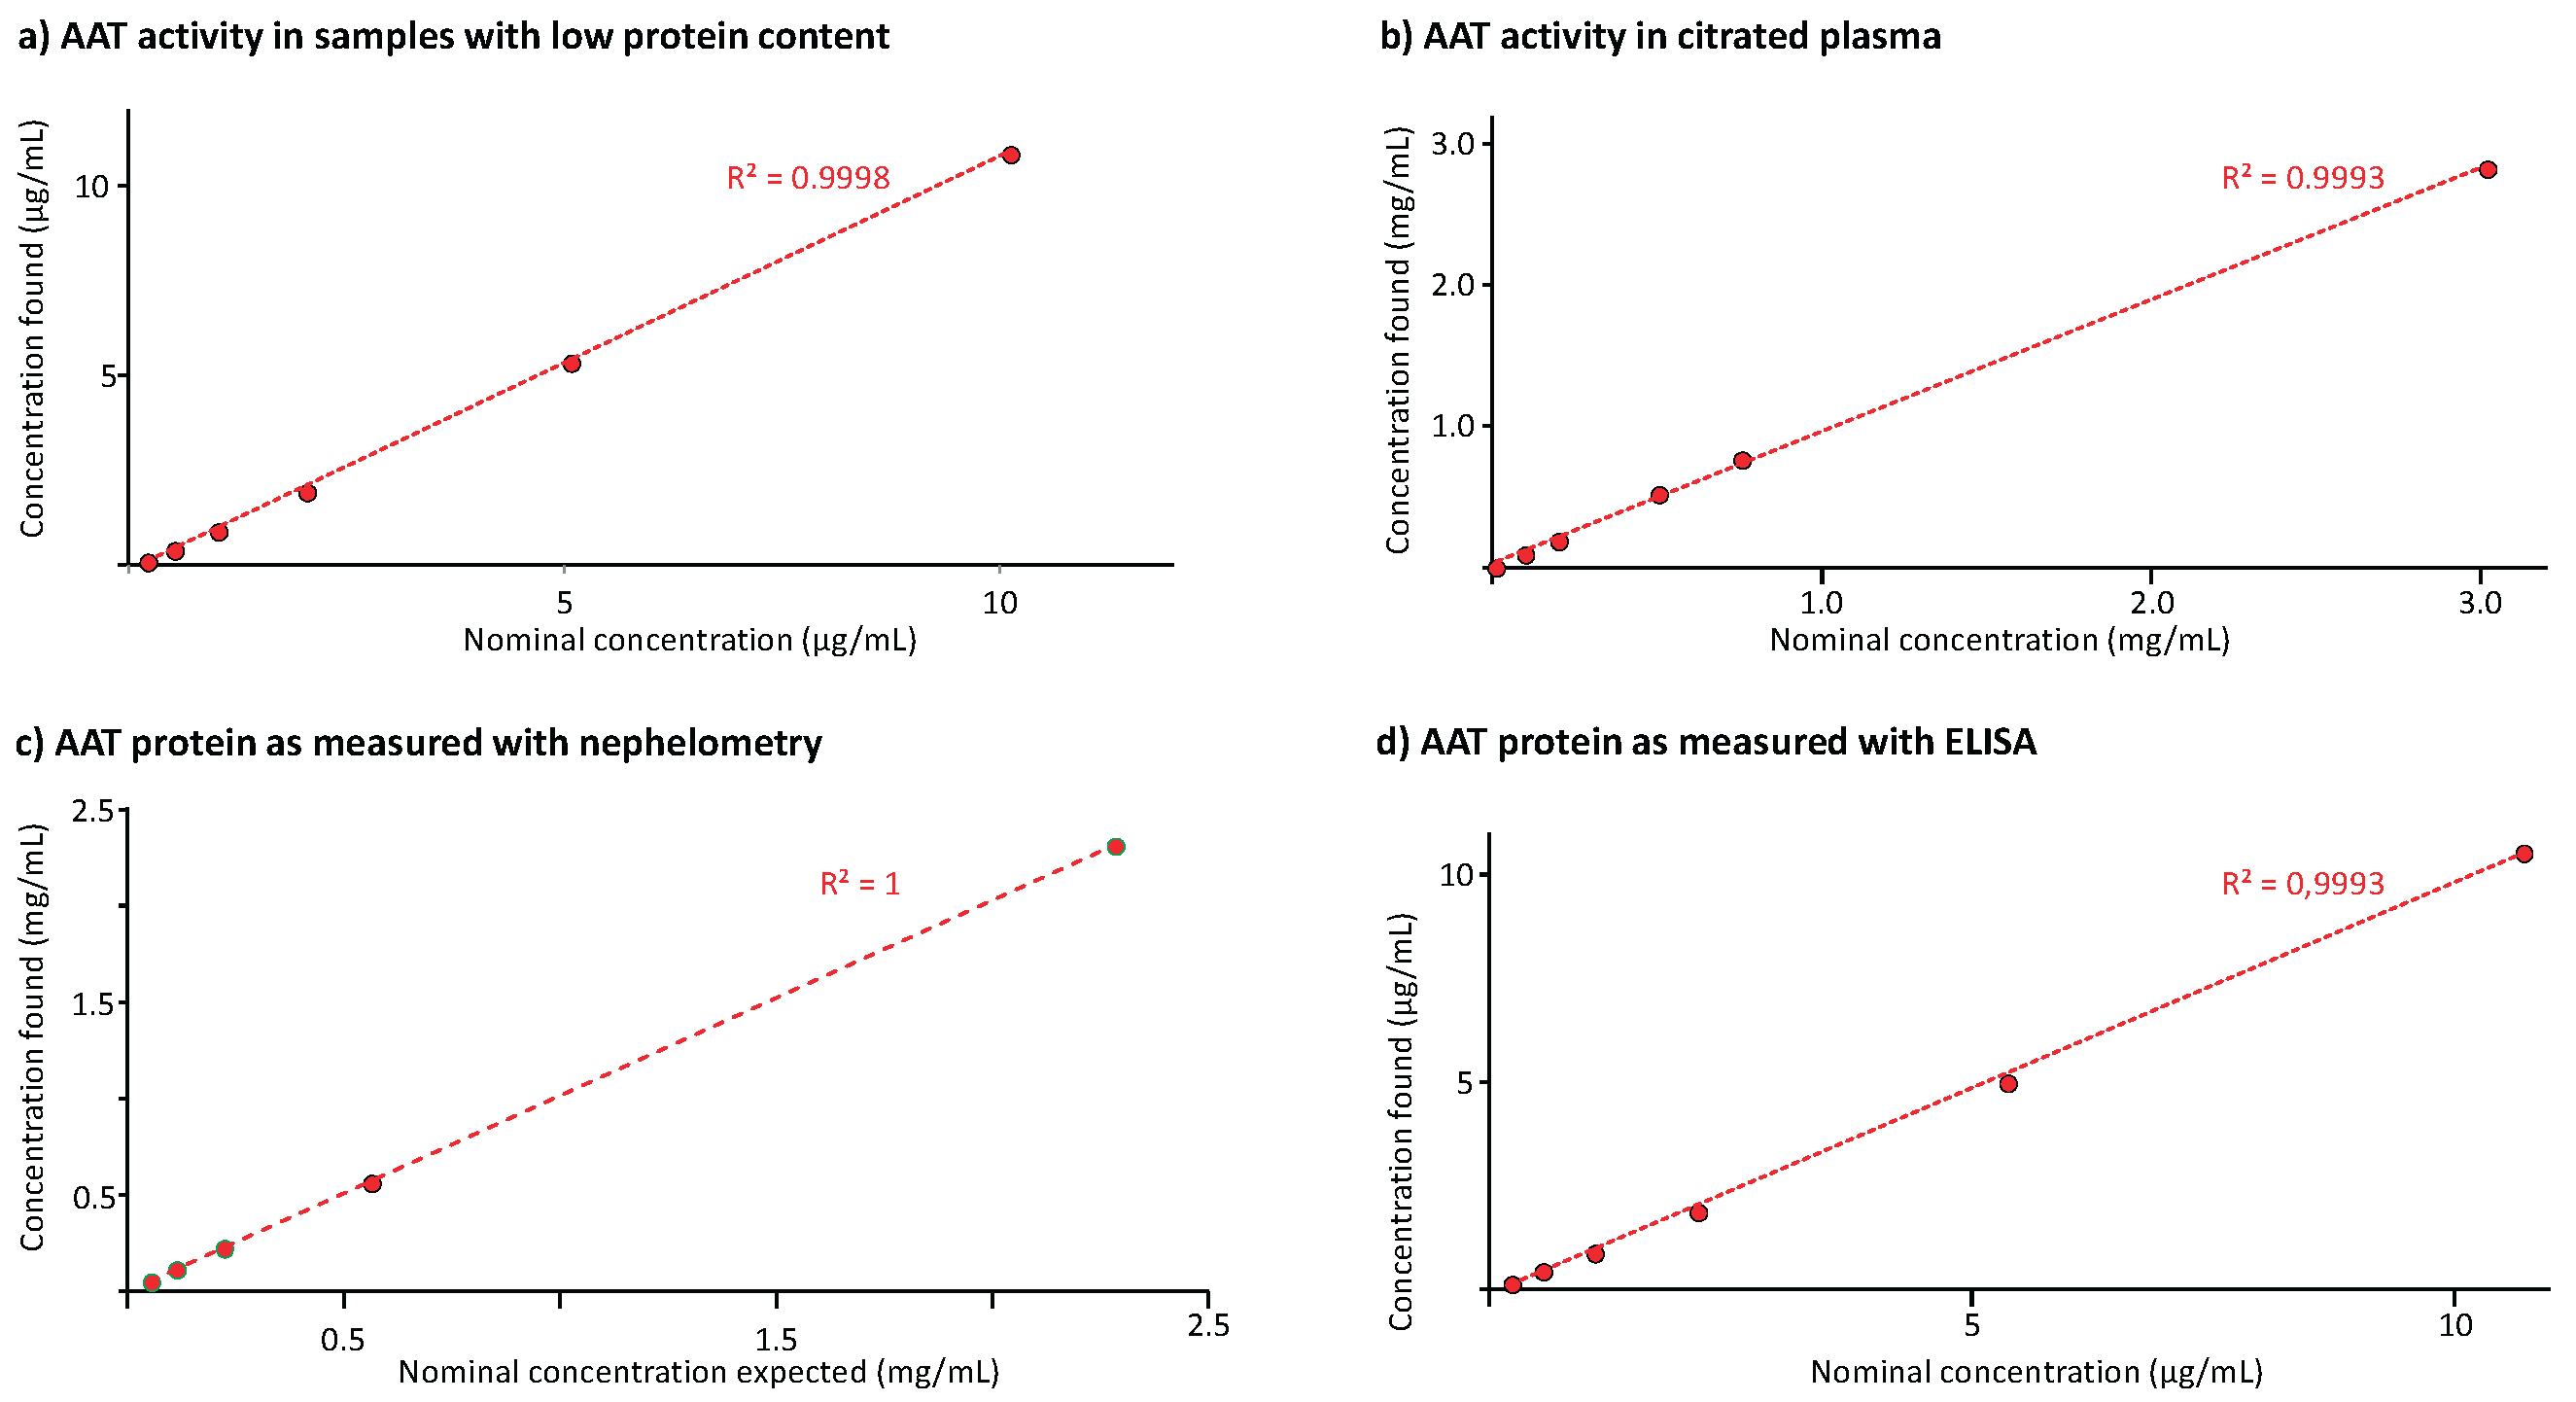

Table 1.
Total errors for the AAT activity and AAT protein measurement methods.
| AAT activity | AAT protein | ||||||
|---|---|---|---|---|---|---|---|
| ECFISA | Nephelometry | ELISA | |||||
| Citrated plasma | BAL-mimicking sample | Citrated plasma | BAL-mimicking sample | ||||
| µg/mL | TE1) (%) | µg/mL | TE (%) | mg/mL | TE (%) | µg/mL | TE (%) |
| 0.1 | 8.8 | 0.2 | 18.7 | 0.05 | 12.9 | 0.2 | 8.9 |
| 10 | 12.1 | 0.5 | 10.7 | 0.1 | 10.5 | 0.5 | 10.4 |
| 100 | 12.2 | 1.0 | 9.3 | 0.2 | 6.6 | 1.0 | 18.1 |
| 200 | 5.6 | 2.0 | 10.0 | 0.5 | 5.3 | 2.0 | 15.3 |
| 500 | 11.9 | 5.0 | 9.9 | 1.0 | 3.5 | 5.0 | 10.0 |
| 750 | 9.3 | 10 | 11.6 | 2.0 | 5.0 | 10 | 11.3 |
| 1,000 | 8.2 | ||||||
| 3,000 | 11.5 | ||||||
1) TEs were calculated for each AAT concentration as the sum of the absolute difference of 100 - mean recovery and the RSD, describing the inter-run precision.
Table 2.
Short-term stability on the bench.
| h at RT | %initial AAT concentration | |||||
| Citrated plasma | BAL-mimicking samples | |||||
| AAT activity | AAT activity | AAT protein (ELISA) | ||||
| 10 µg/mL | 1,000 µg/mL | 0.2 µg/mL | 10 µg/mL | 0.2 µg/mL | 10 µg/mL | |
| 1 | 102.71) | 104.3 | 106.3 | 100.0 | 95.0 | 100.0 |
| 2 | 104.8 | 102.6 | 106.3 | 100.9 | 95.0 | 94.3 |
| 3 | 104.2 | 105.2 | 100.0 | 100.9 | 95.0 | 101.9 |
| 4 | 106.6 | 113.8 | 100.0 | 98.1 | 100.0 | 97.1 |
| h at RT | %initial AAT concentration | |||||
| Citrated plasma | ||||||
| AAT protein (nephelometry) | ||||||
| 0.05 mg/mL | 0.5 mg/mL | 1.0 mg/mL | ||||
| 4 | 100.0 | 100.0 | 96.4 | |||
| 24 | 97.0 | 98.3 | 94.5 | |||
| 48 | 98.8 | 97.1 | 93.8 | |||
1) The stability data are shown as a percent of the initially measured AAT activity or AAT protein concentration. All results correspond to the means of triplicates, measured in one run. The RSDs of the means of the triplicates did not exceed 5%.
Table 3.
Freezing-thawing stability.
| Cycle | %initial AAT concentration | ||||||||
|---|---|---|---|---|---|---|---|---|---|
| Citrated plasma | BAL-mimicking samples | Citrated plasma | |||||||
| Activity (µg/mL) | Activity (µg/mL) | ELISA (µg/mL) | Nephelometry (µg/mL) | ||||||
| 10 | 1,000 | 0.2 | 10 | 0.2 | 10 | 50 | 500 | 1,000 | |
| 1 | 96.91) | 107.1 | 88.2 | 102.8 | 105.0 | 98.3 | 102.6 | 101.9 | 108.5 |
| 2 | 99.1 | 107.6 | 88.2 | 101.8 | 100.0 | 101.6 | 102.0 | 100.6 | 106.9 |
| 3 | 103.5 | 110.2 | 88.2 | 101.8 | 90.0 | 93.4 | 102.6 | 98.8 | 105.7 |
1) The stability data are shown as a percent of the initially AAT activity or AAT protein concentration, measured for the sample kept at RT for 0 h. All results correspond to the means of triplicates measured in one run. The RSDs of the means of the triplicates did not exceed 5%.
Disclaimer/Publisher’s Note: The statements, opinions and data contained in all publications are solely those of the individual author(s) and contributor(s) and not of MDPI and/or the editor(s). MDPI and/or the editor(s) disclaim responsibility for any injury to people or property resulting from any ideas, methods, instructions or products referred to in the content. |
© 2025 by the authors. Licensee MDPI, Basel, Switzerland. This article is an open access article distributed under the terms and conditions of the Creative Commons Attribution (CC BY) license (http://creativecommons.org/licenses/by/4.0/).
Copyright: This open access article is published under a Creative Commons CC BY 4.0 license, which permit the free download, distribution, and reuse, provided that the author and preprint are cited in any reuse.


