
Submitted:
10 November 2024
Posted:
11 November 2024
You are already at the latest version
Abstract
Background: Autoantibodies such as rheumatoid factor (RF) and anti-citrullinated protein autoantibodies (ACPAs) are useful tools for rheumatoid arthritis (RA). The presence of ACPAs against citrullinated proteins (CPs), especially citrullinated fibrinogen (cFBG), seems to be a useful serological marker for diagnosing RA. RA patients' sera were found to be enriched in exosomes that can transmit many proteins. Exosomes have been found to express citrullinated protein, such as cFBG. Methods: We investigated the autoantibodies in one hundred sixteen Saudi RA patients and correlated with host-related risk factors. Exosomes were extracted from patients' sera and examined for the presence of cFBG using monoclonal antibodies. Results: The study reported high female-to-male ratio of 8:1, and the seropositive RA (SPRA) was more frequent among included RA patients. The frequency and the levels of ACPAs were similar in both genders. Autoantibodies incidences have a direct proportion with patients, age, while the average titers decreased as the age increased. Further, the highest incidence and levels of autoantibodies were reported in patients with RA duration between 5-10 years. Smoking and family history have no impact on autoantibody, except for ACPAs titers among smokers RA. Our analysis of serum exosomes revealed that about 50% of SPRA patients expressed cFBG. Conclusion: Further studies are needed to confirm the increasing rate of RA among Saudi patients, as well as the spike in the number of women affected by the disease. The role of autoantibodies in RA can be improved by conducting in-depth research on ACPA in conjunction with other factors, such as genetic, cellular, and even lifestyle factors. Proteomic study of serum exosomes can be performed and validated in larger populations to develop new diagnostic and prognostic markers for RA. It can also be assessed to fill in the gaps in the current understanding of the etiology of RA to enhance disease management.
Keywords:
Rheumatoid arthritis (RA)
; anti-citrullinated protein antibodies (ACPAs)
; risk factors
; citrullinated fibrinogen (cFBG)
; exosomes
; serum-derived exosomes
1. Introduction
Rheumatoid arthritis (RA) is a systemic autoimmune disease of unknown etiology. RA is the most common chronic disorder, with a global prevalence incidence of 0.5-1% [1]. Citrullination is a post-translation modification (PMT) process related to human physiology and some pathological diseases. In inflammatory diseases such as RA, MS, and PsA, citrullinated peptides (CPs) have been found to trigger antibodies against such modified proteins [2]. Autoantibody measures have been a constant companion for physicians managing RA patients, and their significance has grown over the past few decades. Autoantibody investigations include the measurement of rheumatoid factor (RF) and anti-citrullinated peptide antibodies (ACPAs). ACPAs and RF improve diagnostic accuracy and are included in the 2010 ACR/EULAR criteria [3,4]. RF is commonly used as a diagnostic marker of RA, whereas anti-ACPAs, including anti-cyclic citrullinated peptide (anti-CCP) and anti-mutated citrullinated vimentin (anti-MCV), are being used as specific prognostic and diagnostic biomarkers for RA. Both anti-CCP and anti-MCV may exist in patients' sera years before the appearance of clinical symptoms; thus, they can predict the early progression of RA [4,5]. However, RA could be classified as seropositive RA (SPRA) or seronegative RA (SNRA). SPRA refers to the presence of IgM-RF and/or ACPAs, whereas SNRA refers to the absence of these autoantibodies in confirmed RA. Based on clinical and laboratory evidence, seropositivity occurs in 60-80% of patients with confirmed RA [6].
Despite the exact cause of RA is still unknown, a bulk of evidence indicates that many factors might increase the risk of RA, including age, gender, genetic, environmental, and metabolic factors. The combination of genetic and environmental factors is strongly associated with RA. The early diagnosis of RA is important in the treatment and prevention of worse stages [7]. Many epidemiologic studies indicate sex-related factors in RA risk, as two-thirds of RA patients are female. Therefore, it has long been thought that there are female-specific characteristics that increase the risk of RA [8]. A recent systematic review and meta-analysis investigated the association between gender type and serostatus, i.e., seropositive and seronegative. This meta-analysis found that men with RA are more likely to have seropositive RA than women. The results indicated that RF-positivity in males was 16% higher than in females. Similarly, the analysis of ACPA seropositivity showed that males who were ACPA-positive were 12% higher than females [9]. Many studies have elucidated that hormonal replacement therapy (HRT) and the use of oral contraceptives (OCs) for ≥7 years were effective against ACPA and RF development [10,11].
The frequency of RF and ACPA positivity was variable among different age groups. Some reports revealed that seropositivity is more frequent in patients aged above 40 and up to 60 years, while it is less prevalent in other age groups, i.e., <40 and >60 years [12,13]. Considering disease duration, it has been found that there is no significant change in autoantibody existence in patients with early RA (<1 year) and established RA (>2 years). A slight rise has been reported in RF, anti-CCP, and anti-MCV [4]. However, another stydy found that anti-CCP and IgM-RF increased significantly after 5 years of duration [14]. This was supported by further studies that have found that ant-CCP frequency and level exacerbate in the early onset of RA (≤1 year) and then decline decrementally within 3-5 years. Afterward, anti-CCP increased significantly after 5 years of duration [15,16]. Extensive epidemiologic studies have demonstrated that the RA risk for smokers is two times higher than that of non-smokers, notably in male smoker RA patients [17,18]. Even in the absence of RA, smoking has long been linked to a positive RF [19,20]. Many studies have linked the presence of ACPA in smokers to the fact that smoking induces the citrullination process during lung inflammation. It has been found that there is a considerable correlation between smoking and anti-CCP concentration, whereas RF levels were comparable between smoker and non-smoker RA patients [21,22,23,24].
RA is highly heritable and, unfortunately, tends to run in families. According to various studies, 50–60 percent of RA cases are thought to be heritable [25,26]. Assessment of family history in autoimmune diseases may be considered before the identification of genetic factors [27,28]. The human leukocyte antigen (HLA) has essential roles in antigen presentation and immune response in RA. HLA-DRB1 carrying shared epitopes (SE) is a class II-HLA, and it is well established to be the strongest genetic risk factor for developing RA [29]. Recent studies have clarified the high expression of HLA-DRB1 SE on the immunocytes of RA patients. The HLA-DRB SE can bind and present the citrullinated protein and trigger the autoimmunity response in RA [30,31]. Considering the serostatus, early familiar and genetic studies found that family aggregation was higher in seropositive RA cases than in seronegative cases [32,33].
Interestingly, it has been verified that RA patients had higher levels of extracellular vesicles (Evs) than healthy individuals [34]. Furthermore, people with RA have been reported to have distinct exosome cargo, which may help with diagnosis [35]. Exosomes are the smallest and most well-studied class of Evs, with an average diameter of 30-150 nm and density of 1.13–1.19 g/ml; they have a spherical cup-like shape in EM images [36,37]. Exosome cargo includes proteins, lipids, nucleic acids, small molecules, and receptors. These nanoparticles have many critical roles in biological systems' physiology, pathology, and therapy [38]. Exosomes encompass many proteins in their cargo, with the proteome of a typical exosome containing approximately 4,400 proteins [39]. The most common proteins in exosomes are ESCRT proteins (Alix and tumor susceptibility gene 101 (TSG101)), heat shock proteins (HSP70 and HSP90), and tetraspanin (CD9, CD63, and CD81). Distinctly, these exosome-enriched proteins are highly utilized as specific markers for exosomes [40]. The high stability of exosomes in the extracellular space enables them to carry their cargo far away to interact with distant cells [41].
The proteomic and immunological studies of immune cell-derived exosomes obtained from different body fluids revealed the significant role of these nanovesicles in the regulation and modulation of immune responses, including both immune suppression and immune stimulation [42]. Serum exosomes can transfer several proteins involved in RA pathogenesis and might be predictors of therapeutic responses. Serum exosomes exhibit antigen-presenting functions as they can express HLA, especially HLA-DRB1 SE, which has a great affinity to citrullinated proteins [43]. A recent study has shown that B cells produce a high level of HLA-bearing exosomes [44]. Furthermore, proteomics of RA serum exosomes showed that exosomes could present the citrullinated peptides to effector CD8+ cells to release TNF-α and IFN-γ [45]. Citrullinated fibrinogen (cFBG) has been identified as a major autoantigen for ACPAs that play a role in RA pathogenesis. The increased levels of cFBG have been detected in the serum and synovium of RA patients and have been linked to joint damage and RA severity. [46,47,48]. Analysis of exosomes derived from inflamed synovium led to the detection of cFBG on the exosome surface, which may trigger the production of ACPAs [49]. In our current work, we aim to explore the presence of cFBG in serum-derived exosomes. However, as far as we know, no studies have investigated cFBG in exosomes extracted from the serum of RA patients.
2. Materials and Methods
2.1. Study Population and Sample Collection
A set of 116 Saudi RA patients, aged 18-70 years, and 35 healthy controls (HC), aged 23-66 years, were included in this study. The control group included demographically matched, healthy individuals chosen from the general population and the King Abdulaziz University Hospital (KAUH) staff. Patients were enrolled and investigated during their routine visits to the rheumatology clinic at KAUH. We selected the patients who met the inclusion criteria and agreed to participate in the study. The inclusion criteria require that patients be adults (≥18 years old) and have a confirmed RA according to the rheumatologist's diagnosis or based on the fulfillment of the ACR 1987 criteria for RA. The study was approved by the research ethics committee of the Faculty of Medicine at King Abdulaziz University (468-19), and all patients have received written informed consent for participation. Following consent, clinical and demographic data were obtained from the patients or their accompanying relatives. The parameters collected for the patients include age, gender, disease onset, disease duration, family history, smoking status, and occupation.
Serum samples were collected from 116 RA patients attending the rheumatology clinic at KAUH for routine appointments. One hundred and sixteen patients who fulfilled the inclusion criteria and consented to participate in the current study were subjected to blood collection. Whole blood was collected from the veins in the arms by drawing peripheral blood into serum separator tubes for laboratory testing. All collected samples were processed within 1 hour of the collection and centrifuged for serum separation. A fraction of the serum was used for serological testing, while the other was subjected to exosome extraction and further exosomal analysis. The same procedure was applied to the health control group.
2.2. Laboratory Analysis
Measurements of RF and ACPA (anti-CCP and anti-MCV) were performed in the accredited laboratory of immunology at KAUH. Exosome preparation, characterization, and the identification of citrullinated protein (cFBG) were performed in a research lab in the college of science at KAU.
2.2.1. RF Testing
Serum was tested for RF-IgM by nephelometry assay on BN II system using N Latex RF Kit (Siemens Healthcare Diagnostics, Marburg, Germany). All samples and QC samples were run according to the manufacturer's instructions. The assay can detect RF in a range from 10 to 1500 IU/mL. The N Latex RF contains an immunocomplex of human immunoglobulin and anti-human IgG from sheep that aggregate with RF-IgM. The intensity of aggregation is proportional to RF concentration. The measurements were evaluated against the reference curve and reported in IU/mL; results ≥ 20 IU/mL were considered positive for RF.
2.2.2. Anti-CCP and Anti-MCV Testing
The presence of anti-CCP and anti-MCV in the serum of all participants was tested on an Alegria system using the anti-CCP and anti-MCV reagents (ORGENTEC Diagnostika GmbH, Mainz, Germany). Both reagents are ELISA-based assays for the quantitation of immunoglobulin G (IgG) class autoantibodies against citrullinated peptides in human serum or plasma samples. The anti-MCV includes specific epitopes purified from the native mutated citrullinated protein. All measurements were reported in U/ml, and the cut-off was 20 IU/ml. Any result ≥ 20 IU/ml was reported as positive for anti-CCP or anti-MCV.
2.3. Exosomal Study
Exosomes were extracted from serum samples using a commercial reagent and subjected to morphological study and protein identification. Transmission electron microscopy (TEM) and dynamic light scattering (DLS) were used for morphological studies. Sodium dodecyl-sulfate polyacrylamide gel electrophoresis (PAGE) and western blotting were used for the identification of exosome markers proteins and citrullinated fibrinogen (cFBG) in serum-derived exosomes.
2.3.1. Exosome Isolation
Exosomes were extracted from the serum of RA patients (n = 116) and healthy individuals (n = 35) using the Total Exosome Isolation (TEI) kit from serum (Invitrogen, USA). All exosome preparation steps were performed in cold conditions. Initially, serum samples were centrifuged at 2000 x g for 30 minutes to remove cells and debris, and the supernatant was transferred to a new tube. Then, 30 µl of TEI reagent was added to 150 µl of serum and mixed by vortex until a homogenous solution formed with a cloudy appearance. The mixtures were then incubated at for 30 minutes. After incubation, mixtures were centrifuged at 10,000 x g for 10 minutes at . The supernatants were carefully discarded, and the pellet containing the exosomes was subjected to 3 cycles of washing with cold 1X PBS (Gibco). Then, the pellet was resuspended entirely in 75 µl of cold 1 x PBS. Each pellet suspension was divided into two equal volumes and kept at for further analysis, one part for exosomes morphology and the other for exosomes protein identification.
2.3.2. Exosome Size Measurement by Dynamic Light Scattering
Exosome size measurements were analyzed using the Zetasizer Nano ZS ZEN3600 instrument (Malvern Panalytical, UK). Exosome preparations from the original suspensions (non-lyzed) were diluted 1:100 with sterile/filtered 1X PBS to a total volume of 1 ml. However, further dilutions were occasionally required to obtain an ideal concentration and avoid aggregation. The suspensions were then mixed by vortex for 1 minute, immediately poured into Kuvetten Cuvettes (SARSTEDT), and placed in the instrument for measurements. The temperature was set at a stable 25 °C, and the analyzer was allowed to equilibrate the temperature for 120 seconds, and each sample was run for three consecutive measurements.
2.3.3. Exosome Characterization by Transmission Electron Microscopy
In this study, we used high-resolution transmission electron microscopy (HRTEM) Titan CT from FEI Company to characterize the morphology of serum-derived exosomes using the negative staining technique. Briefly, freshly isolated exosomes (≈ 3 µg) in PBS suspension were fixed at a ratio of 1:100 with 2.5% glutaraldehyde. After 10 minutes of fixation at room temperature, a 10-µl drop of exosomes was gently loaded onto Formvar/carbon-coated 200 mesh copper grids and allowed to adsorb for 5 minutes at room temperature. For negative staining, the absorbed exosomes were stained with a 10-µl drop of the 1% phosphotungstic acid (PTA) for 5 minutes at room temperature. The excess solution was wiped off by filter paper and then allowed to air-dry. TEM analysis was performed at an accelerating voltage of 80 kV. Digital images were visualized using a Gatan 2k x 2k slow-scan charged coupled device camera, and 20 fields were captured for each sample.
2.3.4. Quantitation of Exosomal Protein Content
Prior to electrophoretic analysis and immunoblotting, each exosome sample was lysed with 1X radioimmunoprecipitation assay (RIPA) buffer (Merck Millipore, USA) containing phenylmethylsulfonyl fluoride (PMSF) protease inhibitor (Sigma-Aldrich, USA) at 1 mM final concentration. The protein content of exosome samples was measured by the Pierce Detergent Compatible Bradford Assay Kit (Fisher, USA). A set of albumin standards was prepared to make the standard curve. Briefly, 10 µl from each exosome and standard sample was mixed with 300 µl of Pierce detergent-compatible Bradford reagent, followed by 30 minutes of incubation at RT. The absorbance of each standard and sample was measured spectrophotometrically in duplicate at 595 nm using a Biotek ELx800 plate reader (Agilent, USA). All measurements were plotted against the BSA standard curve to determine the protein concentration.
2.3.5. Sodium Dodecyl Sulfate-Polyacrylamide Gel Electrophoresis (SDS-PAGE)
Using the Hoefer™ Mini Vertical Electrophoresis Unit (Hoefer miniVE, USA), two handcast gels were prepared: 4% stacking gel and 12% resolving gel. All exosome samples were separated under denatured and reducing conditions. Cold exosome lysates were mixed with 4X sample loading buffer containing β-Mercaptoethanol. The mixtures were then denatured by heating at 95 °C for 5 minutes. About 10 µg of exosome lysate were loaded into the gel wells, and the PageRuler Plus Prestained Protein Ladder (Thermo Fisher, USA) was loaded in a separate well as a protein molecular weight marker. The current was set at 70 volts for 50 minutes, then at 120 volts for 2 hours. After the electrophoresis was complete, the gel was washed with distilled water and stained with Coomassie blue stain for 15 minutes on the rocking platform. Finally, the gel was washed and destained with a destaining solution.
2.3.6. Western Blot Analysis
Using Mini-PROTEAN® Tetra Handcast (Bio-Rad, USA), exosome lysates were separated by 12% SDS-PAGE. Exosome lysates were mixed with 4X non-reducing sample loading buffer and heated at 95 °C for 5 minutes. Approximately 35 µg of each lysate was loaded into gel wells simultaneously with a protein molecular weight marker (Thermo Fisher). The electrophoresis was carried out at 70 volts for 50 minutes, then at 120 volts for 2 hours. Then, exosome samples were transferred onto PVDF membrane (Bio-Rad, USA) using Mini Trans-Blot Module Systems (Bio-Rad, USA) under constant current at 100 V for 1 hour. The blotted membranes were washed in 1X Tris-buffered Saline, tween 20 (TBST-20) for 4 cycles and blocked in a 3% BSA (Sigma-Aldrich) for 1 hour. After clocking, the membranes were probed with primary antibodies dissolved in blocking buffer: CD9 monoclonal antibody (1:1000, Invitrogen-Fisher Scientific, USA) and citrullinated fibrinogen monoclonal antibody (1:1000, Cayman Chemical, USA). Membranes were incubated with primary antibodies for 1 hour at room temperature, followed by 4 washing cycles with 1X TBST. Peroxidase-conjugated AffiniPure Mouse Anti-Human IgG (H+L) antibody (Jackson ImmunoResearch) was used as a secondary antibody after being diluted 1:5000 in the blocking buffer. Membranes were incubated with secondary antibodies for 1 hour at room temperature, followed by four washings with 1X TBST. Proteins were then visualized using chromogenic DAB substrate (Fisher Scientific, USA).
2.4. Statistical Analysis
The statistical program GraphPad Prism (Prism 10 for Windows) was used to perform data analysis and to calculate percentages, means, standard deviations, minimums, and maximums. Proportions were calculated for categorical variables, and the chi-square test was utilized to evaluate and compare the statistical significance in frequencies between two sets of categorical data. Means and standard deviations were calculated for quantitative data. One-way ANOVA followed by Tukey’s post hoc test was employed for comparing the means among multiple groups of data. An unpaired t-test was used to compare the differences in means between two groups. All significant tests were two-tailed, with a reliability of 95%. P-values less than 0.05 were considered statistically significant.
3. Results
3.1. Demographic Characteristics of Patients and Healthy Controls
To improve the outcome of the study, we tried to find a matched control group. After patient group enrollment, we recruited thirty-five healthy control (HC) individuals who match the demographic characteristics of the patient group. In this study, we considered demographic variables that are known to be the most influential factors in RA. RA patients didn’t differ from healthy controls on demographic variables such as age, gender, and occupation. However, about 89% of patients were females compared to 80% females in the HC group, with a female/male ratio of 8:1 for the patient group.
The average age for all patients was 51.3±11.5 years, against 47±11.6 years for the HC group. Further, symmetry in age distribution between both groups has been considered for each age group. The vast bulk of participants were housewives, 69.8% of RA patients compared to 57.1% of HC. However, there were no significant differences (P>0.05) between the patient and HC groups in any of the demographic characteristics assessed. Baseline demographic characteristics for patients and controls are summarized in Table 1.
3.2. Demographic and Laboratory Investigations of RA Patients
A total of 116 Saudi patients with confirmed RA were investigated in this study; most of them were female (89.7%). Patients were grouped into three categories according to age: <40 years, 40-50 years, and >50 years. The average age of the total population was 51.3±11.5 years; female and male groups had similar mean ages of 51.3 ± 11.6 and 51.7 ± 11.3, respectively. However, there was no statistically significant difference (P>0.05) between age groups for both genders. A large segment of the patients was above 50 years of age (55.2%); of the 104 female participants, 53.8% were above 50 years of age, compared to 66.7% of the male group. The disease duration was evaluated, and the patients were grouped into three levels of duration (<5, 5-10, and >10 years). For all patients, there was no statistically significant difference (P>0.05) between disease durations. The female patients had an even distribution of RA duration, while 58.3% of the male patients had a disease duration between 5 and 10 years. However, the average duration for all subjects was 8.4 ± 6 years, while the average age of RA onset for both genders was 43 years old.
In addition, risk factors associated with RA, such as smoking and family history of RA, were investigated. Patients were divided into those who never smoked and those who had smoked in the past or are current smokers. Patients were considered to have a family history if they had at least one first-degree relative (FDR) with RA. However, about 18.1% of the total population were smokers, and 21.6% had a family history of RA. In terms of laboratory testing, serum samples collected from the patients were investigated for autoantibodies (RF, anti-CCP, and anti-MCV).
Of the 116 RA patients, 37.1%, 54.8%, and 48.3% tested positive for RF, anti-CCP, and anti-MCV, respectively. Hence, we next aim to assess the relationship between laboratory findings and demographic characteristics. All demographic and laboratory characteristics of the RA patients are presented in Table 2.
3.3. Autoantiboies Investigations
3.3.1. Association Between Autoantibodies and Gender Types
We investigated the relation between positive antibodies and gender types based on laboratory results in terms of prevalence and concentration (Table 3). The seropositivity for all patients was defined for each of the tested antibodies (RF, anti-CCP, and anti-MCV). We found that anti-CCP was the most frequent antibody for both genders, followed by anti-MCV and RF in order. The laboratory results showed that 43 (37%) patients from both genders tested positive for RF, 63 (54%) patients were positive for anti-CCP, and 56 (48%) had a positive anti-MCV antibody.
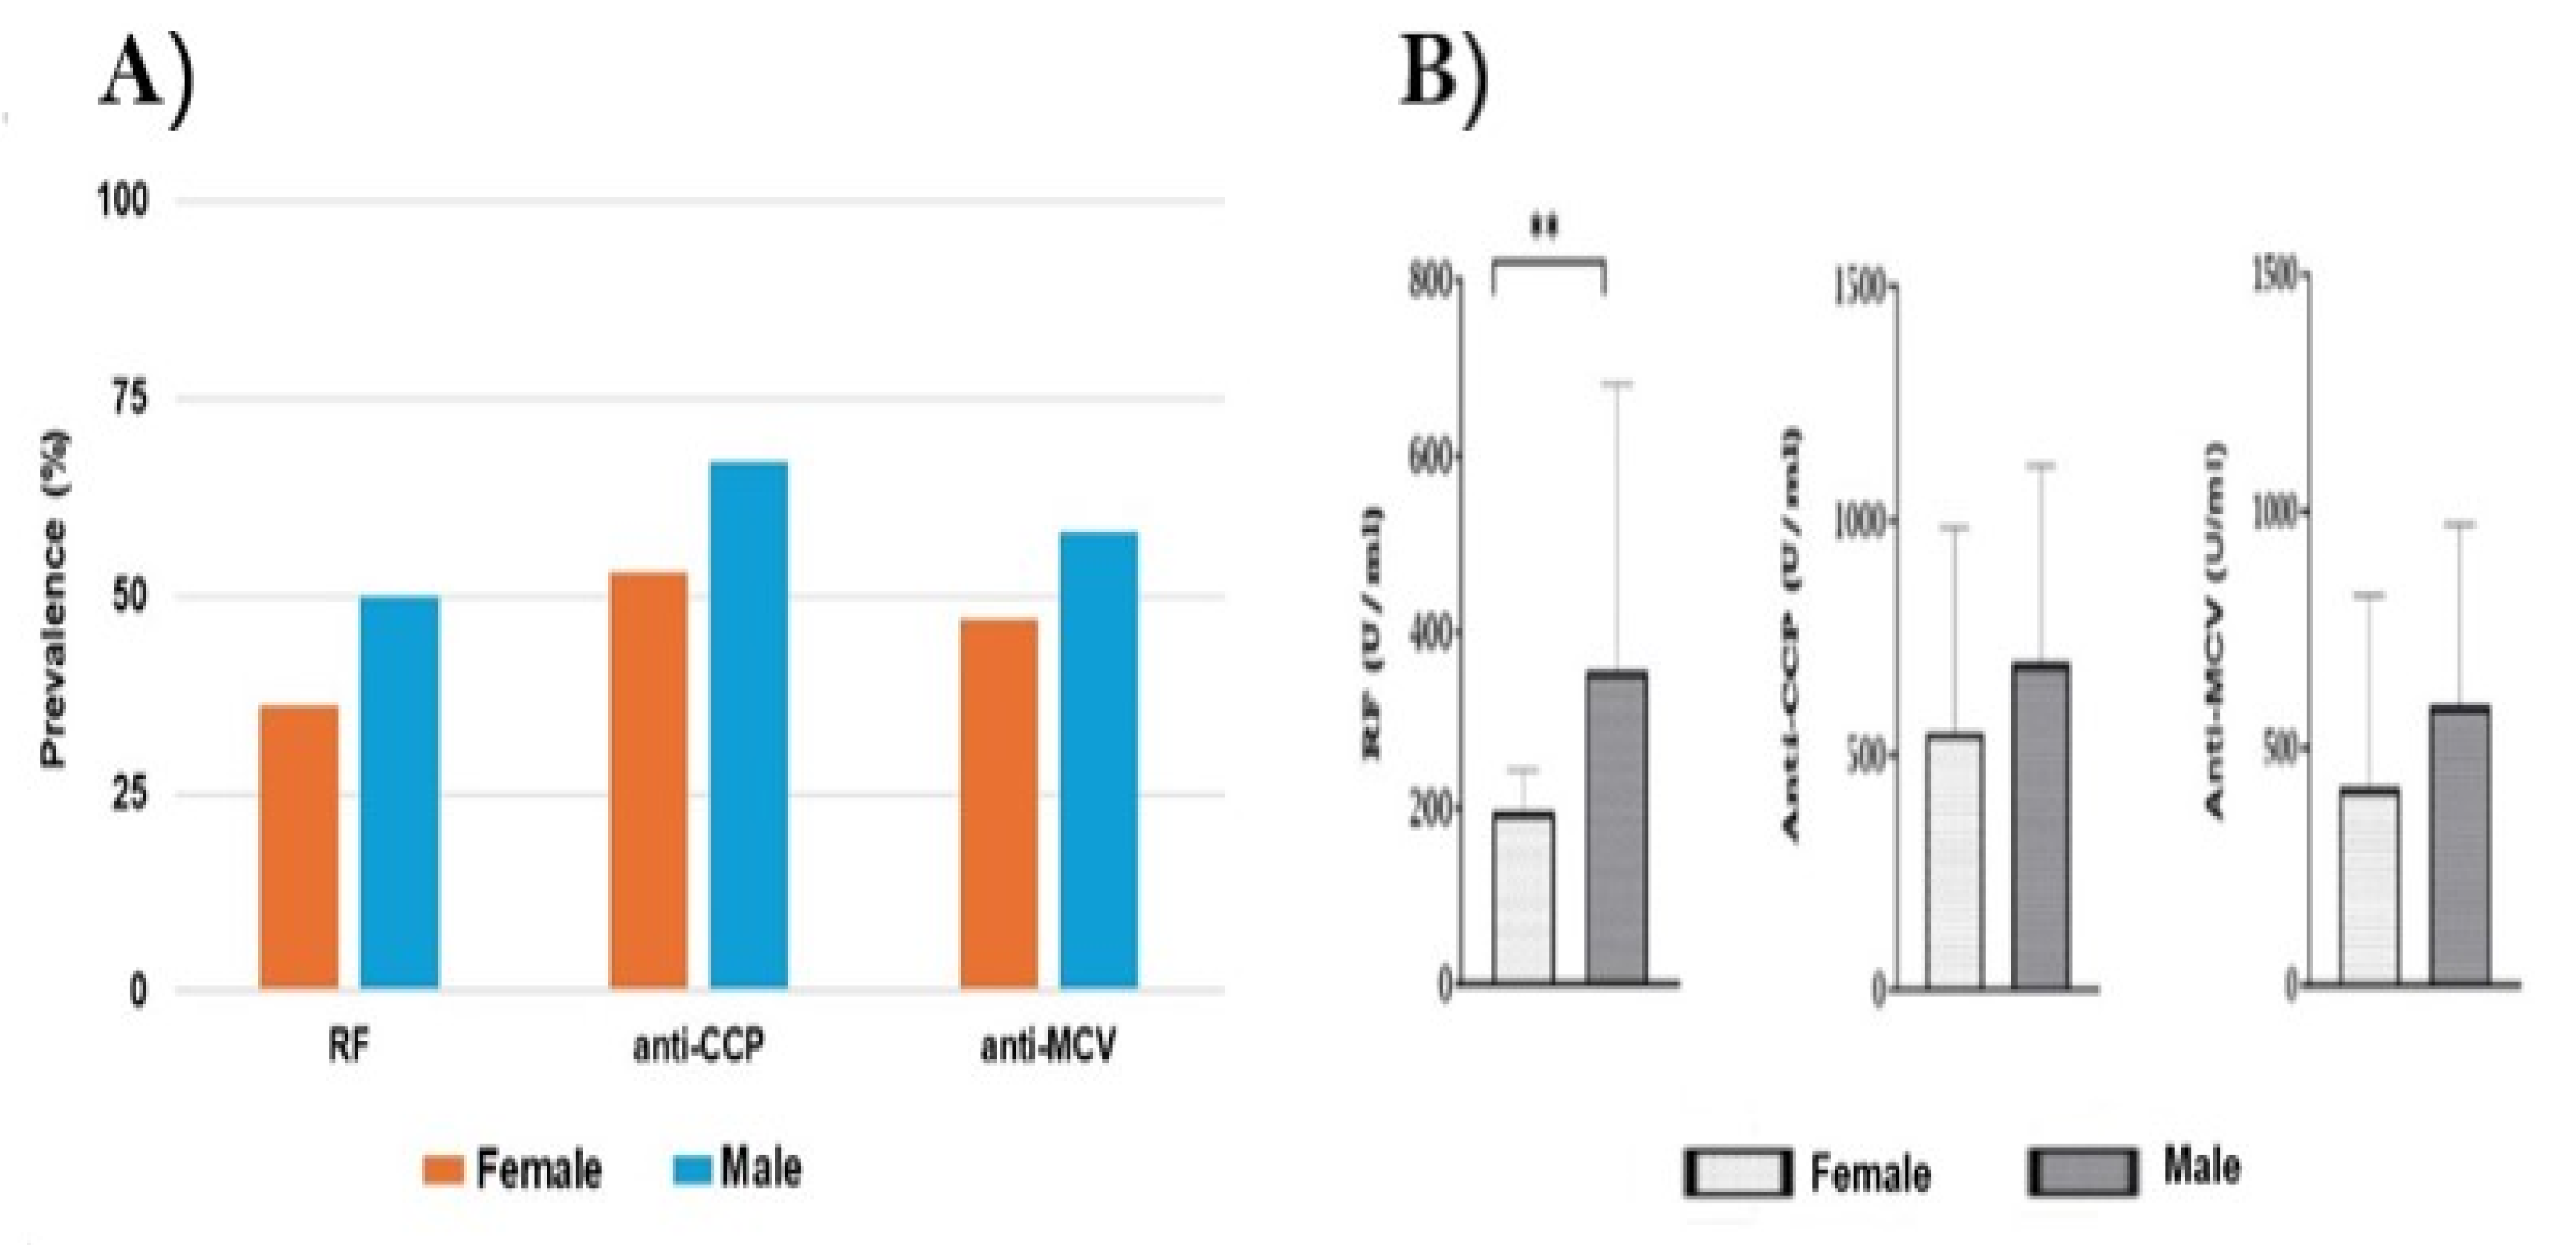
The frequency of each antibody was compared between males and females using the Chi-square test. The presence of positive antibodies was higher in males than females for each type of antibody. About 53% of females were positive for anti-CCP, compared to 67% of males. RF was positive in 36% of females and 50% of males, while positive anti-MCV was found in 47% of females and 58% of males. However, the occurrence of positive antibodies was 1.2–1.4-fold higher in the male group than in the female group. Overall, there was no statistically significant difference (P>0.05) in the prevalence of each antibody in males and females (Figure 1A).
Figure 1B shows the serological level of each antibody for both gender types. The quantitative data in, which is given as means ± standard deviations (SD), was compared using an unpaired t-test. The concentrations (mean±SD) for anti-CCP were comparable between females (547.8 ± 437.8) and males (697.1 ± 420.6), and the anti-MCV titer was (415.2 ± 406.6) for females and (589.2 ± 383.8) for males, showing no significant differences (P>0.05). However, the average level of positive RF in the male group (356.4 ± 512.8) was higher than that in the female group (196.8 ± 236.6), showing a significant statistical difference (P=0.004).
Figure 1.
A) Prevalence of positive (RF, anti-CCP, and anti-MCV) in female and male RApatients. The Chi-square test was used to compare the frequency of each autoantibody between males and female, and there were no statistically significant differences (P>0.05). B) Relation between the genders and the level of each antibody. Each bar represents the mean, and error bars correspond to 95% confidence intervals. Using unpaired t-test, the concentration of RF showed a statistically significant difference between females and males (** P=0.004).
3.3.2. Relation Between Autoantibodies and Patients' Age
The prevalence and level of RF, anti-CCP, and anti-MCV were also correlated with the age of RA patients. In line with many studies, RA patients were divided according to their age into three groups: <40, 40-50, and >50 years. As estimated before in Table 2, the average age for all RA patients was 51.3±11.5 years, with 55.2% over 50 years of age. However, patients with positive results for antibodies have an average age of 53.3±10.8 years. We investigated the association of each antibody with the patient's age, and we found that the incidence of positive antibodies gradually increased with age. The frequencies of anti-CCP and anti-MCV were 1.3-1.5-fold higher in RA patients above 50 years of age than those under 40 years, while the prevalence of RF increased by ~2.4 fold between the same groups (Table 4).
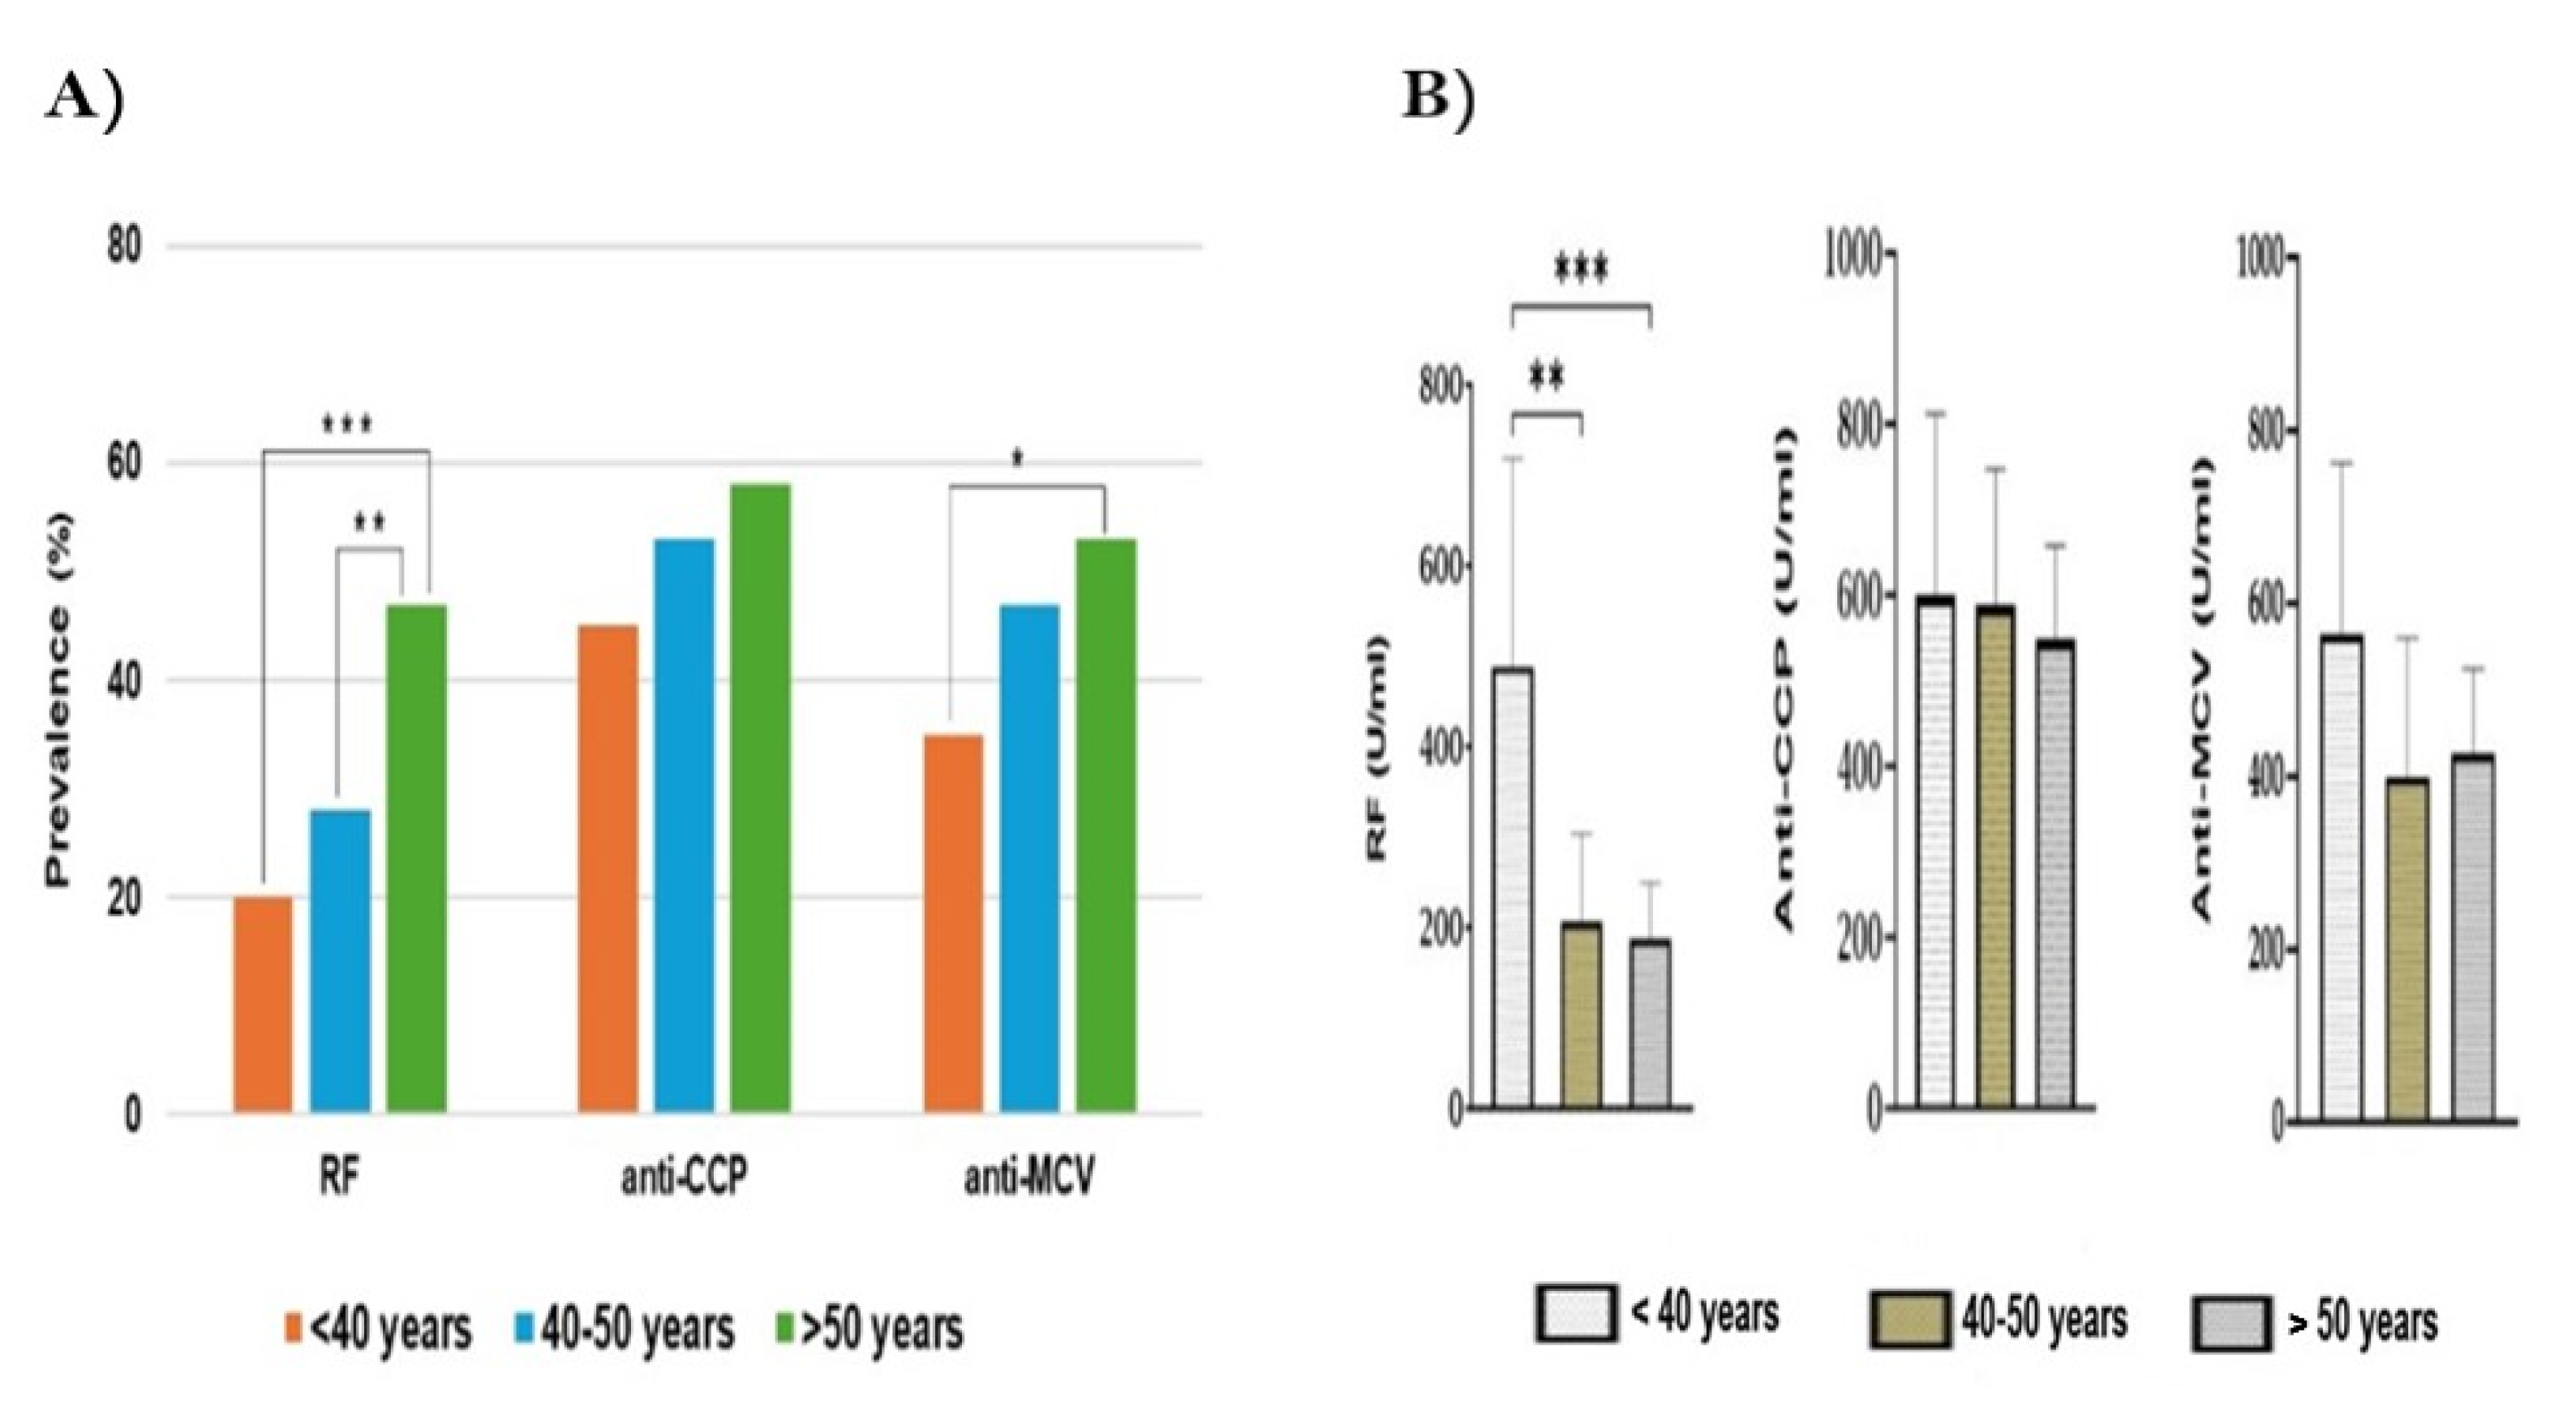
The incidence of anti-CCP among the three age groups was similar (P>0.05). However, the positivity of anti-MCV was comparable except between <40 years (35%) and >50 years (53%), showing a statistically significant difference (P=0.02). Moreover, RF prevalence in patients above 50 years of age (47%) was higher than in those less than 40 years of age (20%) and those between 40 and 50 years of age (28%), showing a significant difference, P<0.001 and P=0.008, respectively (Figure 2A).
We further correlated the concentration of each antibody with the age of the patients. Overall, the level of each antibody decreased as the age increased, except for anti-MCV in patients >50 years. The average concentration (U/ml) for all antibodies was calculated in each age group and compared by one-way ANOVA followed by Tukey’s post hoc test. The highest levels of RF, anti-CCP, and anti-MCV were reported in RA patients under 40 years of age. The titer of RF (mean±SD) in the group of <40 years was 2.3-2.6-fold higher than other age groups. It showed significant differences when compared to the 5-10 years (P=0.005) and >10 years groups of age (P<0.001). Otherwise, the titers of anti-CCP and anti-MCV were similar across all age groups, and there were no statistically significant differences between antibody levels and patients' ages (Figure 2B).
Figure 2.
A) Frequency of autoantibodies among age groups of RA patients. Using Chi-square test, significant differences are shown for RF incidence between <40 and >50 years groups (***), and between 40-50 and >50 years groups (**). The anti-MCV prevalence showed a statistically significant difference between <40 and >50 years groups (*). B) Titers of antibodies among age groups. The one-way ANOVA followed by Tukey’s post hoc test was used to determine the differences in means. Each bar represents the mean, and error bars correspond to 95% confidence intervals. The statistically significant difference in RF level between age groups is shown, where *** P< 0.001, ** P=0.005.
3.3.3. Association Between Autoantibodies and Disease Duration
To investigate the relation between autoantibodies and disease duration, RA patients were grouped according to the duration of RA or since disease onset into three periods: <5 years, 5-10 years, and >10 years. At the time of the investigation, the average duration for all patients included in the study was 8.4±6. As shown in Table 2, the majority of the patients (42%) had RA duration >10 years, and 35% and 39% had a duration <5 and 5-10 years, respectively. The prevalence and level of each positive antibody (RF, anti-CCP, and anti-MCV) were investigated for each period of duration. The mean disease duration was calculated for the positive-tested antibodies, and the average duration was comparable for all antibodies, approximately 9.3±6.5 years. According to laboratory testing, the positive antibodies were highly present in 5-10 years, followed by >10 years and <5 years in order. However, the existence of each antibody over the periods of 5-10 and >10 years was relatively comparable (Table 5).
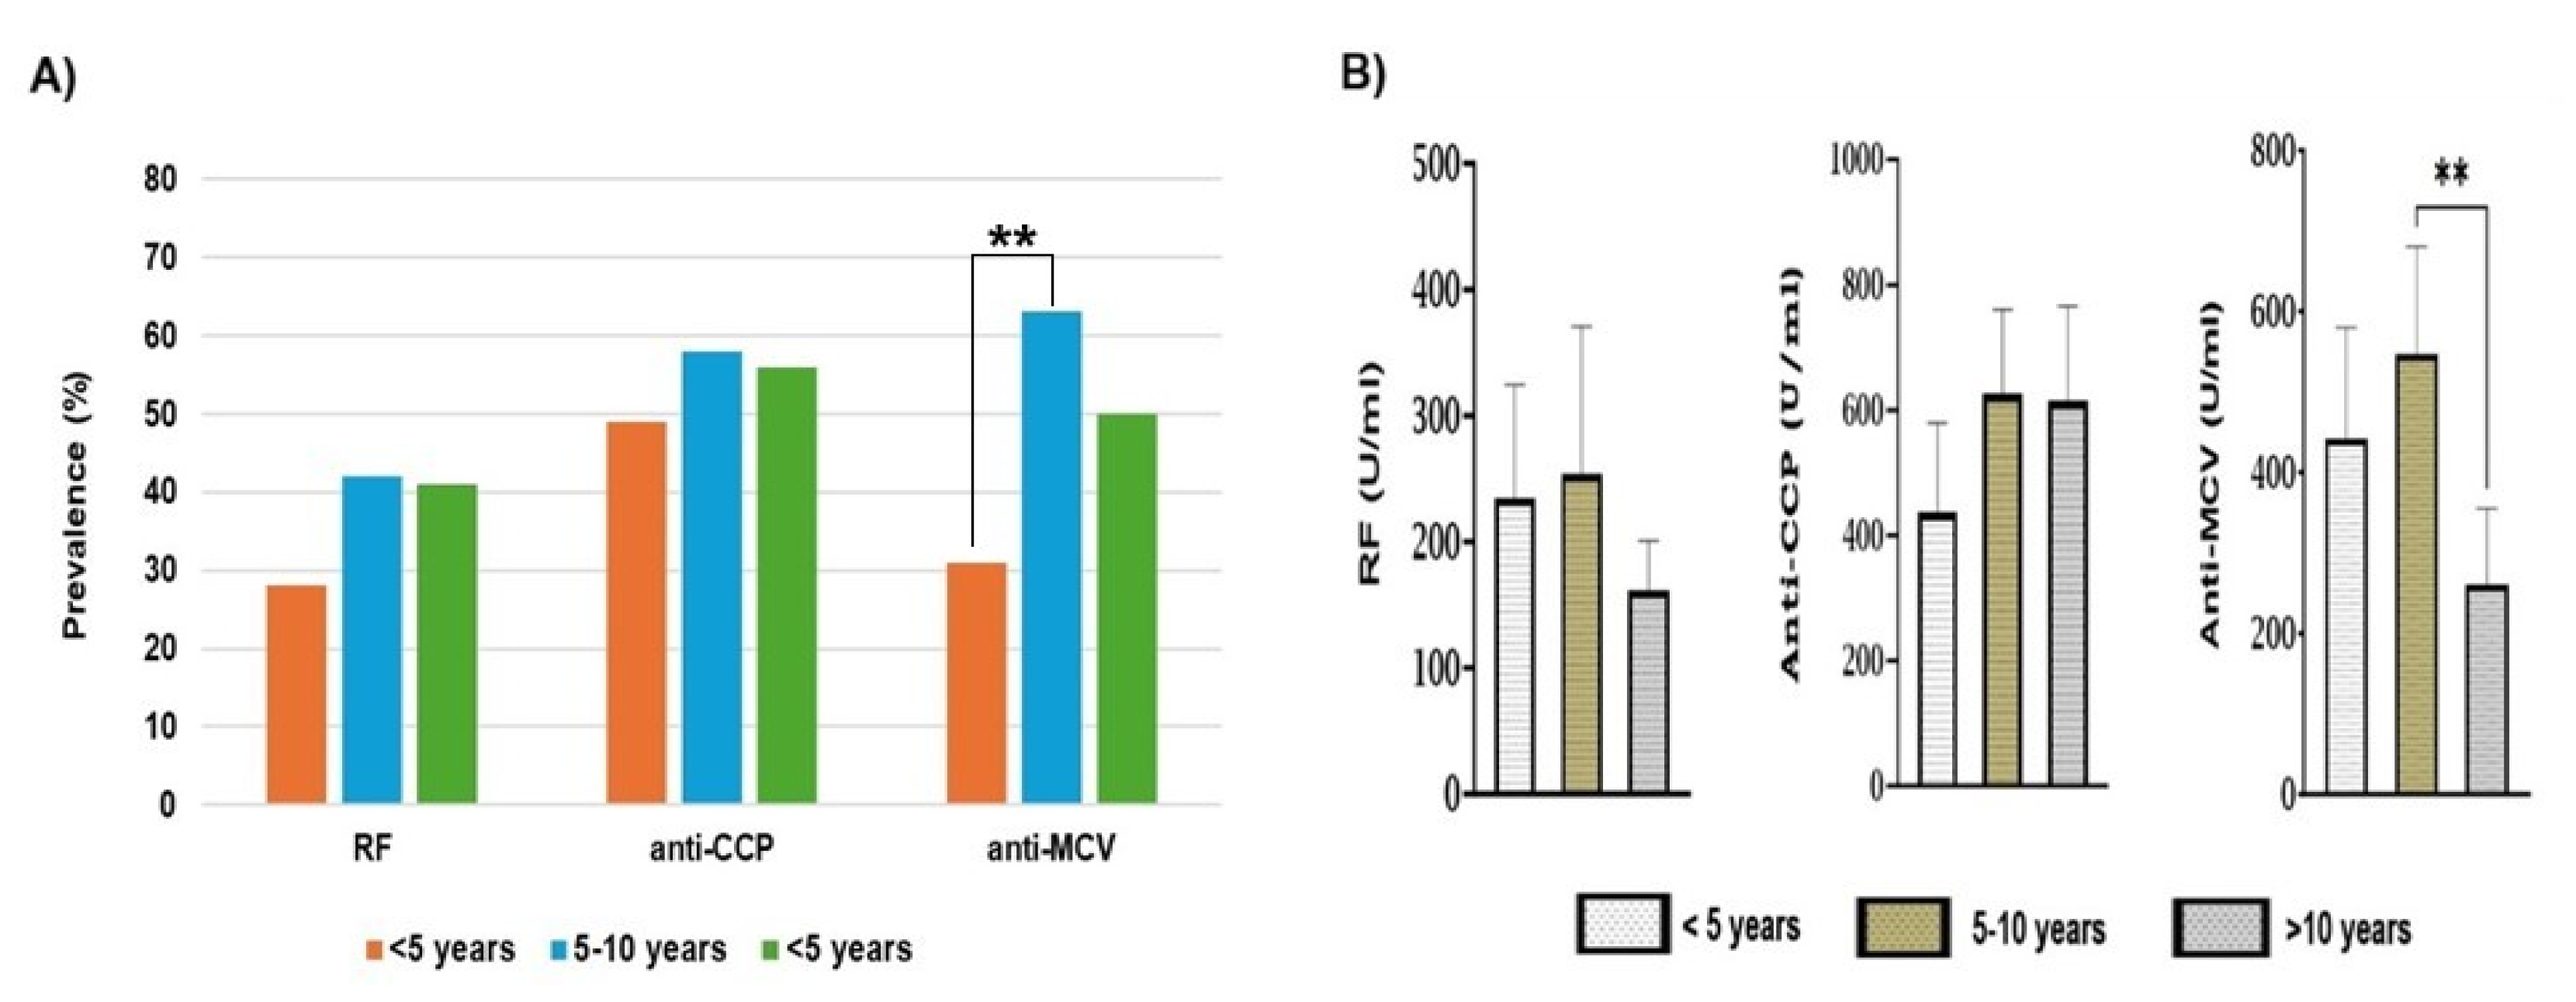
For RF and anti-CCP, there were no statistically significant differences (P>0.05) in the prevalences over all periods of RA duration. The frequency of anti-MCV between <5 years and 5-10 years of RA duration showed a statistically significant difference (P=0.004). The presence of positive anti-MCV was ~ 2-fold higher in patients with a duration of 5-10 years than those with a duration of less than 5 years (Figure 3A). Overall, the highest incidence of each positive antibody was reported in the 5-10 years period of RA duration.
The level of each antibody in each period of RA duration was investigated in the same manner. The average concentration (U/ml) for all antibodies was calculated in each period and compared by one-way ANOVA followed by Tukey’s post hoc test. As shown in Table 5, the highest concentration of each antibody was noticed over the course of 5-10 years. The titers of anti-CCP were similar among the three periods of disease duration (P>0.05). Anti-CCP concentration was relatively reduced for the shortest duration (<5 years) when compared to other durations.
The titers of RF and anti-MCV decreased for RA patients with RA for more than 10 years. The RF titer in this period declined by 1.6-fold as compared to other periods, but overall, there was no statistically significant difference (P>0.05). Regarding anti-MCV, the concentration of anti-MCV antibodies was significantly reduced (P=0.005) in >10 years of duration when compared to 5-10 years. The average level of anti-MCV in the period of <10 years was 2.1-fold lesser than in the period 5-10 years of RA duration (Figure 3B).
Figure 3.
A) Prevalence of autoantibodies in association with the periods of RA duration. No significant difference (P>0.05) for RF and anti-CCP in all periods. The anti-MCV prevalence showed a statistically significant difference (**) between <5 and 5-10 years groups. B) Association between antibody levels and the duration of RA. Each bar represents the mean, and the error bars correspond to 95% confidence intervals. One-way ANOVA followed by Tukey’s post hoc test was used to compare the means across each period. The statistically significant difference in the means of anti-MCV level is displayed.
3.3.4. Effects of Smoking on Autoantibodies
Smoking is considered a risk factor for developing RA and contributes to the production of RA-related antibodies. Of the 116 studied patients, 21 (18%) were smokers, while 95 (82%) were either current or ex-smokers. Although smoking is less common overall in this study, smoking rates among men are increasing far more slowly than those of women. Most of the smoker patients (67%) are over 50 years old, and about 47% have a family history of RA. However, we studied the prevalence and levels of autoantibodies in both smoker and non-smoker patients to evaluate the association between smoking and seropositivity (Table 6). Seropositivity was more frequent in non-smoker patients than smokers. With no significant statistical differences (P>0.05) for RF and anti-CCP antibodies.
As shown in Figure 4A, the existence of RF and anti-MCV was comparable between smokers and non-smokers (P>0.05). For anti-CCP, the positivity rate was more frequent in non-smokers; it was 1.8-fold higher than in smokers, with a significant statistical difference between smokers and non-smokers (P=0.03). Figure 4B shows the average concentration of each antibody in the smokers and non-smokers. Our investigations showed that the titers of each antibody were comparable between smokers and non-smokers. The titers of anti-CCP and anti-MCV were slightly higher in smokers, unlike the RF titer, which was increased in non-smokers. Overall results showed no significant statistical difference (P>0.05) between smokers and non-smokers. According to these findings, smoking doesn’t show a significant effect on the presence and titer of the investigated antibodies in this population.
3.3.5. Family History and Seropositivity
In this study, 25 patients, representing 21.6% of the total population, had a family history of RA. Most of these patients (88%) are above 40 years of age, with an average disease duration of about 9 years. Interestingly, about 40% of RA patients with positive family history in this study were smokers. Table 7 summarizes the prevalence and levels of autoantibodies among RA patients with family history and patients without family history.
The seropositivity was comparable between both groups of patients for anti-CCP and anti-MCV antibodies. The positive anti-CCP and anti-MCV occurred in 52% and 40% of the patients with a positive family history, respectively. However, the incidence of positive RF was higher in RA patients who had no family history (41%) than in those with a family history of RA (24%), but without significant difference (P>0.05). Overall, there was no significant association between seropositivity existence and the presence of family history for RA (Figure 5A). In addition, autoantibody titers were comparable between patients with and without family history, except for RF, which is increased in patients with family history. However, we didn’t find a significant association (P>0.05) between the concentration of antibodies and the presence of family history for our patients' groups (Figure 5B).
3.4. Exosomal Studies
In the exosome analysis, we classified the RA patients according to their serological findings into seropositive RA (SPRA) and seronegative RA (SNRA). Patients who don't express any positive antibodies are considered SNRA, while those with at least one positive antibody are identified as SPRA. Therefore, the study of exosomes includes three groups of samples: SPRA patients, SNRA patients, and HC individuals.
3.4.1. Measurement of Exosome Diameter Dynamic Light Scattering
To confirm that the exosome isolation kit and method used produce a nanoparticle population loaded with exosomes of high purity and typical size. We determined the size and distribution of isolated exosomes using dynamic light scattering (DLS) with a Zetasizer Nano ZS analyzer and assessed their size and morphology using negative stain transmission electron microscopy (TEM). DLS yielded histograms of one and two peaks, with most of the peaks being single. Zetasizer histograms showed how the sizes of exosomes were distributed. Much border size distribution has been measured and detected in exosomes from the SPRA and HC groups (Figure 6A, B,C). However, after excluding the large peaks, the mode size of all isolated exosomes was in the expected range of 30-153 nm, and the mean diameter was approximately 76 nm for all sample groups. According to DLS measurements, the exosomes isolated from SPRA and HC samples revealed comparable sizes, with a diameter (mean±SD) of 96.5 ± 45 nm and 80 ± 45 nm, respectively. In contrast, the exosomes isolated from SNRA patients showed smaller diameters of 52 ± 28 nm. However, the size of SNRA-exosomes showed a statistically significant difference with SPRA-exosomes (P<0.001) and with HC-exosomes (P=0.004) (Figure 6D).
3.4.2. Characterization of Exosomes by Transmission Electron Microscopy (TEM)
TEM imaging was employed to verify the purity and quality of isolated nanoparticles. In a current study, serum-derived exosomes from patients and HC samples were prepared as detailed in the methodology and subjected to TEM. Likewise, patients' samples were categorized into SPRA, SNRA, and HC. Using Titan CT TEM, we defined and compared the exosome size and morphological variations between groups. The negative contrast staining revealed very pure exosomes, which were nanosized particles that looked like cups, spheres, and rounds. Our TEM analysis showed that exosomes were more enriched in the SPRA and SNRA groups than in HC samples. Exosomes isolated from SNRA and HC appeared to have a pure mixture and were relatively less homogeneous than SPRA-exosomes (Figure 7). TEM images illustrated that all exosome sizes range between 30-95 nm, and the average size is 47.8 ± 8.5 nm for single exosomes. It is important to note that TEM detects a smaller mean size than DLS, and this appears to be a result of the TEM preparation process, which could cause the exosome to downsize.
3.4.3. Determination of Exosomal Protein Concentration
Protein measurements showed that exosomes isolated from RA patients were enriched with proteins more than the healthy control (HC) individuals. After exosome isolation and lysing, the protein content of each sample was quantified by a Pierce detergent-compatible Bradford assay. The average protein concentrations (Mean±SD, µg/ml) of exosomes derived from SPRA and SNRA samples were comparable (1828 ± 487 µg/ml and 1950 ± 511 µg/ml), respectively. Exosomes isolated from the HC samples have the lowest protein level (1021 ± 375.9 µg/ml). The protein content of HC exosomes was significantly different from SPRA and SNRA exosomes (P<0.001). Figure 8A compares the Bradford assay-determined protein concentrations for RA patient groups and HC.
3.4.4. Identification of Exosomal Proteins by SDS-PAGE
In this study, we ran SDS-PAGE electrophoresis for all exosomes extracted from patients and healthy control samples. The appearance of gel bands showed that there was no significant difference between all exosome preparations. The pattern of Coomassie staining revealed that the protein bands spread almost the same for all exosomes. Several bands between 25 and 250 kDa were identified in the SDS-PAGE analysis using a prestained protein marker as a molecular weight standard.
Each exosome lysate exhibited ∼14 characteristic bands at various molecular weights. Six bands were major proteins and related to the common exosome protein markers (Figure 8B). Among these obvious proteins, 3 bands correspond to cytosolic proteins such as Alix (95 kDa), HSP70 (70 kDa), and TGS 101 (46 kDa), while 2 bands correspond to tetraspanin proteins such as CD9 (23 kDa), CD81 (25 kDa), and CD63 (53 kDa).
3.4.5. Expression of Exosome-Specific Marker: CD9
To confirm the presence of the exosome in our extraction, we investigated the expression of CD9, which is a membranous protein frequently associated with EVs and used as a specific marker for exosomes. CD9 is a member of the tetraspanin family and has a molecular weight of about 23 kDa. The presence of CD9 was evaluated by western blot in all exosomes derived from RA patients and healthy controls. As described in the methodologies, exosomes were electrophoretically separated and trans-blotted to the PVDF membrane in parallel with a prestained protein marker. After staining, bright bands were expressed at the expected size of CD9 (~ 23 kDa) in all exosomes extracted from RA patients (SPRA and SNRA) and HC samples (Figure 9A). However, exosomes isolated from patients' groups showed higher intensity than from healthy control samples.
3.4.6. Detection of Citrullinated Fibrinogen (cFBG) Proteins by WB
ACPAs are specifically and commonly found in the sera of RA patients. cFBG is one of the potential autoantigens for ACPAs in RA patients. To explore the presence of cFBG in serum exosomes, we used monoclonal antibodies specific for cFBG in western blotting. These antibodies can detect cFBG at an approximate molecular weight of 56 kDa. As we aim to investigate the presence of citrullinated protein.
In this study, we performed WB on exosome lysates from seropositive RA patients. In doing so, we excluded the SNRA and HC sample groups and solely carried out immunoblotting on exosomes from the SPRA patient group (Figure 9B). We used monoclonal anti-citrullinated fibrinogen antibodies to examine the presence of cFBG in exosomes extracted from SPRA patients (n = 71). Then, the expression of cFBG bands in blotted membranes was correlated to the sample's seropositivity for anti-CCP. Among the 71 blotted exosomes, 36 samples showed a clear band (cFBG-positive) with a molecular weight of approximately 56 kDa, whereas 35 samples did not (cFBG-negative).
The cFBG-positive (n = 36) exosomes showed a strong correlation with anti-CCP. In this group, all exosomes tested positive for anti-CCP, with 27 patients (75%) being over 50 years old and having RA for more than 5 years. On the other hand, among RA patients with cFBG-negative exosomes (n = 35), only 27 patients (68%) were tested positive for anti-CCP, and about 75% were aged above 50 years, while 48% had RA duration more than 5 years. However, patients who expressed cFBG on average had 2.6-fold higher levels of anti-CCP than those who didn’t express cFBG in their exosomes. The average concentration (mean±SD, IU/ml) of anti-CCP for cFBG-positive exosomes was (727 ± 389, IU/ml), compared to (273 ± 383, IU/ml) of cFBG- (Figure 9C).
4. Discussion
This study investigated 116 RA patients, with an 8:1 female-to-male ratio. In Saudi Arabia, there is no adequate data available about the exact prevalence of RA in the Saudi population. According to several past studies, the prevalence of the disease among the Saudi population is about 0.1−0.22%, with three to four times higher rates in women than men, which reflects the high risk of worsening the condition [50]. However, recent reports suggest that the incidence of RA is increasing, and the number of RA patients is expected to stand at around 250,000 cases in the near term, or about 1.2% of the Saudi population. [51,52]. For all participants, the average duration of RA is 8.4±6 years, while for 66% of the population, the average disease duration is more than 5 years. The mean age for RA patients in this study is 51.3±11.5 years, with 54% of females and 67% of males being above 50 years of age. This is in line with most data, which suggests that RA development occurs in those over the age of 50 [13,53,54].
Our reported female/male ratio is significantly higher than that estimated either globally or within Saudi Arabia, and we thought that was a limitation due to the small number of male patients (12), which represents 10% of the enrolled patients. In Saudi Arabia, many studies on RA patients have been done in the last decade. A study conducted by Almoallim et al. showed that the female-to-male ratio in the cohort of 433 RA patients was 3:1, with a mean age of 49±11 years [55].
A recent study by [56] included 210 patients with a mean age of 46±11 and reported a prevalence of females with a ratio of about 4:1. Interestingly, a study conducted by Aseel et al. demonstrated a female-to-male ratio of 8:1 in their study, which included 438 RA patients, which is similar to our findings [57]. However, some population-based studies have reported a higher incidence of RA in females, with a ratio as high as 9:1 [58,59].
Rheumatoid arthritis (RA) is a chronic disease that results from the interaction of multiple genetic, environmental, and lifestyle factors. ACPAs are produced as an autoimmune response for abnormal citrullination reactions. However, ACPAs are specific and predictive biomarkers for RA, and they can be detected in patients' sera up to 10 years before the clinical RA onset. But in fact, many RA patients might lack these antibodies. Therefore, RA diagnosis can be classified into seronegative RA (SPRA) and seropositive RA (SNRA) [60].
The association between RA-related autoantibodies and factors such as gender, age, disease duration, and smoking status has been investigated by many previous studies. The influence of age and gender on the development of RA has been described by several global studies [13,61,62]. In the current study, 71 out of 116 patients (61%) were SPRA, and the seropositivity percentages in men were higher than those in women. However, estimations of seropositivity among RA patients have reported inconsistent percentages across a retrospective study [63] and a comparative observational study [64]. Our data showed that about 75% of males were SPRA, while 60% of females were SPRA. Furthermore, the titers for anti-CCP and anti-MCV were higher in males than in females without significant difference (P<0.05). These findings are consistent with the recent systematic review and meta-analysis study in 2022, which searched databases of eighty-four studies, including 141,381 RA patients, and found that seropositivity is more associated with males than females [9]. However, our results differ from those of a recent cross-sectional study that found females represented 76% of the SPRA patients (P<0.001) [65].
Despite the occurrence of ACPA-positive patients in our work increasing gradually with patients' age, there was no significant association for anti-CCP prevalence with age. For anti-MCV, we found it was significantly frequent in patients above 50 years of age. However, the antibody levels across age groups were almost similar or slightly decreased for both ACPAs (P<0.05). This is supported by a previous study that found a non-significant decrease of ant-CCP levels in older RA patients [66]. Findings of our study showed that SPRA patients are older (52.1 ± 11.2 years) than SNRA patients (50.2 ± 11.9), without significant differences (P=0.39). There are some parallels and some differences between the findings of the literature and ours. Our findings are in line with previous studies that demonstrated that the prevalence of ACPA-positive RA was more frequent at older age, above 50 years [67] and 40 years [66]. Conversely, older age has been found to be strongly associated with SNRA than SPRA (54 ± 11 years vs. 43 ± 14 years; P< 0.001) [65]. Furthermore, a multicohort study conducted by Boeters et al. showed that the ACPA-negative RA was more associated with older age than ACPA-positive [68].
Our current work also highlights the contribution of RA duration to ACPAs. The period of 5-10 years duration reflects the highest incidences and levels for both anti-CCP and anti-MCV. But despite that, we didn’t find a significant association between positive anti-CCP and RA duration, either for prevalence or for antibody levels. A recent observational study showed that the higher incidence of ACPA-positive antibodies was associated with RA duration <10 years, followed by 5-10 years and less <5 years, respectively [69]. A previous cross-sectional study has shown that the positive anti-CCP was more prevalent in patients with RA duration >10 years (79%) than those with duration less than 10 years (62%). This study also revealed that anti-CCP levels were comparable between the two periods of duration [70]. We found that the prevalence of anti-MCV antibodies increased after 5 years of duration, whereas the high levels were associated with the period of 5-10 years of duration. The assessment of anti-MCV by Poulsom and Charles. Showed that the prevalence of ant-MCV was higher in short RA duration than in long duration [71].
Smoking is considered a known risk factor for rheumatoid arthritis development [72]. A case-control Myeira study by Abqariyah et al. confirmed the association between smoking and ACPA-positive (64%) in the Malaysian RA population [73]. The current study doesn’t find a relationship between smoking and the ACPAs incidence. On the contrary, seropositivity, whether for anti-CCP or anti-MCV, was more frequent in non-smokers than smokers. Our estimations revealed that smoking is responsible for less than 40% of ACPA-positive RA in smokers compared to more than 50% in non-smokers. This is in line with data from the Swedish Epidemiological Investigation of Rheumatoid Arthritis (EIRA) that showed that smoking is responsible for 35% of ACPA-positive RA [74]. In this experiment, smoker RA patients showed a non-significant increase in ACPA titers. However, a previous cross-sectional analysis demonstrated a significant association between smoking and the high titers of ACPA [75].
Our correlation between family history and seropositivity showed no significant association. We found that patients with no family history have a similar tendency to seropositivity as those with positive family history, even for prevalence or concentration. For instance, Diane et al. suggested that the heritability of ACPA-positive and ACPA-negative is comparable (65%) [76]. Nevertheless, a heritability of around 50% for ACPA-positive RA and approximately 20% for ACPA-negative RA was shown to be compatible with familial hazards in register-based nested case-control research conducted in the Swedish population [77]. The titers of anti-CCP and anti-MCV for RA patients in our work show no significant differences between those with family history and without. This is not in accordance with the findings of Kim et al., who found that the high levels of anti-CCP and anti-MCV were correlated with the presence of family history [78].
Exosomes are the smallest and most extensively researched type of Evs that participate in various biological processes and disorders. In current work, serum-derived exosome preparations of RA patients and HC were validated for morphology and protein content. Negative staining TEM is the most popular technique for visualizing exosomes [79,80,81]. Using TEM, we verified that all preparations had the typically described morphology of exosomes and were within the expected size range (30-150 nm) [82,83,84]. However, DLS measurements showed that SNRA-exosomes were smaller than SPRA-exosomes (P<0.001) and HC-exosomes (P=0.004). Furthermore, the exosome fraction from SPRA samples showed significant heterogeneity when compared to exosomes from SNRA and HC samples. Exosomes are known to have a very diverse population, and it is challenging to isolate exosomes because of their heterogeneity in size, composition, and function [85,86].
Western blot (WB) analysis is another method of exosome confirmation that looks at preparation purity and the presence of exosome markers. Tetraspanins (CD9, CD63, and CD81) are among the most widely used exosome markers; nevertheless, these proteins have also been found to be expressed positively in other EV types [87]. These proteins have been discovered to be highly enriched in EVs as opposed to originating cells [88]. CD9 is a 25-kDa membranous protein that can be detected by WB. Yue-Ting et al. found that exosomes have an equivalent or even higher level of CD9 than the source cells [89]. In this experiment, all exosome samples derived from patients and controls expressed clear CD9 bands with variable intensity. We found that the intensity of CD9 bands in HC samples is not as strong as they are in patient samples.
Antibody-based techniques like ELISA, immunohistochemistry, and western blotting are widely used to detect citrullination with high sensitivity and specificity [90]. But these techniques can't produce a large-scale analysis and reliable localization of citrullinated sites as mass spectrometry (MS) analysis. However, citrullination profiling remains a significant difficulty for mass MS-based approaches, despite its increasing effectiveness in many post-tanslation modification PTM-related investigations [91]. In the current study, we used an anti-CCP commercial kit for the serological investigation of ACPAs, which is an ELISA-based immunoassay. The anti-CCP test was generated by screening peptide libraries containing millions of cyclic peptides to produce highly purified synthetic peptides that serve as antigens [92]. However, some ELISA assays designated for testing anti-CCP don't specify the target antigen. Few studies have used anti-CCP assays that specified the type of citrullinated protein, such as collagen [93], filaggrin [94], and fibrinogen [95].
Fibrinogen and its modified (citrullinated) form have been verified to be the most favored autoantigens for ACPAs in RA patients. Citrullinated fibrinogen (cFBG) epitopes play a role in triggering the autoimmune response in RA patients and contribute to synovitis and bone destruction [47,96]. With regards to Evs, research on exosomes' role in RA is still in its early stages; a small number of studies have shown that RA patients have aberrant exosome expression [97]. It has been suggested that exosomes may contribute to joint inflammation in RA patients because they can transport autoantigens and mediators between distant cells [98].
Recent proteomic studies were performed on exosomes extracted from plasma and serum of RA patients; these studies demonstrated distinct protein profiles in the purified exosomes, but no citrullinated proteins were identified [45,99]. Despite the difficulty in identifying citrullinated proteins in exosomes, a previous study compared the proteomic content of exosomes extracted from synovial fluid of RA and osteoarthritis (OA) patients. Skriner et al. were able to detect the citrullinated forms of fibrinogen, including fibrin alpha-chain, fibrin beta-chain, fibrinogen beta-chain precursor, and fibrinogen D fragment in the purified synovial exosomes [49].
In our work, we extracted exosomes from RA patients' sera, and we confirmed the identity of these microparticles via TEM and DLS. Since cFBG is the most candidate antigen for ACPAs, the goal of our exosome analysis is to explore the presence of cFBG in these microparticles. We used WB to investigate the presence of cFBG in serum-derived exosomes from RA patients, particularly those with positive ACPAs. Several experiments have indicated the contribution of citrullinated proteins in RA pathogenesis. These works investigated cFBG in the serum [100,101,102,103] and synovium of RA patients [48,104,105]. However, to the best of our knowledge, this is the first study exploring the cFBG in exosomes extracted from RA patients' sera.
So, we look at whether cFBG is present in serum-derived exosomes from people with RA, especially those who have anti-CCP antibodies that are positive (SPRA). For this purpose, we performed WB using monoclonal anti-citrullinated fibrinogen antibodies. Our results showed that 36 of the 71 SPRA patients in this study expressed cFBG with clear bands at a molecular weight of about 56 kDa in their blotted exosomes. The other 35 SPRA patients did not express cFBG.
After correlation with seropositivity, our findings showed that all cFBG-positive exosomes had a positive anti-CCP, while among the 35 cFBG-negative exosomes, there were 27 patients tested negative for anti-CCP. To explain this, we suggest that these samples may include citrullinated proteins other than cFBG. Furthermore, we found that the titers of anti-CCP for cFBG-positive exosomes were significantly higher than those for cFBG-negative exosomes. Although 75% of patients with cFBG-positive exosomes were above 50 years of age and had RA for more than 5 years, we couldn’t conclude a specific association of cFBG with either patients' age or disease duration.
5. Conclusions
Data presented by this study show a high female-to-male ratio of 8:1, and SPRA is more frequent than SNRA in Saudi RA patients, with a higher prevalence in men than women. Further studies are needed to confirm the increasing rate of RA among Saudi patients, as well as the spike in the number of women affected by the disease.
Our assessment of risk factors suggests that age and RA duration showed a significant impact on seropositivity, particularly for RF and anti-MCV. Unlike the majority of studies, we were unable to identify a significant impact of smoking and family history on the existence of ACPAs. Understanding the role of autoantibodies in RA can be improved by conducting in-depth research on ACPA in conjunction with other factors, such as genetic, cellular, and even lifestyle factors.
Exosomes are effective transporters for biomolecules. Our analysis of serum exosomes revealed that these vesicles carry citrullinated proteins, especially citrullinated fibrinogen, which is expressed in 50% of SPRA patients. Proteomic study of serum exosomes can be performed and validated in larger populations to develop new diagnostic and prognostic markers for RA. It can also be assessed to fill in the gaps in the current understanding of the etiology of RA to enhance disease management.
Author Contributions
Conceptualization, E.M.R.; literature search, M.A.A.; validation, E.M.R., R.A., E.A.H., Y.A.E.-M. and V.N.U.; formal analysis, V.N.U.; writing—original draft preparation, E.M.R., R.A., E.A.H., Y.A.E.-M., I.A. and M.H.; writing—review and editing, E.M.R., R.A., E.A.H., Y.A.E.-M., I.A., M.H. and V.N.U.; visualization, Y.A.E.-M.; supervision, E.M.R. All authors have read and agreed to the published version of the manuscript.
Funding
This research received no external funding.
Institutional Review Board Statement
The study was conducted in accordance with the Declaration of Helsinki and approved by the research ethics committee of the Faculty of Medicine at King Abdulaziz University (Approval No 468-19).
Informed Consent Statement
Informed consent was obtained from all subjects involved in the study.
Data Availability Statement
The datasets used and analyzed in this study are available from the corresponding author upon reasonable request.
Conflicts of Interest
The authors declare no conflicts of interest.
References
- Kasturi, S., et al., Comparison of the 1987 American College of Rheumatology and the 2010 American College of Rheumatology/European League against Rheumatism criteria for classification of rheumatoid arthritis in the Nurses' Health Study cohorts. Rheumatol Int, 2014. 34(3): p. 407-11. [CrossRef]
- Valesini, G., et al., Citrullination and autoimmunity. Autoimmun Rev, 2015. 14(6): p. 490-7. [CrossRef]
- Nishimura, K., et al., Meta-analysis: diagnostic accuracy of anti-cyclic citrullinated peptide antibody and rheumatoid factor for rheumatoid arthritis. Ann Intern Med, 2007. 146(11): p. 797-808. [CrossRef]
- Badr Eldin, A., S. Mobasher, and G. Hegazy, The Diagnostic Utility of Anti-Mutated Citrullinated Vimentin Antibodies, Anti-Cyclic Citrullinated Peptide Antibodies and Rheumatoid Factor in Rheumatoid Arthritis. Egyptian Journal of Rheumatology and Clinical Immunology, 2014. 2(1): p. 19-25. [CrossRef]
- Block, D.R., et al., Analytical and clinical comparison of anti-CCP assays with rheumatoid factor for the diagnosis of rheumatoid arthritis. Clin Chim Acta, 2012. 413(11-12): p. 1015-7. [CrossRef]
- Sung, W.Y. and W.C. Tsai, Rethink about the role of rheumatoid factor and anti-citrullinated protein antibody in rheumatoid arthritis. Rheumatology and Immunology Research, 2021. 2(1): p. 19-25. [CrossRef]
- Mota, L.M., et al., Guidelines for the diagnosis of rheumatoid arthritis. Rev Bras Reumatol, 2013. 53(2): p. 141-57.
- Deane, K.D., et al., Genetic and environmental risk factors for rheumatoid arthritis. Best Pract Res Clin Rheumatol, 2017. 31(1): p. 3-18. [CrossRef]
- Hadwen, B., et al., Presence of Autoantibodies in Males and Females With Rheumatoid Arthritis: A Systematic Review and Metaanalysis. J Rheumatol, 2022. 49(7): p. 663-671. [CrossRef]
- Orellana, C., et al., Oral contraceptives, breastfeeding and the risk of developing rheumatoid arthritis: results from the Swedish EIRA study. Ann Rheum Dis, 2017. 76(11): p. 1845-1852. [CrossRef]
- Salliot, C., et al., Hormonal replacement therapy may reduce the risk for RA in women with early arthritis who carry HLA-DRB1 *01 and/or *04 alleles by protecting against the production of anti-CCP: results from the ESPOIR cohort. Ann Rheum Dis, 2010. 69(9): p. 1683-6. [CrossRef]
- Arnold, M.B., et al., Are there differences between young- and older-onset early inflammatory arthritis and do these impact outcomes? An analysis from the CATCH cohort. Rheumatology (Oxford), 2014. 53(6): p. 1075-86. [CrossRef]
- Nilsson, J., et al., Influence of Age and Sex on Disease Course and Treatment in Rheumatoid Arthritis. Open Access Rheumatol, 2021. 13: p. 123-138. [CrossRef]
- Meyer, O., et al., Serial determination of cyclic citrullinated peptide autoantibodies predicted five-year radiological outcomes in a prospective cohort of patients with early rheumatoid arthritis. Arthritis Res Ther, 2006. 8(2): p. R40. [CrossRef]
- Ursum, J., et al., Levels of anti-citrullinated protein antibodies and IgM rheumatoid factor are not associated with outcome in early arthritis patients: a cohort study. Arthritis Res Ther, 2010. 12(1): p. R8. [CrossRef]
- Charpin, C., et al., New autoantibodies in early rheumatoid arthritis. Arthritis Res Ther, 2013. 15(4): p. R78. [CrossRef]
- Stolt, P., et al., Quantification of the influence of cigarette smoking on rheumatoid arthritis: results from a population based case-control study, using incident cases. Ann Rheum Dis, 2003. 62(9): p. 835-41. [CrossRef]
- Sugiyama, D., et al., Impact of smoking as a risk factor for developing rheumatoid arthritis: a meta-analysis of observational studies. Ann Rheum Dis, 2010. 69(1): p. 70-81. [CrossRef]
- Jonsson, T., J. Thorsteinsson, and H. Valdimarsson, Does smoking stimulate rheumatoid factor production in non-rheumatic individuals? APMIS, 1998. 106(10): p. 970-4.
- Manfredsdottir, V.F., et al., The effects of tobacco smoking and rheumatoid factor seropositivity on disease activity and joint damage in early rheumatoid arthritis. Rheumatology (Oxford), 2006. 45(6): p. 734-40. [CrossRef]
- Farid, S., G. Azizi, and A. Mirshafiey, Anti-citrullinated protein antibodies and their clinical utility in rheumatoid arthritis. Int J Rheum Dis, 2013. 16(4): p. 379-86. [CrossRef]
- Liao, K.P., L. Alfredsson, and E.W. Karlson, Environmental influences on risk for rheumatoid arthritis. Curr Opin Rheumatol, 2009. 21(3): p. 279-83. [CrossRef]
- Hill, J.A., et al., Cutting edge: the conversion of arginine to citrulline allows for a high-affinity peptide interaction with the rheumatoid arthritis-associated HLA-DRB1*0401 MHC class II molecule. J Immunol, 2003. 171(2): p. 538-41. [CrossRef]
- Alsalahy, M.M., et al., Effect of tobacco smoking on tissue protein citrullination and disease progression in patients with rheumatoid arthritis. Saudi Pharm J, 2010. 18(2): p. 75-80. [CrossRef]
- MacGregor, A.J., et al., Characterizing the quantitative genetic contribution to rheumatoid arthritis using data from twins. Arthritis Rheum, 2000. 43(1): p. 30-7.
- Kuo, C.F., et al., Familial aggregation of rheumatoid arthritis and co-aggregation of autoimmune diseases in affected families: a nationwide population-based study. Rheumatology (Oxford), 2017. 56(6): p. 928-933. [CrossRef]
- Frisell, T., et al., Familial aggregation of arthritis-related diseases in seropositive and seronegative rheumatoid arthritis: a register-based case-control study in Sweden. Ann Rheum Dis, 2016. 75(1): p. 183-9. [CrossRef]
- Hemminki, K., et al., Familial associations of rheumatoid arthritis with autoimmune diseases and related conditions. Arthritis Rheum, 2009. 60(3): p. 661-8. [CrossRef]
- Padyukov, L., Genetics of rheumatoid arthritis. Semin Immunopathol, 2022. 44(1): p. 47-62.
- Ting, Y.T., et al., The interplay between citrullination and HLA-DRB1 polymorphism in shaping peptide binding hierarchies in rheumatoid arthritis. J Biol Chem, 2018. 293(9): p. 3236-3251. [CrossRef]
- Huizinga, T.W., et al., Refining the complex rheumatoid arthritis phenotype based on specificity of the HLA-DRB1 shared epitope for antibodies to citrullinated proteins. Arthritis Rheum, 2005. 52(11): p. 3433-8. [CrossRef]
- Lawrence, J.S., Heberden Oration, 1969. Rheumatoid arthritis--nature or nurture? Ann Rheum Dis, 1970. 29(4): p. 357-79.
- de, B.J., F.W. Boerma, and E.O. Vorenkamp, Rheumatoid arthritis (R.A.) factor in near relatives of sero-positive and sero-negative patients with rheumatoid arthritis. Ann Rheum Dis, 1962. 21(4): p. 339-41. [CrossRef]
- Sellam, J., et al., Increased levels of circulating microparticles in primary Sjogren's syndrome, systemic lupus erythematosus and rheumatoid arthritis and relation with disease activity. Arthritis Res Ther, 2009. 11(5): p. R156. [CrossRef]
- Huang, L., et al., Proteomics profiling of CD4 + T-cell-derived exosomes from patients with rheumatoid arthritis. Int Immunopharmacol, 2023. 122: p. 110560. [CrossRef]
- Borges, F.T., L.A. Reis, and N. Schor, Extracellular vesicles: structure, function, and potential clinical uses in renal diseases. Braz J Med Biol Res, 2013. 46(10): p. 824-30. [CrossRef]
- Doyle, L.M. and M.Z. Wang, Overview of Extracellular Vesicles, Their Origin, Composition, Purpose, and Methods for Exosome Isolation and Analysis. Cells, 2019. 8(7). [CrossRef]
- Koniusz, S., et al., Extracellular Vesicles in Physiology, Pathology, and Therapy of the Immune and Central Nervous System, with Focus on Extracellular Vesicles Derived from Mesenchymal Stem Cells as Therapeutic Tools. Front Cell Neurosci, 2016. 10: p. 109. [CrossRef]
- Qin, J. and Q. Xu, Functions and application of exosomes. Acta Pol Pharm, 2014. 71(4): p. 537-43.
- Lim, J., et al., Direct isolation and characterization of circulating exosomes from biological samples using magnetic nanowires. J Nanobiotechnology, 2019. 17(1): p. 1. [CrossRef]
- Sprent, J., Direct stimulation of naive T cells by antigen-presenting cell vesicles. Blood Cells Mol Dis, 2005. 35(1): p. 17-20. [CrossRef]
- Li, Q., et al., Exosomes: Versatile Nano Mediators of Immune Regulation. Cancers (Basel), 2019. 11(10). [CrossRef]
- Margulies, D.H., How MHC molecules grab citrullinated peptides to foster rheumatoid arthritis. J Biol Chem, 2018. 293(9): p. 3252-3253. [CrossRef]
- Arita, S., et al., B cell activation regulates exosomal HLA production. Eur J Immunol, 2008. 38(5): p. 1423-34. [CrossRef]
- Tsuno, H., et al., A proteomic analysis of serum-derived exosomes in rheumatoid arthritis. BMC Rheumatol, 2018. 2: p. 35. [CrossRef]
- Takizawa, Y., et al., Citrullinated fibrinogen detected as a soluble citrullinated autoantigen in rheumatoid arthritis synovial fluids. Ann Rheum Dis, 2006. 65(8): p. 1013-20. [CrossRef]
- Zhao, X., et al., Circulating immune complexes contain citrullinated fibrinogen in rheumatoid arthritis. Arthritis Res Ther, 2008. 10(4): p. R94. [CrossRef]
- Raijmakers, R., et al., Elevated levels of fibrinogen-derived endogenous citrullinated peptides in synovial fluid of rheumatoid arthritis patients. Arthritis Res Ther, 2012. 14(3): p. R114.
- Skriner, K., et al., Association of citrullinated proteins with synovial exosomes. Arthritis Rheum, 2006. 54(12): p. 3809-14. [CrossRef]
- Al-Dalaan, A., et al., The prevalence of rheumatoid arthritis in the Qassim region of Saudi Arabia. Annals of Saudi medicine, 1998. 18(5): p. 396-397. [CrossRef]
- Alamri, S.Z.S., et al., Rheumatoid Arthritis in Hail Region, Saudi Arabia. International Journal of Innovative Research in Medical Science, 2017. 2(02): p. 545 to 551-545 to 551.
- Alballa, S.R., The expression of rheumatoid arthritis in Saudi Arabia. Clin Rheumatol, 1995. 14(6): p. 641-5. [CrossRef]
- Mavragani, C.P. and H.M. Moutsopoulos, Rheumatoid arthritis in the elderly. Exp Gerontol, 1999. 34(3): p. 463-71. [CrossRef]
- Krams, T., et al., Effect of age at rheumatoid arthritis onset on clinical, radiographic, and functional outcomes: The ESPOIR cohort. Joint Bone Spine, 2016. 83(5): p. 511-5. [CrossRef]
- Almoallim, H., et al., Rheumatoid Arthritis Saudi Database (RASD): Disease Characteristics and Remission Rates in a Tertiary Care Center. Open Access Rheumatol, 2020. 12: p. 139-145. [CrossRef]
- Alharbi, S., Depression in Saudi Patients with Rheumatoid Arthritis. Open Access Rheumatol, 2023. 15: p. 1-9. [CrossRef]
- Almuhareb, A.M., et al., Prevalence of complementary and alternative medicine use among rheumatoid arthritis patients in Saudi Arabia. Saudi Pharm J, 2019. 27(7): p. 939-944. [CrossRef]
- Intriago, M., et al., Clinical Characteristics in Patients with Rheumatoid Arthritis: Differences between Genders. ScientificWorldJournal, 2019. 2019: p. 8103812. [CrossRef]
- Sokka, T., et al., QUEST-RA: quantitative clinical assessment of patients with rheumatoid arthritis seen in standard rheumatology care in 15 countries. Ann Rheum Dis, 2007. 66(11): p. 1491-6. [CrossRef]
- Alghamdi, M.F. and E.M. Redwan, Advances in the diagnosis of autoimmune diseases based on citrullinated peptides/proteins. Expert Rev Mol Diagn, 2021. 21(7): p. 685-702. [CrossRef]
- Raine, C. and I. Giles, What is the impact of sex hormones on the pathogenesis of rheumatoid arthritis? Front Med (Lausanne), 2022. 9: p. 909879.
- Alpizar-Rodriguez, D., et al., The role of female hormonal factors in the development of rheumatoid arthritis. Rheumatology (Oxford), 2017. 56(8): p. 1254-1263. [CrossRef]
- Alemao, E., et al., Association of Seropositivity and Mortality in Rheumatoid Arthritis and the Impact of Treatment With Disease-Modifying Antirheumatic Drugs: Results From a Real-World Study. Arthritis Care Res (Hoboken), 2020. 72(2): p. 176-183. [CrossRef]
- Hammam, N., et al., Clinical implications of seropositive and seronegative autoantibody status in rheumatoid arthritis patients: A comparative multicentre observational study. Rheumatol Immunol Res, 2024. 5(1): p. 57-65. [CrossRef]
- Carbonell-Bobadilla, N., et al., Patients with seronegative rheumatoid arthritis have a different phenotype than seropositive patients: A clinical and ultrasound study. Front Med (Lausanne), 2022. 9: p. 978351. [CrossRef]
- Majka, D.S., et al., Duration of preclinical rheumatoid arthritis-related autoantibody positivity increases in subjects with older age at time of disease diagnosis. Ann Rheum Dis, 2008. 67(6): p. 801-7. [CrossRef]
- van Zanten, A., et al., Presence of anticitrullinated protein antibodies in a large population-based cohort from the Netherlands. Ann Rheum Dis, 2017. 76(7): p. 1184-1190. [CrossRef]
- Boeters, D.M., et al., The prevalence of ACPA is lower in rheumatoid arthritis patients with an older age of onset but the composition of the ACPA response appears identical. Arthritis Res Ther, 2017. 19(1): p. 115. [CrossRef]
- Misaki, K., et al., Associations of disease duration and anti-citrullinated peptide antibody status with the effectiveness of abatacept in biologic-naive patients with rheumatoid arthritis: Post hoc analysis of a multicentre, real-world observational study in Japan (ORIGAMI). Mod Rheumatol, 2024. 34(2): p. 297-306.
- Vazquez-Del Mercado, M., et al., Disease duration of rheumatoid arthritis is a predictor of vascular stiffness: a cross-sectional study in patients without known cardiovascular comorbidities: A STROBE-compliant article. Medicine (Baltimore), 2017. 96(33): p. e7862.
- Poulsom, H. and P.J. Charles, Antibodies to citrullinated vimentin are a specific and sensitive marker for the diagnosis of rheumatoid arthritis. Clin Rev Allergy Immunol, 2008. 34(1): p. 4-10. [CrossRef]
- Di Giuseppe, D., et al., Cigarette smoking and risk of rheumatoid arthritis: a dose-response meta-analysis. Arthritis Res Ther, 2014. 16(2): p. R61.
- Yahya, A., et al., Smoking is associated with an increased risk of developing ACPA-positive but not ACPA-negative rheumatoid arthritis in Asian populations: evidence from the Malaysian MyEIRA case-control study. Mod Rheumatol, 2012. 22(4): p. 524-31.
- Kallberg, H., et al., Smoking is a major preventable risk factor for rheumatoid arthritis: estimations of risks after various exposures to cigarette smoke. Ann Rheum Dis, 2011. 70(3): p. 508-11. [CrossRef]
- Sokolove, J., et al., Increased inflammation and disease activity among current cigarette smokers with rheumatoid arthritis: a cross-sectional analysis of US veterans. Rheumatology (Oxford), 2016. 55(11): p. 1969-1977. [CrossRef]
- van der Woude, D., et al., Quantitative heritability of anti-citrullinated protein antibody-positive and anti-citrullinated protein antibody-negative rheumatoid arthritis. Arthritis Rheum, 2009. 60(4): p. 916-23.
- Frisell, T., et al., Familial risks and heritability of rheumatoid arthritis: role of rheumatoid factor/anti-citrullinated protein antibody status, number and type of affected relatives, sex, and age. Arthritis Rheum, 2013. 65(11): p. 2773-82.
- Kim, S.K., et al., Greater prevalence of seropositivity for anti-cyclic citrullinated peptide antibody in unaffected first-degree relatives in multicase rheumatoid arthritis-affected families. Korean J Intern Med, 2013. 28(1): p. 45-53. [CrossRef]
- Jung, M.K. and J.Y. Mun, Sample Preparation and Imaging of Exosomes by Transmission Electron Microscopy. J Vis Exp, 2018(131).
- Wang, J., et al., Identification and analysis of exosomes secreted from macrophages extracted by different methods. Int J Clin Exp Pathol, 2015. 8(6): p. 6135-42.
- Liu, X. and H.W. Wang, Single particle electron microscopy reconstruction of the exosome complex using the random conical tilt method. J Vis Exp, 2011(49).
- Kalra, H., et al., Comparative proteomics evaluation of plasma exosome isolation techniques and assessment of the stability of exosomes in normal human blood plasma. Proteomics, 2013. 13(22): p. 3354-64. [CrossRef]
- Akers, J.C., et al., Comparative Analysis of Technologies for Quantifying Extracellular Vesicles (EVs) in Clinical Cerebrospinal Fluids (CSF). PLoS One, 2016. 11(2): p. e0149866. [CrossRef]
- Dash, M., et al., Exosomes isolated from two different cell lines using three different isolation techniques show variation in physical and molecular characteristics. Biochim Biophys Acta Biomembr, 2021. 1863(2): p. 183490. [CrossRef]
- Kalluri, R. and V.S. LeBleu, The biology, function, and biomedical applications of exosomes. Science, 2020. 367(6478). [CrossRef]
- Zhang, Y., et al., Exosome: A Review of Its Classification, Isolation Techniques, Storage, Diagnostic and Targeted Therapy Applications. Int J Nanomedicine, 2020. 15: p. 6917-6934. [CrossRef]
- Jankovicova, J., et al., Tetraspanins, More than Markers of Extracellular Vesicles in Reproduction. Int J Mol Sci, 2020. 21(20). [CrossRef]
- Mathieu, M., et al., Specificities of exosome versus small ectosome secretion revealed by live intracellular tracking of CD63 and CD9. Nat Commun, 2021. 12(1): p. 4389. [CrossRef]
- Tang, Y.T., et al., Comparison of isolation methods of exosomes and exosomal RNA from cell culture medium and serum. Int J Mol Med, 2017. 40(3): p. 834-844. [CrossRef]
- Moelants, E.A., J. Van Damme, and P. Proost, Detection and quantification of citrullinated chemokines. PLoS One, 2011. 6(12): p. e28976. [CrossRef]
- Vitorino, R., et al., Elucidating Citrullination by Mass Spectrometry and Its Role in Disease Pathogenesis. J Proteome Res, 2021. 20(1): p. 38-48. [CrossRef]
- Ru, Z., et al., A new pattern of citrullinated peptides improves the sensitivity for diagnosing rheumatoid arthritis. Clin Biochem, 2022. 105-106: p. 87-93. [CrossRef]
- Koivula, M.K., et al., Are there autoantibodies reacting against citrullinated peptides derived from type I and type II collagens in patients with rheumatoid arthritis? Ann Rheum Dis, 2005. 64(10): p. 1443-50.
- Girbal-Neuhauser, E., et al., The epitopes targeted by the rheumatoid arthritis-associated antifilaggrin autoantibodies are posttranslationally generated on various sites of (pro)filaggrin by deimination of arginine residues. J Immunol, 1999. 162(1): p. 585-94. [CrossRef]
- Martinez Tellez, G., et al., Diagnostic Value of Anti-Fibrinogen Citrullinated Peptide in Rheumatoid Arthritis. Reumatol Clin (Engl Ed), 2020. 16(6): p. 455-461.
- Kim, J.S., et al., Implication of the Association of Fibrinogen Citrullination and Osteoclastogenesis in Bone Destruction in Rheumatoid Arthritis. Cells, 2020. 9(12).
- Heydari, R., et al., Exosomes as Rheumatoid Arthritis Diagnostic Biomarkers and Therapeutic Agents. Vaccines (Basel), 2023. 11(3). [CrossRef]
- Alghamdi, M., et al., Circulating extracellular vesicles and rheumatoid arthritis: a proteomic analysis. Cell Mol Life Sci, 2021. 79(1): p. 25. [CrossRef]
- Qin, Q., et al., Systemic Proteomic Analysis Reveals Distinct Exosomal Protein Profiles in Rheumatoid Arthritis. J Immunol Res, 2021. 2021: p. 9421720. [CrossRef]
- Nogueira, L., et al., Autoantibodies to deiminated fibrinogen are the most efficient serological criterion for early rheumatoid arthritis diagnosis. Arthritis Research & Therapy, 2003. 5(Suppl 1): p. 18.
- Cornillet, M., et al., The fibrin-derived citrullinated peptide beta60-74Cit(6)(0),(7)(2),(7)(4) bears the major ACPA epitope recognised by the rheumatoid arthritis-specific anticitrullinated fibrinogen autoantibodies and anti-CCP2 antibodies. Ann Rheum Dis, 2014. 73(6): p. 1246-52.
- Nogueira, L., et al., In Black Africans with rheumatoid arthritis, ACPA recognize citrullinated fibrinogen and the derived peptides alpha36-50Cit38,42 and beta60-74Cit60,72,74, like in Caucasians. Clin Immunol, 2014. 152(1-2): p. 58-64. [CrossRef]
- Hill, J.A., et al., Serum autoantibodies that bind citrullinated fibrinogen are frequently found in patients with rheumatoid arthritis. J Rheumatol, 2006. 33(11): p. 2115-9.
- Sharma, M., et al., Expanding the citrullinome of synovial fibrinogen from rheumatoid arthritis patients. J Proteomics, 2019. 208: p. 103484. [CrossRef]
- Masson-Bessiere, C., et al., The major synovial targets of the rheumatoid arthritis-specific antifilaggrin autoantibodies are deiminated forms of the alpha- and beta-chains of fibrin. J Immunol, 2001. 166(6): p. 4177-84.
Figure 4.
Effect of smoking on autoantibodies. A) The anti-CCP is significantly (*) frequent in non-smokers (P=0.003). No significant difference (P>0.05) for the prevalence of RF and anti-CMCV in both groups. B) No impact of smoking on the titer of positive antibody (P>0.05). The comparison was performed using unpaired t-test, each bar represents the mean, and error bars correspond to 95% confidence intervals.
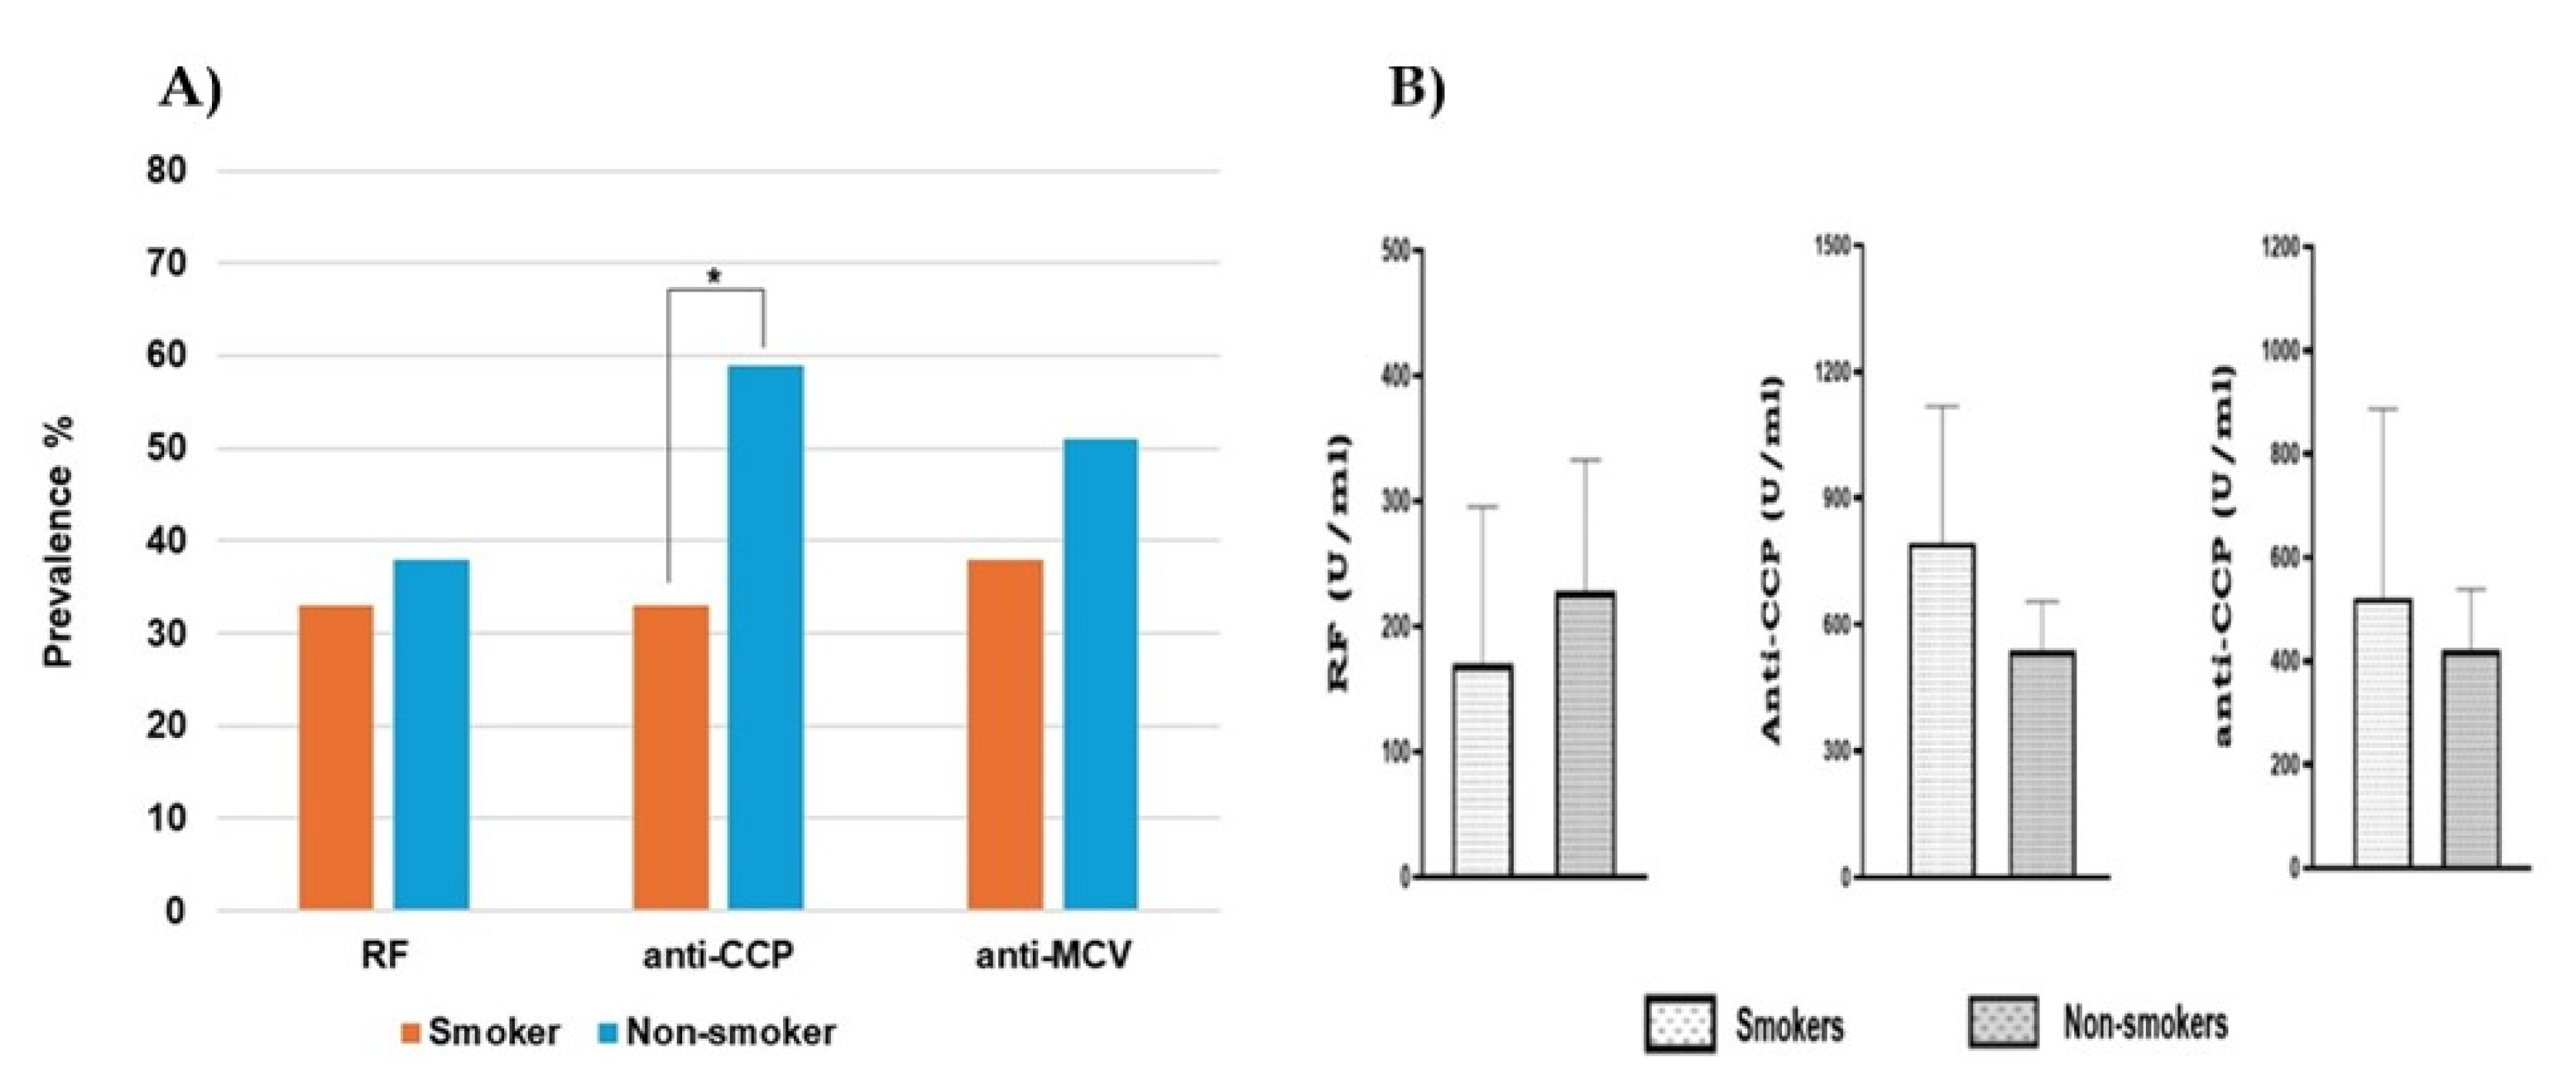
Figure 5.
Association between family history and seropositivity. A) Autoantibodies prevalence in RA patients with and without family history, shows no significant differences (P>0.05). B) No relationship between family history and the titer of a positive antibody. Each bar represents the mean, and error bars correspond to 95% confidence intervals. An unpaired t-test was used to compare the difference in means (P>0.05).
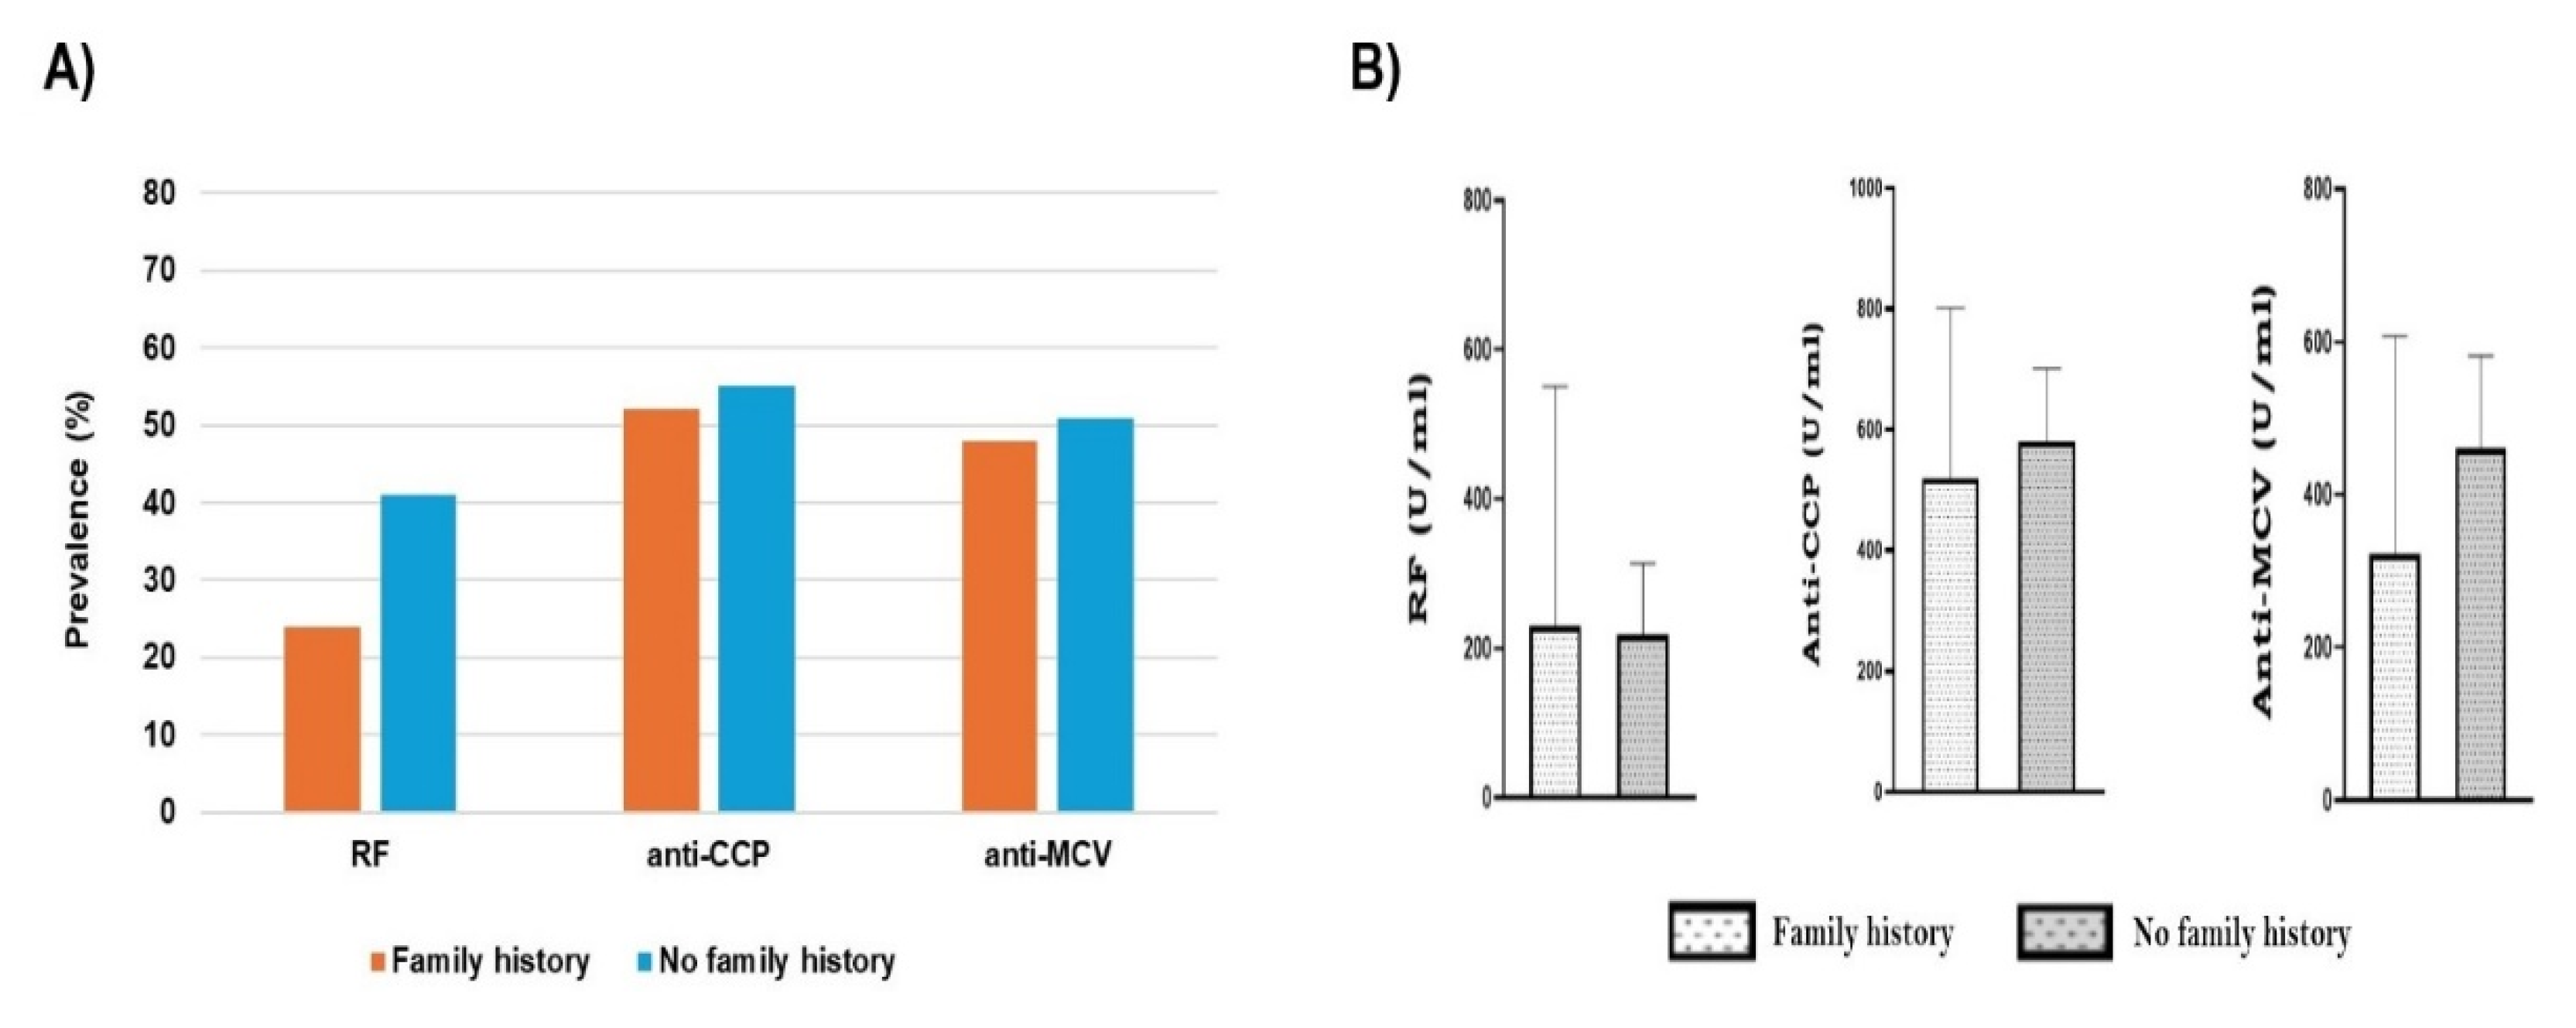
Figure 6.
Summary of exosome morphology by DLS. Zetasizer histograms represent the size distribution by intensity. A) SPRA B) SNRA C) HC. D) Exosomes isolated from SNRA patients revealed significant small diameter when compared to SPRA (***) and HC samples (**). (SPRA: seropositive RA patients, SNRA: seronegative RA patients, HC: Healthy Control individuals).
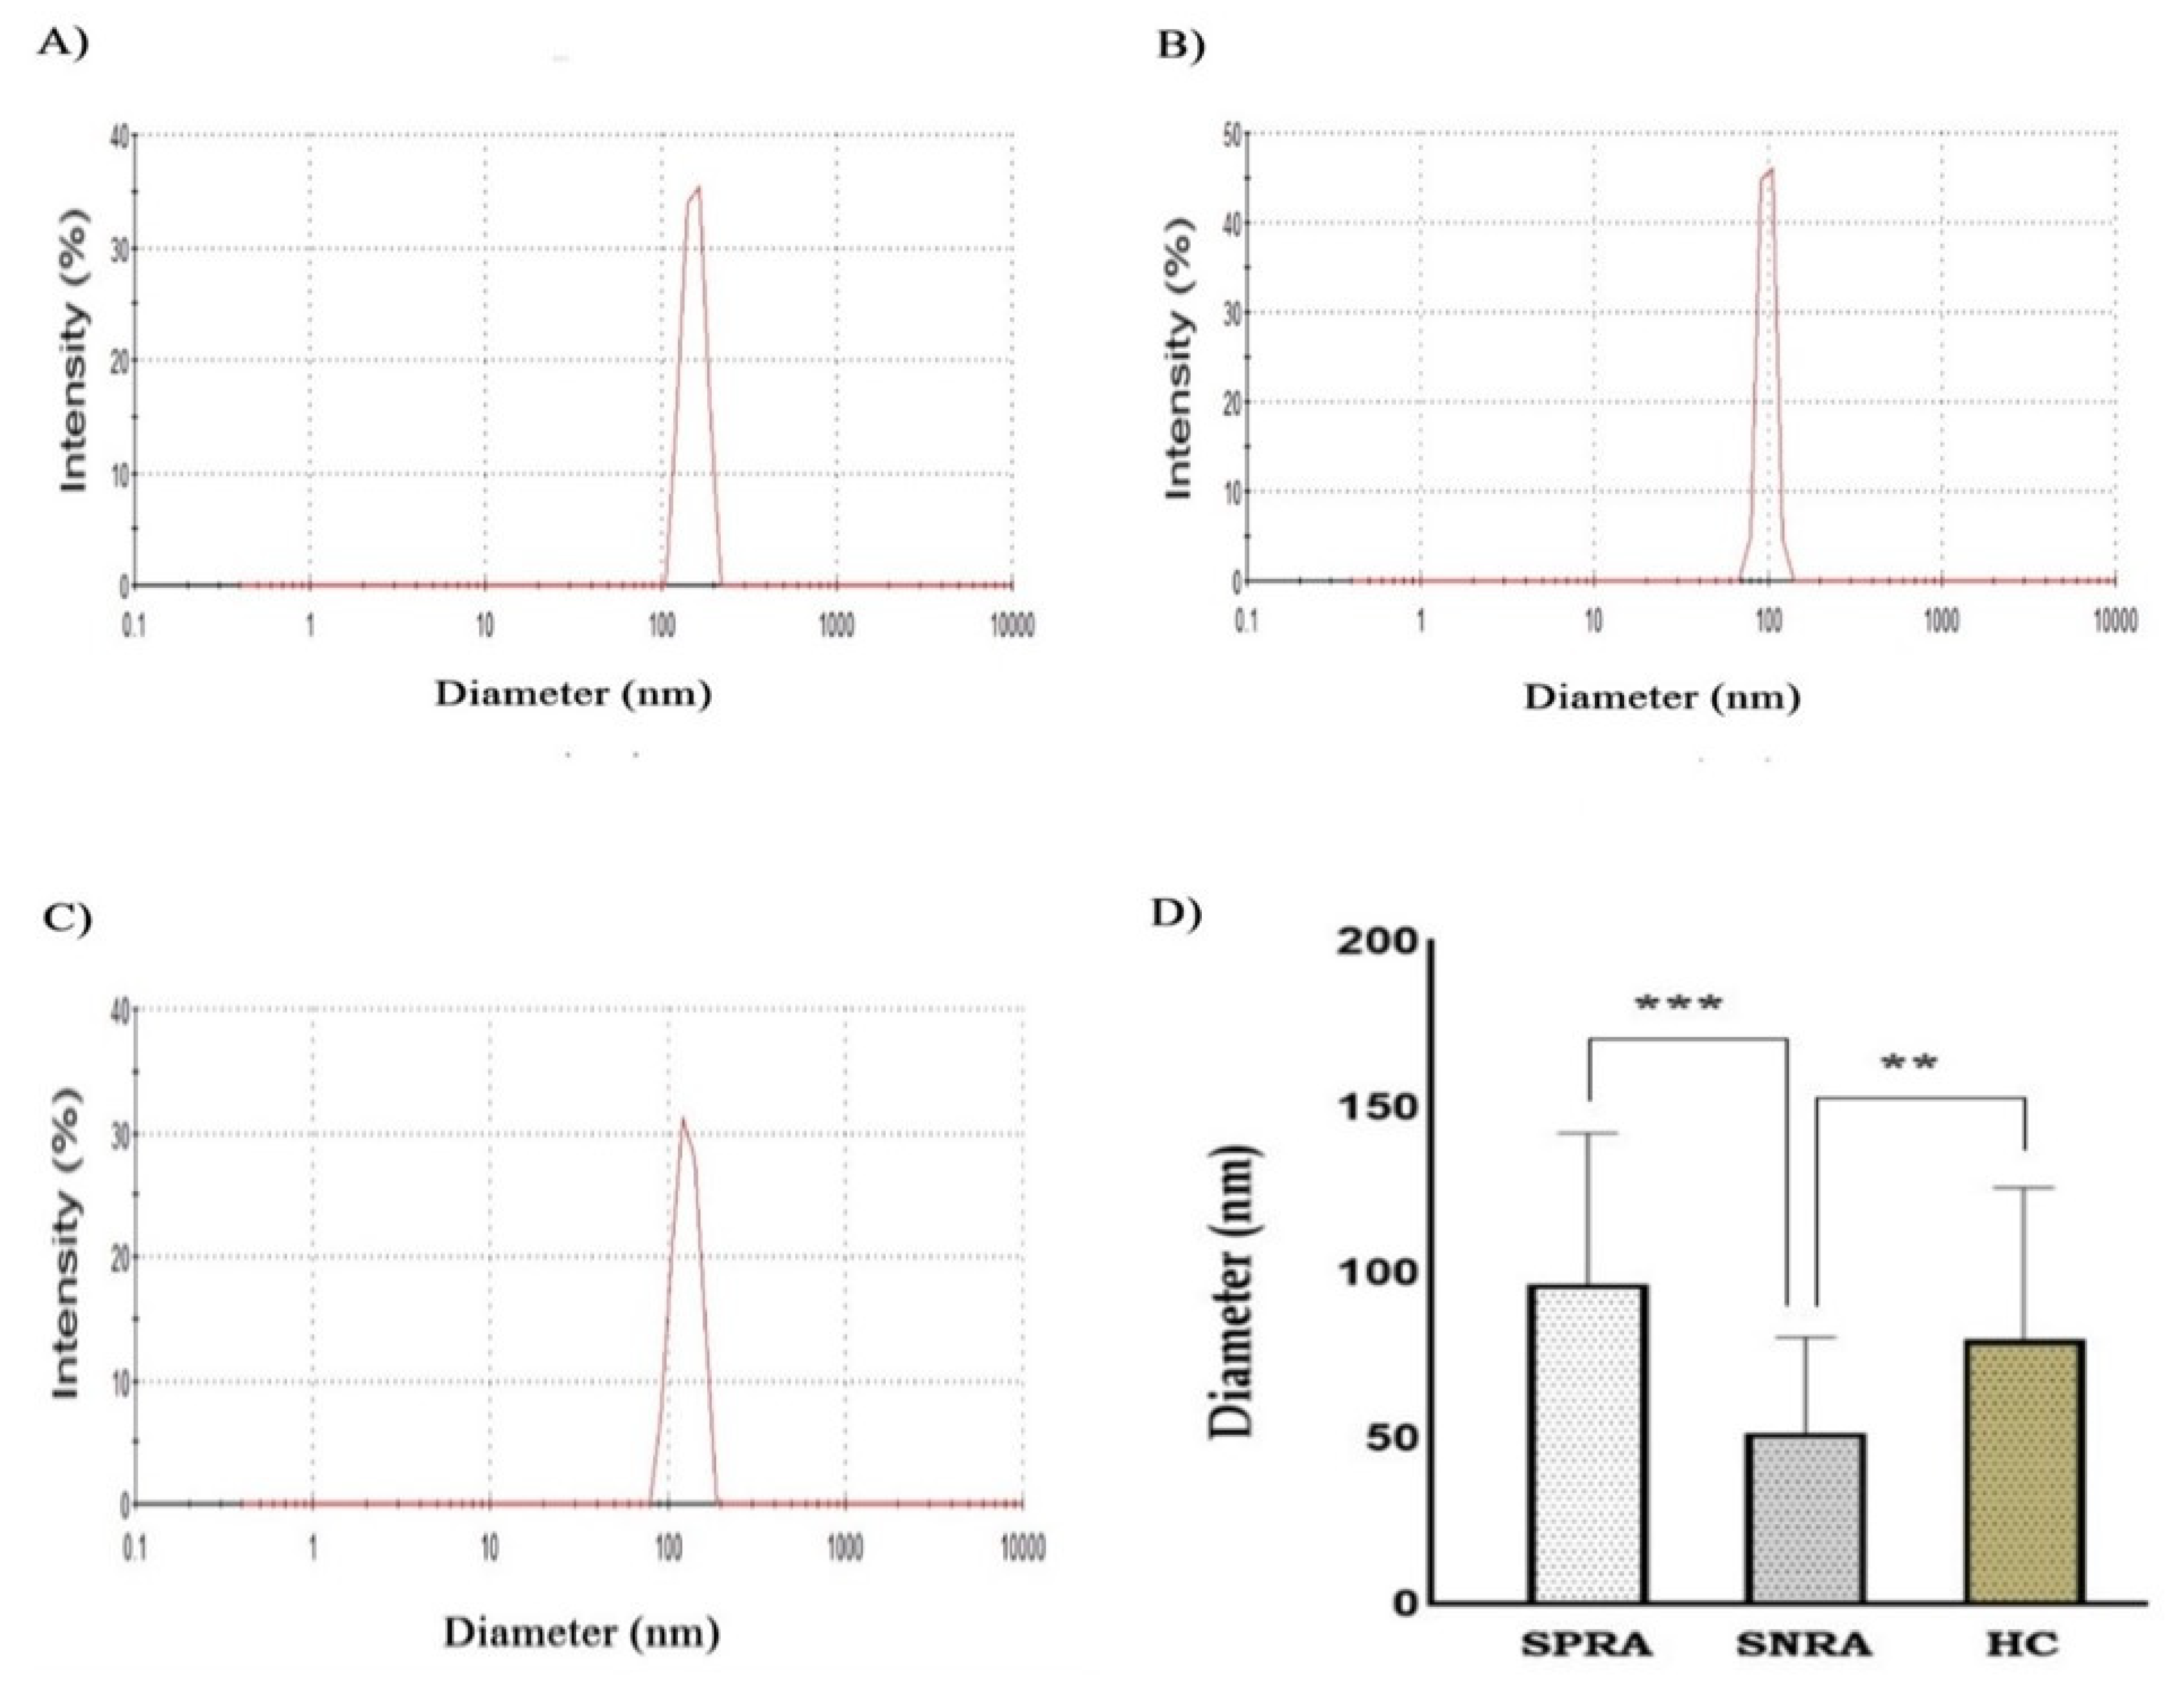
Figure 7.
TEM images of exosomes using negative staining. Exosomes showed round-shaped vesicles with diameters less than 100 nm; scale bar = 200 nm. Representative TEM micrograph of exosomes isolated from (A) SPRA, (B) SNRA, (C) HC. (SPRA: seropositive RA patients, SNRA: seronegative RA patients, HC: Healthy Control).
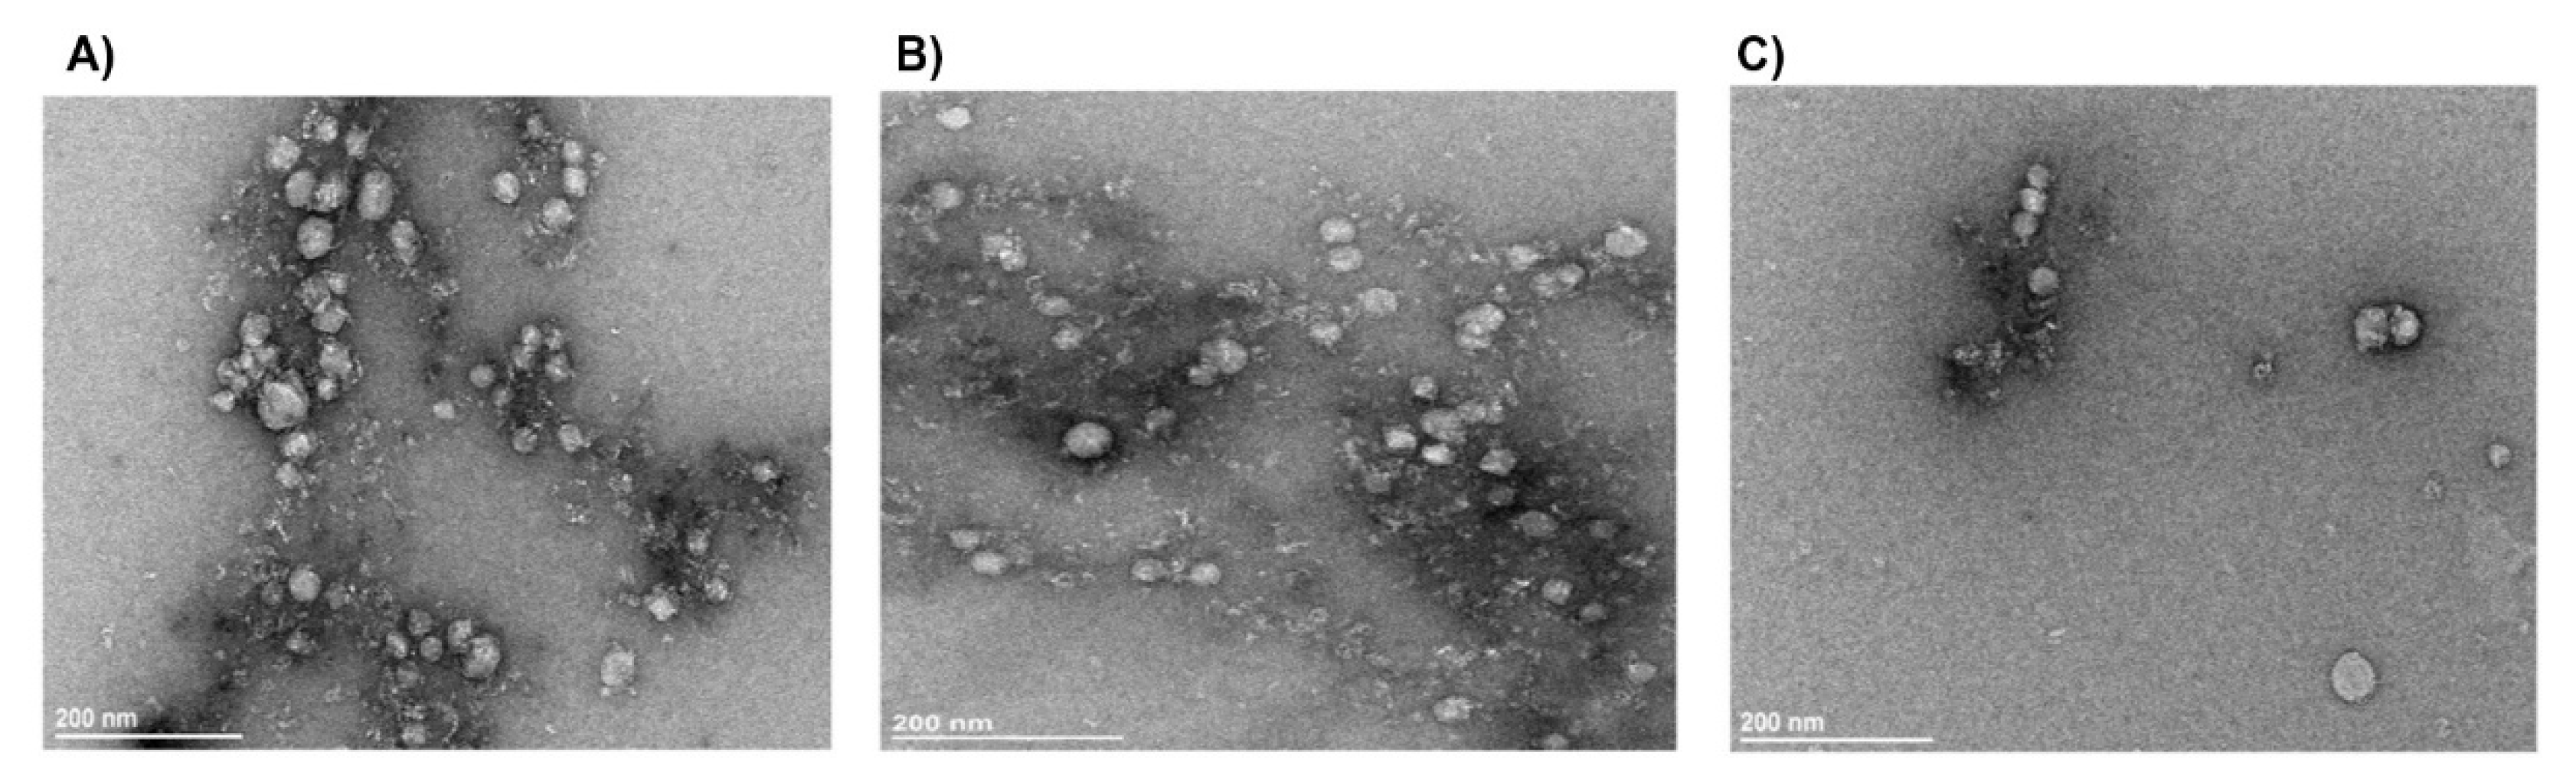
Figure 8.
A) Protein content of exosome lysates determined by the Pierce detergent- compatible Bradford assay. Significant differences in exosomes content of protein between patients and HC samples (P<0.001). B) Coomassie blue-stained gel showing protein band separation for exosome lysates from patient and healthy control samples. (SPRA: seropositive RA, SNRA: seronegative RA, HC: healthy control).
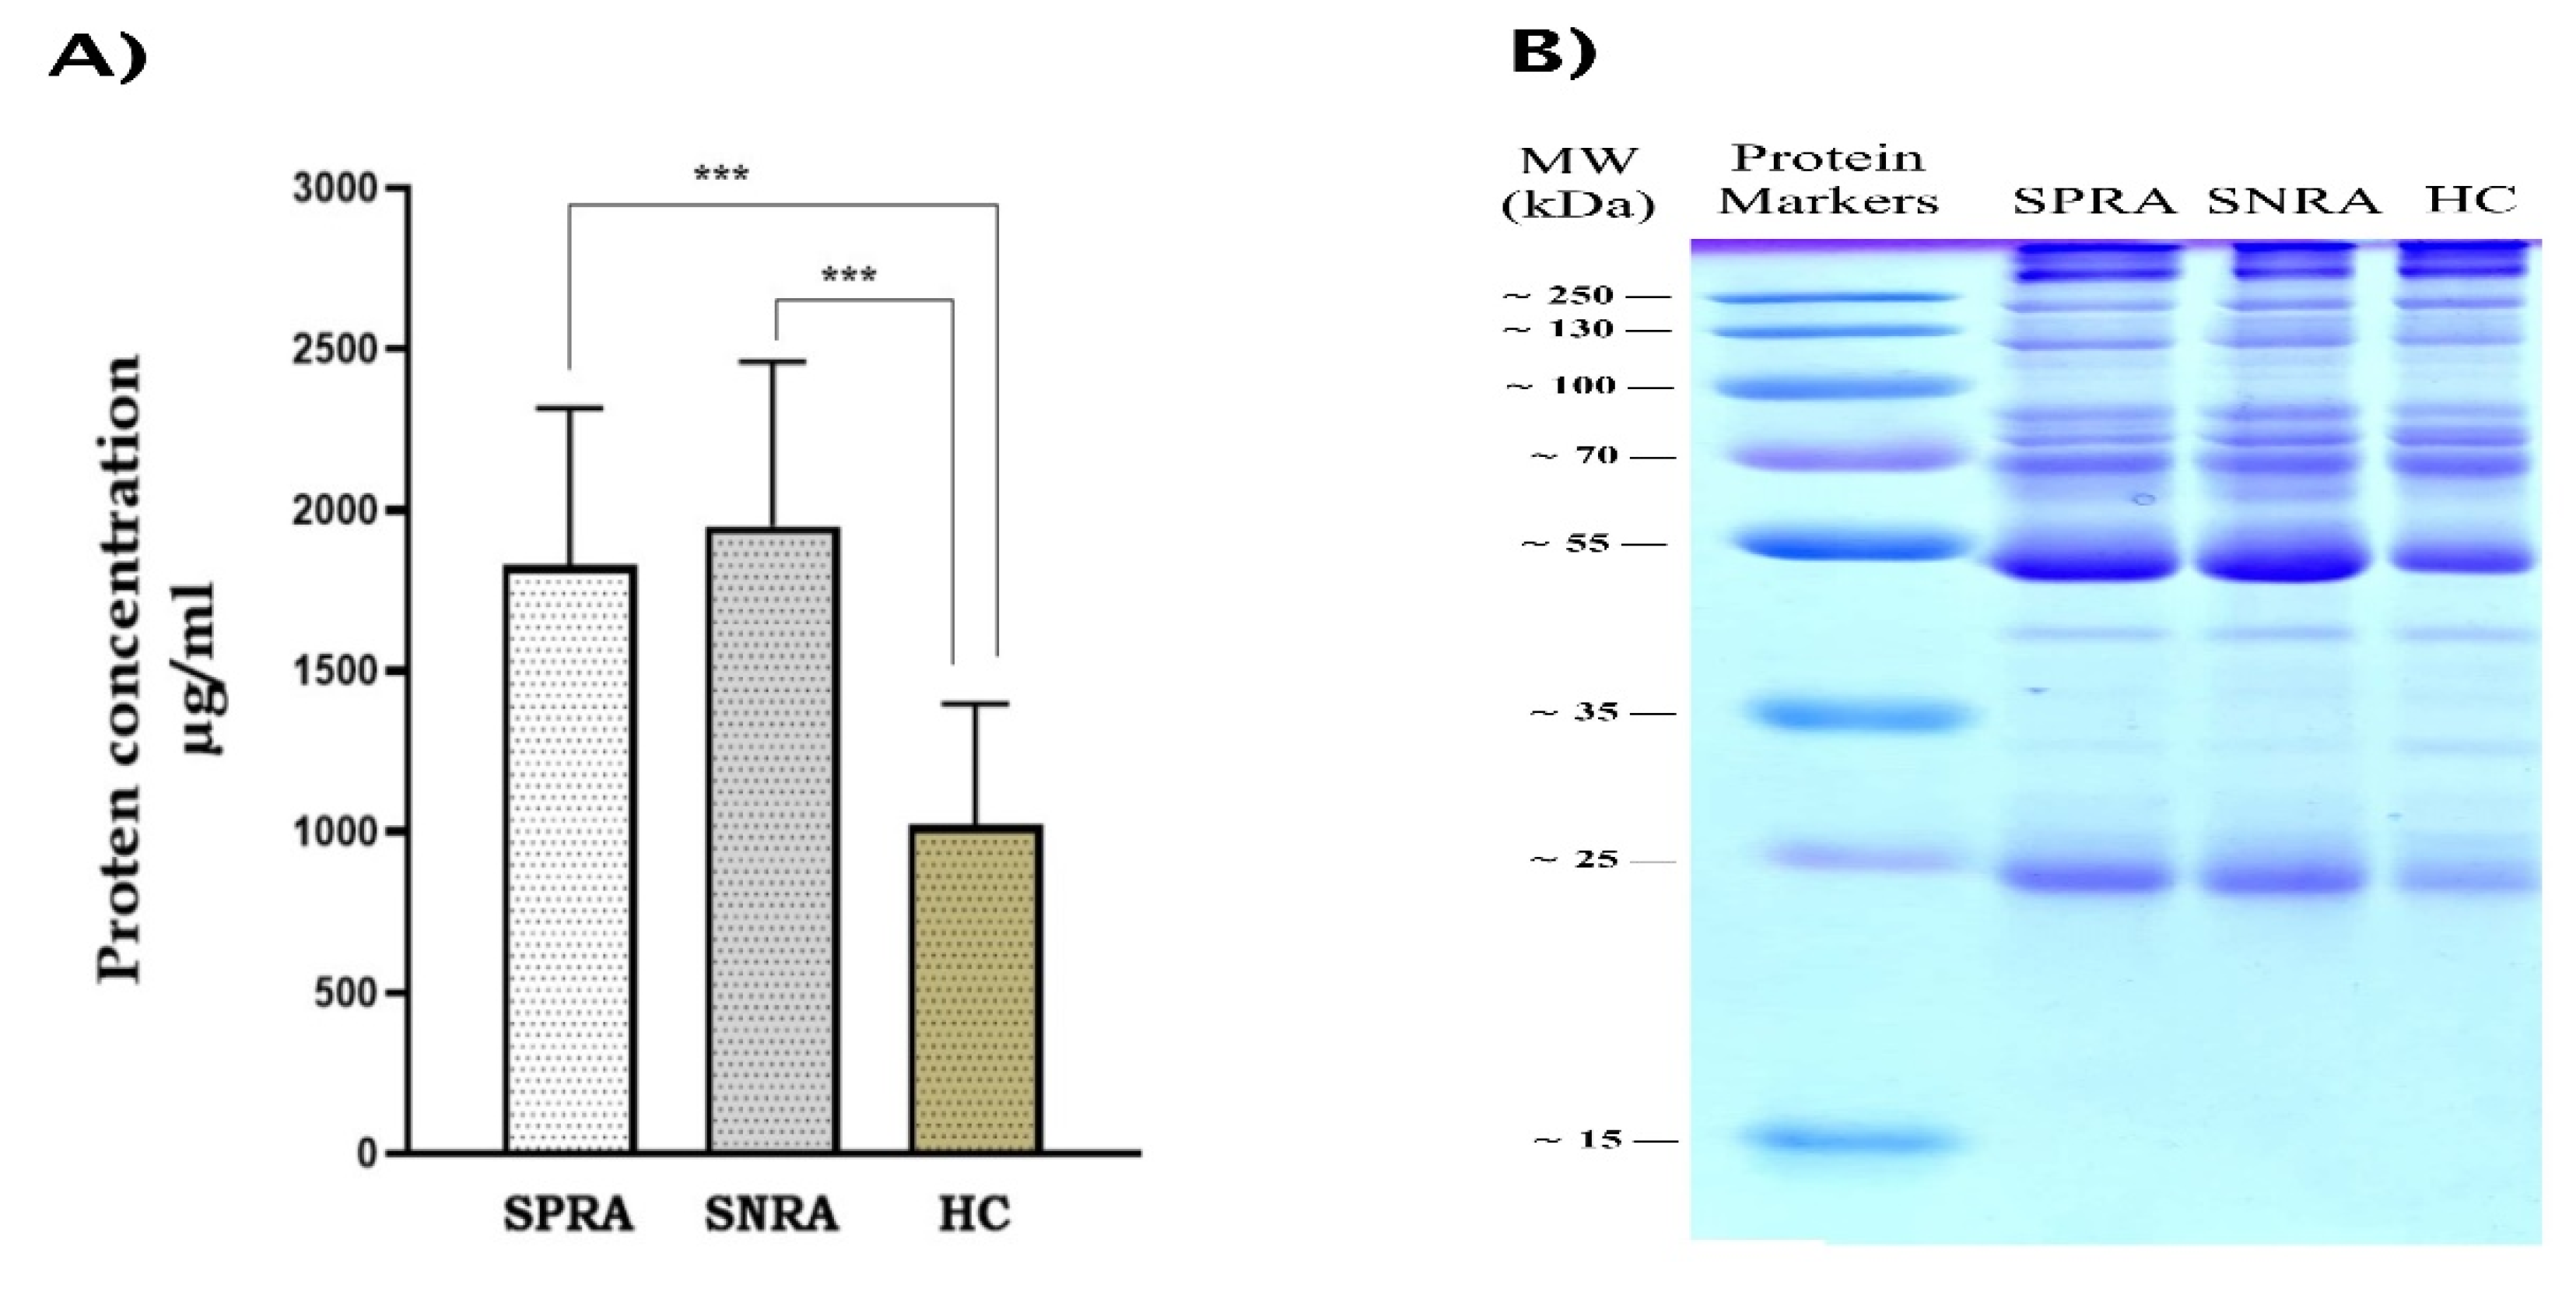
Figure 5.
A) Representative western blotting of CD9 in exosome sample groups: SPRA, ANRA, and HC. B) Western blot analysis for the expression of cFBG in exosome lysates that were extracted from SPRA patients. C) Variation of anti-CCP levels between SPRA patients according to the expression of cFBG in their exosome lysates. (SPRA: seropositive RA, SNRA: seronegative RA, HC: healthy control, cFBG: citrullinated fibrinogen).
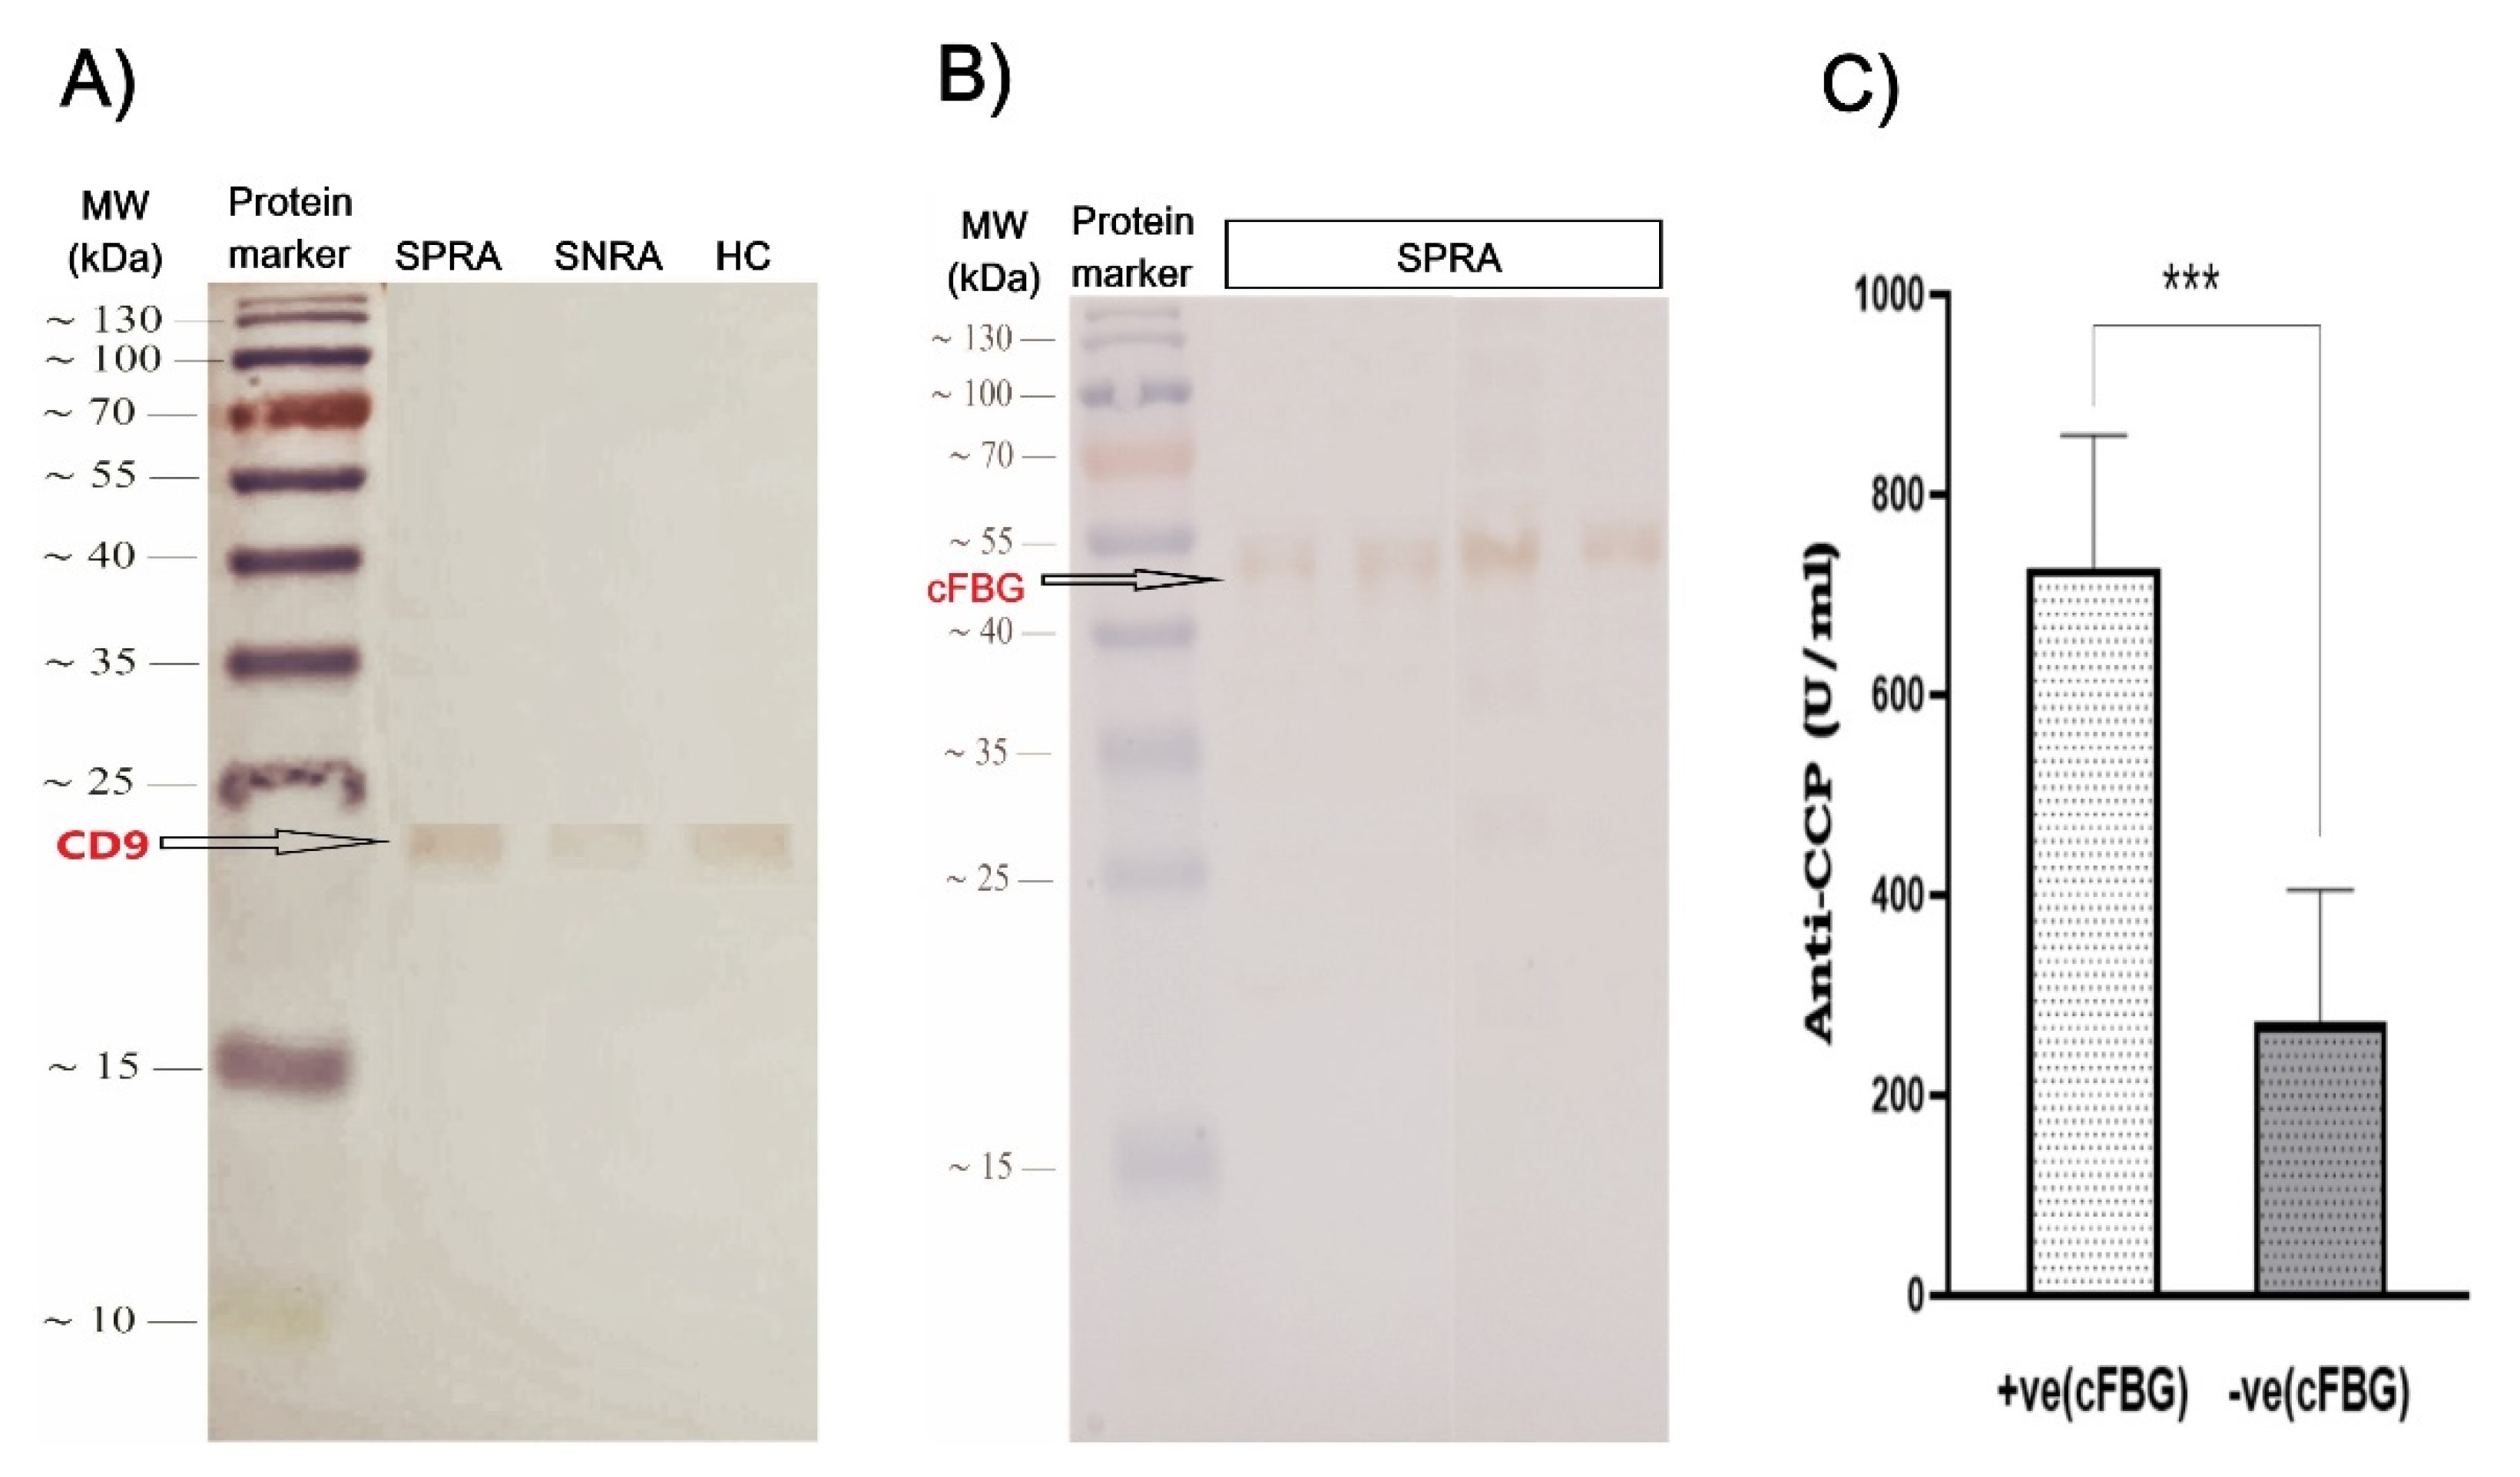

Table 1.
Demographic characteristics of RA patients and healthy controls.
| Characteristic | RA patients | HC individuals | P-value |
|---|---|---|---|
| (N=116) | (N=35) | ||
| Gender | |||
| Female, n (%) | 104 (89.7%) | 28 (80%) | 0.13 |
| Male, n (%) | 12 (10.3%) | 7 (20%) | |
| Age (mean±SD, years) | 51.3±11.5 | 47±11.6 | 0.05 |
| Age range, years | (18-70) | (23-66) | |
| Age distribution, n (%) | |||
| <40 years | 20 (17.2%) | 9 (25.7%) | 0.26 |
| 40-50 years | 32 (27.6%) | 11 (31.4%) | 0.7 |
| >50 years | 64 (55.2%) | 15 (42.9%) | 0.2 |
| Occupation, n (%) | |||
| Worker | 26 (22.4%) | 11 (31.4%) | 0.28 |
| Retired | 7 (6%) | 2 (5.7%) | 0.94 |
| Housewife | 81 (69.8%) | 20 (57.1%) | 0.16 |
| Student | 2 (1.7%) | 2 (5.7%) | 0.2 |
| Smoking, n (%) | |||
| Smoker | 21 (18.1) | NA | |
| Non-smoker | 95 (81.9) | NA | |
| Family history of RA, n (%) | |||
| Yes | 25 (21.5) | 5 (14.3) | 0.35 |
| No | 91 (78.5) | 30 (85.7) |
Table 2.
Demographic and laboratory characteristics of RA patients.
| Characteristic | All | Female | Male | P-value |
|---|---|---|---|---|
| patients | F/M | |||
| Number of patients, [n (%)] | 116 (100) | 104 (89.7) | 12 (10.3) | |
| Age, mean±SD (Years) | 51.3±11.5 | 51.3±11.6 | 51.7±11.3 | 0.96 |
| Age group, [n (%)] | ||||
| <40 years | 20 (17.2) | 18 (17.3) | 2 (16.7) | 0.9 |
| 40-50 years | 32 (27.6) | 30 (28.8) | 2 (16.7) | 0.37 |
| >50 years | 64 (55.2) | 56 (53.9) | 8 (66.6) | 0.4 |
| Disease duration, mean±SD | 8.4±6 | 8.7±6.2 | 6.1±3.8 | 0.16 |
| Disease duration, n (%) | ||||
| <5 years | 39 (33.6) | 35 (33.7) | 4 (33.3) | 0.98 |
| 5-10 years | 43 (37.1) | 36 (34.6) | 7 (58.4) | 0.11 |
| >10 years | 34 (29.3) | 33 (31.7) | 1 (8.3) | 0.09 |
| Smoking, [n (%)] | ||||
| Smoker | 21 (18.1) | 17 (16.3) | 4 (33.3) | 0.15 |
| Non-smoker | 95 (81.9) | 87 (83.7) | 8 (66.7) | |
| Family history of RA, n (%) | ||||
| Yes | 25 (21.6) | 23 (22.1) | 2 (16.7) | 0.66 |
| No | 91 (78.4) | 81 (77.9) | 10 (83.3) | |
| Positive autoantibody, n (%) | ||||
| RF positive | 43 (37.1) | 37 (35.6) | 6 (50) | 0.33 |
| Anti-CCP positive | 63 (54.3) | 55 (52.9) | 8 (66.7) | 0.36 |
| Anti-MCV positive | 56 (48.3) | 49 (47.1) | 7 (58.3) | 0.46 |
Table 3.
The prevalence and levels of positive antibodies among females and males.
| Autoantibody | Female | Male | P-value |
|---|---|---|---|
| N= 104 | N= 12 | ||
| RF +ve, n (%) | 37 (36) | 6 (50) | 0.33 |
| RF Mean±SD, (IU/ml) | 196.8 ± 236.6 | 356.4 ± 512.8 | 0.004 * |
| Anti-CCP +ve, n (%) | 55 (53) | 8 (67) | 0.36 |
| Anti-CCP (Mean±SD, (IU/ml)) | 547.8 ± 437.8 | 697.1 ± 420.6 | 0.37 |
| Anti-MCV +ve, n (%) | 49 (47) | 7 (58) | 0.46 |
| Anti-MCV Mean±SD, (IU/ml) | 415.2 ± 406.6 | 589.2 ± 383.8 | 0.98 |
Table 4.
Prevalence and level of positive antibodies among age groups of RA patients.
| Autoantibody | <40 years | 40-50 years | >50 years |
|---|---|---|---|
| N= 20 | N= 32 | N= 64 | |
| RF+ve, n (%) | 4 (20) | 9 (28) | 30 (47) |
| Mean±SD, (IU/ml) | 488.6 ± 490.9 | 206.8 ± 271.3 | 186.8 ± 251.0 |
| Anti-CCP+ve, n (%) | 9 (45) | 17 (53) | 37 (58) |
| Mean±SD, (IU/ml) | 599.2 ± 454.5 | 587.7 ± 444.4 | 549.3 ± 437.9 |
| Anti-MCV+ve,n (%) | 7 (35) | 15 (47) | 34 (53) |
| Mean±SD, (IU/ml) | 564.1 ± 423.9 | 399.3 ± 445.8 | 427.4 ± 389.5 |
Table 5.
Prevalence and level of positive autoantibodies over the period of RA duration.
| Autoantibody | <5 years | 5-10 years | >10 years |
|---|---|---|---|
| N= 39 | N= 43 | N=34 | |
| RF, n (%) | 11 (28) | 18 (42) | 14 (41) |
| Mean±SD, (IU/L) | 234.3 ± 277.6 | 254.2 ± 379.7 | 161.9 ± 114.0 |
| Anti-CCP, n (%) | 19 (49) | 25 (58) | 19 (56) |
| Mean±SD, (IU/L) | 437.6 ± 438.5 | 627.0 ± 432.3 | 616.7± 430.9 |
| Anti-MCV, n (%) | 12 (31) | 27 (63) | 17 (50) |
| Mean±SD, (IU/L) | 440.9 ± 428.9 | 546.5 ± 435.3 | 260.2 ± 273.6 |
Table 6.
Comparison of positive autoantibodies among smokers and non-smoker RA patients.
| Autoantibody | Smokers | Non-smokers | P-value |
|---|---|---|---|
| N= 25 | N= 91 | ||
| RF, n (%) | 7 (33) | 36 (38) | 0.7 |
| Mean±SD, (IU/ml) | 170.9 ± 135.7 | 228.4 ± 308.5 | 0.41 |
| Anti-CCP, n (%) | 7 (33) | 56 (59) | 0.79 |
| Mean±SD, (IU/ml) | 697.8 ± 425.2 | 538.3 ± 438.9 | 0.55 |
| Anti-MCV, n (%) | 8 (38) | 48 (51) | 0.35 |
| Mean±SD, (IU/ml) | 522.1 ± 435.7 | 422.8 ± 402.3 | 0.57 |
Table 7.
Association between seropositivity and family history.
| Positive family history | Negative family history | P-value | |
|---|---|---|---|
| N= 25 | N= 91 | ||
| RF, n (%) | 6 (24) | 37 (41) | 0.13 |
| Mean±SD, (IU/ml) | 229.4 ± 306.1 | 192.7 ± 292.9 | 0.58 |
| Anti-CCP, n (%) | 13 (52) | 50 (55) | 0.79 |
| Mean±SD, (IU/ml) | 519.4 ± 467.5 | 579.1 ± 430.5 | 0.55 |
| Anti-MCV, n (%) | 10 (40) | 46 (50) | 0.35 |
| Mean±SD, (IU/ml) | 322.5 ± 398.1 | 372.3 ± 389.7 | 0.57 |
Disclaimer/Publisher’s Note: The statements, opinions and data contained in all publications are solely those of the individual author(s) and contributor(s) and not of MDPI and/or the editor(s). MDPI and/or the editor(s) disclaim responsibility for any injury to people or property resulting from any ideas, methods, instructions or products referred to in the content. |
© 2024 by the authors. Licensee MDPI, Basel, Switzerland. This article is an open access article distributed under the terms and conditions of the Creative Commons Attribution (CC BY) license (http://creativecommons.org/licenses/by/4.0/).
Copyright: This open access article is published under a Creative Commons CC BY 4.0 license, which permit the free download, distribution, and reuse, provided that the author and preprint are cited in any reuse.


