
Submitted:
27 June 2025
Posted:
30 June 2025
You are already at the latest version
Abstract
The phenomenon of tourism is becoming increasingly central and integrated into strategic ter-ritorial planning practices, playing a crucial role in guiding development processes and prompting growing reflection on its impacts on places. In the absence of adequate planning, tourism can produce negative effects with significant implications for territorial resources and host commu-nities. In territories characterized by high spatial heterogeneity and dispersed tourist attractions, sustainable tourism management represents a growing challenge. Traditional approaches to es-timating tourism carrying capacity (TCC) often focus on individual sites, overlooking the com-plexity and extent of serial cultural landscapes. This study addresses this gap by proposing an innovative geographic-territorial model for estimating TCC, applied to the serial cultural site “Via Appia. Regina Viarum”. The model, based on Cifuentes’ ecosystem approach, expands the spatial domain of analysis to include 614 municipalities organized into 13 gravitational areas. Through a systemic perspective, multidimensional composite indices reflecting territorial extent and re-source endowment have been developed. The simulation of three tourism development scenar-ios—baseline, UNESCO effect, and stress test—up to 2034 reveals differentiated territorial re-sponses, providing analytical tools for sustainable strategic planning and proactive management of complex cultural territories.
Keywords:
Tourism Carrying Capacity
; Tourism Planning
; Territorial Planning
; UNESCO World heritage site
; Via Appia. Regina Viarum
; Sustainable Tourism
; Local Development
; Heritage Management
; Tourism Management
; Geographical information sistems
1. Introduction
Tourism represents a strategic sector for local development, but it poses significant challenges in terms of sustainability and impact management [1,2,3,4,5,6]. These impacts underscore the necessity for complex governance processes involving institutional actors and stakeholders across multiple levels, highlighting the importance of increasing integration between tourism planning and territorial planning [5,7,8,9,10,11,12,13,14,15].
The literature has addressed the topic of tourism carrying capacity (TCC) through diverse perspectives [16,17,18]. TCC methodologies have been developed, for instance, for urban tourism destinations [19], coastal areas [20], geosites [21], or protected areas [22,23]. Others have formulated cross-cutting TCC methodologies applicable to diverse destinations [24,25,26]. Additional studies focus on defining targeted indicators for measuring tourism sustainability [14,27,28,29,30] and for managing criticalities related to overtourism [4,31]. However, diffuse cultural destinations, characterized by heterogeneous attractors distributed over extensive geographic areas, require innovative methodological approaches, particularly considering the need to integrate various levels of territorial governance.
The present study introduces assessing carrying capacity in tourism destinations, with particular reference to diffused cultural contexts. From this perspective, the study develops a model to measure the TCC of a complex cultural destination based on the presence of heterogeneous attractors distributed over an extensive geographic area. The estimation model is applied to the “Via Appia. Regina Viarum”, a serial site inscribed in 2024 on UNESCO's World Heritage List. UNESCO serial sites comprise two or more elements, monuments, and geographically distinct places (located in one or more Member States) that, taken together, contribute to the Outstanding Universal Value of the inscribed site [32,33].
A substantial corpus of research has contributed over time to better defining the concept of TCC and its applicative evolution. Over the years, various definitions of TCC have been proposed, including that of UNWTO [34], which describes it as "the maximum number of people that may visit a tourist destination at the same time, without causing destruction of the physical, economic and sociocultural environment and an unacceptable decrease in the quality of visitors' satisfaction." Despite advances in this field, although there are several studies focused on UNESCO sites, to our knowledge, those dedicated to estimating tourism carrying capacity in relation to extensive serial sites remain limited.
TCC is a holistic and multi-objective concept for which no universally recognized measure or univocal methodological approach exists. Both in theoretical studies and in applied contexts, TCC has followed the evolution of sustainability analysis dimensions, thus incorporating various load components: ecological [35,36], economic [37,38], socio-anthropic [39,40,41], cultural and behavioral [42].
In theory, TCC estimation should result from the combination of both quantitative descriptive elements and qualitative elements oriented toward achieving a balance between tourism growth, territory, and local community. Simultaneously, quantitative elements are based on the construction of complex indicator sets capable of operating, in time and space, within a systemic framework that encompasses, for a specific context, tourism aspects and territorial dimensions [25]. Authors such as Wagar [43], Lime [44], Mathieson, Wall [39], and Getz [45] have led to consideration of the existence of different carrying capacities for different subsystems of a destination. For example, Getz [45] identifies thresholds for physical, economic, ecological, socio-cultural, political-administrative, and perceptual carrying capacity.
TCC is intrinsically linked to the notion of sustainability, representing a model that informs about a territory's/tourist site's capacity to sustain a certain level of use over time. A tourism destination can be considered sustainable only when it operates within the limits of its carrying capacity [46,47]. Furthermore, it is not limited to defining a static objective but configures itself as a continuous and adaptive management process capable of responding flexibly to emerging challenges and ensuring constant monitoring of the balance between tourist flows and the territorial system's capacity to absorb and sustain them [8,16].
Over the years, numerous TCC estimation techniques have been proposed involving one or more analysis components. In our case, the carrying capacity methodological framework adopts a phased approach. The estimation of the serial site's TCC is inspired by and adapts the ecosystem model developed by Cifuentes [48,49], originally used for defining TCC in parks and protected areas [50,51,52,53], and subsequently experimented with in other fields [24,36,54]. The adaptation follows a geographical-territorial logic capable of capturing the complexity of the case under examination. The proposed model provides the level of interaction between human activities and the physical-ecological environment and is structured, in accordance with the scholar's indications, based on three interconnected indices and the estimation of corrective factors.
The Italian Ministry of Culture (MiC) has identified the designated site in 22 components constituted by a multiplicity of attributes (tangible archaeological evidence), very different from each other in typology and conservation status. The components of the serial site, core zones, are territorially distributed across 4 regions of central-southern Italy (Lazio, Campania, Basilicata, Puglia); the sum of their perimeters covers an area of 9,387.64 ha, while that of their respective protection zones, buffer zones, is 41,354.34 ha. The geographical-territorial model has provided for a recalibration of the route's pertinence areas. To this end, based on a procedure for extending the radius of influence of “Via Appia. Regina Viarum”, the methodology has integrated two scales of geographical analysis: one with municipal-level analysis units (614 municipalities), the other with territorial-level analysis units (13 gravitational areas). This choice was adopted to overcome the impracticability of a detailed TCC estimate for each component and, simultaneously, to allow its estimation as informed and coherent as possible with the geo-settlement characteristics of the territories involved.
The study provides a replicable methodological framework capable of supporting political decision-makers and heritage managers in defining tourism planning and management strategies, monitoring tourist load, and promoting balanced utilization of territorial resources. Furthermore, it supports public tourism policy choices by identifying areas of greatest tourist exposure and those with potential development opportunities [14]. Since the methodology is developed considering multiple geographical units, it allows model application in other studies to perform detailed estimates, adaptable both to the specificities of different reference contexts and to vaster territories, emphasizing the model's scalability across larger territorial extents.
The document is organized into 5 sections: after the introduction, section 2 explores the theoretical framework and main analytical perspectives on the concept of tourism planning, analyzing the evolution of tourism as a strategic and plannable activity; section 3 identifies the study area and describes the procedure that led to the recalibration of the geographical analysis scope. Subsequently, it presents the geographical-territorial model, illustrating its conceptual structure and analysis dimensions associated with corrective indicators. This approach is further deepened by the construction of scenarios aimed at testing the carrying capacities of individual municipalities and individual areas; section 4 shows the results obtained from applying the model and scenarios, highlighting the temporal evolution of carrying capacities in the municipalities and areas previously derived; finally, section 5 discusses the political and practical implications of the obtained results, proposing recommendations for effective management of tourism destinations in a context of sustainable growth.
2. Theoretical Background
In the context of post-World War II economic growth, the expansion of international travel made mass tourism a global phenomenon, laying the foundations for new challenges in tourism destination management. During this historical phase, mass or conventional tourism activity emerged as a direct application of the fordist approach to the travel industry and destination management, aimed at responding to growing demand from an increasingly broad public [55,56,57,58]. Mass tourism has traditionally been associated with intensive resource use, the adoption of unsustainable production models, and increased tourism intensity in many areas, which were in turn reshaped according to strategies markedly oriented by the economic growth paradigm [10,11,59].
From a scientific perspective, particularly since the 1970s, researchers have repeatedly questioned the effects of intensifying tourism growth and its expansion [39,60,61,62,63,64]. During this years, tourism planning, initially applied only within the tourism industry framework [65] and in the physical-economic evaluation of specific facilities or individual areas [66], began to emerge as a field of study and concept of public interest. This evolution was configured as a response to rapid sector changes and the diseconomies produced by tourism growth, in an attempt to manage its associated effects from environmental, socio-anthropological, and spatial perspectives [10,39].
In his work, Getz (1987) [67] identified four distinct traditions in tourism planning, each representative of a specific vision of tourism development: boosterism; industry-oriented; physical-spatial; community-oriented. These traditions continue to represent an essential reference framework, widely used but also expanded by subsequent literature in analyses of different planning contexts; the traditions do not necessarily exclude each other, nor do they develop in linear sequence. While approaches guided by tourism growth objectives and demand stimulation emerged from the 1960s, reflecting a currently dominant interpretation that tourism would automatically bring positive results in the absence of critical vision – the so-called "boosterism" – more structured attempts at rational planning emerged from the 1970s, aimed at mitigating the diseconomies associated with unregulated or unplanned tourism growth [8]. From this perspective, physical/spatial practices constituted a formulation sensitive to spatial organization, land use planning and associated infrastructure, the search for spatial patterns coherent with the development of specific tourism areas, as well as the ecological absorption capacity of tourism's environmental impacts [64,68,69]. At the same time, such practices were judged less sensitive to socio-cultural aspects. The ecological logic of these models proved coherent with the emergence, beginning in the 1960s, of a growing scientific debate on Tourist Carrying Capacity (TCC), aimed at preventing and monitoring the effects of tourism pressure in spaces designated for recreational uses and tourism places [70]. The TCC concept, although traceable to Sumner [71] in the mid-1930s [72], began to gain consistency later, during the 1970s. These elaborations subsequently gave rise to a broad corpus of empirical research and theoretical reflections, while finding isolated previous contributions [43,73,74], as well as in other seminal works [75,76]. Reflections on TCC remain more central than ever on the conceptual level today, as demonstrated by the overtourism debate and concerns regarding the management of sensitive places [4,18,77,78,79]. On the operational level, numerous management techniques have been developed, both quantitative and qualitative [80,81,82], although critical contributions toward attempts to define carrying capacity in purely numerical terms have not been lacking [83].
In the 1980s, in light of problems that emerged in previous decades, attention to the multidimensional and multi-spatial impacts of tourism and carrying capacity gave impetus to a conception of tourism planning as a complex and integrated system. Growing tourism intensification prompted researchers and policymakers to reflect on the impact this expansion had on natural resources and local communities, making tourism planning more attentive to sustainability necessary. The diffusion of the sustainable development concept, promoted by the Our Common Future report [84], found application in tourism beginning in the 1990s, giving rise to an extensive debate on the definition of sustainable tourism [85]. This debate, while having generated relevant contributions, is still marked by persistent conceptual ambiguity, which feeds the gap between theory and practice. Progressively, reflection on tourism sustainability has expanded, including different geographical scales of analysis of implications (for example, as evidenced by studies on tourism water footprint, [86] and interweaving with the development of more sustainable forms of tourism [87,88,89].
Community-oriented planning frameworks, pioneered in Murphy [66], have proven more sensitive to the diversity of local contexts and coherent with sustainable development principles. In theory, such models support bottom-up participatory practices in line with pre-existing socio-territorial conditions and with a concept of development endogenously conceived on a local basis. This translates into pathways of local community involvement in creating authentic tourism experiences and discovering intangible cultural capital; at the same time, community-oriented planning frameworks aim to improve local living standards and monitor social/perceptual carrying capacity. Hall [90] introduces the concept of "sustainable tourism planning" as an extension of Getz's work [67]. This concept refers to a tourism planning approach that integrates elements of pre-existing traditions and emphasizes holistic practices, management cooperation, and attention to the environmental and social components of development, with a focus on strategic planning.
Murphy [66] argues that "planning is concerned with anticipating and regulating change in a system, to promote orderly development so as to increase the social, economic, and environmental benefits of the development process." Williams [63] adds that planning requires "an ordered sequence of operations and actions that are designed to realize one single goal or a set of interrelated goals." In this sense, tourism planning can be seen as a process through which to channel broader public interest objectives [67]. Williams [63] identifies some specific objectives of tourism planning, such as the integration of tourism with other economic sectors; the direction and control of physical development patterns; the creation of harmonious social and cultural relationships between tourists and local populations. In theory, according to the author, tourism-related planning allows for structuring the spatial allocation of tourism infrastructure and services among different geographical areas; organizing or reorganizing a territorial offering capable of anticipating tourism market dynamics; promoting balanced and monitored tourism development, balancing costs and positively directing spillover effects among different territories [63].Furthermore, as Inskeep [91] emphasizes, it enables the conservation of critical tourism resources, such as natural and cultural ones, preserving them and, when possible, improving them to ensure their future use. As reported by Hall [92], tourism planning contributes to mitigating tourism's negative externalities – environmental, economic, and social. Additionally, it helps produce economic benefits and improve perceptions regarding the relationships between tourists and the local community.
Tourism planning is not necessarily a linear or simple process [90,93]. Planning activity can comprise different key areas of tourism intervention, operate at different geographical scales, involve multiple planning bodies (public or private) and at various levels (starting from the local level), adopt distinct temporal horizons for different development, implementation, and evaluation phases [7]. Conversely, its absence, operational complexity, and the adoption of short-sighted visions can result in negative impacts with different types of implications for territorial resources and host communities [63,68,92]. In a broader vision, it is possible to consider that it aims to achieve, considering different scales, a balance between tourism growth, territorial development, and community [29,68,69]. Tourism planning is a process that highlights the need to consider tourism as a multisector activity, integrating tourism resource management and taking into account both physical and institutional aspects [91]. Previously, the importance of this integration had been emphasized especially by [94] and Getz [67], who proposed an interconnected and systematic perspective of tourism planning [95]. In this sense, it is a dynamic process [65], future-oriented, continuous and participatory [8,63,66,92] and is, above all, constantly informed according to different implementation contexts, which are themselves complex.
Although studies on tourism growth limits and impact management have offered significant contributions, their operational application has often remained limited [35,78,96,97]. This gap between theory and practice is reflected in problems generated by tourism which, in many contexts, has continued – and continues today – to be configured as an unplanned activity [56,69,95]. However, the perpetuation of extreme situations, such as overtourism, has reinforced the urgency of integrating the tourism phenomenon with other functions and levels of planning. It is increasingly clearly recognized that tourism cannot be treated as an uncontrolled economic force, but must be coordinated with territorial dynamics. The heterogeneous nature of tourism, both from spatial and functional perspectives, has indeed intensified interest in its territorial impacts, processes of diffusion or redistribution of effects, and its role in local development [4].
Reading socio-economic and tourism dynamics at the territorial scale is complex and requires being addressed through in-depth analyses, integrated multi-level planning processes, management models, and specific evaluation techniques. Such considerations have contributed to strengthening the role of strategic planning, emphasizing the need to integrate tourism activity within multiple planning frameworks and operate at greater systemic and temporal scales [98]. In the tourism context, strategic planning, borrowed from management studies [99], is seen as a process that "requires some estimated perception of the future" [68] and oriented toward favoring the proactivity of destination places in a systematic way [98].
Strategic planning assumes a higher and guiding role suitable for supporting a more territorially balanced and oriented vision of development [7,66]. Hall [92] emphasizes that the application of sustainability requires a balance between long-term temporal horizons and short-term operational constraints, which can be effectively addressed through strategic planning. Ladeiras et al. [100] affirm that a destination must develop a clear vision and undertake a participatory strategic planning process at multiple levels (national, regional, and local) to ensure sustainable tourism development. The pursuit of sustainability objectives in tourism is indeed linked to a structured planning process that adopts a circular causality perspective [99,101,102]. This goal- and context-oriented process also considers endogenous factors that influence strategy generation, requiring robust coordination mechanisms to support the participation of multiple stakeholders and multi-sectoral and multi-actor coordination [98,102,103]. This approach responds to community needs and integrates conventional planning as part of a continuous and dynamic process [98].
3. Materials and Methods
3.1. Area of Study and Territory Calibration
The analytical process first involved a recalibration of the area of relevance, with an extension of the Via Appia's radius of influence beyond the initial boundaries, in order to include a wide variety of surrounding territories. This approach allowed for the integration of areas not directly connected to the main route but nevertheless relevant in relation to morphological and physical specificities, providing a broader and more representative understanding of the considerable territorial complexity of the study area.
It is plausible to conceive the "Via Appia. Regina Viarum" route as a complex set of tourism destinations, characterized by undefined entry and exit points, where tourists and residents share resources and structures. Inevitably, this set of tourism destinations does not exclusively concern municipalities directly crossed by the route, but extends to a broader territorial dimension. A procedure was executed to extend the radius of influence of the serial site that finds support in the concept of range offered by Christaller's model [104,105]. The 22 sections (components) constitute "central goods," from which a hypothetical maximum range extending in a radius reaching 25 km distance was delineated. At the same time, the "central goods" are reinterpreted in the geographical-territorial model as "gravitational centers" around which areas equipped with a complex of infrastructures and services connected to them by functional relationships tend to gravitate. The polygonal approach of the Thiessen method was used to identify gravitational areas; therefore, through the digital geometric tool, space was distributed into areas of relevance, attributing to each section the area closest to it. The association of municipalities belonging to each of the 22 areas of relevance was then optimized according to territorial morphology and the local road system. In some cases, the existence of contiguous sections resulted in an aggregation of areas.
The result achieves a spatialisation of the range defined in 13 new gravitational areas comprising 614 municipalities, compared to the original 74 (Table 1; Figure 1). The range area reflects both elements of heterogeneity in the spatial distribution of population, infrastructure, and activities, as well as the different degree of tourism exposure of the territories. Overall, it covers an area of 30,634 km² and has a population of 11,461,232 residents, 72.4% of the total residents in the 4 regions [106]. Of the 614 municipalities, 64 are cities or large urban areas with high population intensity, equal to 55% of residents in the entire reference area.
The demographic dynamics within the system follow the developments of a space highly conditioned by the existence of different factor endowments. More than half of the municipalities (382 municipalities) included in the system belong to mountain and inland hill areas: these represent 21% of the population considered.
According to the ISTAT [107] parameterized scheme on the degree of urbanization, the range area identifies the territory in three types of municipalities: 1) 64 "Cities" or "Densely populated zones", 2) 227 "Small towns and suburbs" or "zones with intermediate population density", 3) 323 "Rural zones" or "Sparsely populated zones". Respectively, the municipalities thus classified represent 54.6%, 30.5% and 14.9% of the resident population. The cities of Rome and Naples alone (32.5% of total residents) condition the population distribution to such an extent that they bring their respective areas (area 1; area 6) to account for 56.1% of the entire range. Such highly polarized demographics has repeatedly influenced the construction of the analysis model.
3.2. TCC Estimation Model
The development of the methodology is based on the definitions of Physical Carrying Capacity (PCC), Real Carrying Capacity (RCC), and Effective or Admissible Carrying Capacity (ECC), as proposed by Cifuentes [48]. These definitions are structured in relation to specific correction factors appropriately identified. Within this framework, the estimation model is organized so that each successive level of carrying capacity is determined by correcting the preceding one. In the adapted model, PCC is greater than or equal to RCC, and the latter, in turn, is greater than or equal to ECC (also referred to as TCC). The geographical-territorial model is illustrated in Figure 2, which summarizes the procedural sequence.
The following subsections detail the model, describing the specific phases leading to the estimation of ECC. Intermediate territorial findings are presented, based on the Ecological Endowment composite index (EEI) and the Infrastructure Endowment composite index (IEI), which constitute the correction parameters for the three different levels of carrying capacity. EEI and IEI are considered, in accordance with the geographical scale of reference, as territorial threshold values beyond which tourism pressure results in overcapacity, likely triggering diseconomies. After illustrating the ECC estimation method, the scenario-building method is described, based on the application of specific variation coefficients.
3.2.1. Physical Carrying Capacity (PCC)
Physical Carrying Capacity (PCC) is defined as «the maximum number of visitors who can attend physically in a given place and time» [48] (p. 10). For the case under examination, it is interpreted in terms of receptive capacity; specifically, its determination is based on the Gross Occupancy Rate (GOr) of tourist accommodation establishments, calculated both at the municipal scale and across gravitational area. The specific calculation is shown in the Formula (1).
where GOr is the Gross Occupancy rate in hotels and extra hotels; NS constitutes the number of nights spent in hotels and extra-hotels; BPa the potential number of the bed places on offer by day*365; t is the reference year.
GOrt = eNSt / BPat *100
The Physical Carrying Capacity (PCC) is expressed by the Formula (2):
PCC = f (GOr )
The index provides, at specific times and expressed as a percentage, the level of pressure exerted by fluctuations in tourist arrivals on available tourism supply, therefore:
- PCC <20% Very low impact;
- 21% ≤ PCC <40% Low impact;
- 41% ≤ PCC <60% Moderate impact;
- 61% ≤ PCC <80% High impact;
- 81%≤ PCC<100 Very high impact;
- PCC ≥100 Congestion and overuse.
This procedure was developed to calculate the PCC of tourist accommodation (both hotels and extra-hotels).
3.2.2. Real Carrying Capacity (RCC)
Real Carrying Capacity (RCC) is defined as «the maximum limit of visits determined from the PCC of a site, adjusted by correction factors reflecting the specific characteristics of the site» [48] (p.12). For this study, the RCC is derived by applying to the PCC a series of ecological correction factors described through indicators of environmental and anthropic pressure.
Ecological correction factors (Ecf) were normalized and weighted, with their sum constituting the Ecological Endowment composite index (EEI), as shown in Formula (3):
where Ecf1 is the population density; Ecf2 is the ecological efficiency; Ecf3 is the ecological pressure; Ecf4 is the environmental endowment; Ecf5 is the unconsumed land. As a result, the Real Carrying Capacity (RCC) is expressed by the Formula (4):
RCC = f (PCC, EEI)
3.2.3. Effective Carrying Capacity (ECC)
Effective Carrying Capacity (ECC) corresponds to «the maximum number of visits that can be allowed, given the capacity to manage and distribute them […] the ECC is determined by comparing the RCC with the management capacity of the protected area administration» [48] (p.19).
For the calculation of the ECC, additional correction factors related to physical and cultural infrastructure systems were applied to the RCC Formula (4). The Infrastructure Correction Factors (ICF) were normalized and weighted, with their sum constituting the Infrastructure Endowment composite index (IEI), as shown in Formula (5):
where Icf1 is the prevailing tourism supply; Icf2 is the tourism accommodation offer intensity; Icf3 is the material cultural heritage endowment; Icf4 is the station intensity for passenger transport; Icf5 is the local public transport offer. For this purpose, the Effective Carrying Capacity (ECC) is given by the Formula (6):
ECC = f (RCC, IEI)
In the geographical-territorial model, the ECC is, therefore, the result of a serial site's capacity to accommodate tourist demand, considering both the environmental and infrastructural territorial characteristics. Its estimation represents the actual and weighted measure of the tourism carrying capacity (TCC), obtained through a gradual process of geographical-territorial adaptation of the model proposed by Cifuentes [48]. In line with existing literature, this study treats the terms ECC and TCC as interchangeable.
3.2.4. The Correction System Based on EEI and IEI: Indicators, Weighting, and Spatial Representation
The use of the Ecological Endowment Composite Index (EEI) and the Infrastructure Endowment Composite Index (IEI) enables the adjustment of the various levels of carrying capacity, ultimately deriving the ECC for each municipality and each area.
The estimates were conducted based on the construction of a database developed using statistical information available from official secondary sources (Table 2).
It is important to note that the analytical model required the search and selection of a significant volume of data, which was not always fully reflected in the available sources. The collected data exhibit adequate coverage and territorial representativeness at the municipal level. Furthermore, to enable the implementation of the spatial analysis approach, the data were precisely georeferenced across the territory.
The selection of the indicators used to construct the correction factors took into account, in the context of complex territorial systems characterized by varying degrees of tourism exposure, the multidimensionality of tourism impacts [25,25,26,29,30,30,89,113,114,115,116,117,118]. The indicators provide raw data on environmental, anthropic, and infrastructural components, elaborated at the municipal scale. Adopting a coherent approach in relation to the phenomenon being measured, the polarity of each elementary indicator was defined.
The EEI and IEI are calculated as the sum of normalized indicators on a scale from 0 to 1 and recalibrated through the assignment of weights.
The spatial representation of the two indices (Figure 3 and Figure 4) provides an informative framework that enables the development of preliminary observations on the territorial and tourism-related aspects of the area influenced by the “Via Appia, Regina Viarum”. In both cases, the different shades of color used in the maps reflect variations in endowment levels: darker colors indicate areas with higher endowment, while lighter colors represent zones with lower endowment. This representation facilitates the visual analysis of areas with greater potential to support the tourism development of the Via Appia, while also serving as a useful tool for interpreting the spatial distribution of ecological and infrastructural resources.
3.3. Dynamic Estimation of Tourism Carrying Capacity
The methodology has been further developed to account for the dynamic nature of the TCC tool.
The aim of this research is to test the tourism absorption capacities of the areas that compose a serial site. In particular, it is assumed that tourist pressure on territorial endowments (both infrastructural and ecological) will progressively increase over time.
Therefore, through the application of specific variation coefficients in the growth of tourist arrivals and bed places, modifications are induced in the PCC values of the municipalities. In contrast, the respective ecological and infrastructural correction factors, described by the EEI and IEI indices, are kept constant over time, acting as parameters to determine the threshold values. Building on these assumptions, the procedural framework of the three levels of carrying capacity—physical (PCC), real (RCC), and effective (ECC)—facilitates the evaluation of the territories' ability to absorb potential increases in tourism over time, under various scenario conditions.
Thus, the scenario assumptions enable the estimation of the different reactions in the ECC of the areas comprising the serial site observed in the following years. This analysis identifies the decade 2024-2034 as the forecast period for estimating the effects of UNESCO recognition.
The ECC, as the PCC, is expressed in percentage terms, values exceeding 100% represent situations of congestion and overuse:
- ECC <20% Very low impact;
- 21% ≤ ECC <40% Low impact;
- 41% ≤ ECC <60% Moderate impact;
- 61% ≤ ECC <80% High impact;
- 81%≤ ECC<100 Very high impact;
- ECC ≥100 Congestion and overuse
3.3.1. Scenario 1 - Ordinary Dynamics
Scenario 1 - Ordinary Dynamics considers the evolution of the ECC in absence of specific policies aimed at fostering tourism growth. This Scenario projects the trends in tourism demand and accommodation supply observed during the 2014-2019 period onto the forecasting period. This choice reflects the researchers' intent to present a measure as neutral as possible regarding the consequences of the SARS-CoV-2 pandemic. The assumption is that during the forecast period, the system will continue to exhibit five-year growth trends of 7.3% in bed capacity and 7.9% in tourist arrivals for the hotel sector, and 30.2% and 30.7%, respectively, for the accommodation sector (including both hotel and extra hotel facilities). Scenario 1 is represented by the following formula (7) – (8):
where eNS is estimated nights spent at tourist accommodation establishments; eBP is estimated bed places in tourist accommodation establishment; Trend represents trend of nights spent and bed places based on ISTAT data 2014-2019 [106]; Cf are the correction factors used for the calculation of the EEI and IEI.
ECC2029= f (eNS2024, eBP2024, Trend2019-2024, Cf)
ECC2034= f (eNS2029, eBP2029, Trend2019-2024, Cf)
In order to assess the impact of UNESCO recognition on the evolution of ECC, adjustments were made to the trends of Scenario 1, and two additional scenarios were proposed, as described below.
3.3.2. Scenario 2 - UNESCO Effect
The Scenario 2 – UNESCO effect examines the evolution of ECC following the potential increase in pressure resulting from the site's designation as a World Heritage Site. Scenario 2 assumes that, with UNESCO recognition, the ECC will grow at a more pronounced rate compared to Scenario 1. The developing of this Scenario based on tourism trends observed in similar serial sites. This led to the formulation of a five-year growth coefficient of 18.75%, defined within the study as the UNESCO Coefficient (CUNESCO). Scenario 2 is expressed by the following Formulae (9) (10):
where eNS is estimated nights spent at tourist accommodation establishments; eBP is estimated bed places in tourist accommodation establishment; Trend represents trend of nights spent and bed places based on ISTAT data 2014-2019; Cf are the correction factors used for the calculation of the EEI and IEI; CUNESCO represents a five-year growth coefficient of 18.75 percent.
ECC2029= f (eNS2024, eBP2024, Trend2019-2024, Cf, CUNESCO)
ECC2034= f (eNS2029, eBP2029, Trend2019-2024, Cf, CUNESCO)
3.3.3. Scenario 3 - Overflowing/Stress Test
Scenario 3 - Overflowing/ Stress test explores the hypothesis that the ECC, in the presence of UNESCO recognition, grows to such an extent that it pushes the territorial tourism hospitality systems towards a situation of widespread overflowing. In order to analyze Scenario 3 a five-year growth coefficient of 50% was applied, referred to in this study as the Overflowing Coefficient (COVERFLOWING). Scenario 3 is expressed by the following formula (11) – (12):
where eNS is estimated nights spent at tourist accommodation establishments; eBP is es-timated bed places in tourist accommodation establishment; Trend represents trend of nights spent and bed places based on ISTAT data 2014-2019 [107]; Cf are the correction factors used for the calculation of the EEI and IEI; Coverflowingrepresents a five-year growth coefficient of 50 percent.
ECC2029= f (eNS2024, eBP2024, Trend2019-2024, Cf, Coverflowing)
ECC2034= f (eNS2029, eBP2029, Trend2019-2024, Cf, Coverflowing)
4. Results
Table 3 and Table 4 show the values obtained from applying the TCC calculation method to each of the 13 areas and to the entire area of influence of the Via Appia. The first two columns report the trends in tourist arrivals and bed availability for the period 2014–2019; the following columns show the PCC values calculated for the years 2014 and 2019. The last three columns present the ECC values obtained for the different scenarios considered over the time intervals 2019–2024, 2024–2029, and 2029–2034.
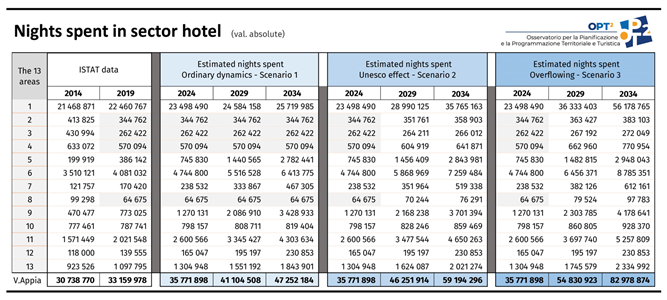
The first step of the analysis involved calculating the PCC as the initial step in determining the ECC. The PCC was calculated for: i) the total set of accommodation facilities; ii) the hotel sector; iii) the non-hotel sector. The calculation was performed separately for each category. However, the discussion focuses on the first two categories, and the cartographic representation of the tourist load is based on the PCC calculated for the hotel sector. This is due to the greater structural rigidity of the hotel sector in responding to fluctuations in tourist demand, which generally requires longer planning and adaptation times. The lower resilience of the hotel supply is clearly visible when comparing the trends reported in the first two columns of Table 3 and Table 4. The latter also provides the specific ECC values calculated based on the physical carrying capacity of the hotel sector.
For the year 2019 only, the PCC corresponds to the ECC. The estimated tourist load is 26.5% (Table 3). It is important to note that in the same year, tourist arrivals across the entire accommodation system exceeded 48 million, with the Rome area (Area 1) alone accounting for 68%. Overall, tourist arrivals in the influence area increased by +30% compared to 2014 (36.7 million) (Table A1). Figure 5 shows the spatial distribution of tourist carrying capacity values in the territory in 2019, highlighting the differences between the 13 areas and among individual municipalities. As previously mentioned, the cartographic evidence illustrates the results obtained starting from the hotel PCC. The color scale uses increasingly intense shades of orange to represent higher levels of tourist load. These figures highlight a highly heterogeneous territorial configuration of tourist demand, with a discontinuous tourism space [119], in which areas and municipalities show very different current levels of tourism exposure. Data on actual and estimated tourist arrivals, in absolute values, are provided in the Appendix B section (Table A1 and Table A2).
Starting from this baseline, what changes in tourism load levels could be observed at area and municipal scales under different scenario assumptions? Figure 6 illustrates the spatial distribution of the ECC estimated under the “Ordinary Dynamics” scenario in 2034, developed on the basis of the hotel PC. In this case, tourist arrivals and bed availability were increased based on trends recorded in previous years. Forecasted tourist arrivals are expected to reach approximately 107.3 million by 2034 (Table A1). As before, the territorial distribution is shown for the 13 areas and the municipalities within the scope.
The increase in tourist arrivals within the system results in moderate variations in territorial tourism load. Indeed, during the periods 2019–2024, 2024–2029, and 2029–2034, the carrying capacity remains between 26.6% and 26.8% when calculated using the PCC of all accommodation facilities (Table 3); and ranges between 39.1% and 39.6% when using the PCC of the hotel sector alone (Table 4). In both cases, the carrying capacity remains within low-impact levels.
At the area level the increase in tourism load is more pronounced in the Capua Area (Area 6), where the ECC would rise from a Moderate impact in 2019 (41.0%) to a High impact in 2034 (76.9%) (Table 3). When limiting the analysis to the initial PCC values of the hotel sector, the scenario immediately appears more critical in some areas. In this case, tourist arrivals in 2034 would reach about 47.2 million (Table A2). The Domitian Area (Area 5) would see the tourism load rise to 85.2%, while Area 9 would reach 108.7% (Table 4; Figure 6). In Area 5, increased tourist flows would compound an already high population density, further raising the territorial tourism load. Conversely, Area 9, which includes the Matera region, is more likely to face congestion and overuse risks due to limited initial infrastructure. However, such risks would only materialize if the tourist growth trend initiated by the "Matera European Capital of Culture" experience continues.
In all other areas, the tourism load on the territory remains at less significant levels. This is also reflected at the municipal level. In some cases, tourism movements—combined with low estimated flows and the territorial characteristics described by the EEI and IEI indices—suggest a higher absorption capacity of the areas.
Figure 7 shows the spatial distribution of ECC values estimated under the “UNESCO effect” scenario, with projections for 2034 based on the hotel PCC. The application of the variation coefficient associated with the UNESCO effect results in an incremental estimate of tourist arrivals during the forecast periods, reaching approximately 140.3 million in the Appia’s influence area (Table A1). Even in this case, considering the area as a whole and using different calculation bases, the increase in tourism load remains compatible with existing ecological and infrastructural capacities. Over the projected periods, territorial ECC increases from 26.6% to 35.1% (Table 3), and from 39.1% to 54.5% (Table 4). This latter value indicates a Moderate impact condition on the territorial system.
The area-level detail would show differentiated trends, with some areas experiencing a sharper increase in tourism load. On the one hand, areas already found to be more sensitive under Scenario 1 would naturally see a worsening of their load conditions by 2034. On the other hand, the territorial absorption capacity would vary, with a rapid increase in load in Areas 5, 7 and 9, leading to Moderate impact levels, while Area 6 reaches an overflowing condition when considering the PCC of the overall accommodation system (Table 3).
The 2034 projection, based on hotel PCC, results in two areas reaching higher levels of congestion and overuse of territorial resources (Areas 5 and 9) (Figure 7; Table 4). The UNESCO coefficient leads to an estimate of tourist arrivals around 59.1 million (Table A2). These greater flows would increase the number of municipalities experiencing Very High Impact conditions or even surpassing 100% of ECC, beyond those previously identified, signaling stronger tensions between tourism growth and the absorption capacity of local resources (Figure 7).
Finally, Figure 8 highlights ECC levels estimated under the extreme Overflowing/Stress Test scenario, assuming the hotel PCC as the reference baseline for calculations. This scenario serves to test the resilience of the territorial system in the face of exceptional tourist pressures. Here, the variation coefficient brings tourist arrivals up to approximately 205 million in 2034 (Table A1). In that year, territorial carrying capacity would reach 51.3% when using the PCC of all accommodation facilities—still within a Moderate impact range (Table 3); but would climb to 84.8% when based on hotel PCC, indicating a significant risk of congestion and overuse of local resources (Table 4). At the same time, the uneven distribution of ecological-infrastructural endowments would increase the number of areas—and particularly municipalities—exceeding critical thresholds of tourism load.
5. Discussion and Conclusion
This article introduced a methodology for estimating the tourism carrying capacity (TCC) of large-scale distributed sites. The model is defined as “geographical-territorial” because it proposes an estimation of carrying capacity attributed to the territorial (municipal) scale, rather than being limited to the analysis of individual tourist sites. To this end, it draws inspiration from the Cifuentes model, which adopts an ecosystem-based and process-oriented approach, considering the TCC (or ECC – Environmental Carrying Capacity) as the result of complex and interdependent dynamics.
The evaluations derived from the model and related scenarios provide a nuanced analytical framework, offering valuable insights for further exploration. Nevertheless, some evaluative and operational implications can already be highlighted. The model generates time-dependent ECC values; the scenarios illustrate how municipalities and areas respond to induced increases in tourist flows. However, the results are strongly influenced by the EEI and IEI indices, which reflect the characteristics and capacities of the territory at the time of the model's construction and remain fixed in future projections. This is a crucial aspect, as it clearly demonstrates that the TCC is influenced—either separately or in combination—by both the intensity of tourism demand and the characteristics and capabilities of the territorial supply system.
The granular evaluations derived from the model and related scenarios provide a nuanced analytical framework, offering valuable insights for further exploration. Nevertheless, some evaluative and operational implications can already be highlighted. The model generates time-dependent ECC values; the scenarios illustrate how municipalities and areas respond to induced increases in tourist flows. However, the results are strongly influenced by the EEI and IEI indices, which reflect the characteristics and capacities of the territory at the time of the model's construction and remain fixed in future projections. This is a crucial aspect, as it clearly demonstrates that the TCC is influenced—either separately or in combination—by both the intensity of tourism demand and the characteristics and capabilities of the territorial supply system.
These differing reactions correspond to distinct planning tasks and objectives in both tourism and territorial domains. On the one hand, there is a need to systematically mitigate the multidimensional impacts of tourism by strategically strengthening and effectively optimizing infrastructure and services at multiple levels. On the other hand, it is essential to promote diversified tourism development in less exposed areas, creating the necessary conditions not only for such development to occur but also for it to be sustainable over time. This includes preserving and enhancing local resources while minimizing environmental and community impacts.
Accordingly, it is crucial to adopt a systemic vision, planning for an integrated territorial offer that enables a balanced distribution of tourist flows, harmonizing the different dimensions of sustainability and capitalizing on the opportunities arising from the deconcentration of high-pressure destinations. From this perspective, strengthening monitoring and evaluation systems is also essential to support informed intervention strategies and ensure adequate adaptive capacity over time.
From an operational standpoint, the model presents room for improvement, which can be leveraged through the integration of additional indicators and alternative statistical sources. During its construction, the model encountered some limitations primarily related to the availability, update frequency, and territorial coverage of data. In many cases, information was not available at the municipal level and, where it was, coverage was not uniform across all municipalities. Furthermore, actual tourism demand is likely underestimated, as the analysis could not account for excursionists or the seasonal variability of tourism flows.
Nevertheless, these limitations can be addressed by expanding and enriching the information base. The integration of new indicators and alternative data sources would enhance the depth and multidimensionality of the territorial endowment indices, while also improving the accuracy of the estimates. Additionally, it would allow the model to be applied at finer spatial resolutions—both below the municipal scale and to differentiated territorial aggregations.
Tourism planning is not an autonomous or isolated process from territorial planning, which is based on an integrated vision of the area’s environmental, cultural, socioeconomic, and settlement resources, as well as on the democratic and participatory involvement of local communities in decision-making processes. In tourism areas, the concept of tourism carrying capacity plays a critical role, as it provides a useful tool for translating the inherently abstract notion of sustainability into measurable operational parameters—both qualitatively and quantitatively, and in relation to spatial dimensions.
Within this perspective, TCC—when embedded in a coherent planning framework—serves as an essential operational mechanism for translating the principle of sustainability into concrete, manageable metrics. It contributes to regulating tourism pressure on sites and destinations and supports the activation of feedback loops for continuous monitoring and adaptive management of tourism strategies. Similarly, strategic planning, by supporting a systemic and long-term vision articulated through a coherent sequence of goals and actions, becomes a key activity for guiding the orderly transformation of territories and their tourism development, while mitigating the negative impacts of uncontrolled tourism growth.
Author Contributions
Conceptualization, M.B., V.E., L.V.; Methodology, M.B., V.E., L.V.; Data curation, L.V.; Formal analysis, V.E., L.V.; Theoretical framework, M.B., V.E., A.S., A.C.; Writing – original draft, V.E., A.S., A.C.; Writing – review and editing, M.B., V.E., L.V., A.S., A.C. All authors have read and agreed to the published version of the manuscript.
Funding
This research received no external funding
Institutional Review Board Statement
Not applicable.
Informed Consent Statement
Not applicable.
Data Availability Statement
All datasets used in this study are properly cited within the article. Further data supporting the findings of this study are available from the corresponding author (lvalanzano@unisa.it), who is solely responsible for matters related to the data, upon reasonable request.
Conflicts of Interest
The authors declare no conflicts of interest.
Abbreviations
The following abbreviations are used in this manuscript:
| BP | Bed Places |
| Cf | Correction factors (generic, including Ecf and Icf) |
| Coverflowing | Overflowing Coefficient |
| CUNESCO | UNESCO Coefficient |
| DPa | Bed places Available |
| ECC | Effective (o Admissible) Carrying Capacity (synonymous of TCC) |
| Ecf | Ecological correction factors |
| EEI | Ecological Endowment composite index |
| eNS | Estimated Nights Spent |
| EUAP2010 | Elenco Ufficiale delle Aree Protette |
| GOr | Gross Occupancy rate |
| Icf | Infrastructure correction factors |
| IEI | Infrastructure Endowment composite index |
| ISPRA | Istituto Superiore per la Protezione e la Ricerca Ambientale |
| ISTAT | Istituto Nazionale di Statistica |
| LPT | Local Public Transport |
| MiC | Ministero della Cultura |
| MSW | Municipal Solid Waste |
| NS | Nights Spent |
| PCC | Physical Carrying Capacity |
| RCC | Real Carrying Capacity |
| RFI | Rete Ferroviaria Italiana |
| SARS-CoV-2 | Severe Acute Respiratory Syndrome COronaVirus 2 |
| TCC | Tourism Carrying Capacity |
| UNESCO | United Nations Educational, Scientific and Cultural Organization |
Appendix B

Table A1.
Nights spent in total accommodation establishments. Source: Authors’ elaboration.
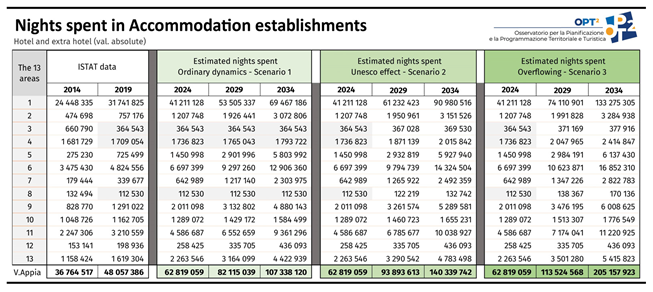
Table A2.
Night spent in hotel. Source: Authors’ elaboration.
References
- Milano, C.; Novelli, M.; Cheer, J.M. Overtourism and Tourismphobia: A Journey Through Four Decades of Tourism Development, Planning and Local Concerns. Tourism Planning & Development 2019, 16, 353–357. [CrossRef]
- Wall, G. From Carrying Capacity to Overtourism: A Perspective Article. Tourism Review 2020, 75, 212–215.
- Rogerson, C.M.; Baum, T. COVID-19 and African Tourism Research Agendas. Development Southern Africa 2020, 37, 727–741. [CrossRef]
- Butler, R.W.; Dodds, R. Overcoming Overtourism: A Review of Failure. Tourism Review 2022, 77, 35–53.
- Page, S.J.; Duignan, M. Progress in Tourism Management: Is Urban Tourism a Paradoxical Research Domain? Progress since 2011 and Prospects for the Future. Tourism Management 2023, 98, 104737.
- Milano, C.; Novelli, M.; Russo, A.P. Anti-Tourism Activism and the Inconvenient Truths about Mass Tourism, Touristification and Overtourism. Tourism Geographies 2024, 26, 1313–1337. [CrossRef]
- Hall, C.M.; Page, S.J. The Geography of Tourism and Recreation: Environment, Place and Space; Fourth edition.; Routledge: New York, 2014; ISBN 978-0-415-83398-1.
- Saarinen, J.; Rogerson, C.M.; Hall, C.M. Geographies of Tourism Development and Planning. Tourism Geographies 2017, 19, 307–317.
- Shoval, N. Urban Planning and Tourism in European Cities. Tourism Geographies 2018, 20, 371–376. [CrossRef]
- Costa, C. Tourism Planning: A Perspective Paper. Tourism review 2020, 75, 198–202.
- Bramwell, B.; Lane, B. Critical Research on the Governance of Tourism and Sustainability. Journal of Sustainable Tourism 2011, 19, 411–421. [CrossRef]
- Dredge, D.; Jamal, T. Progress in Tourism Planning and Policy: A Post-Structural Perspective on Knowledge Production. Tourism Management 2015, 51, 285–297.
- Blázquez-Salom, M.; Blanco-Romero, A.; Vera-Rebollo, F.; Ivars-Baidal, J. Territorial Tourism Planning in Spain: From Boosterism to Tourism Degrowth? In Tourism and Degrowth; Routledge, 2020; pp. 20–41.
- Bencardino, M.; Esposito, V. Il Turismo Costiero e Marittimo Meridionale: Una Analisi Di Base per Le Nuove Politiche Turistiche. Annali del turismo 2023, 93–108.
- Klepej, D.; Marot, N. Considering Urban Tourism in Strategic Spatial Planning. Annals of Tourism Research Empirical Insights 2024, 5, 100136. [CrossRef]
- Coccossis, H.; Mexa, A. Tourism Carrying Capacity: Methodological Considerations. In The Challenge of Tourism Carrying Capacity Assessment; Routledge, 2017; pp. 71–106.
- Li, J.; Weng, G.; Pan, Y.; Li, C.; Wang, N. A Scientometric Review of Tourism Carrying Capacity Research: Cooperation, Hotspots, and Prospect. Journal of Cleaner Production 2021, 325, 129278.
- Ajuhari, Z.; Aziz, A.; Yaakob, S.S.N.; Abu Bakar, S.; Mariapan, M. Systematic Literature Review on Methods of Assessing Carrying Capacity in Recreation and Tourism Destinations. Sustainability 2023, 15, 3474.
- Wang, J.; Huang, X.; Gong, Z.; Cao, K. Dynamic Assessment of Tourism Carrying Capacity and Its Impacts on Tourism Economic Growth in Urban Tourism Destinations in China. Journal of Destination Marketing & Management 2020, 15, 100383.
- Navarro Jurado, E.; Tejada Tejada, M.; Almeida García, F.; Cabello González, J.; Cortés Macías, R.; Delgado Peña, J.; Fernández Gutiérrez, F.; Gutiérrez Fernández, G.; Luque Gallego, M.; Málvarez García, G. Carrying Capacity Assessment for Tourist Destinations. Methodology for the Creation of Synthetic Indicators Applied in a Coastal Area. 2012.
- Lima, A.; Nunes, J.C.; Brilha, J. Monitoring of the Visitors Impact at “Ponta Da Ferraria e Pico Das Camarinhas” Geosite (São Miguel Island, Azores UNESCO Global Geopark, Portugal). Geoheritage 2017, 9, 495–503. [CrossRef]
- Salerno, F.; Viviano, G.; Manfredi, E.C.; Caroli, P.; Thakuri, S.; Tartari, G. Multiple Carrying Capacities from a Management-Oriented Perspective to Operationalize Sustainable Tourism in Protected Areas. Journal of environmental management 2013, 128, 116–125.
- Putri, I.A.S.L.P.; Ansari, F. Managing Nature-Based Tourism in Protected Karst Area Based on Tourism Carrying Capacity Analysis. Journal of Landscape Ecology 2021, 14, 46–64. [CrossRef]
- Fernández-Villarán, A.; Espinosa, N.; Abad, M.; Goytia, A. Model for Measuring Carrying Capacity in Inhabited Tourism Destinations. Port Econ J 2020, 19, 213–241. [CrossRef]
- Zekan, B.; Weismayer, C.; Gunter, U.; Schuh, B.; Sedlacek, S. Regional Sustainability and Tourism Carrying Capacities. Journal of Cleaner Production 2022, 339, 130624.
- ESPON, E. Carrying Capacity Methodology for Tourism. Final Report, ESPON 2020, 66.
- Indicators of Sustainable Development for Tourism Destinations A Guidebook (English Version); World Tourism Organization (UNWTO), Ed.; World Tourism Organization (UNWTO), 2004; ISBN 978-92-844-0726-2.
- Kristjánsdóttir, K.R.; Ólafsdóttir, R.; Ragnarsdóttir, K.V. Reviewing Integrated Sustainability Indicators for Tourism. Journal of Sustainable Tourism 2018, 26, 583–599. [CrossRef]
- Miller, G.; Torres-Delgado, A. Measuring Sustainable Tourism: A State of the Art Review of Sustainable Tourism Indicators. Journal of Sustainable Tourism 2023, 31, 1483–1496. [CrossRef]
- Esposito, V.; Maselli, G.; Nesticò, A.; Bencardino, M. Spatial Analysis of Tourism Pressure on Coastal and Marine Ecosystem Services. In Proceedings of the Networks, Markets & People; Calabrò, F., Madureira, L., Morabito, F.C., Piñeira Mantiñán, M.J., Eds.; Springer Nature Switzerland: Cham, 2024; pp. 512–522.
- Mandić, A.; Marković Vukadin, I. Managing Overtourism in Nature-Based Destinations. In Mediterranean Protected Areas in the Era of Overtourism; Mandić, A., Petrić, L., Eds.; Springer International Publishing: Cham, 2021; pp. 45–70 ISBN 978-3-030-69192-9.
- Peihong, W.; Kai, W.; Kerun, L.; Shufang, F. An Evaluation Model for the Recreational Carrying Capacity of Urban Aerial Trails. Tourism Management Perspectives 2023, 48, 101152. [CrossRef]
- UNESCO The Operational Guidelines for the Implementation of the World Heritage Convention Available online: https://whc.unesco.org/en/guidelines/ (accessed on 23 June 2025).
- UNWTO Saturation of Tourist Destinations: Report of the Secretary General 1981.
- Mexa, A.; Coccossis, H. Tourism Carrying Capacity: A Theoretical Overview. The challenge of tourism carrying capacity assessment 2017, 53–70.
- Zacarias, D.A.; Williams, A.T.; Newton, A. Recreation Carrying Capacity Estimations to Support Beach Management at Praia de Faro, Portugal. Applied Geography 2011, 31, 1075–1081.
- Swarbrooke, J. Sustainable Tourism Management. CABI. The Three Dimensions of Sustainable Tourism 1999, 47–69.
- Costa, P.; Van Der Borg, J. Un Modello Lineare per La Programmazione Del Turismo. COSES informazioni 1988, 32, 21–26.
- Mathieson, A.; Wall, G. Tourism, Economic, Physical and Social Impacts.; 1982;
- Saveriades, A. Establishing the Social Tourism Carrying Capacity for the Tourist Resorts of the East Coast of the Republic of Cyprus. Tourism management 2000, 21, 147–156.
- Chen, C.-L.; Teng, N. Management Priorities and Carrying Capacity at a High-Use Beach from Tourists’ Perspectives: A Way towards Sustainable Beach Tourism. Marine Policy 2016, 74, 213–219.
- Brown, K.; Turner, R.K.; Hameed, H.; Bateman, I.A.N. Environmental Carrying Capacity and Tourism Development in the Maldives and Nepal. Environmental Conservation 1997, 24, 316–325.
- Wagar, J.A. The Carrying Capacity of Wild Lands for Recreation. Forest Science 1964, 10, a0001-24.
- Lime, D.W. Research for Determining Use Capacities of the Boundary Waters Canoe Area. Naturalist 1970, 21, 9–13.
- Getz, D. Capacity to Absorb Tourism. Annals of Tourism Research 1983, 10, 239–263. [CrossRef]
- Interministerial Council for Tourism. (2017). Dossier de Presse – Interministerial Council for Tourism. Matignon Press Office.
- O’Reilly, A.M. Tourism Carrying Capacity: Concept and Issues. Tourism management 1986, 7, 254–258.
- Cifuentes, M. Determinación de Capacidad de Carga Turística Enáreas Protegidas; Bib. Orton IICA/CATIE, 1992;
- Morales, M.E.; Aguilar, N.; Cancino, D.; Ramirez, C.; Ribeiro, N.; Sandoval, E.; Turcios, M. Capacidad de Carga Turistica de Las Areas de Uso Publico Del Monumento Nacional de Guayabo, Costa Rica. 1999.
- Amador, E.; Cayot, L.; Cifuentes, M.; Cruz, E.; Cruz, F.; Ayora, P. Determinación de La Capacidad de Carga Turística En Los Sitios de Visita Del Parque Nacional Galápagos. Servicio Parque Nacional Galápagos, Ecuador. 42p 1996.
- Maldonado, E.; Montagnini, F. Determinación de La Capacidad de Carga Turística Del Parque Nacional La Tigra Tegucigalpa, Honduras. Revista Forestal Centroamericana Volumen 10, número 34 (abril-junio 2001), páginas 47-51 2001.
- ORTIZ, C.D.R.C.; MORA, Z.J. Guía Metodológica Para El Monitoreo Impactos Del Ecoturismo y Determinar Capacidad de Carga Aceptable En La Unidad de Parques Nacionales Naturales de Colombia.
- Rocha, C.H.B.; Fontoura, L.M.; Vale, W.B.D.; Castro, L.F.D.P.; Da Silva, A.L.F.; Prado, T.D.O.; Da Silveira, F.J. Carrying Capacity and Impact Indicators: Analysis and Suggestions for Sustainable Tourism in Protected Areas – Brazil. World Leisure Journal 2021, 63, 73–97. [CrossRef]
- Erdoğan, A. Revisiting Cifuentes’s Model for Cultural Heritage Tourism in the Era of Pandemics: The Site of Mardin Cultural Landscape Area. Journal of Quality Assurance in Hospitality & Tourism 2025, 26, 80–110. [CrossRef]
- Vanhove, N. Mass Tourism: Benefits and Costs. Tourism, development and growth: The challenge of sustainability 1997, 50–77.
- Tosun, C.; Jenkins, C.L. The Evolution of Tourism Planning in Third-World Countries: A Critique. Progr. Tourism Hospit. Res. 1998, 4, 101–114. [CrossRef]
- Arnegger, J.; Woltering, M.; Job, H. Toward a Product-Based Typology for Nature-Based Tourism: A Conceptual Framework. Journal of Sustainable Tourism 2010, 18, 915–928. [CrossRef]
- Gössling, S.; Scott, D.; Hall, C.M. Pandemics, Tourism and Global Change: A Rapid Assessment of COVID-19. Journal of Sustainable Tourism 2021, 29, 1–20. [CrossRef]
- Pearce, D.G. Tourist Development; Longman Scientific & Technical, 1989; ISBN 978-0-582-01435-0.
- Meadows, D. H., Meadows, D. L., Randers, J., & Behrens, W. W. (2018). The Limits to Growth. In Green Planet Blues (Pp. 25-29). Routledge.
- Doxey, G.V. A Causation Theory of Visitor-Resident Irritants: Methodology and Research Inferences. In Proceedings of the Travel and tourism research associations sixth annual conference proceedings; San Diego, 1975; Vol. 3, pp. 195–198.
- Boissevain, J. Tourism and Development in Malta. Development and Change 1977, 8, 523–538. [CrossRef]
- Williams, T.A. Impact of Domestic Tourism on Host Population: The Evolution of a Model. Tourism Recreation Research 1979, 4, 15–21. [CrossRef]
- Butler, R.W. 1. The Concept of a Tourist Area Cycle of Evolution: Implications for Management of Resources. In The Tourism Area Life Cycle, Vol. 1; Butler, R., Ed.; Multilingual Matters, 2006; pp. 3–12 ISBN 978-1-84541-027-8.
- Stamatiou, K. Bridging the Gap between Tourism Development and Urban Planning: Evidence from Greece. Sustainability 2024, 16, 6359.
- Murphy, P.E. Tourism: A Community Approach 1985.
- Getz, D. Tourism Planning and Research: Traditions, Models and Futures. In Proceedings of the Australian Travel Research Workshop, Bunbury, Western Australia; 1987; Vol. 5.
- Gunn, C.A. Tourism Planning.; 1988;
- Inskeep, E. Tourism Planning: An Integrated and Sustainable Development Approach; John Wiley & Sons, 1991;
- Saarinen, J. Traditions of Sustainability in Tourism Studies. Annals of tourism research 2006, 33, 1121–1140.
- Sumner, E.L. Special Report on a Wildlife Study of the High Sierra in Sequoia and Yosemite National Parks and Adjacent Territory; US Department of the Interior, National Park Service, 1936;
- Manning, R.E. How Much Is Too Much? Carrying Capacity of National Parks and Protected Areas. In Proceedings of the Monitoring and management of visitor flows in recreational and protected areas. Proceedings of the Conference held at Bodenkultur University Vienna, Austria; 2002; pp. 306–313.
- Lucas, R.C. The Recreational Capacity of the Quetico-Superior Area; Lake States Forest Experiment Station, Forest Service, US Department of …, 1964; Vol. 15;.
- Lucas, R.C. Wilderness Perception and Use: The Example of the Boundary Waters Canoe Area. Natural Resources Journal 1964, 3, 394–411.
- McMurry, K.C. THE USE OF LAND FOR RECREATION. Annals of the Association of American Geographers 1930, 20, 7–20. [CrossRef]
- Wolfe, R.I. WASAGA BEACH: THE DIVORCE FROM THE GEOGRAPHIC ENVIRONMENT. Canadian Geographies / Géographies canadiennes 1952, 1, 57–66. [CrossRef]
- Koens, K.; Postma, A.; Papp, B. Is Overtourism Overused? Understanding the Impact of Tourism in a City Context. Sustainability 2018, 10, 4384.
- Dodds, R.; Butler, R. The Phenomena of Overtourism: A Review. International Journal of Tourism Cities 2019, 5, 519–528.
- Chen, L.I.; Sheng-kui, C.; Yuan-sheng, C. A Review of the Study of China’s Tourism Carrying Capacity in the Past Two Decades. Geographical Research 2009, 28, 235–245.
- Stankey, G.H.; Cole, D.N.; Lucas, R.C.; Petersen, M.E.; Frissell, S.S. The Limits of Acceptable Change (LAC) System for Wilderness Planning. Gen. Tech. Rep. INT-GTR-176. Ogden, UT: US Department of Agriculture, Forest Service, Intermountain Forest and Range Experiment Station. 37 p. 1985, 176.
- Graefe, A.; Kuss, F.R.; Vaske, J.J. Visitor Impact Management: The Planning Framework. (No Title) 1990.
- Manning, R.E.; Lime, D.W.; Hof, M.; Freimund, W.A. The Visitor Experience and Resource Protection (VERP) Process: The Application of Carrying Capacity to Arches National Park. In Proceedings of the The George Wright Forum; JSTOR, 1995; Vol. 12, pp. 41–55.
- McCool, S.F.; Lime, D.W. Tourism Carrying Capacity: Tempting Fantasy or Useful Reality? Journal of Sustainable Tourism 2001, 9, 372–388. [CrossRef]
- World Commission on Environment and Development. (1987). Our Common Future. Oxford University Press.
- Butler, R.W. Sustainable Tourism: A State-of-the-art Review. Tourism Geographies 1999, 1, 7–25. [CrossRef]
- Gössling, S. New Performance Indicators for Water Management in Tourism. Tourism Management 2015, 46, 233–244.
- Richards, G. Cultural Tourism: A Review of Recent Research and Trends. Journal of hospitality and tourism management 2018, 36, 12–21.
- Streimikiene, D.; Svagzdiene, B.; Jasinskas, E.; Simanavicius, A. Sustainable Tourism Development and Competitiveness: The Systematic Literature Review. Sustainable Development 2021, 29, 259–271. [CrossRef]
- Saarinen, J. Tourism for Change: Change Management towards Sustainable Tourism Development. In Tourism, change and the Global South; Routledge, 2021; pp. 15–32.
- Hall, C.M. Tourism Planning: Policies, Processes and Relationships; Themes in tourism; 2. ed.; Prentice Hall: Harlow Munich, 2008; ISBN 978-0-13-204652-7.
- Inskeep, E. Tourism Planning: An Emerging Specialization. J. of the Am. Planning Association 1988, 54, 360–372. [CrossRef]
- Hall, C.M. Tourism Planning: Policies, Processes and Relationships; Pearson education, 2008;
- Coccossis, H. Sustainable Development and Tourism: Opportunities and Threats to Cultural Heritage from Tourism. In Cultural tourism and sustainable local development; Routledge, 2016; pp. 65–74.
- Baud-Bovy, M. New Concepts in Planning for Tourism and Recreation. Tourism Management 1982, 3, 308–313.
- Costa, C. An Emerging Tourism Planning Paradigm? A Comparative Analysis between Town and Tourism Planning. Journal of Tourism Research 2001, 3, 425–441. [CrossRef]
- Williams, P.W.; Gill, A. Tourism Carrying Capacity Management Issues. In Global tourism; Routledge, 2013; pp. 246–261.
- Butler, R.W. Tourism Carrying Capacity Research: A Perspective Article. Tourism Review 2020, 75, 207–211.
- Ruhanen *, L. Strategic Planning for Local Tourism Destinations: An Analysis of Tourism Plans. Tourism and Hospitality Planning & Development 2004, 1, 239–253. [CrossRef]
- Soteriou, E.C.; Coccossis, H. Integrating Sustainability into the Strategic Planning of National Tourism Organizations. Journal of Travel Research 2010, 49, 191–205. [CrossRef]
- Ladeiras, A.; Mota, A.; Costa, J. Strategic Tourism Planning in Practice: The Case of the Open Academy of Tourism. Worldwide Hospitality and Tourism Themes 2010, 2, 357–363. [CrossRef]
- Butler, R. Modelling Tourism Development: Evolution, Growth and Decline. Tourism development and growth. The challenge of sustainability 1997, 109–125.
- Simpson, K. Strategic Planning and Community Involvement as Contributors to Sustainable Tourism Development. Current Issues in Tourism 2001, 4, 3–41. [CrossRef]
- Hall, C.M. Changing Paradigms and Global Change: From Sustainable to Steady-State Tourism. Tourism Recreation Research 2010, 35, 131–143. [CrossRef]
- Alberti, M.P.P. Le Località Periferiche Del Turismo Secondo La" Teoria Delle Regioni Periferiche" Del Christaller. Bollettino della Società Geografica Italiana 1973, 381–384.
- Christaller, W. Die Zentralen Orte in Suddeutschland, Jena. Central Places in Southern Germany 1933.
- ISTAT―Istituto Nazionale Di Statistica. Available Online: Https://Esploradati.Istat.It/Databrowser/#/En (Accessed on 22 September 2022) Available online: https://esploradati.istat.it/databrowser/#/en (accessed on 23 June 2025).
- ISTAT―Istituto nazionale di statistica. Available online: https://www.istat.it/classificazione/principali-statistiche-geografiche-sui-comuni/ (accessed on 22 October 2022).
- ISPRA―Istituto Superiore per La Protezione e La Ricerca Ambientale. Available Online: Https://Www.Catasto-Rifiuti.Isprambiente.It/Index.Php?Pg= (Accessed on 22 September 2022) Available online: https://www.catasto-rifiuti.isprambiente.it/index.php?pg=&width=1920&height=1080 (accessed on 23 June 2025).
- ISTAT―Istituto nazionale di statistica. Available online: https://www.istat.it/statistiche-per-temi/focus/informazioni-territoriali-e-cartografiche/rappresentazioni-cartografiche-interattive/mappa-dei-rischi-dei-comuni-italiani/indicatori/ (accessed 22 September 2022).
- MiC―Ministero Della Cultura . Available Online: Http://Www.Sistan.Beniculturali.It/Servizi_aggiuntivi.Htm (Accessed on 23 September 2022). Available online: http://www.sistan.beniculturali.it/Servizi_aggiuntivi.htm (accessed on 23 June 2025).
- ISTAT―Istituto nazionale di statistica. Available online: https://www.istat.it/it/sistema-informativo-6/banca-dati-territoriale (accessed on 22 September 2022).
- RFI― Rete Ferroviaria Italiana SpA. Available online: https://www.rfi.it/it/stazioni.html (accessed on 22 October 2022) Available online: https://www.rfi.it/content/rfi/it/stazioni.html (accessed on 23 June 2025).
- McElroy, J.L.; De Albuquerque, K. Tourism Penetration Index in Small Caribbean Islands. Annals of tourism research 1998, 25, 145–168.
- Coccossis, H.; Mexa, A.; Collovini, A.; Parpairis, A.; Konstandoglou, M. Defining, Measuring and Evaluating Carrying Capacity in European Tourism Destinations. Environmental Planning Laboratory, Athens 2001.
- The European Tourism Indicator System: ETIS Toolkit for Sustainable Destination Management; European Commission, Ed.; Publications Office: Luxembourg, 2016; ISBN 978-92-79-55249-6.
- Leka, A.; Lagarias, A.; Panagiotopoulou, M.; Stratigea, A. Development of a Tourism Carrying Capacity Index (TCCI) for Sustainable Management of Coastal Areas in Mediterranean Islands–Case Study Naxos, Greece. Ocean & coastal management 2022, 216, 105978.
- Indicators of Sustainable Development for Tourism Destinations A Guidebook (English Version); World Tourism Organization (UNWTO), Ed.; World Tourism Organization (UNWTO), 2004; ISBN 978-92-844-0726-2.
- Castellani, V.; Sala, S.; Pitea, D. A New Method for Tourism Carrying Capacity Assessment. WIT Transactions on Ecology and the Environment 2007, 106, 365–374.
- Bencardino, M.; Esposito, V. Evaluation of Tourist Intensity in the South Italy and Empirical Evidence. In Networks, Markets & People; Calabrò, F., Madureira, L., Morabito, F.C., Piñeira Mantiñán, M.J., Eds.; Lecture Notes in Networks and Systems; Springer Nature Switzerland: Cham, 2024; Vol. 1184, pp. 319–330 ISBN 978-3-031-74607-9.
Figure 1.
From the 22 sections to be enhanced to the 13 gravitational areas. Source: Authors’ elaboration.
Figure 1.
From the 22 sections to be enhanced to the 13 gravitational areas. Source: Authors’ elaboration.
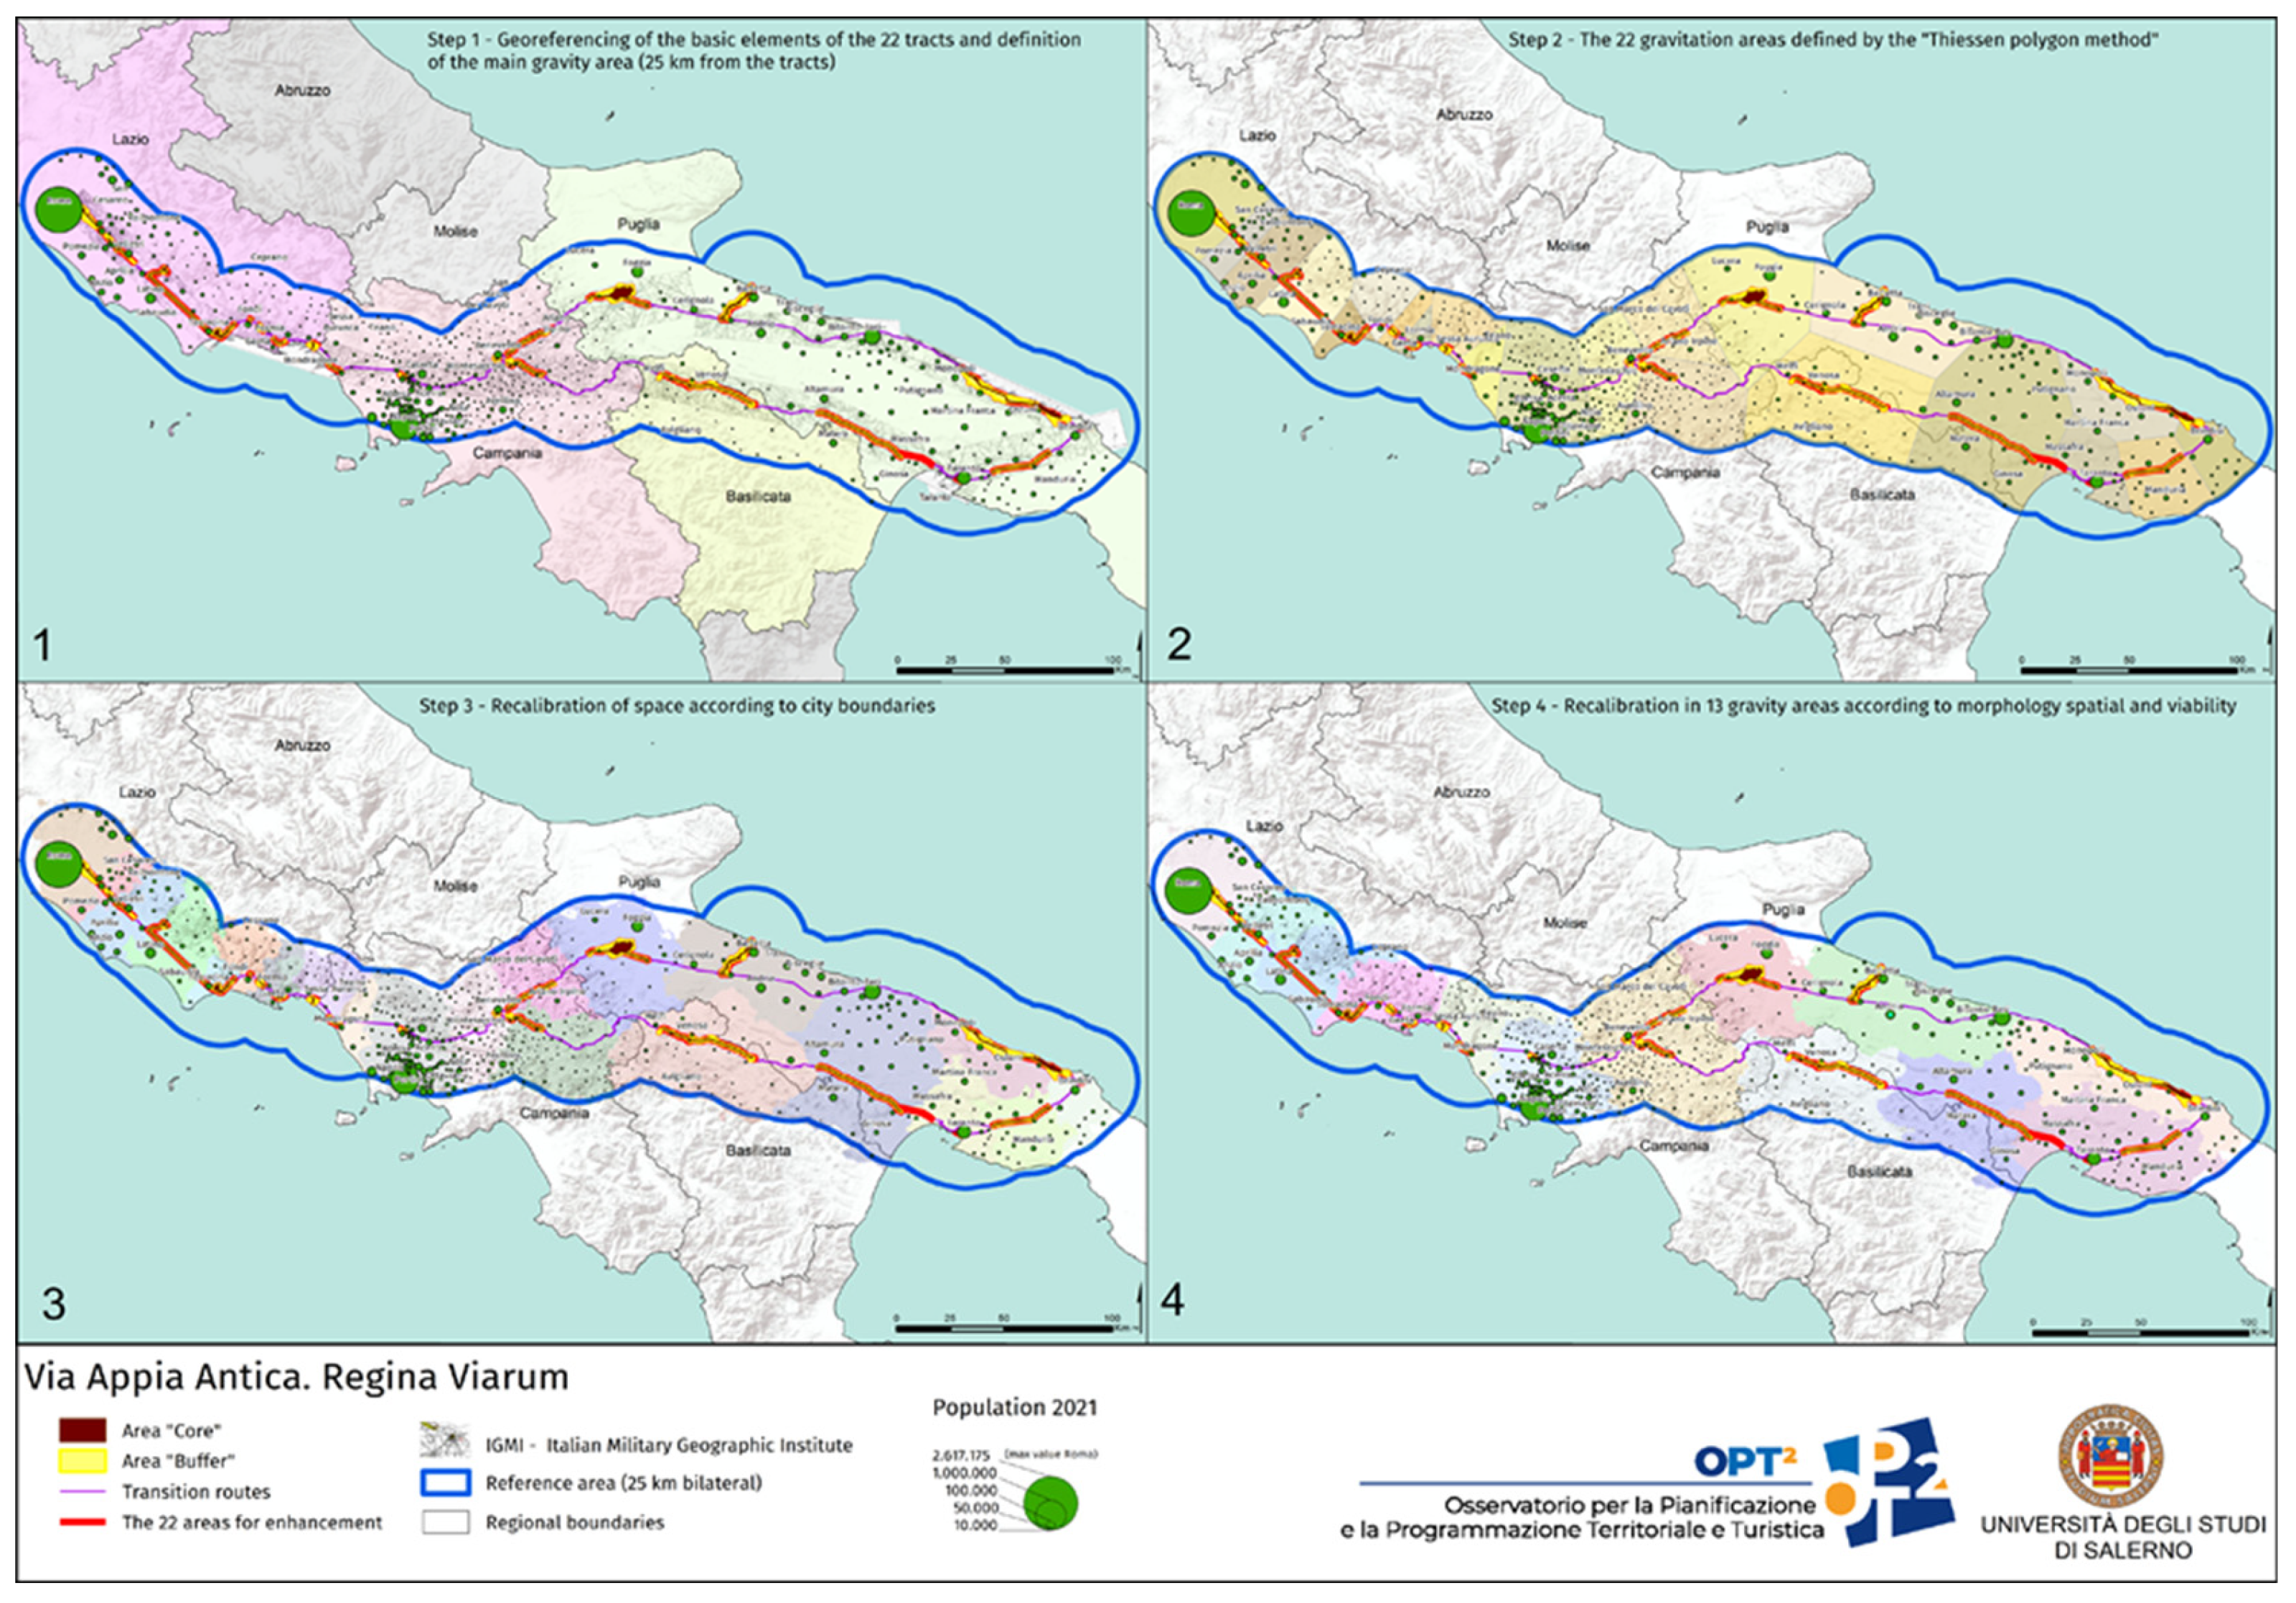
Figure 2.
Geographical-territorial model, adaptation of the Cifuentes approach. Source: Authors’ elaboration.
Figure 2.
Geographical-territorial model, adaptation of the Cifuentes approach. Source: Authors’ elaboration.
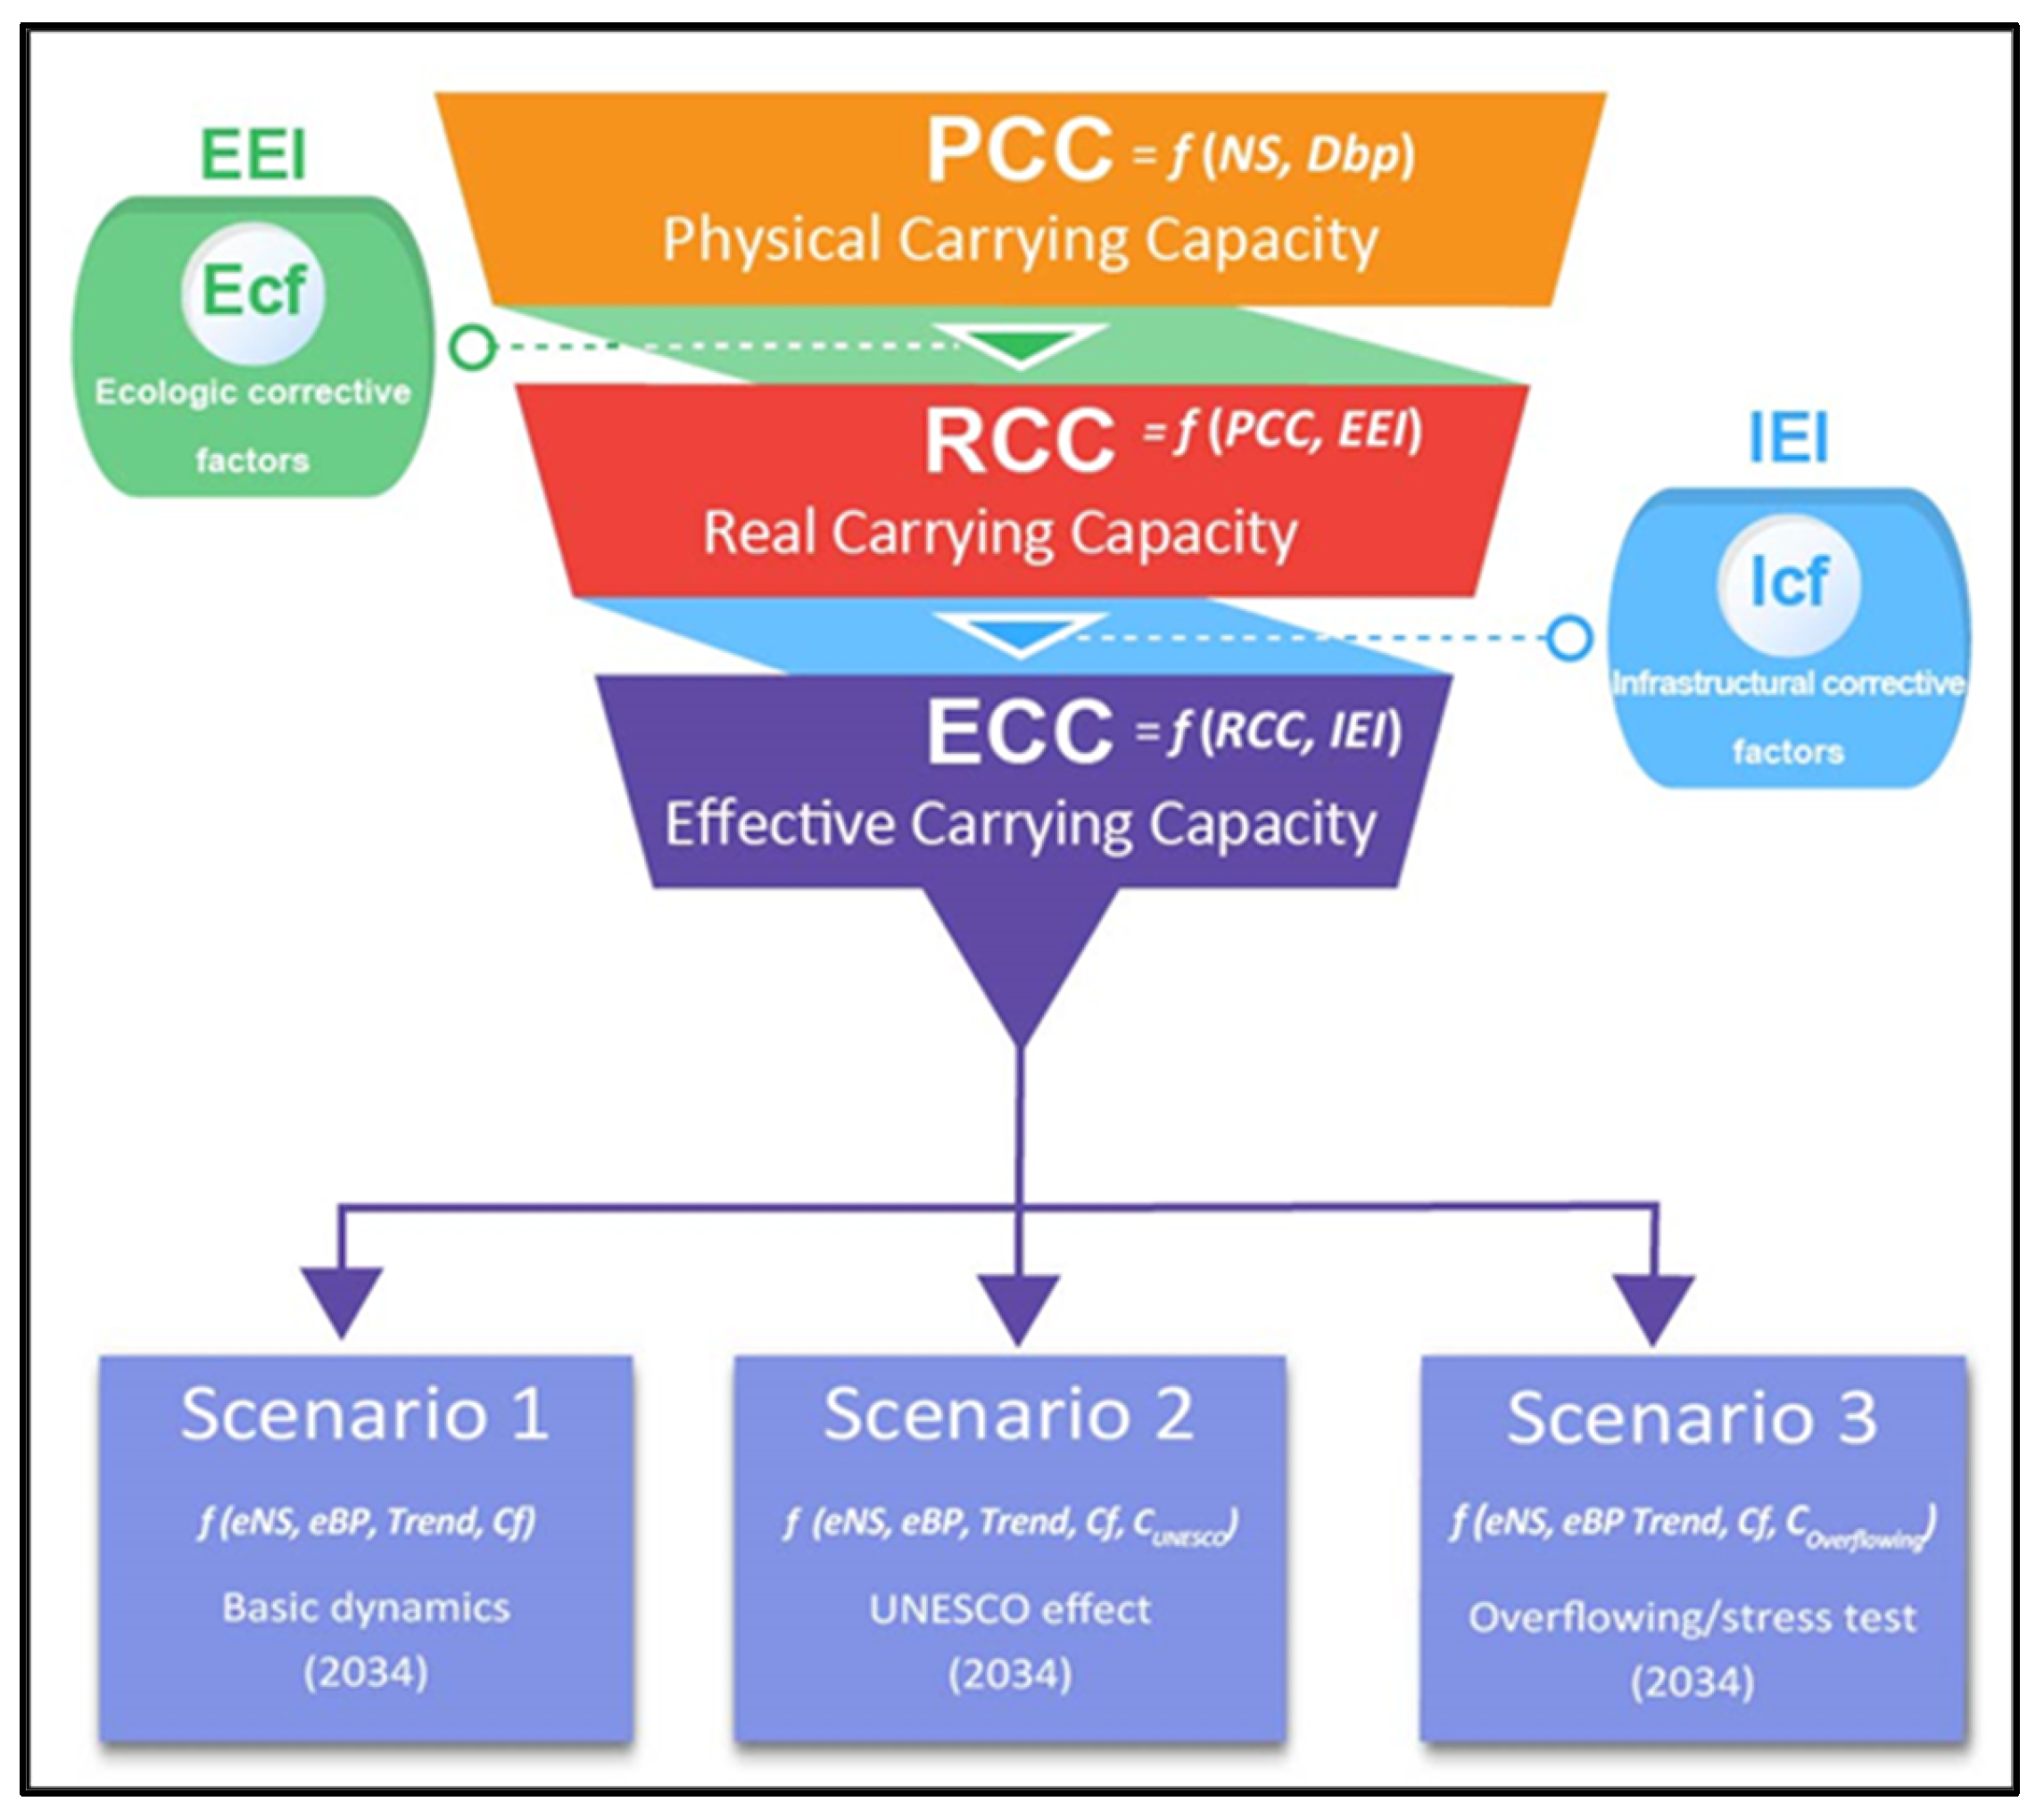
Figure 3.
Ecological Endowment Composite Index (EEI) of the “Via Appia Antica. Regina Viarum”. Source: Autorhs’ elaboration.
Figure 3.
Ecological Endowment Composite Index (EEI) of the “Via Appia Antica. Regina Viarum”. Source: Autorhs’ elaboration.
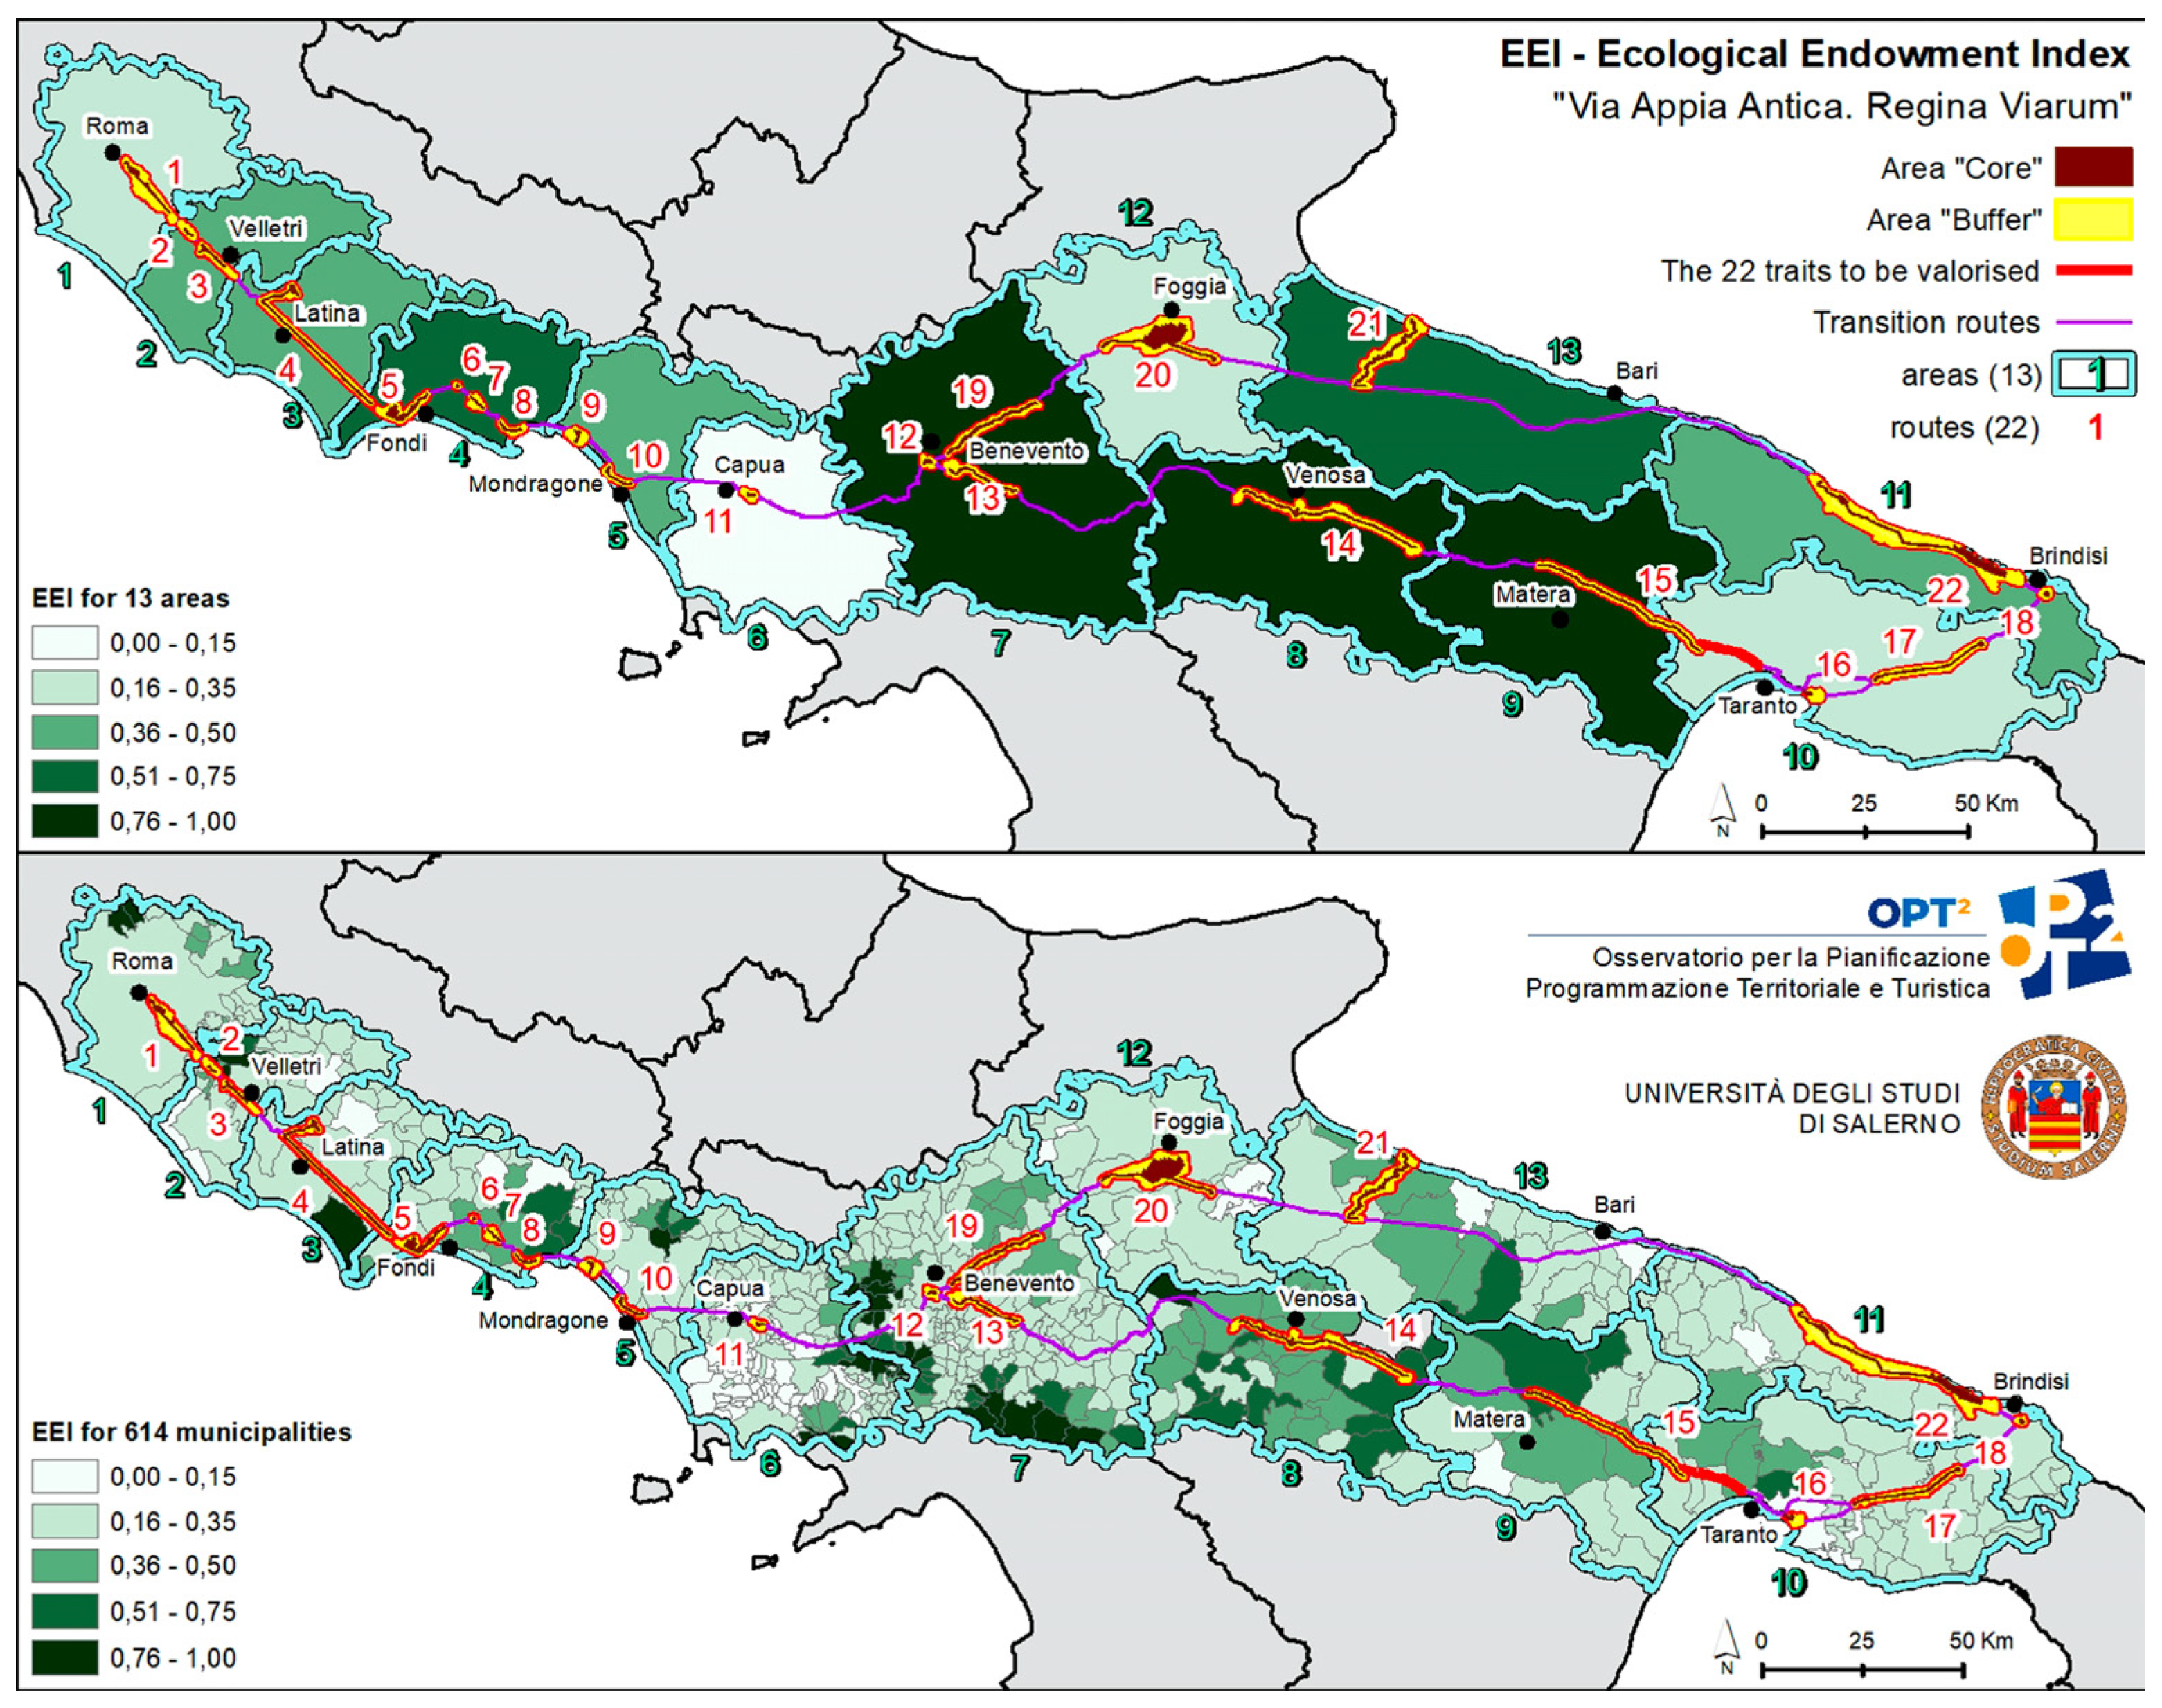
Figure 4.
Infrastructure Endowment Composite Index (IEI) of the “Via Appia. Regina Viarum”. Source: Autorhs’ elaboration.
Figure 4.
Infrastructure Endowment Composite Index (IEI) of the “Via Appia. Regina Viarum”. Source: Autorhs’ elaboration.
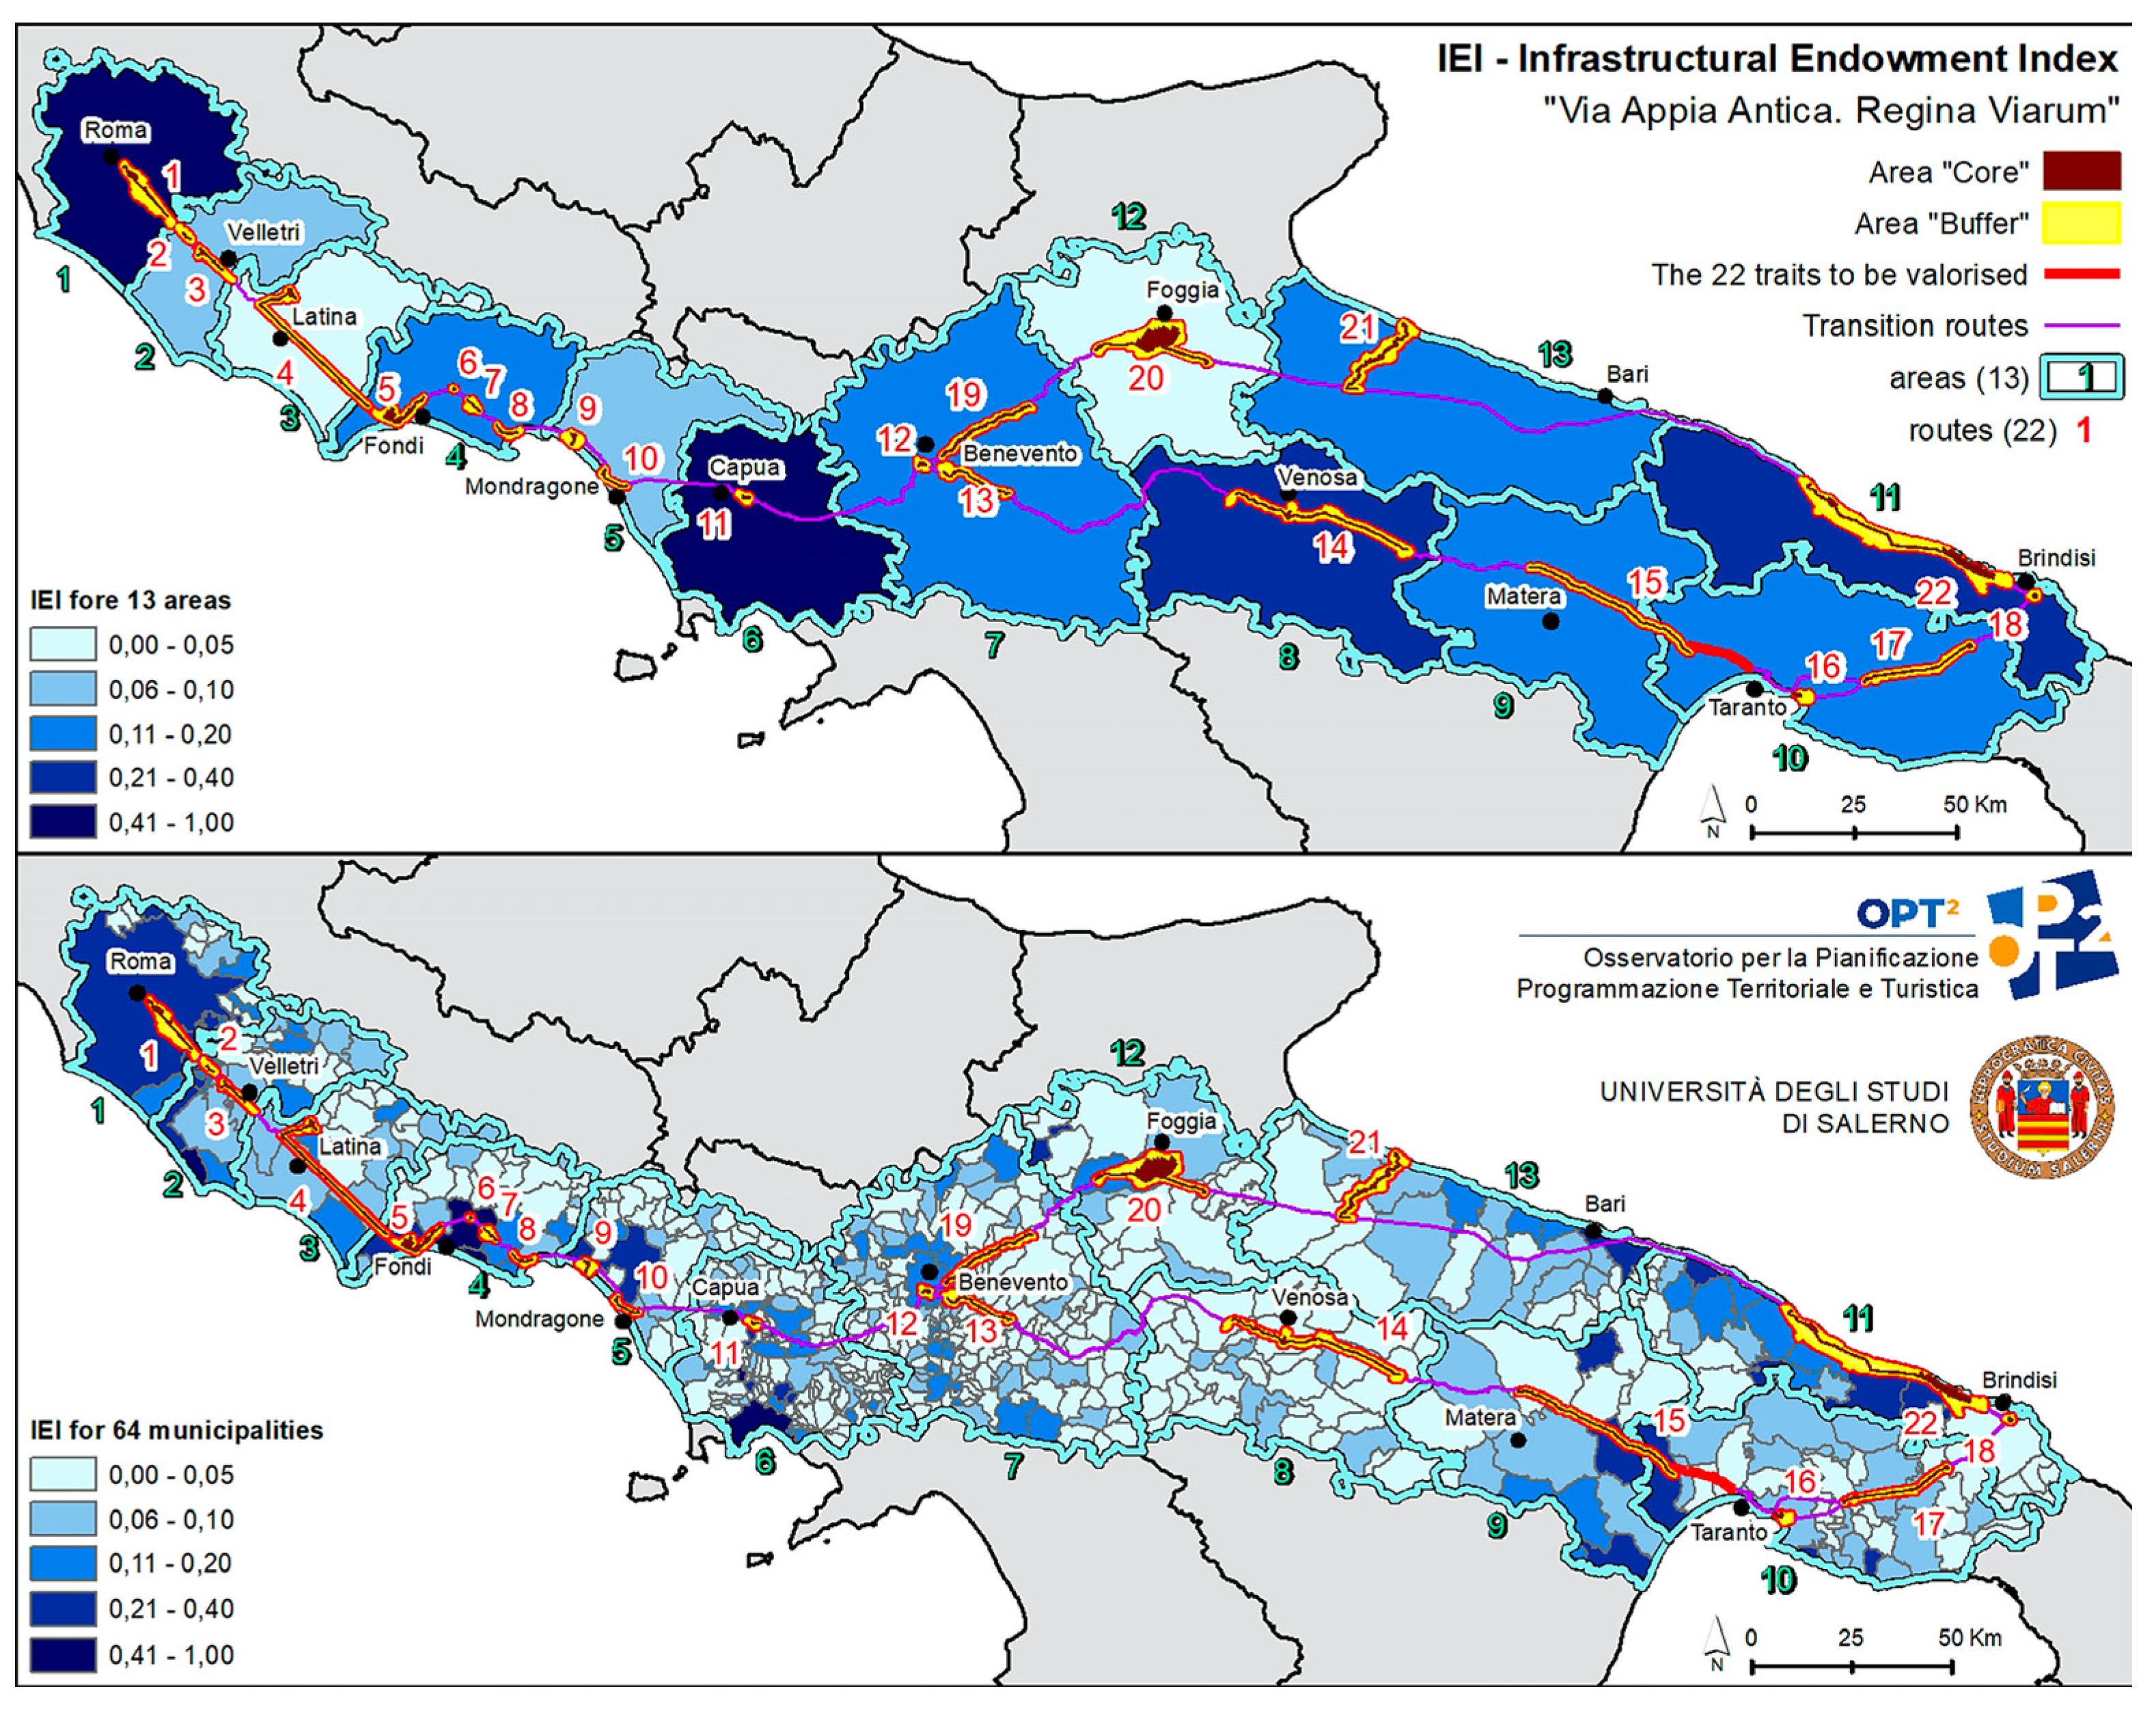
Figure 5.
Effective Carrying Capacity (ECC) or Physical Carrying Capacity (PCC), as calculated for the year 2019 for “Via Appia. Regina Viarum”. Source: Authors’ elaboration.
Figure 5.
Effective Carrying Capacity (ECC) or Physical Carrying Capacity (PCC), as calculated for the year 2019 for “Via Appia. Regina Viarum”. Source: Authors’ elaboration.
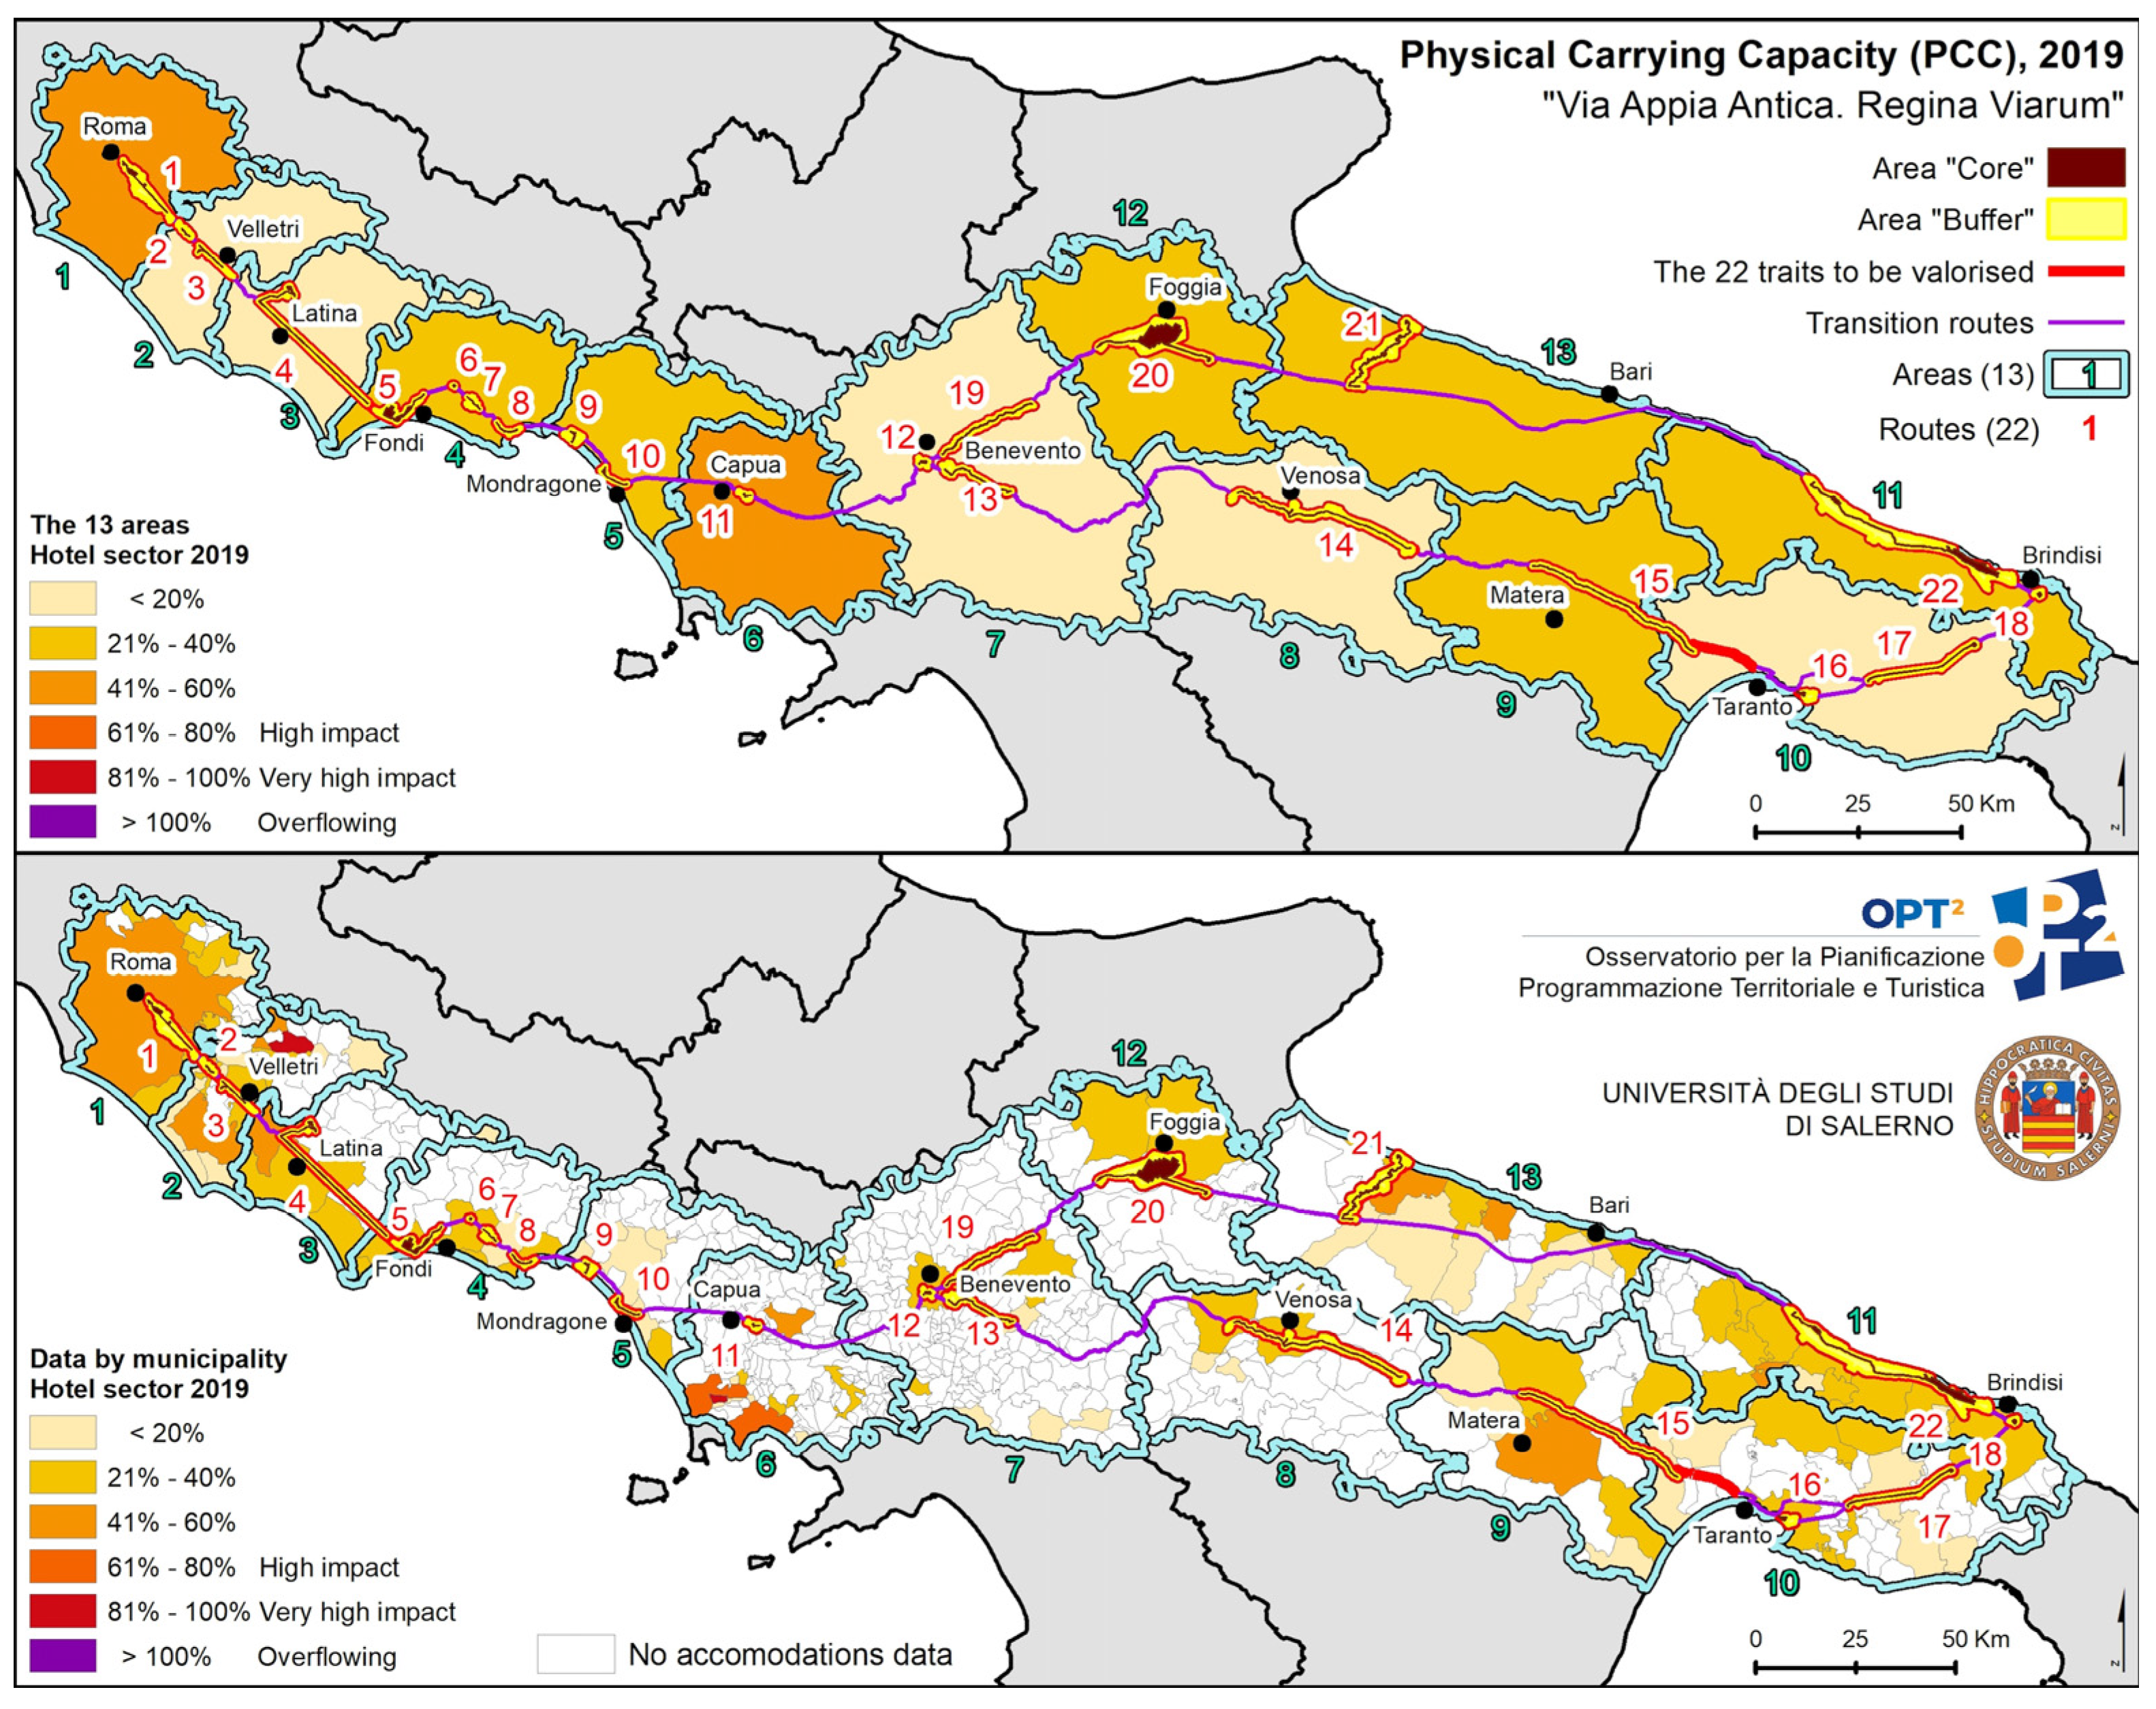
Figure 6.
Effective Carrying Capacity (ECC), Scenario 1 Ordinary dynamics, as calculated for the year 2034 for “Via Appia. Regina Viarum”. Source: Authors’ elaboration.
Figure 6.
Effective Carrying Capacity (ECC), Scenario 1 Ordinary dynamics, as calculated for the year 2034 for “Via Appia. Regina Viarum”. Source: Authors’ elaboration.
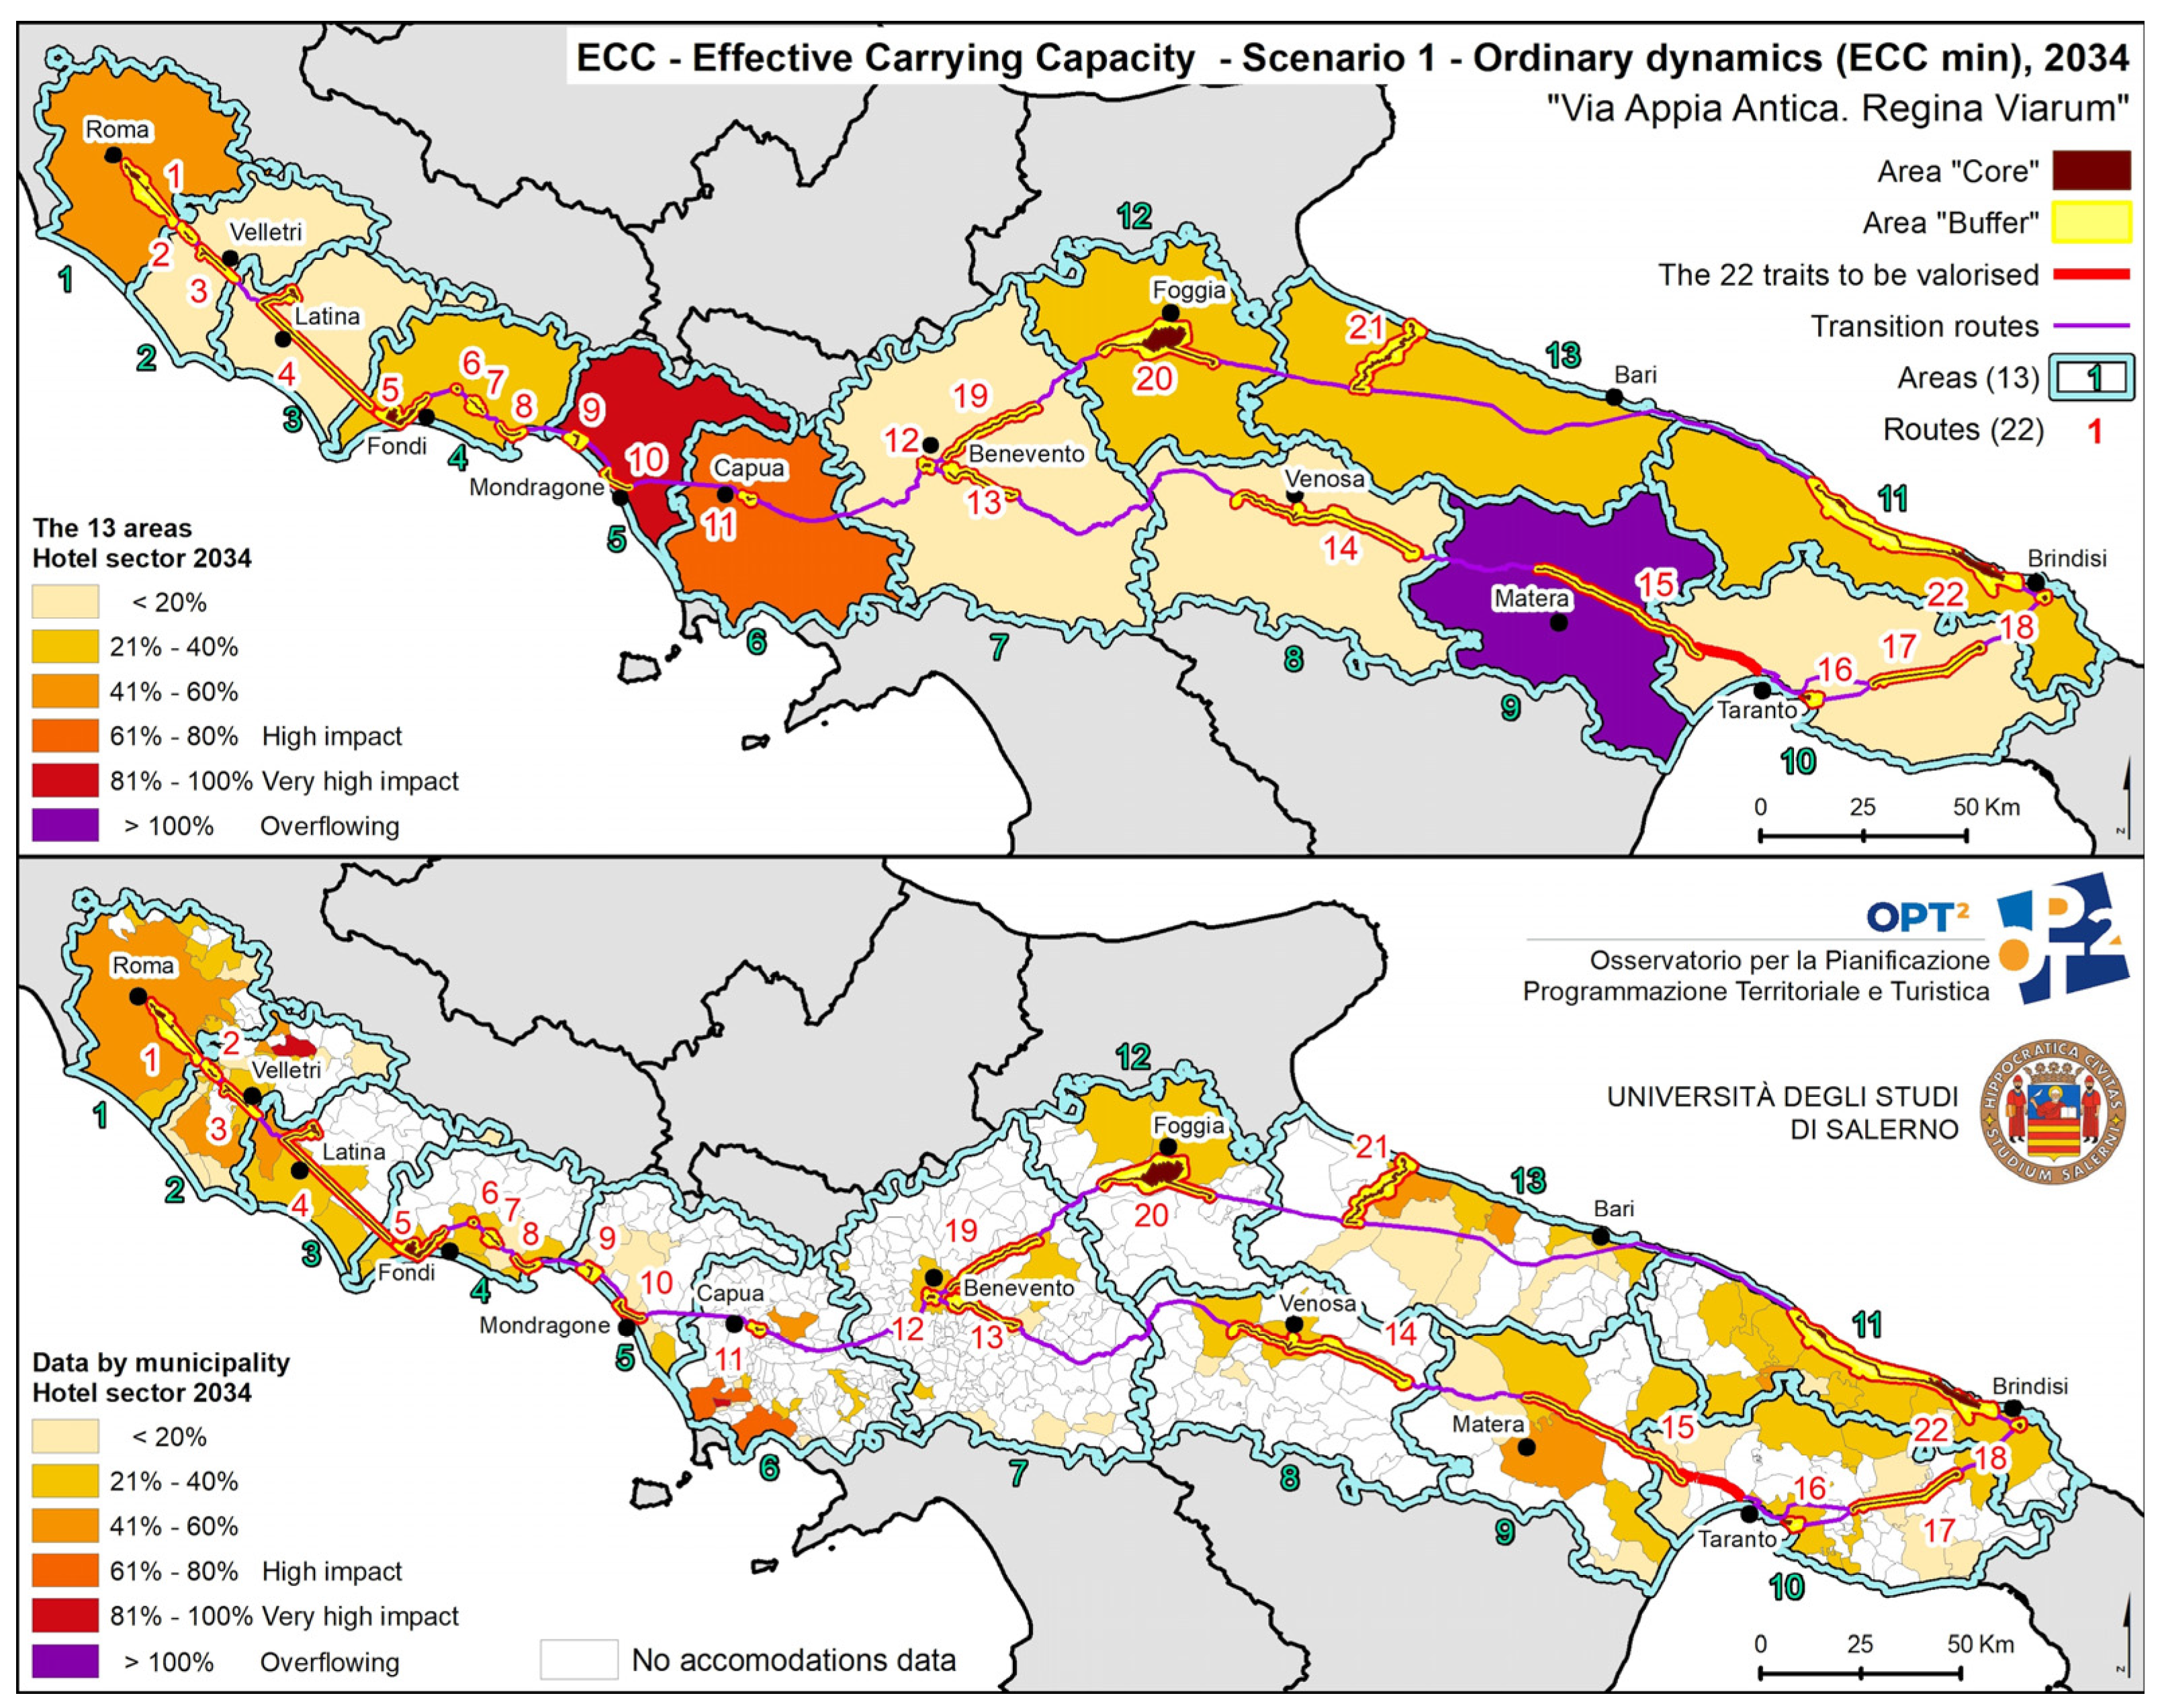
Figure 7.
Effective Carrying Capacity (ECC), Scenario 2 UNESCO effect, as calculated for the year 2024 for “Via Appia. Regina Viarum”. Source: Authors’ elaboration.
Figure 7.
Effective Carrying Capacity (ECC), Scenario 2 UNESCO effect, as calculated for the year 2024 for “Via Appia. Regina Viarum”. Source: Authors’ elaboration.
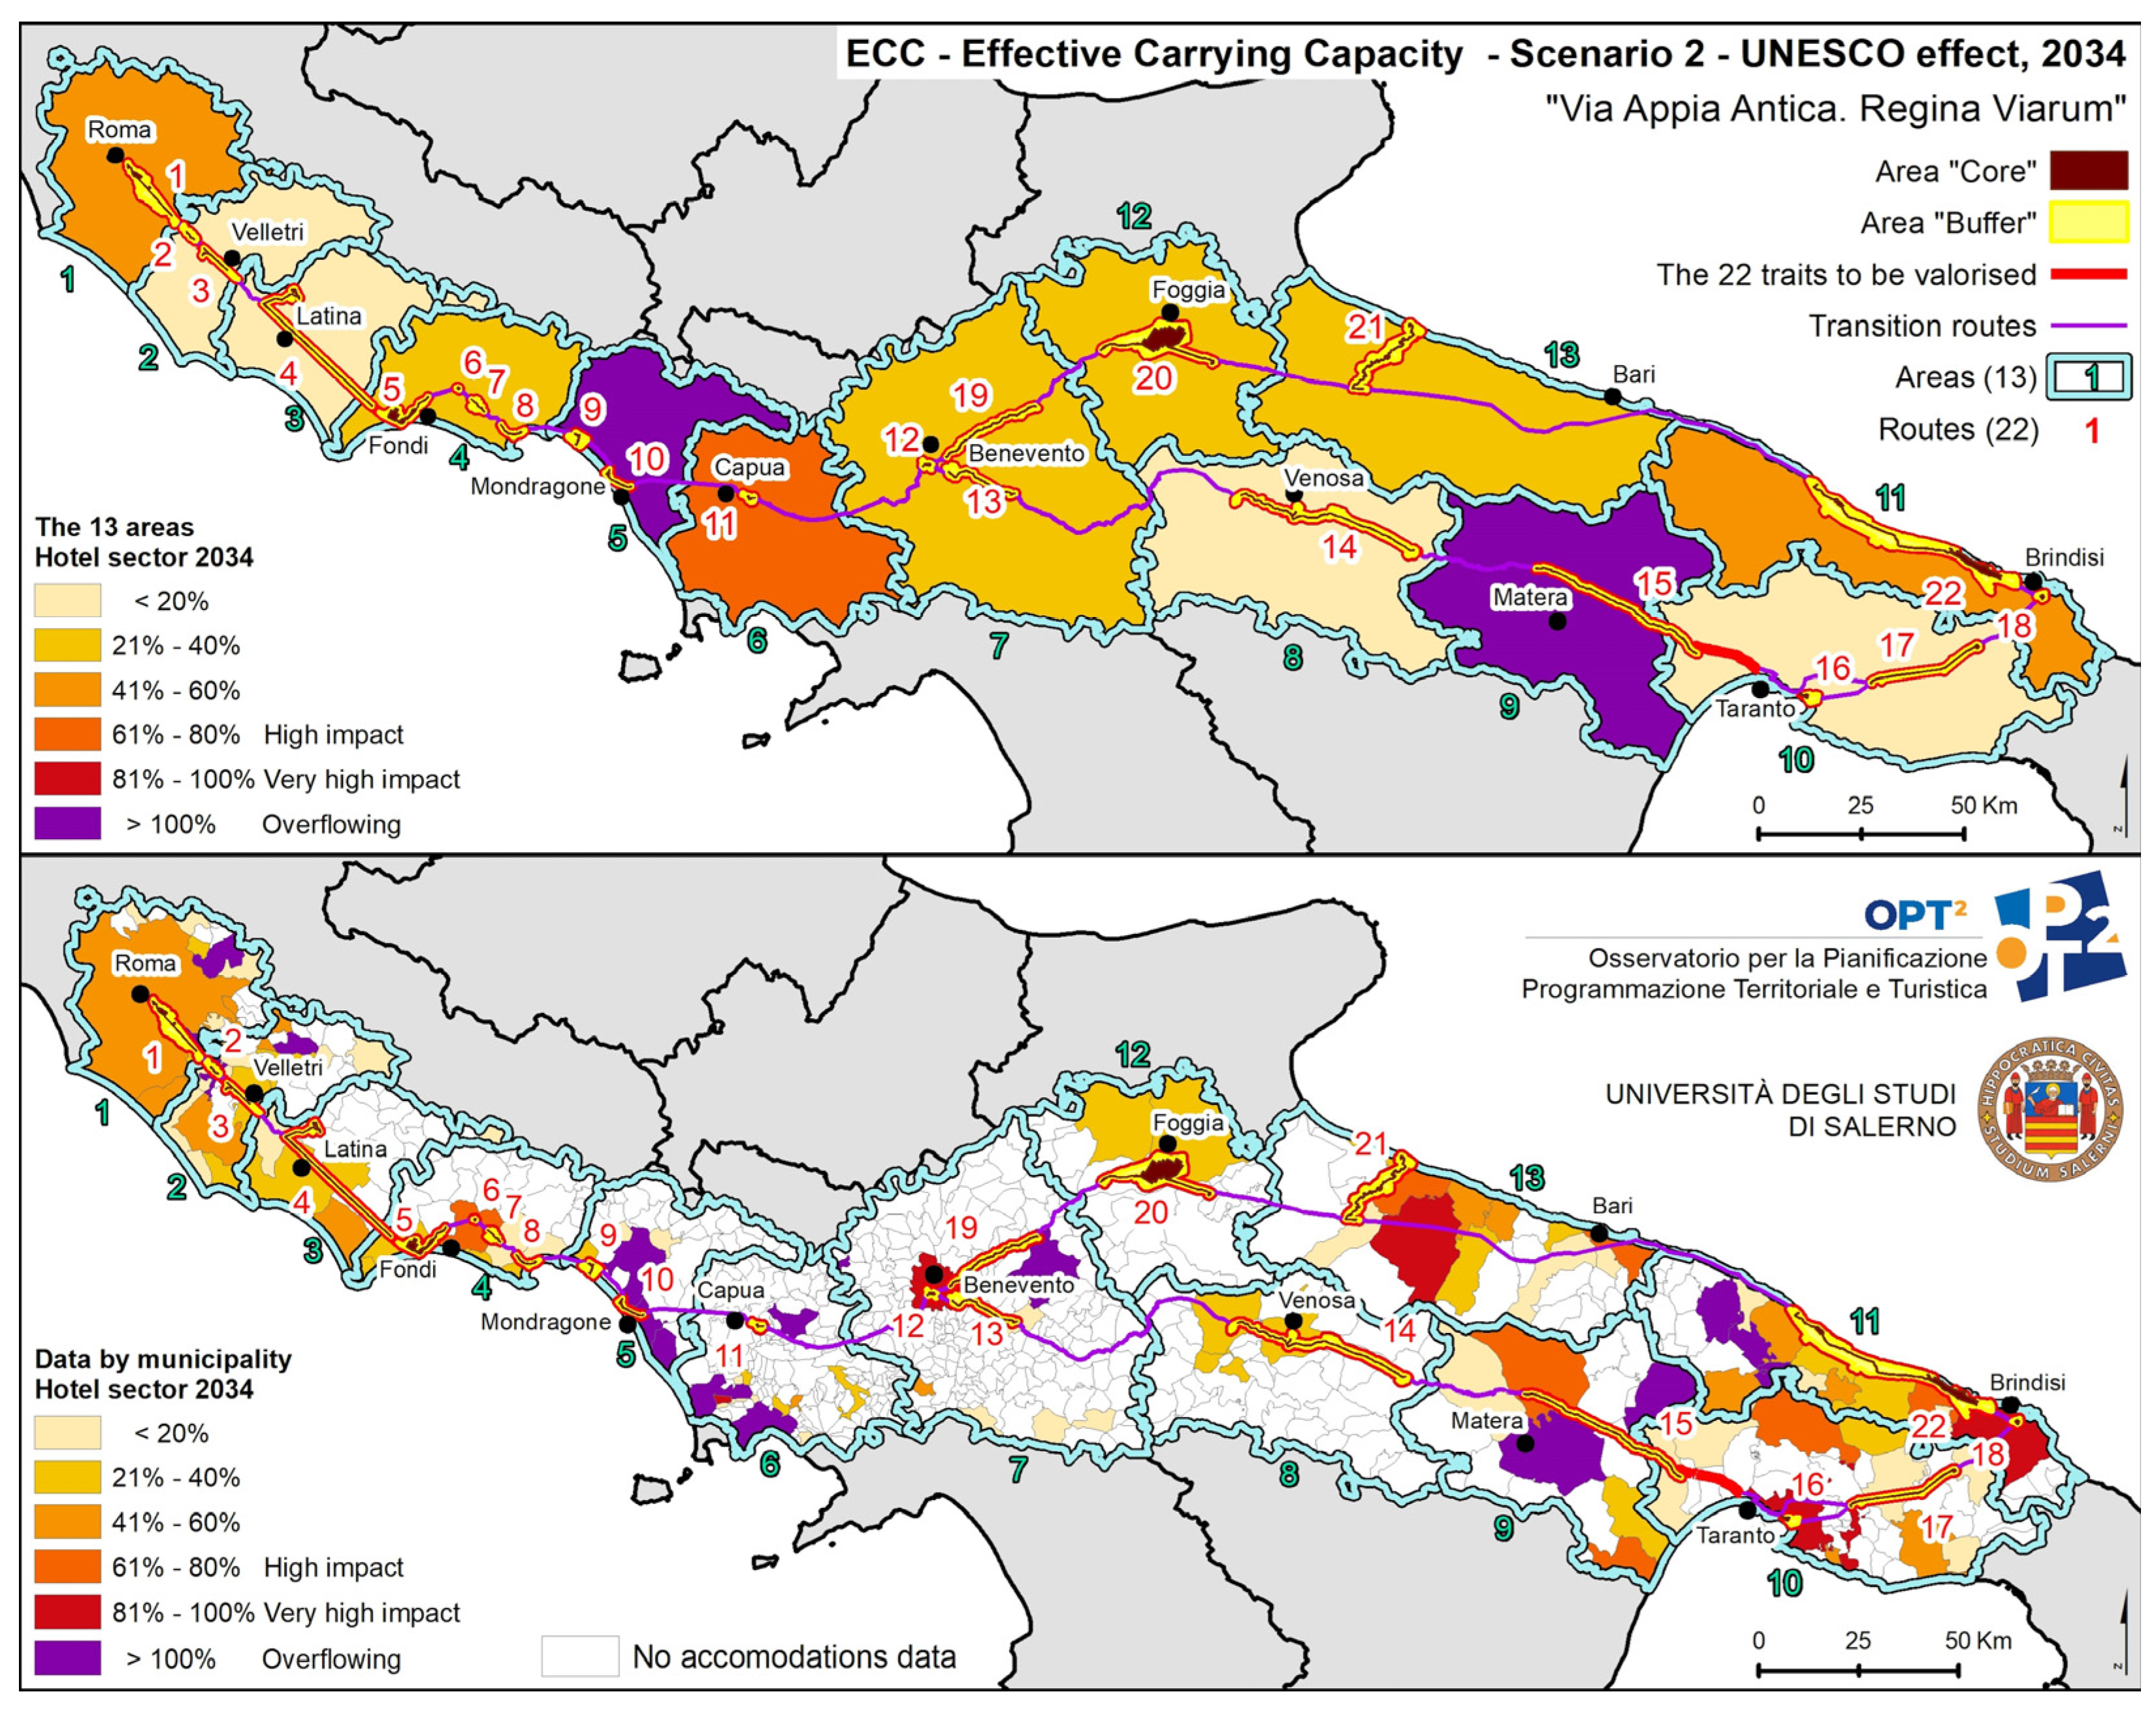
Figure 8.
Effective Carrying Capacity (ECC), Scenario 3 Overflowing (ECC max), as calculated for the year 2024 for “Via Appia. Regina Viarum”. Source: Authors’ elaboration.
Figure 8.
Effective Carrying Capacity (ECC), Scenario 3 Overflowing (ECC max), as calculated for the year 2024 for “Via Appia. Regina Viarum”. Source: Authors’ elaboration.
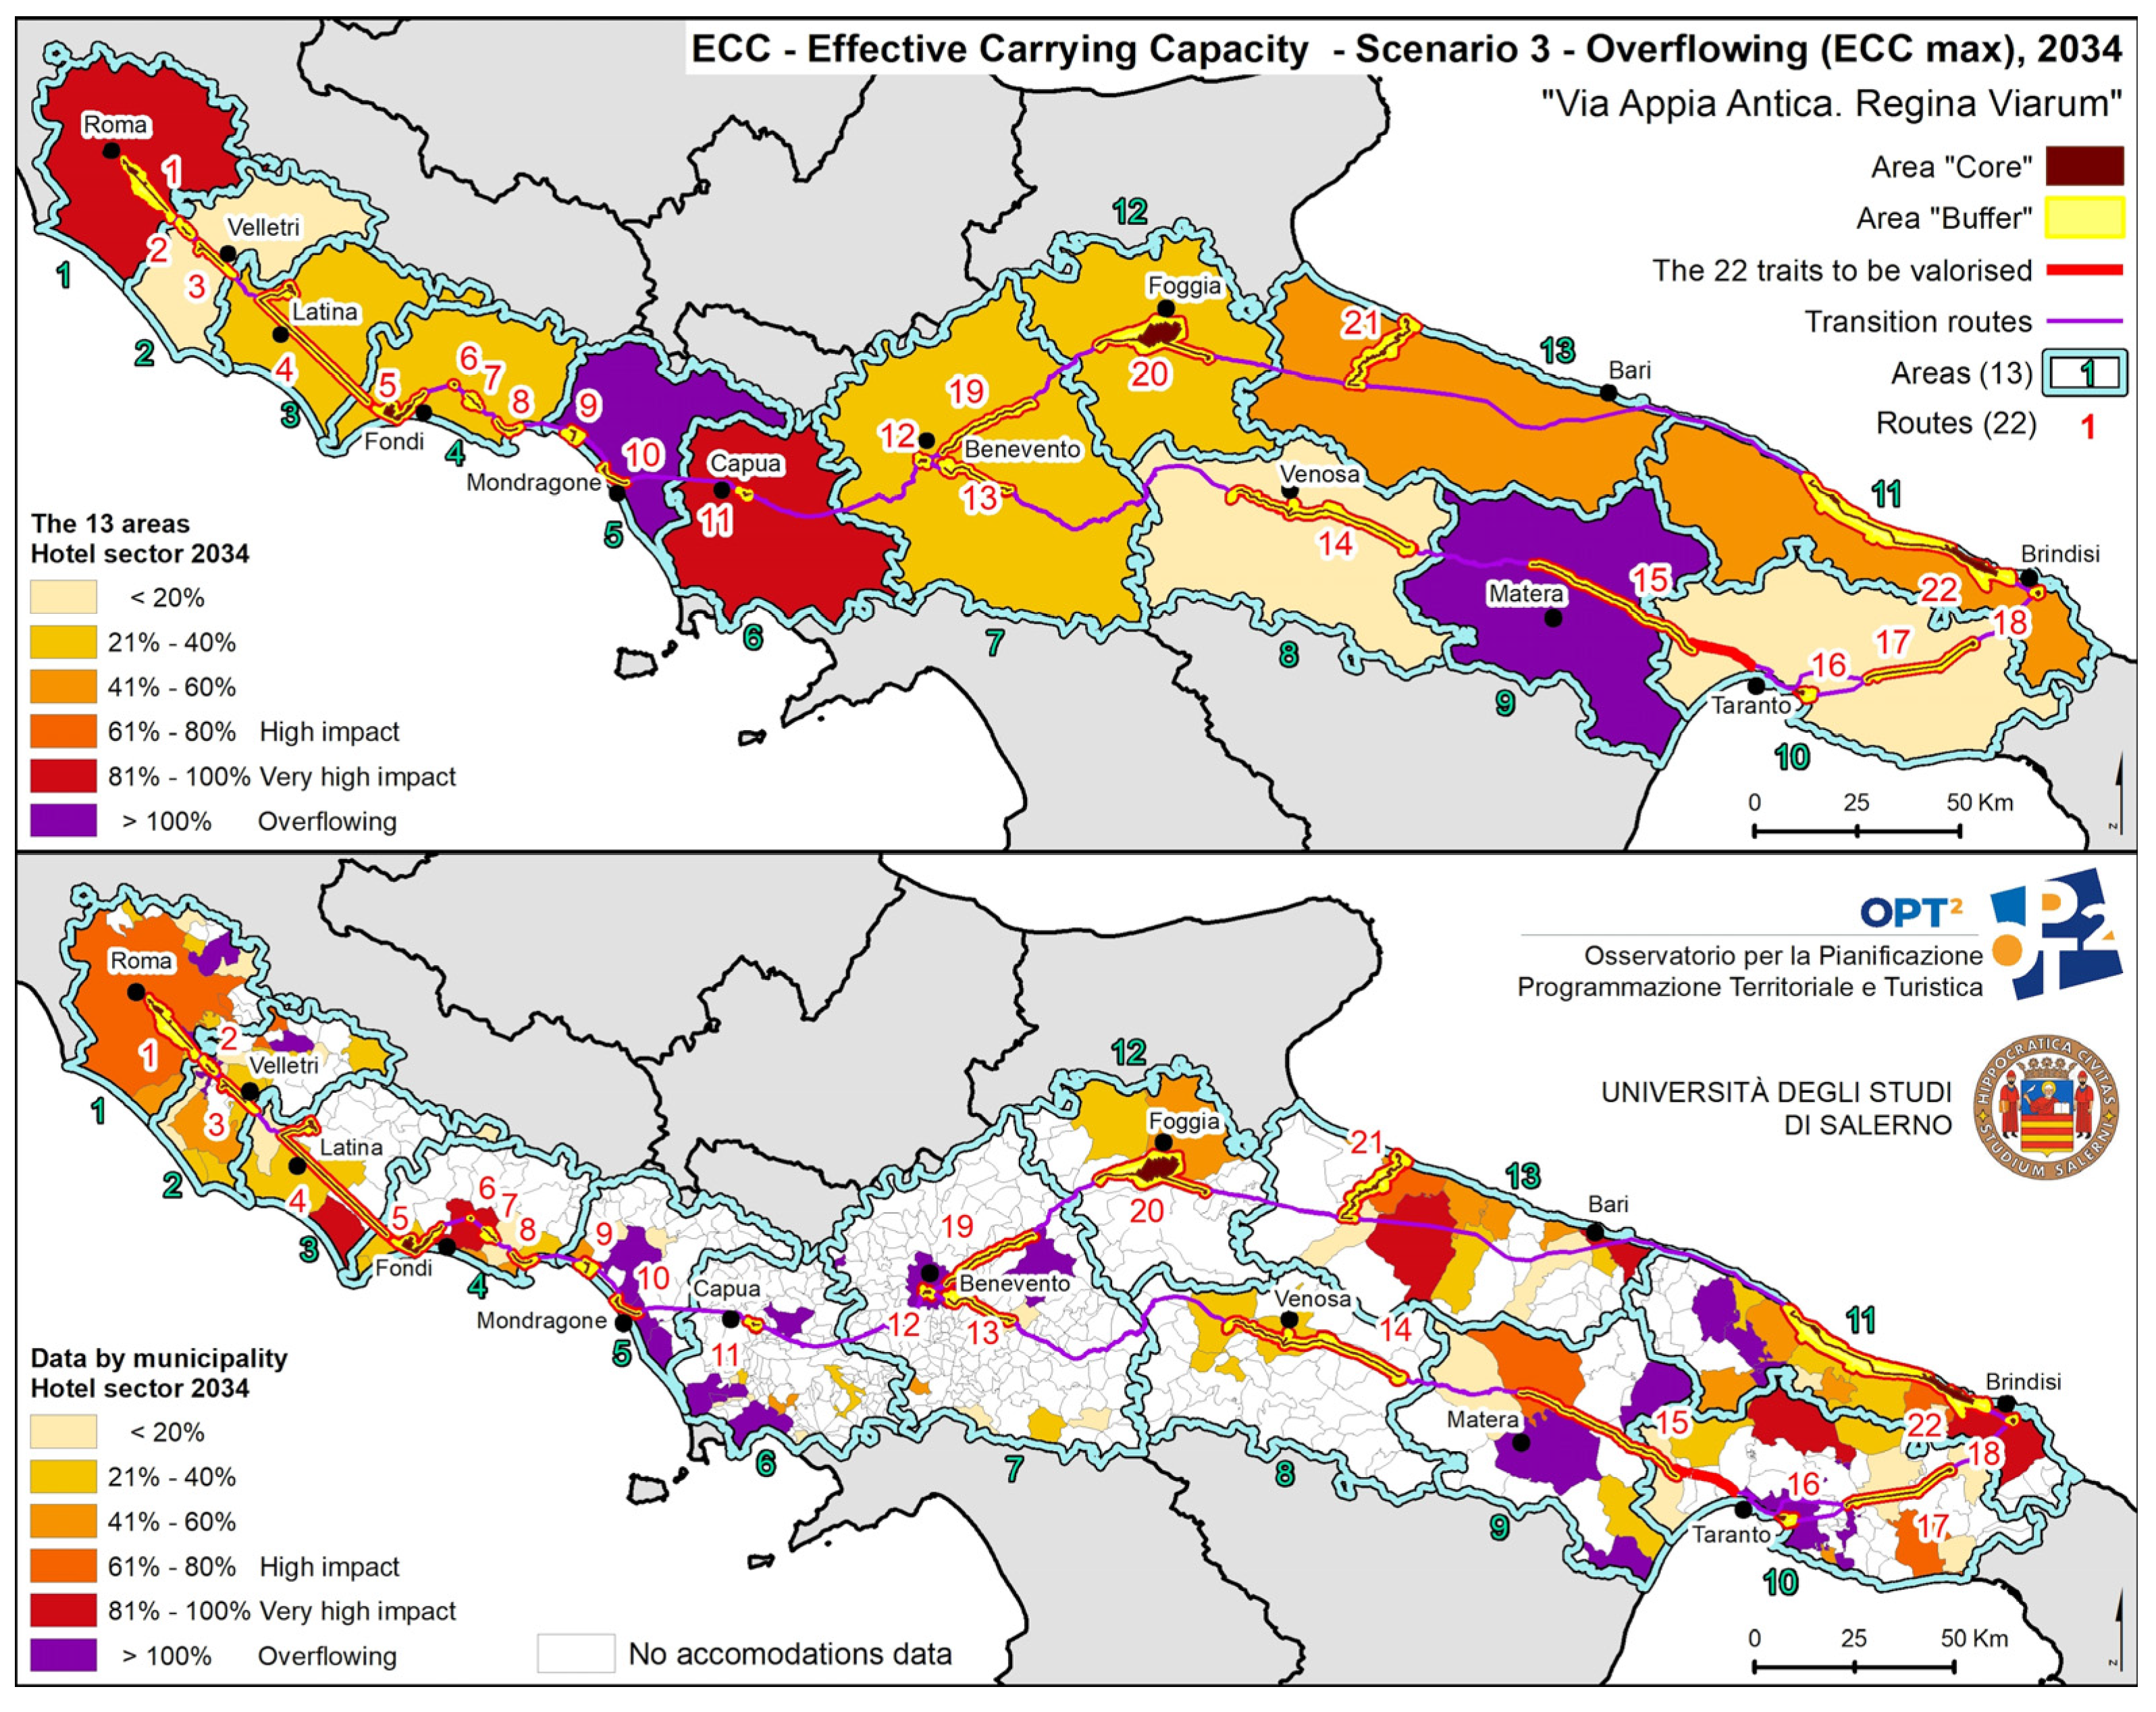
Table 1.
Connection between the 22 sections to be enhanced and 13 gravitational areas. Source: Authors’ elaboration from MiC direct provision and ISTAT data [106].
Table 1.
Connection between the 22 sections to be enhanced and 13 gravitational areas. Source: Authors’ elaboration from MiC direct provision and ISTAT data [106].
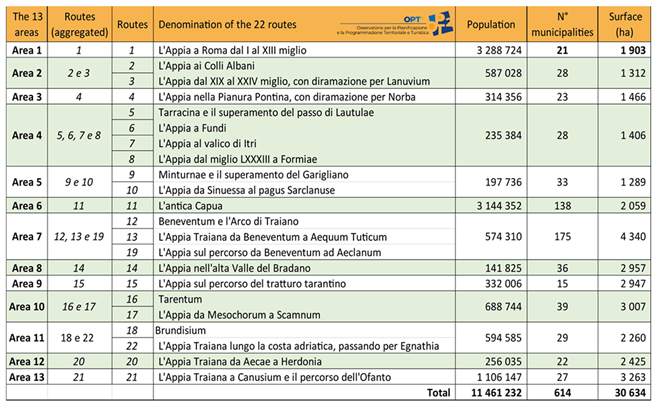
Table 2.
Composite indices: set of indicators.
| Correction Factors | Indicators | Description | Variables | Reference | Source | Year |
|---|---|---|---|---|---|---|
| Ecological Endowment Composite Index (EEI) | ||||||
| Ecf1 | Population density | Ratio of administrative municipality's land area to resident population [number of inhabitants per sq. km] | Resident | [106] | ISTAT | 2021 |
| Land area (sq. km.) | [106] | ISTAT | 2021 | |||
| Ecf2 | Ecological efficiency | Sorted municipal waste fraction detected in the administrative municipality [%] | Separate waste [t] | [106] | ISPRA | 2020 |
| Ecf3 | Ecological pressure | Municipal Waste generated by municipal inhabitants [kg] | Municipal Solid Waste (MSW) [t] | [108] | ISPRA | 2020 |
| Ecf4 | Environmental endowment | Presence of Protected Areas (EUAP2010) [%] | Protected Areas (EUAP2010) [h] | [109] | ISTAT | 2010 |
| Ecf5 | Unconsumed land | Share of unsealed land [%] | Unconsumed land [h] | [108] | ISPRA | 2019 |
| Infrastructure Endowment Composite Index (IEI) | ||||||
| Icf1 | Prevailing tourism supply | Relationship between hotel receptivity with non-hotel receptivity | Bed-places in hotel and non-hotel accommodations | [106] | ISTAT | 2019 |
| Icf2 | Tourism accommodation offer intensity | Ratio of total beds in accommodations to municipal population | Bed-places in hotel and non-hotel accommodations | [106] | ISTAT | 2019 |
| Icf3 | Material cultural heritage endowment | Number of archaeological assets and number of architectural assets | Number of subway stations | [110] | MIC | 2017 |
| Icf4 | Station intensity for passenger transport | Ratio of the number of railway stations and metro stations to the territorial area of the administrative municipality [per 100 sq. km] | Number of stations belonging to the categories: Platinum; Gold; Silver and Bronze | [111] | ISTAT | 2015 |
| [112] | RFI | 2022 | ||||
| Icf5 | Local public transport offer | Ratio of the number of vehicles for local public transport (LPT) to residents | Number of bus and trolleybus cars intended for passenger transport | [111] | ISTAT | 2015 |
Table 3.
Effective Carrying Capacity (ECC) in percentage values based on the Physical Carrying Capacity (PCC) calculated for the hotel and extra hotel (accommodation establishment). Source: Authors’ elaboration.
Table 3.
Effective Carrying Capacity (ECC) in percentage values based on the Physical Carrying Capacity (PCC) calculated for the hotel and extra hotel (accommodation establishment). Source: Authors’ elaboration.
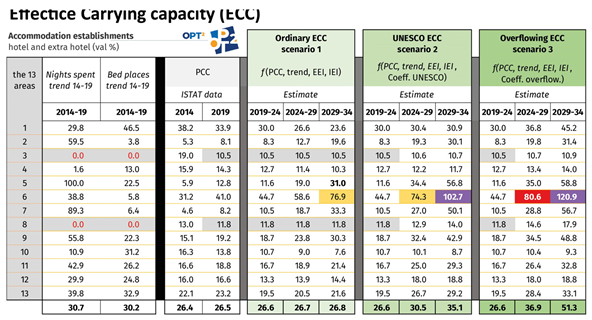
* Note: to limit model bias, the negative trends were treated as a null trend (grey cells).
Table 4.
Effective Carrying Capacity (ECC) in percentage values based on the Physical Carrying Capacity (PCC) calculated for the hotel sector. Source: Authors’ elaboration.
Table 4.
Effective Carrying Capacity (ECC) in percentage values based on the Physical Carrying Capacity (PCC) calculated for the hotel sector. Source: Authors’ elaboration.
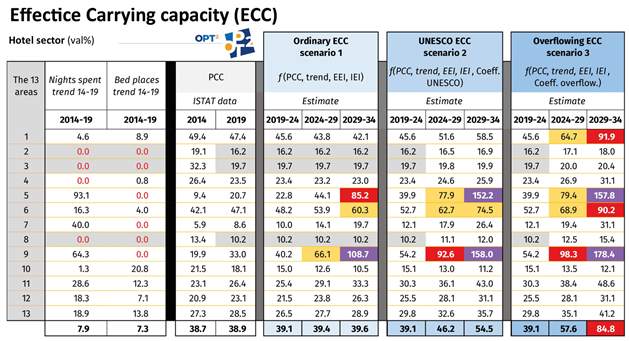
* Note: to limit model bias, the negative trends were treated as a null trend (grey cells).
Disclaimer/Publisher’s Note: The statements, opinions and data contained in all publications are solely those of the individual author(s) and contributor(s) and not of MDPI and/or the editor(s). MDPI and/or the editor(s) disclaim responsibility for any injury to people or property resulting from any ideas, methods, instructions or products referred to in the content. |
© 2025 by the authors. Licensee MDPI, Basel, Switzerland. This article is an open access article distributed under the terms and conditions of the Creative Commons Attribution (CC BY) license (http://creativecommons.org/licenses/by/4.0/).
Copyright: This open access article is published under a Creative Commons CC BY 4.0 license, which permit the free download, distribution, and reuse, provided that the author and preprint are cited in any reuse.


