
Submitted:
26 December 2024
Posted:
27 December 2024
You are already at the latest version
Abstract
This paper aims at addressing sustainability concerns in vulnerable insular territories. Such concerns are due to the rising overtourism phenomenon that affects islands at a rapidly escalating pace; and renders sustainable local development of these outstanding areas – from a natural and cultural viewpoint – at stake. Towards this end, this work capitalizes on current literature and attempts to structure a methodological framework and a respective set of indicators’ groups that are capable of assessing dimensions of overtourism in each single tourism destination, thus providing evidence-based and more robust guidelines for articulating policy decisions that can remedy incidents of overtourism. The proposed methodological framework follows a place-based approach and combines tourism demand and supply data with environmental, social, economic and spatial data and respective indicators for assessing tourism density and intensity of each destination’s tourism pattern and related multi-dimensional impacts. Validation of both the proposed framework and indicators’ groups is conducted in Santorini Island, Greece, i.e., an island that lies at top positions of many lists of destinations, marked as suffering by overtourism. Results show that Santorini Island is confronted with severe overtourism impacts, which are highly affecting its identity, productive model and spatial pattern, while endangering its natural and cultural wealth.
Keywords:
sustainable insular territories
; overtourism
; indicators
; geospatial data analysis
; Santorini Island
1. Introduction
Globally, the tourism industry is one of the fastest growing economic sectors, trending to reach 1.8 billion in 2030 – i.e., 54% increase since 2015 [1] – and a major driving force of destinations’ economic growth. Concurrently, however, severe concerns have been expressed as to the detrimental impacts of the rapidly expanding travel and tourism industry on destinations’ environment and host communities [2]. These have given rise to the articulation of the sustainable tourism concept, expressed by the UNWTO [3] as the tourism that takes full account of its current and future economic, social and environmental impacts, addressing the needs of visitors, the industry, the environment and the host communities; with this concept being permeating also the Sustainable Development Goals of the UN Agenda 2030 (SDGs 8, 12 and 14 – targets 8.9, 12b and 14.7) [4,5]. Nevertheless, the sustainable tourism concept is marked by ambiguity. In fact, a precise definition of this multifaceted term in each particular destination [6] and the diverse perspectives and stakes inherent in its interpretation within a certain destination are lacking [7].
Among the globally highly-rated tourism destinations fall coastal and particularly insular areas in the Mediterranean, where the 3S (Sun-Sea-Sand) mass tourism model prevails. The prevalence of this model is particularly affecting stability and sustainability of these areas by means of land use changes in the vulnerable coastal parts (construction of large tourist complexes, large infrastructure facilities, spread of built constructions outside the settlements’ boundaries, etc.); pollution as a result of the irrational management of waste and water resources; CO2 emissions due to intense transportation; etc. [8]. Additionally, insular regions are particularly vulnerable to problems relating to unsustainable levels and forms of tourism that can lead to overtourism [9]. Moreover, these regions are more dependent on tourism than their counterparts in the mainland; while, concurrently, they are confronted with a number of insularity-related challenges and vulnerabilities, e.g. limited resources and access to the global supply chain, high import costs, cultural and environmental fragility, climate change vulnerability [10], to name but a few. Furthermore, islandness has historically resulted in employment and income barriers. Such barriers, in older times were confronted by emigration. Currently, however, tourism is often featured as a potential source of livelihood, a developmental lever that can provide jobs, income and a subsistence level of existence [11]; and a catalyst for social and territorial cohesion as well as local economic growth on an island scale [12]. However, although tourism constitutes a key driver of islands’ economic growth, it is also a source of significant pressures on multiple levels (social, spatial, cultural, environmental, etc.). In addition, under conditions of climate change, largely affecting insular territories, but also of other recent global crises (economic, energy, health, geopolitical tensions, etc.), the rapidly evolving monocultural model of tourism in island regions endangers sustainability objectives in the long run; while, in many occasions, gives prominence to the overtourism phenomenon, an issue that is currently at the heart of the interest of research and policy making community, but also host communities in island areas.
In fact, overcrowded destinations, insular ones as well, are not a new phenomenon. This was already identified at the end of the mid-60s, where the roots of overtourism are traced [13]. However, the term overtourism per se is a rather new one, firstly appearing in tourism-related literature in 2016 [14]. Overtourism aims to express the impacts of destinations’ overcrowding or, stated differently, the pressure exerted by an excessive volume and type of tourist flows in a certain destination [14]. Thus, the term intends to summarize the various negative impacts that are related to tourism mainly in city contexts, but also in nature-based destinations, such as national parks, coastal areas or islands. In fact, although overtourism is primarily noticed in urban areas, such as Venice, Barcelona, Amsterdam, etc. [13,15,16], the most vulnerable destinations are not necessarily cities, but rather coastal, insular and rural heritage sites [17].
But what exactly does the overtourism term imply? The answer to this question is not a clear-cut one, with overtourism representing another vague term in the policy and planning realm. Indeed, a commonly-agreed definition of overtourism – occasionally referred as overcrowding or visitor pressure [14] – does not yet exist; while viewpoints from different disciplines (e.g., tourism, planning) seem to be contradictory or even conflicting. Furthermore, the overtourism concept raises particular concerns in the scientific community with respect to even its very existence [9]. That said, Capocchi et al. [18] wonder whether overtourism is really anything more than over-development under a new name; Chung and Koo [19] and Huertas [20] consider overtourism as a media-generated term, experiencing a rush of media popularity; UNWTO [21] expresses the view that overtourism can eventually be simply a sort of management problem; and Dredge [22] argues whether overtourism is simply a common phenomenon which, despite already experienced for a long time, it is just now that has received widespread attention.
Further to the above arguments, literature search unveils a number of overtourism definitions, expressing different viewpoints on the topic. Generally speaking, overtourism is commonly grasped as unsustainable tourism [23]; a state of “too many tourists at a place and in an unsustainable way” [24] (p. 48); a threat to quality of life [25], heritage [26], natural and socio-cultural resources [25], and place attachment [27]; and a phenomenon mainly associated with the volume, type and time frame of tourist flows, coupled with the carrying capacity and fragility of the destination. In addition, literature-based definitions stress the physical, cultural, economic, social, psychological, political, spatial, etc. dimensions of overtourism. In this respect, Peeters et al. [17] (p. 22), define overtourism as “… a state that is tightly linked to a situation in which tourism impacts, at certain times and in certain locations, exceed physical, ecological, social, economic, psychological, and/or political capacity thresholds”; and is being mainly associated with volume of visitors. Mihalic [23] highlights the impacts of overtourism on the natural and cultural resources; and perceives overtourism as the rapid escalation and growth of tourism supply and demand, which result in the excessive use of destinations' natural resources and the destruction of their cultural attractions, while also affecting negatively the local socioeconomic environments in the long run. Stressing the social dimension, UNWTO [21] perceives overtourism on the ground of the impacts of tourism on a destination, or parts thereof that are excessively influencing perceived quality of life of citizens and/or quality of visitors' experiences in a negative way. Accordingly, Vourdoubas [28] presents overtourism as a phenomenon occurring mainly in popular tourism destinations, and being mostly expressed by the large number of tourists – a “tourism storm” or “tourism invasion” – that overwhelms the destination and results in negative impacts on the local communities, the environment, and the visitors’ experience. Overtourism definition by Milano et al. [29] and García-Buades et al. [30] lies in the same direction, perceiving overtourism as a state of an excessive growth of visitors, which leads to overcrowding in specific areas; while, in turn, renders residents the ‘victims’ of the impacts of temporary and seasonal tourism peaks that cause permanent changes to their lifestyles, limit their access to amenities and damage in general their well-being. The social dimension is also stressed by Saveriades [31], claiming that overtourism is associated with the maximum level of use (in terms of numbers and activities) that can be absorbed by a destination so that an acceptable decline in the quality of experience of visitors and acceptable adverse impact on the host community to be ensured. Placing emphasis on the psychological dimension of overtourism, Goessling et al. [27] conceptualize overtourism as a psychological reaction to tourist pressure, being the result of the damage of ‘place-residents’ interrelationships, which cause the shift of residents’ attitudes towards tourism. Capocchi et al. [18] stress the subjective nature of overtourism, where locals, tourists or both realize a destination as having that number of tourists that is changing its character, affects its authenticity, and leads to irritation and annoyance. Milano et al. [32] claim that overtourism can be grasped as a multifaceted and self-perpetuating system, placing priority to economic growth through mass tourism and gradually mobilizing a ‘visitor economy’ that leads to economic restructuring at the destination level. In this respect, questionable unfair practices are unleashed, e.g. rent expropriation, labour exploitation, displacement and expulsion of indigenous community and natural resource extraction.
In seeking to achieve sustainable tourism objectives at the destination level, in alignment with the 2030 SDGs, the issue of overtourism is currently at the heart of the scientific research discussions, but also a central matter at the community and decision-making level in overcrowded destinations [18]. Despite the recent, exponentially expanding, literature that has been produced on this topic [33], displaying relative concerns, the overtourism context still remains obscure and lacks a clear-cut, widely accepted, definition as well as a well-documented and commonly agreed methodological approach (steps, criteria and related indicators) in order for this to be identified and assessed. Lacking are also commonly accepted thresholds, beyond which tourism development of a destination is demonstrated as overtourism. In fact such thresholds are rather quite difficult to be defined, since they are largely grounded in destination’s carrying capacity, which is perceived as the amalgam of specific or place-related factors, including tourism type, tourist flows through time and space, stage of development, environmental and social peculiarities, fragility of the destination, etc. Thus no general guidelines for determining a destination's tourism capacity are identified as each tourism destination environment can display multiple relevant thresholds [15]. Furthermore, since overtourism is subject to various interpretations, emanating from different viewpoints and disciplines [34,35], certain kind of disagreement with regard to policy reaction is also noticed.
That said, the present paper attempts to add to the literature corps by indulging into the overtourism concept and elaborating on methodological concerns and relevant indicators for assessing, managing and monitoring overtourism or the risk of overtourism as the means for relevant decision-making to be facilitated. The contribution of this work lies in: systematizing current methodological endeavours into a coherent, integrated, of universal use, and sound methodological framework; and identifying relevant indicators’ groups that support implementation of this framework. This, apart from the main two pillars of such an exploration – i.e., tourist demand and supply, being mostly the ground of relevant studies in the literature – it also attempts to highlight and quantify spatial, environmental, land use, economic, etc. impacts of overtourism that can potentially lead to the degradation of the tourist destination per se and the loss of those critical attributes upon which destination’s attractiveness is based [36,37]. In addition, considering the limited number of overtourism assessment studies that attempt to place the impacts of the tourism sector’s growth (demand and supply) in the spatial context of the highly vulnerable insular territories by means of related spatial repercussions, this work attempts to partially fill this gap and enrich current literature. Towards this end, it illuminates the methodological ground and produces empirical evidence from its application in a specific case study, Santorini Island, namely a highly-rated tourist destination, located in the Southern Aegean Region, Greece; that lies at the top positions of destinations characterized by overtourism [38,39,40,41]. Τhe methodological framework and data elaboration procedures used for the indicators’ analysis are designed in a way to permit replication to other case study areas, thus adding to the universal applicability of this research work.
The paper is structured as follows: in Section 2, a literature review is carried out, aiming to identify/classify sets of indicators that can be of relevance for exploring the overtourism condition; in Section 3, the methodological framework developed in this work, the selected sets of indicators as well as the data sources are shortly outlined; in Section 4 the dynamics of the tourism sector in the study region are delineated; in Section 5 assessment of overtourism of the selected case study – Santorini Island – is demonstrated; in Section 6 discussion of results is carried out; while finally in Section 7 key conclusions are drawn.
2. Literature Review on Indicators for Assessing Overtourism
As noticed by Butler and Dodds [9], vulnerability of islands to overtourism is largely grounded in their geographical size and location, size and cohesion of local population, accessibility and links to tourist markets as well as relative power or control over their own development. That said, assessment of overtourism per se is not a straightforward task [24,33]. Moreover, a certain gap is noticed in terms of both a common approach for such an assessment and a commonly-defined and widely accepted set of indicators that can be used in this respect. This, in turn, raises obstacles to conducting, on a common ground, comparative studies among various destinations and documenting potential thresholds, beyond which the tourism pattern in a specific destination can be featured as ‘overtourism’ [33,36,42].
In seeking to feature types of indicators that are relevant when exploring the overtourism state, a literature search on the topic is conducted, highlighting methodological pathways and related indicators on the one hand; as well as case study examples and the pool of specific indicators that are applied, on the other. Following this search, a sort of indicators’ groups can be identified that are pertinent to the exploration of the overtourism state or risk (Figure 1). Further to these groups, it has to be stressed that overtourism assessment has to follow a place-based stream that takes into consideration the particular attributes of each single destination, e.g. natural and cultural resources, value system, local economic structure, attributes of host population at hand, etc. Locally-induced political power for controlling future pathways is also critical in this respect [9]. In addition to the aforementioned, it should be kept in mind that complexity of assessment of the overtourism state per se as well as its high reliance on each single destination’s peculiarities introduces uncertainties as to the establishment of an upper threshold of tourists, beyond which a destination’s state is running of overtourism risk [36].
Following this classification of indicators, overtourism assessments can follow both quantitative and qualitative paths, with the former being established on a set of quantitative indicators, e.g. tourism accommodation in the destinations in terms of number of hotels or beds [17] or land consumed due to urban sprawl in a destination [36]; while the latter is realized through more qualitative data, e.g. attitudes of host community of the destination against tourism/visitors or tourists’ perceptions about the destination [30] as the means for grasping the number of visitors a destination can bear [43].
Literature review also demonstrates one additional group of indicators for assessing overtourism – actually a quite important one, as demonstrated by the various literature-based case studies – that is purely linked to tourism activity per se in a destination, including both the demand and the supply side. These indicators are further distinguished to those marked as ‘absolute indicators’, e.g. number of beds of a certain destination, which can be used for e.g. assessing tourism dynamics in this destination; and those that relate tourism variables to other general aspects in the destination, attributed as ‘relative indicators’ (Figure 1) [33], being mainly used for overtourism assessments. The group of relative indicators is further discriminated into two broad categories, namely a first that expresses tourism intensity and a second associated with tourism density. Tourism intensity indicators are those emanating from absolute indicators divided by the resident population of the geographical area concerned; and display the pressure of tourism on the population. Those demonstrating tourism density emerge from absolute indicators divided by the size of the geographical area concerned; and are used to ascertain the pressure of tourism on the territory. In addition, indicators identified in the literature can be further distinguished to those that assess vulnerability to overtourism, e.g. rate of GDP reliance on tourism; or territorial aspects of overtourism, e.g. urban sprawl due to tourism accommodation and infrastructure development, loss of agricultural land in a destination. Finally, indicators for overtourism assessment are classified into those expressing direct impacts of overtourism, e.g. ecological damage, land use changes due to tourism infrastructure deployment, loss of agricultural land, etc. [7]; and the ones highlighting indirect impacts of overtourism, e.g. degradation or loss of cultural heritage [44], displacement of communities from certain core tourism settlements [7], loss of social cohesion of the host population [5,36].
Currently, a commonly-agreed and unified set of indicators for overtourism identification does not exist. In fact, when seeking to assess or identify the overtourism phenomenon, various indicators are proposed by a number of research endeavours [9,14,17,28,30,42,45,46]. The majority of them relies on indicators reflecting the tourism pressure in terms of supply and demand, both being at the heart of the current discussion on overtourism; while a few of them expand discussion on overtourism by encompassing additional indicators, related to the spatial and temporal concentration of tourist flows, rate of growth, added value of tourism in terms of its interaction with other activities, etc. It should also be noted that the selection of indicators is also largely driven by data availability, which can evidently guide or affect each specific endeavour and lead to incomplete overtourism assessment or certain approximation of it to the detriment of its criticality for establishing more informed overtourism remedy policies in a destination. Generally speaking, lacking are spatially disaggregated data on tourism demand and supply; socio-economic data that can accurately capture a destination’s profile; societal responses to tourism; high-resolution environmental assessment data; and data on climate-related threats. An additional obstacle in respect of data availability relates to data that are not monitored nor are available for the requested territory; or are just not up-to-date. Furthermore, since data are often not available, new forms of relevant sources need to be discovered in order for overtourism assessments to be properly accomplished. Moreover, worth mentioning is the comparative credibility of data, since apart from land use and environmental data, obtained through global or pan-European geospatial databases like Copernicus Land Monitoring Service, most tourism-related data come from local/national databases and are occasionally incomplete or simply not comparable.
3. Methodology & Data
3.1. Methodology
The issue of overtourism is currently highly rated in the agendas of policy makers, planners and local administration / communities. That said, within the scope of this paper falls the development and implementation of a planning-oriented, of universal use, methodological framework (Figure 2) that can act as a guide for exploring overtourism signs or state in various tourism destinations.
The proposed framework (Figure 2) is grounded in:
- The very essence of the tourism phenomenon and its main constituents, i.e. supply, demand, and destination’s tourism and other infrastructure as well as their impacts on the particular natural, cultural and human context of each single destination.
- The PSR – Pressure/State/Response model as a structured, well-proven and robust framework [47] for better understanding actions and activities that are affecting the state of a system; and are feeding appropriate policy response for addressing them. This builds upon a range of properly selected indicators and can orient evidence- and place-based policy reaction of, among others, the overtourism phenomenon.
The starting point of this framework is associated with the destination itself and more specifically with the driving forces, upon which its attractiveness is relied, reflecting thus the place-based rationale of such a framework. As driving forces of a destination are considered the: natural and cultural assets this hosts, which actually constitute the main motive for tourism attraction; unimpeded accessibility, implying options available for smoothly reaching the destination; tourism accommodation and related entrepreneurship (food, facilities, etc.) – tourism supply – for serving the needs of tourist flows; and public infrastructure per se (transport networks, health infrastructure, water and energy infrastructure, etc.), being also part of the quality of tourism experience in a destination. Positive assessment of those driving forces by travellers are largely defining the level of tourism demand; while, in turn, developments in the destination (e.g., further deployment of public infrastructure or accessibility networks, expansion of accommodation infrastructure), coupled with the rising volume of tourism flows (rising tourism demand) are the main sources of impacts occurring on the natural, cultural and social scenery of the destination. In addition, based on data related to tourist supply and demand, the dynamics of the tourism sector in the destination can be featured.
The next step of the proposed framework aims at identifying – both quantitatively and qualitatively – the impacts of the aforementioned components on the destination. These refer mainly to impacts on the valuable natural and cultural assets (degradation of ecosystems, landscape, cultural heritage etc.), the spatial pattern (land use changes), but also the economic (changes in the economic profile and prevalence of the tertiary sector) and social structure (loss of local identity, social cohesion etc.) of the destination. In order for such an assessment to be accomplished, a relevant set of indicators, drawn upon the international literature / experience is used; with indicators being selected and properly adjusted to reflect the specific peculiarities of the case study region.
Based on the outcome of the above-mentioned step, response to the question whether the destination under examination is suffering or not from overtourism is based on a two-stage approach, grounded in the: a) national experience through comparative study and related outcomes, and b) combined interpretation of qualitative and quantitative results, emanating from the selected indicators. In case of a negative response as to whether an overtourism state is noticed, a steady monitoring of the destination is following in order for early overtourism signs to be identified and be properly addressed in the policy realm. In the opposite case – i.e. the destination suffers from overtourism – the proposed framework is capable of explicitly addressing the critical overtourism dimensions and thus properly guiding policy (or community) reaction to effectively cope with them.
Implementation of the aforementioned framework in this work uses as case study the island of Santorini, South Aegean Region, Greece. Taking into account that this specific island is rating high in the lists of destinations around the globe that suffer from overtourism [38,39,40,41], Santorini Island consists of a fruitful ground for validating the usefulness and effectiveness of the proposed framework and documenting Santorini’s overtourism context.
3.2. Data and Indicators
Drawn upon literature review, the list of indicators used in this work for assessing the main components of the proposed framework, i.e., tourist supply, demand and their impacts on the environment, economy, society but also space (Figure 2) are demonstrated in Table 1, Table 2 and Table 3. The majority of indicators of these tables are falling into two categories, namely tourism intensity and tourism density (Table 1 and Table 2 – 11 indicators). This indicators’ set is further expanded to incorporate additional indicators (Table 3), which are grasped as useful for exploring environmental/spatial (6 indicators), economic (4 indicators), and social (3 indicators) impacts of tourism in Santorini Island. Geospatial analysis is conducted in this respect in order for the spatial implications of tourism to be identified and quantified. It should be noted here that permanent population data, used in this work, refer to the year 2021 (National Census Data). However, for the purpose of calculations in Table 1 and Table 2, conducted for the years 2023 and 2022 respectively, population data in 2021 is used, assuming that the permanent population of the study area remains unchanged.
Data with regard to the indicators used in this study are gathered from the sources displayed in Table 4. It should be noted here that all data are georeferenced to the LAEA-Europe projection system (ETRS89-extended - EPSG:3035), while the territory of Santorini Island is split into 6 local zones, based on aggregations that are drawn upon the official administrative boundaries (https://www.statistics.gr/digital-cartographical-data) [48].
4. Featuring the Evolving Tourism Dynamics in Santorini Island
Santorini Island (or Thera) is part of the Cyclades complex, Southern Aegean Region, Greece (Figure 3). Administratively, the island belongs to the Municipality of Thera, which, apart from Santorini Island – the main tourist destination of the municipality – it also incorporates the smaller island of Thirasia and the uninhabited islets of Palaia Kameni, Nea Kameni, Aspronisi, Christiani, Askania and Esxati. The area of the municipality is 90.69 km2 and its population amounts to 15,480 inhabitants, according to the 2021 Census. Worth noticing is the remarkable increase of municipality’s population in the time span 2001-2021 (+12.79%), surpassing the rising population trends of the Region of Southern Aegean (+9.84%), in contrast to the general population decline trend of the Greek country as a whole (-4.13%).
The island of Santorini (or Thera) is currently a highly-reputed tourist destination on a global scale, featured by remarkable natural and cultural assets; and a special geomorphology, witnessing its volcanic origin. The whole area of the island is marked as ‘Landscape of Outstanding Natural Beauty’ (Code AΤ5011063), while the same holds for the island of Thirasia and the islets of Aspronisi, Palaia Kameni and Nea Kameni (Code AΤ5010091). In addition, Santorini Island, but also the whole area of Thera Municipality, disposes a rich cultural heritage, incorporating historical / archaeological sites and traditional settlements. Moreover, the agricultural production has a long tradition in the island, being so far well known for its Protected Designation of Origin (PDO) products, such as wine, small tomatoes and fava bean that have, among others, strengthened the island’s extroversion.
Having in mind that overtourism is the outcome of a rapidly evolving tourism demand and supply in a destination [33], the dynamics of the tourism sector – demand and supply – in Santorini Island are explored as a first step in this work, seeking to grasp their evolution over time. Towards this end, a range of absolute indicators as to the tourism demand and supply are investigated, demonstrating the growth rates of the tourism sector in the study region as well as their spatial distribution. More specifically, the evolution of tourism supply and demand is delineated by use of the absolute indicators demonstrated in Table 5.
In Figure 4 and Figure 5 the dynamics and spatial pattern of tourism supply is delineated, coupled with the built-up space in Santorini Island in 2018. More specifically, the number of hotel units in the Municipality of Thera seems to follow a strongly increasing course in the time span 2012-2023, as shown in Figure 4a, with the majority of hotel accommodation of the Municipality of Thera being located in Santorini (Thera) Island. The same holds for hotel rooms and beds (Figure 4b,c). Actually in the period 2012-2023, a noticeable increase of 16,7%, 37,0% and 43,13% in hotel units, rooms and beds respectively has occurred, with a remarkable prevalence of the 5* hotel category. The tourism supply of the Municipality of Thera in general and Santorini Island in particular is also further enriched by the rapid increase of Airbnb accommodation. In 2023, the number of Airbnb accommodations rises to 4783 units and 10750 beds [57], which sounds to be a quite large number, taking into consideration that the Athens metropolitan capital disposes 11314 Airbnb beds.
In fact it is also worth noticing that Santorini Island owns the largest number of Airbnb accommodation (4783 units), compared to any other island of the Cyclades complex and the Southern Aegean Region as a whole; and is actually followed by the islands of Mykonos (3418 Airbnb accommodations) and Paros (3134 Airbnb accommodations), with these three islands – Santorini, Mykonos and Paros – being marked as the protagonists of Airbnb development in Southern Aegean Region. Further to that, the spatial pattern of the bulk of hotel and Airbnb accommodation in Santorini Island displays a similar spatial pattern (Figure 5a,b); while the same holds for the pattern of built-up space in 2018 (Figure 5c) that is in line with the escalating pressure for tourism accommodation infrastructure, serving the rising tourist demand in Santorini Island. In addition, in Figure 5c is also evident the pressure exerted by tourism accommodation on the arable land and vineyards in Santorini Island as well as the deployment of tourism accommodation in proximity or inside protected natural areas and archaeological sites.
In Figure 6 the dynamics of tourism demand is roughly sketched. More specifically, arrivals by air in the time span 2016-2023 (Figure 6a) show a strong upward trend, demonstrating an increase of 62.61% in this period, with a short break in the COVID-19 period. The same holds with arrivals in hotel accommodation (Figure 6b), which in the time span 2010-2022 demonstrate a remarkable increase of 487.84%. On the contrary, arrivals by cruise ships in Santorini Island in the time span 2013-2022 (Figure 6c) display a more stable pattern, rising in this period by 6,24%; while a certain escalating trend is noticed in the number of cruise ships’ arrivals in the same time span (Figure 6d), reaching an increase of 17,86%.
The tourism dynamics in the island of Santorini, as previously presented by means of absolute indicators, clearly demonstrates the escalating trends of the tourism sector – both in terms of supply and demand – in this island. In order to explore overtourism signs, however, absolute values of these indicators have to be scaled by island’s surface and size of population, thus putting them into relation to the destination’s capacity. In addition, they need to be combined or co-interpreted with other indicators as well, a task that is accomplished in the following section.
5. Assessing Overtourism Signs in Santorini Island – Empirical Results
The impacts of the tourism sector in the island of Santorini are presented in this section by calculating values of the indicators presented in Table 1, Table 2 and Table 3. Results of such calculations are demonstrated in Table 6, Table 7, Table 8 and Table 9 below.
Based on these results, a two-stage assessment is conducted as follows (see Figure 2):
- firstly, a comparative assessment is carried out, based on indicators’ calculation – tourist supply TSi and demand TDi indicators – for all islands of the Cyclades complex in order for positioning Santorini Island in the immediate insular context, namely the Cyclades Regional Entity (part of the Southern Aegean Region), being a highly touristic insular entity of the Greek territory (Table 6 and Table 7);
- secondly, an integrated assessment of the state of Santorini Island is conducted, taking into account the values of indicators associated with the tourism supply and demand; sustainability indicators (environmental, economic and social); and the spatial pattern of tourism development and related implications (Table 8 and Table 9).
More specifically, at the first stage of assessment, a comparative analysis is accomplished. In this respect, values of the proposed indicators TSi and TDi for the 18 Islands / Municipalities of the Regional Entity of Cyclades complex – Santorini is part of this complex – are calculated and compared (Table 6 and Table 7). This analysis aims at highlighting the position of Santorini Island in terms of tourism density and intensity in this Regional Entity. Inspection of results demonstrates that Santorini Island gains the highest or the second highest score (ranking second only after Mykonos) in the majority of TSi and TDi indicators (Table 6 and Table 7). Worth mentioning is the value of TS6 (Table 6), displaying the pressure of tourism infrastructure (hotel and Airbnb) on the island’s area. Actually, in TS6 Santorini is placed at the first position, at a large distance from the rest islands of the Cyclades complex, including Mykonos Island. Additionally, despite the pressure exerted on local resources and the resulting unsustainable state of the island, Santorini still remains a highly attractive destination, marked also by: a high level of tourist service, as values of TD4 and TD5 demonstrate; and a high extroversion, as shown by the indicators TD2 and TD3, featuring the share of foreign tourists to be the prevalent one in the island. Tourism flows, however, seem to exert high pressure on local population (TD1). Furthermore, the high tourism intensity of Santorini Island – interpreted as pressure to the local population –, comparing to the rest islands of the Cyclades complex is clearly depicted by the value of TS1 (second position after Mykonos Island). Finally, Santorini Island falls into the group with high tourism saturation level in terms of hotel and Airbnb beds with respect to the population and the surface of the island (TS4); and the group with high tourism infrastructure density (TS5). It should be noted here that if comparison takes place only between the large islands of Cyclades complex in terms of population and surface, then Santorini Island in TS5 ranks first (smaller islands in population and surface terms are definitely altering calculation results in this respect). Here it should also be noticed that the volcanic origin of Santorini Island renders potential areas for tourism infrastructure deployment rather limited, thus exacerbating the density of such infrastructure and related pressure on the island.
In conclusion, the comparative analysis witnesses that Santorini follows a definitely intense tourism growth pattern, both in terms of supply and demand. The sustainability implications of this pattern are assessed in the following in order for a complete insight, interpretation and assessment of overtourism state or risk to overtourism of Santorini Island to be sketched.
Calculations related to the second stage, targeting an integrated assessment of the overtourism state of Santorini Island, are presented in Table 8 and Table 9. Results in Table 8 (EC4 indicator) demonstrate the prevalence of the tourism sector that is witnessed by the employment share of the tertiary sector. This rates pretty high and displays an escalating trend to the detriment of the primary and secondary sectors, which demonstrate downturn signs through time.
In addition, based on the results of geospatial analysis for the indicators EN1-EN6, EC1-EC3 and S1 (Table 9), for the six local zones of Figure 7 (these correspond to a spatial differentiation based on administrative boundaries [48]), the following remarks can be drawn:
- The central and southern part of the island (Zones 3 and 4) are the most heavily impacted by construction, followed by the northern part (Zone 2 mainly, and next Zone 1).
- All zones, apart from Zone 6, are characterized by significant environmental vulnerability (maximized in Zone 5 that includes the archaeological zone of Akrotiri), while building within protected areas can reach up to 12.7% of land (Zone 4).
- Vegetation health and coverage (as captured by NDVI) is rapidly decreasing in the past years, with these attributes displaying a more rapid pace in Zones 3, 4, and 5.
- Agricultural land (as depicted by Corine Land Cover) is rapidly shrinking over the past three decades, rising to a 25% per cent on the island level and above 40% in the northern part of Santorini as well as the Therasia land. A significant percentage of remaining wider agricultural zones is now left uncultivated, especially in the central-southern part (Zones 3, 4 and 5).
- Large scale tourism infrastructure that includes 4* and 5* hotels of significant bed capacity, pools and other auxiliary spaces covering large plots, is estimated to a significant 12-18% coverage of total artificial land, located in the northern and central part; while such infrastructure dominates (35%) in the Akrotiri territory (Zone 5), where no significant local settlement is established.
- Santorini at an overall level presents significant loss of housing affordability as the mean rental price is 56% higher than the average for Cyclades and Attika Region; while mean price for sale is 100% higher. This is clearly manifested in the extreme difficulties reported especially for deputy school teachers to find a residence when they arrive to the island, but certainly it also affects various groups of local population.
As shown by EN3 indicator, built-up areas continue to expand, usually taking the form of large-scale (or in certain cases medium-scale) tourism development in exurban areas. Moreover, close inspection of the EN4 indicator (NDVI loss) shows that vegetation degradation and loss is considerably affecting the vineyards (Figure 8), i.e. a very important resource for the famous (PDO product) local wine of Santorini and a milestone of agricultural tradition. This degradation can be a combined effect of climate change and drought, as well as the sprawling of new constructions (or relevant preparatory works) taking place since 2017 in such fields (Figure 9). According to most indicators, the central part is very heavily affected by built-up areas, while significant pressure is currently identified in the northern part (Oia settlement) and towards the outstanding archaeological space of Akrotiri in the southern part of Santorini Island.
6. Discussion
In recent years, the integration of sustainability objectives into tourism planning and management has been advocated by the scientific and policy community, bringing forward a paradigm shift that is in alignment with the 2030 UN Agenda and the SDGs; and aims to achieve a balance among economic growth, environmental stewardship and social responsibility [63]. Such a shift stresses the importance attached to the adverse impacts – both quantitative and qualitative – of tourism overload in destinations, especially in those ones that are suffering from overtourism; and takes the form of a transition from ‘tourism growth’ – in terms of number of visitors, economic output etc. – to ‘sustainable tourism’ that delves into the interaction of tourism with other sectors, hosting communities, natural and cultural capital as well as other policy directions at the destination level. Concurrently, rising awareness but also experience of the repercussions of overcrowded destinations and related impacts on the quality of life of population has given rise to social movements at the community level, as a means to protest against the escalating tourism load in destination territories [14]. Remarkable examples of such movements have taken place especially in urban environments, such as Venice [64] or Barcelona [63], to name but a few. However, as clearly stated by a range of research works, more vulnerable to the overtourism phenomenon seem to be coastal, insular and rural heritage sites [17].
That said, the focus of the present work is on insular territories and particularly those lying in the Mediterranean Region, including Greek ones, as world’s leading sun, sea and sand (3S) mass tourism destinations and – as evidence shows – distinct examples for studying the overtourism condition. Indeed, insular territories as geographically constrained land parcels, with the insularity state being largely conditioning their developmental trajectory [5,8,36], are quite vulnerable to overtourism. These territories, in contrast to their insularity-related structural weaknesses, are endowed by a highly-valued natural and cultural capital that renders them: unique and highly attractive places for tourists; highly competitive destinations in the global tourism scenery; and challenging places for both global and local real estate interests, tourism-oriented entrepreneurship and establishment of a ‘visitor’ economy. That said, tourism development in insular regions has been perceived as the cornerstone for coping with developmental barriers; and a way out to the flourishing of local economies and communities by the wealth of employment opportunities tourism provides as a labour-intensive sector. The so far continuously escalating tourism influx in Mediterranean insular territories, however, has through time unveiled its detrimental consequences, raising today severe sustainability and resilience concerns. This holds even more true in the context of the today’s quite challenging external decision environment, featured by climate change threats, water scarcity, rapid urbanization of coastal space and urban sprawl, to name but a few. Within such a scenery, the concept of overtourism in insular territories gains much attention, being by many presented as ‘an old wine in a new bottle’ [22] or a new term to describe an already known, although at present highly exaggerating, tourism overcrowding trend. Concurrently, it constitutes today a new task in the scientific and policy agenda by means of assessing such a state and its implications in the highly sensitive and fragile insular territories. Such an assessment aims at highlighting the key dimensions of overtourism in each single destination – e.g. environmental deterioration, water stress, urban sprawl, loss of agricultural land, structural changes in the local economic profile, threatening of natural/cultural heritage, loss of authenticity and local identity, rising of living costs and real estate, damage to land- and sea-scape, economic inequalities and social exclusion – in order for relevant ‘win-win-win’ (local community, visitors and natural/cultural environment) policy reaction to be articulated for coping with the multiple repercussions of overtourism and remedy, in the same breath, sustainability inefficiencies, developmental lag and identity spoiling of insular territories.
In such an effort, literature research unveils certain critical issues that seem to be the source of overtourism in insular territories. A first and very critical one relates to the developments of the sharing economy and more specifically to the peer-to-peer accommodation providers, such as the case of Airbnb, Booking.com, and Uber. As Hall et al. [65] claim, the globally-dominant platform-based intermediaries can severely affect the rising of tourist flows and their spatial implications in destinations. In fact, Airbnb is often blamed for some of the largest impacts in the accommodation sector and destinations [33,65], mainly due to the fact that it remains, in most of the cases, neither regulated nor monitored. In addition, the role of Airbnb is further intensified by use of the Information and Communication Technologies (ICTs), playing a crucial role as an accelerator of tourism growth as well as temporal and geographical concentration of tourist flows and volumes in certain locations [17]. Starting as a private accommodation development on a small individual scale, Airbnb has currently been transformed into a massive accommodation structure, resulting in destinations’ overtourism [9]. Such problems have so far been noticed in Mallorca [30], but also Greek islands [46]. In fact, developments associated with Airbnb, second homes, and time shares developments have led plans, addressing sustainable tourism objectives, to failure and have allowed the rising of overtourism [66]. The issue of Airbnb’s influence seems to be proven in Santorini Island, as shown in this work, with Airbnb but also hotel accommodation infrastructure being a major source of built-up expansion and urban sprawl, remaining also largely uncontrolled and expanding in vulnerable parts of Santorini Island, e.g., natural and cultural sites of remarkable value.
A second critical issue, leading to islands’ overtourism, relates to their overdependence on offshore tour operators to bring tourism in and promote an island, since in most cases local agencies do not dispose adequate resources, power or capacity to do so [9]. The image promoted by such operators may lead to overtourism, with the small-scale accommodation businesses of islands being unable to oppose against this image and keep track with local identity and traditions, considering the risk of losing the powerful customers’ suppliers [67]. Santorini Island is a typical example of overdependence on offshore operators that are largely affecting overtourism in the island, e.g. cruise companies that constitute one of the major factors for the noticeable overcrowding phenomenon in the island. In addition, dependence on offshore tour operators is evident by indicators demonstrating the share of foreign tourists in the island (TD2 and TD3 indicators in Table 7).
Taking into consideration that problems of overtourism are primarily and usually experienced at the local level, the fact of handling such overdependence on external tour operators is tightly interwoven to a third critical issue, the one of political structure of islands as well as their power and independency to control the rate and nature of tourism development. This is also tightly linked to the options they have in order for alternative sources of employment and income for local population to be ensured when rejecting or strictly limiting tourism development to avoid overtourism [9]. Speaking of the island regions, both the power of political structures – local administrations as parts placed at the lowest level of the policy making pyramid, with considerably confined flexibility and freedom to define the own desirable future of its territory – and the options available in such geographically constrained and resource inefficient regions are rather limited. This holds true for the study area of Santorini as well, which as part of broader administrative entities – Regional Entity of Cyclades Complex and the Region of Southern Aegean, but also the Greek state as a whole in terms of its jurisdiction for setting up strategic policy directions for tourism development, being defined at the central political scene – lacks, to a great extent, political control over the island’s own destiny in general, including developments in the tourist sector as well.
Finally, a fourth critical issue is associated with the role of the local community in planning the tourist development of their island, an issue that highlights the residents’ perspective, being often given insufficient attention or, in many cases, being largely ignored. In literature this issue is stressed, featuring the little attention that is paid to the residents’ perception and the social implications of overtourism [9,14,33]. Lack of local community engagement in tourism planning seems to be the case in the majority of Greek islands, as relevant studies prove [5].
Having these critical issues in mind, this paper attempts to establish a methodological framework for overtourism assessment that is of universal use and is accompanied by a range of relevant sets of indicators that can prove useful for targeted assessments in both mature destinations, as the case of Santorini Island, but also emerging ones, offering thus the chance for either reactive or proactive policy making respectively. The methodological framework follows the rationale of a dynamic, systemic, integrated and feedback-based process in the effort to link driving forces of each single destination with tourism demand and related repercussions, the intensity of which can guide inferences as to the overtourism state or risk to overtourism of the destination at hand. Based on the diversifying attributes of the local environment of each destination, it is evident that implementation of this framework follows a place-based approach.
The proposed indicators, used in this framework, are in alignment with the current theoretical ground and empirical studies with regard to the tourism supply and demand, and are set under the umbrella of the PSR methodological approach. In fact a set of quantitative indicators is selected, aiming at highlighting the tourism density and intensity in a destination. These, combined with the study of the tourism dynamics in each single case study area can, in a way, guide inferences as to the evolution of the tourism sector in a destination. Further to the tourism supply/demand indicators and the dynamics of the tourist sector, an additional indicators’ set is proposed in Santorini case study, being both of quantitative and qualitative nature and aiming to feature the environmental, economic, social and spatial implications of tourism that can define overtourism or risk to overtourism conditions, thus affecting quality of life of local communities. This set of indicators is critical, provided that each single destination presents a distinct socio-economic, environmental, cultural, etc. profile, elements that are largely defining its vulnerability and fragility to tourism impacts. It can also reveal disturbance of resource allocation between competing interests (e.g. tourism and agriculture, as the example of Santorini Island reveals), witnessing thus the sectors mostly affected by overtourism that need to be properly assisted by relevant policies. Combined assessment/interpretation of all sets of indicators mentioned above is used for responding to the question of whether the specific destination suffers from overtourism or not. Results of the implementation of this framework in Santorini Island demonstrate that tourism so far has contributed to the transition of Santorini Island from an agrarian society to a thriving service-oriented economy, mainly a ‘visitor economy’. Both quantitative and qualitative indicators demonstrate an alarming island’s state, implying that certain capacity thresholds have already been reached or even overcome. Quite alarming is also the impacts on the agricultural sector, placing at stake well established, traditional production patterns and PDO products, steering for many decades the island’s extroversion and being part of local identity; while the same holds with the pattern of land use change and the ongoing process of tourist accommodation expansion even within Natura 2000 and Archaeological Zones, or in close proximity to them.
7. Conclusions
The pressure of tourism growth in environmental, social, cultural, territorial, economic etc. terms is expected to intensify in the years to come in order for the needs of the globally rapidly escalating tourism flows to be met. Such a growth in the Mediterranean region in general and Greece in particular, especially in the geographically fragmented insular territories, is associated with the major wealth of employment and income it can offer at the local level, but also its contribution to the national economy. However, this growth is also a source of considerable pressure, resource depletion and degradation, spoiling of insular identity and eventually of unbearable and/or irreversible damages in tourism-prominent areas. Overtourism and related impacts, in this respect, is a state that needs to be seriously grasped by relevant destinations; and has to be dealt with proper spatial planning and related tourism policies as the essential control mechanisms, especially in highly-rated tourism destinations, such as the insular ones. Articulation of policies has to definitely be drawn upon a well-defined data-enabled ground, assessing overtourism state and its key dimensions in each single destination in order for dedicated policy reaction to be articulated, especially when it refers to fragile socio-spatial systems as the case of islands. However, as various researchers claim [14,17], it is necessary to realize that overtourism is a new concept in the planning and policy arena; thus being currently at early stages of the policy cycle. This is justified by the fact that overtourism, in its present exaggerating form, is a phenomenon of approximately the last few decades. Thus it lacks extensive empirical research and comparative analysis as well as those data that are necessary for its documentation and assessment of its impacts on territories. This, in turn, implies that there is still a long way to go before effective policies can be formulated to adequately cope with it. In order to proceed to the next step, i.e. the one of policy analysis and formulation, of critical importance is its exploration by use of multi-level spatially-defined quantitative and qualitative data at requested spatial levels that are capable of highlighting tourism density and intensity as well as their implications in each specific environmental, economic, socio-cultural etc. context. Of critical importance is also the establishment of a pool of indicators that are fed by available, spatially-disaggregated and local-level data and can form the ground for place-based integrated assessments of the overtourism phenomenon. In any case, response to the question ‘How much tourism is too much tourism?’ articulated by Weber et al. [14] does not have a one-size-fits-all response, but has to be answered by: properly prioritizing well-being of locals in a destination, i.e. protect and preserve the natural and cultural capital, local identity and values, social cohesion etc.; and using spatial and developmental planning as a means to promote ‘win-win-win’ solutions (local community - tourists - natural/cultural environment) in order for a fruitful future developmental trajectory that aligns with sustainability and resilience objectives to be attained.
Author Contributions
Akrivi Leka (AL1): Writing, review & editing; Methodology; Data Curation; Writing original – draft (Section 3, Section 4, Section 5 and Section 6). Apostolos Lagarias (AL2): Writing, review & editing; Methodology; Writing original – draft; Data Curation (Section 3, Section 4, Section 5 and Section 6); Anastasia Stratigea (AS): Conceptualization, Writing, review & editing; Methodology; Writing original – draft (Section 1, Section 2, Section 3 and Section 4, Section 6 and Section 7). Panayiotis Prekas (PP): Data Curation (Section 4).
Funding
This research received no external funding.
Data Availability Statement
Data used are contained within the article.
Conflicts of Interest
The authors declare no conflicts of interest. On behalf of all authors, the corresponding author states that there is no conflict of interest.
References
- Misrahi T. What will travel look like in 2030? World Economic Forum, (2016), Available online: https://www.weforum.org/agenda/2016/09/what-will-travel-look-like-in-2030/ (accessed on 22 October 2024).
- Zolfani, S.H.; Sedaghat, M.; Maknoon, R.; Zavadskas, E.K. Sustainable tourism: a comprehensive literature review on frameworks and applications. Econ. Res. 2015, 28(1), 1–30. [CrossRef]
- UNWTO (n.d.). Available online: https://www.unwto.org/sustainable-development (accessed on 16 October 2024).
- OECD. Rethinking tourism success for sustainable growth. In Tourism Trends and Policies 2020; OECD, Ed.; OECD Publishing: Paris, France, 2020; ISSN: 20767773 (online), Available online: https://www.oecd-ilibrary.org/docserver/6b47b985-en.pdf?expires=1731843712&id=id&accname=guest&checksum=9306352C569EF690D59EECBEC18DA594 (accessed on 16 September 2024). [CrossRef]
- Koutsi, D.; Lagarias, A.; Stratigea, A. Evidence-based exploration as the ground for heritage-led pathways in insular territories: Case study Greek Islands. Heritage 2022, 5(3), 2746–2772. [CrossRef]
- Butler, R.W. Sustainable tourism: A state-of-the-art review. Tourism Geographies 1999, 1(1), 7–25. [CrossRef]
- Jurgens, S.S.; Mijts, E.; Van Rompaey, A. Are there limits to growth of tourism on the Caribbean islands? Case-study Aruba. Front. Sustain. Tour. 2024, 3, 1–14. [CrossRef]
- Leka, A.; Lagarias, A.; Panagiotopoulou, M.; Stratigea, A. Development of a Tourism Carrying Capacity Index (TCCI) for sustainable management of coastal areas in Mediterranean Islands – Case Study Naxos, Greece. Ocean & Coastal Management 2022, 216, 105978. [CrossRef]
- Butler, R.; Dodds, R. Island tourism: Vulnerable or resistant to overtourism? Highlights of Sustainability 2022, 1(2), 54–64. [CrossRef]
- UN Tourism (n.d.) Tourism in Small Island Developing States (SIDS). Available online: https://www.unwto.org/sustainable-development/small-islands-developing-states (accessed on 9 November 2024).
- Graci, S.; Dodds, R. Sustainable Tourism in Island Destinations. Routledge: Oxon, UK, 2010; ISBN 9781844077809.
- Coppin, F.; Guichard, V. Tourism as a tool for social and territorial cohesion - Exploring the innovative solutions developed by INCULTUM pilots. In Innovative Cultural Tourism in European Peripheries; K. J. Borowiecki, A. Fresa and J. M. Martín Civantos, Eds.; Routledge: London, UK, 2025; pp. 7–27; ISBN 9781032728995.
- Koens, K.; Postma, A.; Papp, B. Is overtourism overused? Understanding the impact of tourism in a city context. Sustainability 2018, 10(12), 4384. [CrossRef]
- Weber, F.; Stettler, J.; Crameri, U.; Eggli, F. Measuring overtourism. Indicators for overtourism: Challenges and opportunities. Lucerne University of Applied Sciences and Arts, Hochschule Luzern, Institut für Tourismus Wirtschaft, ISBN: 978-3-033-07773-7, 2020, Available online: https://www.researchgate.net/publication/344282239_Measuring_Overtourism_Indicators_for_overtourism_Challenges_and_opportunities (accessed on 12 October 2024). [CrossRef]
- Wall, G. From carrying capacity to overtourism: A perspective article. Tourism Review 2020, 75(1), 212–215. [CrossRef]
- Zemla, M. Overtourism and local political debate: is the over-touristification of cities being observed through a broken lens? Entrepreneurship – Education 2024, 20(1), 215–225. [CrossRef]
- Peeters, P.; Gössling, S.; Klijs, J.; Milano, C.; Novelli, M.; Dijkmans, C.; Eijgelaar, E.; Hartman, S.; Heslinga, J.; Isaac, R.; Mitas, O.; Moretti, S.; Nawijn, J.; Papp, B.; Postma, A. Research for TRAN Committee -Overtourism: impact and possible policy responses, European Parliament, Policy Department for Structural and Cohesion Policies, Brussels, 2018.
- Capocchi, A.; Vallone, C.; Amaduzzi, A.; Pierotti, M. Is ‘overtourism’ a new issue in tourism development or just a new term for an already known phenomenon? Curr. Issues Tour. 2020, 23(18), 2235–2239. [CrossRef]
- Chung, N.; Koo C. The use of social media in travel information search. Telemat. Inform. 2015, 32(2), 215–229. [CrossRef]
- Huertas, A. How live videos and stories in social media influence tourist opinions and behaviour. Inf. Technol. Tour. 2018, 19, 1–28. [CrossRef]
- UNWTO. “Overtourism”? Understanding and managing urban tourism growth beyond perceptions. United Nations World Tourism Organization: Madrid, Spain; 2018.
- Dredge, D. “Overtourism” - Old wine in new bottles? 2017, Available online: https://www.linkedin.com/pulse/overtourism-old-wine-new-bottles-dianne-dredge/ (accessed on 14 November 2024).
- Mihalic, T. Conceptualizing overtourism: A sustainability approach. Annals of Tourism Research 2020, 84, 103025. [CrossRef]
- Gowreesunkar, V. G.; Thanh, T. V. Between overtourism and under- tourism: Impacts, implications, and probable solutions. In Overtourism: Causes, Implications and Solutions; H. Séraphin, Gladkikh, T., Vo Thanh, T., Eds.; Palgrave Macmillan: Cham, Switzerland, 2020; pp. 45–68. [CrossRef]
- Mihalic, T.; Kuščer, K. Can overtourism be managed? Destination management factors affecting residents’ irritation and quality of life. Tourism Review 2021, 77(1), 16–34. [CrossRef]
- Adie, B. A.; Falk, M. Residents’ perception of cultural heritage in terms of job creation and overtourism in Europe. Tourism Economics 2021, 27(6), 1185–1201. [CrossRef]
- Goessling, S.; McCabe, S.; Chen, N. A socio-psychological conceptualisation of overtourism. Annals of Tourism Research 2020, 84, 102976. [CrossRef]
- Vourdoubas, J. Evaluation of overtourism in the island of Crete, Greece. European Journal of Applied Science, Engineering and Technology 2024, 2(6), 21–32. [CrossRef]
- Milano, C.; Cheer, J. M.; Novelli, M. Overtourism: an evolving phenomenon. In Overtourism: Excesses, discontents and measures in travel and tourism; C. Milano, J. M. Cheer, M. Novelli, Eds.; CAB International: Oxfordshire, UK, 2019; pp. 1–17.
- García-Buades M. E.; García-Sastre, M. A.; Alemany-Hormaeche, M. Effects of overtourism, local government, and tourist behavior on residents’ perceptions in Alcúdia (Majorca, Spain). Journal of Outdoor Recreation and Tourism 2022, 39, 100499. [CrossRef]
- Saveriades, A. Establishing the social tourism carrying capacity for the tourist resorts of the east coast of the Republic of Cyprus. Tourism Management 2000, 21(2), 147–156. [CrossRef]
- Milano, C.; Novelli, M.; Russo, A.P. Anti-tourism activism and the inconvenient truths about mass tourism, touristification and overtourism. Tourism Geographies 2024, 1–25. [CrossRef]
- Buitrago, E.M.; Yñiguez, R. Measuring overtourism: A necessary tool for landscape planning. Land 2021, 10(9), 889. [CrossRef]
- Dodds, R.; Butler, R. W. Introduction. In Overtourism: Issues, Realities and Solutions; R. Dodds, R. W. Butler, Eds.; Walter de Gruyter GmbH: Berlin/Boston, 2019; pp. 1–21.
- Gretzel, U. The role of social media in creating and addressing overtourism. In Overtourism: Issues, realities and solutions; R. Dodds, R. W. Butler, Eds.; Walter de Gruyter GmbH: Berlin/Boston, 2019; pp. 263–276.
- Lagarias, A.; Stratigea, A.; Theodora, Y. Overtourism as an emerging threat for sustainable island communities – Exploring indicative examples from the South Aegean Region, Greece. In Proceedings of the Computational Science and Its Applications – ICCSA 2023 Workshops. Lecture Notes in Computer Science; O. Gervasi, B. Murgante, A. M. A. C. Rocha. Ch. Garau, F. Scorza, Y. Karaca, C. M. Torre, Eds.; Springer Nature: Cham, Switzerland, 2023; Part VII, Vol. 14110, pp. 404–421. [CrossRef]
- Constantoglou, M.; Klothaki, T. How much tourism is too much? Stakeholder’s perceptions on overtourism, sustainable destination management during the pandemic of COVID 19 era in Santorini Island Greece. Journal of Tourism and Hospitality Management 2021, 9(5), 288–313. [CrossRef]
- Stanchev, R. The most affected European destinations by over-tourism. Universitat de les Illes Balears, Facultat de Turisme, Grau de Turisme, Any acadèmic 2017-18, Available online: https://dspace.uib.es/xmlui/bitstream/handle/11201/148140/Stanchev_Rostislav148140.pdf?sequence=3&isAllowed=y (accessed on 18 October 2024).
- Wilson, N. 30 destinations cracking down on overtourism, from Venice to Bhutan. Independent, 2024, Available online: https://www.independent.co.uk/travel/sustainable-travel/destinations-cracking-down-overtourism-venice-b2587510.html (accessed on 18 October 2024).
- Bateman, J. Santorini under Pressure: The Threat of Overtourism, 2019, Available online: https://www.greece-is.com/santorini-pressure-threat-overtourism/ (accessed on 18 October 2024).
- O'Toole, L. Beautiful European Island under pressure where even tourists complain about the tourists, Daily Express, 2024, Available online: https://www.express.co.uk/news/world/1910789/santorini-greece-overtourism-tourists-news (accessed on 18 October 2024).
- Simancas Cruz, M.; Pilar Peñarrubia Zaragoza, M. Analysis of the accommodation density in coastal tourism areas of insular destinations from the perspective of overtourism. Sustainability 2019, 11(11), 3031. [CrossRef]
- Veríssimo, M.; Moraes, M.; Breda, Z.; Guizi, A.; Costa, C. Overtourism and tourismphobia. Tourism: An International Interdisciplinary Journal 2020, 68(2), 156–169. [CrossRef]
- Bambrick, H. Resource extractivism, health and climate change in small islands. International Journal of Climate Change Strategies and Management 2017, 10(2), 272–288. [CrossRef]
- Thomas, R.N.; Pigozzi, B.W.; Sambrook, R.A.: Tourist carrying capacity measures: Crowding syndrome in the Caribbean. The Professional Geographer 2005, 57(1), 13–20. [CrossRef]
- Panousi, S.; Petrakos, G.: Overtourism and tourism carrying capacity - A regional perspective for Greece. In Culture and Tourism in a Smart, Globalized, and Sustainable World; V. Katsoni, C. Ciná van Zyl, Eds.; Springer: Cham, Switzerland, 2021; pp. 215–229. [CrossRef]
- OECD Environment at a Glance 2013: OECD Indicators. OECD Publishing, Paris, 2013. [CrossRef]
- Official administrative boundaries. Available online: https://www.statistics.gr/digital-cartographical-data (accessed on 15 November 2024).
- Imperviousness Classified Change Layer. [CrossRef]
- Archaeological zones. Available online: https://www.arxaiologikoktimatologio.gov.gr/en.
- Natura 2000 areas and Wildlife Repositories of Greece. Available online: https://geodata.gr/en/ (accessed on 3 November 2024).
- Agricultural land change. (vector 2018). [CrossRef]
- Agricultural land change. (vector 1990). [CrossRef]
- Coastal Zones Land Cover / Land Use 2018 (vector), Europe, 6-yearly, Feb. 2021. [CrossRef]
- Hellenic Statistical Authority (ELSTAT). Available online: https://www.statistics.gr/en/home/ (accessed on 15 November 2024).
- Institute of the Association of Greek Tourism Enterprises (INSETE). Available online: https://insete.gr/districts/?lang=en (accessed on 8 October 2024).
- Airbnb accommodation. Available online: https://bfortune.opendatasoft.com/explore/dataset/Airbnb-listings/export/?disjunctive.neighbourhood&disjunctive.column_10&disjunctive.city&q=santorini (accessed on 8 October 2024).
- Hellenic Chamber of Hotels. Available online: https://www.grhotels.gr/en/tourist-guide/search-hotels-and-camping/ (accessed on 8 October 2024).
- Spiti24. Available online: https://www.spiti24.gr/ (accessed on 18 October 2024).
- JTR-Airport (Santorini Airport). Available online: https://www.jtr-airport.gr/en (accessed on 15 June 2024).
- Hellenic Ports Association. Available online: https://www.aivp.org/en/aivp/our-members/directory/hellenic-ports-association/ (accessed on 12 October 2024).
- Institute of the Association of Greek Tourism Enterprises (INSETE). The contribution of tourism in the Greek economy in 2023, 2024. Available online: https://insete.gr/wp-content/uploads/2024/04/23_04_Tourism_and_Greek_Economy_2019-2023.pdf.
- Donaire, A.J.; Galí, N.; Coromina, L. Evaluating tourism scenarios within the limit of acceptable change framework in Barcelona. Annals of Tourism Research Empirical Insights 2024, 5(2), 100145. [CrossRef]
- Seraphin, H.; Sheeran, P.; Pilato, M. Over-tourism and the fall of Venice as a destination. Journal of Destination Marketing & Management 2018, 9, 374-376. [CrossRef]
- Hall, C.M.; Prayag, G.; Safonov, A.; Coles, T.; Gössling, S.; Naderi Koupaei, S. Airbnb and the sharing economy. Current Issues in Tourism 2022, 25(19), 3057-3067. [CrossRef]
- Butler, R.W. Sustainable Tourism in Sensitive Environments: A Wolf in Sheep’s Clothing? Sustainability 2018, 10(6), 1789. [CrossRef]
- Bastakis, C.; Buhalis, D.; Butler, R. The perception of small and medium sized tourism accommodation providers on the impacts of tour operators’ power in Eastern Mediterranean. Tour. Manag. 2004, 25(2), 151–170. [CrossRef]
Figure 1.
Types/groups of indicators for assessing the overtourism phenomenon. Source: Own elaboration.
Figure 1.
Types/groups of indicators for assessing the overtourism phenomenon. Source: Own elaboration.
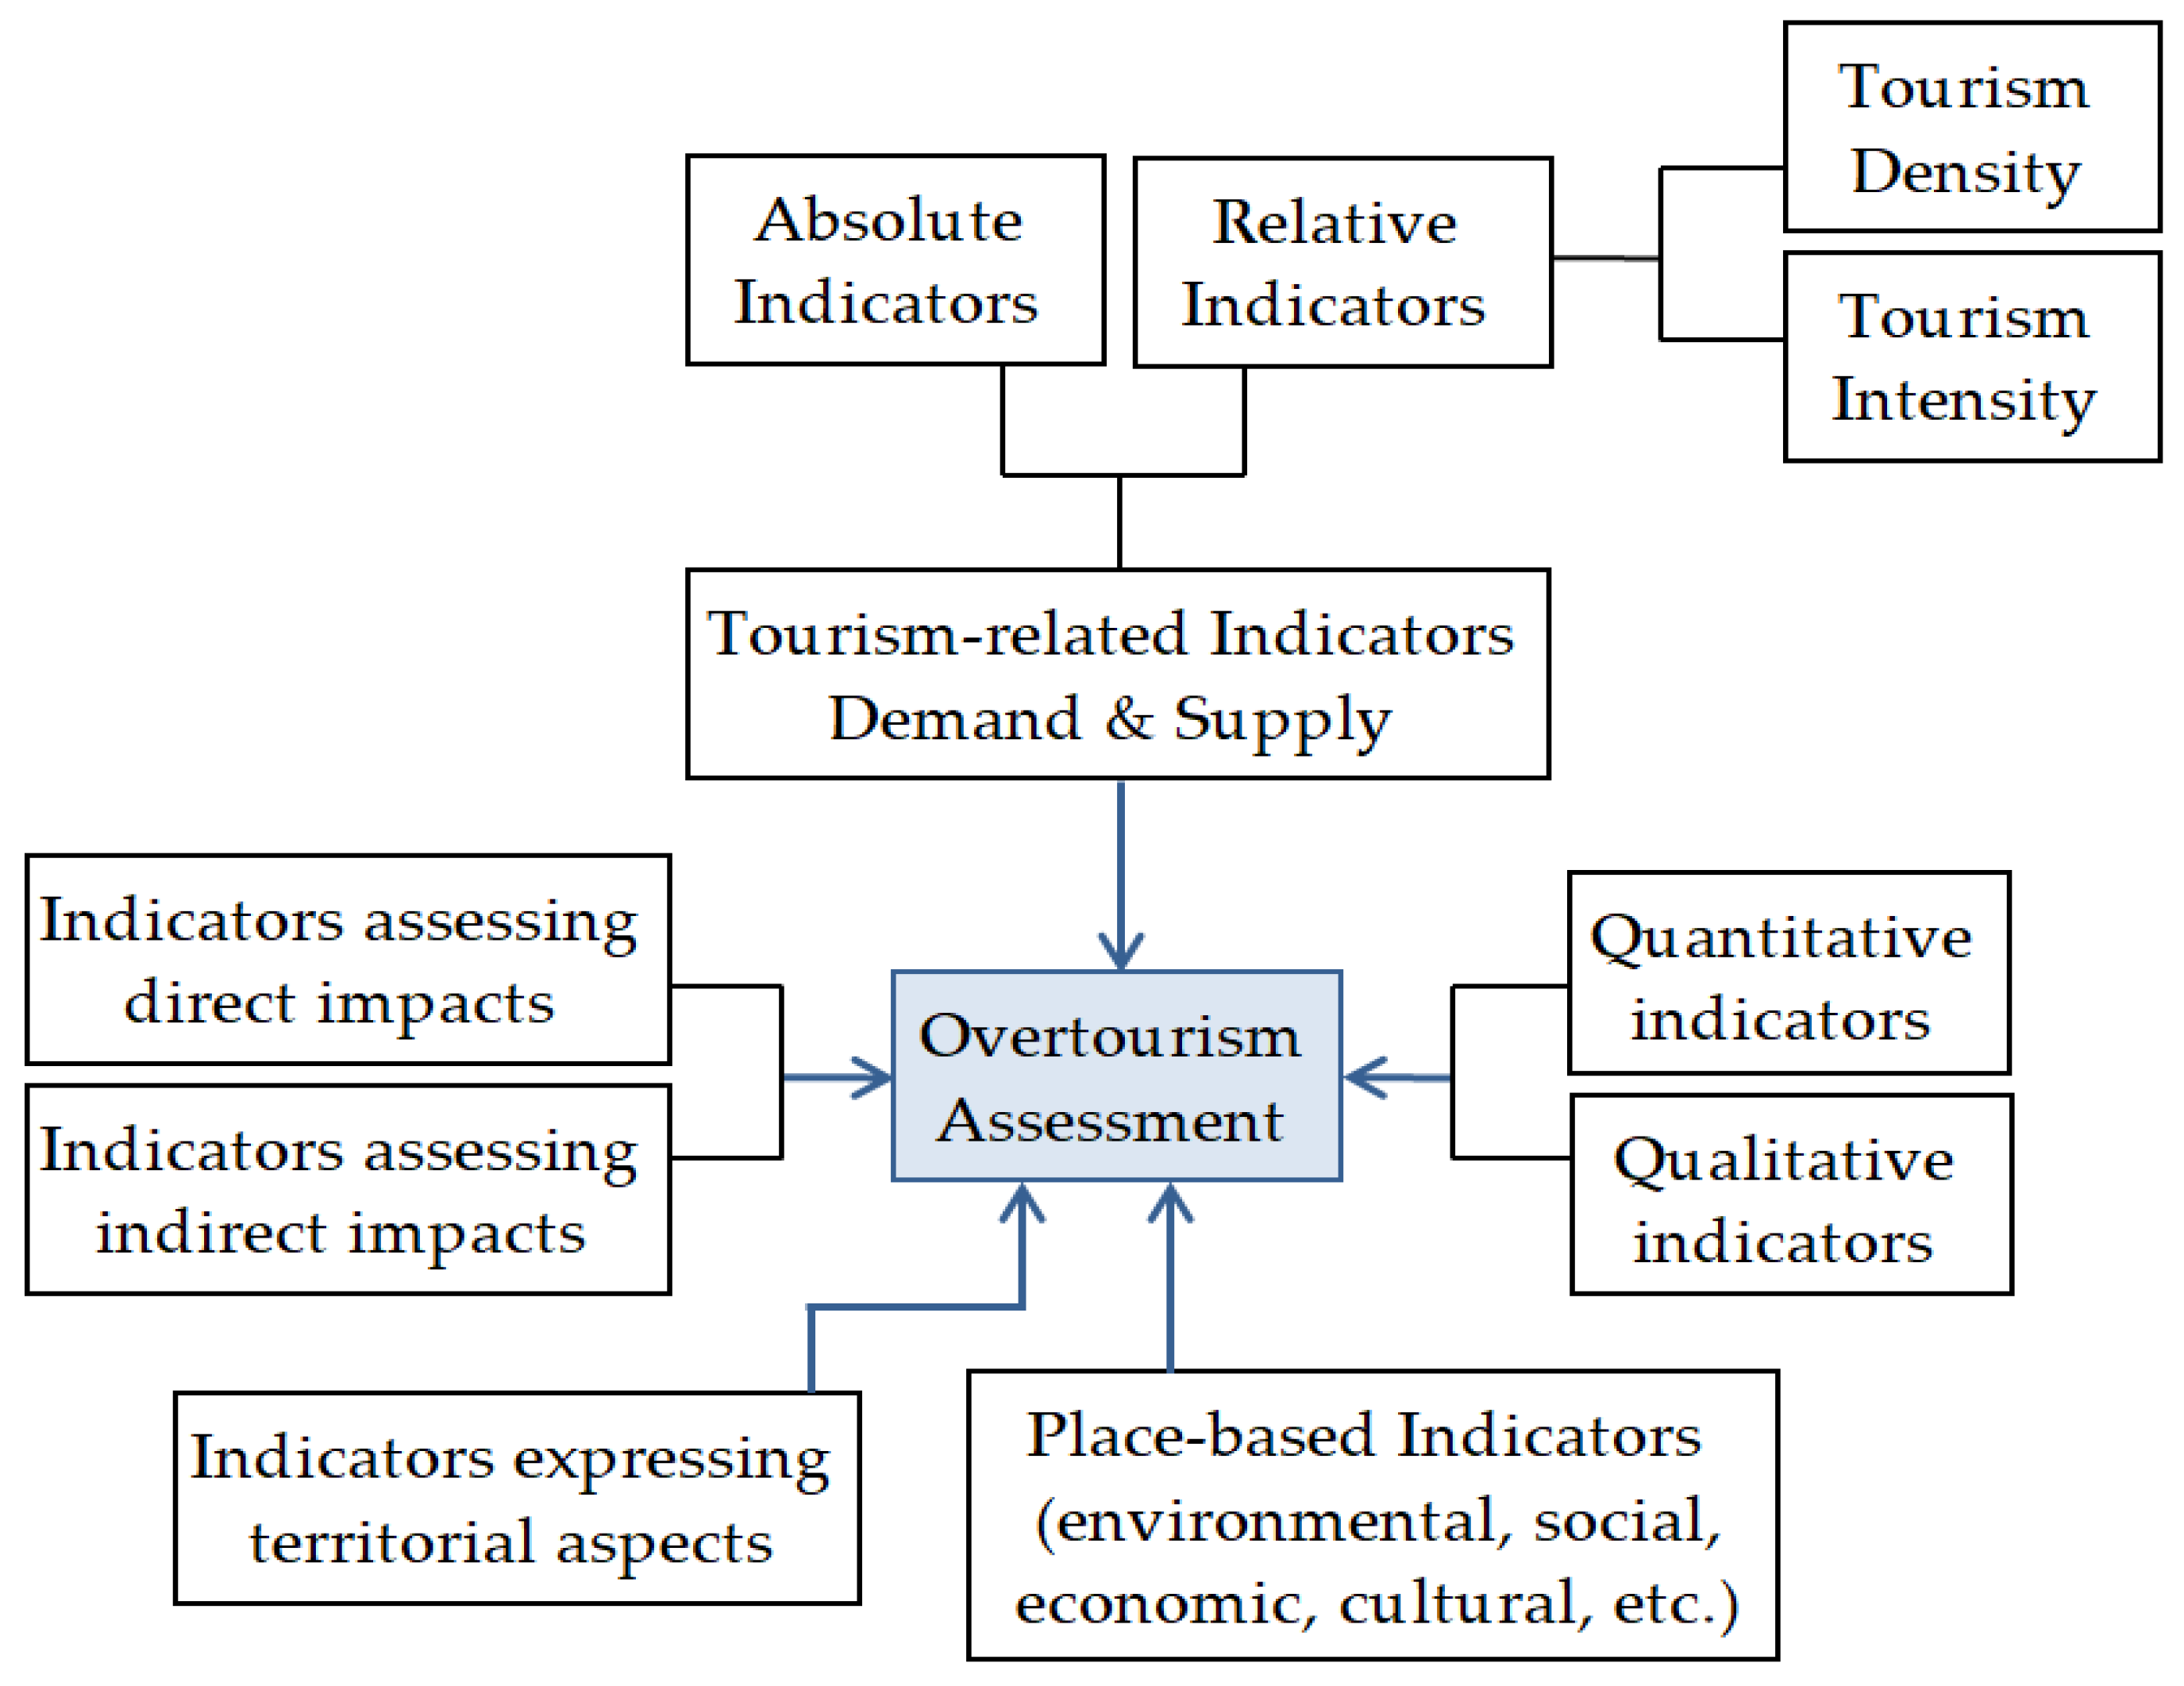
Figure 2.
Steps of the methodological framework for assessing and monitoring overtourism. Source: Own elaboration.
Figure 2.
Steps of the methodological framework for assessing and monitoring overtourism. Source: Own elaboration.
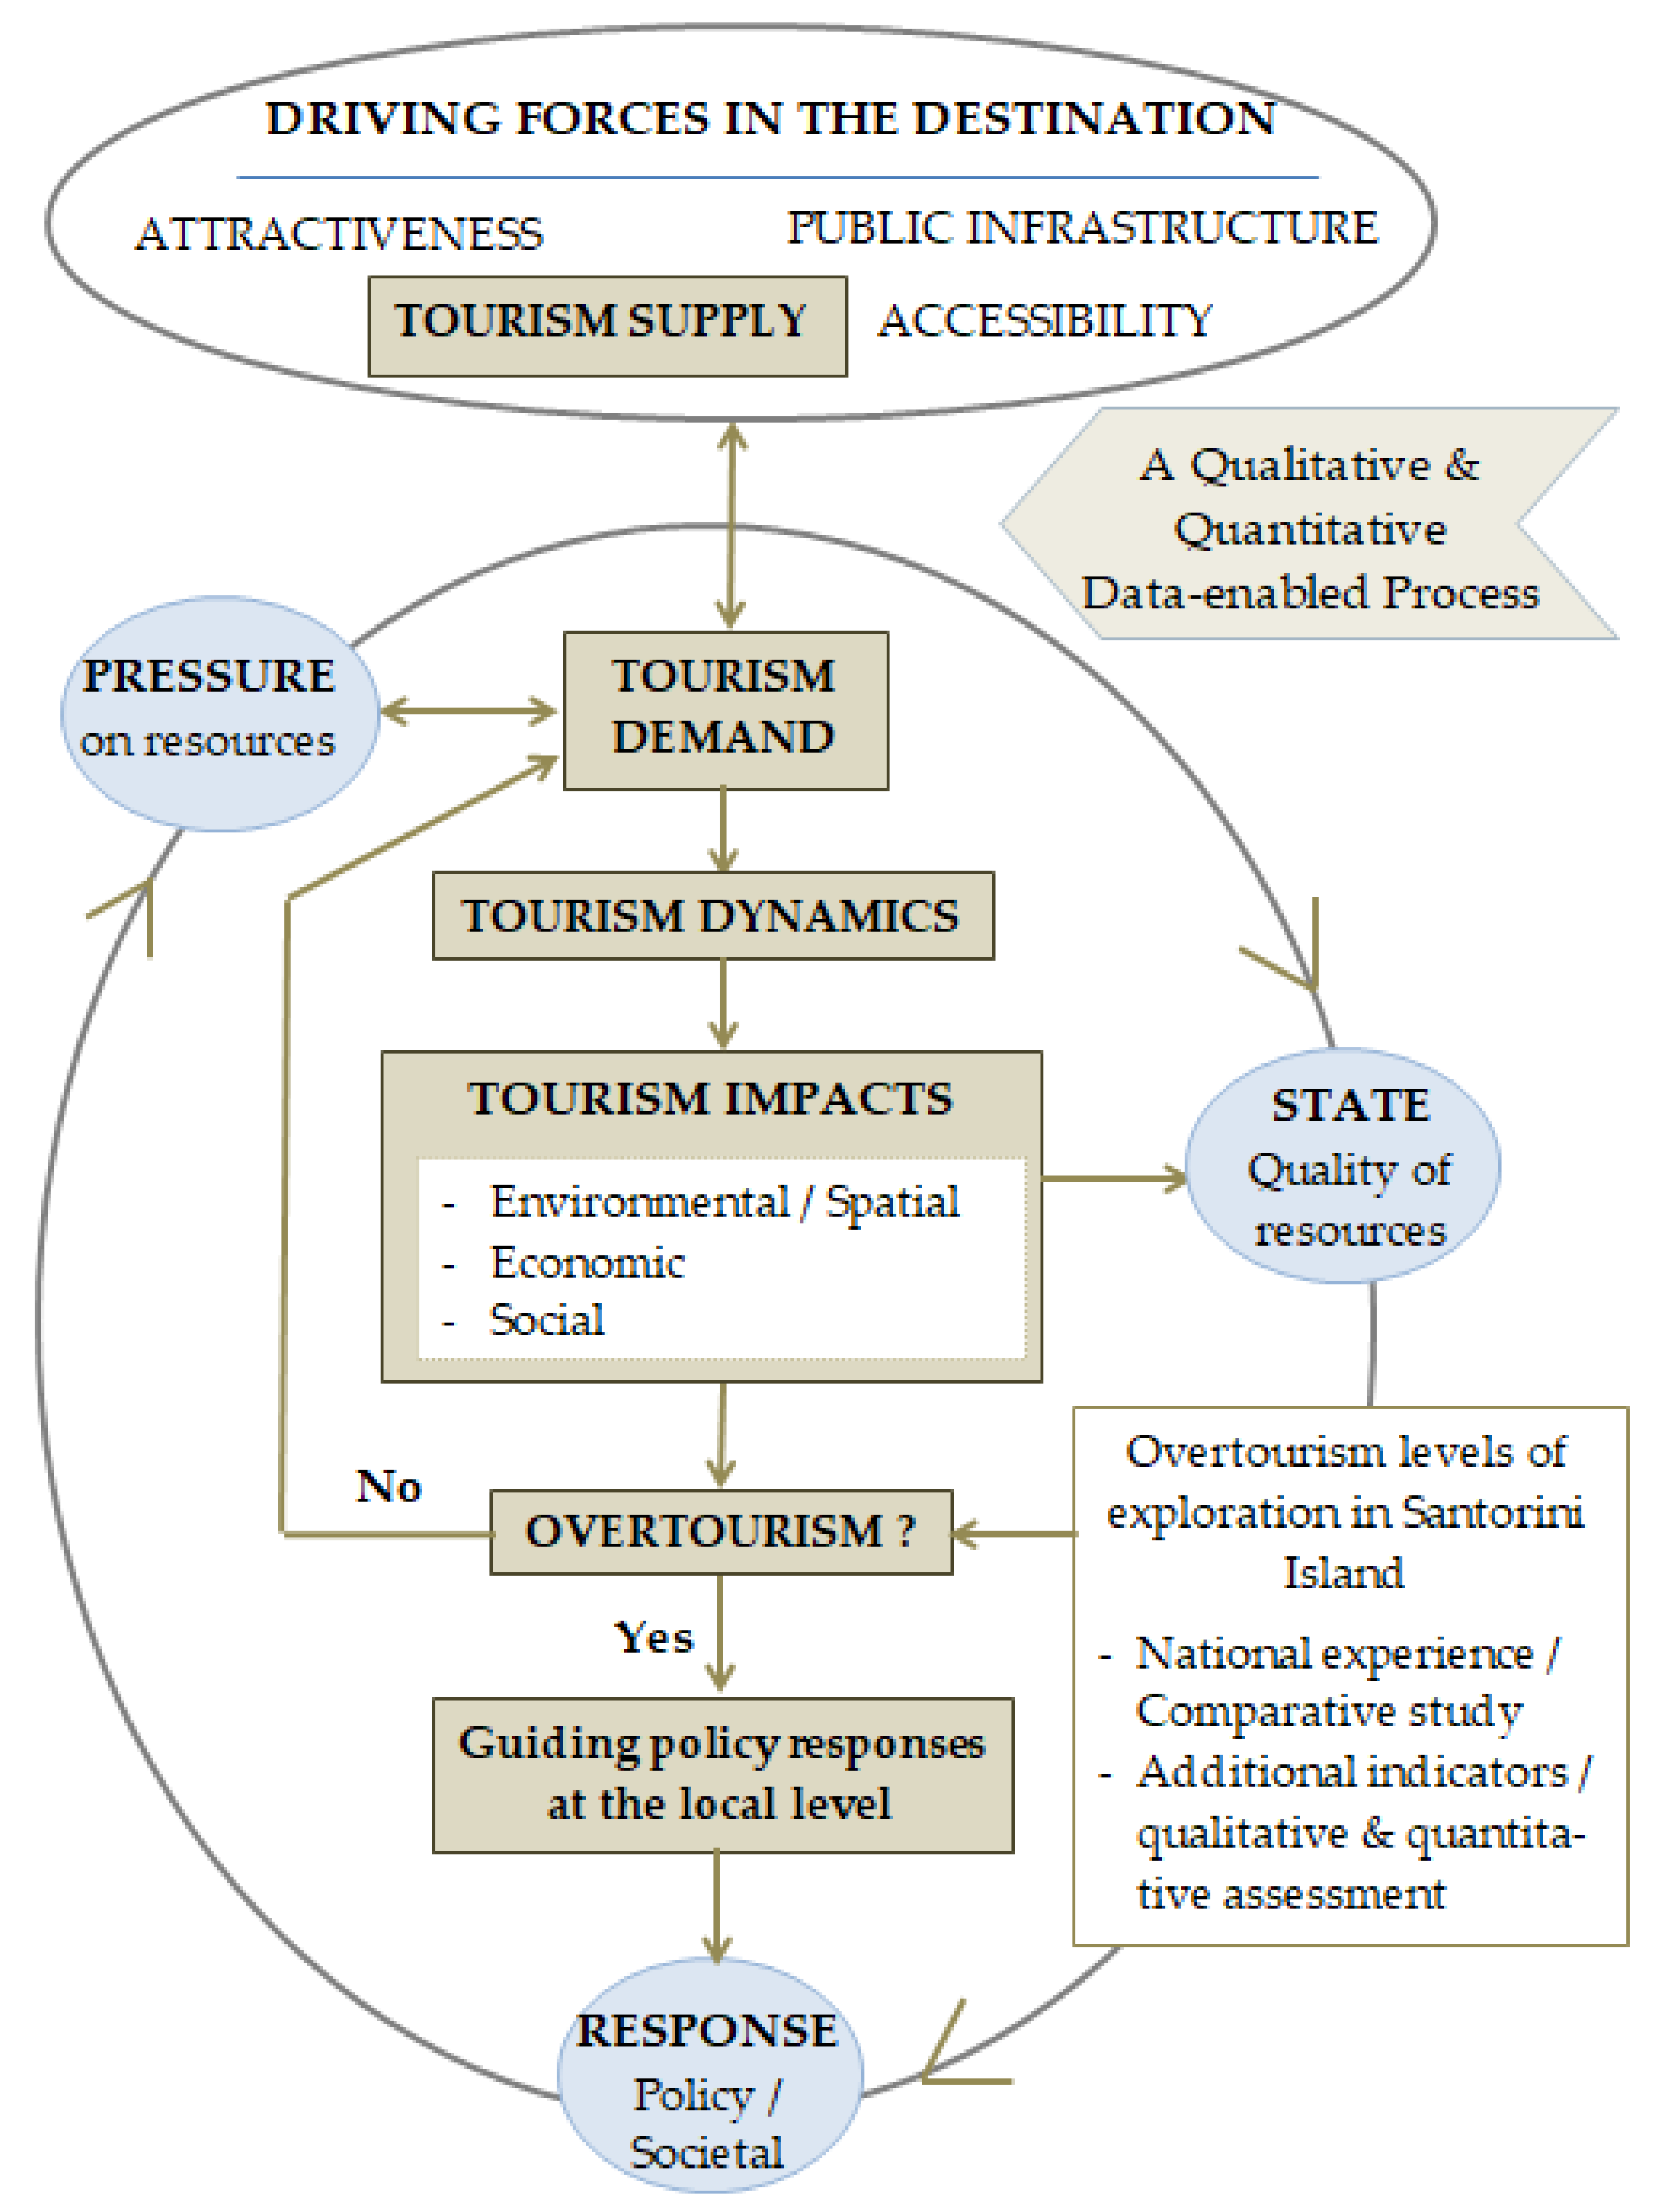
Figure 3.
Location of Thera Municipality in the Greek territory. Source: Own elaboration.
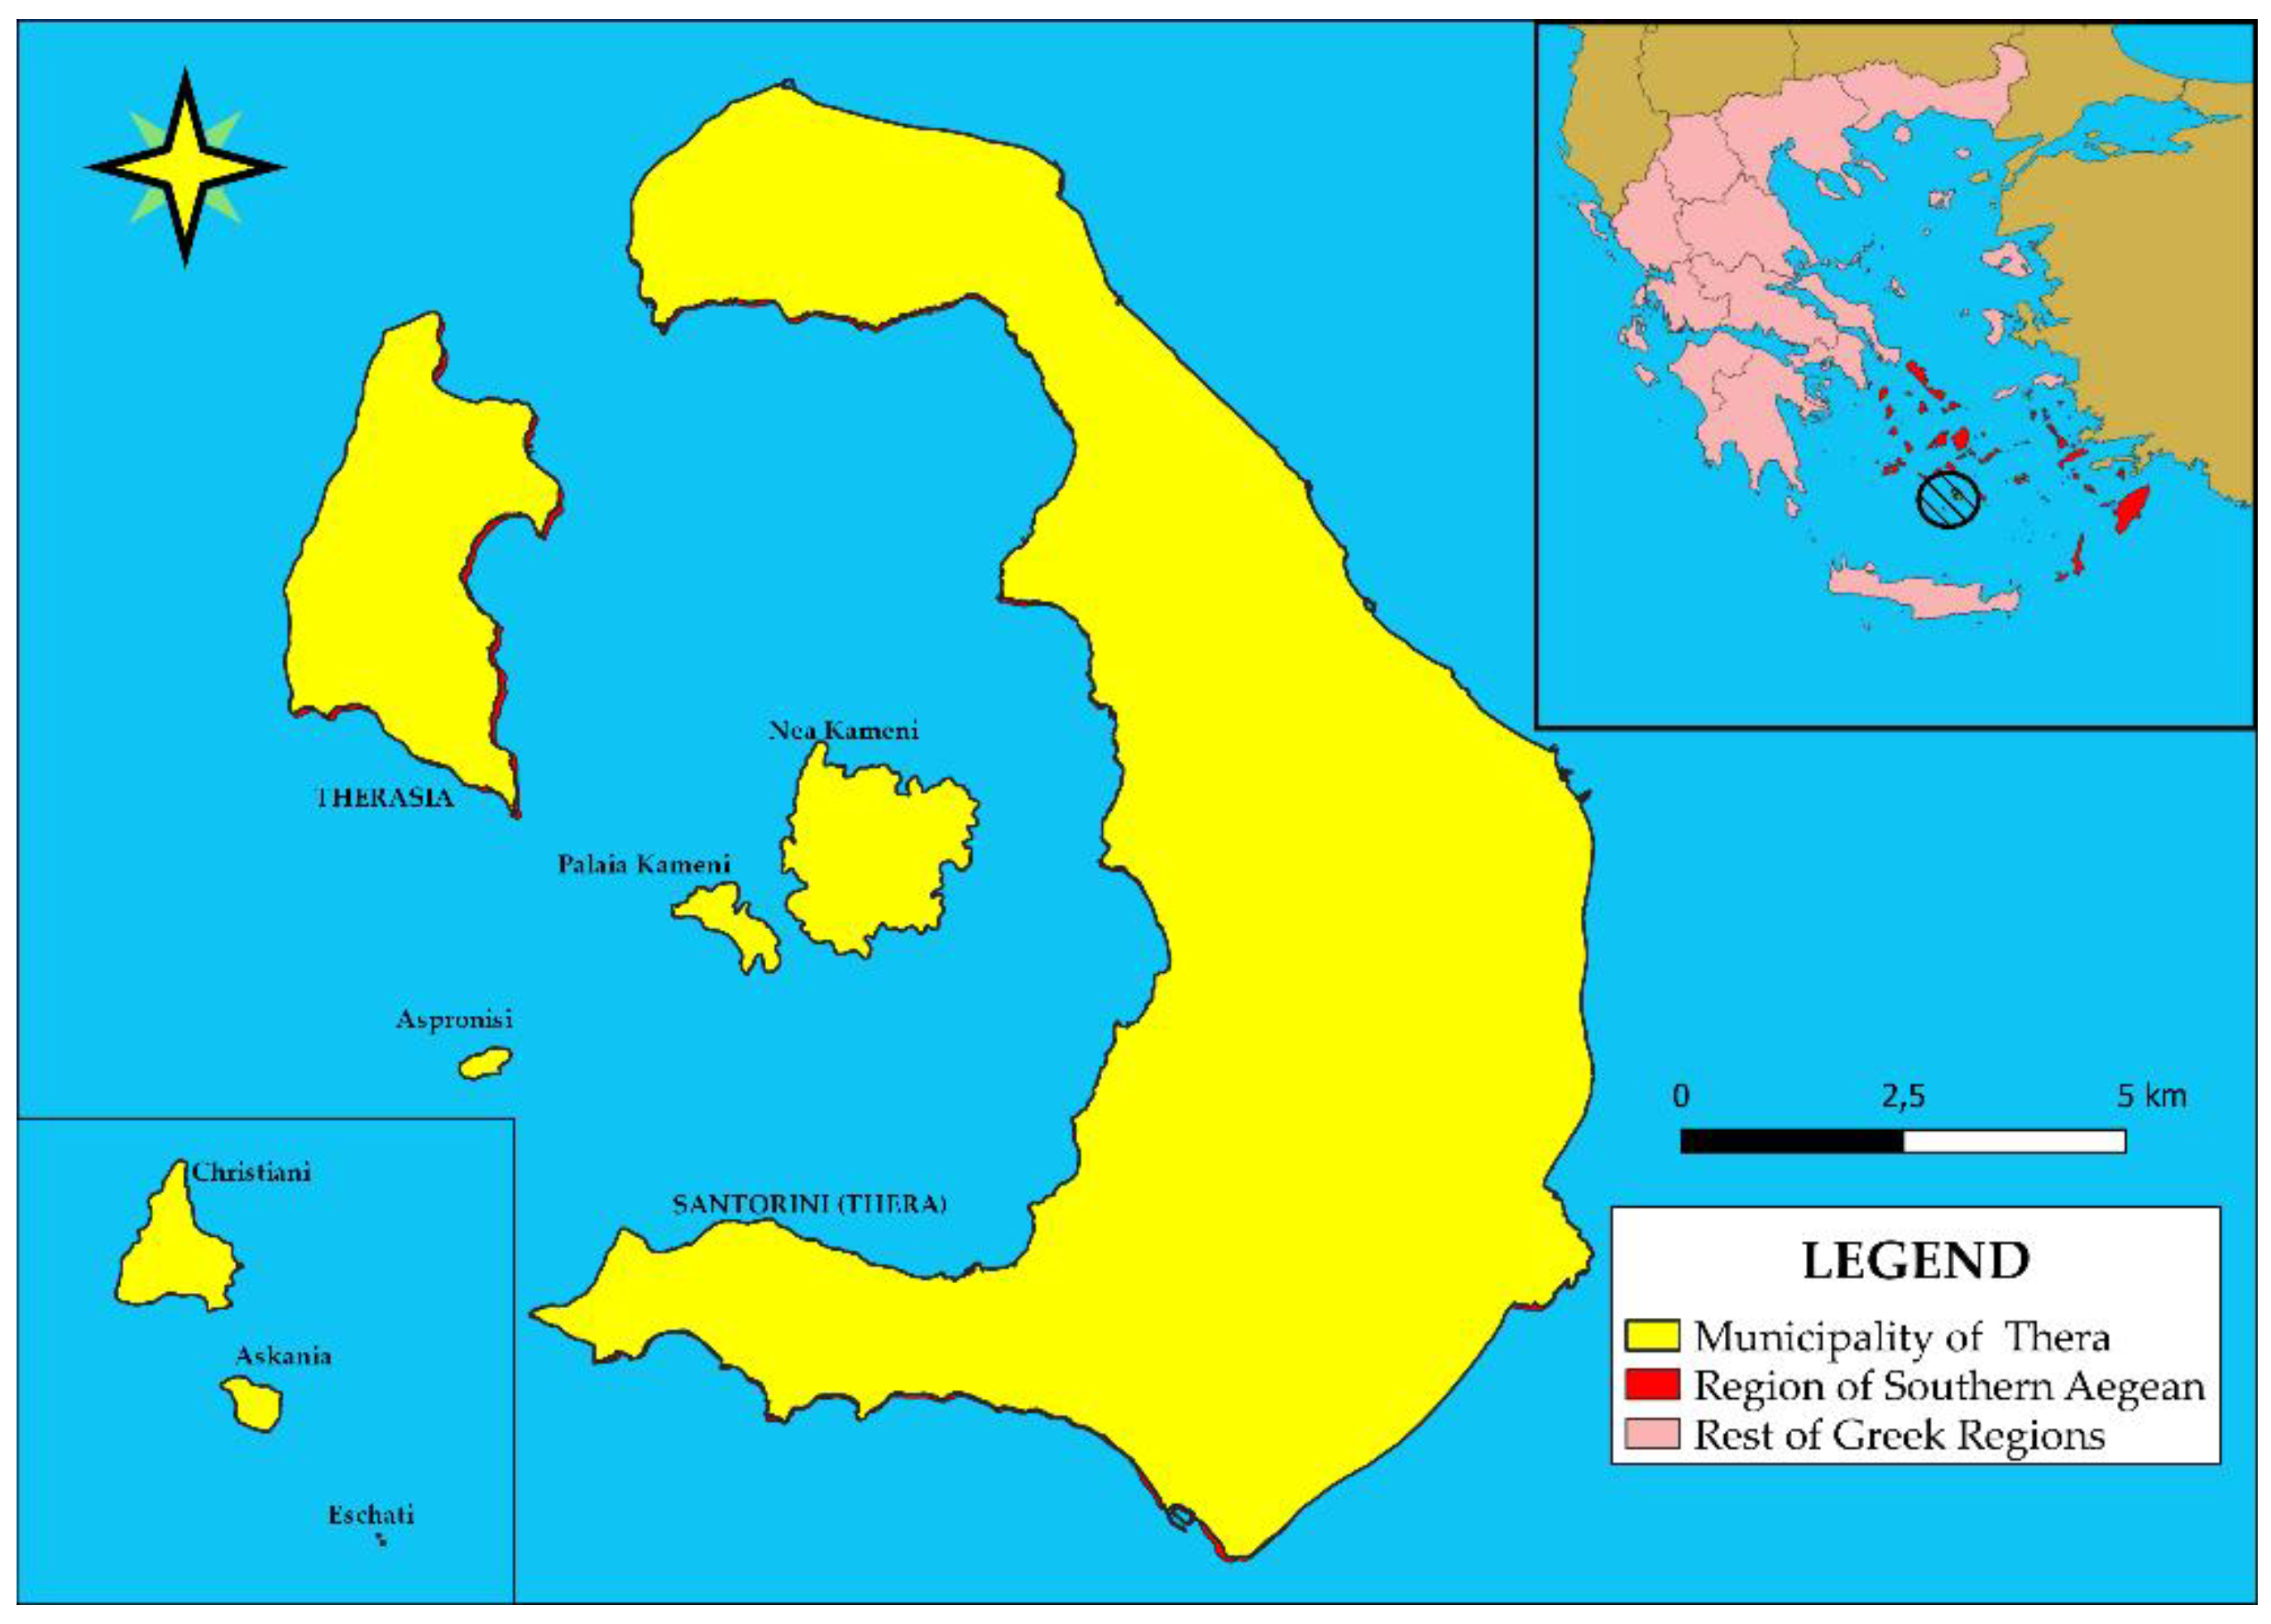
Figure 4.
Dynamics of tourism supply in the time span 2012-2023. Source: Own elaboration based on data from the Institute of Greek Tourism Confederation [56] and Hellenic Chamber of Hotels [58].
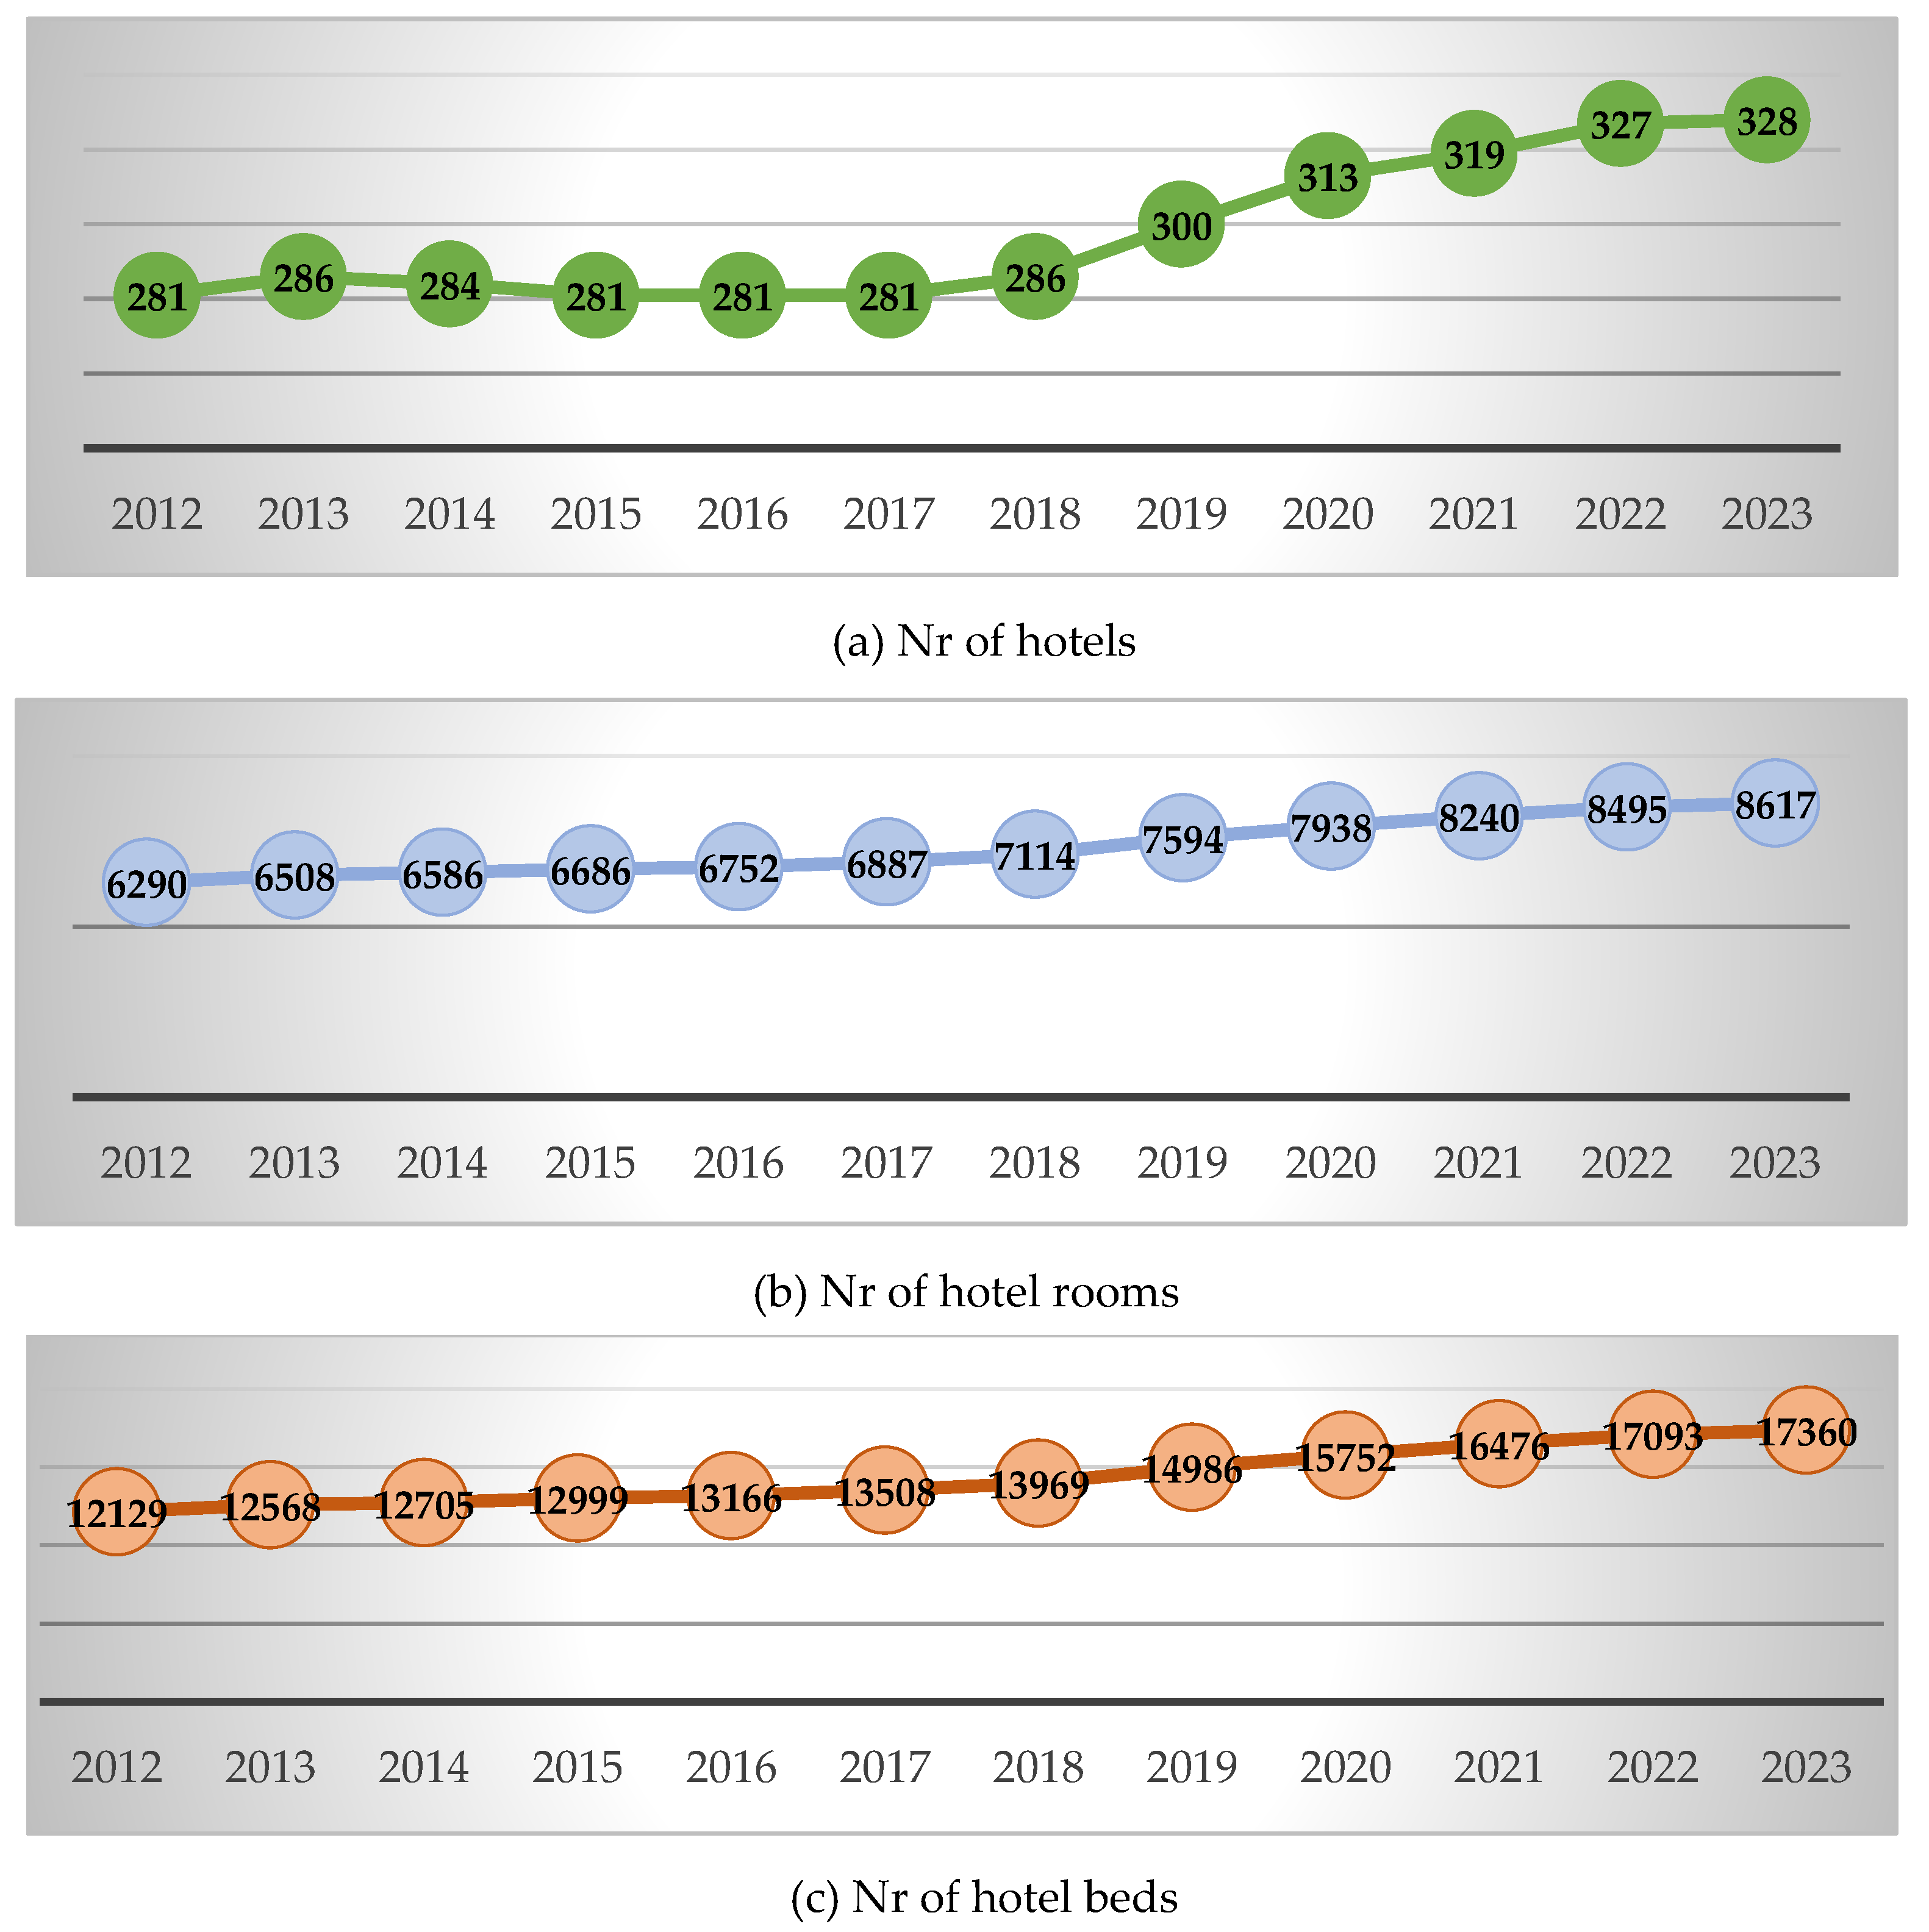
Figure 5.
Spatial pattern of tourism accommodation.

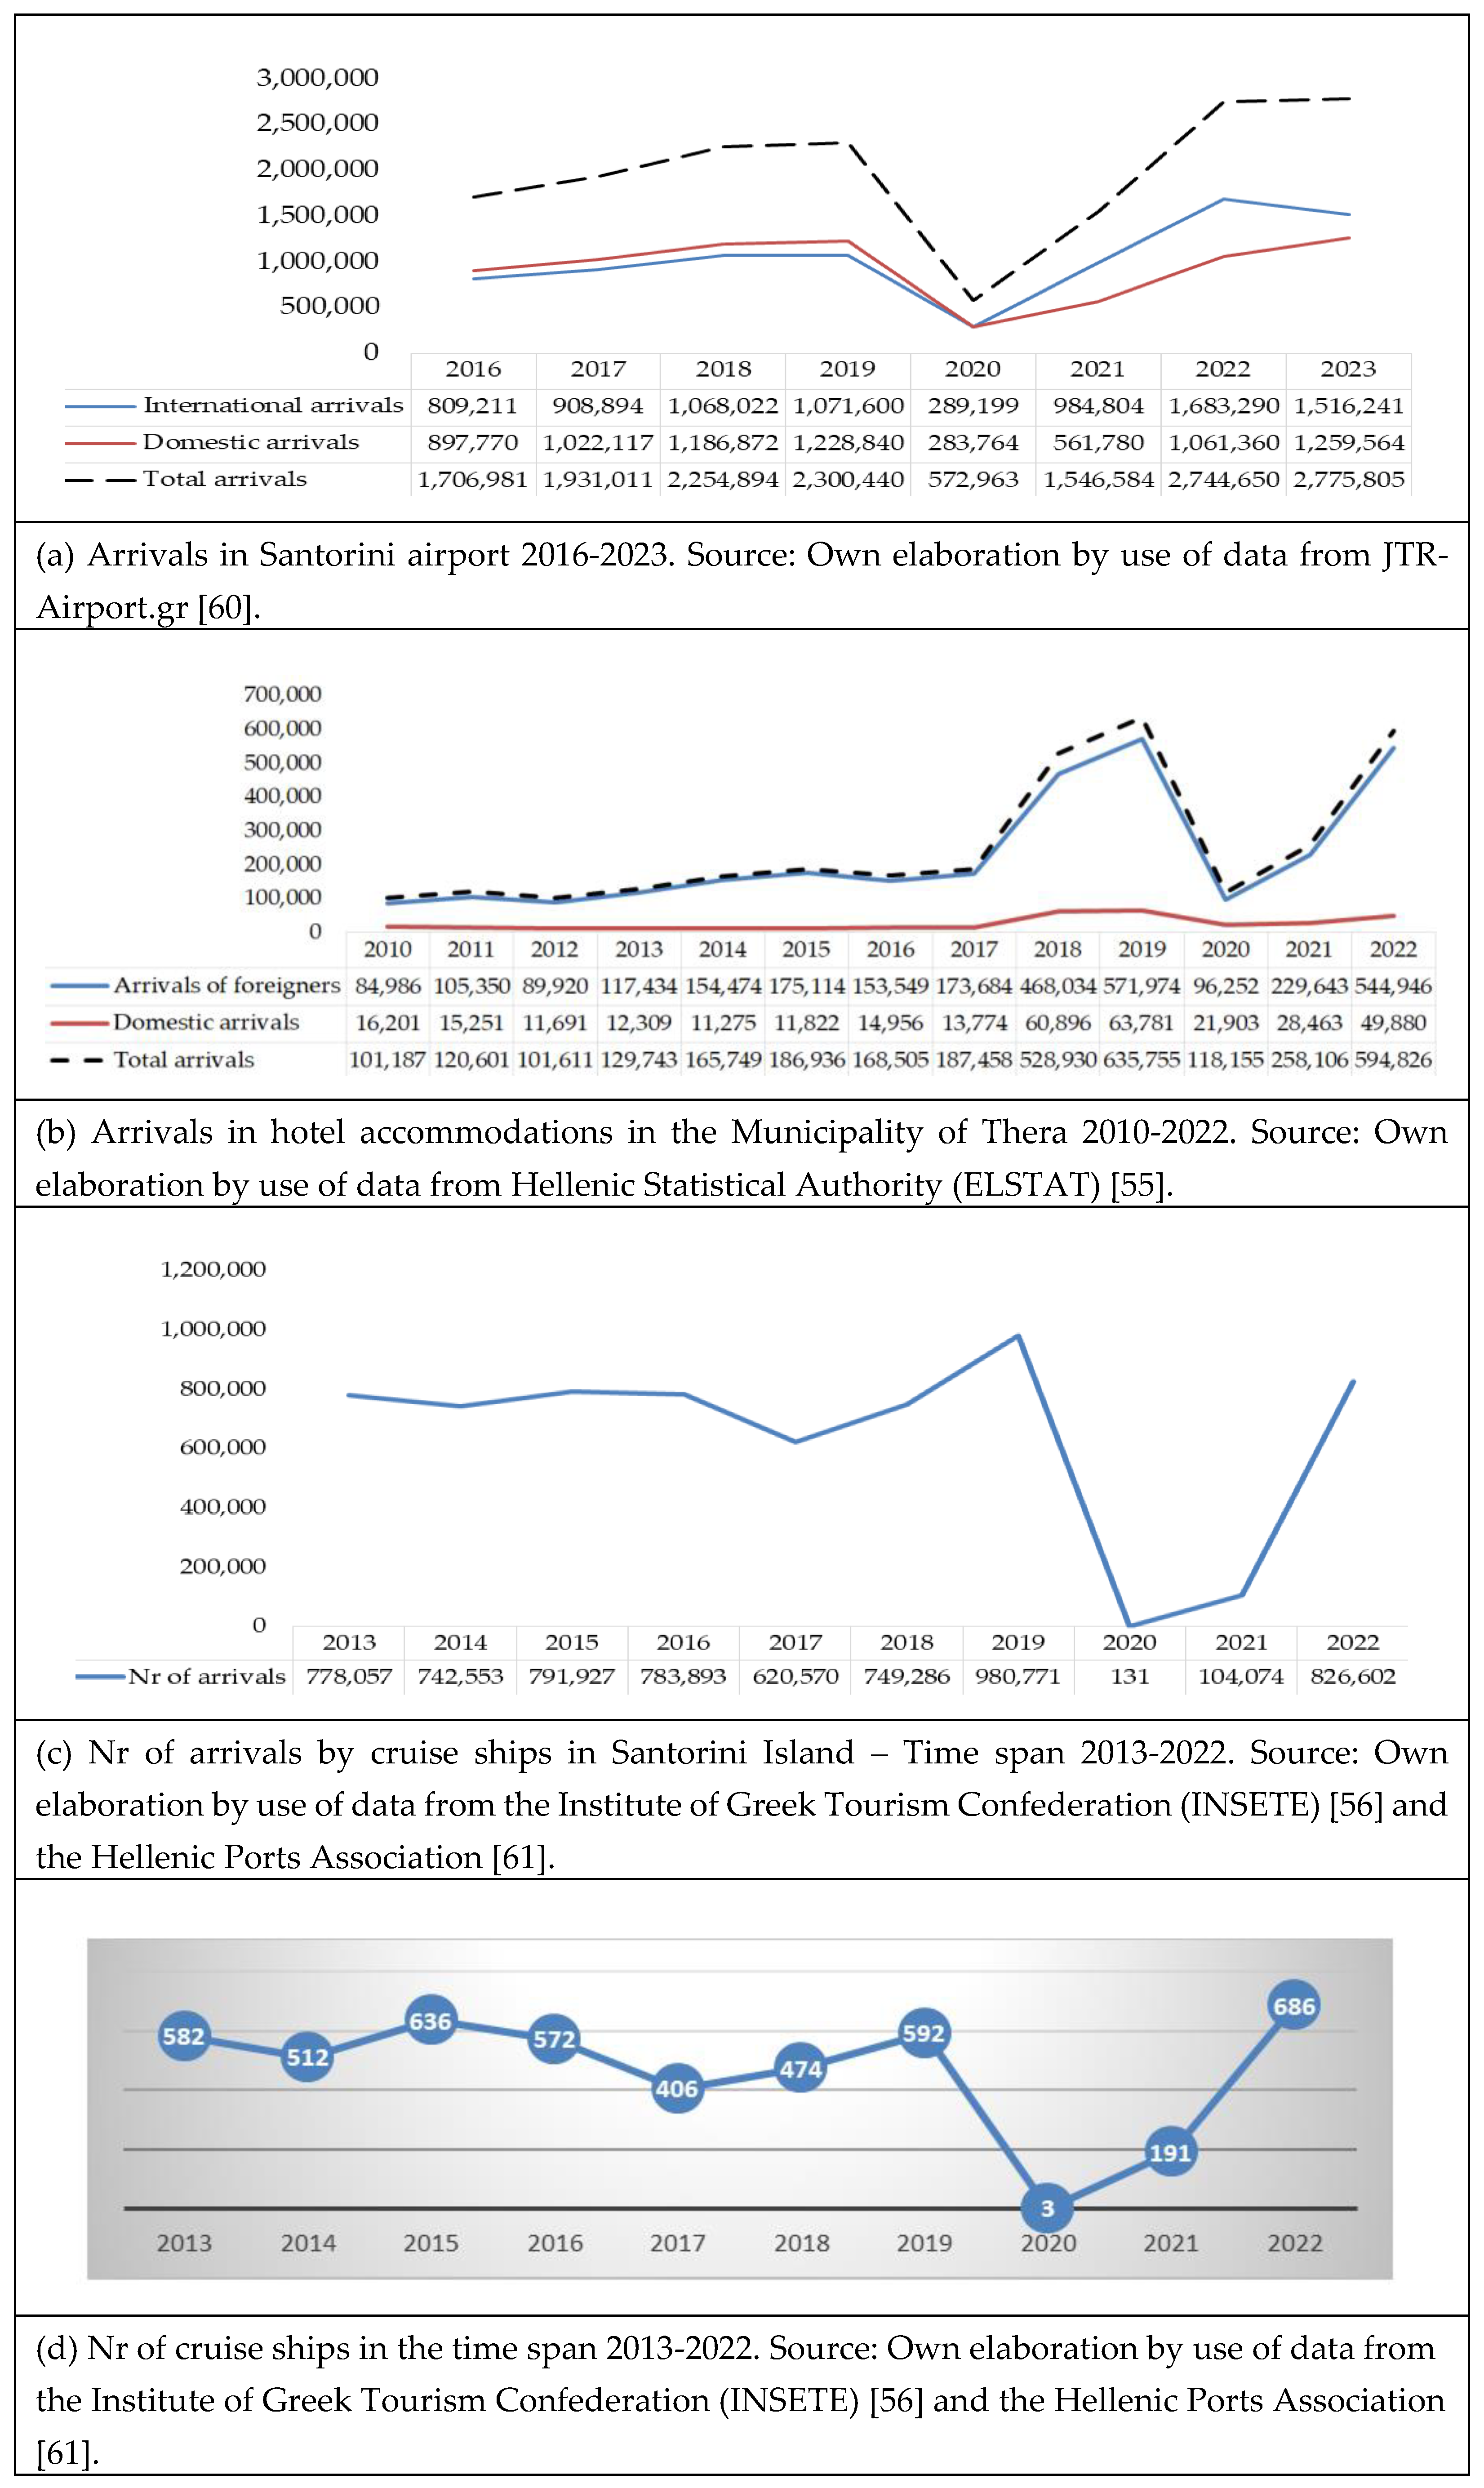
Figure 7.
Mapping of geospatial indicators in the six administrative zones of Santorini Island. Source: Own elaboration.
Figure 7.
Mapping of geospatial indicators in the six administrative zones of Santorini Island. Source: Own elaboration.
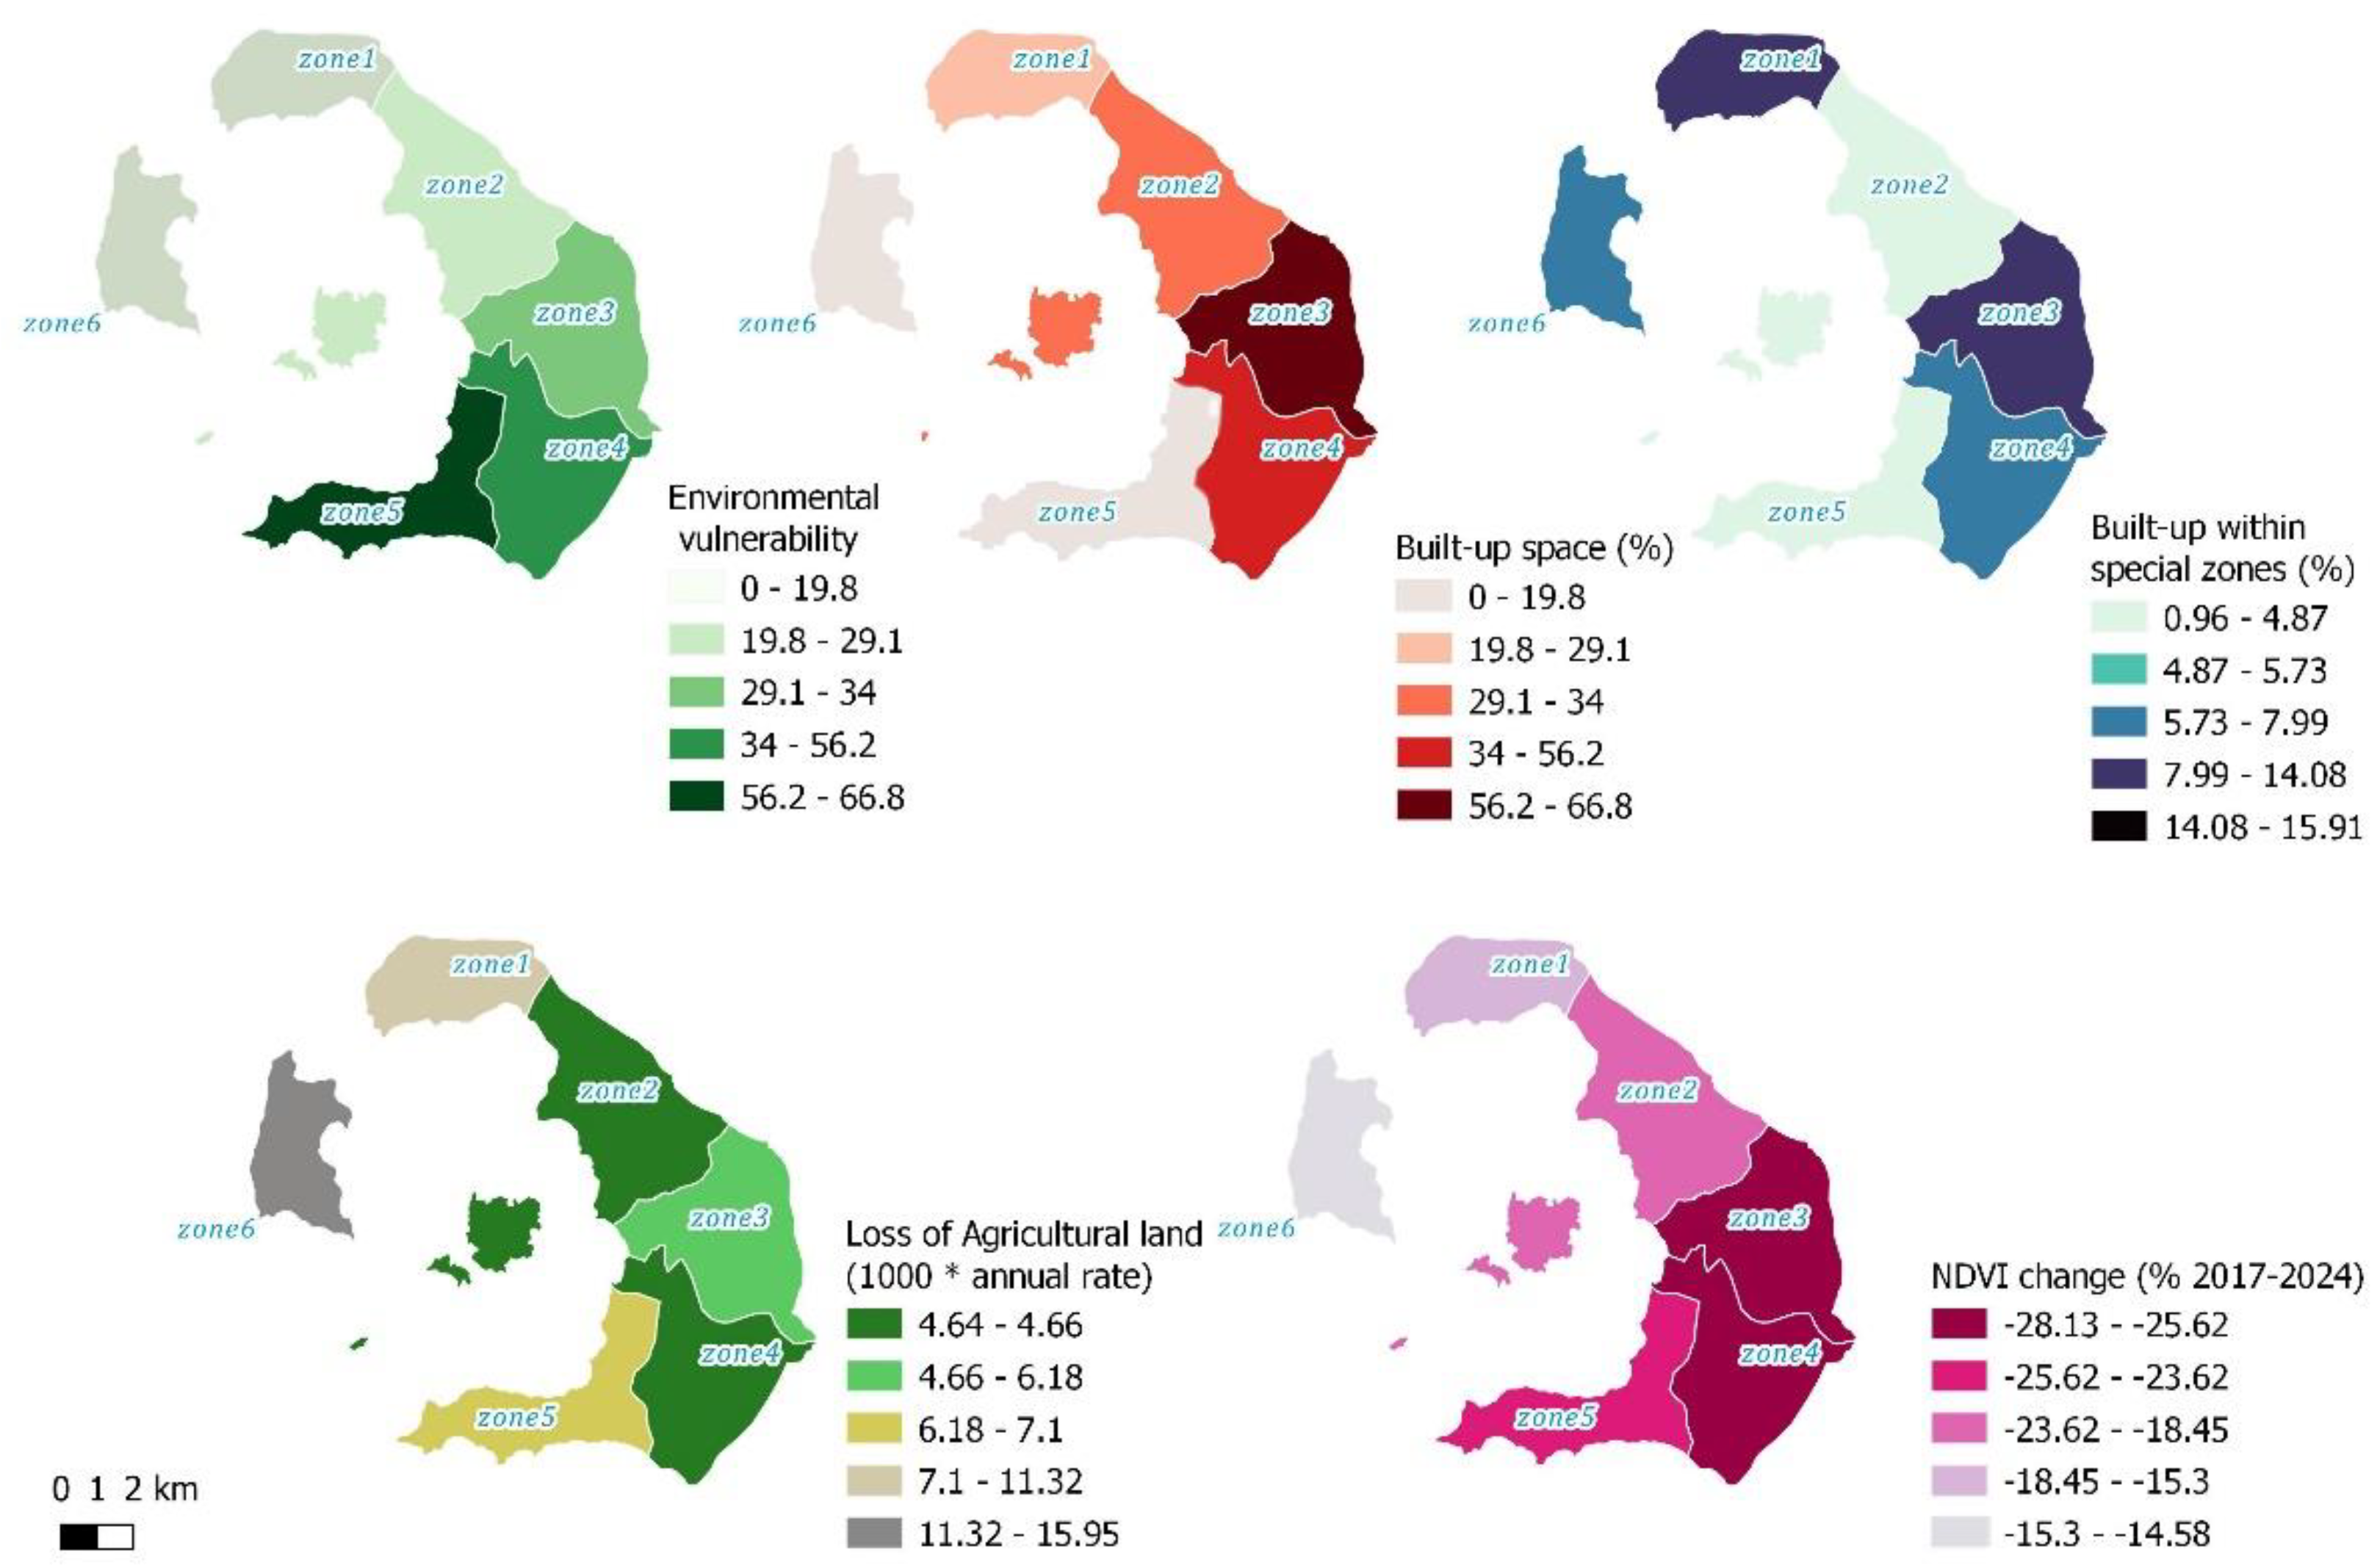
Figure 8.
NDVI loss in comparison to vineyards in Santorini Island. Source: Own elaboration from Coastal Zones Land Use / Land Cover database [55] and Sentinel-2 images.
Figure 8.
NDVI loss in comparison to vineyards in Santorini Island. Source: Own elaboration from Coastal Zones Land Use / Land Cover database [55] and Sentinel-2 images.
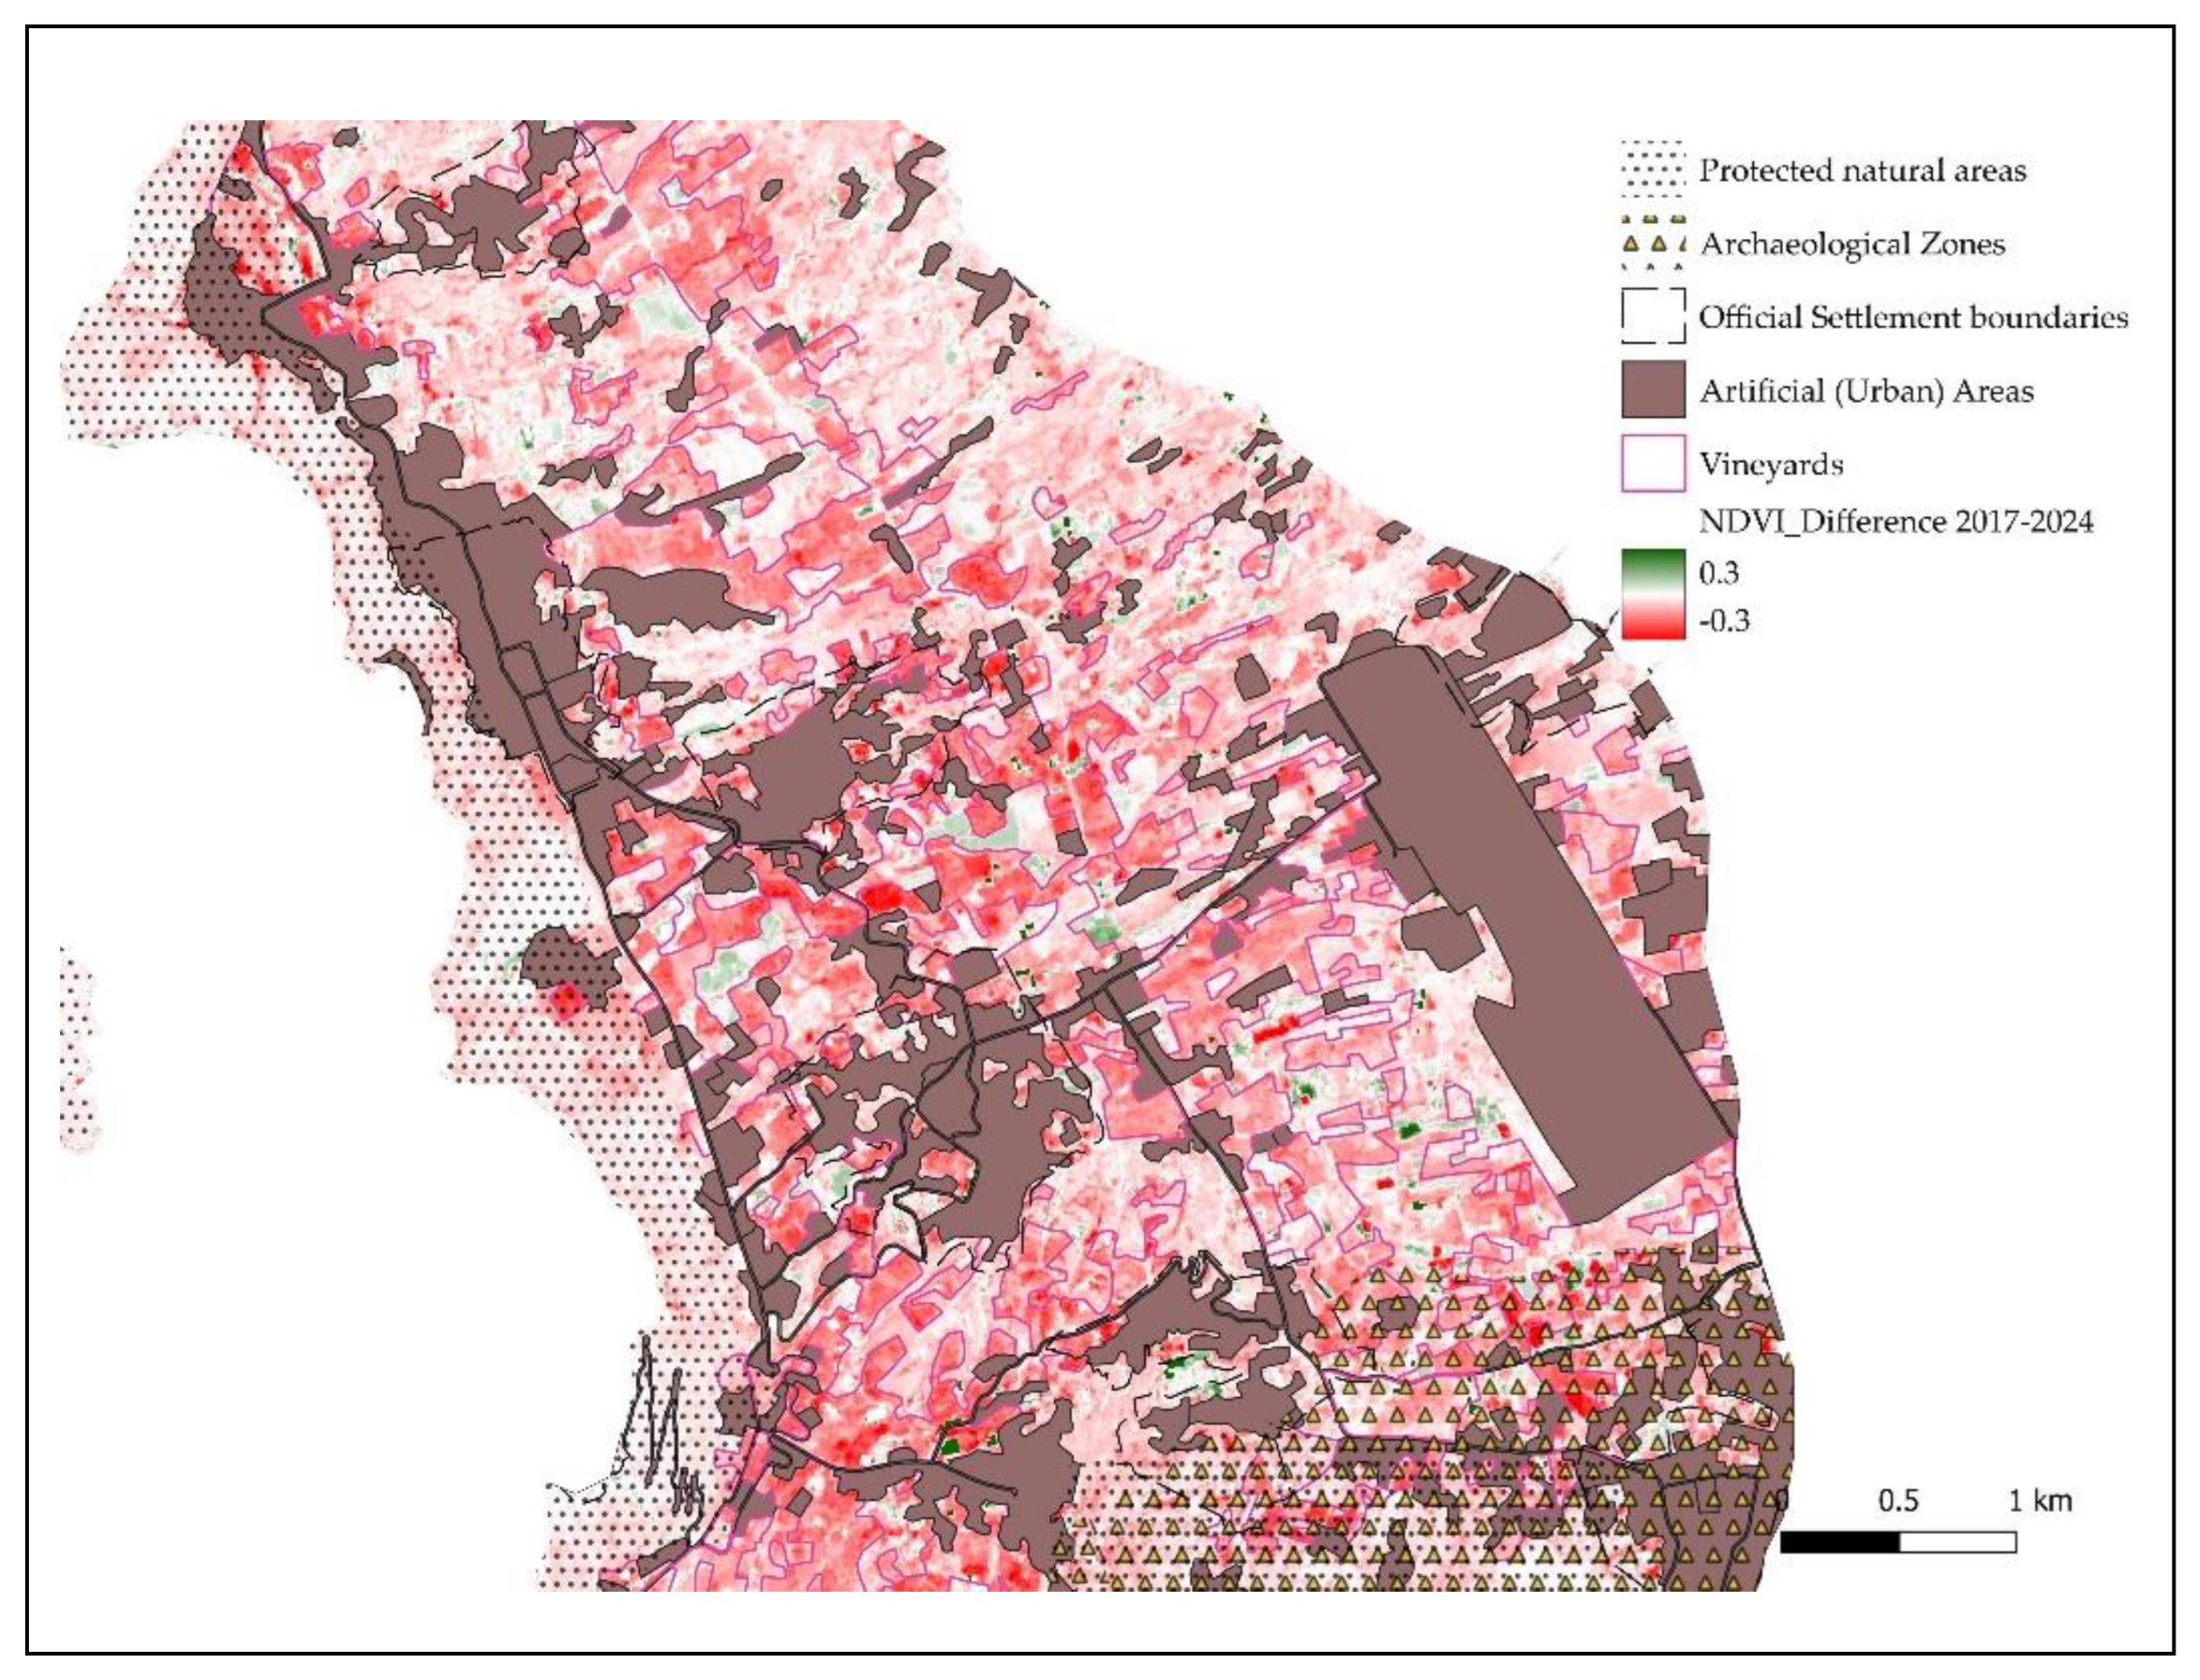
Figure 9.
Overlay of the newest available Sentinel-2 image (September 2024) with the vineyards, showing some new built up developments within the fields. Source: Own elaboration from Coastal Zones Land Use / Land Cover database [55] and Sentinel-2 images6.
Figure 9.
Overlay of the newest available Sentinel-2 image (September 2024) with the vineyards, showing some new built up developments within the fields. Source: Own elaboration from Coastal Zones Land Use / Land Cover database [55] and Sentinel-2 images6.
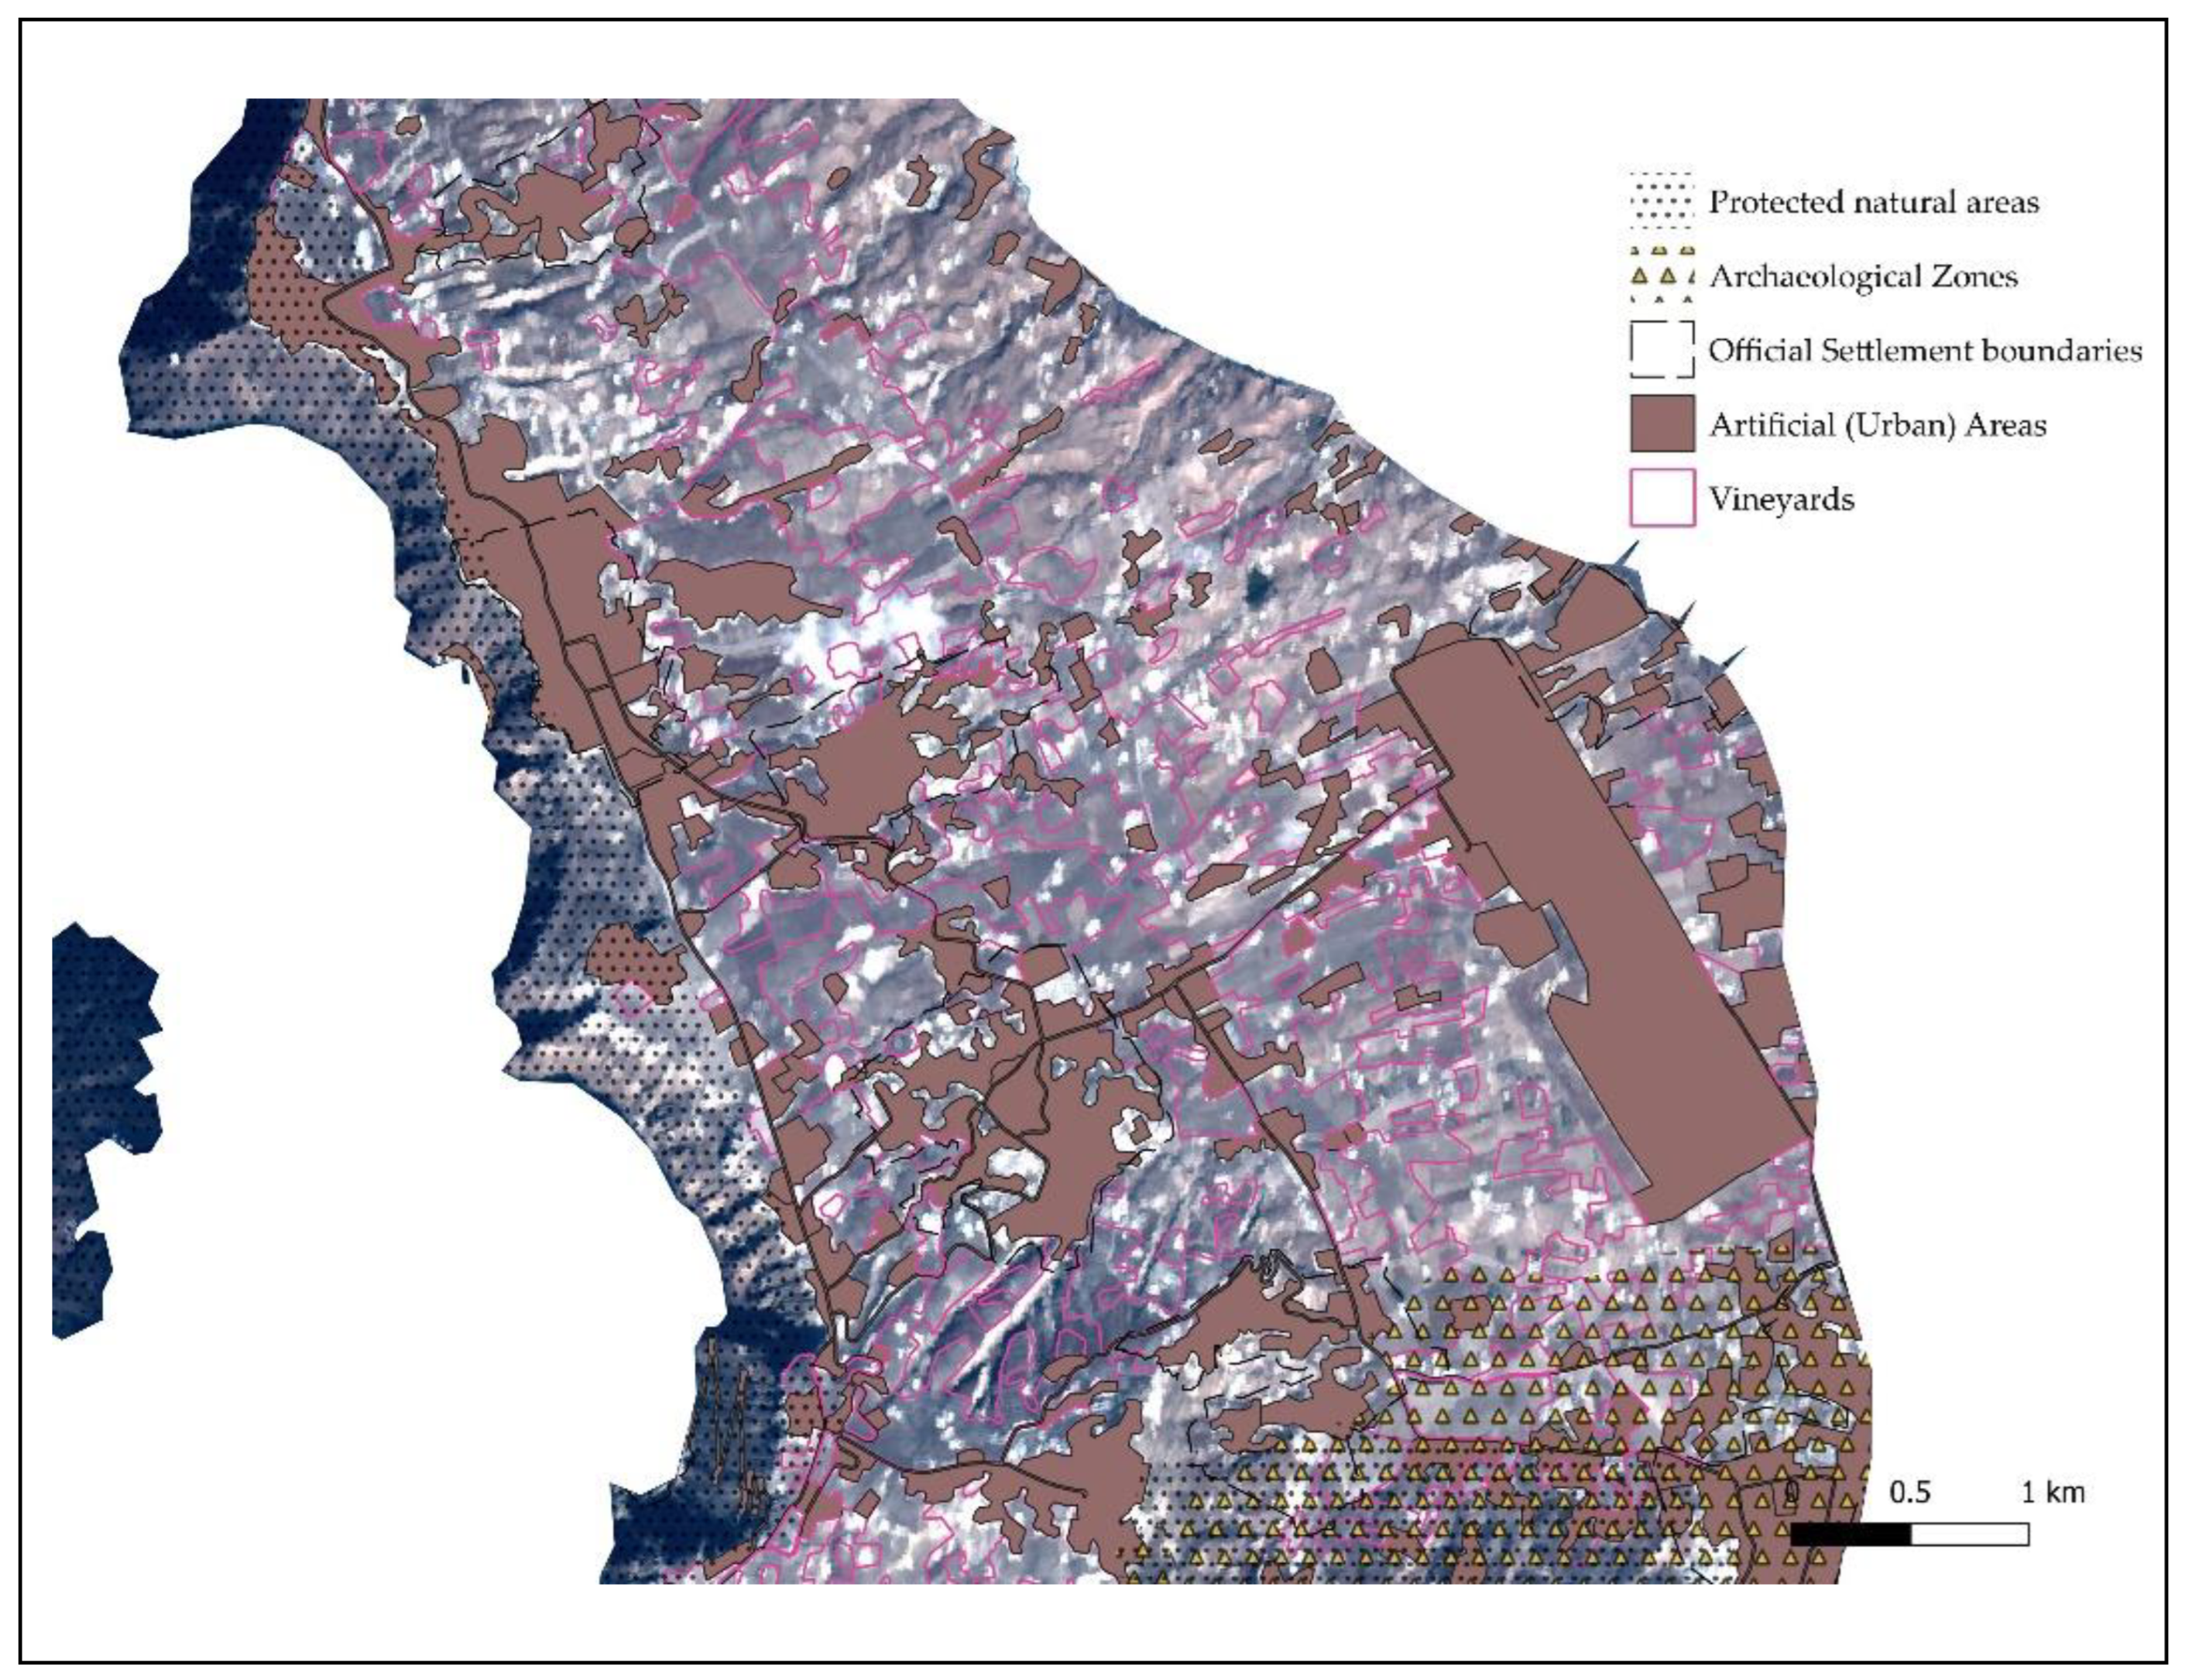

Table 1.
Tourism Supply (TSi) indicators.
| a/a | Indicator | Description of Indicator (Calculations in Year 2023) |
| 1 | TS1 - Tourism Intensity Index | [Total Tourism Accomodation (hotel and Airbnb Beds) / Permanent Population (Residents)] TS1 features the pressure on population that is due to tourism accommodation infrastructure. |
| 2 | TS2 – Airbnb Intensity Index | [Total Airbnb beds / Permanent Population (Residents)] TS2 highlights the pressure on population due to the Airbnb tourism supply. |
| 3 | TS3 – Tourism Infrastructure Indensity Index | ]Nr of hotels and Airbnb accommodation / Permanent Population (Residents)] TS3 assesses the pressure on population that is due to tourism infrastructure deployment. |
| 4 | TS4 – Tourism Index | [Total Tourist Accomodation (hotel & Airbnb Beds) * 100] / [Permanent population (Residents) * Total Area in km2] TS4 sketches the tourism saturation level. |
| 5 | TS5 – Tourism Infrastructure Index | [(Nr of hotels and Airbnb) * 100] / [Permanent Population (Residents) * Total Area in km2] TS5 demonstrates the pressure of tourism inrastructure on the destination (local population and area). |
| 6 | TS6 – Tourism Infrastructure Density Index | [Nr of hotels and Airbnb / Total Area in km2] TS6 reflects the spatial pressure on the destination that is due to the deployment of accommodation infrastructure. |
Source: Own elaboration.
Table 2.
Tourism Demand (TDi) indicators.
| a/a | Indicator | Description of Indicator (Calculations in Year 2022) |
| 1 | TD1 - Tourism Intensity Index | [Total Hotel Arrivals *100 / Permanent Population] TD1 features the pressure of tourist flows on the population. |
| 2 | TD2 - Attracti- veness Index | [Foreign Arrivals (hotels) / Domestic Arrivals (hotels)] TD2 expresses the attractiveness of a destination to foreigners compared to domestic tourist flows. |
| 3 | TD3 - Tourism Penetration Index | [Overnights of Foreigners (hotels) * 100] / [Permanent population * 360] TD3 determines the penetration of foreign visitors in a place in relation to the local resident population. |
| 4 | TD4 - Tourism Concentration Index (density) | [Total Overnight Stays (Hotels) / Total Area in km2] TD4 demonstrates visitors’ willingness to stay in a specific destination and thus pressure exerted on its local resources. |
| 5 | TD5 - Tourism Overnight Stays Index (intensity) | [Total Overnight Stays (Hotels) / [Permanent Population] TD5 demonstrates the potential pressure on the local population. |
Source: Own elaboration.
Table 3.
Indicators for assessing sustainability implications of tourism in a destination.
| Indicator | Description of Indicator | |
|---|---|---|
| a/a | Environmental/ Spatial | |
| 1 | EN1 - Environmental Vulnerability | [% area falling into the NATURA 2000 network] EΝ1 displays areas with high natural value, manifesting vulnerability/risk of environmental degradation due to tourism activities. |
| 2 | EN2 - Share of Built-up Space |
[% built-up space in 2018] EΝ2 demonstrates the environmental pressure due to urban sprawl, i.e. the evolving built-up areas pattern due to mainly tourism accommodation deployment. |
| 3 | EN3 - Change of Built-up Space |
[Mean annual rate of built-up area change (2006-2018) multiplied by 1000] EΝ3 displays the evolving land use change patterns that are mainly due to developments in the tourism sector. |
| 4 | EN4 - Vegetation Change Index |
[% change (2017-2024)] EΝ4 features the loss of green space with repercussions in the microclimate and degradation of the landscape. |
| 5 | EN5 - Built-up Areas within Protected Zones (Natura 2000, archaeological zones etc.) | [% of built-up areas within protected zones in 2018] EΝ5 highlights the penetrating nature of built-up areas due to mainly tourism demand, expanding into protected zones. |
| 6 | EN6 - Built-up Areas within Protected Zones (Natura 2000, archaeological zones etc.) | [Mean annual rate of built-up areas within protected zones in 2006-2018 multiplied by 1000] EΝ6 displays the mean annual rate of the aforementioned expansion. |
| a/a | Economic | |
| 1 | EC1 – Available Agricultural Land | [% of agricultural zones (2019)] |
| 2 | EC2 – Agricultural cultivation | % of (wider) agricultural zones still cultivated |
| 3 | EC3 - Loss of Agricultural Land | [% agricultural land change (1990-2018)] EC3 features the pressure of mainly tourism on the agricultural sector, placing at stake traditional production patterns, especially in insular destinations. |
| 4 | EC4 – Employ- ment Pattern | [Share of employment % (primary, secondary and tertiary sector, rate of change 2001-2011, 2011-2021)] EC4 features the impacts of tourism on the employment pattern of a destination. |
| a/a | Social | |
| 1 | S1 - Large-scale Tourism Infrastructure | [% built-up space in 2018 that is attributed to large-scale tourism infrastructure] S1 features the social / psychological pressure due to large-scale tourism development and relevant land-take. |
| 2 | S2a - Loss of Housing Affordability | [Ratio1: Ratio between land rent for housing in the destination and mean value at the territorial level] S2a features the pressure on permanent residents not being able to find affordable housing due to tourism pressure on land values. |
| 3 | S2b - Loss of Housing Affordability | [Ratio2: Ratio between land sale value in the destination and mean value at the territorial level] S2b features the pressure on permanent residents not being able to buy houses due to tourism pressure on land values. |
Source: Own elaboration.
Table 4.
Data sources.
| Type / Source of Data |
|---|
| Imperviousness Classified Change Layer (raster 20 m) covering the period 2006-2018, 3-yearly: provides, at pan-European level, the degree of imperviousness change in the categories of sealing change (unchanged no sealing, new cover, loss of cover, unchanged sealed, increased sealing, decreased sealing) between each two Imperviousness Density status layers [49]. |
| Archaeological zones: obtained from the geospatial platform of the Archaeological Cadastre of Greece, recording and documenting Greece's immovable monuments, archaeological sites, historical sites, and their protection zones [50]. |
| Natura 2000 areas and Wildlife Repositories of Greece: obtained from the Geodata portal of Greece [51]. The “Kaldera” volcanic zone of Santorini Island is simultaneously part of both networks, and is also recently at the exploration stage as a candidate to the UNESCO World Geological Sites. |
| Agricultural land change: obtained for a large time span, based on Corine Land Cover database availability, DOI (vector 2018): [52], and DOI (vector 1990): [53]. Codes 221, 242, and 243 are applicable in Santorini and the changes are identified by comparing all relevant classes. To more accurately estimate the remaining agricultural zones in 2019, a fine resolution global dataset is used, namely COPERNICUS / Landcover / 100m / Proba-V-C3 / Global / 2019) (km). To identify agricultural land still cultivated (vineyards and arable land) and their relationship to artificial areas, the Coastal Zones Land use / Landcover database [54] and part of the European Union’s Copernicus Land Monitoring Service are used. |
| NDVI (Normalized Difference Vegetation Index): obtained by both Landsat 8 satellite images, at 30m resolution and Harmonized Sentinel-2 MSI, MultiSpectral images, at 10m resolution. Data are processed through Google Earth Engine, and the difference of NDVI between 2016-2024 (Landsat 8) and 2017-2024 is obtained at the pixel level. NDVI values are obtained at each case as the maximum pixel value during the summer period of each reference year. |
| Population: Data on permanent population is derived from the 2021 National Census of the Hellenic Statistical Authority [55]. |
| Tourism arrivals: derived from the annual report of the Institute of the Association of Greek Tourism Enterprises (INSETE) [56]. The Annual Report of each Region/District includes: Demographic data, Macroeconomic data, Tourism infrastructure, Arrivals-Night stays and Revenues, key indicators (Average Per Capita Expenditure, Expenditure per Night and Average Length of Stay), Employment etc. It should be noted here the lack of data on Airbnb arrivals. |
| Airbnb accommodation: gathered through the open data source platform [57]. |
| Hotel accommodation: emanates from the Hellenic Chamber of Hotels [58]. |
| Land values: estimated through the commercial real estate platform Spiti24 [59], by defining a specific zone and obtaining mean values for rental and sale. |
Table 5.
Indicators used for exploring tourism dynamics in Santorini Island.
| Tourism Supply | Tourism Demand |
|---|---|
| Nr of hotels 2012-2023 | Arrivals by air 2010-2022 |
| Nr of hotel rooms 2012-2023 | Arrivals in hotels 2010-2022 |
| Nr of hotel beds 2012-2023 | Arrivals by cruise ships 2013-2022 |
| Nr of Airbnb beds 2023 | Nr of cruise ships 2013-2022 |
Table 6.
Assessment of Tourism Supply values (TSi indicators).
| Indicator | TS1 | TS2 | TS3 | TS4 | TS5 | TS6 | |
| Island | |||||||
| Santorini/Thera | 1.83 | 0.69 | 0.33 | 2.00 | 0.36 | 56.40 | |
| Mykonos | 2.70 | 1.16 | 0.34 | 2.57 | 0.32 | 34.63 | |
| Folegandros | 1.82 | 0.43 | 0.22 | 5.68 | 0.69 | 4.97 | |
| Ios | 1.45 | 0.47 | 0.18 | 1.33 | 0.17 | 3.88 | |
| Paros | 1.20 | 0.70 | 0.23 | 0.61 | 0.11 | 16.68 | |
| Naxos | 0.76 | 0.41 | 0.16 | 0.15 | 0.03 | 6.51 | |
| Amorgos | 0.67 | 0.38 | 0.17 | 0.53 | 0.13 | 2.57 | |
| Sifnos | 1.07 | 0.68 | 0.24 | 1.44 | 0.32 | 8.86 | |
| Antiparos | 1.01 | 0.68 | 0.19 | 2.24 | 0.43 | 5.38 | |
| Milos | 0.74 | 0.40 | 0.20 | 0.46 | 0.12 | 6.60 | |
| Sikinos | 0.49 | 0.34 | 0.12 | 1.14 | 0.28 | 0.71 | |
| Serifos | 0.94 | 0.92 | 0.31 | 1.25 | 0.41 | 5.04 | |
| Anafi | 0.45 | 0.37 | 0.16 | 1.12 | 0.40 | 1.16 | |
| Kea | 1.14 | 0.89 | 0.22 | 0.76 | 0.15 | 3.47 | |
| Andros | 0.47 | 0.32 | 0.11 | 0.12 | 0.03 | 2.54 | |
| Syros | 0.25 | 0.13 | 0.05 | 0.24 | 0.05 | 10.23 | |
Source: Own elaboration.
Table 7.
Assessment of Tourism Demand values (TDi indicators).
| Indicator | TD1 | TD2 | TD3 | TD4 | TD5 | |
| Island | ||||||
| Santorini/Thera | 3837.16 | 10.93 | 28.50 | 19137.23 | 112.03 | |
| Mykonos | 5501.23 | 11.22 | 49.01 | 19369.64 | 190.34 | |
| Folegandros | 3102.19 | 7.65 | 22.63 | 2114.82 | 94.76 | |
| Ios | 2372.99 | 3.86 | 17.04 | 1669.13 | 79.15 | |
| Paros | 976.69 | 3.08 | 8.17 | 2835.09 | 38.33 | |
| Naxos | 616.25 | 2.87 | 5.37 | 1026.74 | 24.74 | |
| Amorgos | 571.85 | 2.64 | 5.12 | 375.60 | 24.20 | |
| Sifnos | 703.10 | 2.76 | 4.13 | 755.06 | 20.10 | |
| Antiparos | 503.64 | 1.61 | 3.73 | 571.44 | 20.41 | |
| Milos | 524.52 | 1.98 | 2.86 | 492.45 | 14.87 | |
| Sikinos | 326.20 | 7.68 | 2.38 | 59.30 | 9.96 | |
| Serifos | 485.01 | 1.42 | 2.24 | 219.01 | 13.27 | |
| Anafi | 275.18 | 10.91 | 2.11 | 60.32 | 8.31 | |
| Kea | 342.01 | 0.48 | 1.10 | 153.55 | 9.79 | |
| Andros | 300.95 | 0.52 | 1.08 | 227.17 | 9.78 | |
| Syros | 275.18 | 0.57 | 1.04 | 1819.11 | 8.78 | |
Source: Own elaboration.
Table 8.
Employment structure per productive sector in Santorini Island (Indicator EC4).
| Share (Rate of Change | Share % in 2001 | Share % in 2011 (% change 2001-2011) |
Share % in 2021 (% change 2011-2021) |
|
| Sector | ||||
| Primary | 5.52 | 4.18 (-1.34) | 3.67 (-0.51) | |
| Secondary | 25.72 | 17.63 (-8.09) | 5.60 (-12.03) | |
| Tertiary | 68.77 | 78.18 (+9,41) | 90.66 (+12.48) | |
Source: INSETE [62].
Table 9.
Assessment of sustainability implications of overtourism in Santorini Island.
| a/a | Santorini Island | Total Area | Zone 1 |
Zone 2 |
Zone 3 |
Zone 4 |
Zone 5 |
Zone 6 |
|
| Indicator | |||||||||
| EN1 | Environmental vulnerability | 23.0 | 19.8 | 29.1 | 21.4 | 33.5 | 66.8 | - | |
| EN2 | Share of built-up space | 36.6 | 19.8 | 29.1 | 34.0 | 56.2 | 17.8 | - | |
| EN3 | Change of built-up space | 3.1 | 2.9 | 7.2 | 2.1 | 1.7 | 0.3 | 0.0 | |
| EN4 | Vegetation change index | -20.7 | -15.3 | -18.4 | -28.1 | -25.6 | -23.6 | -14.6 | |
| EN5 | Built-up within protected zones | 6.4 | 8.5 | 3.7 | 12.7 | 6.3 | 4.0 | - | |
| EN6 | Built-up within protected zones | 0.4 | 0.2 | 4.4 | 0.0 | -0.3 | 0.0 | 0.0 | |
| EC1 | Available agricultural land | 53.1 | 57.3 | 47.0 | 55.4 | 57.7 | 60.8 | 40.1 | |
| EC2 | Agricultural cultivation | 56.4 | 23.8 | 46.7 | 62.5 | 76.4 | 69.7 | 38.5 | |
| EC3 | Loss of agricultural land | 24.3 | 40.7 | 15.0 | 20.4 | 15.0 | 23.8 | 62.0 | |
| S1 | Large-scale tourism infrastructure | 11.9 | 13.5 | 17.3 | 7.8 | 6.5 | 34.5 | 0.0 | |
| S2a | Loss of housing - Afford.1 | 1.56* | - | - | - | - | - | - | |
| S2b | Loss of housing - Afford.2 | 2.00* | - | - | - | - | - | - | |
* estimated only at the island-level due to data availability constraints. Source: Own elaboration.
Disclaimer/Publisher’s Note: The statements, opinions and data contained in all publications are solely those of the individual author(s) and contributor(s) and not of MDPI and/or the editor(s). MDPI and/or the editor(s) disclaim responsibility for any injury to people or property resulting from any ideas, methods, instructions or products referred to in the content. |
© 2024 by the authors. Licensee MDPI, Basel, Switzerland. This article is an open access article distributed under the terms and conditions of the Creative Commons Attribution (CC BY) license (http://creativecommons.org/licenses/by/4.0/).
Copyright: This open access article is published under a Creative Commons CC BY 4.0 license, which permit the free download, distribution, and reuse, provided that the author and preprint are cited in any reuse.


