
Submitted:
30 June 2025
Posted:
01 July 2025
You are already at the latest version
Abstract
The paper presents a comprehensive evaluation of advanced machine learning (ML) and deep learning (DL) techniques for cybersecurity threat detection and mitigation actions, with a focus mainly on integrative approaches. It synthesizes prior research on generative adversarial networks (GANs), ensemble methods and transfer learning techniques and introduces a novel unified threat detection pipeline that combines these methods into a single framework. This pipeline utilizes GANs for synthetic data generation of both malware images and tabular zero-day attack records, which are afterwards used to train convolutional neural networks (CNNs) that leverage transfer learning and ensemble classifiers. Extensive experiments demonstrate the effectiveness of this integrative approach across varied network environments and data types. Results highlight significant improvements in detection accuracy and false positive reduction when multimodal inputs are fused, especially using the selected confidence-weighted averaging. The proposed framework demonstrates robustness against zero-day attacks, botnet traffic and malware threats, showcasing its real-world applicability and scalability.
Keywords:
threat detection
; cybersecurity
; synthetic data generation
; Generative Adversarial Networks (GANs)
; multimodal fusion
; deep learning
; transfer learning
1. Introduction
The digital age has brought about a widespread shadow economy of cybercrime while also enabling previously unheard-of levels of global connectivity and innovation. According to projections, this illegal economy will cost the world economy $10.5 trillion annually by 2025 [1], surpassing the GDP of all but the two biggest countries and essentially becoming the third-largest "economy" in the world [2]. This startling statistic goes beyond simple monetary losses to include widespread deterioration of public trust, severe reputational damage, and systemic operational paralysis. The cost of a single data breach increased by 10% year over year to $4.88 million in 2024, the most significant increase since the pandemic, demonstrating this growing impact [3]. Cyberattacks are now sophisticated, systemic threats rather than isolated disruptions. Approximately 3.4 billion malicious emails are sent every day by threat actors, and phishing continues to be the most common attack vector, accounting for 45.56% of all emails sent in 2021 that were scams [4]. Attacks now happen every few seconds, and it takes an average of 258 days for organizations to identify and stop a breach. This gives adversaries plenty of time to exploit credentials that have been stolen or get into supply chains [3].
Cyberattacks have become much more frequent, sophisticated, and destructive in recent years, placing an unprecedented burden on institutions in the public and private sectors worldwide. Today, governments, businesses, and operators of vital infrastructure are more vulnerable to coordinated, extremely complex cyberattacks that routinely take advantage of new technologies and infrastructure flaws. This was supported by IBM's 2024 X-Force Threat Intelligence Index, which highlighted a 266% increase in the deployment of infostealers and a 71% increase in the attacks using genuine credentials on a yearly basis [5].
The evolving dynamics of modern cyber-attacks overwhelm the capabilities of traditional cybersecurity techniques, such as static rule-based systems, heuristic scanning, and signature matching. These systems often miss new or obfuscated threats, especially zero-day exploits, which are by nature undefinable at the time of attack, even though they remain relevant in layered defense strategies. The cybersecurity research community has gradually embraced ML and DL approaches to create more robust and adaptive detection systems in order to get around these restrictions. By automatically extracting intricate patterns from large, diverse datasets, ML and DL allow models to detect subtle indicators of compromise (IOCs) even in high-dimensional environments.
Emerging technologies pose a significant dual-use problem. Since the introduction of ChatGPT, generative Artificial Intelligence (AI) has caused a 4,151% increase in advanced phishing, facilitating deepfake-aided fraud and hyper-personalized scams [6]. On top of a 93% increase in encrypted threats, Internet of Things (IoT) device attacks rose 124% in 2024 [7].
A significant rise in related scientific research supports this paradigm shift toward AI-driven solutions. According to Purnama et al.'s [8] bibliometric analysis, the number of published studies on this topic grew by 1,392% over the course of five years, from 13 publications in 2019 to 194 in 2023. There is a clear trend in this growing body of work toward integrative and hybrid approaches. These methods improve detection performance, system resilience, and adaptive capacity by carefully combining several AI techniques, including generative modeling, ensemble classification, and transfer learning. This development recognizes that no single model is always the best approach to counter the various and changing methods utilized by threat actors.
The potential of GANs in alleviating the ongoing problem of data scarcity in cybersecurity has gained a lot of interest. Network intrusion records and malware binary images are examples of realistic synthetic data samples produced by GANs that closely resemble real-world occurrences [9]. This synthetic data allows for the simulation of controlled scenarios for uncommon attack types, such as zero-day exploits, in addition to supplementing limited datasets. Especially in complex, unbalanced, or noisy operating environments, ensemble methods [10]— combining the predictions of a set of classifiers —consistently exhibit higher accuracy and robustness than single-model approaches. Transfer learning techniques [11], on the other hand, enable models that have been trained on a single dataset or domain to be successfully adapted for new, related tasks. This improves model generalization across different network infrastructures and significantly reduces the need for extensive retraining.
This study suggests a unified cybersecurity threat detection pipeline, building on the developments. The main innovation is the integration of these technologies, namely, Convolutional Neural Networks (CNNs), ensemble classifiers, GANs, and transfer learning into a single, cohesive framework. The suggested pipeline creates synthetic data which then is fed to CNN-based detectors. Additionally, the system uses transfer learning to increase model applicability across various network conditions and organizational contexts and ensemble methods to combine the predictive strengths of multiple classifiers. By combining the unique benefits of model diversification, cross-domain knowledge transfer, and synthetic data generation, this paper makes a substantial contribution to the development of intelligent, AI-driven cybersecurity. The suggested framework offers realistic steps for building more robust cyber security infrastructures that can tackle both present and emerging threats, while also directly addressing the technical shortcomings of existing systems.
The remainder of the paper is organized as follows: Section 2 presents related works, focusing on the domain of cybersecurity and mainly revolve around GANs, zero-day attacks, transfer learning and ensemble methods. Section 3 describes in detail the proposed methodology designed and developed, whilst Section 4 elaborates on the produced results. Finally, Section 5 concludes the paper.
2. Related Works
In recent scientific literature, many publications utilize GANs for detecting and fighting cybersecurity threats. Mu et al. [12] proposed a Wasserstein Generative Adversarial Networks with Gradient Penalty (WGAN-GP) model for generating synthetic network traffic data which can realistically simulate patterns of zero-day attacks. Experimental testing using the NSL-KDD dataset [13] showed that the WGAN-GP model could improve the detection accuracy for both binary classification and multi-classification (2.3% and 2% improvement respectively). The model helped the classification models in identifying even subtle signatures of zero-day attacks. A GAN-based model for detecting zero-day malware in Android mobile devices was introduced by Chhaybi and Lazaar [14]. This model was capable of producing previously unknown viruses and threats which were used for the training process. Both the sigmoid and ReLU activation functions were employed and the Fréchet Inception Distance (FID) and Inception Score (IS) scores were used for evaluating the performance of the model. The FID metric is commonly used for assessing the performance of GANs [15] and measures the similarity of the training set distribution and the generated samples’ distribution. The IS evaluates the diversity and quality of the images generated by a GAN model [16]. The model proposed by the authors reached an IS score of 7.65 and FID score of 2.34, indicating that its generated results were very realistic and of high quality. Won et al. [17] presented a GAN-based malware training and augmentation framework. The so-called PlausMal-GAN framework was capable of generating high-quality zero-day malware images of high diversity. For the classification of malware images both real and generated malware data were utilized. Furthermore, the framework was tested with four different GAN models, namely the Least Squares Generative Adversarial Network (LSGAN), WGAN-GP, Deep Convolutional Generative Adversarial Network (DCGAN), and Evolutionary Generative Adversarial Network (E-GAN), yielding classification results of up to 98.74% accuracy.
GANs are also employed in adversarial attacks IoT and Internet of Vehicles (IoV) applications. Benaddi et al. [18] proposed an Intrusion Detection System (IDS) and utilized Conditional Generative Adversarial Networks (CGANs) to improve the training process which often suffers from missing or unbalanced data. More specifically, the IDS model was CNNLSTM-based. These kinds of models combine the strengths of CNNs and Long Short-Term Memory (LSTM) networks. The IDS model was evaluated both before and after applying cGANs. This combination yielded better overall accuracy, precision and F1-scores in different attack types (e.g., Denial-of-Service-DoS, Distributed Denial-of-Service- DDoS, Info Theft, Info Gathering) and increased the theft attack detection accuracy by 40%. Saurabh et al. [19] proposed a Semi-supervised GAN model (SGAN) for detecting botnets in Internet of Things (IoT) environments. This model aimed to overcome the challenge of many supervised models, which due to unlabeled network traffic sometimes cannot directly categorize botnets which are responsible for a specific attack. The SGAN achieved a binary classification accuracy of 99.89% and a multi classification accuracy of 59%. These results were better than the results achieved by an Artificial Neural Network (ANN) model and a CNN model when tested on the same dataset. The specific model also did not require large, labelled datasets, which are often required by supervised learning models. A model for IoV applications was showcased by Xu et al. [20]. This model aimed at improving the detection of zero-day attacks in IoV applications, which often lack labelled data. The authors designed an attack sample augmentation algorithm, also incorporating a collaborative focal loss function into the discriminator to improve classification results. Experimental testing of the aforementioned approach indicated high F1 scores as compared to similar models, yielding an average 93.32% F1 score across four different attack types (i.e., DoS, Disruptive, RandomSpeed-RS, RandomPosOffset-RPO). The loss function used by the authors also outperformed other loss functions (Wasserstein Distance, Cross-Entropy Loss, Euclidian Distance, Kullback-Leibler Divergence) in terms of F1-score and AUC score. Another model for Intrusion Detection was proposed by Kumar and Sinha [21]. This model combined Wasserstein Conditional Generative Adversarial Networks (WCGANs) and a XGBoost classifier. It was used for both synthetic data generation and classification of different kinds of attacks. It made use of gradient penalty for updating weights and was experimentally tested on three datasets (i.e., BoT-IoT, UNSW-NB15, and NSL-KDD). Its performance was also compared to the DGM model [22], achieving better results in terms of Precision, Recall, and F1-scores (86.7%, 88.47%, and 87.58% respectively as compared to 63.82%, 57.43%, and 60.46% of the DGM model).
DDoS attacks and botnet detection are the main focal points in different GAN-based publications. Lent et al. [23] proposed a GAN-based anomaly detection system for the detection and mitigation of DDoS attacks on software-defined networks. The model was tested with the Orion and the CIC-DDoS2019 datasets yielding an F1-score of 98.5% and not being seriously affected by the imbalance in the datasets. The model also helped in the mitigation, by determining which network flows will be included in a block list and which in a safe list. Botnet detectors often constitute targets of adversarial evasion attacks. Taking this into consideration, Randhawa et al. [24] introduced a GAN model which also utilized deep reinforcement learning for both exploring semantic aware samples and hardening the detection of botnets. The so-called RELEVAGAN was also experimentally tested and compared to another similar model called EVAGAN [25]. The results indicated that RELEVAGAN outperformed EVAGAN in terms of convergence speed. More specifically, it converged at least 20 iterations before the EVAGAN in all the tested datasets. Aiming to address the issue of critical information leakage during the training of GANs for botnet detection, Feizi and Ghaffari [26] presented a method combining Deep Convolutional GANs (DCGANs) and Differential Privacy (DP). The authors used DCGANs to distinguish real and fake botnets, applied DP, and implemented a mix-up method for stabilizing the training process. Experimental testing of the method indicated classification accuracy of 87.4% while keeping information leakage during the training process at acceptable levels.
In the following publications, ensemble machine learning techniques were applied for botnet detection. Afrifa et al. [27] combined three ML models (i.e., Random Forest - RF, Generalized Linear Model - GLM, and Decision Trees - DT), building a stacking ensemble model for detecting botnets in computer traffic. Out of the three individual ML models, the RF yielded the best coefficient of determination (R2), reaching 0.9977, followed by the DT with 0.9882, and the GLM with 0.9522. The use of the stacking ensemble model led to an increase of the R2 as compared to the use of individual ML models, resulting in a 0.2% improvement compared to RF and 1.15% and 3.75% as compared to the DT model and the GLM model respectively. Another model based on ensemble learning was proposed byAbu Al-Haija and Al-Dala’ien [28].The so called ELBA-IoT model aimed to serve as a lightweight botnet detection system for IoT applications. More specifically, the authors combined three DT techniques (i.e., AdaBoosted, RUSBoosted, Bagged). The proposed model was capable of profiling behavioral features in IoT networks and detecting anomalous traffic from compromised IoT nodes. Experimental testing showed that ELBA-IoT could reach high accuracy rates (up to 99.6%) while having a very low inference time of 40 μs. The accuracy of the ensemble classifier was higher than the accuracy of each individual classifier (AdaBoosted reached 97.3%, RUSBoosted reached 97.7%, and Bagged reached 96.2%). Hossain and Islam [29] presented a model for botnet detection which used ensemble learning and combined different feature selection techniques. More specifically, for the feature selection, the Principal Component Analysis, Mutual Information, and Categorical Analysis techniques were combined. Furthermore, the Extra Trees ensemble classification models were used, in which every decision tree was trained on a random subset of features from the input dataset. Experimental testing using different datasets (e.g., N-BaIoT, Bot-IoT, CTU-13, ISCX, CCC, CICIDS) indicated very high performance in terms of botnet detection, reaching a true positive rate of 99%. Finally, Srinivasan and Deepalakshmi [30] presented an ensemble classifier for botnet detection with stacking process called ECASP. The proposed model yielded an accuracy of 94.08%, a sensitivity of 86.5%, and a specificity of 85.68% when tested on publicly available datasets. ECASP outperformed three different models, i.e., an Extreme Learning Machine (ELM), a Support Vector Machine (SVM) and a CNN model.
3. Proposed Methodology
Chapter 3 presents the proposed integrative ML framework which has been designed for advanced cybersecurity threat detection and mitigation actions. This unified system combines synthetic data generation using GANs, transfer learning for image-based malware detection and ensemble learning for tabular network intrusion detection. The main goal of this research is to unify and enhance detection capabilities across diverse threat modalities and types, from zero-day and botnet attacks to malware included within images, through a modular and flexible pipeline architecture. The suggested methodology builds upon the authors’ previous work in related areas including GAN-based malware image synthesis and classification [11] zero-day attack data generation using tailored GAN models [9] and multi-model ensemble evaluations for intrusion detection [10].
3.1. Overview of the Unified Threat Detection Pipeline
The unified threat detection pipeline has been designed to support multiple input modalities of different types and formats and integrate them in an effective way within a modular architecture. It includes an input recognition component, two parallel processing branches, one for image-based threats and one for tabular-based network intrusion data, and a final fusion layer for decision support. Thus, α modular architecture has been chosen for flexibility, scalability and adaptability purposes to diverse threat modalities, including zero-day attacks, malware embedded within images, and network intrusion data. Each component operates independently, enabling the system to scale and adapt properly based on the input availability and the deployment environment. One of its core strengths lies within its ability to flexibly adapt to different types of cyber threat datasets, including image-based malware representations and structured tabular data of network traffic logs, without necessarily requiring standardization of the data inputs. This can be achieved through a two-branch system on the first layer of the suggested architecture, in which each branch specializes in different data modalities. To route incoming data to the appropriate branch, the pipeline includes a lightweight input-type classification layer that not only checks metadata and structure but also leverages traditional ML (shallow ML) models such as decision trees or entropy-based filters. These models are trained to distinguish malware image files from tabular network records based on statistical features. This approach enhances reliability compared to simple header-based detection and adds resilience to mislabeled or adversarial inputs. Based on the inferred type, each sample is automatically dispatched to the corresponding processing branch. Moreover, this mechanism ensures that even ambiguous or manipulated inputs are correctly routed, while maintaining modular adaptability for future extensions.
The first image-processing branch has been optimized for malware image classification, utilizing a transfer-learning advancements and CNNs, while the second tabular-processing-oriented-branch applies a soft-voting ensemble classifier to identify anomalies in network activity. Each branch is independently trained and functions autonomously, when the outputs of it are provided in the form of binary classification results, and more specifically in the form of malicious or benign threat. These outputs can optionally be merged on a decision-level fusion strategy layer, in cases where both data modalities refer to the same input instance. This option allows the system to combine the strengths of each detection approach, providing the capability to offer higher resilience against evasive or zero-day threats.
For further interoperability purposes, the architecture includes logging modules and configurable parameters for each branch, enabling the system to tune for different operational environments. Moreover, the modular nature of the suggested pipeline allows future extensions to receive additional data modalities such as textual, user activity and/or behavioral analytics data as input. These main features of flexibility, extensibility and modality with which the pipeline was designed, make it well-suited for deployment particularly in heterogeneous cybersecurity environments, including enterprise networks, endpoint detection systems and malware analysis sandboxes. The overall architecture of the proposed system is illustrated in Figure 1. It demonstrates the modular structure of the suggested, unified pipeline, composed of two specialized processing branches—one for image-oriented threats and one for tabular-based intrusion data—along with the input classification module, decision-level fusion logic and the rest of logging/configuration components. The design on this figure highlights how diverse threat data types can be handled independently but integrated coherently for final decision-making, within a layered and flexible design of different AI techniques that ensures scalability, adaptability and extensibility.
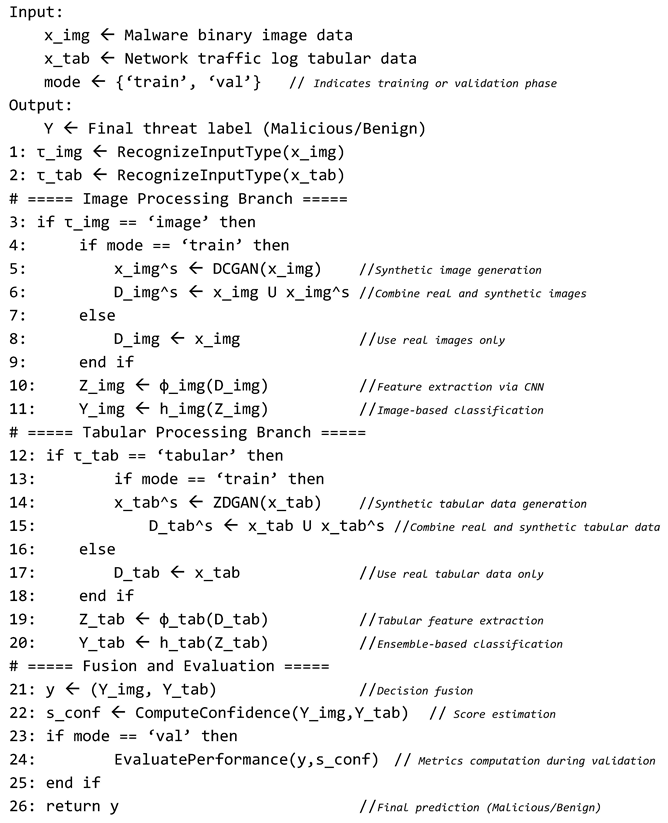
The pseudocode below clarifies the internal operational steps of the unified pipeline architecture depicted in Figure 1. This step-by-step representation outlines how incoming data is processed, classified and optionally fused, providing a clear abstraction of the pipeline's dynamic execution flow.
Pseudocode: Dual-Modality Threat Detection with GAN Augmentation
3.2. Synthetic Data Gemeration
3.2.1. ZDGAN for Zero-Day Tabular Data Synthesis
Data scarcity remains a critical challenge for both labeled and unlabeled cybersecurity datasets. To address this issue, particularly in the context of labeled zero-day attack data in structured network intrusion logs, we have adopted the Zero-Day Generative Adversarial Network (ZDGAN), an enhanced GAN variant introduced and developed within our prior work [9]. ZDGAN has been especially designed to simulate rare or previously unseen attack patterns by learning complex feature relationships from open-source datasets such as NSL-KDD and CTU-13. These datasets were used during the training and evaluation of ZDGAN, though the model has been designed to receive additional data sources as input in future extensions. The model architecture consists of fully connected layers in both the generator and discriminator, trained adversarial to synthesize tabular data that preserves properly the structural and statistical properties of real-world network traffic and events. The model’s primary objective focuses mainly on preserving class-conditional feature distributions while also generating realistic variations that accurately reflect emerging attack behaviors.
The synthetic records generated by ZDGAN serve as the augmentation layer for the training of the ensemble classifier, which will be detailed in Section 3.4. This integration enables the tabular processing branch to detect not only known threats but also to generalize to approximations of zero-day behaviors. To assess the quality and fidelity of the generated samples, we apply validation techniques, such as such as log-mean deviation analysis, feature-wise cosine similarity and visual inspection of class-wise t-SNE plots. These techniques also confirm both the diversity and realism of the synthetic dataset. Table 1 summarizes the structure and feature types of the ZDGAN-generated dataset used in this study.
3.2.2. ZDGAN for Tabular Botnets Data Synthesis
To further enrich the training set of the tabular threat detection branch, we incorporate synthetic botnet intrusion data generated from subsets of the CTU-13 dataset. These samples represent a variety of botnet behaviors including Neris, Rbot, and Virut traffic patterns. For the generation process, we adopt the same ZDGAN architecture as described in Section 3.2.2, due to its proven ability to capture rare patterns across sparse and imbalanced features. This approach ensures architectural consistency while enabling the synthesis of an expanded range of malicious behaviors.
The generated botnet samples augment the existing dataset used by the ensemble classifier, improving its ability to generalize to diverse threat categories. Validation of these botnet-specific synthetic samples follows the same methodology as the zero-day variants, using feature distribution comparisons, deviation metrics, and clustering visualizations. The combined augmentation strategy strengthens the classifier’s detection capabilities across a wider spectrum of real-world attack types without requiring additional data collection from live environments.
It is important to highlight the different uses of ZDGAN in this framework and specifically between the two data sources engaged and the modeling objectives involved. Although both implementations rely on the same GAN (ZDGAN) architecture, the nature of the training data and the targets of the data samples generation differ significantly. In the case of zero-day attacks, ZDGAN is trained using NSL-KDD and generic CTU-13 entries to simulate infrequent or unknown threat vectors generally categorized as anomalies. In the opposite direction, the botnet data synthesis variant of ZDGAN is constrained to a subset of CTU-13 focused specifically on botnet activity, generating labeled records that reflect behavior from families like Neris, Rbot, and Virut. This results in varying feature schemas, label distributions and operational roles despite relying on the equal architectural model. Table 3 summarizes these differences to clarify how ZDGAN contributes to diversified threat modeling within the tabular processing pipeline and during synthetic data generation on different data modalities.
3.2.3. DCGAN for Malware Image Synthesis
To mitigate the limited availability of malware image datasets and improve the robustness of image-based threat classification, this particular study [11] adopts a DCGAN for synthetic data generation. This suggested approach follows our prior work [11] where malware binary samples were transformed into grayscale or RGB images and afterwards used to train a DCGAN model. The generator maps random noise vectors into visually coherent 64×64-pixel malware images, while the discriminator learns to distinguish between real and synthetic samples. During the training implementations, the adversarial dynamics of the DCGAN gradually improve the visual fidelity and statistical consistency and accuracy of the generated images. In parallel, the generator employs transposed convolutional layers with batch normalization and ReLU activations, whereas the discriminator is built with striped convolutional layers and Leaky ReLU activations.
These generated images augment the training set of the CNN classifier in the image-processing branch, enhancing its ability to generalize to unseen variants of known malware families. Evaluation metrics from our prior work are adopted to demonstrate that DCGAN-augmented datasets yield improved classification accuracy and reduced false positive rates compared to real-related training samples. Additionally, frequency histograms, FID and classifier-based evaluation results confirm the quality and utility of the synthetic, generated samples. For this study, new malware images were generated using the pretrained DCGAN model from our earlier work, to maintain consistency with the architecture while enabling seamless integration into the proposed multimodal threat detection pipeline. This reuse of a validated model allows for methodological consistency and cost-efficient experimentation in a real-world deployment setting. Table 4 presents the image generation format and key attributes used in the DCGAN-generated dataset.
3.3. Transfer Learning for Image-Based Detection
The first branch of the proposed framework employs a transfer learning approach, consisting of an image-based threat detection mechanism centered around a pretrained ResNet50 CNN. This strategy capitalizes on the ability of deep residual networks to extract high-level visual features from structured image datasets, including the ones derived from malware binaries samples. Taking the limited availability of labeled malware image datasets into account, transfer learning can be considered as a particularly effective solution, allowing the reuse of robust feature extractors trained on large-scale image datasets such as the ImageNet.
The ResNet50 architecture has been adjusted by freezing the initial convolutional layers and fine-tuning the final dense layers using a domain-specific dataset consisting of real and DCGAN-generated malware images (as described in Section 3.2 on ‘DCGAN for Malware Image Synthesis’). The input malware images are uniformly resized to 64×64 pixels and normalized to ensure compatibility with the pretrained layers. The training set has been split and balanced to include both benign and malicious samples, with augmentation further improving generalization. The model is trained using a binary cross-entropy loss function, the Adam optimizer with weight decay regularization and a learning rate scheduler with early stopping based on validation loss.
To make the model’s decisions easier to understand, Gradient-weighted Class Activation Mapping (Grad-CAM) is optionally used to show which parts of the image influenced the prediction, supporting the classification decision-making. This helps to ensure that the model focuses on semantically meaningful visual features, rather than noise or artifacts introduced by the GAN generator. Evaluation metrics include classification accuracy, F1-score, false positive rate and confusion matrix analysis. In previous experiments, incorporating DCGAN-generated malware samples during training led to a statistically significant improvement in the classifier’s ability to generalize to previously unseen malware sets, especially those with obfuscated or polymorphic structures.
The outputs of this second-layer branch are binary predictions denoting whether an input sample is classified as benign or malicious. These results are used in isolation or combined in the decision-level fusion stage (Section 3.5) when tabular intrusion data is also available for the same case. Moreover, the simple but effective use of transfer learning ensures the system remains scalable for real-time or resource-constrained environments and procedures, while still maintaining high detection performance.
The network’s initial layers are frozen and only the final dense layers are fine-tuned using both real and synthetic malware images. The classification task is binary (malware vs. benign) and training is optimized using early stopping and learning rate scheduling. This setup enables effective learning from modest domain-specific datasets.
Table 5 summarizes the setup used to adapt the ResNet50 model for the image-based classification task. This table outlines the key architectural and training parameters applied during the transfer learning processes.
3.4. Ensemble Learning for Tabular Threat Detection
The tabular data processing branch adopts a soft voting ensemble classifier composed of five distinct base learners: K-Nearest Neighbors (KNN), Support Vector Classifier (SVC), RF, DT and Stochastic Gradient Descent (SGD). Each of these base classifiers is selected for its unique inductive bias and learning characteristics, enhancing to this end the ensemble’s robustness and generalization capabilities when applied to heterogeneous network intrusion datasets.
These classifiers are trained on a composite dataset that includes both real-world network traffic records and synthetic samples generated by the ZDGAN model, as previously discussed in Section 3.2. To manage class imbalance commonly present in intrusion detection datasets, two complementary strategies are applied: 1) oversampling of minority attack classes (using SMOTE or GAN-augmented sampling) and/or 2) under sampling of dominant benign records. This ensures that each model within the ensemble learns from a balanced distribution and is less susceptible to bias.
Training and hyperparameter tuning are performed independently for each base classifier, using stratified cross-validation on a training-validation split. Key hyperparameters, including the number of neighbors in KNN, kernel type for SVC, depth and number of trees in RF and DT and learning rate (lr) in SGD, are optimized through a grid search. The ensemble then aggregates predictions from all base models using a soft voting mechanism, which averages the predicted class probabilities and selects the class with the highest mean probability as the final output.
This ensemble approach offers enhanced resilience to overfitting phenomena, improved detection of low-frequency threats and greater adaptability results across different network environments and data modalities. Its integration with the synthetic data generation process ensures that the system remains capable of detecting rare or evolving attack patterns that would otherwise be underrepresented in real-world datasets or scenarios. These models are trained on a combination of real and synthetic tabular records. Experiments include variations of the training dataset such as under sampled and oversampled versions to address class imbalance. As a result, this ensemble method improves detection robustness and reduces overfitting to any single classifier.
Before concluding this section, Table 6 summarizes the key training configurations of the base learners that comprise the soft-voting ensemble classifier.
3.5. Fusion Output and Decision Logic
The Fusion and Decision Logic constitutes one important layer for the final decision that been extracted from the suggested pipeline. When both malware image and tabular data are available for the same input instance, their respective predictions are merged at the decision level using a confidence-weighted averaging strategy. This method calculates the final threat classification by averaging the probability score outputs extracted by the two branches, the image-based and tabular-based, and assigning greater weight to predictions made with higher classifier confidence. This strategy provides a balanced and probabilistic fusion mechanism that accommodates uncertainty in individual predictions, rather than relying on fixed thresholds or rigorous logic.
This probabilistic fusion ensures that threats indicated with high certainty in one modality are properly weighed even when the other modality shows uncertainty. By prioritizing average confidence scores, the system mitigates false positives from noisy inputs, while strengthening the decision boundary in ambiguous cases. Also, this approach balances sensitivity and accuracy while preserving real-time operability.
In cases where only one input modality is available, as a result of possible sensor limitations, missing data or partial logs, the available branch processes the input independently and provides the final prediction. The fusion module is bypassed in such cases and the system adjusts seamlessly to maintain functional reliability under partial input conditions.
Moreover, several alternative methods can be applied at the decision-level fusion stage of multimodal threat detection systems including:
- Majority Voting: Combines binary predictions from multiple branches and selects the majority class as the final decision [31]
- Bayesian Inference: Models each branch as a probabilistic source and uses posterior distributions to infer the most likely class [34]
- Dempster-Shafer Theory: Applies evidence theory to combine beliefs from different branches, accounting for uncertainty and conflict [35]
- Rule Based Method: Applies logical rules (e.g., OR) to combine binary decisions from multiple branches [36]
During the experimental section of this study in Chapter 4, we focus on evaluating three representative fusion methods: the Rule-Based (Boolean) approach for simplicity and explainability, Majority Voting for ensemble-orientation consensus and Confidence-Weighted Averaging to incorporate probabilistic certainty in decision-making. These methods are benchmarked and compared to identify the most effective strategy for robust multimodal threat detection within the Fusion layer.
3.6. Evaluation Plan
The evaluation phase of the proposed integrative cybersecurity threat detection framework has been designed to assess each pipeline’s component in isolation as well as in its full multimodal configuration. Its main goal is to measure the contribution of individual modules (GAN-based synthetic data generation, image-based CNN classifier, tabular ensemble classifier) and evaluate the fusion layer’s impact on overall threat detection performance.
To validate the effectiveness of the proposed system in realistic cybersecurity connfigurations, a structured and coherent experimental setup was established carefully. Each component of the pipeline, whether is related on image-based threats, tabular intrusion detection or their multimodal fusion, is evaluated under consistent and reproducible conditions. This setup aims to replicate a wide range of attack scenarios and operational conditions.
The evaluation relies on three key dimensions:
- Datasets – Three datasets are used including Malimg for the image-based malware detection branch, NSL-KDD and CTU-13 for tabular-oriented network intrusion analysis. Synthetic data augmentation is performed adopting models developed in previous works, DCGAN (image modality) and ZDGAN (tabular modality, including zero-day and botnet variants) to enhance generalization on different cyberthreat sections.
- Data Splitting and Preprocessing – Each dataset is divided into stratified training, validation and test sets to maintain label distributions. In GAN-augmented scenarios, synthetic samples are combined with real data prior to training. Preprocessing includes normalization and encoding tailored to each modality respectively. The datasets have been stratified into 70% for training, 15% for validation, and 15% for testing to maintain balanced class distributions.
- Environment and Execution – Experiments are run in a GPU-accelerated environment. Training leverages early stopping, learning rate scheduling and cross-validation have been selected to ensure robust model evaluation.
Table 7 provides a summary of the metrics used in this study, describing their role and the branch or component to which each applies. Each classification has been evaluated using particular metrics as clearly stated right below.
Table 8 summarizes the configuration of evaluation experiments applied to each branch of architecture. It includes the datasets used, any synthetic augmentation involved, the base classifiers employed and the final structure of the outputs for the decision fusion stage.
The last layer of the suggested pipeline, the fusion component, plays a pivotal role in consolidating predictions from multiple data modalities. The evaluation of various fusion strategies allows this work to identify and select the most reliable method to combine the extracted results from both the image and tabular branches of the pipeline.
To select a fair evaluation of the impact of the fusion mechanism, we focus on performance improvements when both modalities are available for an input instance. Several fusion strategies are tested to understand their comparative benefits before selecting the optimal one. Subsequently, a representative subset of matched input samples each containing both image-based and tabular features is passed through the full pipeline. Experiments are structured to compare how the image-only, tabular-only and fusion-enabled configurations perform across the evaluation metric. Among the tested fusion strategies, the confidence-weighted averaging method is benchmarked against majority voting and OR-based logic to validate its overall effectiveness. The remaining two strategies, Dempster-Shafer and Bayesian Inference, while theoretically robust, were finally excluded from full evaluation due to computational and integration constraints in the current pipeline design. The evaluation focuses on threat detection accuracy, F1-score, and false positive rates under scenarios that simulate zero-day attacks, botnet intrusions, and complex multi-source evasive threats. Table 9 lists each evaluated fusion approach along with a short description.
4. Experimental Analysis and Results
4.1. Evaluation Plan
Chapter 4 provides an extensive analysis and evaluation of the experimental results aimed at validating the effectiveness, robustness, and generalizability of the proposed integrative threat detection framework under diverse cybersecurity scenarios. Specifically, the extended evaluation presented on this chapter has been structured to assess how each component, including the input-type recognition layer, synthetic data generation modules, data classifiers, and final decision-level fusion module, contributes individually and in an integrated manner to improve the overall threat detection performance.
The key objectives of this evaluation process include assessing the accuracy of the input-type recognition module, which ensures proper routing of image and tabular-based data to the appropriate pipeline branches. Additionally, the evaluation procedure aims to quantify the detection performance of each individual branch-the image-based CNN classifier and the tabular-based ensemble model-across the corresponding representative datasets. Another objective is to examine the contribution of GAN-based synthetic data augmentation in improving generalization, particularly for rare threat types such as zero-day and botnet attacks, ensuring the extensibility of this layer to further types of cybersecurity threat datasets. The comparative effectiveness of multiple decision-level fusion strategies is also investigated, in order to determine the most reliable method for combining multimodal outputs when available. Lastly, the evaluation considers performance across specific threat categories, such as zero-day exploits, botnet intrusions, and multi-source evasive threats, to understand the system’s adaptability in realistic deployment scenarios.
To support these objectives, multiple experiments are conducted using publicly available datasets augmented with synthetic data, with evaluation metrics such as accuracy, precision, recall, F1-score and false positive rate. This chapter presents both quantitative and qualitative insights into the system’s behavior under varying operational conditions and scenarios.
4.2. Evaluation of the Input-Type Recognition Layer
The evaluation of the efficiency and accuracy of the input-type recognition layer was conducted by implementing a comparative experiment using three lightweight traditional (shallow) ML classifiers: DT, Logistic Regression and RF. A synthetic dataset of 10,000 total samples, consisting of 5,000 image-based files and 5,000 tabular records, was generated and used as input to simulate structural differences in typical cybersecurity inputs. Each sample was characterized by features such as file size, entropy and encoded file extension. Additionally, to preserve label balance across the evaluation process, the dataset was split using stratified 70/30 train-test partitions, respectively.
As shown in Table 10, all models achieved perfect accuracy (1.00) and F1-scores, ensuring that the process of input-type recognition layer is highly separable using minimal features. However, the Decision Tree classifier significantly outperformed the others in terms of inference time, classifying inputs in just 6.04 milliseconds. In contrast, Logistic Regression and Random Forest required 94.45 ms and 147.96 ms, respectively. As a result, these findings lead to the selection of the Decision Tree-based input classifier, balancing high performance with minimal computational cost. This validates the design choice of employing a shallow ML model to ensure real-time routing throughout the (first) input layer of the suggested pipeline.
A visual comparison of the inference times of the model compared above is illustrated in Figure 2, highlighting the advantage of the Decision Tree Classifier in terms of the efficiency in time-reference routing scenarios.
4.3. Evaluation of GAN Models for Data Synthesis
4.3.1. Evaluation of ZDGAN for Zero-Day Data Synthesis
The ZDGAN, introduced in the previous chapter, has been adopted to generate synthetic zero-day attack records for tabular network intrusion data. The main goal of this model, in the context of this integrated system, is to enhance the generalization capacity of the tabular-processing branch by introducing simulated examples of novel or rare cyberattacks. Rather than retraining or modifying the ZDGAN architecture, this evaluation focuses on quantifying the quality and diversity of the generated data, ensuring that the augmentation process contributes to improved threat detection coverage in a meaningful way.
To evaluate the output of ZDGAN, a set of synthetic tabular samples was generated, using the pre-trained generator which were then compared against real data records from NSL-KDD and CTU-13. A total of 10,000 synthetic and 10,000 real samples were used for comparison purposes. Hence, their similarity underwent further evaluation using five key metrics: mean cosine similarity, log-mean deviation, Jensen-Shannon divergence, diversity index, and dimensionality reduction-based cluster visualization. Cosine similarity measures directional alignment across feature vectors, while log-mean deviation quantifies statistical distance between distributions of real and synthetic records. To visualize how well synthetic records cluster with their real counterparts, the method of Principal Component Analysis (PCA) was selected and applied, to project both datasets into a 2D embedding space.
Table 11 reports a detailed summary of metrics extracted using and evaluating the ZDGAN model. These metrics offer strong evidence of the synthetic data's structure and statistical distribution and its capacity to serve as a meaningful augmentation to real-world intrusion datasets. The average cosine similarity was calculated at 81.9%, indicating a strong feature-level alignment. The average log-mean deviation across all features was found to be 82%, confirming that the synthetic records remain close to the real data distributions without exhibiting mode collapse or over-smoothing results. Beyond these core metrics, Jensen-Shannon divergence was estimated at 10.4%, reflecting a modest divergence in probability distributions that is still within acceptable limits for high-quality data synthesis. Additionally, a synthetic sample diversity index of 77% suggests the generator introduces meaningful variation among samples, preventing overfitting in downstream classifiers. Finally, the t-SNE cluster metric achieved a result of 87%, confirming that synthetic records were inserted well within the high-dimensional space of their real counterparts. Together, these metrics extracted highlight that the ZDGAN-generated samples are not only statistically similar to real data, but also diverse and semantically meaningful in terms of quality, an aspect essential for improving generalization in zero-day attack detection tasks.
Figure 3 illustrates how synthetic and real samples group together, showing that the generator learns important patterns from the input data. In addition to this, Figure 4 depicts a feature-level comparison of the extracted deviations. These results demonstrate that ZDGAN can produce reliable, diverse, structurally and statistically consistent synthetic samples that generalize well to unseen threats, thereby strengthening the detection performance of the ensemble classifier described in detail, also in Chapter 3.
4.3.2. Evaluation of ZDGAN for Botnet Data Synthesis
Following the logic of sub-chapter 4.3.2, To evaluate ZDGAN’s applicability beyond zero-day intrusion synthesis, the model was applied to a separate dataset focused on botnet attack traffic. The goal was to determine whether the generator could generalize effectively across different threat categories. The same architecture, training configuration, and evaluation pipeline were reused, and only the dataset and class schema were modified.
As shown in Table 12, the generated samples retained strong alignment with the original botnet traffic data. A mean cosine similarity of 80.3% indicated solid feature-level consistency, while the average log-mean deviation was calculated at 9.3%, suggesting only minor dispersion across synthetic instances. The Jensen-Shannon divergence remained relatively low at 11.7%, reinforcing the statistical proximity between real and synthetic distributions. The diversity index of 74% confirmed that the model did not collapse into repetitive patterns, and a t-SNE overlap score of 85% demonstrated that synthetic clusters were meaningfully embedded within the real feature space.
As before, Figure 5 illustrates how synthetic and real samples group together, while Figure 6 demonstrates the feature-level comparison of the extracted deviations. These results validate the portability of ZDGAN to different structured intrusion datasets, confirming that its generative capabilities can be extended across threat domains. This generalizability is particularly useful in real-world deployments, where emerging threats—such as botnets—demand timely simulation to strengthen detection pipelines.
4.3.3. Evaluation of DCGAN for Malware Image Data Synthesis
To evaluate the synthetic image generation capability for the layer of the image-based pipeline, a Deep Convolutional GAN (DCGAN) was adopted to generate grayscale malware images that follow the structural patterns of the Malimg dataset, as previously detailed within Chapter 3. The primary goal of this evaluation is to assess how realistic and diverse the synthetic images are in comparison to real malware instances and to ensure they preserve intra-class visual features while introducing meaningful inter-class diversity.
The generated images were compared to real malware samples using four key metrics that assess both structural similarity and distributional diversity. These metrics include the Structural Similarity Index Measure (SSIM), FID, average entropy and an inter-class diversity index. The results, shown in Table 13, indicate that the DCGAN-generated samples maintain high structural integrity with an SSIM of 87.3% and achieve a moderate FID of 24.6, which proves reduced deviation between the real and synthetic image feature distribution. Even if this metric is not as low as other more generic image-oriented generation tasks, taking into account the specialized nature and class imbalance of the malware set of images, it can be considered very competitive for domain-specific image generation. To further examine the quality and randomness of the samples, average entropy was calculated per image and reached 6.38, indicating high pixel variability and confirming that the generated samples do not suffer from mode collapse or over-smoothing. Finally, the diversity index score at 0.72, measuring variation across generated malware classes, an aspect that signifies adequate intra-class diversity and supports generalization across different malware families for future extensibility of the particular layer of the pipeline.
Figure 7 demonstrates the PCA visualization diagram generated, illustrating and highlighting the inter-class and intra-class coherence. The results ensure the DCGAN model’s capability to generate the training space with diverse malware-like patterns.
4.4. Performance of Individual Branches
The performance of the two modality-specific detection branches of the proposed framework, the CNN-based image classifier for malware detection and the ensemble learning model for network intrusion analysis using tabular data, is evaluated under this section of the current study. Each branch is assessed independently to measure its detection capacity when it can also operate autonomously, prior to the fusion processes.
The CNN-based branch leverages a pre-trained VGG16 architecture, fine-tuned on malware image data synthesized and augmented using a DCGAN. A balanced dataset of 50,000 real and 50,000 synthetic grayscale malware samples was used to train and test the model.
The tabular branch integrates three classifiers—Random Forest, XGBoost, and SVM—into a soft voting ensemble. It was trained and tested on a combination of NSL-KDD and CTU-13 datasets, augmented by synthetic samples from ZDGAN. The test set also included 50,000 real and 50,000 synthetic intrusion records.
Table 14 presents a comprehensive summary of the evaluation metrics for the two detection branches of the proposed framework. The image-based CNN classifier, achieved an accuracy of 97.2% and an F1-score of 97.3% when trained on a balanced dataset of 100,000 grayscale malware images (50% real, 50% synthetic). Precision and recall remained closely aligned at 97.5% and 97.1% respectively, while the Area Under the ROC Curve (AUC) was exceptionally high at 99.1%, indicating the model’s strong discriminative ability even under varied data sample complexities. On the other hand, the tabular-based classifier also showed reliable performance. Trained on a similarly sized dataset of 100,000 intrusion records (comprising real and ZDGAN-synthesized samples from NSL-KDD and CTU-13), it reached 94.5% accuracy and an F1-score of 94.6%. Its precision and recall were also high, 95.2% and 94.1%, respectively, with a robust AUC of 98.2%, that reflects consistent performance across various intrusion types including zero-day and botnet attacks. Together, these results establish the individual and combined efficiency of both detection branches before fusion integration.
Figure 8 and Figure 9 provide a visual comparison of the classification performance metrics between the image and tabular branches. Figure 8 illustrates a radar chart capturing five key metrics, as presented in Table 14, for both branches, allowing for an intuitive side-by-side performance overview. The chart reveals a consistently higher metric profile for the image-based CNN branch, particularly in precision and AUC, while the tabular branch remains competitive, especially in recall.
Figure 9 further reinforces this comparison through a grouped bar chart, highlighting metric-wise differences between the two branches. The visual separation between bars clearly highlights the quantitative margins, with the CNN-based model achieving slightly higher performance in most categories. These visualizations emphasize the complementary strengths of each modality and justify their joint use in a unified fusion architecture as described in Chapter 3.
4.5. Comparison of Different Fusion Strategies
The fusion layer plays a crucial role when both data modalities are available as a given input instance, enabling the system to combine predictions from each independent model to produce a final decision. The current section of the current work evaluates and compares the performance of multiple decision-level fusion strategies used to integrate outputs from the image and tabular branches of the proposed threat detection pipeline. To this end, we selected and evaluated three distinct fusion methods, as indicated within sub-chapter 3.5: Majority Voting, Rule-Based (Boolean Logic) and Confidence-Weighted. Each strategy was applied to a subset of test samples that included both image-based and tabular-based data, enabling multimodal fusion under realistic simulation environments. The goal was to measure the efficiency of each method in terms of threat detection accuracy, precision, recall, F1-score and false positive rate when both predictions are integrated rather than taken from a single branch individually.
Table 15 highlights the comparative results for each algorithm, respectively. As it's obvious, among the methods tested, Confidence-Weighted Averaging outperformed the others across the most key evaluation metrics, achieving a superior balance between precision and recall, as well as the lowest false positive rate. These results confirm the effectiveness, robustness and operational feasibility of dynamically weighting predictions based on the relative confidence levels of each model certainty, especially in heterogeneous data environments.
Figure 10, illustrates the F1-score and AUC performance of each strategy, highlighting the performance results of probabilistic combination techniques over simpler rules like majority voting or Boolean logic.
The evaluation confirms that the integrative framework is capable of adapting to multiple data formats and leveraging synthetic augmentation to strengthen detection robustness, while the selected fusion mechanism plays a key role in enhancing decision-making's reliability across the framework.
5. Conclusions and Future Work
The current study presented an integrative framework for advanced cybersecurity threat detection that combines GAN-based synthetic data generation, modality-specific classifiers and decision-level fusion strategies. Through a modular and adaptable architecture, the system efficiently processes both image-based malware samples and structured tabular network intrusion data. Experimental results demonstrated high detection accuracy performance for each individual branch, particularly 97.2% for the CNN-based malware detector and 94.5% for the ensemble tabular classifier. In parallel, the confidence-weighted averaging fusion strategy resulted to the best overall performance, achieving 96.7% accuracy and 98.5% AUC, confirming the added value of the addition of the multimodal fusion, as the last layer of the suggested pipeline, over standalone detection components.
The framework’s robustness was validated across diverse threat types, including zero-day exploits and botnet intrusions. Synthetic data generated through the selected ZDGAN and DCGAN models significantly improved generalization and resilience to rare or unseen threats. Moreover, the architecture’s ability to handle heterogeneous data streams and perform input-type recognition dynamically highlights its adaptability to real-world deployment environments. The extensive evaluation highlighted its scalability, modularity and extensibility, making it suitable for cybersecurity infrastructures such as intrusion detection systems, malware analysis sandboxes, and endpoint security platforms.
Future additions to this framework can explore the inclusion of additional modalities, such as user activity logs, behavioral analytics and natural language textual inputs (e.g., phishing emails or threat intelligence feeds). The integration of online learning components could further enhance adaptability in dynamic environments. Moreover, the incorporation of explainability mechanisms (e.g., SHAP or LIME) to interpret model decisions and increase transparency for cybersecurity analysts. Additionally, the framework’s design is also extensible to accommodate future advances in AI, including alternative deep learning (DL) architectures and large language models (LLMs), enabling hybrid reasoning or semantic enrichment. Lastly, real-time benchmarking on live network traffic and adversarial robustness evaluations will be explored to advance the framework's maturity toward production-grade deployment.
Author Contributions
Conceptualization, N.P., E.D., T.A and E.A. ; methodology, N.P., E.D, T.A. and E.A.; software, N.P.; validation, N.P., E.D. T.A., and E.A.; formal analysis, E.A. and N.P.; investigation, N.P, E.D. and T.A.; resources, E.D., T.A. and N.P.; data curation, N.P., E.A. writing—original draft preparation, N.P., T.A. and E.D.; writing—review and editing, E.A., N.P., E.D.; visualization, N.P. and T.A.; supervision, E.A.; project administration, E.A. All authors have read and agreed to the published version of the manuscript.
Funding
This research received no external funding.
Institutional Review Board Statement
Not applicable.
Informed Consent Statement
Not applicable.
Data Availability Statement
The data presented in this study are available on request from the corresponding author.
Acknowledgments
Not applicable.
Conflicts of Interest
The authors declare no conflicts of interest.
Abbreviations
The following abbreviations are used in this manuscript:
| AI | Artificial Intelligence |
| ANN | Artificial Neural Network |
| CGAN | Conditional Generative Adversarial Network |
| CNN | Convolutional Neural Networks |
| DCGAN | Deep Convolutional Generative Adversarial Network |
| DoS | Denial of Service |
| DDoS | Distributed Denial of Service |
| DL | Deep Learning |
| DP | Differential Privacy |
| DT | Decision Tree |
| EGAN | Evolutionary Generative Adversarial Network |
| ELM | Extreme Learning Machine |
| FID | Fréchet Inception Distance |
| GAN | Generative Adversarial Networks |
| GDP | Gross Domestic Product |
| GLM | Generalized Linear Model |
| IDS | Intrusion Detection System |
| IoC | Indicators of Compromise |
| IoT | Internet of Things |
| IoV | Internet of Vehicles |
| IS | Inception Score |
| KNN | K-Nearest Neighbors |
| LLM | Large Language Model |
| LSGAN | Least Squares Generative Adversarial Network |
| LSTM | Long Short-Term Memory |
| ML | Machine Learning |
| RF | Random Forest |
| SGAN | Semi-supervised Generative Adversarial Network |
| SGD | Stochastic Gradient Descent |
| SVC | Support Vector Classifier |
| SVM | Support Vector Machine |
| TL | Transfer Learning |
| WCGAN | Wasserstein Conditional Generative Adversarial Network |
| WGAN-GP | Wasserstein Generative Adversarial Network with Gradient Penalty |
| ZDGAN | Zero-Day Generative Adversarial Network |
References
- Fleck, A. Cybercrime Expected To Skyrocket in Coming Years. Statista 2024.
- Worldometer GDP by Country. Available online: https://www.worldometers.info/gdp/gdp-by-country/ (accessed on 20 June 2025).
- ΙΒΜ. Cost of a Data Breach Report 2024; Cost of a Data Breach Report; IBM Corporation: New Orchard Road Armonk, NY 10504, 2024. [Google Scholar]
- Griffiths, C. The Latest 2025 Phishing Statistics (Updated June 2025), AAG, 2025.
- ΙΒΜ. X-Force Threat Intelligence Index 2024; X-Force Threat Intelligence Index; IBM Corporation: New Orchard Road Armonk, NY 10504, 2024. [Google Scholar]
- SlashNext. The State of PHISHING 2024 Mid-Year Assessment; The State of PHISHING; SlashNext: Pleasanton CA, 2024. [Google Scholar]
- sonicwall. 2025 CYBER THREAT REPORT THE NEED FOR SPEED AND STRONG ALLIES TO OVERCOME THE CYBERSECURITY BATTLEFIELD; CYBER THREAT REPORT; sonicwall: Milpitas, CA, 2025. [Google Scholar]
- Purnama, Y.; Asdlori, A.; Ciptaningsih, E.; Kraugusteeliana, K.; Triayudi, A.; Rahim, R. Machine Learning for Cybersecurity: A Bibliometric Analysis from 2019 to 2023. Journal of Wireless Mobile Networks, Ubiquitous Computing, and Dependable Applications 2024, 15, 243–258. [Google Scholar] [CrossRef]
- Peppes, N.; Alexakis, T.; Adamopoulou, E.; Demestichas, K. The Effectiveness of Zero-Day Attacks Data Samples Generated via GANs on Deep Learning Classifiers. Sensors 2023, 23. [Google Scholar] [CrossRef] [PubMed]
- Peppes, N.; Daskalakis, E.; Alexakis, T.; Adamopoulou, E.; Demestichas, K. Performance of Machine Learning-Based Multi-Model Voting Ensemble Methods for Network Threat Detection in Agriculture 4.0. Sensors 2021, 21. [Google Scholar] [CrossRef]
- Peppes, N.; Alexakis, T.; Daskalakis, E.; Demestichas, K.; Adamopoulou, E. Malware Image Generation and Detection Method Using Dcgans and Transfer Learning. IEEE Access 2023, 11, 105872–105884. [Google Scholar] [CrossRef]
- Mu, Z.; Shi, X.; Dogan, S. Information System Security Reinforcement with WGAN-GP for Detection of Zero-Day Attacks. In Proceedings of the 2024 7th international conference on artificial intelligence and big data (ICAIBD); 2024; pp. 105–110. [Google Scholar]
- Zhang, C.; Ruan, F.; Yin, L.; Chen, X.; Zhai, L.; Liu, F. A Deep Learning Approach for Network Intrusion Detection Based on NSL-KDD Dataset. October 2019; 41–45. [Google Scholar]
- Chhaybi, A.; Lazaar, S. System Call Frequency Analysis-Based Generative Adversarial Network Model for Zero-Day Detection on Mobile Devices. International Journal of Electrical and Computer Engineering (IJECE) 2024, 14, 1969–1978. [Google Scholar] [CrossRef]
- Heusel, M.; Ramsauer, H.; Unterthiner, T.; Nessler, B.; Hochreiter, S. GANs Trained by a Two Time-Scale Update Rule Converge to a Local Nash Equilibrium 2018.
- Salimans, T.; Goodfellow, I.; Zaremba, W.; Cheung, V.; Radford, A.; Chen, X.; Chen, X. Improved Techniques for Training Gans. In Proceedings of the Advances in neural information processing systems; Lee, D., Sugiyama, M., Luxburg, U., Guyon, I., Garnett, R, Eds.; Curran Associates, Inc., 2016; Vol. 29. [Google Scholar]
- Won, D.-O.; Jang, Y.-N.; Lee, S.-W. PlausMal-GAN: Plausible Malware Training Based on Generative Adversarial Networks for Analogous Zero-Day Malware Detection. IEEE Transactions on Emerging Topics in Computing 2022, 1–1. [Google Scholar] [CrossRef]
- Benaddi, H.; Jouhari, M.; Ibrahimi, K.; Benslimane, A.; Amhoud, E.M. Adversarial Attacks against IoT Networks Using Conditional GAN Based Learning. In Proceedings of the GLOBECOM 2022 - 2022 IEEE global communications conference; 2022; pp. 2788–2793. [Google Scholar]
- Saurabh, K.; Singh, A.; Singh, U.; Vyas, O.P.; Khondoker, R. GANIBOT: A Network Flow Based Semi Supervised Generative Adversarial Networks Model for IoT Botnets Detection. In Proceedings of the 2022 IEEE International Conference on Omni-layer Intelligent Systems (COINS); 2022; pp. 1–5. [Google Scholar]
- Xu, B.; Zhao, J.; Wang, B.; He, G. Detection of Zero-Day Attacks via Sample Augmentation for the Internet of Vehicles. Vehicular Communications 2025, 52, 100887. [Google Scholar] [CrossRef]
- Kumar, V.; Sinha, D. Synthetic Attack Data Generation Model Applying Generative Adversarial Network for Intrusion Detection. Computers & Security 2023, 125, 103054. [Google Scholar] [CrossRef]
- Dlamini, G.; Fahim, M. DGM: A Data Generative Model to Improve Minority Class Presence in Anomaly Detection Domain. Neural Computing and Applications 2021, 33, 13635–13646. [Google Scholar] [CrossRef]
- Brandão Lent, D.M.; da Silva Ruffo, V.G.; Carvalho, L.F.; Lloret, J.; Rodrigues, J.J.P.C.; Lemes Proença, M. An Unsupervised Generative Adversarial Network System to Detect DDoS Attacks in SDN. IEEE Access 2024, 12, 70690–70706. [Google Scholar] [CrossRef]
- Randhawa, R.H.; Aslam, N.; Alauthman, M.; Khalid, M.; Rafiq, H. Deep Reinforcement Learning Based Evasion Generative Adversarial Network for Botnet Detection. Future Generation Computer Systems 2024, 150, 294–302. [Google Scholar] [CrossRef]
- Randhawa, R.H.; Aslam, N.; Alauthman, M.; Rafiq, H. Evasion Generative Adversarial Network for Low Data Regimes. IEEE Transactions on Artificial Intelligence 2023, 4, 1076–1088. [Google Scholar] [CrossRef]
- Feizi, S.; Ghaffari, H. Botnet Detection and Information Leakage Mitigation with Differential Privacy under Generative Adversarial Networks. Cluster Computing 2024, 28, 89. [Google Scholar] [CrossRef]
- Afrifa, S.; Varadarajan, V.; Appiahene, P.; Zhang, T.; Domfeh, E.A. Ensemble Machine Learning Techniques for Accurate and Efficient Detection of Botnet Attacks in Connected Computers. Eng 2023, 4, 650–664. [Google Scholar] [CrossRef]
- Abu Al-Haija, Q.; Al-Dala’ien, M. ELBA-IoT: An Ensemble Learning Model for Botnet Attack Detection in IoT Networks. Journal of Sensor and Actuator Networks 2022, 11. [Google Scholar] [CrossRef]
- Hossain, Md.A.; Islam, Md.S. A Novel Hybrid Feature Selection and Ensemble-Based Machine Learning Approach for Botnet Detection. Scientific Reports 2023, 13, 21207. [Google Scholar] [CrossRef]
- Srinivasan, S.; P, D. Enhancing the Security in Cyber-World by Detecting the Botnets Using Ensemble Classification Based Machine Learning. Measurement: Sensors 2023, 25, 100624. [Google Scholar] [CrossRef]
- Morvant, E.; Habrard, A.; Ayache, S. Majority Vote of Diverse Classifiers for Late Fusion. In Proceedings of the Structural, syntactic, and statistical pattern recognition; Fränti, P., Brown, G., Loog, M., Escolano, F., Pelillo, M., Eds.; Springer Berlin Heidelberg: Berlin, Heidelberg, 2014; pp. 153–162. [Google Scholar]
- Schörgendorfer, A.; Elmenreich, W. Extended Confidence-Weighted Averaging in Sensor Fusion. January 2006. [Google Scholar]
- Elmenreich, W. Fusion of Continuous-Valued Sensor Measurements Using Confidence-Weighted Averaging. Journal of Vibration and Control 2007, 13, 1303–1312. [Google Scholar] [CrossRef]
- Massignan, J.A.D.; London, J.B.A.; Bessani, M.; Maciel, C.D.; Fannucchi, R.Z.; Miranda, V. Bayesian Inference Approach for Information Fusion in Distribution System State Estimation. IEEE Transactions on Smart Grid 2022, 13, 526–540. [Google Scholar] [CrossRef]
- Murphy, R.R. Dempster-Shafer Theory for Sensor Fusion in Autonomous Mobile Robots. IEEE Transactions on Robotics and Automation 1998, 14, 197–206. [Google Scholar] [CrossRef]
- Zemirline, A.; Lecornu, L.; Solaiman, B. Rule-Based Diagnostic System Fusion. In Proceedings of the 2007 10th International Conference on Information Fusion; 2007; pp. 1–7. [Google Scholar]
Figure 1.
Overview of the suggested Unified Threat Detection Architecture.
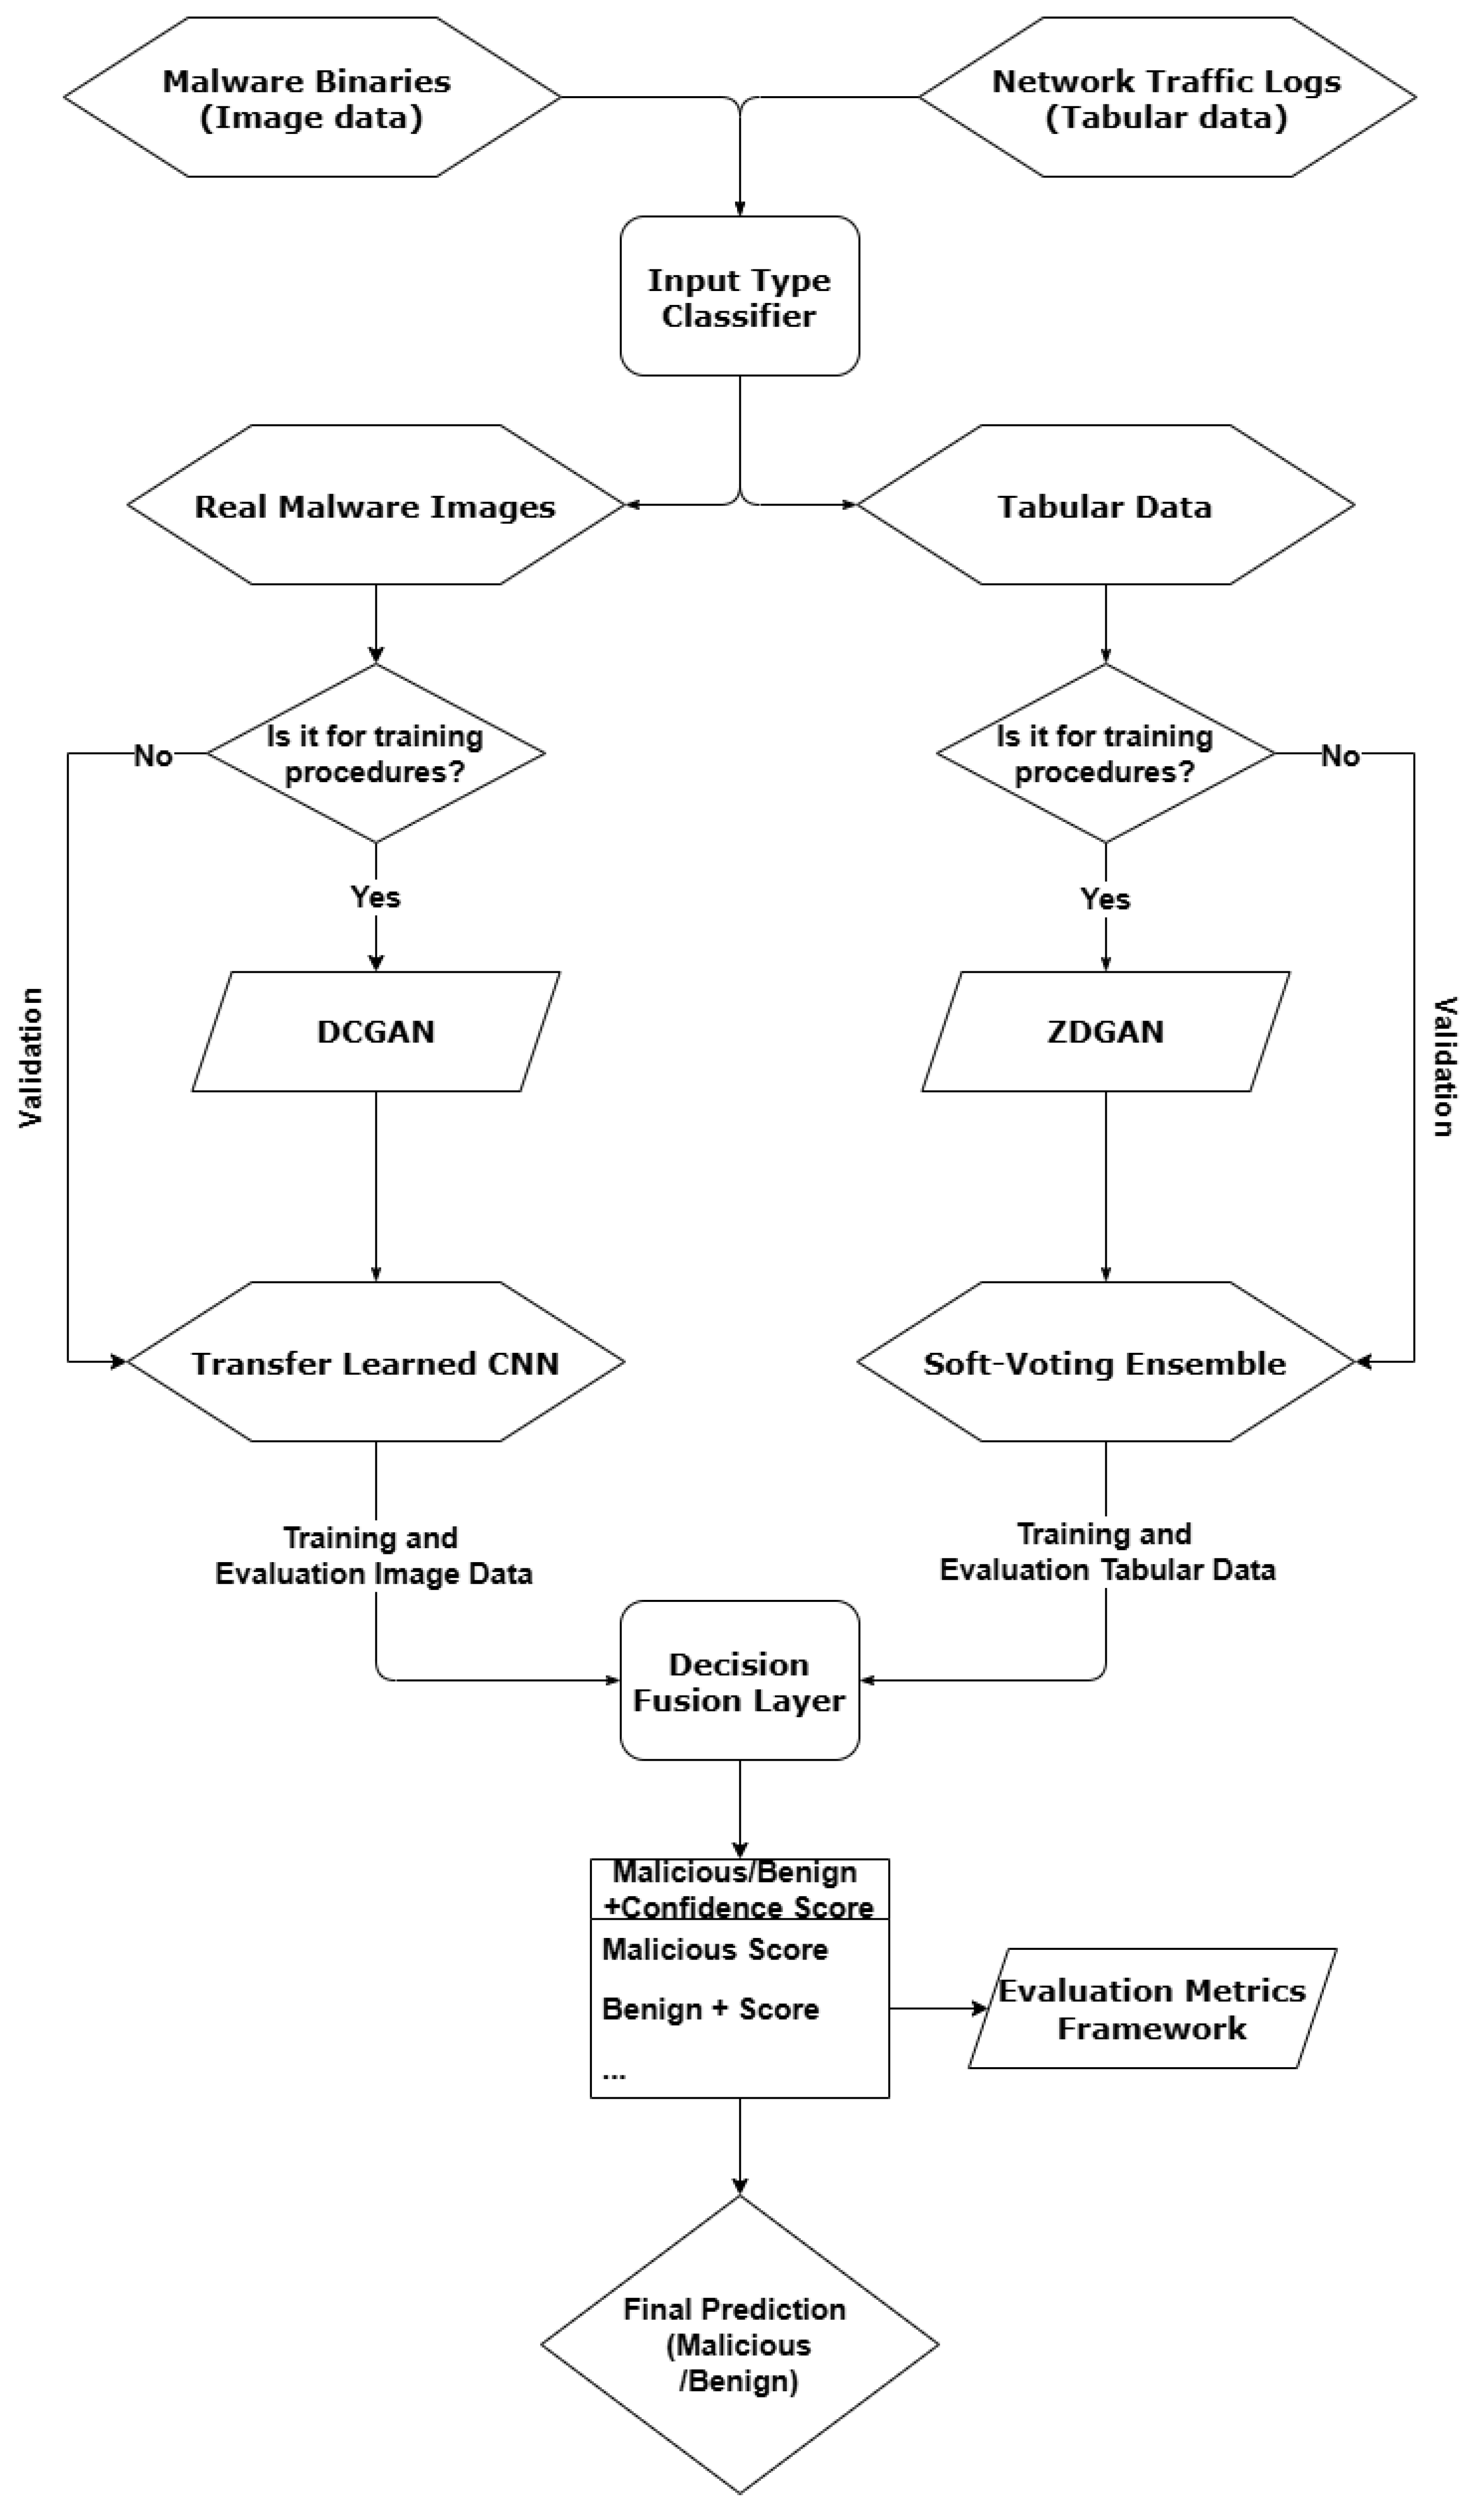
Figure 2.
Inference Time per ML Classifier.
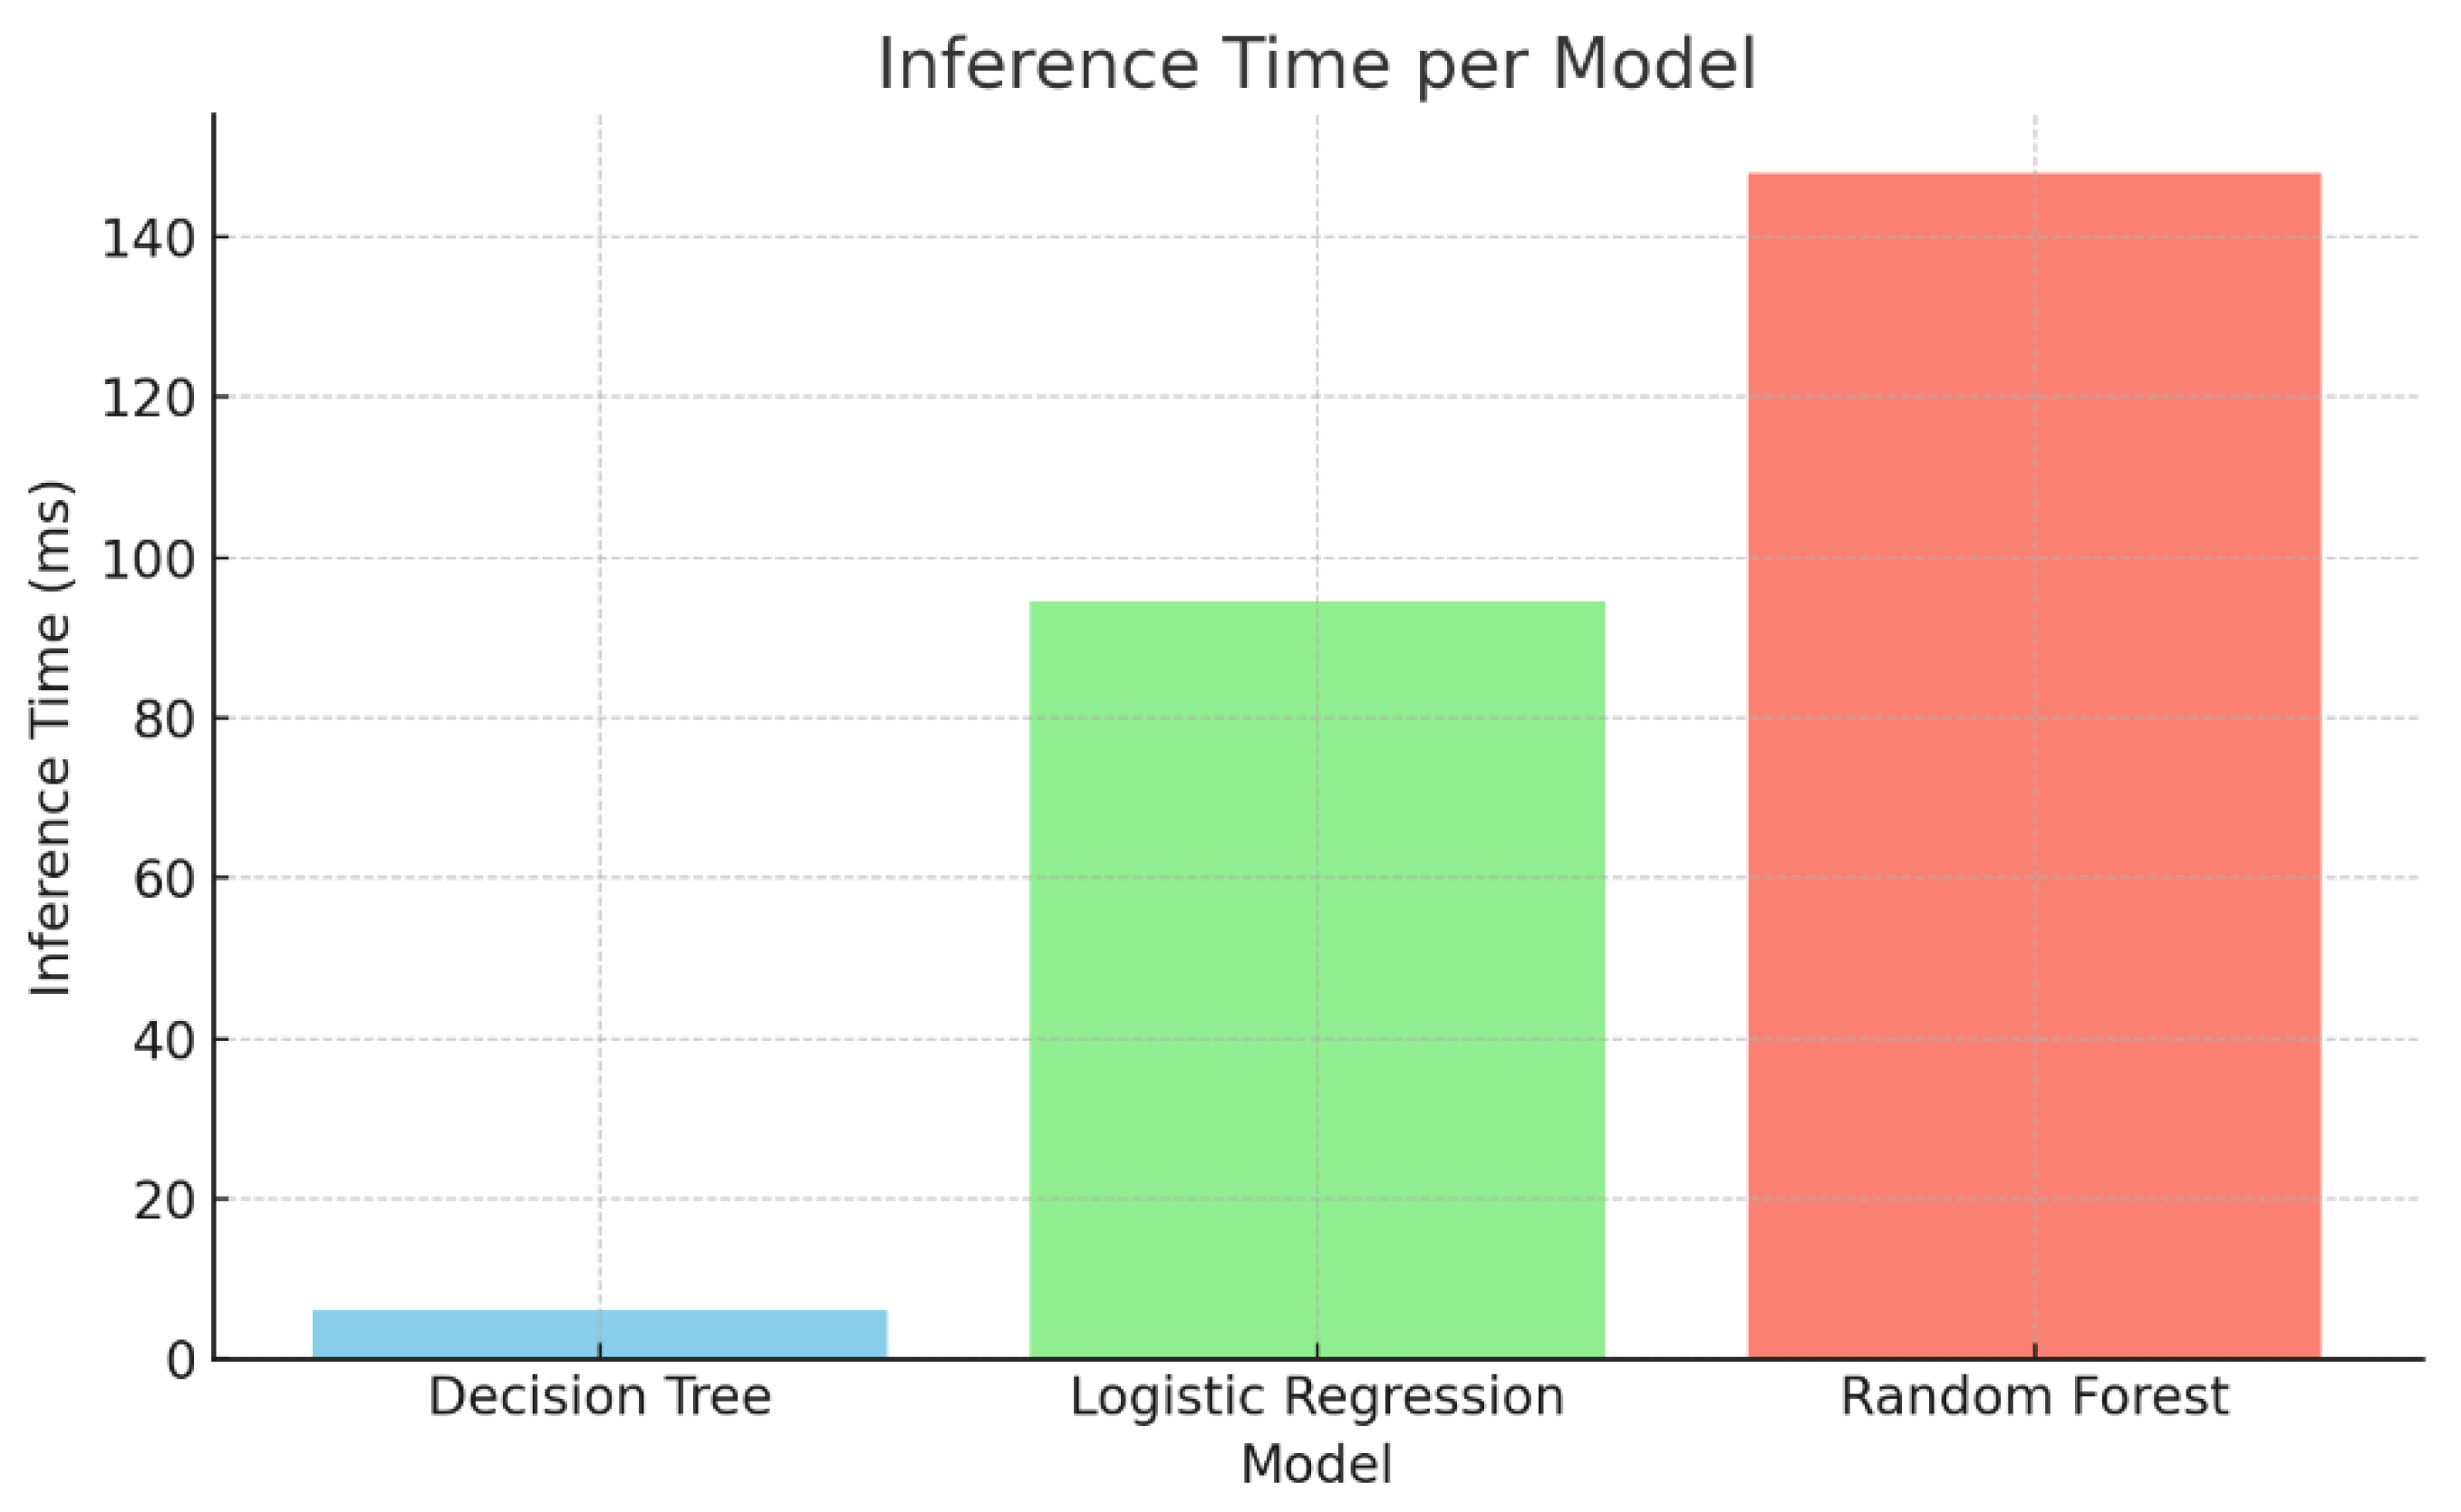
Figure 3.
PCA Visualization Plot for Zero-Day Data.
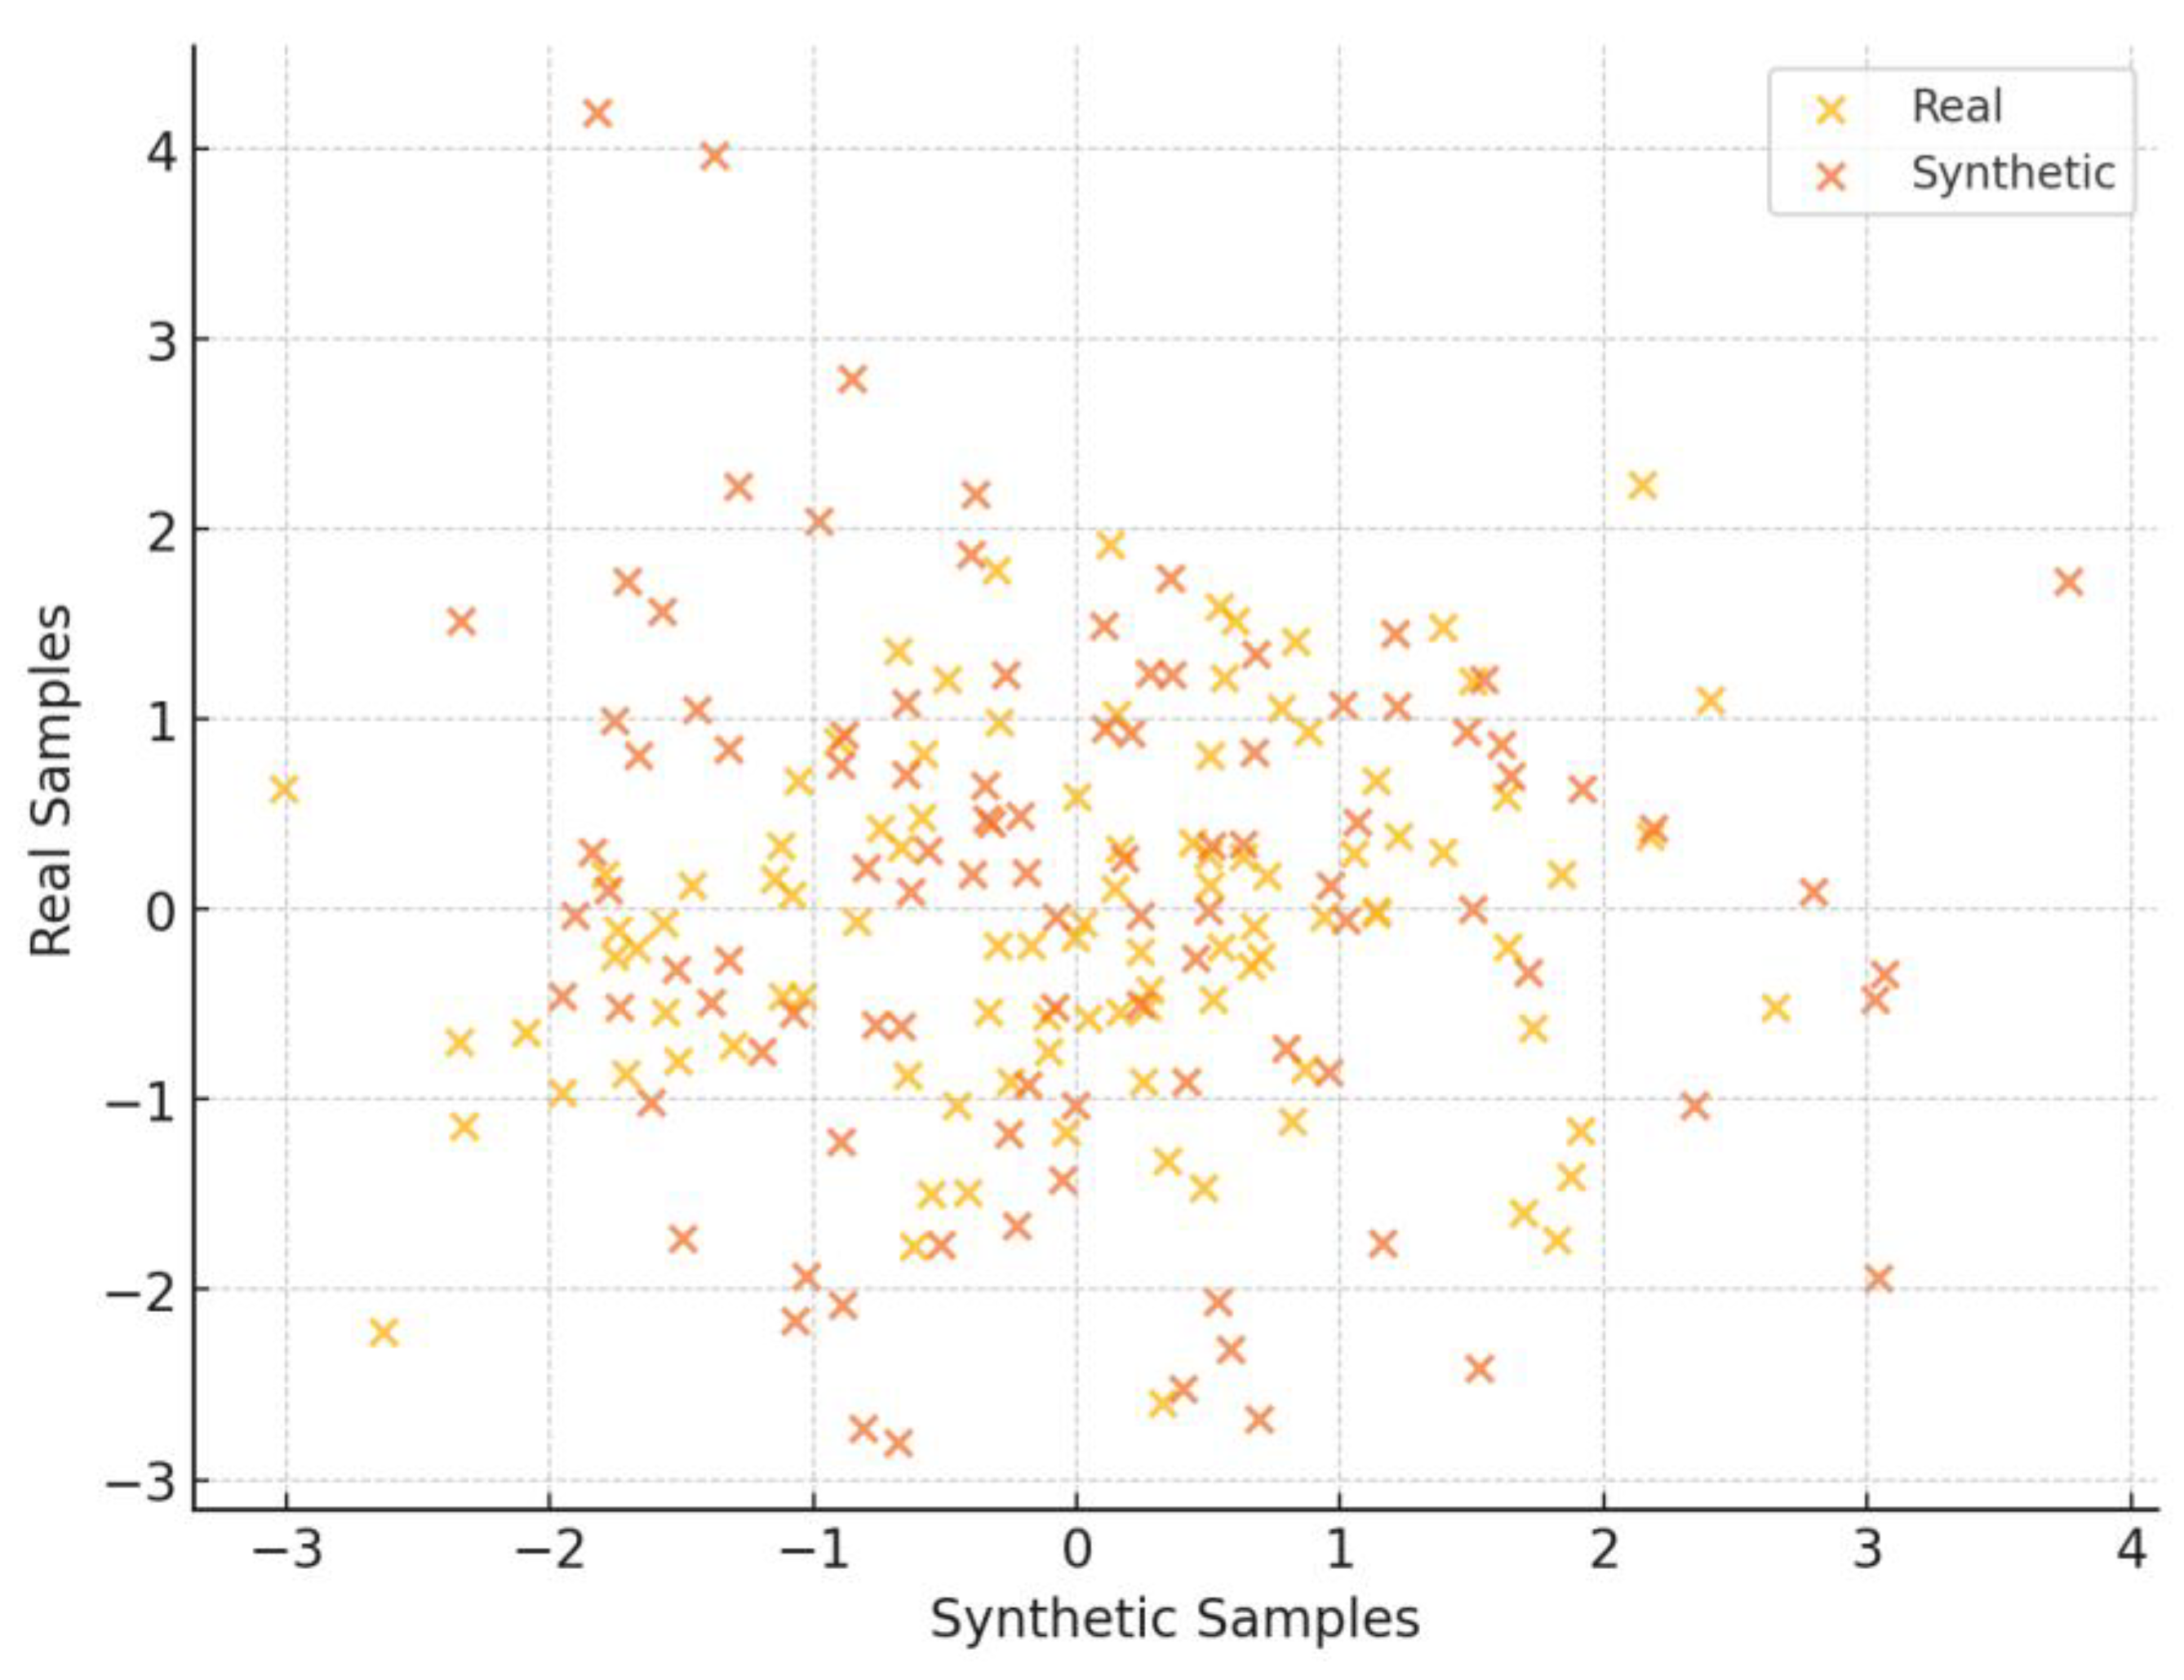
Figure 4.
Log Mean Deviation per Feature for Zero-Day Data.
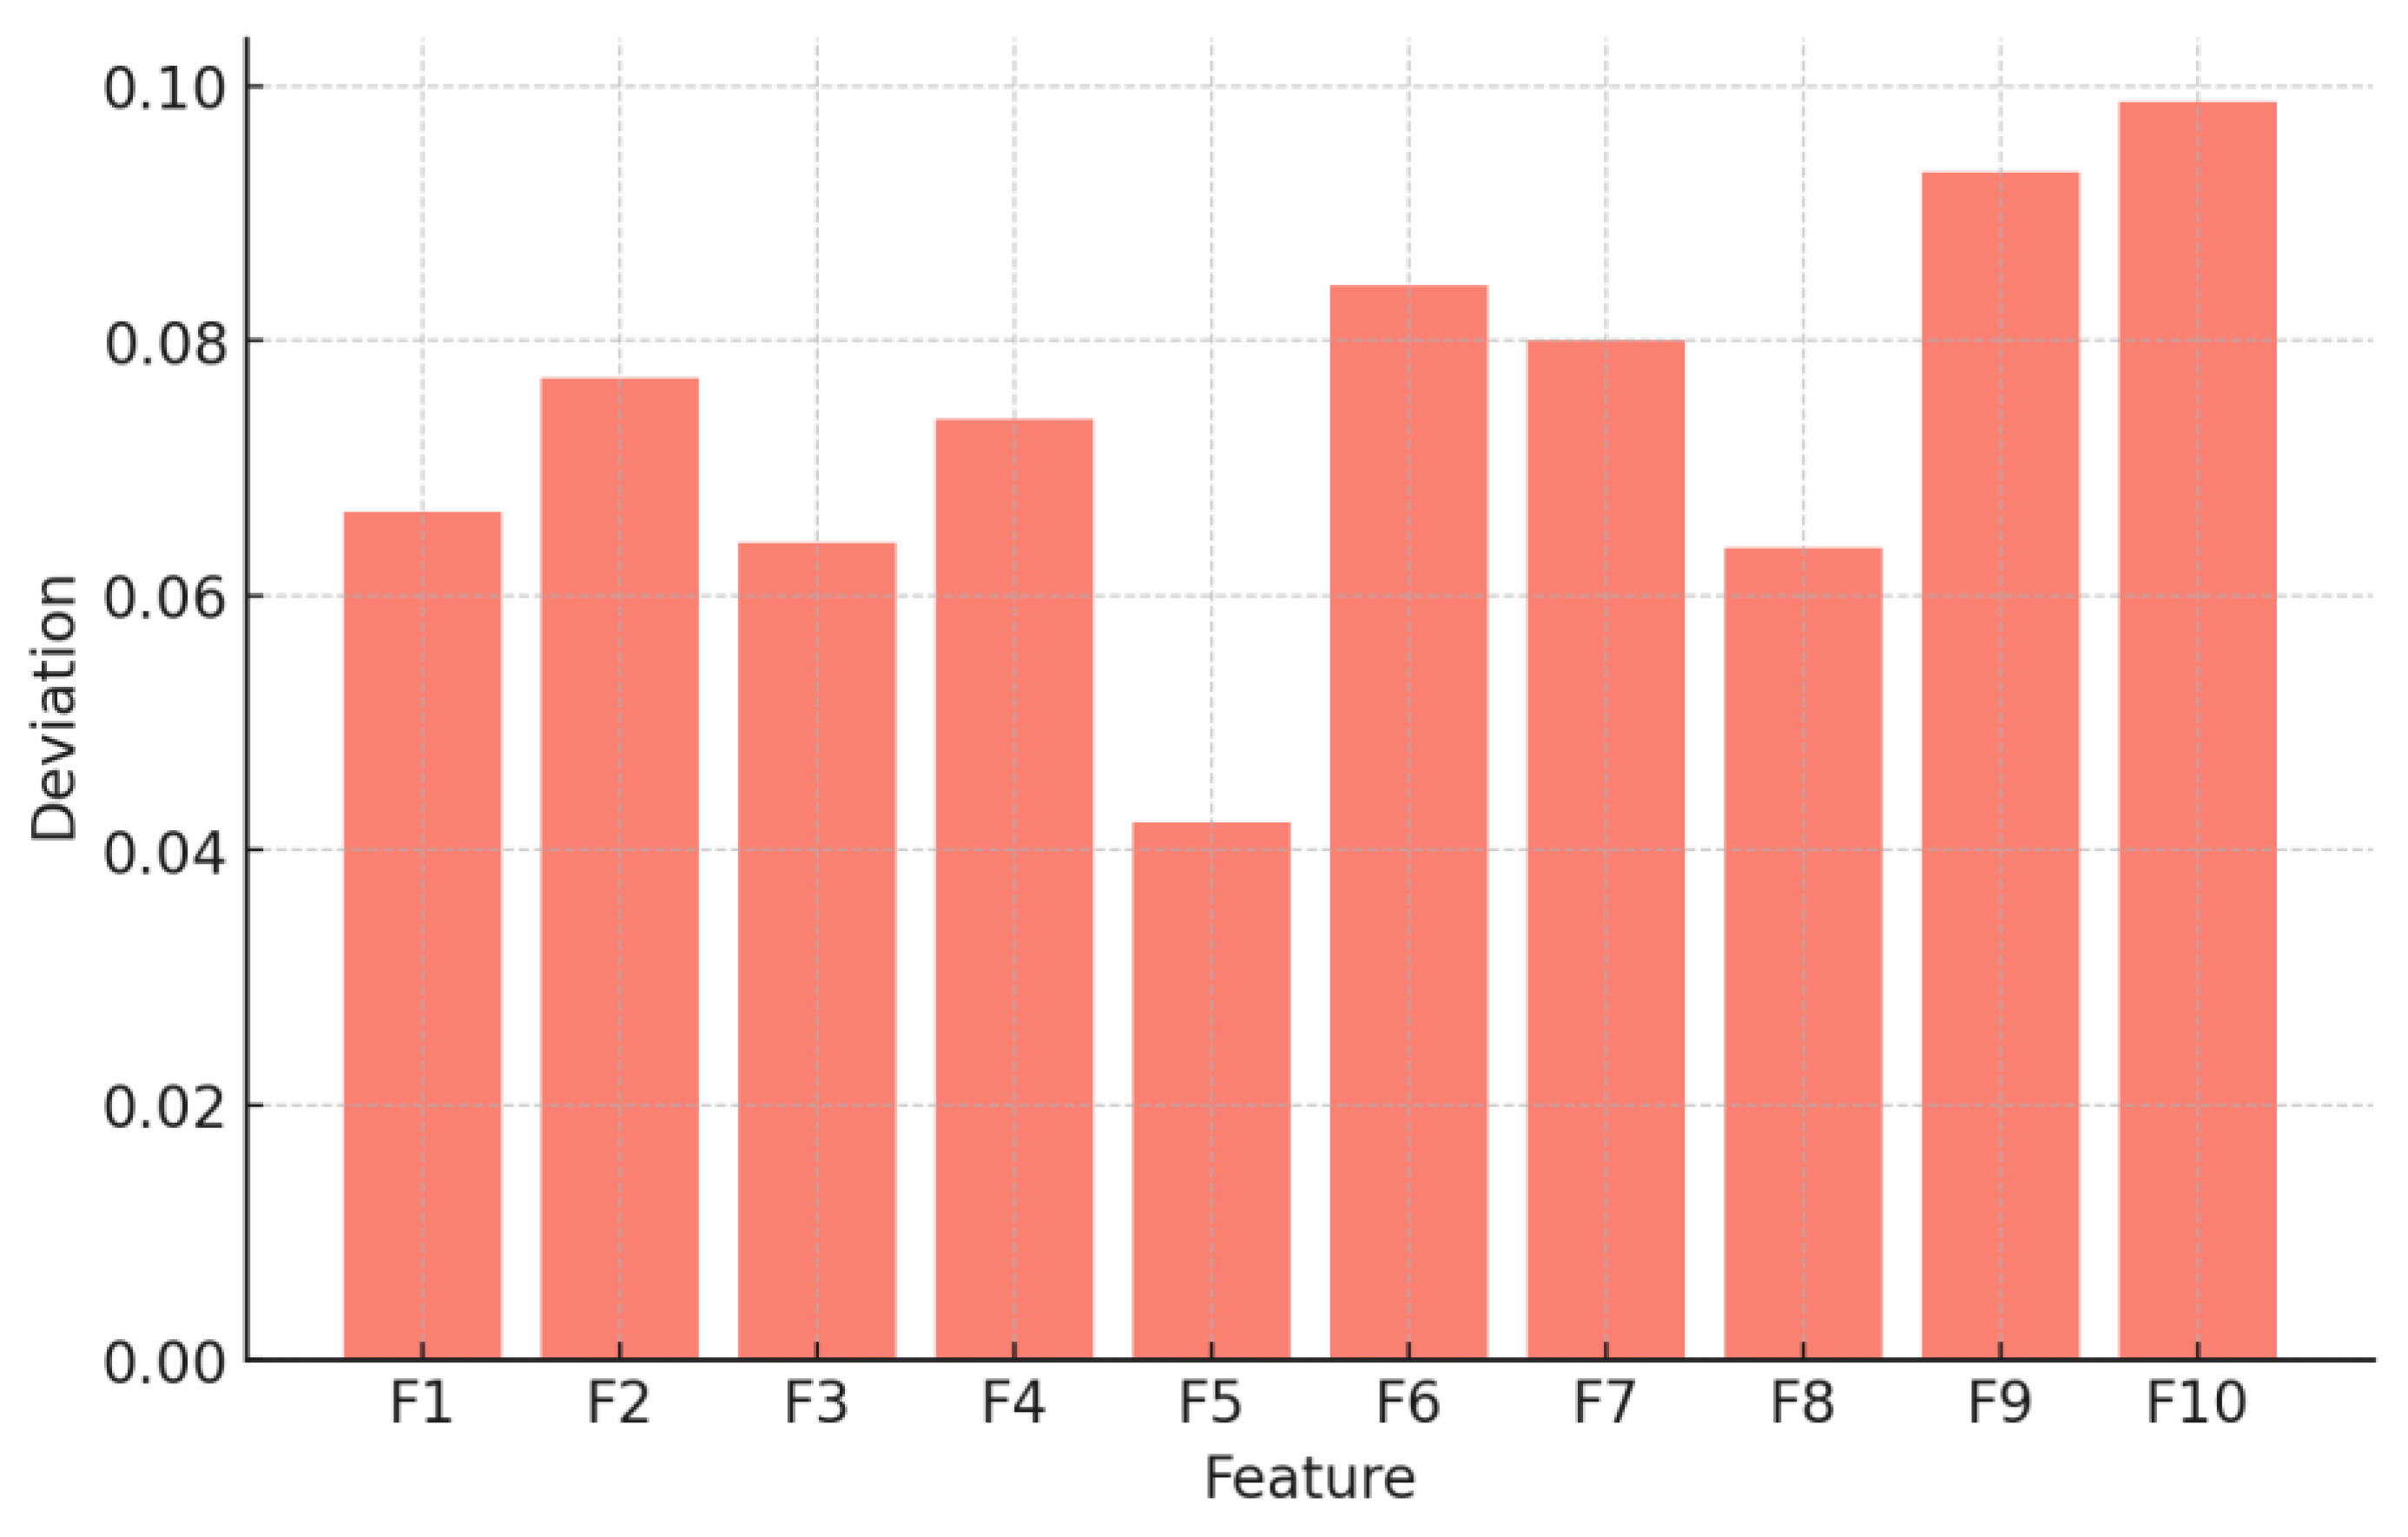
Figure 5.
PCA Visualization Plot for Botnet Data.
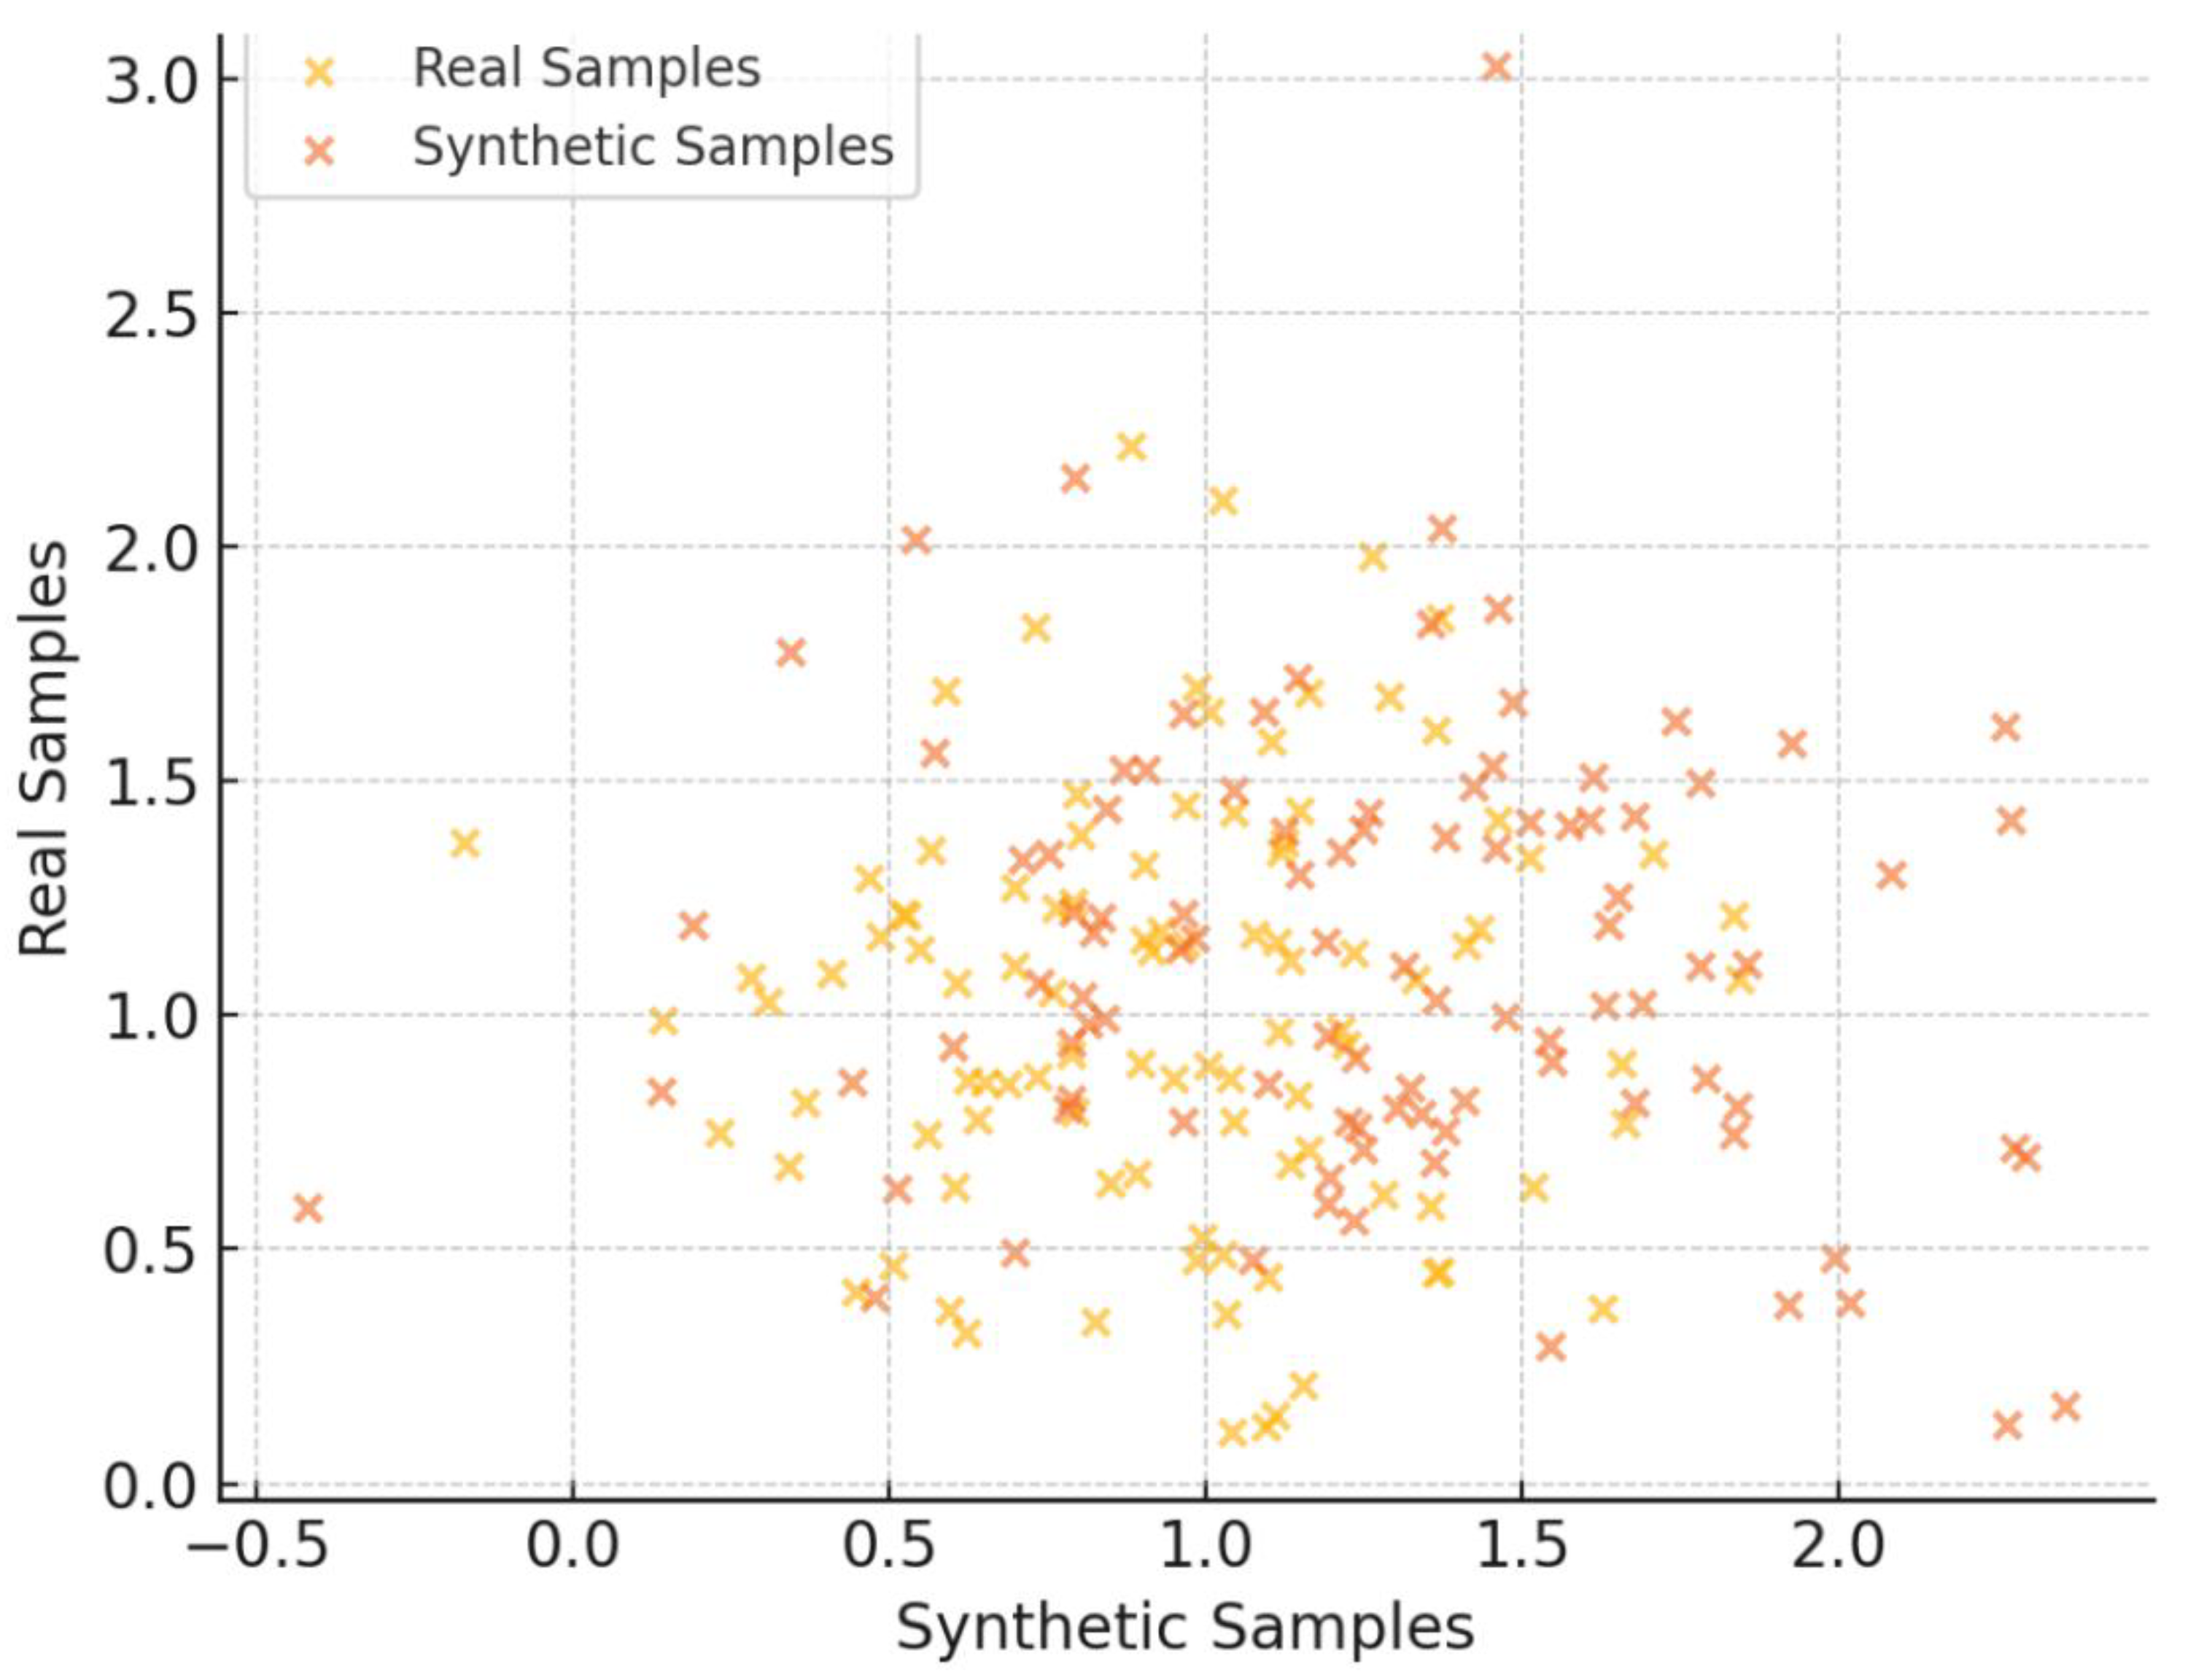
Figure 6.
Log Mean Deviation per Feature for Botnet Data.
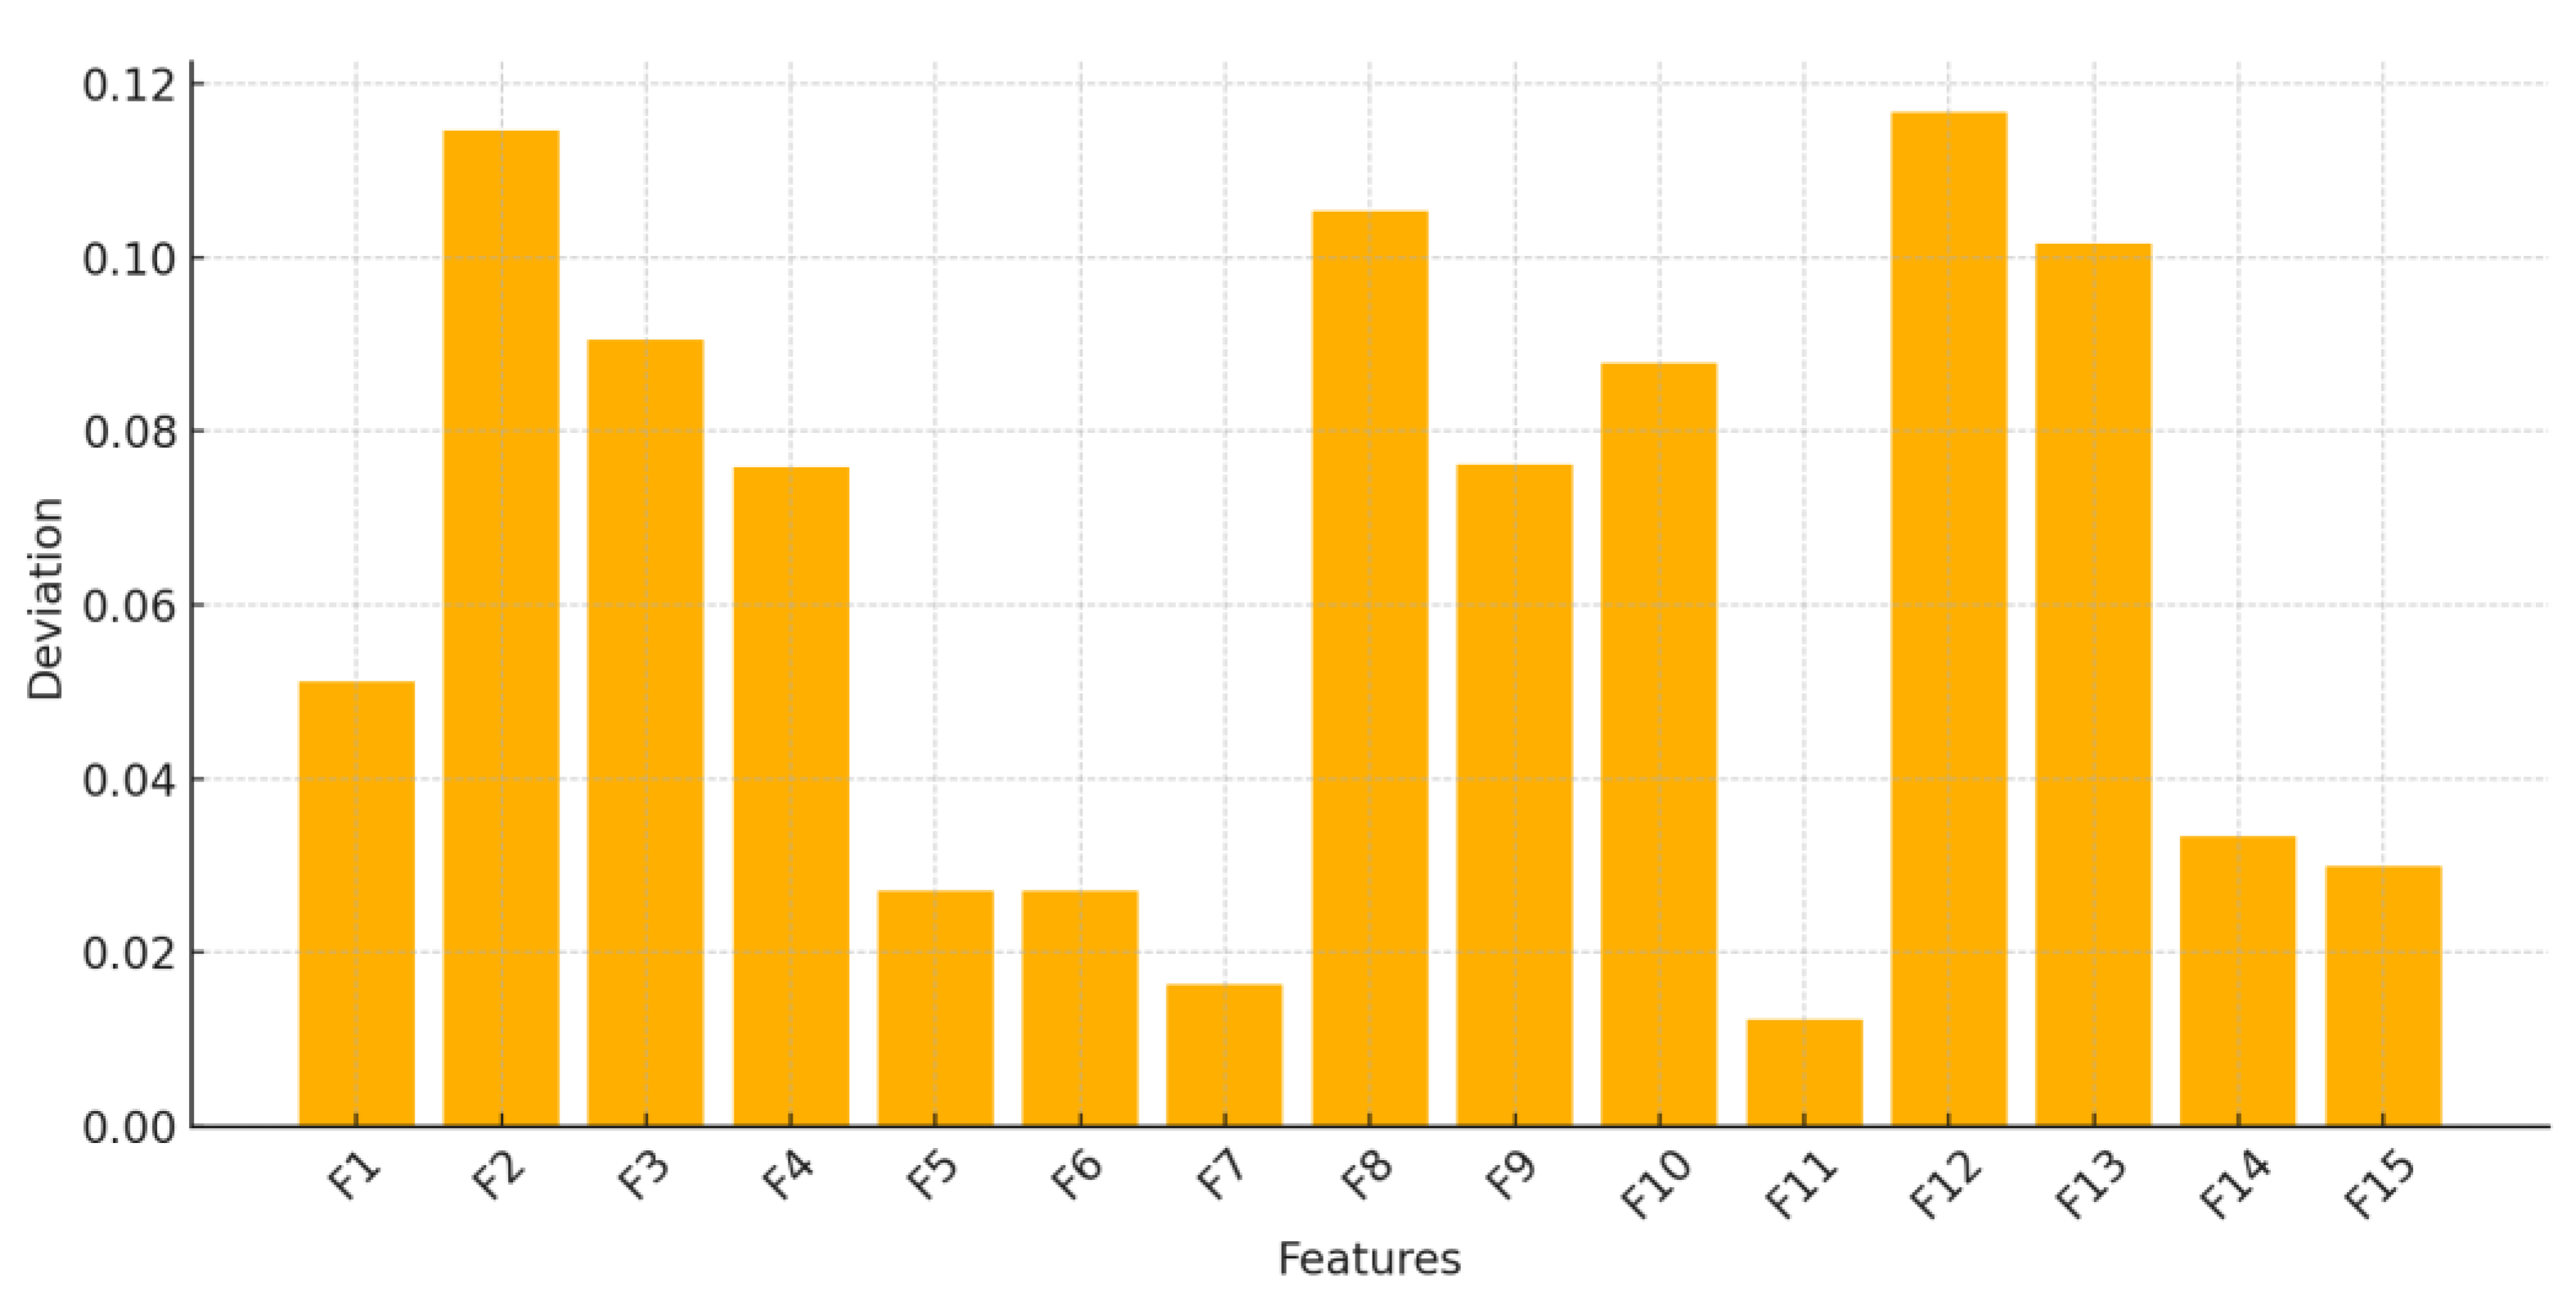
Figure 7.
PCA Visualization Plot for real and synthetic images.
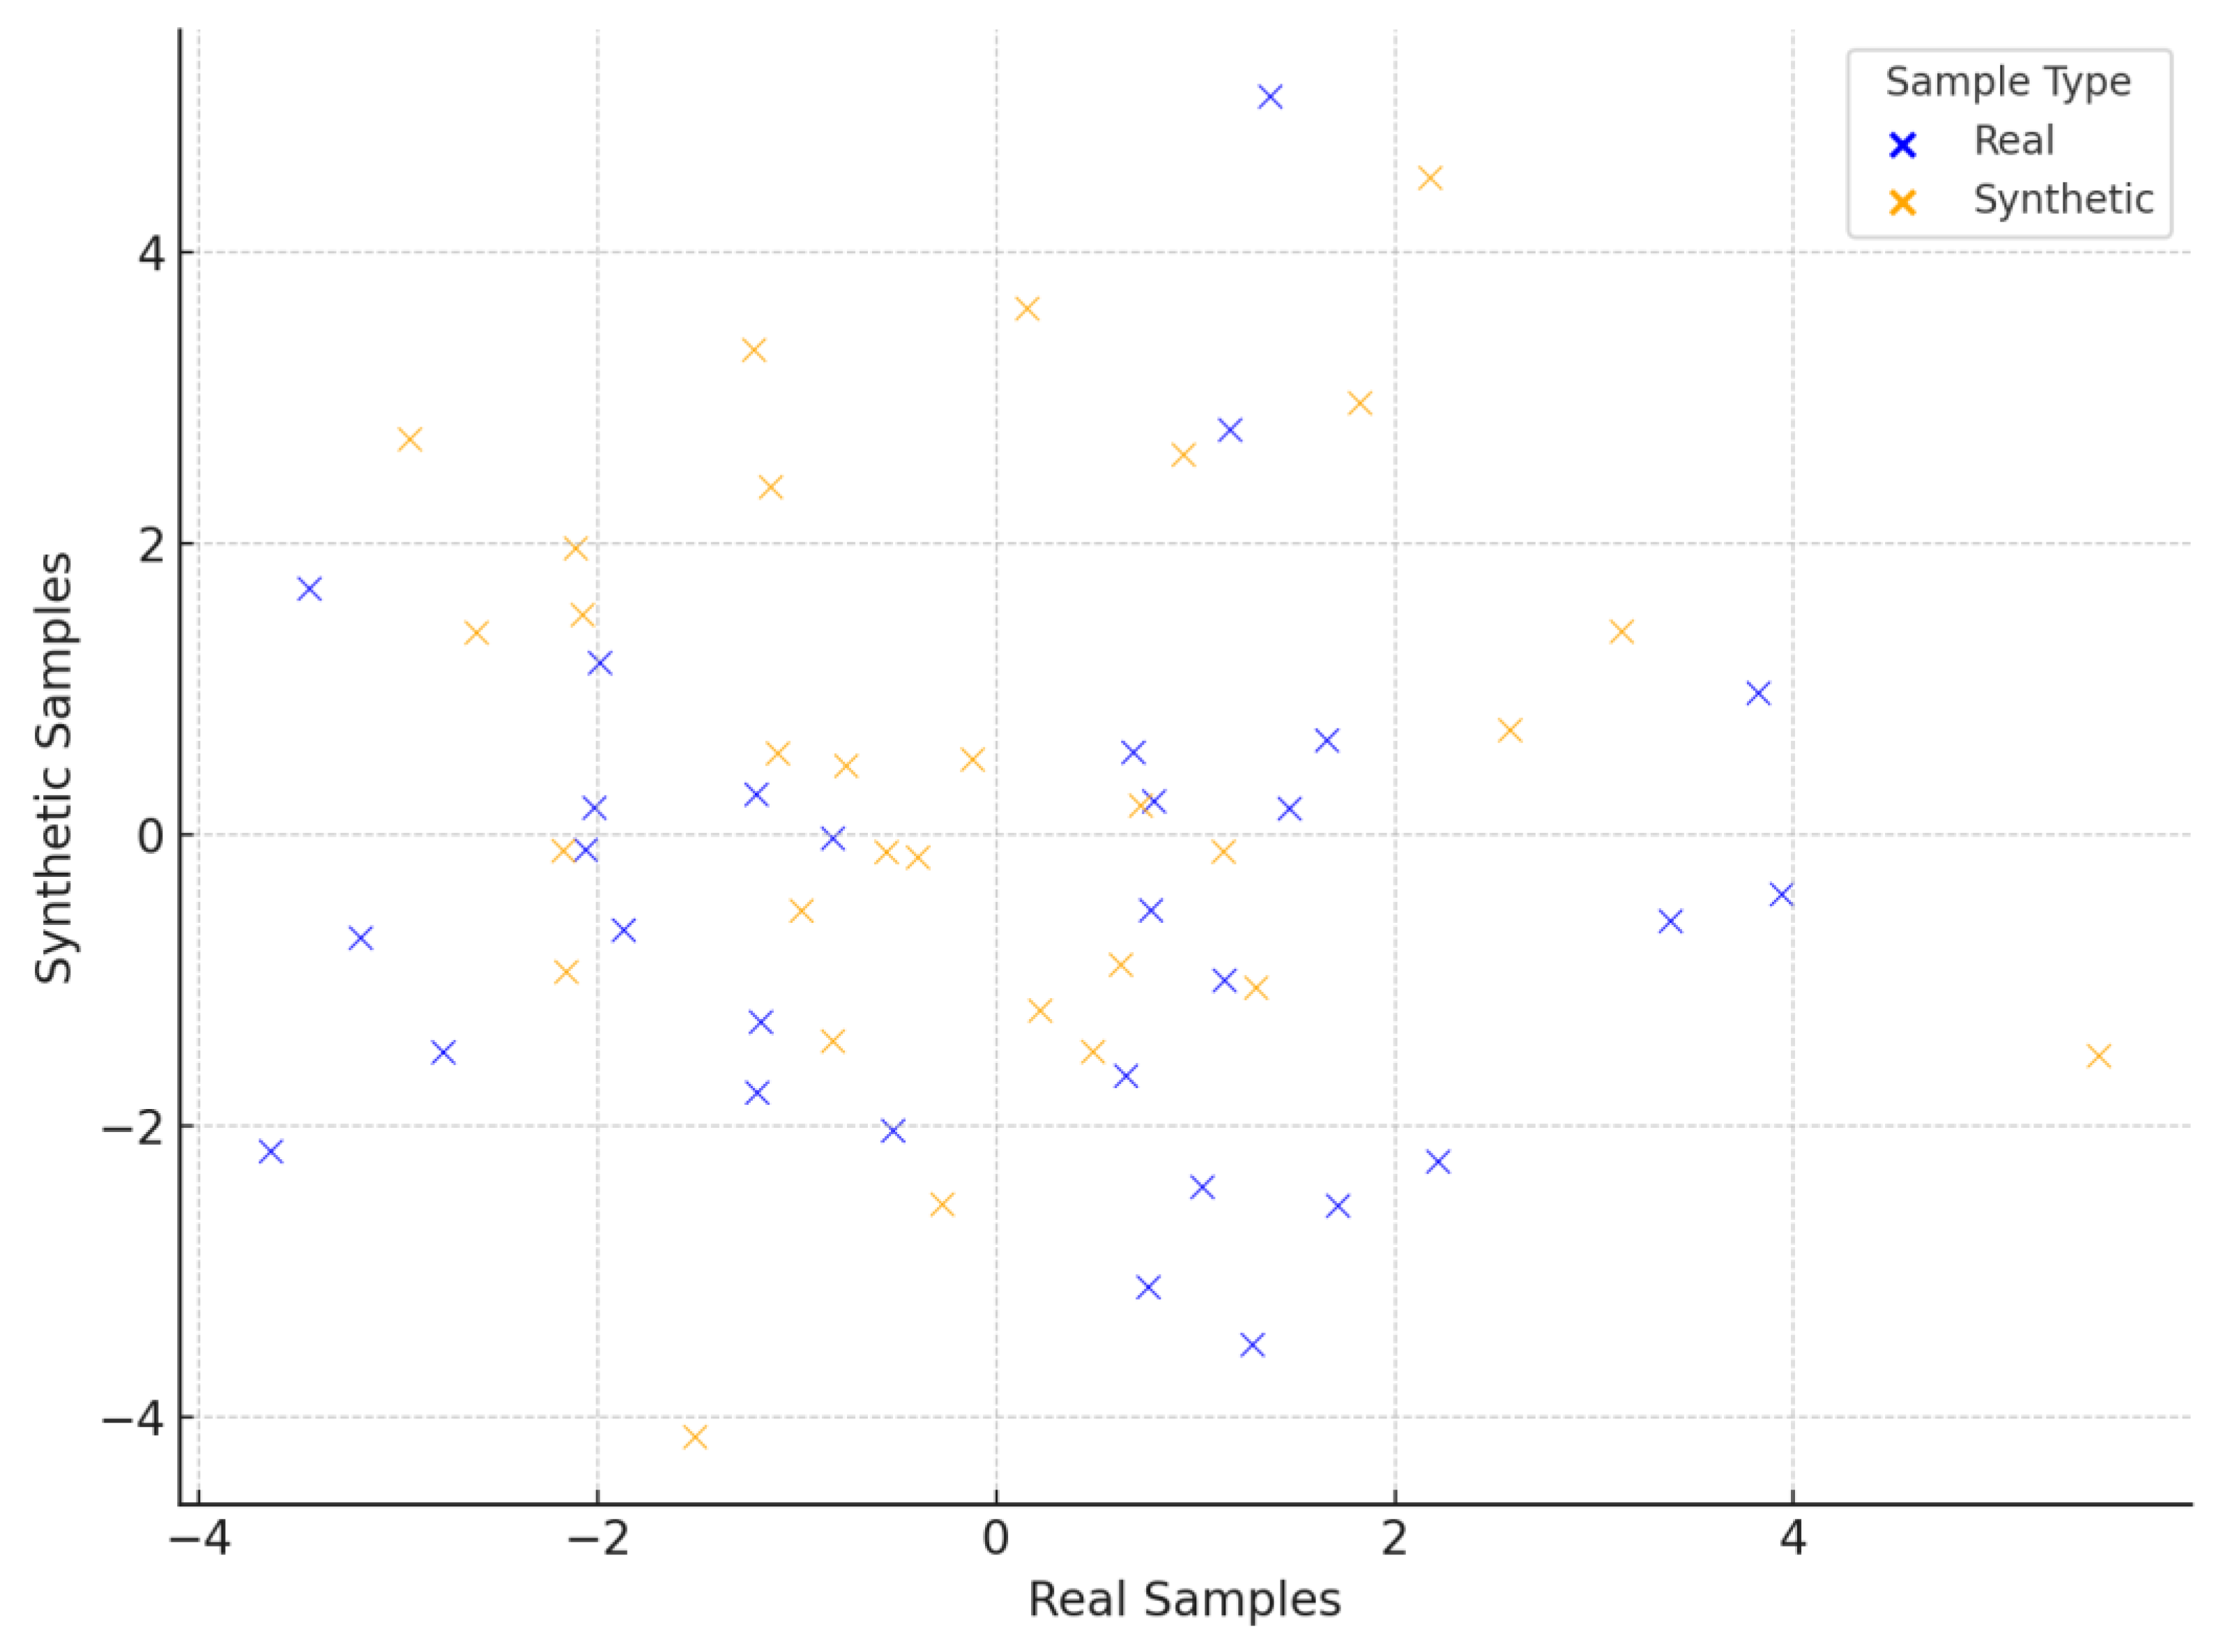
Figure 8.
Radar Chart Visualization of the Comparative Performance between the two Branches.
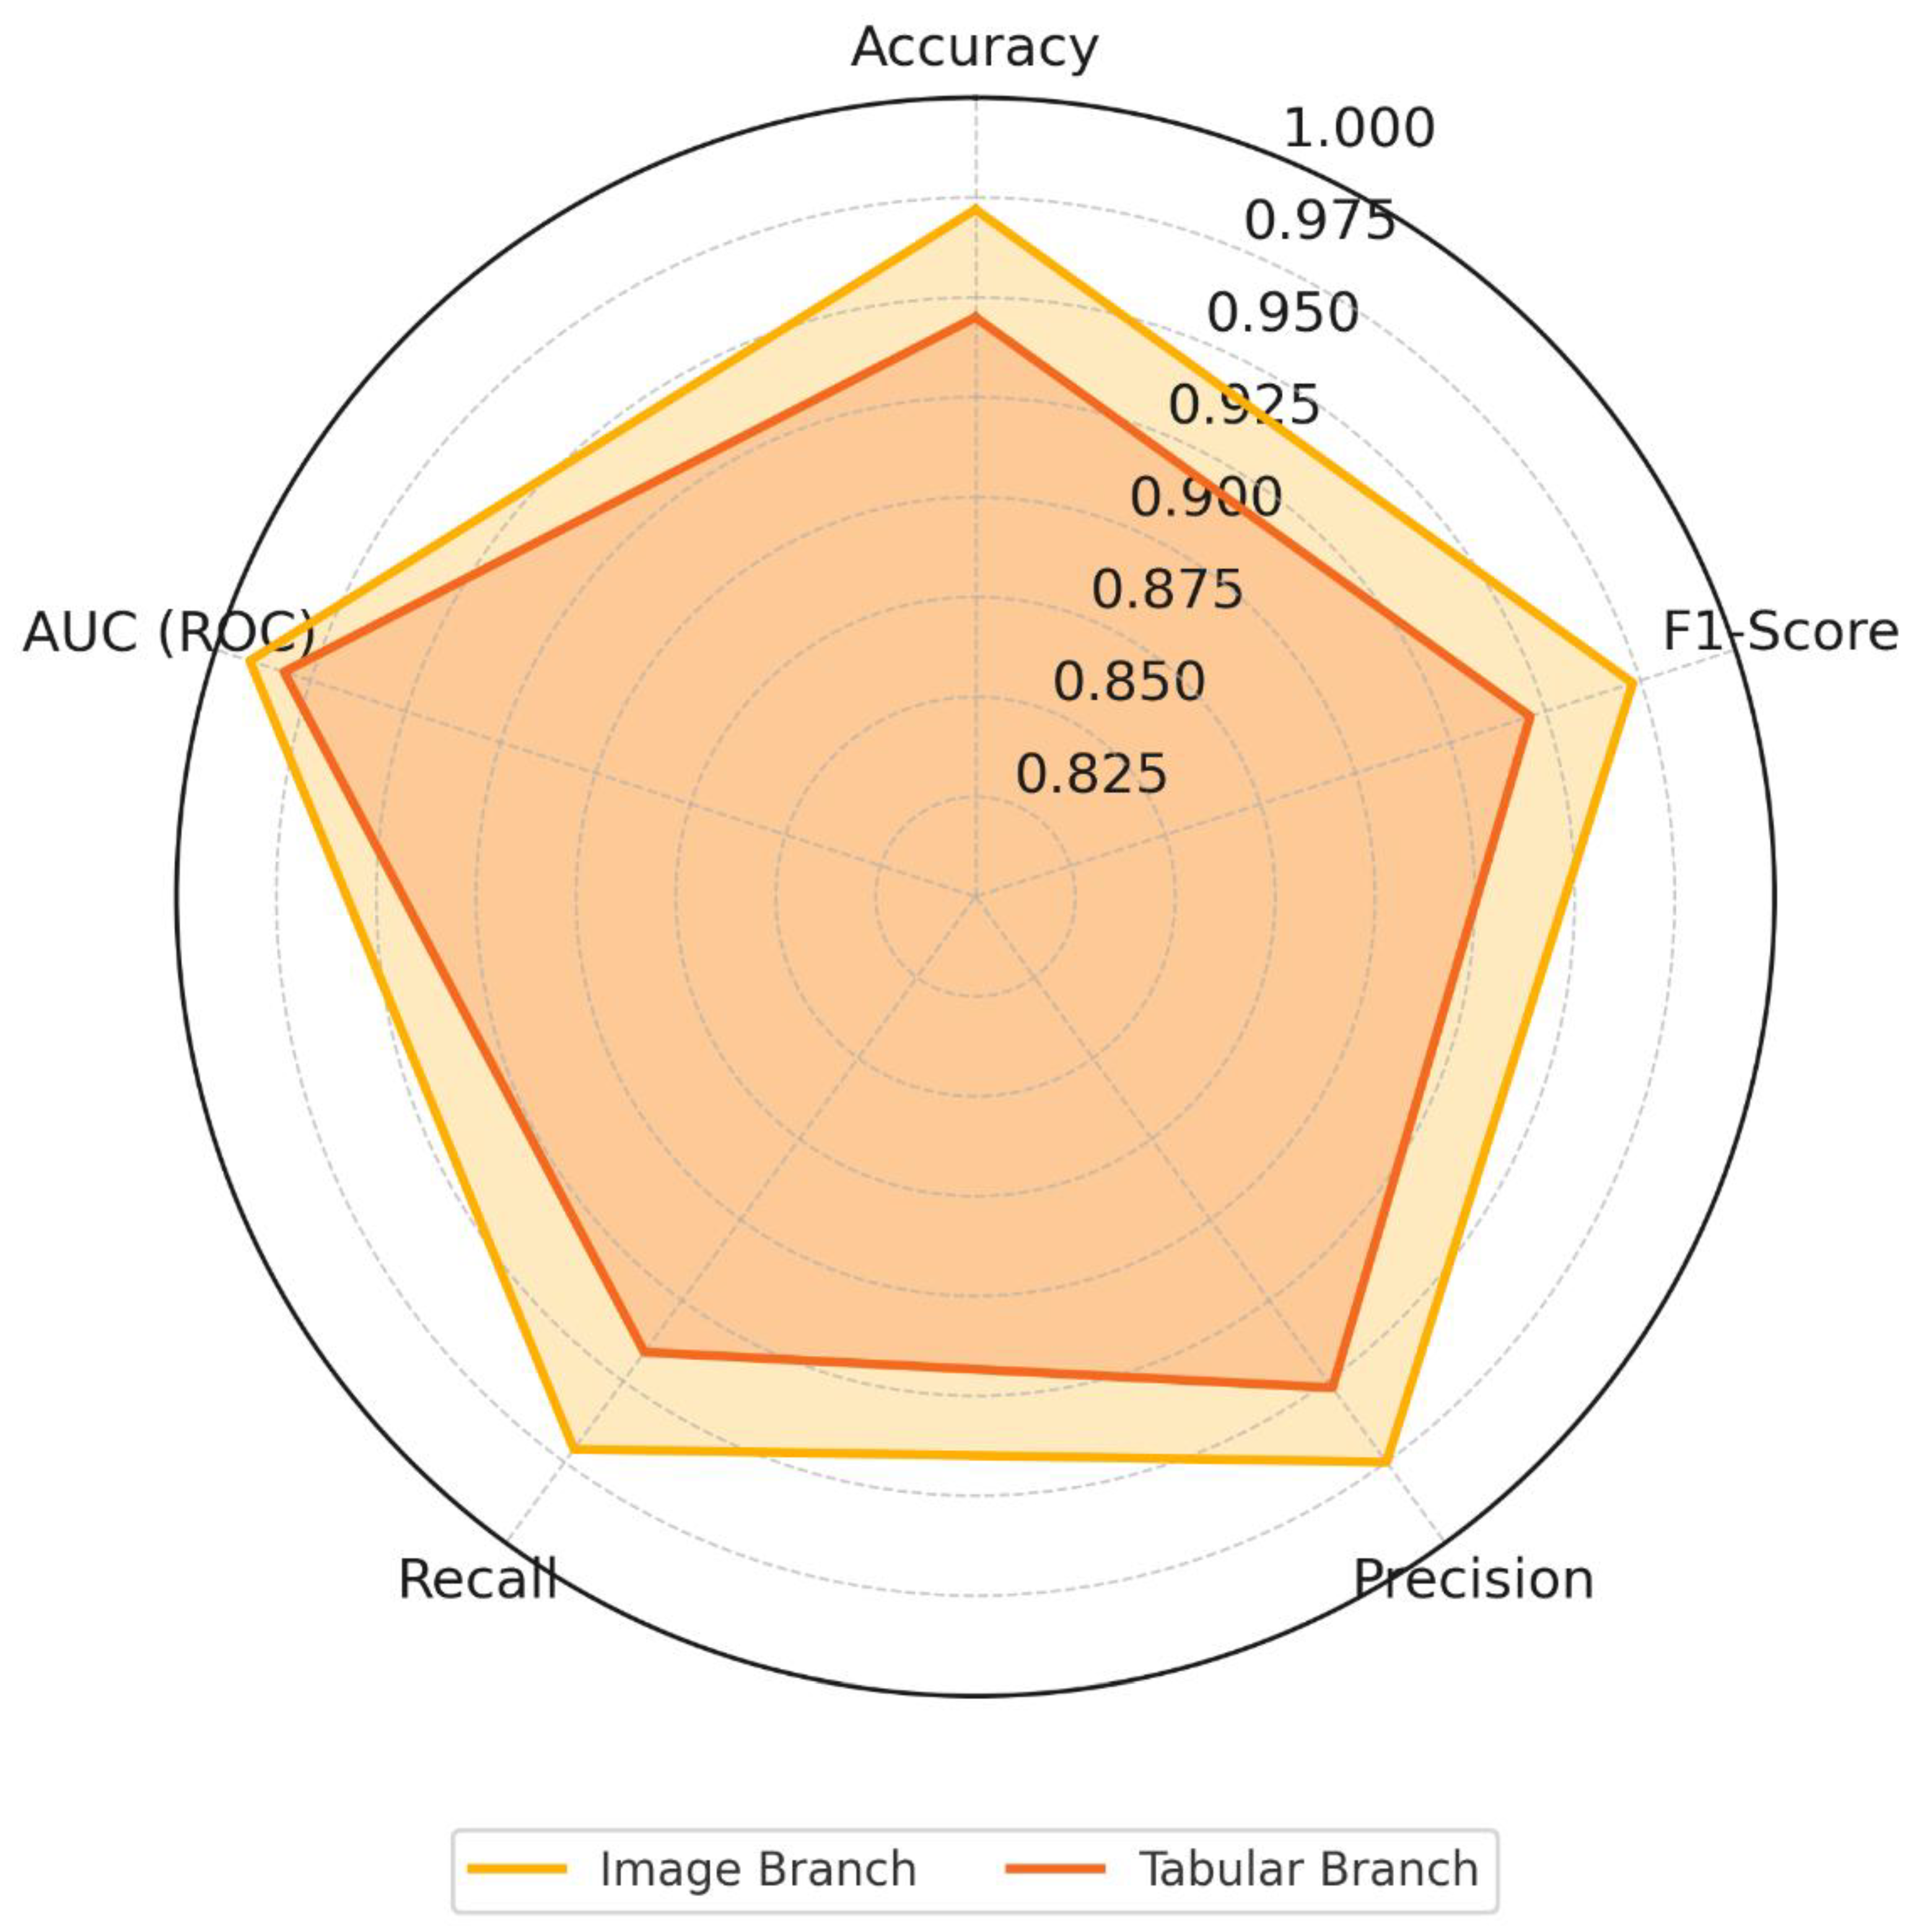
Figure 9.
Visualization of the Comparative Performance between the two Branches.
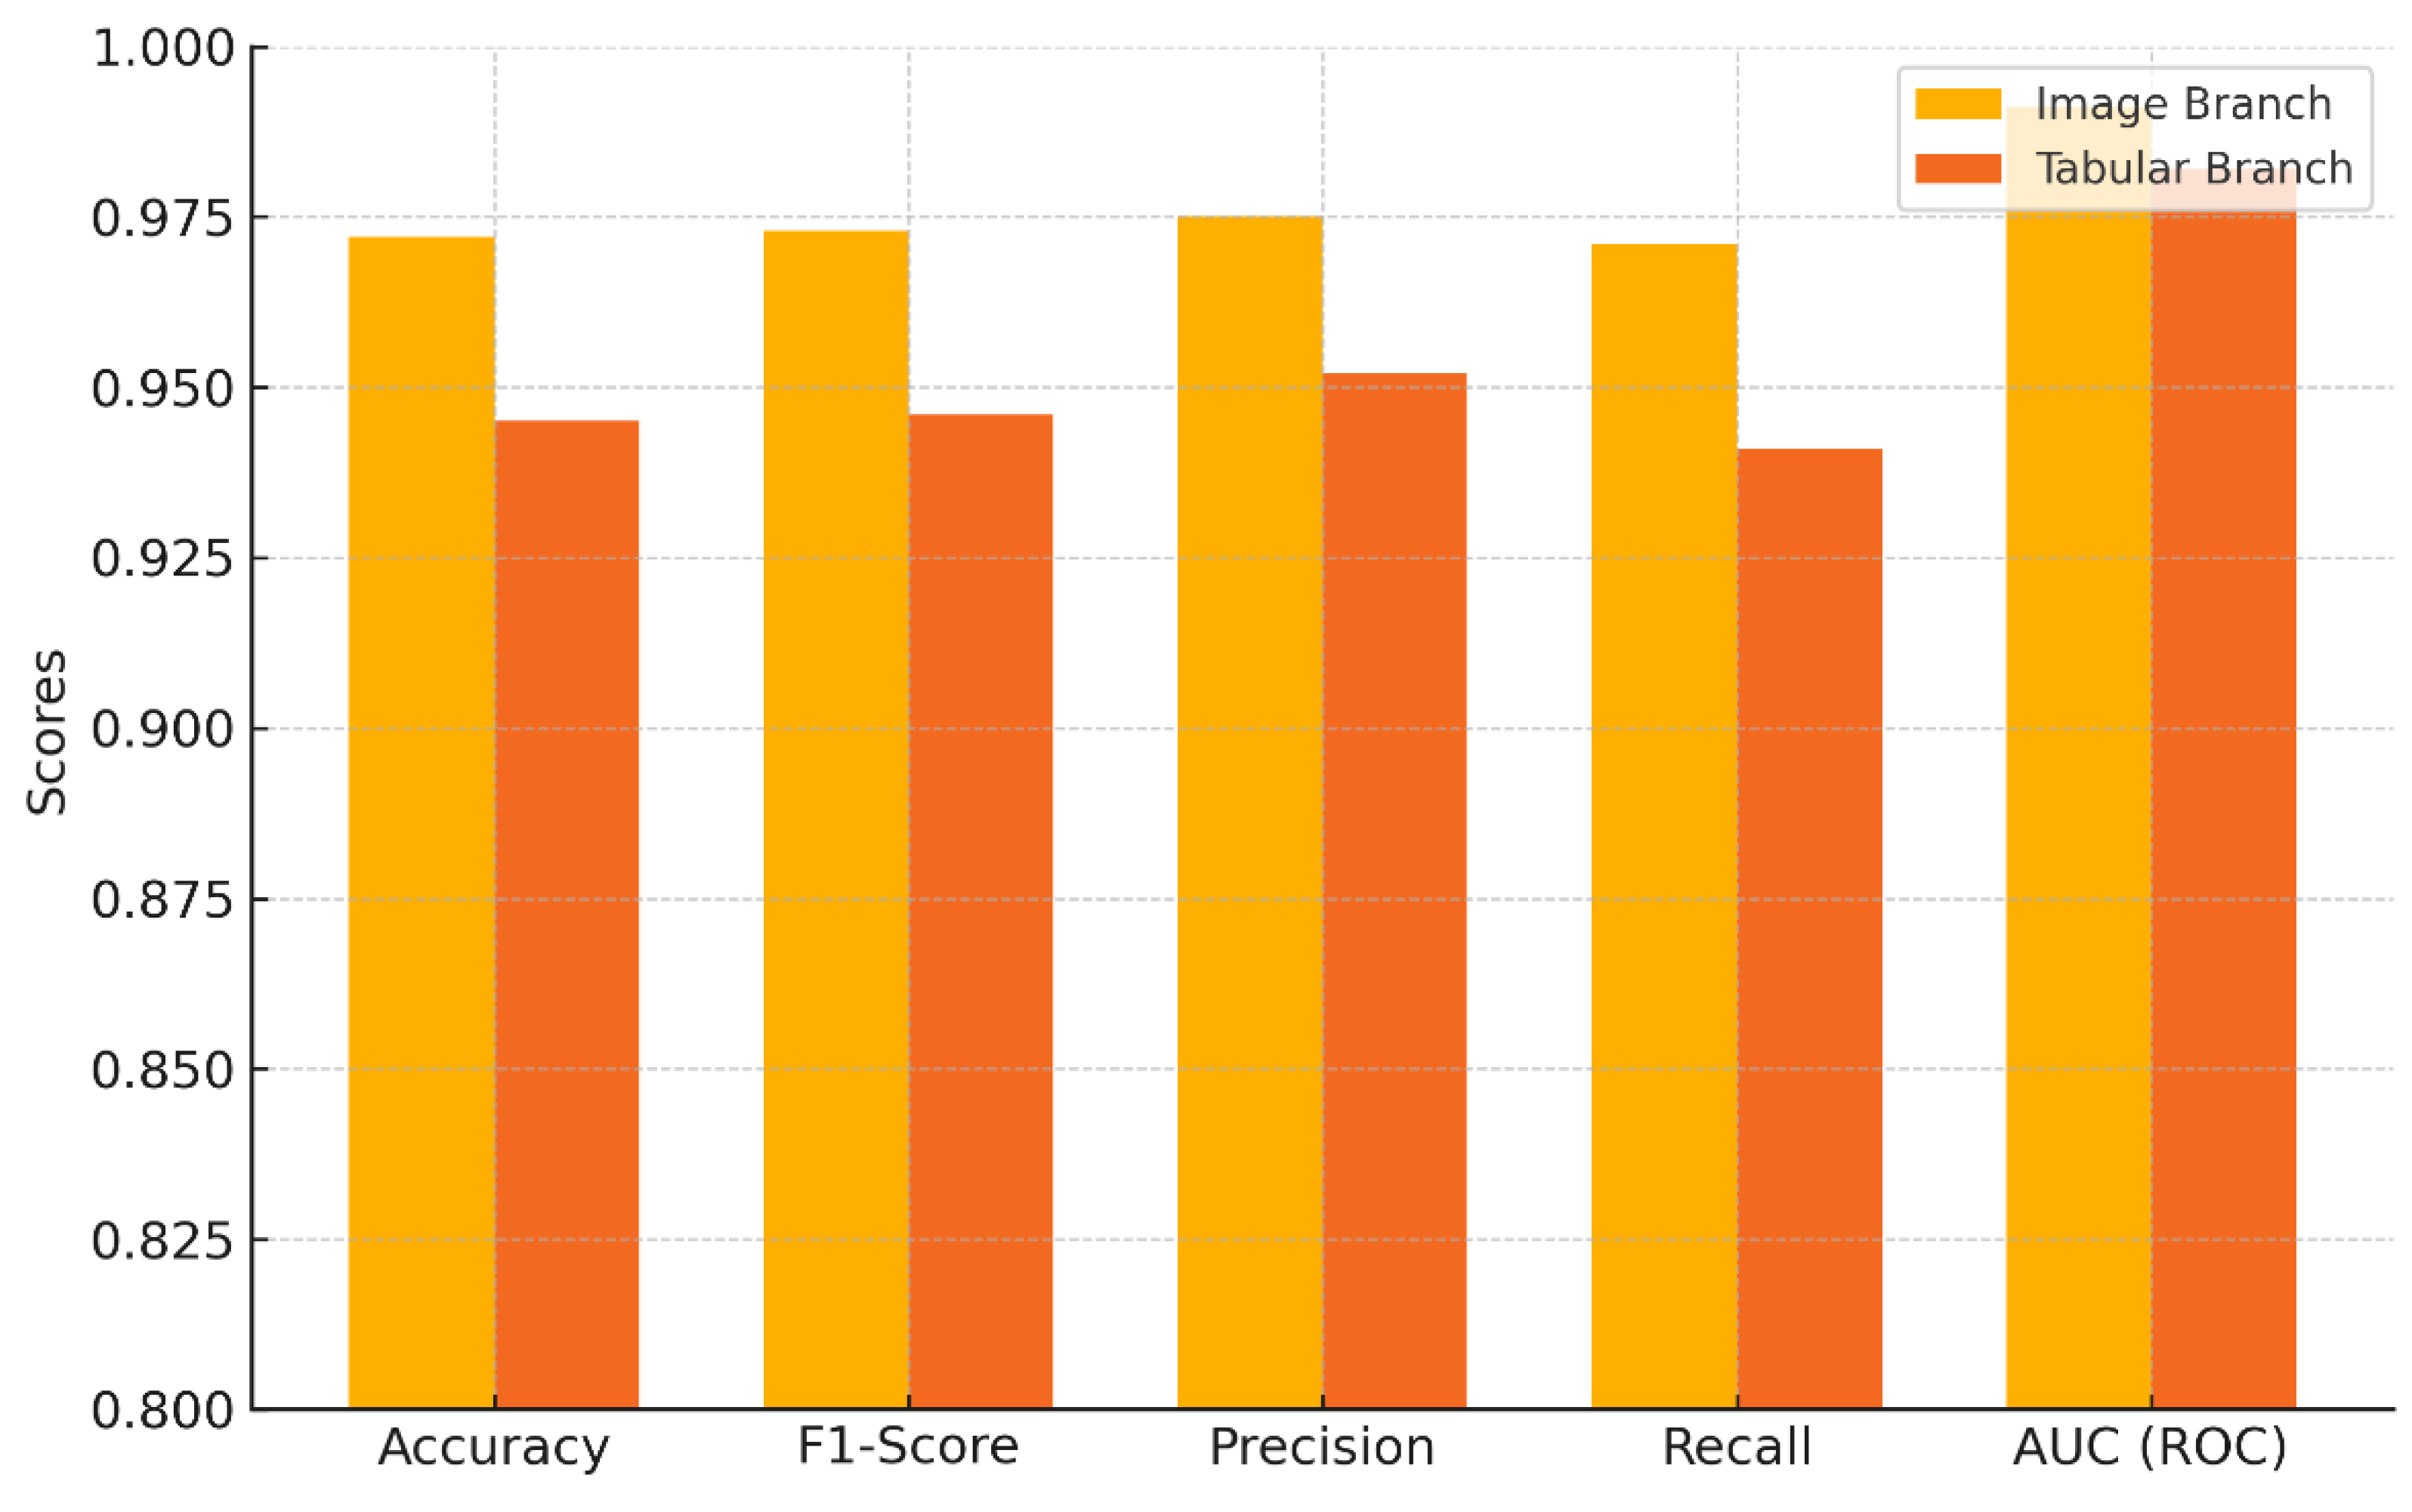
Figure 10.
Visualization of the Comparative Performance between the different Fusion Methods.
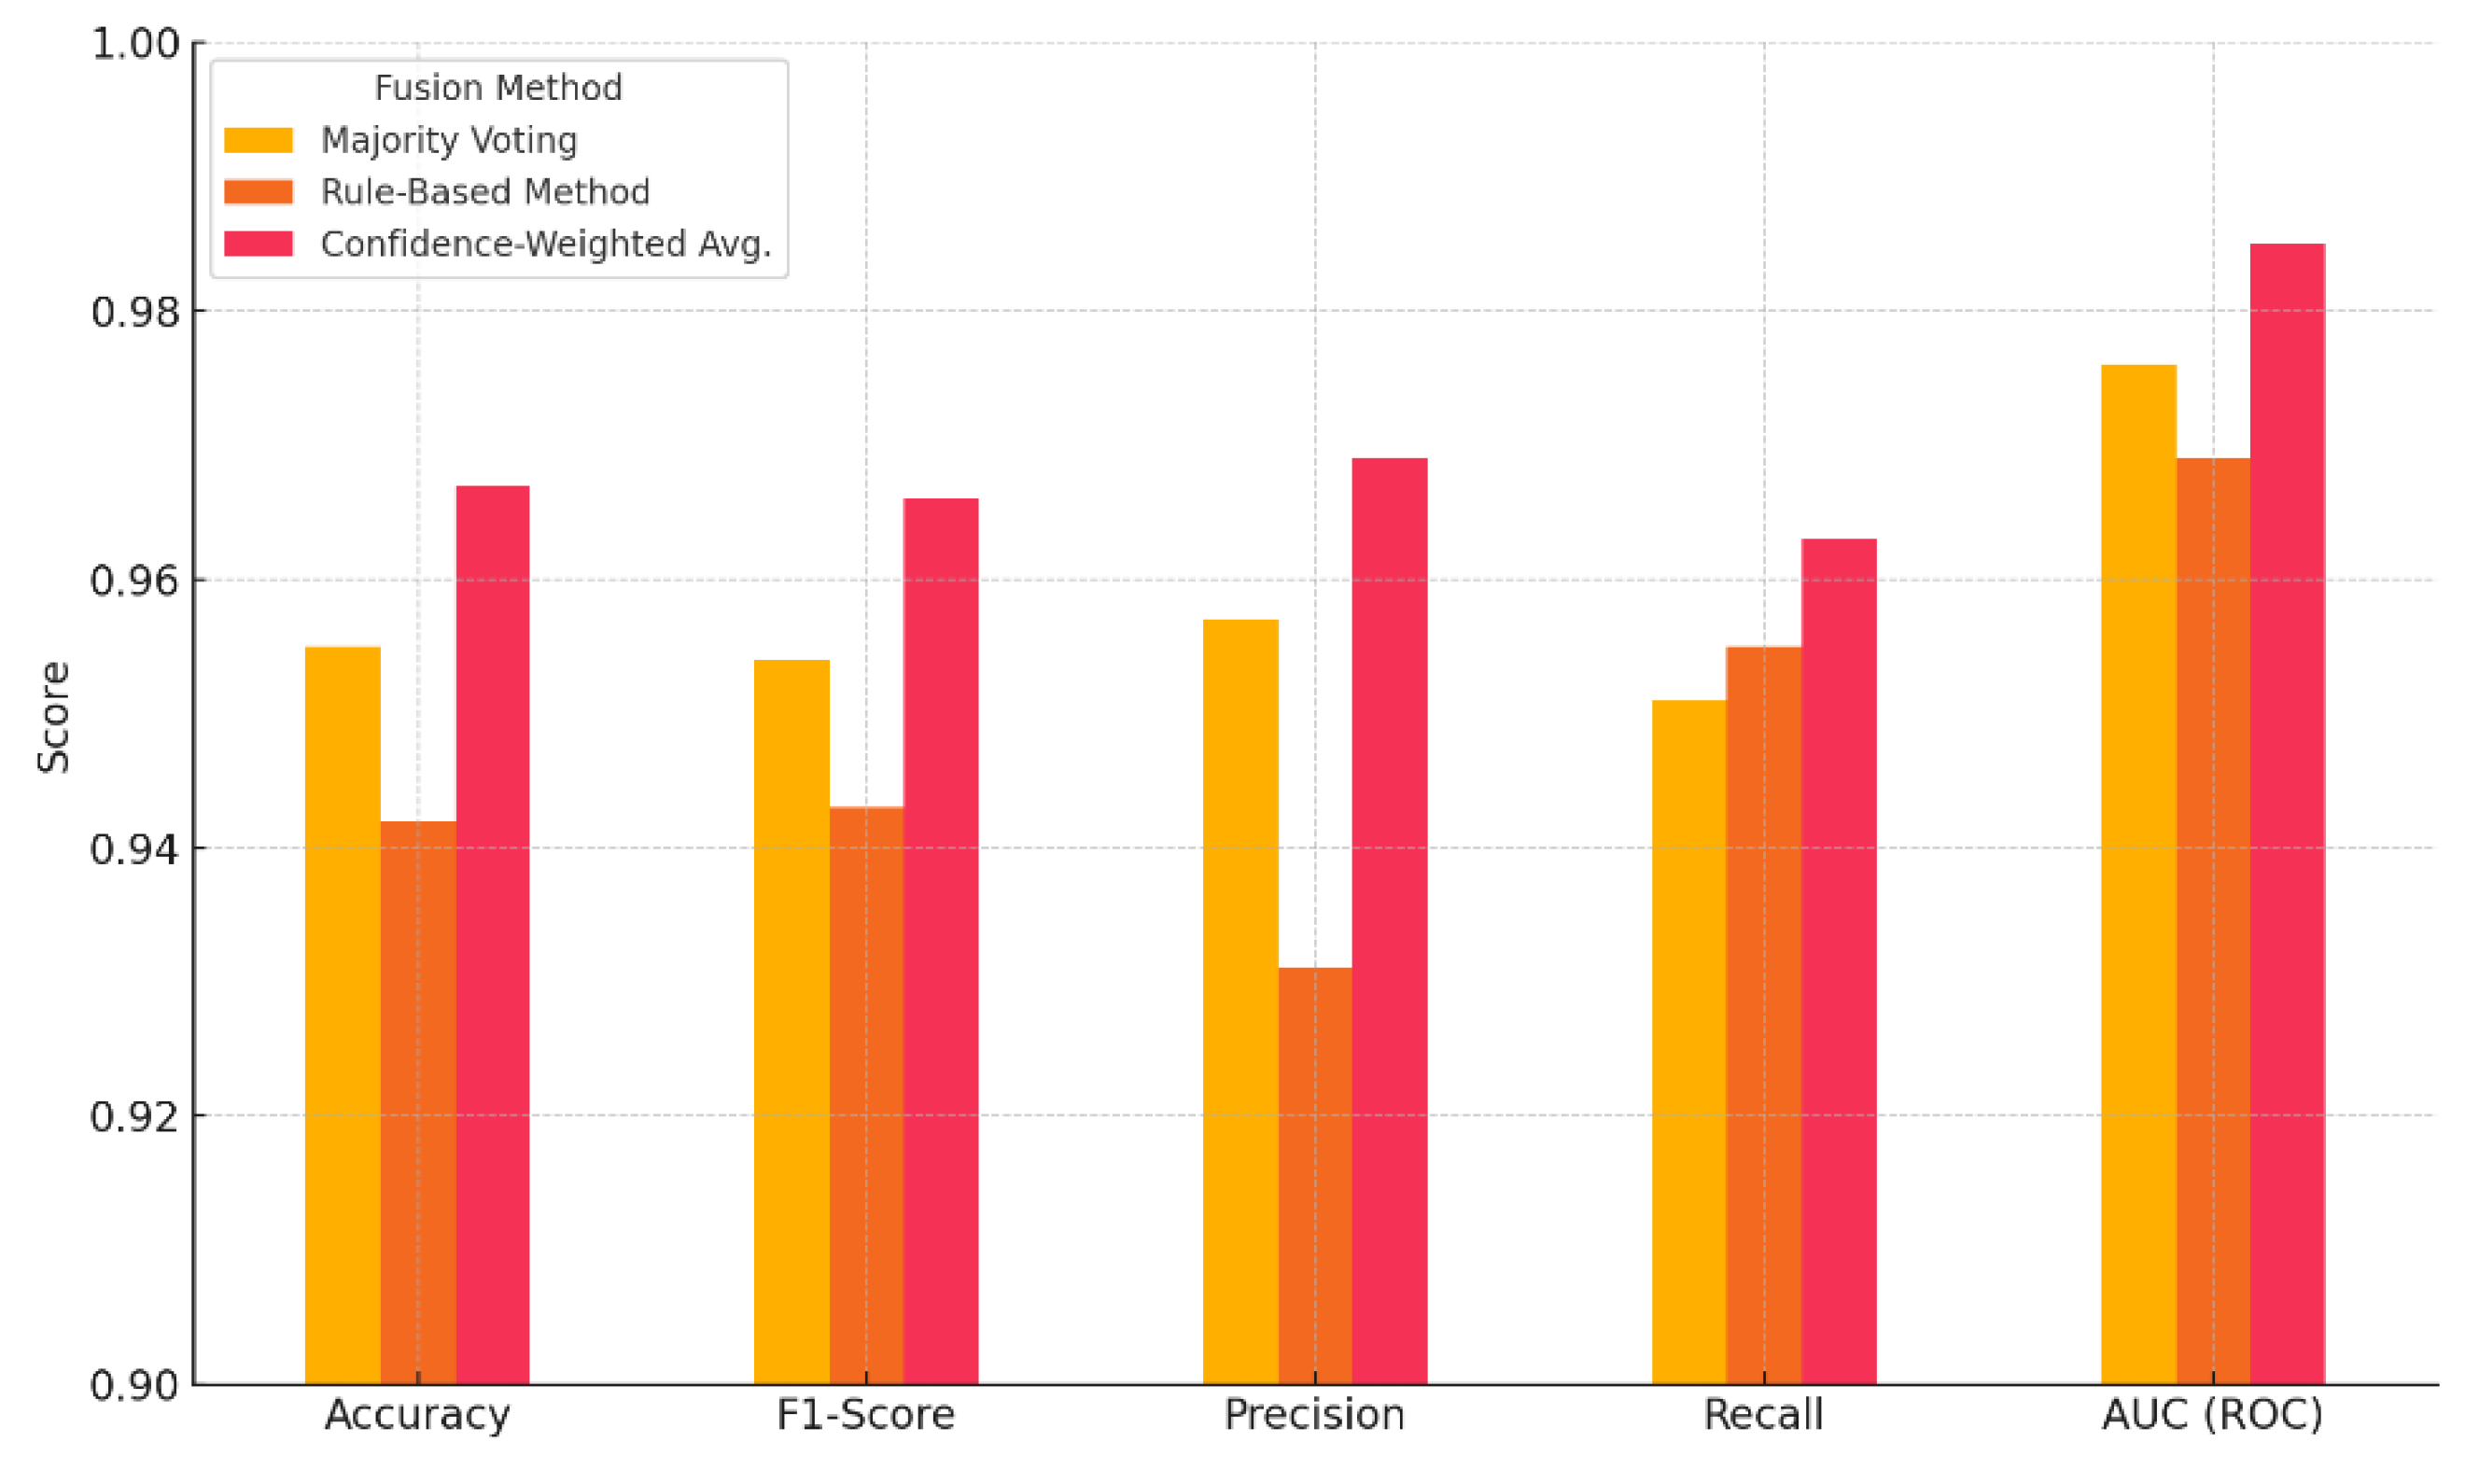

Table 1.
Characteristics of ZDGAN Generated for Zero-Day Data Samples.
| Feature | Data Type | Value Range/ Examples |
Description |
|---|---|---|---|
| Duration | Float | 0.0 – 586.5 | Duration of the network session (secs) |
| SrcBytes | Integer | 0 – 350,000 | Bytes sent from source |
| DstBytes | Integer | 0 – 250,000 | Bytes sent to destination |
| Protocol | Categorical | TCP, UDP, ICMP | Communication protocol |
| State | Categorical | S0, REJ, SF, RSTO | Connection state indicator |
| TotPkts | Integer | 1 – 5,000 | Total number of packets transferred |
| TotBytes | Integer | 10 – 600,000 | Total session byte count |
| Label | Binary | 0 (malicious), 1 (benign) | Ground truth class |
Table 2.
Characteristics of ZDGAN Generated for Botnets Data Sample.
| Feature | Data Type | Value Range/ Examples |
Description |
|---|---|---|---|
| Flow Duration | Float | 0.0 – 1,200 sec | Total duration of the network flow |
| Src Packets | Integer | 1 – 4,000 | Packets sent from the source IP |
| Dst Packets | Integer | 1 – 3,500 | Packets received by the destination IP |
| Bytes Sent | Integer | 0 – 2,000,000 | Volume of outgoing traffic |
| Bytes Received | Integer | 0 – 1,500,000 | Volume of incoming traffic |
| Protocol | Categorical | TCP, UDP, ICMP | Protocol type used in the session |
| Botnet Family | Categorical | Neris, Rbot, Virut | Botnet label from CTU-13 annotations |
| Label | Binary | 0 = benign, 1 = botnet | Ground truth label |
Table 3.
Comparison of ZDGAN Model Applicability for Zero-Day vs. Botnet Synthetic Data Generation.
| Aspect | ZDGAN for Zero-Day Attacks | ZDGAN for Botnet Intrusions |
|---|---|---|
| Source Dataset(s) | NSL-KDD, CTU-13 (general attacks) | CTU-13 (botnet-focused subsets) |
| Target Class Labels | 0 = malicious, 1 = benign | 0 = benign, 1 = botnet |
| Key Feature Types | Duration, Bytes, Protocol, State | Flow Duration, Packets, Botnet Family |
| Output Format | Tabular (network session records) | Tabular (flow-level intrusion logs) |
| Primary Use | Simulating rare or unknown attack types | Simulating diverse botnet behaviors |
| Integration Target | Ensemble classifier (Section 3.4) | Ensemble classifier (Section 3.4) |
Table 4.
Characteristics of DCGAN-Generated Malware Image Data.
| Attribute | Type | Description |
|---|---|---|
| Image Resolution | 64×64 px | Image encoding format (based on original binary data) |
| Color Mode | Grayscale/RGB | Raw binary converted to pixel intensity values |
| Input Source Encoding | Byte stream | 0 = benign, 1 = malware |
| Label | Binary | e.g., Allaple.A, Lolyda.AA1, Wintrim.BX, etc. |
| Malware Families | Categorical | Random noise vector (e.g., 100 dimensions from Gaussian) |
| Generator Input (z) | Vector | e.g., 70% train, 15% val, 15% test (combined real/synthetic) |
| Dataset Split | Percentage | Image encoding format (based on original binary data) |
| Image Resolution | 64×64 px | Raw binary converted to pixel intensity values |
Table 5.
ResNet50 Transfer Learning Configuration.
| Parameter | Value |
|---|---|
| Input Resolution | 64×64 pixels |
| Base Model | ResNet50 (ImageNet pretrained) |
| Frozen Layers | All convolutional base layers |
| Fine-tuned Layers | Fully connected classifier head |
| Loss Function | Binary Cross-Entropy |
| Optimizer | Adam (with weight decay) |
| Augmentation | Flip, Rotation, Scaling |
| Training Epochs | 25–30 (with early stopping) |
Table 6.
Configuration Summary of Soft-Voting Ensemble Classifiers.
| Classifier | Key Parameters | Value(s) |
|---|---|---|
| KNN | Number of Neighbors (k) | 5 |
| SVC | Kernel Type | RBF |
| RF | Number of Trees, Max Depth | 100 trees, depth = 15 |
| DT | Max Depth, Split Criterion | Depth = 10, Gini Index |
| SGD | Loss Function, Learning Rate | Hinge, 0.01 |
Table 7.
Evaluation Metrics Overview.
| Metric | Description | Usage Target |
|---|---|---|
| Accuracy | Correct predictions over total samples | All branches |
| Precision / Recall | Measure of relevance and completeness | All branches |
| F1-score | Harmonic mean of precision and recall | Imbalanced datasets |
| ROC-AUC | Area under ROC curve | Binary classifiers |
| FPR | False positive rate | Benign classes |
| Confusion Matrix | Actual vs predicted class distributions | Interpretability |
Table 8.
Summary of Evaluation Experiments per Branch.
| Branch | Datasets | Synthetic Data | Classifier | Output Format |
|---|---|---|---|---|
| Image Branch | Malimg | DCGAN malware images | ResNet50 (TL) | Binary class scores |
| Tabular (ZD) | NSL-KDD, CTU-13 |
ZDGAN zero-day samples | Ensemble (5 models) | Binary class scores |
| Tabular (Bot) | CTU-13 subsets | ZDGAN botnet samples | Ensemble (5 models) | Binary class scores |
Table 9.
Summary of Evaluation Experiments per Branch.
| Fusion Strategy | Approach Description |
|---|---|
| Majority Voting | Picks most common class across branches |
| OR Rule | Flags if any branch detects a threat |
| Confidence-Weighted Avg. | Averages scores weighted by confidence |
| Dempster-Shafer | Combines belief from branches |
| Bayesian Inference | Probabilistic posterior inference |
Table 10.
Summary of Evaluation Experiments per Branch.
| Model | Accuracy | F1-Score | Inference Time (ms) |
|---|---|---|---|
| Decision Tree | 1.00 | 1.00 | 6.04 |
| Logistic Regression | 1.00 | 1.00 | 94.45 |
| Random Forest | 1.00 | 1.00 | 147.96 |
Table 11.
Summary of ZDGAN Performance Metrics for Zero-Day Datasets.
| Metric | ZDGAN (Zero-Day Data) |
|---|---|
| Mean Cosine Similarity | 0.819 |
| Average Log-Mean Deviation | 0.082 |
| Jensen-Shannon Divergence (Avg) | 0.104 |
| Synthetic Sample Diversity Index | 0.770 |
| t-SNE Cluster Overlap Score | 0.870 |
Table 12.
Summary of ZDGAN Performance Metrics for Zero-Day Datasets.
| Metric | ZDGAN (Botnet Data) |
|---|---|
| Mean Cosine Similarity | 0.803 |
| Average Log-Mean Deviation | 0.093 |
| Jensen-Shannon Divergence (Avg) | 0.117 |
| Synthetic Sample Diversity Index | 0.740 |
| t-SNE Cluster Overlap Score | 0.850 |
Table 13.
Summary of DCGAN Performance Metrics for Malware Images.
| Metric | Value |
|---|---|
| Structural Similarity Index (SSIM) | 0.873 |
| Fréchet Inception Distance (FID) | 24.600 |
| Average Entropy per Image | 6.380 |
| Diversity Index (Inter-class) | 0.720 |
Table 14.
Summary of Evaluation Metrics for the Image and Tabular Branch.
| Metric | Image Branch (CNN) | Tabular Branch (Ensemble) |
|---|---|---|
| Accuracy | 0.972 | 0.945 |
| F1-Score | 0.973 | 0.946 |
| Precision | 0.975 | 0.952 |
| Recall | 0.971 | 0.941 |
| AUC (ROC) | 0.991 | 0.982 |
Table 15.
Summarization of Fusion SMethods Comparison Results.
| Metric | Accuracy | F1-Score | Precision | Recall | AUC (ROC) |
|---|---|---|---|---|---|
| Majority Voting | 0.955 | 0.954 | 0.957 | 0.951 | 0.976 |
| Rule-Based Method | 0.942 | 0.943 | 0.931 | 0.955 | 0.969 |
| Confidence-Weighted Avg. | 0.967 | 0.966 | 0.969 | 0.963 | 0.985 |
Disclaimer/Publisher’s Note: The statements, opinions and data contained in all publications are solely those of the individual author(s) and contributor(s) and not of MDPI and/or the editor(s). MDPI and/or the editor(s) disclaim responsibility for any injury to people or property resulting from any ideas, methods, instructions or products referred to in the content. |
© 2025 by the authors. Licensee MDPI, Basel, Switzerland. This article is an open access article distributed under the terms and conditions of the Creative Commons Attribution (CC BY) license (http://creativecommons.org/licenses/by/4.0/).
Copyright: This open access article is published under a Creative Commons CC BY 4.0 license, which permit the free download, distribution, and reuse, provided that the author and preprint are cited in any reuse.


