
Submitted:
03 November 2025
Posted:
06 November 2025
You are already at the latest version
Abstract
The Otukpo Burnt Brick Factory has remained inactive for over three decades despite repeated government efforts to revive it. Given the abundance of clay-rich soils in the region and the growing need for sustainable, low-cost building materials, this study explores the potential of Otukpo soils for uncalcined brick production and use as supplementary cementitious materials (SCMs). Four representative samples (OT1–OT4) were characterized through mechanical, chemical, and mineralogical tests aligned with international standards for natural pozzolans. All samples exhibited high oxide contents (SiO₂ + Al₂O₃ + Fe₂O₃ > 93 %), low SO₃ and loss-on-ignition (~6 %), and adequate fineness (13–17 % retained on a 45 µm sieve), suggestive of favorable pozzolanic properties. Strength Activity Indices (SAI) based on unconfined compressive strength (UCS) and cube strength showed that OT3 and OT4 exceeded 100% of the NIS 87:2007 (≥2500 kPa at 28 days) threshold at 56 days with 5 wt.% sodium hydroxide and cement activation. Both also surpassed the NBC’s 14-day cube strength requirement (≥1600 kPa) and maintained water absorption below the 20 % limit for bricks. Unstabilized samples collapsed upon immersion, indicating excessive porosity/poor durability without enhancements. These findings strongly suggest that the Otukpo soils, particularly OT3 and OT4, are suitable for low-energy brick and SCM production.
Keywords:
burnt bricks
; uncalcined
; low-energy
; pozzolanic
; supplementary cementitious material
; sustainable construction
1. Introduction
In Nigeria, sandcrete blocks are the predominant walling material but remain largely unaffordable for many. Their inconsistent quality and substandard performance across manufacturers have raised concerns, as commercial blocks frequently fall below regulatory benchmarks. As highlighted by Ubi et al. [1], even the most lenient cement mix ratios are often disregarded in practice. In contrast, burnt bricks typically exceed strength requirements and offer a cheaper alternative, positioning them as a potentially more sustainable solution for affordable housing.
The Otukpo Burnt Brick Factory, once a symbol of industrial promise, has remained dormant since the 1990s despite repeated revival efforts [2,3]. Figure 1 depicts what is left of it. In response to this context, the present exploratory study seeks more sustainable and culturally resonant alternatives, specifically, the utilization of local soil to produce minimally processed, uncalcined mud bricks (unfired bricks), and to assess its potential as a natural pozzolan for the development of supplementary cementitious materials (SCMs). The overarching aim is to reduce reliance on conventional cement in construction, lower environmental impact, cut production costs, and promote Indigenous building traditions.
The growing demand for sustainable building materials has prompted a re-evaluation of legacy soil samples, particularly those historically used for burnt brick production. In Nigeria’s Benue Valley, traditional brickmaking has long relied on locally sourced clayey soils and rudimentary firing methods. While economically viable, these practices raise environmental concerns and yield inconsistent product quality, similar to issues observed with sandcrete blocks.
Burnt bricks, valued for durability and thermal insulation [4], require high-temperature firing, often using firewood—raising sustainability concerns. Alternatives that minimize energy use and leverage pozzolanic reactions offer a low-carbon path forward [5]. Pozzolans, though not cementitious on its own, react with calcium hydroxide in the presence of water to form cementitious compounds such as calcium silicate hydrate (C–S–H) and calcium aluminate hydrate (C–A–H) [6]. Materials like fly ash, calcined clays, and volcanic ash are common, but recent studies show that natural soils rich in SiO2, Al2O3, and Fe2O3 can serve as supplementary cementitious materials (SCMs) [7]. Nigerian clays often contain kaolinite and goethite, suggesting pozzolanic potential [8], though activation - mechanical, thermal, or chemical - is typically required [9]. Even uncalcined kaolinitic clays, when finely ground, show reactivity in cement systems [10].
Sandcrete blocks often fail to meet Nigerian Industrial Standard - NIS 87:2007 [31], which require a minimum UCS of 2.5 N/mm2 for non-load-bearing blocks [11]. Stabilization using minimal cement or alkali activators has shown promise. Locally produced burnt bricks in Makurdi, Benue State, exhibited strengths of 3.46 and 11.75 N/mm2, water absorption of 8.58% and 16.49%, and abrasion resistance of 9.32 and 33.67, respectively [12]. These bricks were significantly more cost-efficient than sandcrete blocks, which typically range from 0.5 to 1 N/mm2 [11,12]. Despite these advantages, further research is needed to improve firing methods and reduce environmental degradation.
Legacy soils from Otukpo and Makurdi often possess mineralogical profiles conducive to pozzolanic reactivity [12] yet remain under-assessed for SCM applications. Re-evaluating these soils supports both local traditions and global sustainability goals. The prolonged dormancy of the Otukpo Burnt Brick Factory—inactive for over three decades—underscores the need for community-driven alternatives [13]. Reviving brick production through low-energy methods like uncalcined bricks or SCMs could stimulate employment and meet rising construction demands.
Traditional earthen materials vary widely in composition and require tailored characterization for mainstream use [14]. Their compressive strength ranges from 0.49 to 4.90 N/mm2, often below code requirements. Moisture ingress and rainfall pose additional challenges, necessitating stabilization. Mechanical, thermal, and chemical activation methods have been explored [9], with chemical activation shown to enhance pozzolanic reactivity. Reactivity is influenced by mineralogy and specific surface area (SSA), where higher SSA can improve strength [15]. Uncalcined clays offer sustainable potential but may absorb water excessively, affecting long-term performance [15].
SCMs are increasingly used to reduce cement’s environmental footprint [16]. These include natural pozzolans and industrial by-products like fly ash, silica fume, metakaolin, and GGBFS [7]. In tropical regions, clay-derived SCMs are especially relevant. Their filler effect accelerates hydration and improves durability. In Chile, most of the cement production uses Portland-pozzolan cement with natural pozzolans that are readily available [5]. Research shows that calcining kaolinite at 700 °C for 1 hour yields high-quality SCMs, though energy-intensive. Following ASTM C618-12 [6], Class N natural pozzolans must meet key criteria including SiO2 + Al2O3 + Fe2O3 ≥ 70%, SO3 ≤ 4%, and a Strength Activity Index (SAI) ≥ 75% at 28 days, among other chemical and physical requirements [6,7].
2. Materials and Methods
To characterize Otukpo soils, this study applied techniques such as X-ray fluorescence (XRF) for elemental and oxide composition, X-ray diffraction (XRD) for mineral phase identification [20], scanning electron microscopy (SEM) for microstructural analysis [21], thermogravimetric analysis (TGA) for thermal behavior, and particle size distribution (PSD) for granulometry [22]. Unconfined compressive strength (UCS) and cube compressive strength tests were conducted to evaluate stabilization performance and early-age mechanical behavior. Additional pozzolanicity indicators such as strength activity index (SAI), differential thermogravimetry (DTG), fixed lime strength activity test (FAST), Frattini test, and the rapid, relevant, and reliable (R3) reactivity test may also be used [23,24]. However, because this exploratory study is self-funded, the number and extent of the tests conducted were constrained by available funds. Furthermore, the sequence of tests was conducted so as so check conformance to ASTM C618 [6] as well as the requirements for brick in NIS 87: 2007 [31] and Nigerian Building Code – NBC [34].
2.1. Lab Strategy
Chemical, thermal, physical, and mechanical tests were conducted across multiple laboratories at Ahmadu Bello University, Zaria. Specifically, XRD, XRF, and SEM analyses and TGA were performed at the university’s diffractometry laboratory [25,26], while all other tests were conducted at the Geotechnical Engineering and Concrete Laboratories of the Civil Engineering Department. Due to scheduling constraints and for cross-verification purposes, OT2 samples were tested at Goe-Works and Engineering Services Limited, a private laboratory based in Abuja. The Scanning Electron Microscopic (SEM) test was conducted at the Nigeria Bridge, Roads and Research Institute (NBRRI), Abuja as they were the only one with a functioning equipment at the time.
2.2. Sample Collection and Preparation
4 sets of representative soil samples were collected from the borrow pits of the defunct Benue Burnt Bricks Factory in Otukpo, and labelled OT1 to OT4 as shown on Table 1. They were collected below the topsoil horizon at a depth of ~ 2ft to eliminate organic materials. Cement used for this study were Portland limestone cement with product designation SOKCEM II-42.5N for normal or general-purpose use, manufactured by BUA Cement at their Plant in Sokoto State, Nigeria, manufactured in accordance with NIS 444 [31].
The soil samples were initially air-dried and ground to reduce size, then oven-dried at 105 ± 5 °C for 24 hours to eliminate residual moisture. The dried clods were gently pulverized using a wooden mallet and sieved to pass through a 2 mm mesh for geotechnical testing and a 75 µm mesh for chemical and mineralogical analyses.
2.3. XRD, XRF, SEM, and TGA Tests
XRD analysis was conducted using a Rigaku MiniFlex benchtop system to identify the mineral phases the soil samples. Prior to analysis, samples were oven-dried at 100 °C for 24 hours to eliminate moisture, ground to a particle size of less than 75 µm for consistency, sieved for uniformity, centrifuged to isolate the clay fraction, and oriented mounts were prepared for clay-specific evaluation. These procedures followed ASTM E691 - Standard Practice for Conducting an Interlaboratory Study to Determine the Precision of a Test Method [6], along with related sample handling protocols, using approximately 1.5 grams of material per test. The diffraction analysis employed Cu-Kα radiation (λ = 1.54056 Å), and scans were performed over a 2θ range of 3.00° to 70.00° at 0.02° intervals, enabling high-resolution peak detection as described by Moussa et al. [26]. Resulting spectra were matched against the International Centre for Diffraction Data – Powder Diffraction File (ICDD PDF-2) database, and semi-quantitative phase estimation was performed using peak area normalization.
The chemical composition of the untreated soil samples was determined using the Xenemetrix Genius IF (Secondary Targets) Energy-Dispersive X-Ray Fluorescence (EDXRF) spectrometer. Sample preparations were similar to XRD. Prior to analysis, the powders were pressed into 40 mm diameter pellets using an inert binder at a 5:1 ratio; approximately 5 g of sieved powder was compacted with a hydraulic press and placed into the spectrometer chamber for elemental and oxide analysis via X-ray excitation. The pozzolanicity index was assessed in accordance with ASTM C618, and each analysis was performed in duplicate for quality assurance.
SEM was conducted using the Oxford PhenomProX system, which provided a high-resolution imaging to examine soil microstructure, particle morphology, and mineral bonding, particularly in samples with distinct mineralogical features. TGA was performed using the PerkinElmer MES-TGA TGA4000 system (Netherlands), which measures thermal decomposition and weight loss under controlled heating to identify moisture content, organic matter, mineral stability, and loss on ignition (LOI). As different materials decompose at characteristic temperatures, TGA provides insight into compositional changes and thermal behavior.
2.3. Geotechnical and Mechanical Tests
For the particle size distribution, both dry and sedimentation analysis were done to adequately capture the full range of particle sizes per the requirements of ASTM D 6913 - Standard Test Method for Particle Size Distribution (Gradation) of Soils using Sieve Analysis [6]. For the Atterberg limits and related tests, ASTM D 4318 - Standard Test Method for Liquid Limit, Plastic Limit, and Plasticity Index of Soils in conjunction with ASTM D 698 - Standard Test Method for Laboratory Compaction Characteristics of Soil [6]. Figure 2 is depictive of hydrolysis, stabilizer mixing operation, and compaction.
Stabilized formulations were prepared by dry mixing the processed soil with 5 wt.% cement or 5 wt.% sodium hydroxide (NaOH) as shown in Figure 2, followed by the addition of water corresponding to the optimum moisture content (OMC) as determined from Proctor compaction tests. For the strength tests, to ensure repeatability and statistical reliability, three replicate specimens (n = 3) were produced for each test condition for UCS and cube strength evaluations. The UCS tests were conducted using a Load Frame machine in accordance with BS 1377-7:1990 – Methods of Test for Soils for Civil Engineering Purposes, Part 7: Shear Strength Tests (Total Stress Condition) [33] and ASTM D2166/D2166M-13 – Standard Test Method for Unconfined Compressive Strength of Cohesive Soil [6]. Cube specimens measuring 70.6 mm were used, based on the available moulds. These conform to IS 4031-6:1988 – Methods of Physical Tests for Hydraulic Cement, Part 6: Determination of Compressive Strength and IS 10080:1982 – Specification for Vibration Machine for Cement Mortar Cubes [32], which provide standardized procedures for compressive strength testing of cementitious materials. The setup also aligns with BS 1881-116:1983 – Testing Concrete, Method for Determination of Compressive Strength of Concrete Cubes [33], which specifies a minimum cube dimension of 70.7 mm and is considered acceptable for stabilized soil evaluation. Additionally, ASTM C109/C109M-21 – Standard Test Method for Compressive Strength of Hydraulic Cement Mortars (Using 2-in. or 50 mm Cube Specimens) was adapted to accommodate the larger 70.6 mm specimens, with consistent loading rates and curing protocols applied. Figure 3 shows the cube strength tests being executed [6].
The pH of the soil samples presented in Table 1 was determined by dissolving 2 g of each sample in distilled water, followed by thorough mixing. The suspension was left to stand undisturbed for approximately 30 minutes, then stirred again to ensure homogeneity. The mixture was subsequently filtered through standard filter paper, and the pH of the filtrate was measured using a calibrated pH meter. The resulting values, expressed in standard pH units (±0.1), reflect the acidity or alkalinity of the soil samples under laboratory conditions.
2.4. Water Absorption Test
The water absorption test was conducted to evaluate the susceptibility of unsaturated lateritic soil to moisture ingress, a key factor in assessing durability under environmental exposure. Specimens were cured in open air for 28 days, following the benchmark outlined in BS 1881-122:1983 – Testing Concrete, Method for Determination of Water Absorption [33], and adopted by Nigerian Industrial Standards (NIS 586:2007 [31]) and the NBC [34]. After curing, each cube was oven-dried at 105 °C to constant mass, cooled, and weighed to obtain the dry mass (Md). Each sample was then submerged in clean water for 24 hours to reach a saturated surface-dry (SSD) condition. After gently blotting off surface moisture, the SSD mass was recorded. Water absorption was calculated using: Water Absorption (%) = (SSD mass − Dry mass)/Dry mass × 100.
Although no dedicated standards exist for lateritic soils, this procedure was adapted from ASTM C127 – Standard Test Method for Relative Density and Absorption of Coarse Aggregate, ASTM C128 – Standard Test Method for Relative Density and Absorption of Fine Aggregate, and ASTM C1585 – Standard Test Method for Measurement of Rate of Absorption of Water by Hydraulic-Cement Concretes [6], as well as BS EN 1097-6:2013 – Tests for Mechanical and Physical Properties of Aggregates, Part 6: Determination of Particle Density and Water Absorption [33]. These standards ensure methodological consistency while accommodating the unique characteristics of tropical soils.
3. Results and Discussion
3.1. XRD, XRF,SEM, and TGA
Table 2 presents the quantitative results of the XRD analysis showing the minerology and the content (wt. %) of the various phases. Expectedly, the difference with cement is clearly shown by the dominance of calcite and alite in SOKCEM, especially alite, which is a synthetic material used in cement production [27]. OT1 and OT2 used SOKCEM1 while OT3 and OT4 used SOKCEM2. The two sets of tests were conducted months apart as shown in Table 1.
Table 3 provides the associated qualitative XRD analysis of soil samples, which includes the various peaks, angle of diffraction (- 2θ (two-theta), and the (ICDD PDF-2) database references.
The complete XRD trace, illustrating the various diffraction peaks, is graphically presented in Figure 4. It highlights the distinct mineralogical phases and clearly identifies the dominant components, as summarized in Table 3.
To complement the mineralogical insights from the XRD analysis, further deductions may be drawn from the elemental and chemical compositions presented in Table 4, which displays the XRF results in terms of major oxides side by side. This data provides a quantitative basis for evaluating the soil’s geochemical profile, and supports the determination of pozzolanic potential.
S + A + F is cement chemistry notation for the summation of the major oxides of SiO2, Al2O3, and Fe2O3.
Following the mineralogical and chemical characterization provided by XRD and XRF analyses, Scanning Electron Microscopy (SEM) was employed to investigate the microstructural features of the stabilized lateritic soil samples. While XRD identified dominant crystalline phases and XRF quantified elemental oxides, SEM offers complementary insight into particle morphology, surface texture, and bonding characteristics at the microscale. This visual assessment is critical for understanding how mineral phases are distributed and how stabilization treatments influence soil structure, porosity, and cohesion [28].
Figure 5.
SEM Surface Morphology and Microstructure for OT3 and OT4.
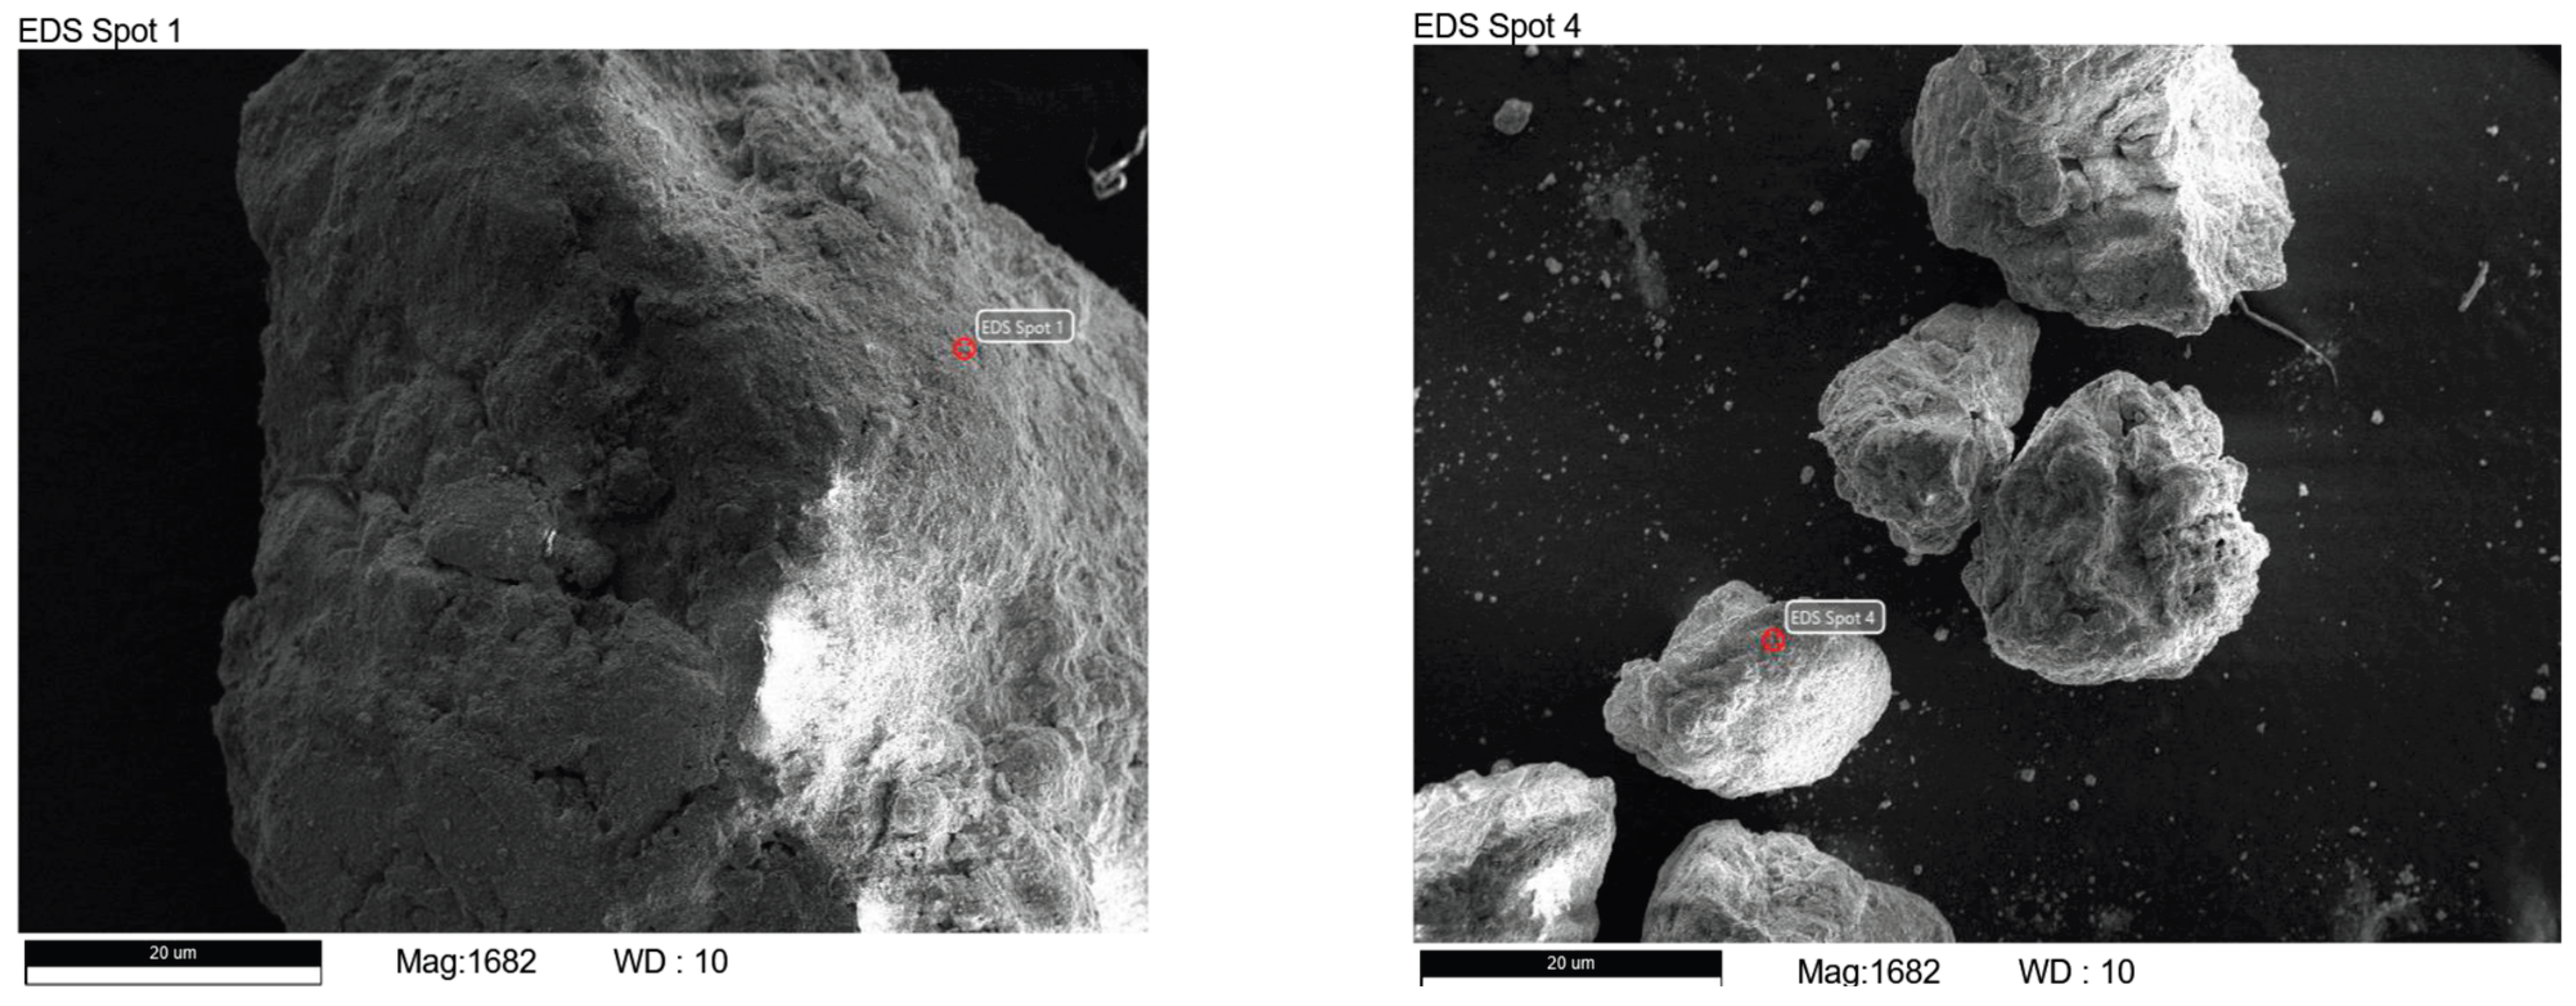
The SEM analyses of OT3 and OT4, conducted across multiple points of interest, reveal compositional and microstructural features broadly representative of the entire OT sample group (OT1–OT4). Both samples exhibit platy, layered textures indicative of kaolinite morphology, accompanied by interparticle aggregation and sporadic iron-rich surface coatings. These microstructural traits align with the XRF results showing elevated concentrations of Al2O3 and Fe2O3, and are consistent with XRD confirmation of kaolinite, goethite, and quartz phases. Collectively, the SEM micrographs point to the classification of these soils as silica- and alumina-rich lateritic clays with a mixture of kaolinite and ferrite, reflecting their dual siliceous and ferric characteristics [28].
The thermogravimetric analysis (TGA) of samples OT3 and OT4 revealed multiple stages of weight loss patterns that reflect the soil’s natural mineralogical composition and thermal behavior. Both samples exhibited an initial weight loss between 30 °C and 105 °C, attributed to the evaporation of free and adsorbed water. From 105 °C to 400 °C, the gradual decline corresponds to the release of structural water from clay minerals such as kaolinite, and possibly the breakdown of organic matter. A sharper weight loss between 400 °C and 550 °C is linked to the dehydroxylation of hydroxyl-bearing minerals like kaolinite and goethite that were identified by XRD. Further loss from 550 °C to 850 °C may be reflective of the decomposition of naturally occurring calcium carbonate (CaCO3), releasing CO2 and confirming the presence of native carbonate phases such as calcite [29]. Beyond 850 °C, the curves stabilize, indicating that major volatile components have been expelled and decomposition reactions are complete. The estimated Loss on Ignition (LOI) for both OT3 and OT4 is approximately 6% as shown in Table 5, suggesting a moderate presence of volatile-bound phases typical of lateritic soils. LOI was calculated using the standard formula: LOI (%) = (Initial weight of sample – Final weight after heating) ÷ (Initial weight of sample – Weight of empty crucible) × 100, which expresses the percentage of mass lost due to moisture, structural water, carbonates, and other volatiles. These thermal signatures, when considered alongside XRD and XRF data, point to the classification of the OT soils as silica- and alumina-rich lateritic clays with a mixture of kaolinite and ferrite [30].
3.2. Water Absorption Test
Table 6 presents the 28-day water absorption results for representative OT soil samples following standard procedures adapted from BS 1881-122 [33] and supported by NIS 586:2007 [31] and the NBC [34]. The offer a measure of the soil’s permeability and moisture retention capacity and provide insight into the effectiveness of cement and alkali activation in reducing porosity – a key requirement for checking durability. When interpreted alongside SEM and XRD analyses, the observed trends in water absorption correlate with microstructural densification, mineral phase development, and reduced capillary pathways, indicating that stabilization led to an improvement in the long-term performance of lateritic soils.
3.3. Geotechnical and Physico-Mechanical Tests
3.3.1. Soil Classification, PH and Moisture Content Tests
Sieve analyses and Atterberg limits tests were carried out for all the samples to aid in their classification, and to examine their gradation. Optimum moisture content was also determined. These laboratory analyses revealed a range of properties. The results of the particle size distribution are captured in Table 7, from which percentage residue retained on 45µm sieve can be extrapolated - 13, 6.8, 17, and 13 respectively - which meets the requirement of ASTM C618 that caps this value at 34% for pozzolans that can be utilized for SCMs.
Some sieve sizes were unavailable at the time of testing, resulting in partial data for certain samples. These gaps are indicated with dashes ‘—’ in Table 7 and do not affect the overall interpretation, as the available data sufficiently captures the gradation trends and supports classification and compliance assessments.
Table 8 summarizes the key physical properties and Unified Soil Classification System (USCS) designations for OT1 to OT4, all of which were identified as sandy fat clay (CH) based on their high plasticity indices and liquid limits. These classifications are consistent with the mineralogical and microstructural evidence obtained from XRD and SEM analyses, which revealed dominant kaolinitic and ferruginous phases alongside a porous matrix typical of lateritic clays. The specific gravity values (~2.6) and the relatively high optimum moisture contents (OMC) further support the presence of fine-grained, water-sensitive constituents.
LL = Liquid Limit; PL = Plastic Limit; PI = Plasticity Index; OMC = Optimum Moisture Content; MDD = Maximum Dry Density; SG = Specific Gravity; USCS = Unified Soil Classification System. “0% CN” refers to the unstabilized control sample; “5% C” denotes stabilization with 5% cement; “5% N” denotes stabilization with 5% NaOH.
At ambient temperature (25 ± 3 °C), OT3 and OT4 exhibited slightly acidic pH values of 6.14 and 6.34, respectively, along with high natural moisture contents of 26.6% and 28.5%. These values are within reasonable margins of findings by Adunoye et al. [38] and Osuji [39] who reported that lateritic soils in southwestern Nigeria typically show pH levels between 5.5 and 6.5 and moisture contents ranging from 17% to 25%, reflecting the influence of tropical weathering and high rainfall. Such conditions suggest moderately reactive environments that support binder dispersion and early-stage stabilization, particularly when using cementitious or alkaline activators.3.3.2 Unconfined Compressive Test (UCS)
3.3.3. Unconfined Compressive Test (UCS)
Table 9 presents the unconfined compressive strength (UCS) results for OT1, OT3, and OT4 samples over curing periods of 7, 14, 28, and 56 days, under varying stabilization regimes including 5% cement, 5% NaOH, and a combined 2.5% cement–2.5% NaOH treatment. The progressive strength gains reflect the influence of chemical activation on matrix development and bonding. These trends correlate with the geotechnical properties shown in Table 8 where high plasticity indices and optimum moisture contents indicate moisture-sensitive, fine-grained soils. Mineralogical insights from XRD confirm the presence of reactive clay minerals such as kaolinite and iron oxides (e.g., goethite), while XRF data support the availability of silica and alumina for pozzolanic reactions. Together, these results demonstrate that chemical stabilization promotes microstructural densification and strength development in lateritic soils.
The significant difference in UCS performance between OT1 and OT3/OT4 could be attributed to either the type of cement used or the mineralogical composition/gradation of the soil samples. OT3 and OT4 were stabilized with SOKCEM2, a cement blend characterized by higher calcite content (31 ± 2%) compared to SOKCEM1 (19.3 ± 19) used for OT1. This elevated calcite level possibly enhanced early matrix formation and contributed to better strength development through improved particle bonding and densification, but this is arguable as it is within the margin of error. Additionally, OT3 and OT4 contain substantial amounts of kaolinite (31–34%), a reactive clay mineral that readily participates in pozzolanic reactions with calcium-rich binders. In contrast, OT1 lacks kaolinite and is dominated by less reactive phases such as quartz and orthoclase, which may limit its responsiveness to chemical stabilization and result in lower UCS values.
3.3.4. Compressive Cube Test and Dimensional Shrinkage
Table 10 presents the compressive strength results of cube specimens for OT2, OT3, and OT4 across 7, 14, and 28 days of curing under various binder treatments. The strength trends closely mirror those observed in the UCS tests (Table 9), with OT3 and OT4 consistently outperforming OT2 across all binder types and curing ages. As expected, cube strength values are characteristically higher than UCS values due to the confined geometry and reduced lateral deformation during loading. The results reaffirm the effectiveness of cement and alkali activation in enhancing strength, particularly in kaolinite-rich soils like OT3 and OT4 and further highlight the influence of binder type and mineralogical compatibility on mechanical performance.
Before crushing the cubes, shrinkage was observed. The dimensions of the cured cubes were measured and compared to the original mold size of 70.6 mm. The dimensional shrinkage (%) was calculated as the deviation from the nominal 70.6 mm mold size after curing. Average dimensional shrinkage of the cured 70.6 mm cubes ranged from 1.0 % to 2.5 %, depending on the binder.
3.4. Integrated Results Interpretation
The results confirm the pozzolanic potential of Otukpo soils, particularly OT3 and OT4, for low-energy brick production and supplementary cementitious material (SCM) applications. All four samples (OT1–OT4) exhibited favorable chemical characteristics, including high oxide content (SiO2 + Al2O3 + Fe2O3 > 93%), low SO3 and LOI values, and adequate fineness (13–17% retained on a 45 µm sieve), aligning with established criteria for natural pozzolans. However, the relatively low pH values observed across all samples suggest limited inherent alkalinity, reinforcing the need for chemical activation to enhance dissolution and reactivity.
The Strength Activity Index (SAI) was calculated using both UCS and cube strength data where available. Although not determined according to ASTM C311 [6], this study adopted a modified approach: comparing the 5 wt.% cement strength results against the minimum compressive strength requirements of the NBC [34] at 14 days and NIS 87:2007 [31] at 28 days. This yields a more stringent, context-specific assessment. The integrated results are presented in Table 11. OT3 and OT4 achieved SAI values well above the 75% benchmark: OT3 recorded 117.2% and OT4 109.8% at 56 days under 5 wt.% NaOH and cement activation. Although the benchmark is set at 28 days for sandcrete blocks, these results highlight the strength benefits of extended curing, particularly for NaOH-activated systems, which outperformed cement at later ages. Both samples also surpassed the NBC’s 1600 kPa cube strength requirement at 14 days across all binder types, confirming their suitability for uncalcined brick production (unfired). Unfortunately, on account of the much higher cost than cement, NaOH is not sustainable for use in Nigeria at this time [35].
Water absorption results further support these findings. Only the 5 wt.% cement-stabilized samples met the ≤20% limit prescribed by NIS 586 [31] for load-bearing bricks. The NaOH-only and unstabilized samples collapsed during immersion testing, indicating excessive porosity and inadequate cohesion. These outcomes underscore the critical role of binder selection in achieving durable, water-resistant bricks. Moisture content was not considered in this phase, as all samples were oven-dried prior to testing to ensure consistency and eliminate variability due to ambient conditions.
Dimensional stability was assessed through linear shrinkage measurements of the cured 70.6 mm cubes, which ranged from 1.0% to 2.5% depending on binder composition. These values exceed the 0.065% limit prescribed for concrete masonry units under ASTM C90/C426 [6], as expected for uncalcined, clay-rich materials. Nevertheless, they fall within the typical 0.5–2% range reported for stabilized lateritic and earthen bricks. Among the binders investigated, cement-stabilized samples exhibited the least shrinkage (~1.0 - 1.3%), followed by cement + NaOH blends (~1.2%), while NaOH-only and unstabilized samples showed the highest values (up to 2.5%). The relatively low shrinkage of cement-treated specimens confirms the stabilizing and pore-filling effects of hydrated calcium silicate formation, which improves matrix cohesion and limits drying-induced volume change. Despite not meeting the stringent concrete block limit, the stabilized bricks, particularly those containing cement, demonstrated satisfactory dimensional stability consistent with field-acceptable tolerances for compressed or low-energy earthen units.
While the tested lateritic soils do not meet the criteria to be classified as true pozzolans in their untreated form, they demonstrated clear pozzolanic potential. Their elevated major oxides’ composition and modest early-age strength gains suggest that through activation methods such as calcination or mechanochemical processing, these materials could attain full pozzolanic reactivity and function effectively as SCMs. This interpretation aligns with prior findings that uncalcined kaolinitic clays, when finely milled, exhibit measurable reactivity in cementitious systems [10], and that the extent of this reactivity is closely linked to factors such as mineralogical composition, amorphous phase content, and specific surface area [15].
Lastly, Otukpo is home to major rice mills, and it is within an agricultural belt, so there are valuable opportunities for synergy with Agro-waste-based ashes. Rice husk ash (RHA), a well-documented pozzolanic byproduct, could be locally sourced and blended with Otukpo soil to enhance mechanical performance, reduce binder demand, and promote circular construction practices. Even more instructive is the fact that there are substantial limestone deposits nearby, which can also be leveraged to produce so-called Limestone Calcined Clay Cement (LC3) [36]. If properly harnessed, such integration could significantly improve the sustainability and economic viability of decentralized binder and brick production in the region [36,37].
4. Conclusions
This study demonstrates that Otukpo soils, particularly areas where OT3 and OT4 were collected, which was within the vicinity of the defunct Benue Burnt Bricks, possess favorable pozzolanic and mechanical characteristics suitable for use in low-energy (unfired) brick production and as supplementary cementitious materials (SCMs) (given their relatively high kaolinite content). Their high reactive oxide contents, moderate loss-on-ignition values, and strong response to cement and alkaline activation confirm their suitability for sustainable construction applications within the Benue region and similar lateritic environments.
Although water absorption and shrinkage data suggest improved dimensional stability, especially in cement-stabilized samples, they do not fully capture the swelling behavior of clay-rich soils. Future research should address this behavior and examine how activation strategies affect long-term volumetric stability. These studies should also assess durability under varied environmental and loading conditions, including the potential benefits of mechanochemical activation. A combined approach involving mineralogical, chemical, and microstructural analyses (before and after treatment), specific surface area measurements, and standardized strength tests over extended curing is recommended. In parallel, regional quality frameworks and the incorporation of Agro-waste ashes like rice husk ash could further enhance strength and durability.
Emerging alternatives like Limestone Calcined Clay Cement (LC3), which utilize abundant clay minerals and require lower calcination temperatures, offer promising low-carbon pathways for binder optimization. Establishing such evidence-based standards will reinforce confidence in earthen construction, promote adoption by government and private-sector stakeholders, and advance decentralized, community-driven production models across the Benue Valley and similar regions.
Author Contributions
Conceptualization, J.A.; methodology, J.A.; validation, S.O., O.O.; formal analysis, J.A.; investigation, J.A.; resources, J.A.; data curation, J.A.; writing—original draft preparation, J.A.; writing—review and editing, S.O.; visualization, J.A.; supervision, S.O., O.O.; project administration, J.A.; funding acquisition, J.A. All authors have read and agreed to the published version of the manuscript.
Funding
This research received no external funding.
Data Availability Statement
The data sets generated during and/or analyzed during the current study are included in this submission and are also available on the authors’ computers and can be made available upon request via email to the authors.
Acknowledgments
During the preparation of this manuscript/study, the author(s) used Microsoft Copilot for the purposes of compilating the results of the chemical tests, and rephrasing portions of the abstract and the conclusions. The authors have reviewed and edited the output and take full responsibility for the content of this publication.
Conflicts of Interest
The authors declare no conflicts of interest.
References
- Ubi, S.E.; Nyah, E.D.; Agbor, R.B. Determination of mechanical properties of sandcrete block made with sand, polystyrene, laterite and cement. Int. J. Adv. Eng. Manag. 2022, 7(2). Available online: https://ijaem.net/issue_dcp/Determination%20of%20Mechanical%20Properties%20of%20Sandcrete%20Block%20Made%20With%20Sand,%20Polystyrene,%20Laterite%20and%20Cement.pdf (accessed on 24 June 2025).
- Daily Post Nigeria. Governor Ortom pledges to revive Taraku Mills, others. Daily Post Nigeria 2015. Available online: https://dailypost.ng/2015/06/20/governor-ortom-pledges-to-revive-taraku-mills-others/ (accessed on 24 June 2025).
- Daily Trust. Encounter with Benue burnt brick makers. Daily Trust 2023. Available online: https://dailytrust.com/encounter-with-benue-burnt-brick-makers/ (accessed on 24 June 2025).
- Tse, A. Suitability of flood plain deposits for the production of burnt bricks in parts of Benue State, Central Nigeria. Geoscience 2012, 2, 1–6. [Google Scholar] [CrossRef]
- Oviedo, I.; Pradena, M.; Link, Ó.; Balbo, J.T. Using Natural Pozzolans to Partially Replace Cement in Pervious Concretes: A Sustainable Alternative? Sustainability 2022, 14, 14122. [Google Scholar] [CrossRef]
- ASTM International. Annual Book of ASTM Standards; ASTM International: West Conshohocken, PA, USA, 2023.Includes: ASTM C618-23 (Standard Specification for Coal Fly Ash and Raw or Calcined Natural Pozzolan for Use in Concrete), ASTM C311-22 (Standard Test Methods for Sampling and Testing Fly Ash or Natural Pozzolans for Use in Portland-Cement Concrete), ASTM D4318-17 (Standard Test Methods for Liquid Limit, Plastic Limit, and Plasticity Index of Soils), ASTM D698-12 (Standard Test Methods for Laboratory Compaction Characteristics of Soil Using Standard Effort), and ASTM C90/C426 (Standard Specification and Test Method for Linear Drying Shrinkage of Concrete Masonry Units), among other relevant standards referenced in this study. Available online: https://www.astm.org (accessed on 24 June 2025).
- Ayininuola, G.M.; Adekitan, O. Characterization of Ajebo kaolinite clay for production of natural pozzolan. Int. J. Civ. Environ. Struct. Constr. Archit. Eng. 2016, 10(9), 1212–1219. Available online: https://www.researchgate.net/publication/315378397_Characterization_of_Ajebo_Kaolinite_Clay_for_Production_of_Natural_Pozzolan (accessed on 18 July 2025).
- Amah, A.N.; Ahemen, I.; Kur, A. Chemophysical characterization of clay soil used for locally manufactured burnt bricks in Makurdi, Benue State, Nigeria. J. Eng. Appl. Sci. 2011, 7(1). Available online: https://journals.unizik.edu.ng/ujeas/article/view/1628 (accessed on 24 June 2025).
- Pol Segura, I., Jensen, P. A., Sanagavarapu, K., & Leal da Silva, W. R. (2025). Unlocking clay’s potential: A comparative analysis of activation techniques for enhanced reactivity in SCMs. Materials and Structures, 58(4), Article 141. [CrossRef]
- Geiker, M.R.; Gallucci, E. Clays as SCM – Reactivity of Uncalcined Kaolinite and Bentonite, and Impact on Phase Assemblage and Strength Development of PC Mortars. Nordic Concrete Research 2019, 60, 13–30. [Google Scholar] [CrossRef]
- Okigbo, C.C.; Gana, M. Determination of Quality of Sandcrete Blocks Using Cost Analysis of Material Input. J. Environ. Sci. Resour. Manag. 2017, 9(4), 44–52. Available online: https://www.cenresinjournals.com/wp-content/uploads/2020/02/Page-44-52-0351.pdf (accessed on 30 October 2025).
- Olawuyi, B.; Olusola, K.; Ogunbode, E.; Kyenge, S. Performance Assessment of Makurdi Burnt Bricks. Constr. Focus—J. Dep. Build. Ahmadu Bello Univ. 2013, 3(1), 1–12. Available online: https://www.researchgate.net/publication/262765699_Performance_Assessment_of_Markurdi_Burnt_Brics (accessed on 6 May 2025).
- Abah, H.E. Benue Investment Firm Unveils Revival Agenda. Daily Trust, 7 Jul 2020. Available online: https://dailytrust.com/benue-investment-firm-unveils-revival-agenda/ (accessed on 24 June 2025).
- Minke, G. Building with Earth: Design and Technology of a Sustainable Architecture; Birkhäuser: Basel, Switzerland, 2005; pp. 1–198. Available online: https://www.academia.edu/68778205 (accessed on 30 October 2025).
- Overmann, S.; Vollpracht, A.; Matschei, T. Reactivity of Calcined Clays as SCM—A Review. Materials 2024, 17, 312. [Google Scholar] [CrossRef] [PubMed]
- Global Cement and Concrete Association (GCCA). Blended Cements and Supplementary Cementitious Materials: Policy Document; GCCA: London, UK, 2024. Available online: https://gccassociation.org/wp-content/uploads/2025/07/GCCA_Blended_Cements_and_SCM_Policy_Document_Digital.pdf (accessed on 30 October 2025).
- Elsen, J.; Mertens, G.; Snellings, R. Portland Cement and Other Calcareous Hydraulic Binders: History, Production and Mineralogy. EMU Notes in Mineralogy 2010, 9, 441–479. [Google Scholar] [CrossRef]
- Sherwood, P. Soil Stabilization with Cement and Lime; HMSO/Transport Research Laboratory: London, UK, 1993. [Google Scholar]
- Makusa, G.P. Soil Stabilization Methods and Materials in Engineering Practice: State of the Art Review. Department of Civil, Environmental and Natural Resources Engineering, Division of Mining and Geotechnical Engineering, Luleå University of Technology, Luleå, Sweden, 2012; pp. 1–35. Available online: https://www.diva-portal.org/smash/get/diva2:997144/FULLTEXT01.pdf (accessed on 30 October 2025).
- Sierra, O.M.; Payá, J.; Monzó, J.; Borrachero, M.V.; Soriano, L.; Quiñonez, J. Characterization and Reactivity of Natural Pozzolans from Guatemala. Appl. Sci. 2022, 12, 11145. [Google Scholar] [CrossRef]
- Moussa, R.S.; Mahamadou, Z.; Mamane, O.S.; Habou, I.; Alma, M.M.M.; Natatou, I. Physico-chemical, Mineralogical and Structural Characterization of a Clay of Tanout (Zinder-Niger). World J. Adv. Res. Rev. 2022, 16, 1077–1092. [Google Scholar] [CrossRef]
- Neville, A.M. Properties of Concrete, 5th ed.; Pearson Education Limited: Harlow, UK, 2011. [Google Scholar]
- Alujas, A.; Fernández, R.; Quintana, R.; Scrivener, K.L.; Martirena, F. Pozzolanic Reactivity of Low-Grade Kaolinitic Clays: Influence of Calcination Temperature and Impact of Calcination Products on OPC Hydration. Appl. Clay Sci. 2015, 108, 94–101. [Google Scholar] [CrossRef]
- Pinheiro, V.D.; Alexandre, J.; Xavier, G.D.; Marvila, M.T.; Monteiro, S.N.; de Azevedo, A.R. Methods for Evaluating Pozzolanic Reactivity in Calcined Clays: A Review. Materials 2023, 16, 4778. [Google Scholar] [CrossRef] [PubMed]
- Iorfa, T.F.; Iorfa, K.F.; McAsule, A.A.; AKaayar, M.A. Extraction and characterization of nanocellulose from rice husk. Int. J. Appl. Phys. 2020, 7(1). Available online: https://www.internationaljournalssrg.org/IJAP/2020/Volume7-Issue1/IJAP-V7I1P117.pdf (accessed on 24 June 2025).
- Carminati, M.; Borghi, G.; Demenev, E.; Gugiatti, M.; Pepponi, G.; Crivellari, M.; Ficorella, F.; Ronchin, S.; Zorzi, N.; Borovin, E.; Lutterotti, L.; Fiorini, C. 32-Channel Silicon Strip Detection Module for Combined X-ray Fluorescence Spectroscopy and X-ray Diffractometry Analysis. Front. Phys. 2022, 10, 910089. [Google Scholar] [CrossRef]
- Dodson, V.H. Concrete Admixtures; Van Nostrand Reinhold: New York, NY, USA, 1990. [Google Scholar]
- Mitchell, J.K.; Soga, K. Fundamentals of Soil Behavior, 3rd ed.; John Wiley & Sons: Hoboken, NJ, USA, 2005. Available online: https://www.wiley.com/en-us/Fundamentals+of+Soil+Behavior,+3rd+Edition-p-9780471463023 (accessed on 24 June 2025).
- Horpibulsuk, S. Strength and Microstructure of Cement Stabilized Clay. InTechOpen 2012, pp. 1–20. [CrossRef]
- Nuru, Z.K.; Elsaigh, W.A.; Kearsley, E.P. Characteristics of Laterite Soil for Potential Geopolymer Applications. Minerals 2025, 15, 719. [Google Scholar] [CrossRef]
- Nigerian Industrial Standards for Cement and Masonry Materials; Standards Organisation of Nigeria (SON): Abuja, Nigeria, 2007–2014. Includes NIS 87:2007—Specifications for Sandcrete Blocks; NIS 444-1:2014—Cement: Composition, Specifications, and Conformity Criteria for Common Cements; and NIS 586:2007—Method for Determination of Water Absorption of Concrete.
- Indian Standards for Cement and Concrete Testing; Bureau of Indian Standards (BIS): New Delhi, India, 1982–1988. Includes: IS 4031-6:1988 (Methods of Physical Tests for Hydraulic Cement, Part 6: Determination of Compressive Strength); IS 10080:1982 (Specification for Vibration Machine for Cement Mortar Cubes); and other relevant BIS standards applied in this study.
- British Standards for Soil and Concrete Testing; British Standards Institution (BSI): London, UK, 1983–1990. Includes: BS 1377-7:1990 (Methods of Test for Soils for Civil Engineering Purposes, Part 7: Shear Strength Tests); BS 1881-116:1983 (Testing Concrete—Method for Determination of Compressive Strength of Concrete Cubes); and BS 1881-122:1983 (Method for Determination of Water Absorption).
- National Building Code of Nigeria (NBC); Federal Republic of Nigeria, 2006. Published by the Nigerian Building and Road Research Institute (NBRRI) and Federal Ministry of Works and Housing: Abuja, Nigeria, 2006.
- Jiji.ng. Caustic Soda Manufacturing Materials & Supplies in Nigeria. Available online: https://jiji.ng/manufacturing-materials-and-tools/caustic-soda (accessed on 29 October 2025).
- Singh, N.B. Clays and Clay Minerals in the Construction Industry. Minerals 2022, 12, 301. [Google Scholar] [CrossRef]
- Endale, S.A.; Taffese, W.Z.; Vo, D.; Yehualaw, M.D. Rice Husk Ash in Concrete. Sustainability 2023, 15, 137. [Google Scholar] [CrossRef]
- Adunoye, G.O.; Kolapo, S.A.; Olamoju, T.O.; Akanbi, O.T. Investigation of Geotechnical Properties of Lateritic Soils in Parts of Ife Central Local Government Area, Osun State, Southwestern Nigeria. Afr. J. Environ. Nat. Sci. Res. 2018, 1(2), 31–41. Available online: https://abjournals.org/...AJENSR_exc3VXYL.pdf (accessed on 30 October 2025).
- Osuji, O.S.; Akinwamide, J.T. Engineering Properties of Lateritic Soils in Ado-Ekiti, South Western Nigeria. Am. J. Eng. Res. 2018, 7(1), 353–360. Available online: https://ajer.org/papers/Vol-7-issue-1/ZS0701353360.pdf.
Figure 1.
Defunct Benue Burnt Bricks Factory, Otukpo, Nigeria.
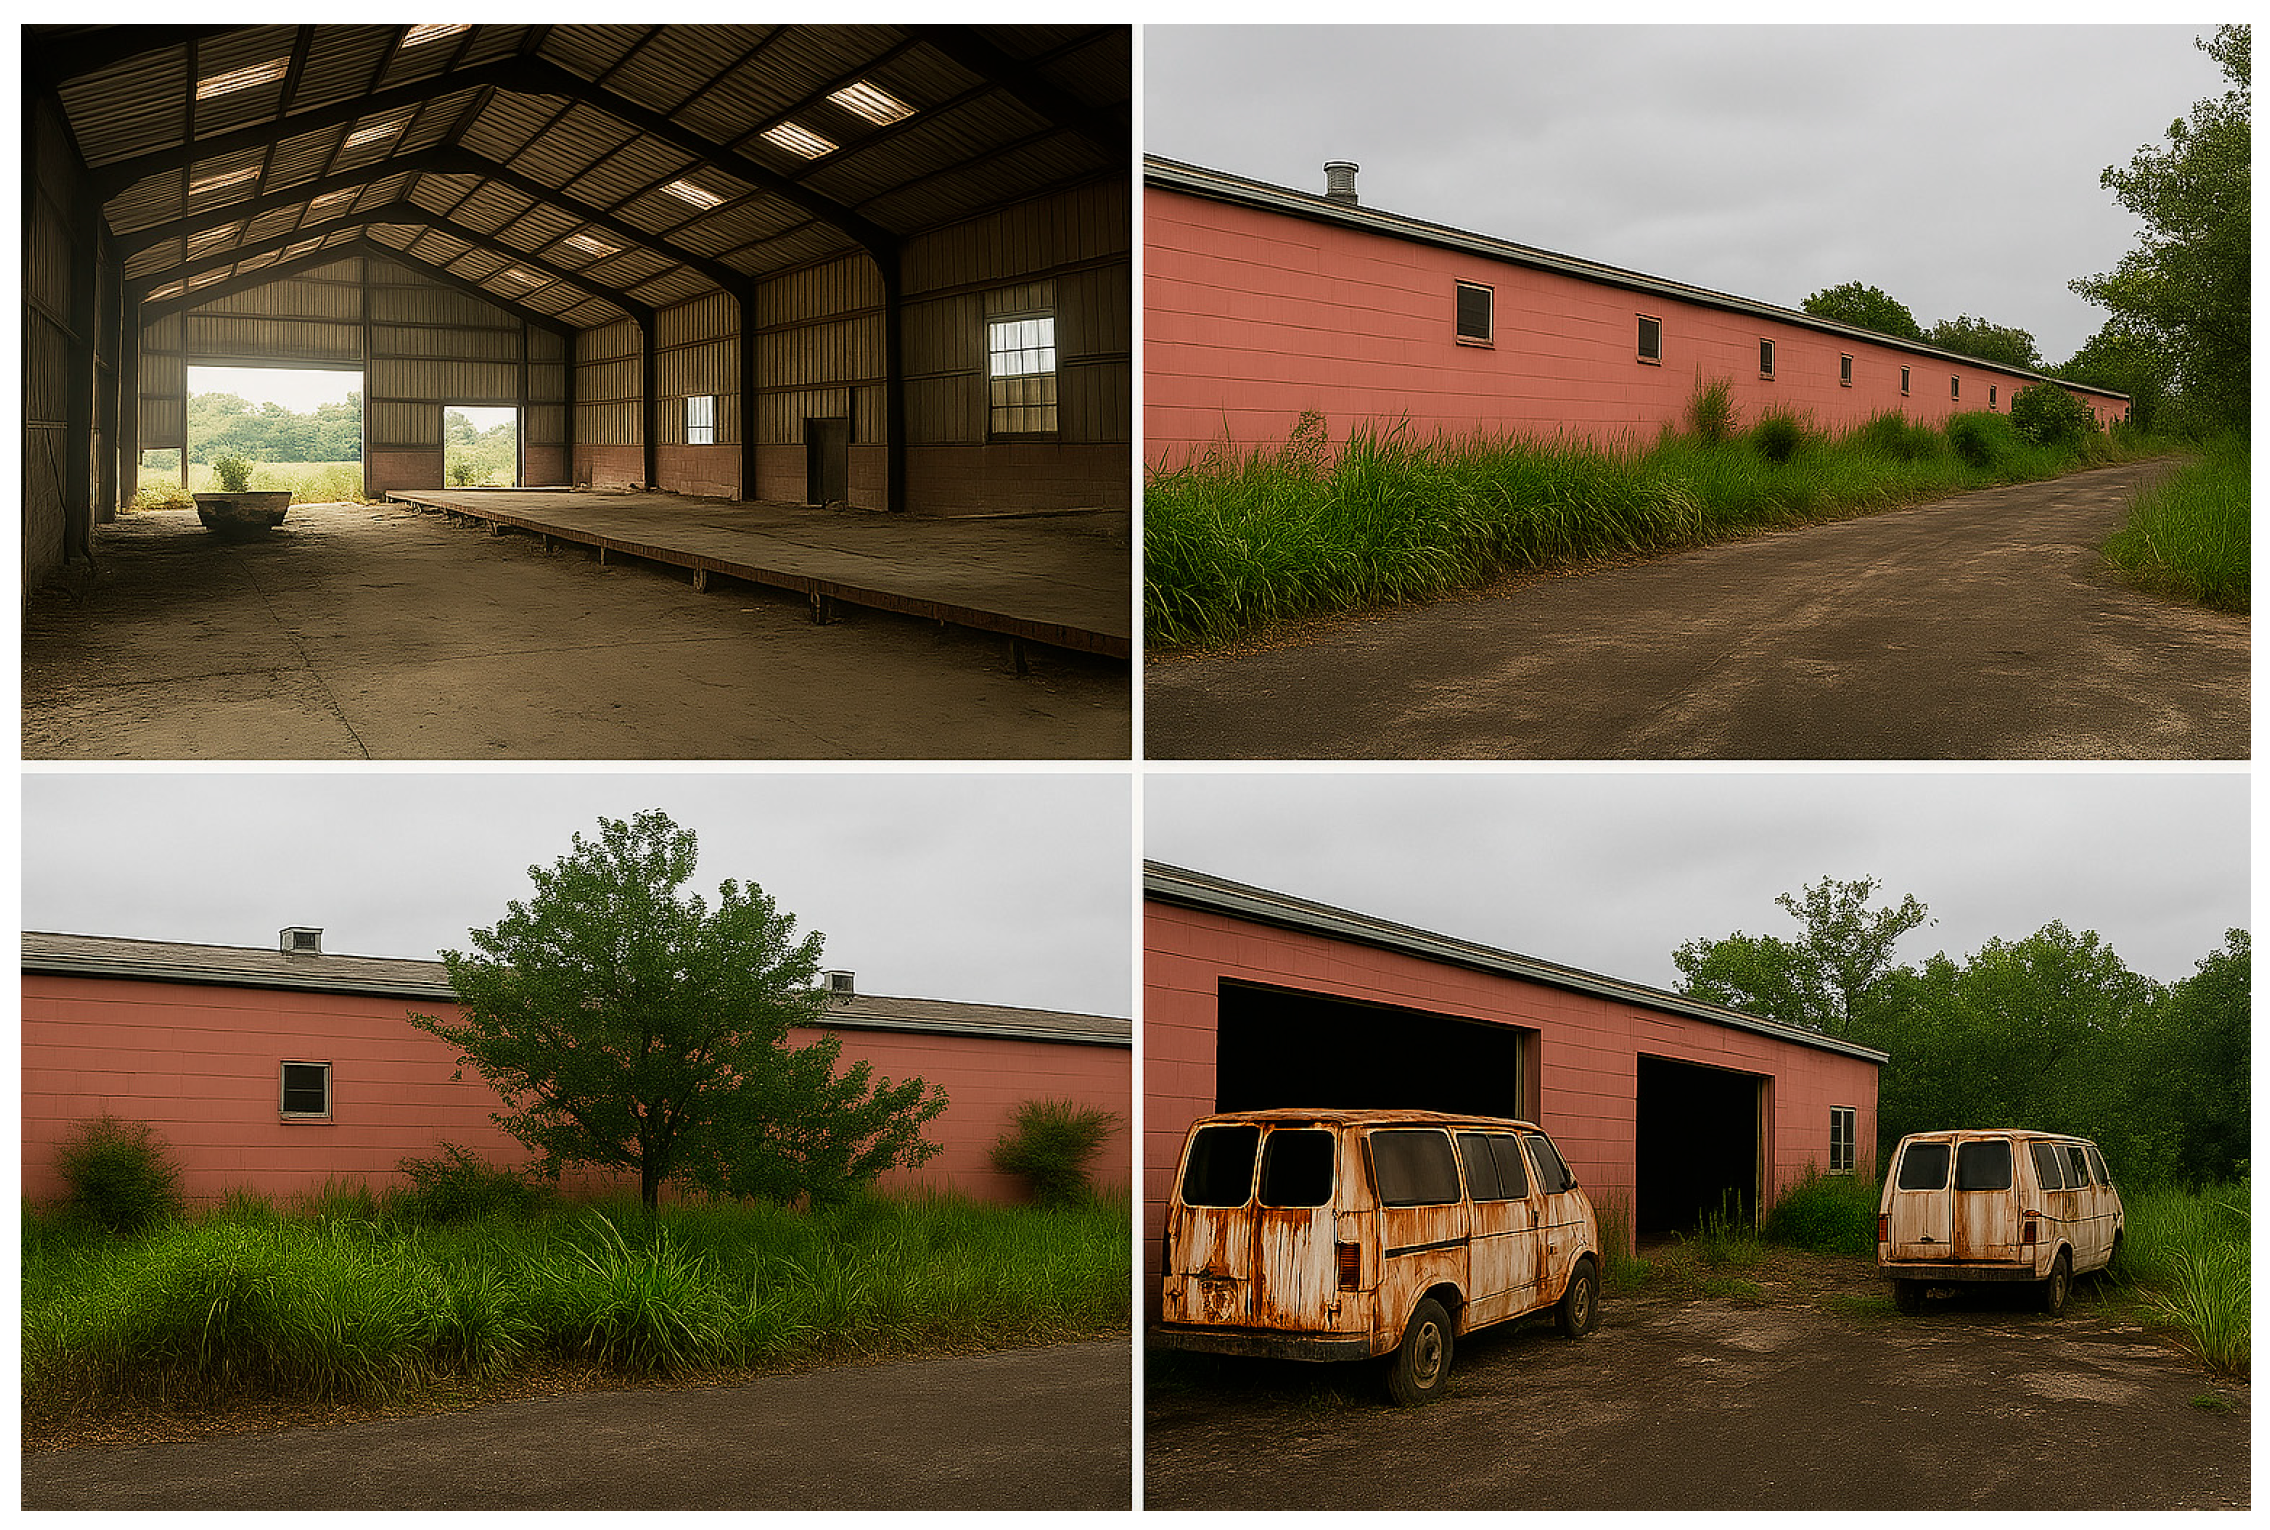
Figure 2.
Hydrolysis Test, Cement and NaOH mixing & compaction.
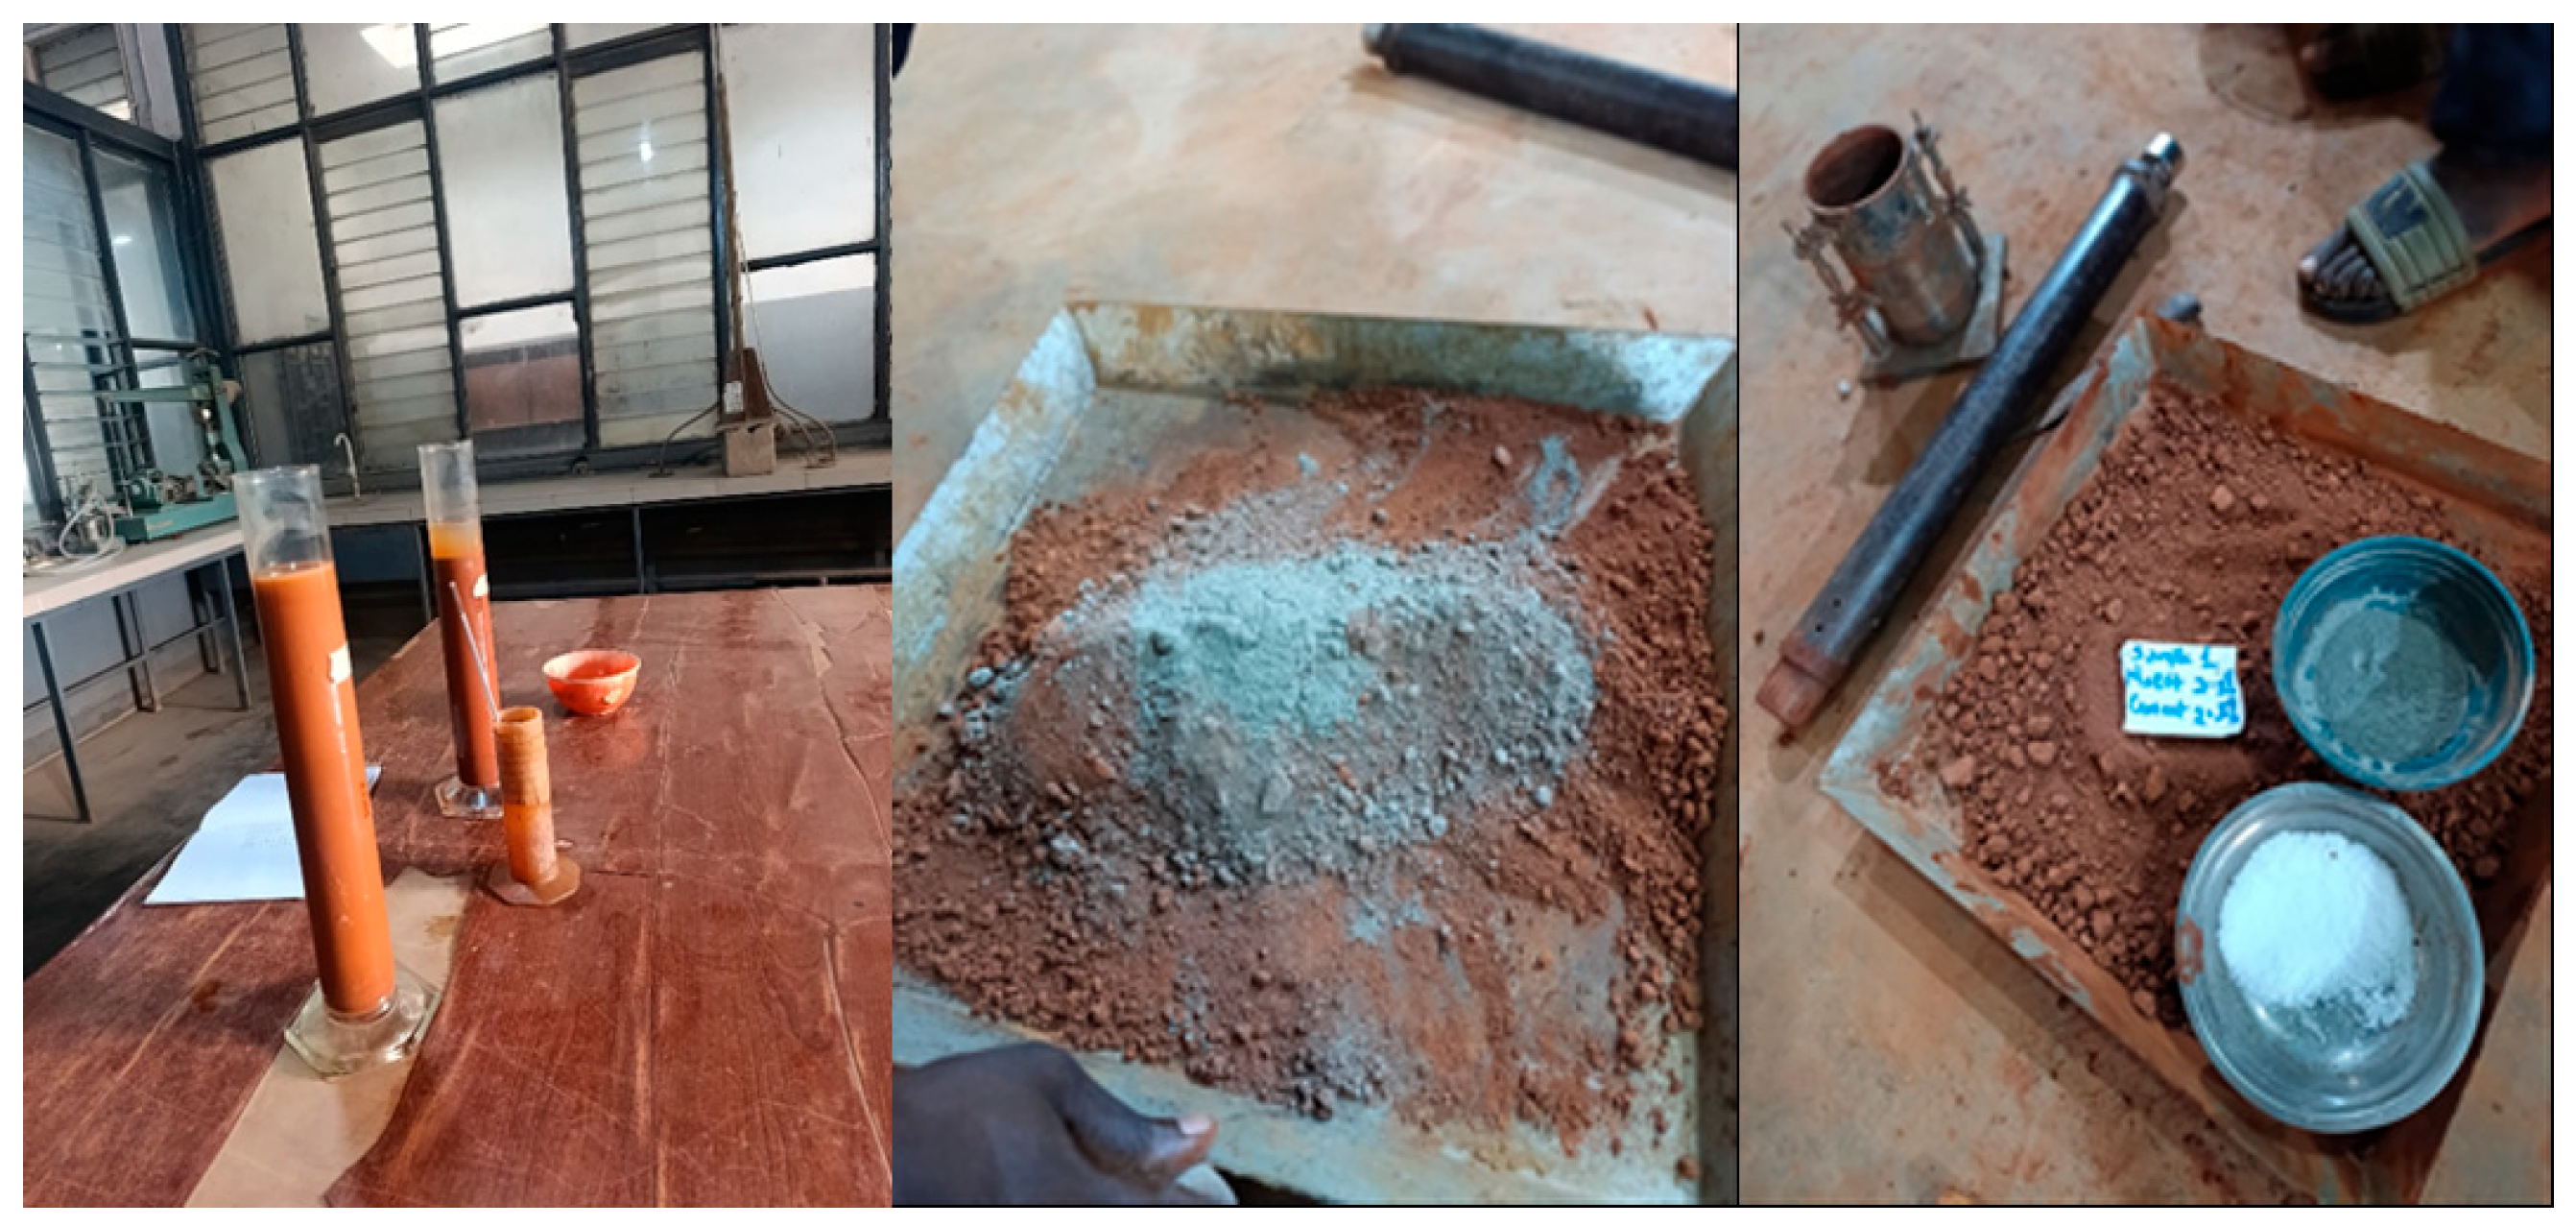
Figure 3.
Compressive strength test on cubes.
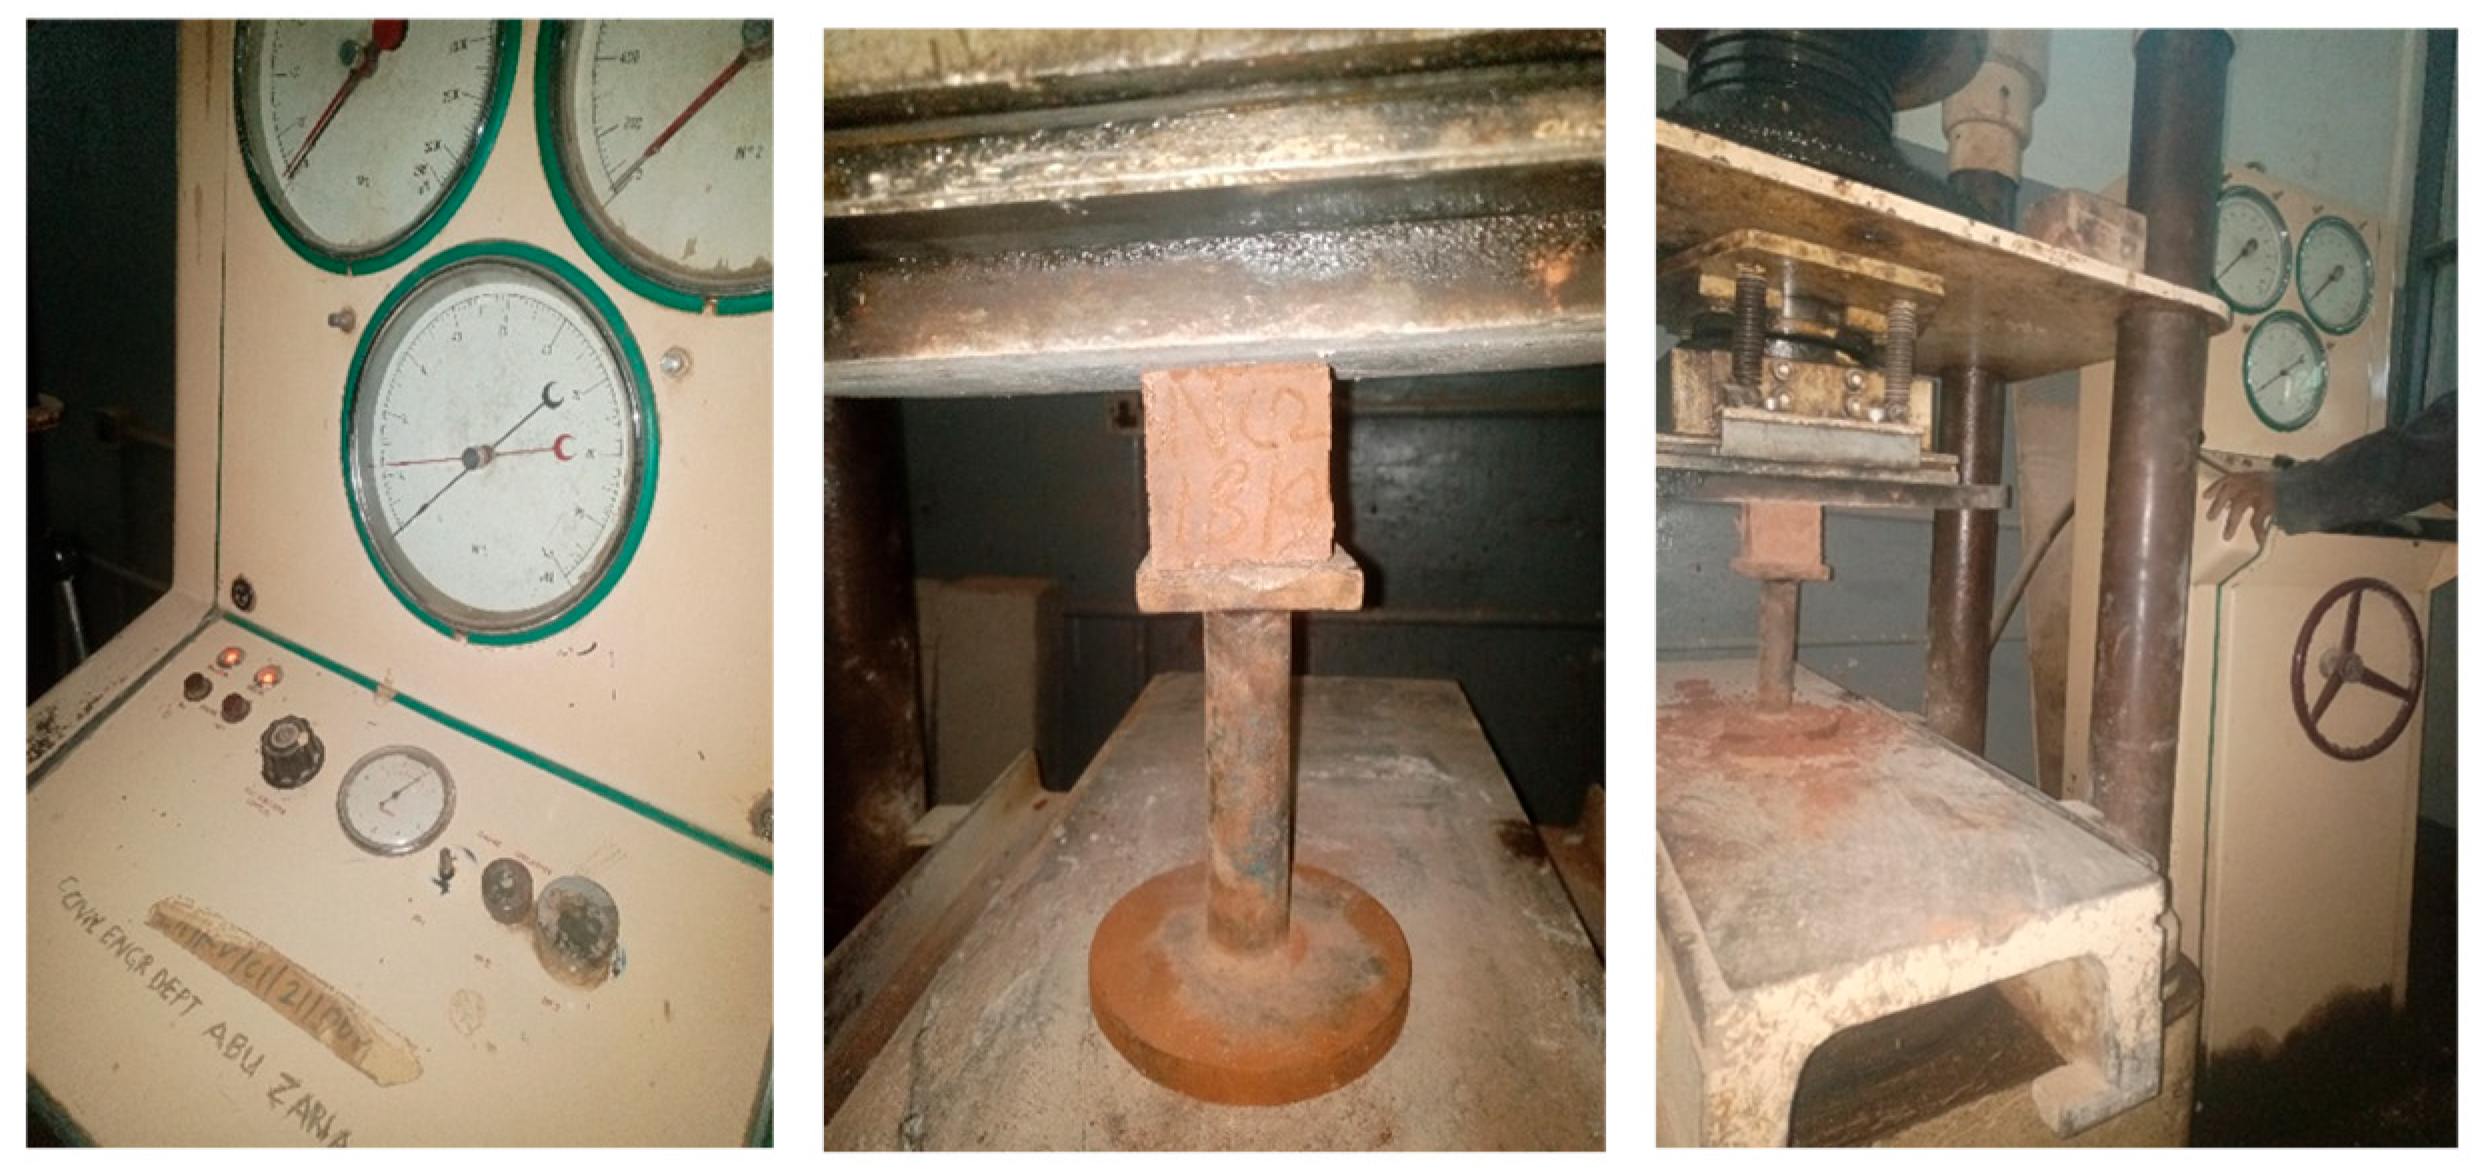
Figure 4.
X-ray diffraction (XRD) patterns for samples OT1 through OT4.
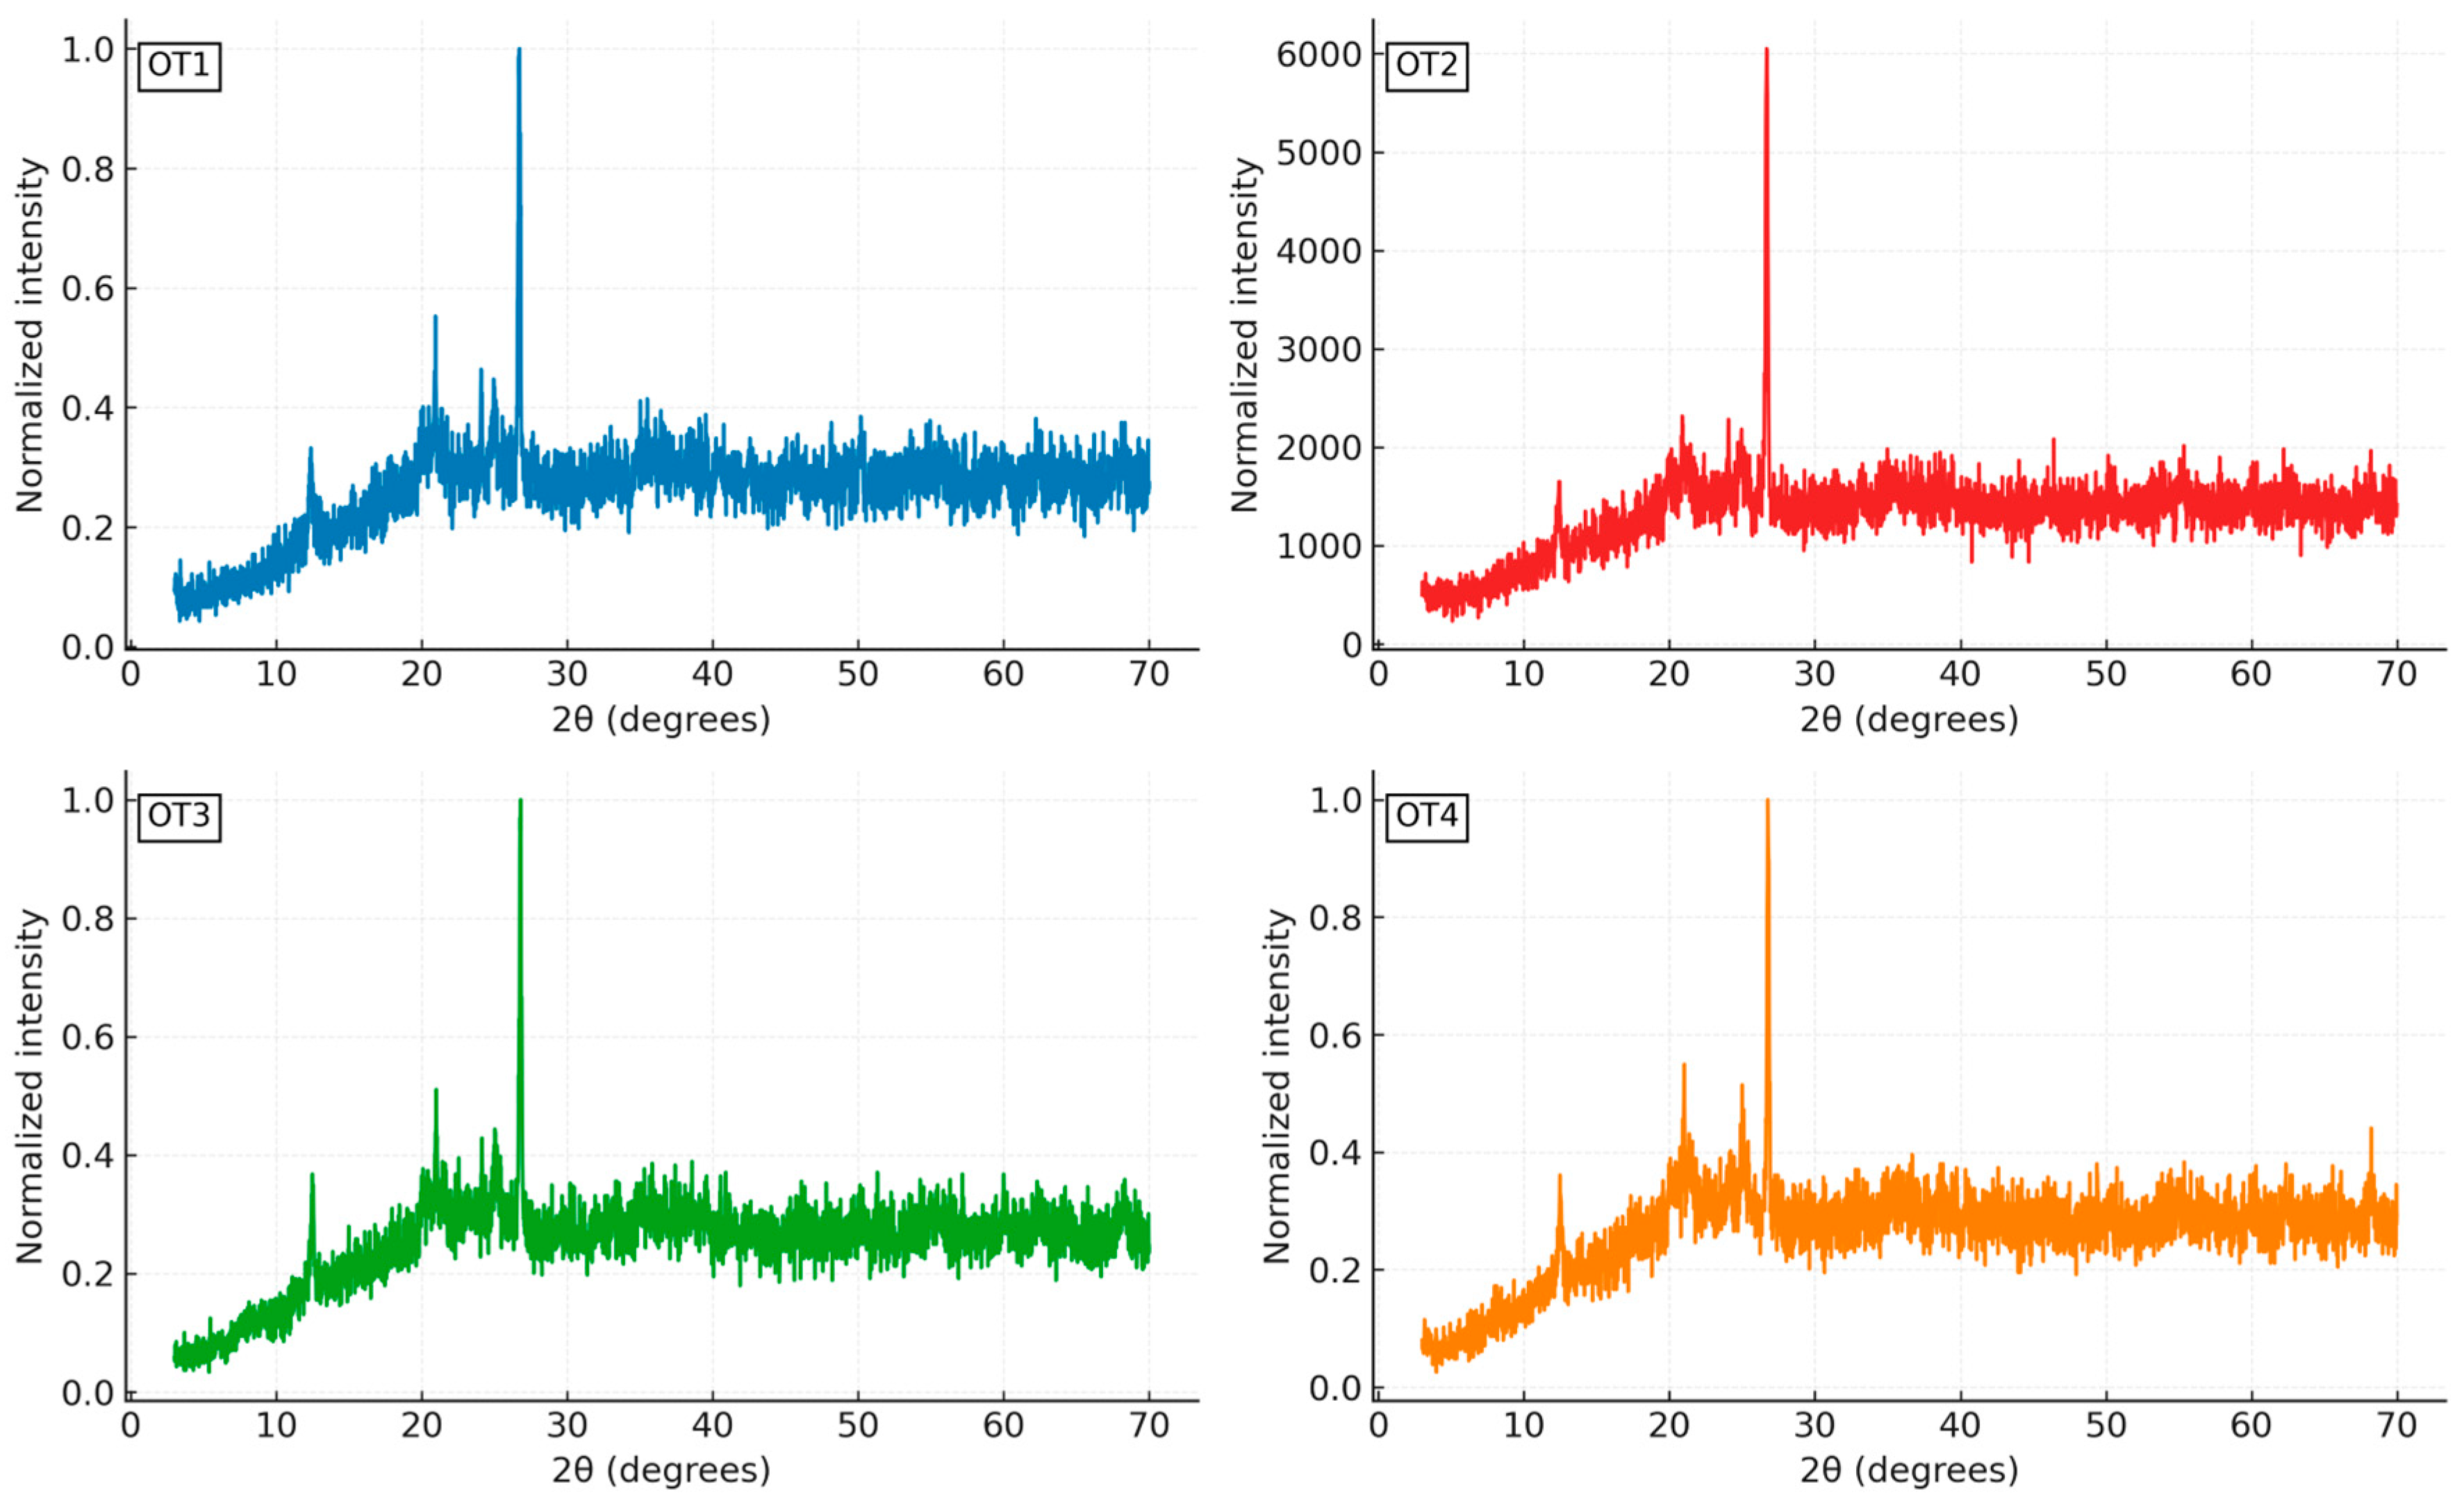

Table 1.
Sample Labels and Coordinates.
| Label | Latitude | Longitude | Date Collected | Size (Kg) |
|---|---|---|---|---|
| OT1 | 7.209435 | 8.168925 | 28 Oct 2024 | 35 |
| OT2 | 7.209435 | 8.168925 | 28 Oct 2024 | 40 |
| OT3 | 7.204419 | 8.1551943 | 30 Jul 2025 | 48 |
| OT4 | 7.2027175 | 8.1582676 | 30 Jul 2025 | 45 |
Table 2.
Minerology of the samples with average values and ranges (wt.%).
| Mineral Phase | OT1 (%) | OT2 (%) | OT3 (%) | OT4 (%) | SOKCEM1 (%) | SOKCEM2 (%) |
|---|---|---|---|---|---|---|
| Quartz | 48 ± 6 | 42 ± 8 | 47 ± 2 | 54 ± 6 | 13.6 ± 5 | 5.5 ± 3 |
| Kaolinite | — | 33 ± 7 | 31 ± 2 | 34 ± 6 | — | — |
| Orthoclase | 39 ± 6 | 5 ± 11 | 10.5 ± 8 | 6 ± 4 | — | — |
| Albite | 2 ± 5 | 11 ± 11 | 11 ± 2 | 3.7 ± 12 | — | — |
| Muscovite | 6 ± 7 | 4 ± 6 | — | — | — | — |
| Goethite | 6 ± 4 | 4 ± 5 | 0.3 ± 4 | 2.3 ± 6 | — | — |
| Calcite | — | — | — | — | 19.3 ± 19 | 31 ± 2 |
| Alite | — | — | — | — | 67.1 ± 18 | 63 ± 2 |
Table 3.
Qualitative XRD summary for OT1 to OT4.
| Phase | OT1 | OT2 | OT3 | OT4 |
|---|---|---|---|---|
| Quartz | 26.69° (101), PDF# 00-001-0649, ~55 nm | 21.23°, 26.67° (100, 101), PDF# 00-001-0649, ~57 nm | 26.67° (101), PDF# 00-001-0649, ~40 nm | 26.75° (101), PDF# 00-001-0649, ~65 nm |
| Kaolinite | 12.33° (001), unmodeled, ~25 nm | 12.42° (001), PDF# 00-001-0527, ~29 nm | 12.42° (001), PDF# 00-001-0527, ~32 nm | 12.47° (001), PDF# 04-013-3074, ~36 nm |
| Orthoclase | 20.94°, 50.08° (202, 420), PDF# 00-002-0475, ~49–95 nm | 26.67° (202), PDF# 00-002-0475, ~57 nm | — | 25.14° (202), PDF# 00-002-0475, ~66 nm |
| Albite | 24.94° (13̅1), PDF# 00-001-0739, ~11 nm | 24.91° (200), PDF# 00-003-0451, ~10 nm | 21.23° (1̅11), PDF# 00-003-0451, ~26 nm | 21.13° (100), PDF# 00-003-0451, ~39 nm |
| Muscovite | 26.69° (006), PDF# 00-001-1098, shared with Quartz | 24.91° (002), PDF# 00-001-1098, ~10–15 nm | — | Minor, overlapping with Albite |
| Goethite | Not resolved, PDF# 00-001-0401 | Not resolved, PDF# 00-001-0401 | — | 62.38° (110), PDF# 00-001-0401, ~95 nm |
Table 4.
Elemental and chemical compositions of OT1 from XRF.
| Element/Oxide | OT1 wt.% | OT3 wt.% | OT4 wt.% |
|---|---|---|---|
| Si/SiO2 | 22.702/48.567 | 23.012/49.230 | 21.836/46.713 |
| Al/Al2O3 | 12.283/23.208 | 12.916/24.403 | 10.360/19.574 |
| Fe/Fe2O3 | 15.392/22.007 | 13.766/19.681 | 18.866/26.973 |
| Ti/TiO2 | 1.643/2.740 | 2.914/2.984 | 1.803/3.008 |
| Mg/MgO | 0.226/0.375 ± 13.602 | 0.350/0.580 ± 17.996 | 0.000/0.000 ± 2.537 |
| K/K2O | 0.737/0.887 | 0.724/0.873 | 0.761/0.917 |
| Ca/CaO | 0.291/0.407 | 0.433/0.311 | 0.365/0.511 |
| Cl/Cl | 0.717/0.717 | 0.888/0.888 | 0.950/0.950 |
| S/SO3 | 0.066/0.166 | 0.190/0.195 | 0.091/0.227 |
| S + A + F | 93.782 | 93.314 | 93.26 |
Table 5.
LOI Calculation for OT3 and OT4.
| Sample | Weight of Crucible (W1) (g) | Weight of Crucible + oven-dried sample (W2) (g) | Weight of Crucible + burnt sample “after ignition” (W3) (g) | LOI (%) |
|---|---|---|---|---|
| OT3 | 67.4 | 87.4 | 86.2 | 6 |
| OT4 | 67.2 | 87.2 | 86 | 6 |
Table 6.
Water Absorption Tests Results.
| Sample | Stabilizer | Mass of Oven-Dried Sample (g) | Mass of Surface-Dried Sample (g) | Water Absorption (%) |
|---|---|---|---|---|
| OT3 | Unstabilized | 578 | Collapsed | - |
| 5% Cement | 583 | 692 | 18.69 | |
| 5% NaoH | 590 | Collapsed | - | |
| 2.5% (Cement+NaOH) | 595 | 692 | 16.3 | |
| OT4 | Unstabilized (Control) | 570 | Collapsed | - |
| 5% Cement | 630 | 750 | 19.04 | |
| 5% NaoH | 624 | Collapsed | - | |
| 2.5% (Cement+NaOH) | 625 | Collapsed | - |
Table 7.
Results of particle size distribution analyses (% passing).
| Sieve Size (mm) | OT1 (%) | OT2 (%) | OT3 (%) | OT4 (%) |
|---|---|---|---|---|
| 0.075 | 87 | 93.2 | 83 | 87 |
| 0.15 | 91 | — | 86 | 90 |
| 0.212 | 93 | — | 87 | 91 |
| 0.25 | — | 95.4 | — | — |
| 0.3 | 94 | — | 88 | 91 |
| 0.425 | 95 | 96.8 | 89 | 91 |
| 0.6 | 96 | — | 89 | 92 |
| 1.0 | — | 98 | — | — |
| 1.18 | 97 | — | 91 | 93 |
| 2 | — | 98.6 | 93 | 94 |
| 2.36 | 98 | — | — | — |
| 4.76 | 100 | — | 96 | 97 |
| 5 | — | 99.6 | — | — |
| 10 | — | 100 | — | — |
Table 8.
Physical properties and soil classification.
| LL (%) | PL (%) | PI (%) | 0%CN OMC(%) | 0%CN MDD (g/cm3) | 5% C OMC(%) | 5% C MDD (g/cm3) | 5% N OMC(%) | SG | USCS | |
|---|---|---|---|---|---|---|---|---|---|---|
| OT1 | 72 | 26 | 46 | 22 | 1.69 | — | — | — | — | Sandy fat clay (CH) |
| OT3 | 64 | 38 | 26 | 18 | 1.64 | 17 | 1.77 | 19 | 2.6 | Sandy fat clay (CH) |
| OT4 | 61 | 24 | 37 | 20 | 1.66 | 19 | 1.76 | 20 | 2.6 | Sandy fat clay (CH) |
Table 9.
UCS results for OT1, OT3, OT4.
| Treatment Type | Curing Age (Days) | OT1 UCS (kPa) | OT3 UCS (kPa) | OT4 UCS (kPa) |
|---|---|---|---|---|
| Natural (0%) | 7 | 73 | 538.3 | 566.2 |
| 14 | 87 | 762.1 | 904 | |
| 28 | 96 | 860 | 949.8 | |
| 56 | — | 1107.6 | 1399.7 | |
| 5% Cement | 7 | 153 | 1397.8 | 1002.4 |
| 14 | 240 | 937.6 | 1192.3 | |
| 28 | 512 | 1782.5 | 2003.3 | |
| 56 | — | 2223.1 | 2291.1 | |
| 5% NaOH | 7 | 75 | 735.7 | 600.9 |
| 14 | 72 | 976.7 | 1053.3 | |
| 28 | 122 | 1758.8 | 1329.1 | |
| 56 | — | 2578.5 | 2580.3 | |
| 2.5% (C+N) | 7 | — | 458.5 | 453.4 |
| 14 | — | 728.6 | 532.8 | |
| 28 | — | 889.1 | 814.7 | |
| 56 | — | 1212.4 | 1434.2 |
Table 10.
Cube strength test results for OT2.
| Binder Type | Age (Days) | OT2 (Kpa) |
OT-3 (Kpa) |
OT-4 (Kpa) |
|---|---|---|---|---|
| 0% Binder | 7 | 100 | 1520 | 650 |
| 14 | 100 | 1150 | 860 | |
| 28 | — | 670 | 1430 | |
| 5% Cement | 7 | 800 | 2840 | 2450 |
| 14 | 1100 | 2940 | 1960 | |
| 28 | — | 5100 | 5370 | |
| 5% NaOH | 7 | 200 | 1140 | 1970 |
| 14 | 300 | 2550 | 2350 | |
| 28 | — | 2930 | 2870 | |
| 2.5% Cement + 2.5% NaOH | 7 | — | 1580 | 1680 |
| 14 | — | 1880 | 1960 | |
| 28 | — | 2230 | 2280 |
Table 11.
Summary of ASTM C618 Compliance for OT1-OT4.
| Parameter | OT1 | OT2 | OT3 | OT4 | Remark |
|---|---|---|---|---|---|
| S+A+F ≥ 70 % | 93.78 | — | 93.31 | 93.26 | Pass |
| SO3 ≤ 4 % | 0.17 | — | 0.2 | 0.23 | Pass |
| LOI ≤ 10 % | — | — | 6 | 6 | Pass |
| ≤ 34 % retained on 45 µm (fineness) | 13 | 7 | 17 | 13 | Pass |
| SAI ≥75% - UCS (5% Cement@28 days) per NIS 87 | 20.48% | — | 71.30% | 80.13% | OT3/OT4 meet criterion |
| SAI ≥75% - Cube (5% Cement@14 days) per NBC | — | 68.75% | 318.75% | 335.63% |
Disclaimer/Publisher’s Note: The statements, opinions and data contained in all publications are solely those of the individual author(s) and contributor(s) and not of MDPI and/or the editor(s). MDPI and/or the editor(s) disclaim responsibility for any injury to people or property resulting from any ideas, methods, instructions or products referred to in the content. |
© 2025 by the authors. Licensee MDPI, Basel, Switzerland. This article is an open access article distributed under the terms and conditions of the Creative Commons Attribution (CC BY) license (http://creativecommons.org/licenses/by/4.0/).
Copyright: This open access article is published under a Creative Commons CC BY 4.0 license, which permit the free download, distribution, and reuse, provided that the author and preprint are cited in any reuse.


