
Submitted:
30 June 2025
Posted:
01 July 2025
You are already at the latest version
Abstract
Wine appreciation is subject to trends, dependent on wine sensory properties. The wines characterized by high ethanol content, deep colour, and dominated by oak have given pace to less alcoholic and leaner styles. Nevertheless, these changes are only supported by anecdotal evidence. Therefore, the purpose of this work was to evaluate the differences in the most preferred wine styles. The scores of Grand Gold dry red and white wines were obtained from the online data of Mundus Vini challenge. The older period ranged from 2014 to 2016 while the most recent editions ranged from 2020 to 2023. The profile of red wines was synthesized in four sensory spaces, comprising Oakiness, Harshness, Freshness, and Funkiness. Overall, most preferred wines continued to have high ethanol content and high body and were dominated by Oakiness. The main difference was related to the higher proportion of Funkiness in the wines from the more recent editions. A relatively small number of white wines were awarded Grand Gold in the latest editions. These wines were characterized by the sensory spaces of Freshness, Mellowed, Oakiness, and Funkiness. The main difference was related to the higher proportion of Oakiness in the more recent editions. Overall, the temporal analysis of Grand Gold wines did not show a significant variation in their style, continuing to be characterized by bold wines with high ethanol content, residual sugar, and oak flavors.
Keywords:
wine competitions
; consumer science
; wine styles
; sensory spaces
; wine liking
; OIV tasting sheet
; wine quality
1. Introduction
The international wine market is influenced by trends of different nature related to brand or origin reputation, heritage or culture, packaging or labeling, and sustainability or health concerns [1,2,3,4]. Irrespective of the reasons that justify the purchasing decisions, the primary factor is dependent on wine sensory features among "sensory-oriented consumers" [5]. Therefore, wine companies continuously seek to adapt their products to the most wanted wine styles [6]. As in other industries subjected to fashion, influencers play a crucial role in shaping consumer preferences [7]. The effect of the wine critic Robert Parker is considered the best example of how influencers affect the sensory features that a wine must have to achieve commercial success [5]. His best-scored red wines were high in ethanol, deep in color, high in the body, dominated by oak, with smooth mouthfeel [8]. In whites, oak or intense fresh fruitiness were the most preferred features [9]. Presently, there is a major shift globally towards lighter and refreshing wines, including white, rosé, sparkling and no-alcohol wines [8,10]. In niche markets, aged-worthy wines are no longer restricted to reds but also include whites [11,12] in what appears to be a return to the preferences described in ancient sources [13]. However, these illustrative changes, even if widely acknowledged by the popular press, have not been properly demonstrated. On the contrary, specialized magazine reviews continue to show that aged reds are better rated than aged whites or that rosés are still marginal [14]. This endeavor is not easily handled using standard sensory protocols since the same wines change in time just as the same individuals of the tasting panel are not likely to be assembled in consecutive years and to keep their preferences.
The use of online data repositories and powerful statistical approaches have made possible to interpret wine quality based on chemical composition [15]. Crowd-sourcing platforms (e.g., Vivino) have been explored to assess professional and consumer preferences [16,17,18]. Even if the quality of information may be questionable, when the available data is massive individual judgment errors tend to cancel each other out when their judgments are aggregated [17]. In addition, expert ratings collected from specialized magazines during wide time-series periods have been useful to study the effect of climate change on wine quality [19,20], to characterize the most prized sensory descriptors and to determine trends in wine types, regional popularity, age-ability or price [14].
However, magazine reports have two major limitations regarding quality evaluation besides the expected divergence among professional tasters [22]. First, the distinction between "commercial quality" and "fine wine quality" is not acknowledged [23]. Second, quality evaluation is based on the assumption that the quality standards are unchangeable during the periods under study. This drawback may explain the discrepant results when assessing the issue of climate change, as discussed by Whitnall and Alston [24]. These authors pointed out that most econometric studies show that hotter temperatures are not harmful to wine quality contrary to enological-viticultural studies. Even if a more precise weather model might be developed, another possible explanation for the apparent contradiction is that, in the former studies, quality might have been understood as the commercial one and so warmer weather tends to favor the more appreciated bolder styles. With the trend shift to leaner styles, the opposite conclusions might be obtained since their recognition would lead to a clear damaging effect of the warmer periods. Thus, the question of how particular sensory features affect wine quality, or price, in econometric studies handling uncontrolled judgments, is still to be clarified.
Wine competitions are another source of a relatively high amount of data on quality evaluation [25,26,27]. Even if the number of wines is comparatively smaller than with econometric data, the tasting protocols are more controlled and the requirement for blind tasting is guaranteed, unlike with crowdsourcing and wine guide’s results [28]. As an example, using the information from the Mundus Vini challenge, Malfeito-Ferreira et al. showed that the likelihood of being awarded a Grand Gold medal was consistent with the preference for the predictable bolder styles in reds and for exotic fruit in white wines. Given that the Mundus Vini tasting procedure has remained constant over the years and contains a flavor description, it would seem appropriate to compare the results along the different editions to find evidence of any changing trends. Therefore, the purpose of this study was to look for changes in the sensory characteristics of the wines awarded Grand Gold medals in large competitions. For that, data from the 2020 to 2023 editions were compared to the equivalent results from the 2014 to 2016 editions of the Mundus Vini wine challenge.
2. Materials and Methods
2.1. Data Obtention
The outputs of the Mundus Vini wine challenges (2020-2023 editions) were retrieved from the site https://www.meininger.de/en/mundus-vini/results (assessed from March to May 2024) as formerly described [9]. These authors provided the results from the older editions (2014-2016). Briefly, the wines were selected from the still dry wine category among those awarded Grand Gold medals. The judges were considered by the challenge organization as experts, comprising oenologists, specialist retailers, specialist journalists, and scientists from more than 40 countries in each edition. The tasting sheet followed the 100-point scheme of the International Organisation of Vine and Wine [29]. Grand Gold is awarded to wines with at least 95 points, while Gold and Silver are given when the scores are equal to or higher than 90 and 85, respectively. The number of products given an award in the competition is limited to 40 percent of the participating samples with the highest scores in their respective category. Therefore, the minimum number of points required to win a medal may increase. The published information on the number of judges and wines subjected to the recent editions is shown in Table 1.
The data obtained included the brand, winery, vintage year, price (€), basic chemical analysis (ethanol content (% v/v), residual sugar (g/L), total acidity (g/L tartaric acid)), and the sensory profile included flavor descriptors and indicators of overall quality [9]. Occasional missing values regarding chemical composition and price were replaced by values published on the producer website or in the Wine Searcher database (www.wine-searcher.com, assessed from June to September 2024).

Table 1.
Number of judges, tasted wines and respective awards retrieved from Mundus Vini website (www.meininger.de/en/mundus-vini/results).
Table 1.
Number of judges, tasted wines and respective awards retrieved from Mundus Vini website (www.meininger.de/en/mundus-vini/results).
| Edition | Number of judges | Number of wines | Grand Gold | Gold | Silver |
|---|---|---|---|---|---|
| Summer 2023 | 140 | - | 22 | 878 | 776 |
| Spring 2023 | 268 | >7500 | 70 | 1920 | 1031 |
| Summer 2022 | 130 | - | 23 | 980 | 671 |
| Spring 2022 | 264 | 7555 | 43 | 1685 | 1294 |
| Summer 2021 | >120 | >4500 | 36 | 971 | 811 |
| Spring 2021 | - | 7300 | 49 | 1546 | 1339 |
| Summer 2020 | 120 | ~4500 | 13 | 919 | 849 |
2.2. Statistical Analysis
Data were analyzed across four separate categories: chemical, sensory attributes, overall quality (body, complexity, harmony, and potential) and price. To compare the basic composition of the wines and sensory scores, an analysis of variance was performed on the chemical parameters with pair-wise mean separation by Tukey's HSD (p < 0.05). Pearson correlations were performed between sensory and chemical parameters. Given that, the periods under comparison had different numbers of wines (unbalanced design), least square (LS) means were calculated. Cluster analysis was performed using agglomerative hierarchical clustering (AHC) with Euclidean distance as dissimilarity measure and Ward’s method of agglomeration. All analysis were performed using XLSTAT® statistical analysis software version 2024.4.0 (Lumivero, Denver, USA).
3. Results
3.1. Chemical Characterization and Price of the Grand Gold Awards
3.1.1. Red Wines
The chemical parameters of Grand Gold red wines are listed in Table 2. Overall, average ethanol contents varied between 13.9 % (v/v) and 14.6 % (v/v), ranging from 12.5 % (v/v) in the 2021 Summer edition to 16 % (v/v) in the Spring editions of 2021 and 2023. The reported mean residual sugar varied from 1.9 to 3.2 g/L, with maximum values of 8.0 g/L and 11.1 g/L in two editions. The mean total acidity varied from 5.5 g/L to 5.8 g/L, attaining 7.4 and 8.2 g/L as maximum values in two editions. These values fall in the range of the chemical analysis results reported by Malfeito-Ferreira et al. for the 5 editions of Mundus Vini between Spring 2014 and Spring 2016.
Concerning ethanol content, there was only one wine with 12.5 % (v/v) (Summer 2021) while there were 5 wines with 16% (v/v), two from Spring 2021 and 3 from Spring 2023. Moreover, there were 9 wines with, or more than, 5 g/L residual sugar, over the limit of 4 g/L to be considered as dry (https://www.oiv.int/standards/international-code-of-oenological-practices/part-i-definitions/wines, assessed 18th June 2025). Therefore, the claimed trend to higher appreciation for less alcoholic and drier wines was not apparent from the competition results, in accordance with other reports using big data [30]. Like in the older editions, the recognition of Amarone style wines (e.g. high in ethanol and residual sugar), from Valpolicella or other Italian regions [31], contributed to explain these results.
The variation in retail prices demonstrated that Grand Gold red wines range from cheap wines to relatively costly wines, with mean values ranging from about 20 € to 33 €, as commonly acknowledged [32]. Nevertheless, Kaimann et al. found that prices and product ratings were significantly related when using a large amount of data from a specialized magazine. Most likely, the price range in the magazine reviewed wines is larger, but it is also known that these reviews barely underscore expensive wines to avoid discussion on their judgements.
Table 2.
Chemical analysis and price of Grand Gold red wines.
| Edition | Number of wines | Ethanol (%v/v) | Residual sugar (g/L) | Total acidity (g/L) | Price (€) | ||||
|---|---|---|---|---|---|---|---|---|---|
| Mean±sda | Range | Mean±sd | Range | Mean±sd | Range | Mean±sd | Range | ||
| 2023 Summer | 9 | 14.5±0.2 | 14.0-15.0 | 3.2±2.2 | 0.9-8.0 | 5.6±0.4 | 5.2-6.2 | 32.5±28.1 | 12-100 |
| 2023 Spring | 37 | 14.4±0.8 | 13.5-16.0 | 2.2±1.2 | 0.6-5.8 | 5.5±0.6 | 4.7-6.9 | 27.1±17.9 | 10-100 |
| 2022 Summer | 14 | 14.4±0.5 | 13.5-15.0 | 1.9±1.3 | 0.7-4.5 | 5.8±0.5 | 5.0-6.8 | 27.8±17.1 | 7.5-60 |
| 2022 Spring | 26 | 13.9±2.5 | 13.0-15.0 | 2.4±2.3 | 0.6-3.7 | 5.7±1.1 | 4.5-8.2 | 30.4±20.7 | 9-100 |
| 2021 Summer | 22 | 14.3±0.6 | 12.5-15.0 | 2.6±1.9 | 1.1-5.8 | 5.5±0.7 | 4.5-6.0 | 20.8±12.3 | 2.4-50 |
| 2021 Spring | 29 | 14.6±0.5 | 14.0-16.0 | 2.2±2.1 | 0.2-11.1 | 5.7±0.8 | 4.6-7.4 | 32.2±19.8 | 6-85 |
| 2020 Summer | 4 | 14.4±0.4 | 14.0-15.0 | 1.9±1.5 | 0.1-4.0 | 5.6±1.2 | 3.5-6.7 | 30.7±20.6 | 10.9-60 |
a Standard deviation.
3.1.2. White Wines
The chemical analysis of the Grand Gold white wines is shown in Table 3. In the Summer of 2020, there were no Grand Gold medals attributed to white wines. Given the low number of samples, the origin of the wines was also listed. The older editions presented a higher number of wines with similar chemical average values, with ethanol varying from 12.5 to 14.0 % (v/v) and occasional residual sugar over 2 g/L [9]. Therefore, the changing to more acidic styles with less ethanol was not evidenced. There seems to be much less Grand Golds awarded to white than to red wines, contradicting the claimed higher present recognition of white wines [8], even if the proportion could not be calculated since the total number of entries was not reported. These results are in accordance with the scores of another international large challenge where wines with higher ethanol and higher residual sugar were better scored [34]. Interestingly, two wines with about 6 to 8 years old were worthy of a Grand Gold (Table 3) that might indicate the return to aged white wines as described by Marasà et al. [12].
The absence of rosé wines from Grand Gold medals is in accordance with the results from another large international competition or specialized magazine reviews [14]. Thus, rosé wines appear to continue underscored when compared to dry white and red wines. The fact these wines are not expected to have aging potential might contribute to this output.
Table 3.
Chemical analysis and price of Grand Gold white wines in the 2021 to 2023 editions of the Mundus Vini challenge.
Table 3.
Chemical analysis and price of Grand Gold white wines in the 2021 to 2023 editions of the Mundus Vini challenge.
| Editions | Country/Region/Vintage | Varietya | Ethanol (%v/v) | Residual sugar (g/L) | Total Acidity (g/L) | Price (€) |
|---|---|---|---|---|---|---|
| 2023 Summer | Spain/Montilla-Moriles 2021 | Pedro Ximénez (Oak) | 14.0 | 1.4 | 7.0 | 18.9 |
| Italy/Sicily 2022 | Grillo | 13.0 | 4.0 | 6.2 | 12.7 | |
| Spain/Rioja 2017 | Viura (Oak) | 13.0 | 2.2 | - | 18.0 | |
| 2023 Spring | New Zealand/Marlborough 2014 | Pinot Gris (Oak) | 13.0 | 3.3 | 5.4 | 40.0 |
| Greece/Macedonia 2021 | Assyrtiko | 13.5 | 1.0 | 6.2 | 22.9 | |
| Greece/Crete 2021 | Vidiano | 14.0 | 1.3 | 5.6 | 16.4 | |
| 2022 Summer | Bulgaria/Daubian Plain 2021 | Sauvignon Blanc | 13.0 | 1.7 | 6.4 | 12.0b |
| 2022 Spring | Australia/Adelaide Hills 2019 | Chardonnay (Oak) | 13.0 | 1.5 | 7.6 | 23.0 |
| 2021 Summer | Luxembourg 2019 | Riesling | 12.5 | 6.2 | 6.8 | 12.9 |
| Italy/Lazio 2020 | Bellone | 13.5 | 3.0 | 6.2 | 7.0 | |
| 2021 Spring | Spain/ Mancha 2019 | Chardonnay (Oak) | 13.0 | 0.8 | 5.7 | 5.5 |
a Mention to barrique aging by the producer. b Average price from www.winesearcher.com (assessed 20th May 2025).
3.2. Sensory Characterization of the Grand Gold Awards
3.2.1. Red Wines
The average sensory characterization of the Grand Gold red wines of the 7 Mundus Vini editions from 2020 to 2023 is shown in Table 4, in comparison with the 5 editions from 2014 to 2016. The one-way ANOVA using the older and more recent editions as explanatory variables showed that higher mean scores were observed for Red berries, Cherry, Acidity, Coffee-Chocolate, Minty-Eucalyptus, Jammy, Smoky, and Green-Vegetative in latest editions. On the contrary, older editions showed higher scores for Astringency and Sweetness, while there were no differences concerning Spicy, Oak, Dried fruits, Bitterness and Barnyard. Despite these differences, the sensory features elicited similar overall quality ratings for Body, Complex and Potential, while Harmonious was perceived as slightly higher in the more recent editions.
Table 4.
Least square (LS) means and range of the scores given to Grand Gold red wines in the older and more recent Mundus Vini editions.
Table 4.
Least square (LS) means and range of the scores given to Grand Gold red wines in the older and more recent Mundus Vini editions.
| Category | Descriptor | 2020-2023 Editions | 2014-2016 Editions | Pr > Fa | ||
|---|---|---|---|---|---|---|
| Mean | Rangeb | Mean | Range | |||
| Flavor | Red berries | 5.79a | 5.97-5.62 | 5.27b | 5.53-5.01 | 0.001 |
| Cherry | 5.08a | 5.27-4.89 | 4.48b | 5.76-4.19 | 0.001 | |
| Spicy | 4.86a | 5.03-4.68 | 4.64a | 4.90-4.38 | 0.169 | |
| Acidity | 4.53a | 4.70-4.36 | 4.21b | 4.47-3.96 | 0.040 | |
| Coffee-Chocolate | 4.61a | 4.81-4.41 | 4.24b | 4.54-3.94 | 0.041 | |
| Oak | 4.09a | 4.29-3.90 | 4.10a | 4.39-3.81 | 0.993 | |
| Minty-Eucalyptus | 4.01a | 4.24-3.78 | 3.24b | 3.59-2.90 | 0.000 | |
| Astringency | 3.92b | 4.14-3.70 | 4.42a | 4.74-4.09 | 0.012 | |
| Dried Fruits | 3.96a | 4.18-3.74 | 3.74a | 4.08-3.41 | 0.284 | |
| Jammy | 3.89a | 4.07-3.70 | 3.54b | 3.82-3.27 | 0.044 | |
| Smoky | 3.74a | 3.94-3.54 | 3.07b | 3.37-2.76 | 0.000 | |
| Bitterness | 2.18a | 2.35-2.02 | 1.96a | 2.21-1.72 | 0.145 | |
| Sweetness | 2.20b | 2.38-2.02 | 2.60a | 2.87-2.83 | 0.015 | |
| Green-Vegetative | 2.15a | 2.35-1.95 | 1.52b | 1.82-1.22 | 0.001 | |
| Barnyard | 1.66a | 1.87-1.45 | 1.61a | 1.92-1.29 | 0.763 | |
| Overall evaluation | Harmonious | 6.31a | 6.45-6.16 | 6.05b | 6.26-5.83 | 0.049 |
| Body | 6.26a | 6.41-6.12 | 6.12a | 6.33-5.90 | 0.272 | |
| Complex | 6.13a | 6.28-5.99 | 6.06a | 6.28-5.85 | 0.617 | |
| Potential | 6.05a | 6.23-5.87 | 5.80a | 6.08-5.53 | 0.145 | |
a Significance set at p < 0.05 and indicated by bold font. b Range: upper bound 95%-lower bound 95%.
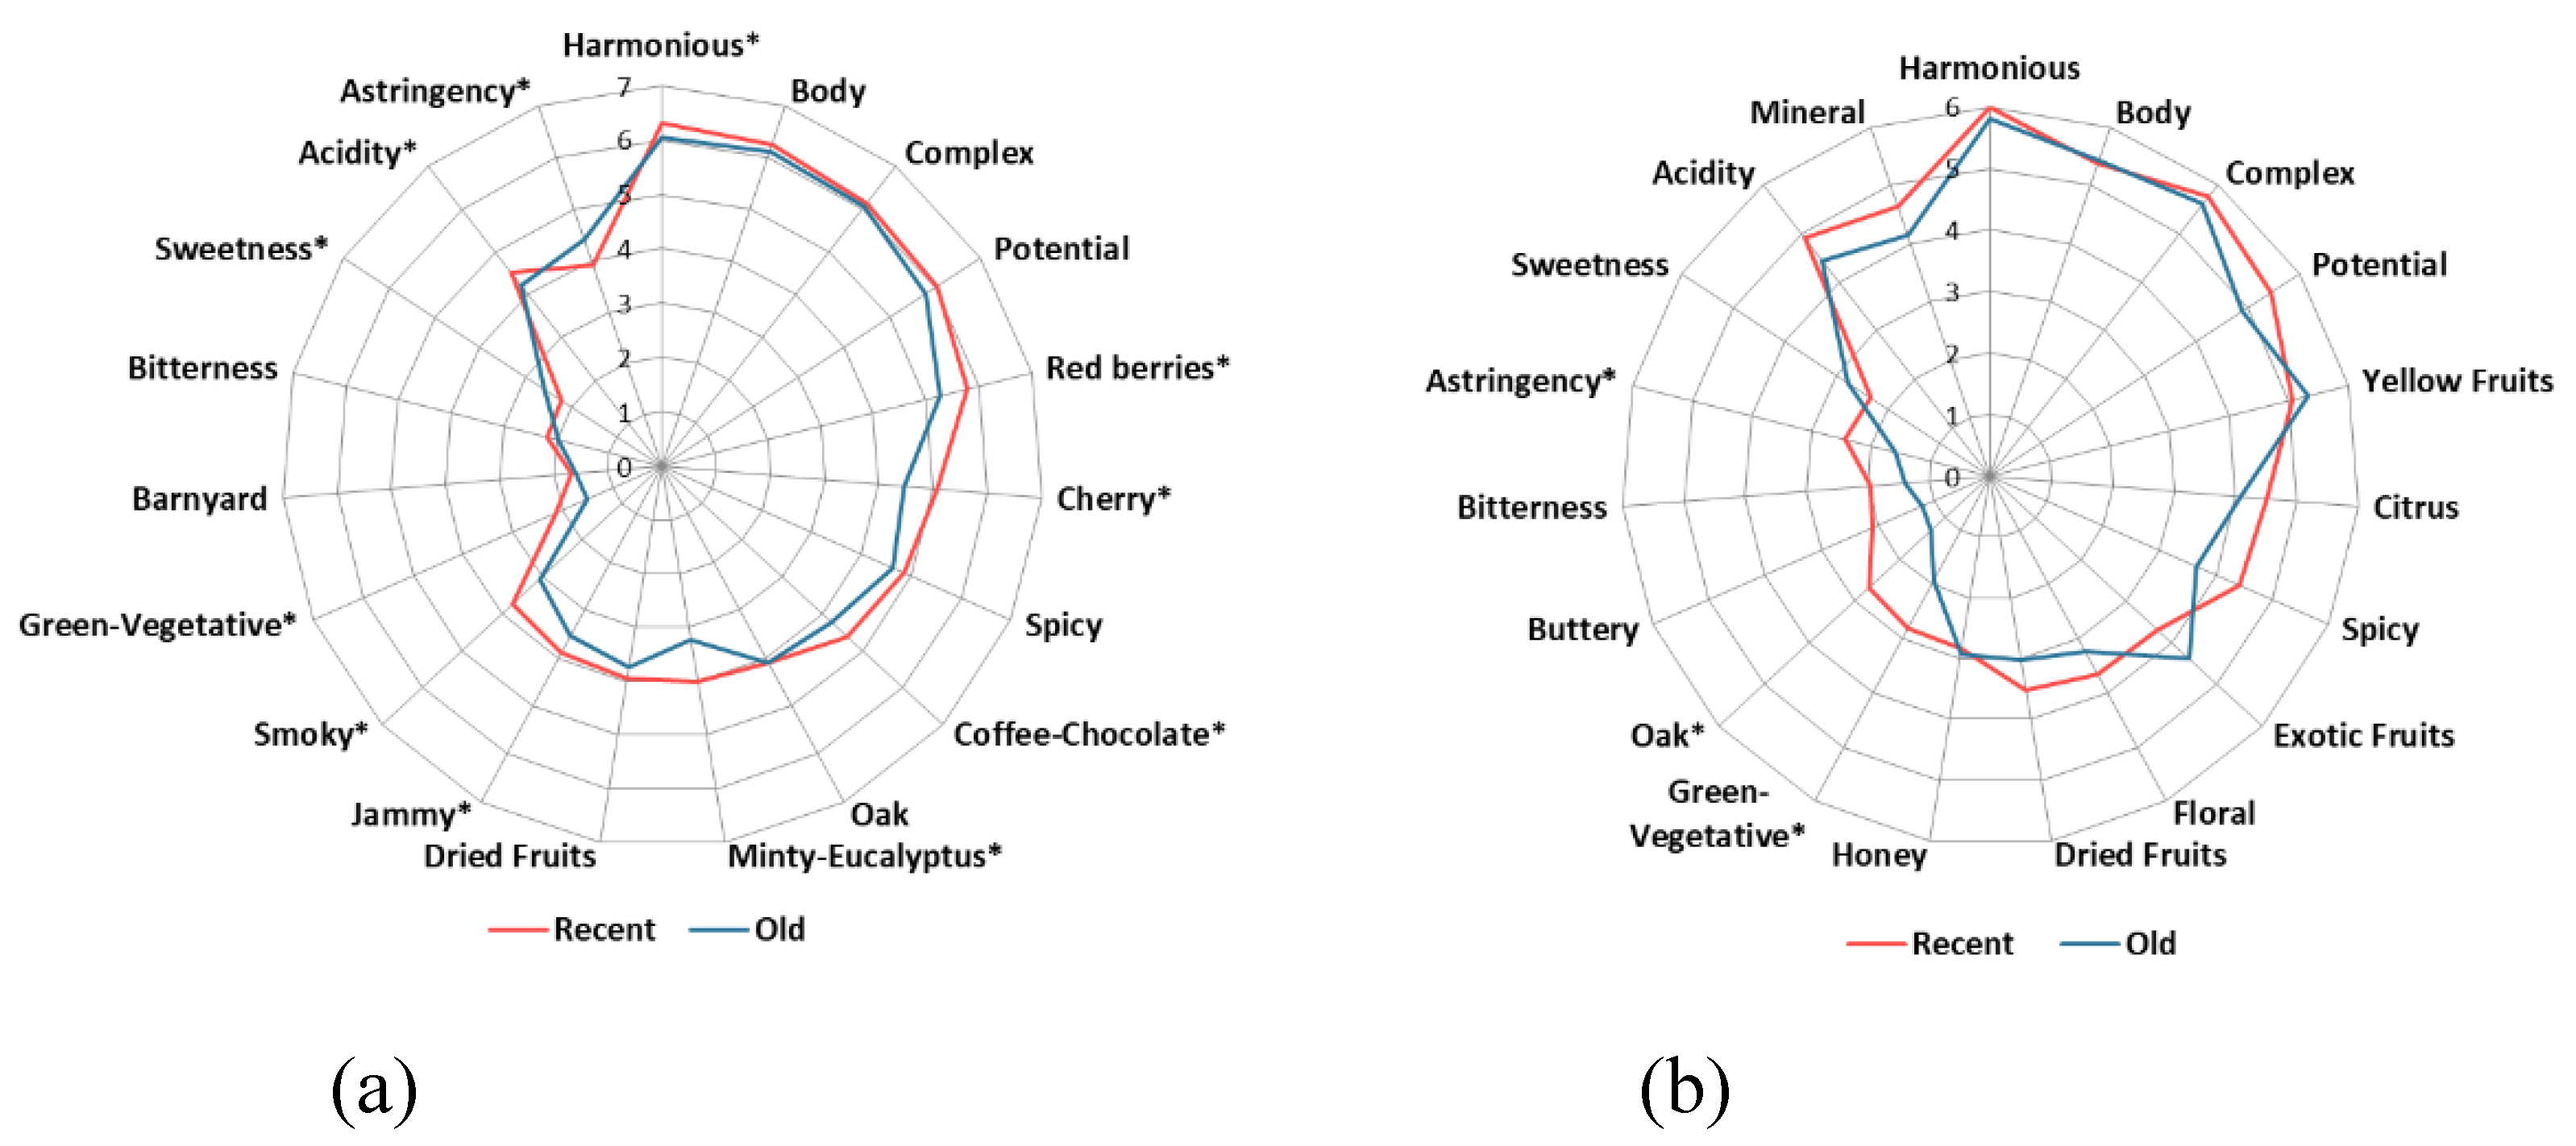
The comparison with the results of the older editions is illustrated in Figure 1a, evidencing the similarity in the flavor descriptors despite the computed statistical differences.
Figure 1.
Representation of the sensory profile and overall evaluation of the Grand Gold (a) red and (b) white wines in the older (2014-2016) and more recent (2020-2023) editions of Mundus Vini wine challenge (*, p<0.05).
Figure 1.
Representation of the sensory profile and overall evaluation of the Grand Gold (a) red and (b) white wines in the older (2014-2016) and more recent (2020-2023) editions of Mundus Vini wine challenge (*, p<0.05).
3.2.2. White Wines
The average sensory characterization of the Grand Gold white wines of the 6 Mundus Vini editions from 2021 to 2023 is shown in Table 5, in comparison with the 5 editions from 2014 to 2016. The one-way ANOVA using the older and more recent editions as factors showed that the higher mean scores were observed for Green-Vegetative, Oak and Astringency in latest editions. Despite these differences, the sensory features elicited similar overall quality ratings for all quality indicators as portrayed in Figure 1b.
Table 5.
Least square (LS) means and range of the scores given to Grand Gold white wines in the older and more recent Mundus Vini editions.
Table 5.
Least square (LS) means and range of the scores given to Grand Gold white wines in the older and more recent Mundus Vini editions.
| Category | Descriptor | 2020-2023 Editions | 2014-2016 Editions | Pr > Fa | ||
|---|---|---|---|---|---|---|
| Mean | Rangeb | Mean | Range | |||
| Flavor | Yellow Fruits | 5.07 a | 5.69-4.45 | 5.34 a | 5.85-4.82 | 0.566 |
| Acidity | 4.90 a | 5.52-4.29 | 4.44 a | 4.85-4.03 | 0.236 | |
| Mineral | 4.64 a | 5.37-3.90 | 4.14 a | 4.61-3.67 | 0.268 | |
| Citrus | 4.51 a | 5.13-3.89 | 4.08 a | 4.47-3.69 | 0.250 | |
| Spicy | 4.41 a | 5.04-3.78 | 3.66 a | 4.14-3.17 | 0.093 | |
| Exotic Fruits | 3.69 a | 4.60-2.78 | 4.38 a | 4.79-3.96 | 0.124 | |
| Floral | 3.66 a | 4.33-2.98 | 3.25 a | 3.64-2.85 | 0.290 | |
| Dried Fruits | 3.52 a | 4.48-2.56 | 3.04 a | 3.55-2.53 | 0.347 | |
| Honey | 2.84 a | 3.58-2.10 | 2.94 a | 3.43-2.45 | 0.816 | |
| Green-Vegetative | 2.82 a | 3.55-2.09 | 1.95 b | 2.37-1.52 | 0.041 | |
| Oak | 2.68 a | 4.07-1.29 | 1.32 a | 1.96-0.69 | 0.049 | |
| Astringency | 2.45 a | 3.13-1.77 | 1.59 b | 2.03-1.16 | 0.043 | |
| Sweetness | 2.34 a | 2.96-1.72 | 2.78 a | 3.20-2.36 | 0.264 | |
| Buttery | 2.11 a | 2.98-1.24 | 1.21 a | 1.70-0.73 | 0.068 | |
| Bitterness | 1.95 a | 2.55-1.34 | 1.40 a | 1.78-1.02 | 0.135 | |
| Overall Quality | Harmonious | 5.99 a | 6.63-5.36 | 5.80 a | 6.15-5.46 | 0.583 |
| Body | 5.36 a | 5.84-4.89 | 5.41 a | 5.77-5.05 | 0.885 | |
| Complex | 5.75 a | 6.23-5.26 | 5.60 a | 6.00-5.20 | 0.682 | |
| Potential | 5.46 a | 6.05-4.86 | 4.89 a | 5.37-4.42 | 0.192 | |
a Significance set at p < 0.05 and indicated by bold font. b Range: upper bound 95%-lower bound 95%.
3.3. Inference of Sensory Description from Chemical Composition
Malfeito-Ferreira et al. showed that the chemical composition of Grand Gold and Gold red wines was fairly correlated with some flavor descriptors. Indeed, Spicy, Smoky, Coffee-Chocolate and Oak were positively and highly correlated with ethanol content. Likewise, all the overall quality parameters were highly correlated with ethanol, evidencing the predicted higher appreciation for bold wines dominated by oak flavors. Then, it would be interesting to check if these correlations were still observed. Table 6 shows the correlations between the chemical composition of each wine and the values of the sensory and overall quality responses for both periods. The most relevant changes were related to the decrease in the correlations with ethanol content and residual sugar. The higher correlations with ethanol regarding Cherry, Smoky, Coffee-Chocolate in 2014-2016 editions were not observed in 2020-2023. Likewise, absent or lower correlations were obtained between residual sugar for Jammy, Dried fruits, Smoky, Coffee-Chocolate and Red berries in the more recent editions. It may be hypothesized that the perceptual interactions with chemical composition varied with time among the Grand Gold awarded wines. These results suggest that the behavior of the earlier tasting panels was better predicted from chemical composition, in accordance with the preference for the so-called high ethanol and bold “fruit bombs”.
Table 6.
Pearson correlations between the average red wine sensory and analytical measures for the older (2014-2016) and more recent (2020-2023) Mundus Vini editionsa.
Table 6.
Pearson correlations between the average red wine sensory and analytical measures for the older (2014-2016) and more recent (2020-2023) Mundus Vini editionsa.
| Variables | Residual sugar (g/L) | Total acidity (g/L) | Ethanol (%v/v) | |||
|---|---|---|---|---|---|---|
| Recent | Older | Recent | Older | Recent | Older | |
| Chemical composition | ||||||
| Residual sugar | — | — | ||||
| Total acidity | 0.230** | 0.359** | — | — | ||
| Ethanol | 0.245** | 0.404** | 0.094 | 0.374** | — | — |
| Flavor descriptors | ||||||
| Cherry | -0.267** | 0.135 | -0.079 | 0.25* | 0.029 | 0.267* |
| Jammy | -0.066 | 0.307* | -0.02 | 0.318* | 0.06 | 0.241 |
| Dried Fruits | -0.047 | 0.293* | 0.002 | 0.317* | -0.006 | 0.231 |
| Spicy | -0.026 | -0.069 | -0.012 | 0.245 | 0.007 | -0.074 |
| Smoky | -0.007 | 0.273* | -0.06 | 0.208 | -0.106 | 0.336** |
| Coffee-Chocolate | -0.062 | 0.332** | -0.017 | 0.252* | -0.003 | 0.310* |
| Oak | -0.003 | 0.13 | 0.001 | 0.055 | 0.12 | 0.048 |
| Barnyard | -0.087 | -0.01 | -0.074 | 0.11 | -0.197* | 0.205 |
| Acidity | -0.046 | -0.053 | 0.189* | -0.103 | 0.074 | -0.248 |
| Sweetness | 0.325*** | 0.576*** | 0.05 | 0.339** | 0.185* | 0.296* |
| Bitterness | -0.039 | -0.028 | -0.046 | 0.05 | -0.024 | 0.175 |
| Astringency | -0.023 | 0.078 | 0.019 | 0.166 | 0.261** | 0.126 |
| Green Vegetative | -0.131 | -0.019 | 0.033 | -0.04 | 0.064 | 0.037 |
| Minty Eucaliptus | 0.015 | 0.189 | 0.08 | 0.167 | -0.103 | 0.214 |
| Red berries | -0.13 | 0.254* | -0.091 | 0.191 | 0.044 | 0.053 |
| Overall Quality | ||||||
| Harmonious | 0.003 | -0.029 | 0.002 | -0.085 | -0.031 | -0.127 |
| Body | 0.124 | 0.093 | 0.103 | 0.252* | 0.045 | 0.14 |
| Complex | -0.022 | 0.089 | 0.129 | -0.127 | -0.041 | 0.004 |
| Potential | 0.153 | -0.027 | 0.169* | -0.024 | 0.103 | -0.086 |
a * p<0.05, **p<0.01, ***p<0.001.
Concerning white wines, there were less significant correlations among chemical and sensory parameters (Table 7). However, despite the low number of wines in recent editions, there were significant and predictable correlations between residual sugar and sweetness and total acidity and astringency [36]. As with reds, older editions showed a higher number of significant correlations.
Overall, since average chemical composition was similar between both periods, these observations justify looking for variations in the sensory profiles within Grand Gold awards.
Table 7.
Pearson correlations between the white wine sensory and analytical measures for the older (2014-2016) and more recent (2021-2023) Mundus Vini editionsa.
Table 7.
Pearson correlations between the white wine sensory and analytical measures for the older (2014-2016) and more recent (2021-2023) Mundus Vini editionsa.
| Variables | Residual sugar (g/L) | Total acidity (g/L) | Ethanol (%v/v) | |||
|---|---|---|---|---|---|---|
| Recent | Older | Recent | Older | Recent | Older | |
| Chemical composition | ||||||
| Residual Sugar | - | |||||
| Acidity | 0.028 | 0.608*** | - | - | ||
| Ethanol | -0.586 | -0.392* | -0.208 | -0.618*** | - | - |
| Flavor descriptors | ||||||
| Yellow Fruits | -0.057 | 0.365 | 0.057 | 0.322 | -0.088 | -0.001 |
| Exotic Fruits | 0.187 | -0.171 | -0.424 | -0.197 | -0.331 | 0.159 |
| Floral | 0.157 | -0.361 | -0.318 | -0.058 | -0.100 | 0.168 |
| Dried Fruits | 0.249 | 0.159 | 0.244 | 0.027 | -0.408 | 0.218 |
| Spicy | -0.481 | -0.023 | 0.333 | 0.187 | 0.175 | -0.106 |
| Honey | -0.010 | 0.060 | 0.314 | 0.113 | -0.143 | -0.038 |
| Oak | -0.164 | -0.531** | 0.346 | -0.536** | -0.291 | 0.413* |
| Buttery | -0.313 | -0.460* | 0.456 | -0.447* | -0.321 | 0.190 |
| Acidity | 0.323 | 0.332 | 0.043 | 0.555 | 0.000 | -0.541 |
| Sweetness | 0.610* | 0.216 | -0.211 | -0.047 | -0.385 | 0.005 |
| Bitterness | 0.362 | -0.363 | 0.269 | -0.131 | -0.357 | -0.020 |
| Astringency | 0.066 | -0.036 | 0.624* | 0.405* | -0.346 | -0.289 |
| Green-Vegetative | -0.058 | -0.373 | -0.268 | -0.126 | 0.269 | -0.199 |
| Mineral | 0.131 | 0.271 | 0.047 | 0.382* | -0.135 | -0.498** |
| Citrus | 0.038 | 0.081 | -0.129 | 0.016 | 0.220 | -0.222 |
| Quality variables | ||||||
| Harmonious | 0.233 | 0.138 | -0.243 | -0.033 | -0.224 | -0.021 |
| Body | -0.233 | -0.315 | -0.290 | -0.434* | -0.228 | 0.408* |
| Complex | -0.130 | -0.184 | 0.124 | -0.168 | -0.253 | 0.099 |
| Potential | -0.154 | -0.063 | -0.135 | -0.118 | -0.282 | -0.166 |
a *p<0.05, **< p<0.01, ***, p<0.001.
3.4. Wine Clustering According to Sensory Profile
3.4.1. Red Wines
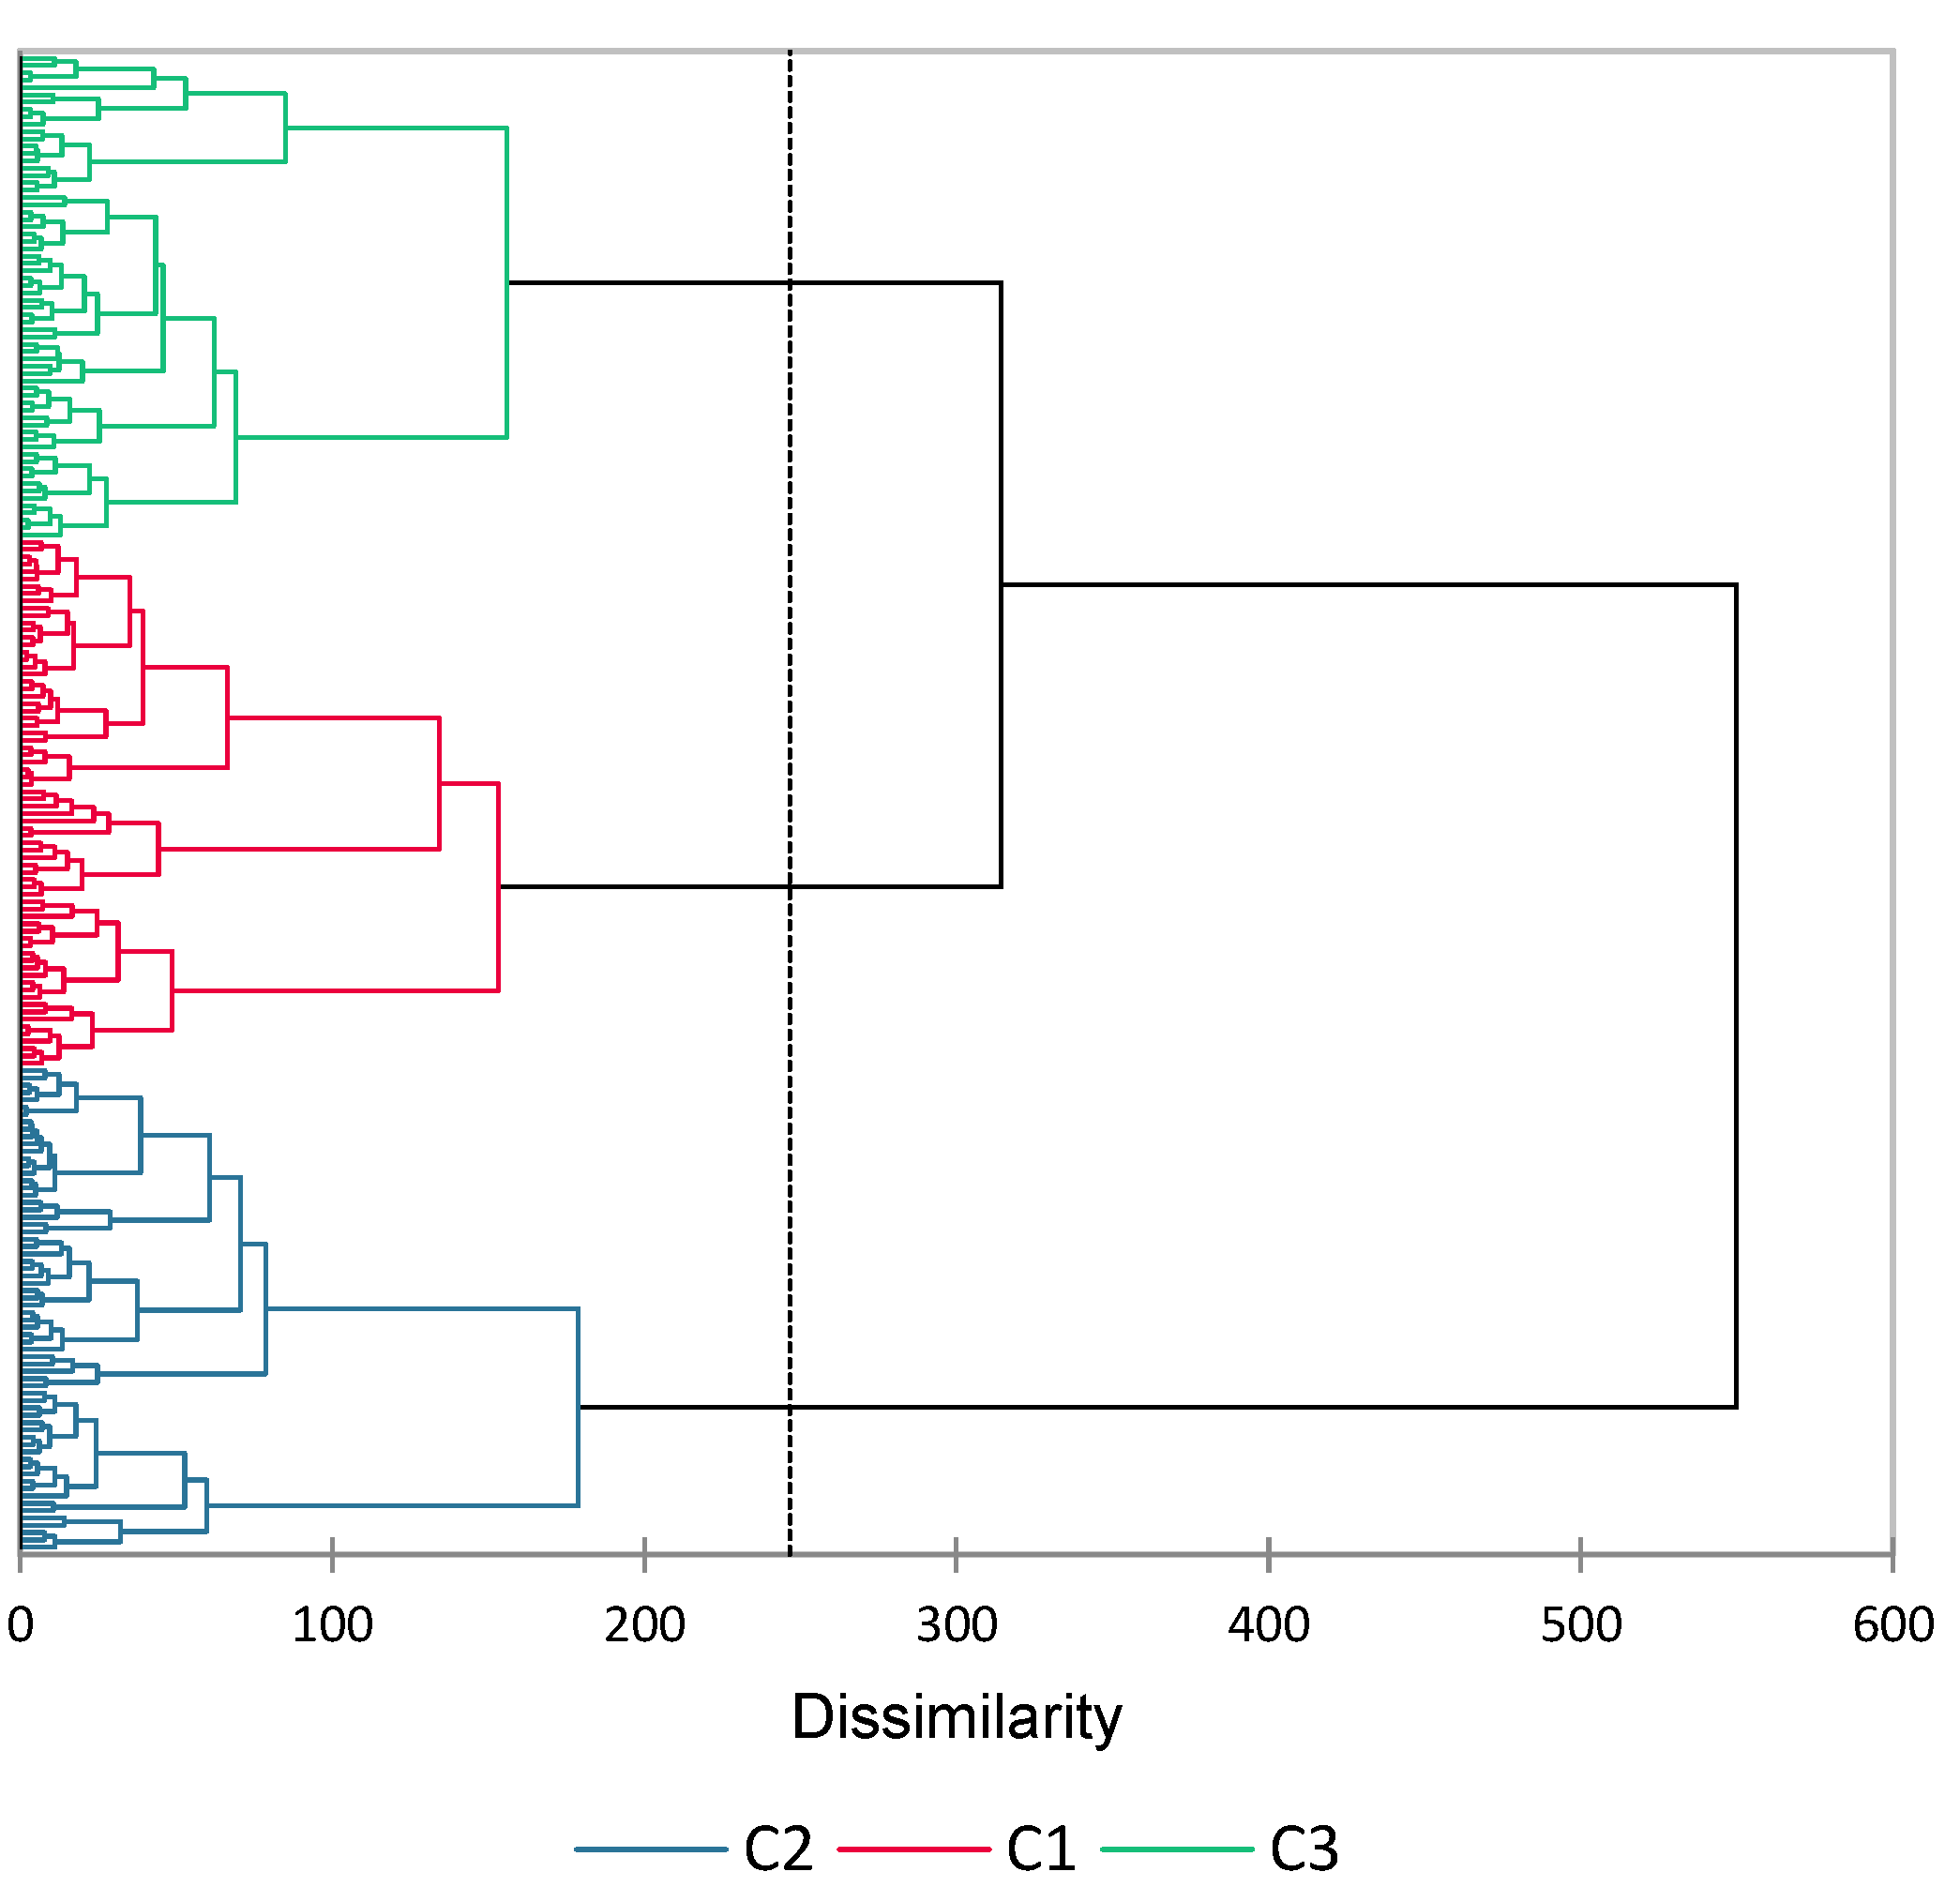
To provide a deeper insight into likely changes in the inference of quality from sensory perception, an AHC was performed for all wines in both periods as a function of the intensity of perception for each flavor descriptor. The dendogram is shown in Figure 2 evidencing the clustering of the red wines according to their flavor similarity.
Figure 2.
AHC of Grand Gold red wines according to their flavor description (wines are not referenced for the sake of clarity).
Figure 2.
AHC of Grand Gold red wines according to their flavor description (wines are not referenced for the sake of clarity).
The comparison of the flavor descriptors of each wine cluster is summarized in Table 8. The differences in flavor scores were significant for all cases evidencing that the average profile reported before (see Figure 1a) comprised different nuances. The pair-wise differences (Tukey HSD test) were observed between at least two of the clusters.
Table 8.
Flavor characterization of the Grand Gold red wines clusters.
| Flavor attribute | Cluster | Pr > F(Model) | ||
|---|---|---|---|---|
| 1 | 2 | 3 | ||
| Red berries | 4.84 b | 6.21 a | 5.92 a | <0.0001 |
| Cherry | 4.19 b | 5.27 a | 5.28 a | <0.0001 |
| Acidity | 4.31 ab | 4.29 b | 4.71 a | 0.029 |
| Spicy | 4.30 b | 5.22 a | 4.88 a | <0.0001 |
| Oak | 3.76 b | 4.24 a | 4.32 a | 0.009 |
| Coffee-Chocolate | 3.74 c | 5.25 a | 4.57 b | <0.0001 |
| Minty-Eucalyptus | 3.24 b | 5.02 a | 3.11 b | <0.0001 |
| Jammy | 3.07 c | 3.96 b | 4.38 a | <0.0001 |
| Dried Fruits | 2.93 b | 4.46 a | 4.39 a | <0.0001 |
| Smoky | 2.91 c | 4.30 a | 3.44 b | <0.0001 |
| Astringency | 3.63 b | 4.26 a | 4.37 a | 0.001 |
| Sweetness | 2.10 b | 2.28 ab | 2.60 a | 0.024 |
| Bitterness | 1.75 b | 2.31 a | 2.32 a | 0.000 |
| Green-Vegetative | 1.47 b | 3.158 a | 1.29 b | <0.0001 |
| Barnyard | 1.31 b | 2.236 a | 1.42 b | <0.0001 |
a Bold font indicates significant differences (p<0.05) among LS means. b Different letters in the row indicate pair-wise differences (p<0.05) by the Tukey HSD test.
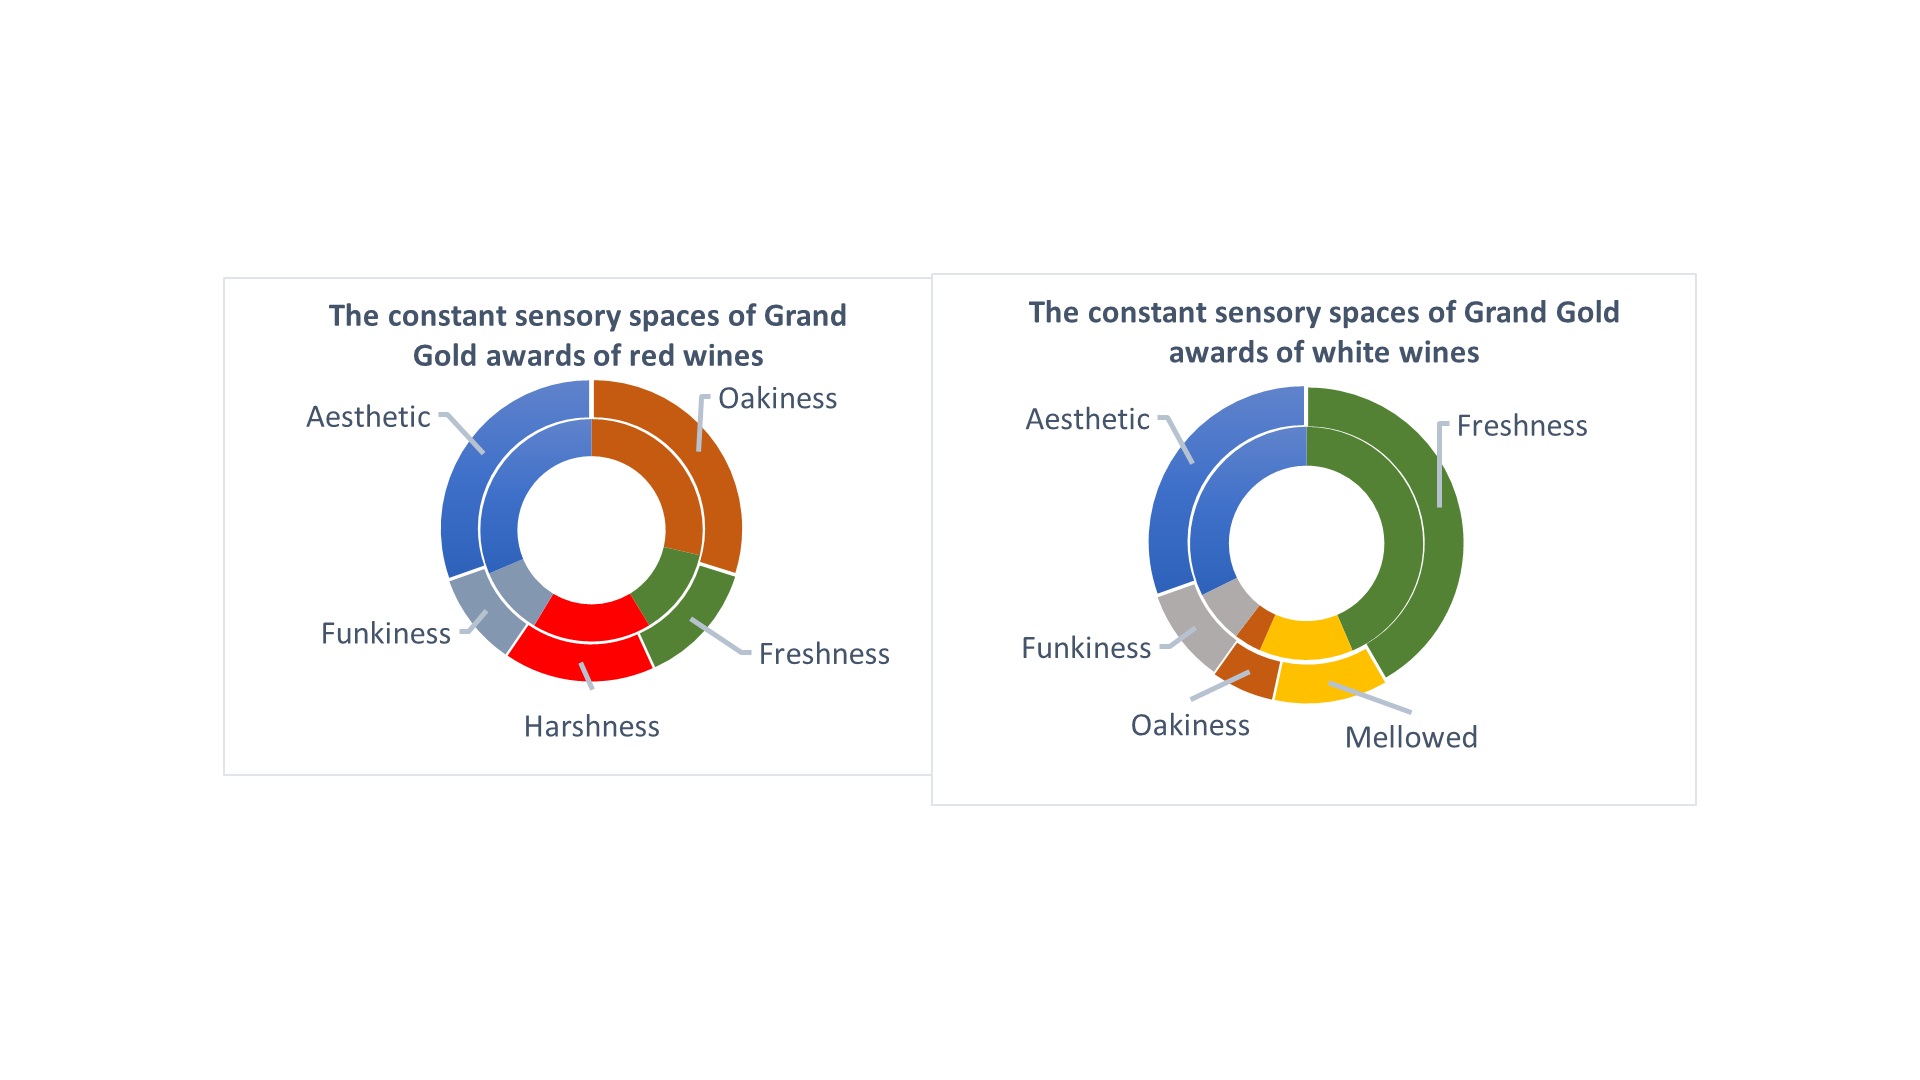
The AHC now using the flavor scores as variables is shown in Figure 3. When the dendogram was partitioned in 4 clusters, each cluster could be attached to a sensory space in a fair consistent form [37]. Cluster 1 included the typical descriptors of red wines fresh fruit (Cherry, Red berries) and was coined as Freshness. Cluster 2, named as Oakiness, included aromas related to oak ageing (Oak, Coffe-chocolate, smoky, dried fruits, minty-eucalyptus) and over ripen fruit (dried fruits, jammy), as broadly reported by others [39]. Cluster 3 corresponded to the taste perception of Acidity and the mouthfeel sensation of Astringency, as expected [40], and was called Harshness. The aroma Spicy appeared in this cluster without any known perceptual inference with these two in-mouth perceptions. Finally, cluster 4 was composed by wine flaws (Green-vegetative, Bitterness, Barnyard) and Sweetness that may interact among each other [40]. The cluster was defined as Funkiness, since this concept reflects the perception of flavors associated to off-flavors but that do not penalize wine appreciation [41].
Figure 3.
AHC of the flavor descriptors Grand Gold red wines from 2014-2016 and 2020-2023 editions (C1, Freshness; C2, Oakiness; C3, Harshness; C4, Funkiness).
Figure 3.
AHC of the flavor descriptors Grand Gold red wines from 2014-2016 and 2020-2023 editions (C1, Freshness; C2, Oakiness; C3, Harshness; C4, Funkiness).
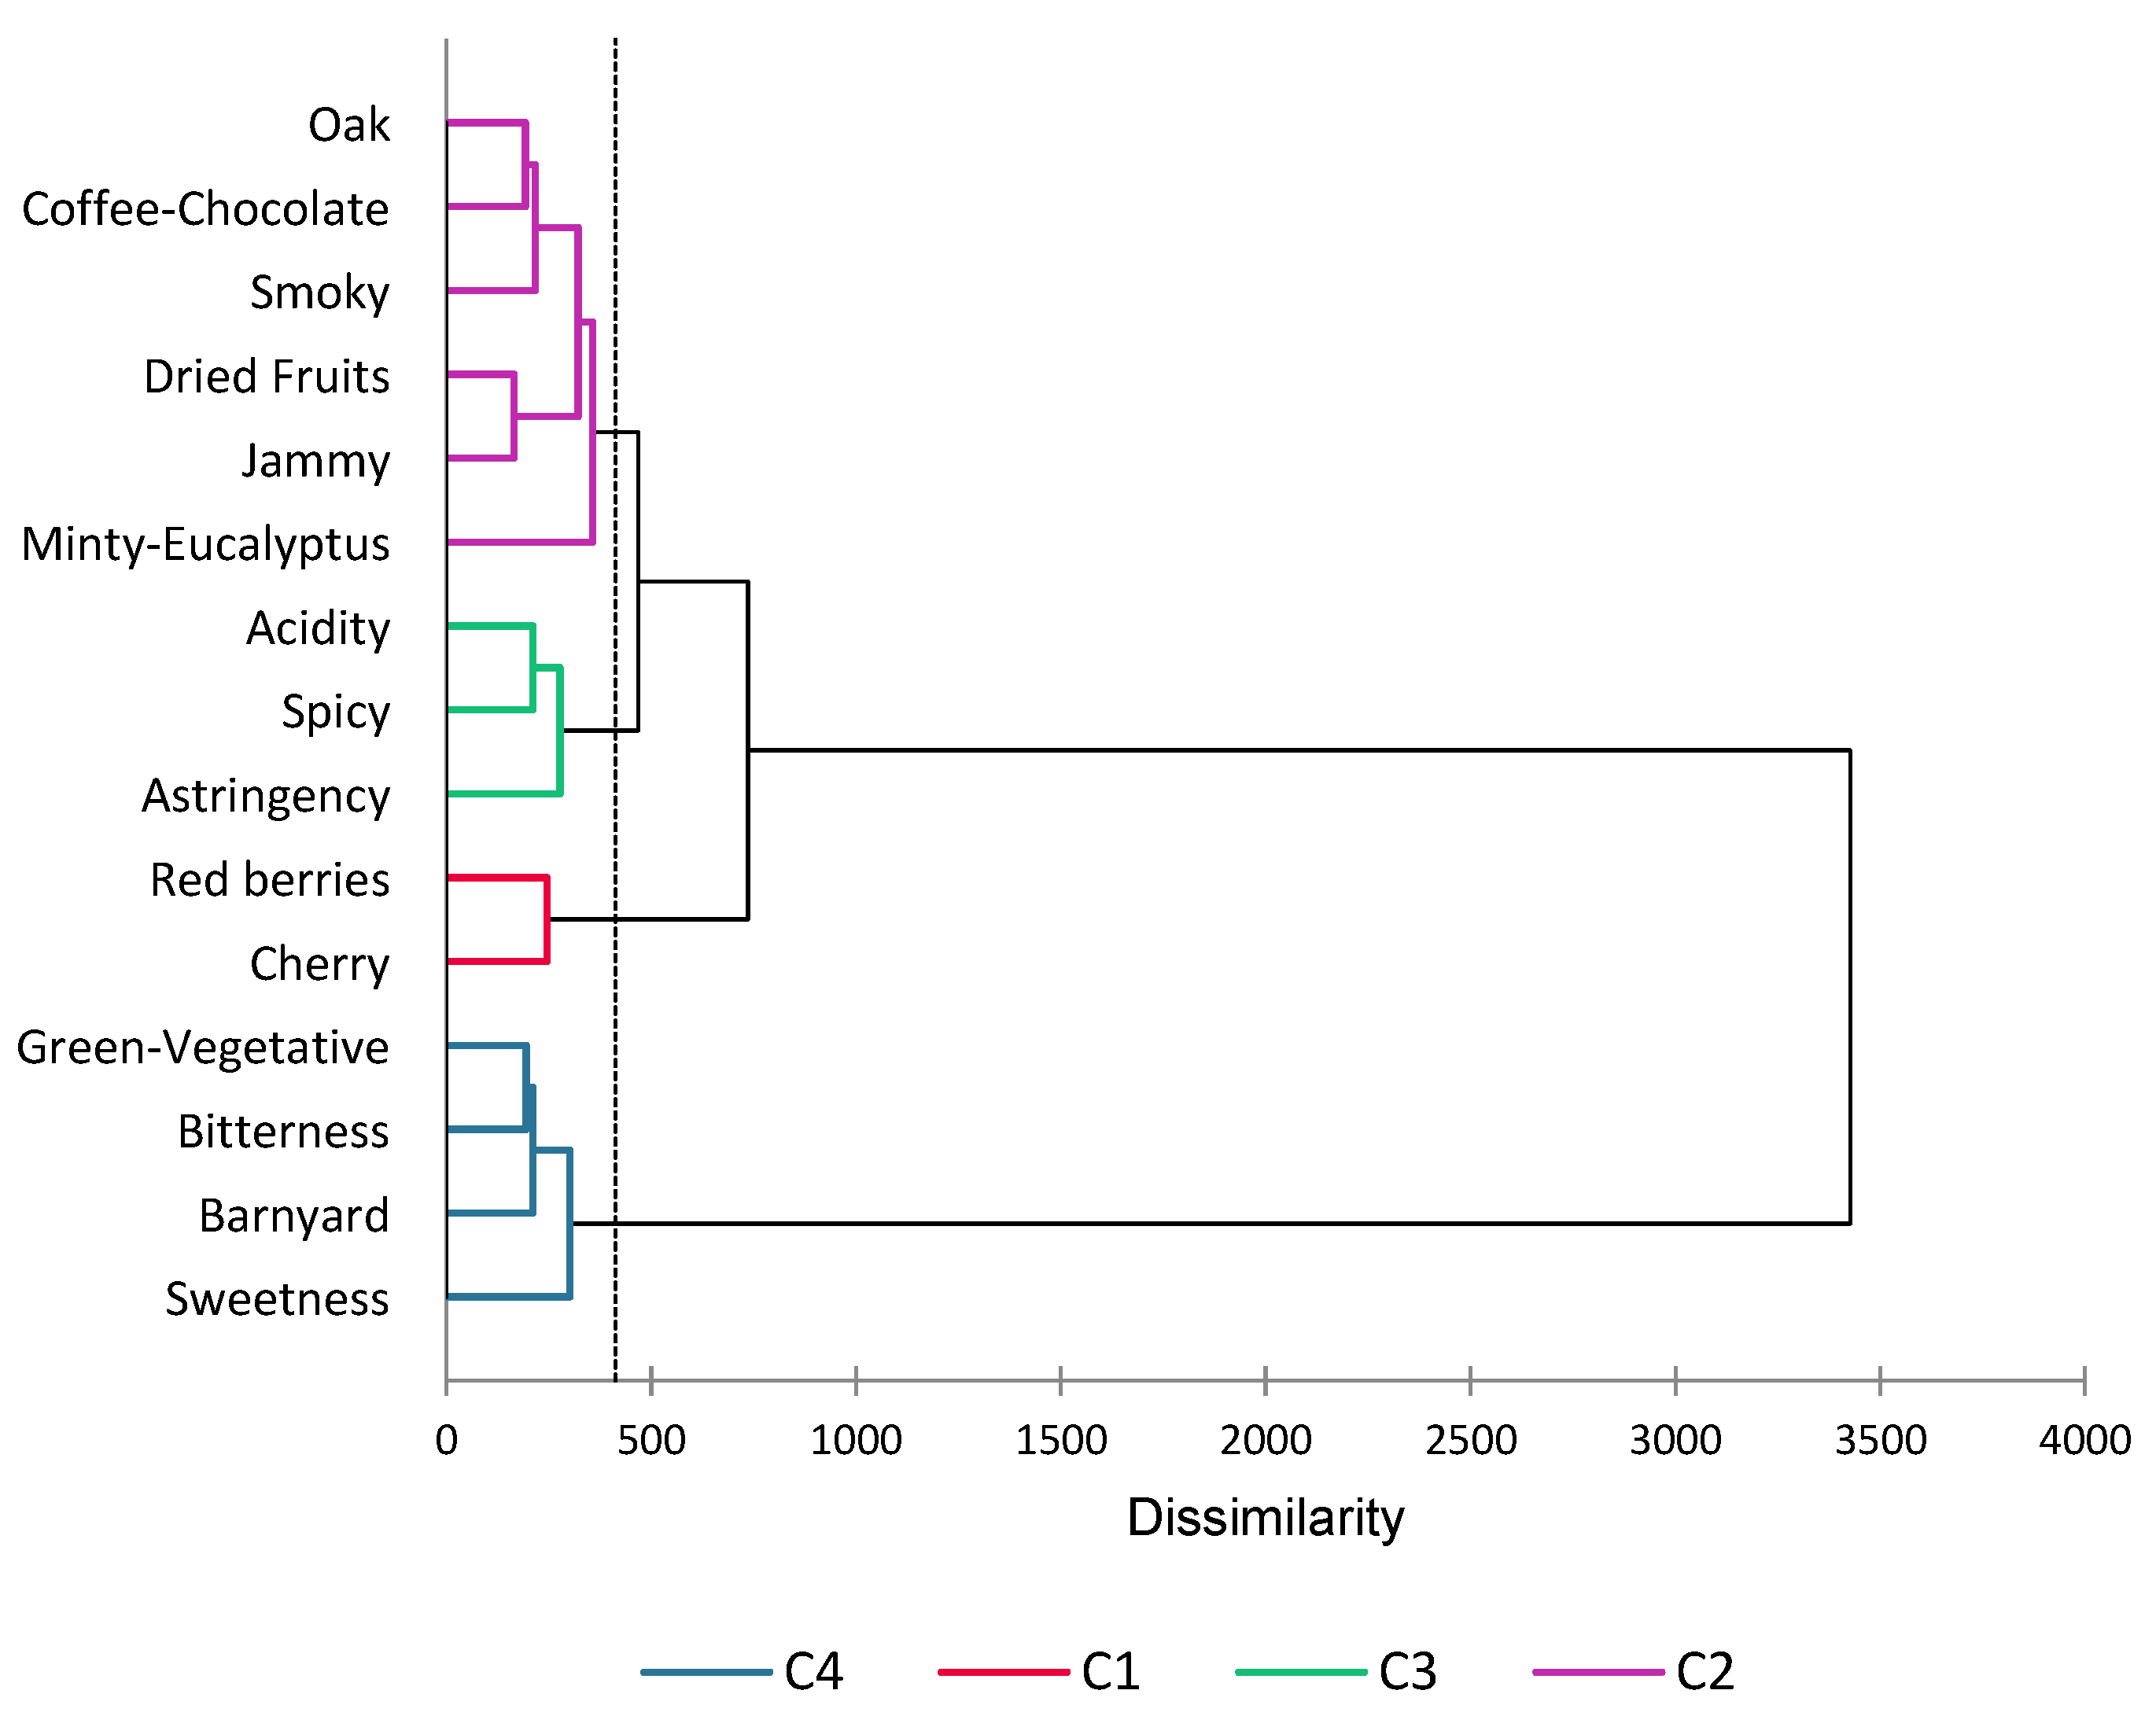
Overall, the similarities obtained by AHC were predictable and so these flavor families may be understood under the concept of sensory conceptual spaces, which are in accordance with the synthetic nature of flavor perception [23]. Then, the weight of each family in the aroma profile of each cluster may be calculated by the sum of the scores of each flavor. The results are listed in Table 9 together with the corresponding overall quality, price and chemical composition. The results showed that only harmonious was slightly different among the wine clusters.
Table 9.
Sensory, quality and chemical characterization of the Grand Gold red wines clustered according to their flavor description.
Table 9.
Sensory, quality and chemical characterization of the Grand Gold red wines clustered according to their flavor description.
| Category | Family | Cluster | Pr > F(Model)a | ||
|---|---|---|---|---|---|
| 1 | 2 | 3 | |||
| Flavor | Oakiness | 19.62b c | 27.23 a | 24.19 b | <0.0001 |
| Harshness | 12.25 b | 13.78 a | 13.96 a | <0.0001 | |
| Freshness | 9.01 b | 11.48 a | 11.20 a | <0.0001 | |
| Funkiness | 6.64 c | 9.99 a | 7.62 b | <0.0001 | |
| Quality | Body | 6.03 a | 6.26 a | 6.37 a | 0.064 |
| Harmonious | 6.01 b | 6.23 ab | 6.46 a | 0.011 | |
| Complex | 5.92 a | 6.21 a | 6.23 a | 0.063 | |
| Potential | 5.79 a | 6.14 a | 6.01 a | 0.173 | |
| Price | 27.6 a | 26.7 a | 41.6 a | 0.162 | |
| Chemical | Residual Sugar | 2.4 a | 2.1 a | 2.8 a | 0.132 |
| Acidity | 5.5 a | 5.7 a | 5.6 a | 0.462 | |
| Ethanol | 14.3 a | 14.4 a | 14.4 a | 0.722 | |
a Bold font indicates significant differences (p<0.05) among LS means. b Different letters in the row indicate pair-wise differences (p<0.05) by the Tukey HSD test.
Szolnoki and Hoffmann also found 3 sensory clusters that influenced differently the quality of Bordeaux wines. Highest quality was associated to full-body wines dominated by oak, while other two clusters (fresh wines and perfumed wines) gathered wines with lower quality scores. In the present work, the sensory clusters corresponded to a deeper distinction among the highest quality scores (Table 10). Therefore, among the bold Grand Gold dry red wines dominated by Oakiness: (a) Cluster 1 included cleaner and smoother wines, with less intensity and harmony; (b) Cluster 2 involved wines with higher funky notes, dominated by oak; (c) Cluster 3 comprised samples with noticeable oak and less Funkiness. These results evidence a sensory continuum among the Grand Golds wines mainly modulated by the perception of Oakiness and Funkiness. The number of wines of the 3 clusters is shown in Table 10, evidencing higher percentages of cleaner wines in the older editions and of funkier ones in the recent editions. These observations are in accordance with the present higher leniency of the wine press towards the perception of off-flavors [42]. Even among experts, the association of faults with organic mode of production was shown to elicit higher quality scores under controlled experiments [43].
Table 10.
Synthetic characterization and percentage composition of the wines clusters of the recent and older editions of the Mundus Vini challenges (number of wines between brackets).
Table 10.
Synthetic characterization and percentage composition of the wines clusters of the recent and older editions of the Mundus Vini challenges (number of wines between brackets).
| Wine cluster | 2020-2023 Editions | 2014-2016 Editions | Synthetic description |
|---|---|---|---|
| 1 | 29.1 (41) | 49.2a (31) | Less intense and harmonious, smoother and cleaner wines |
| 2 | 39.0 (55) | 17.5 (11) | Harmonious bold wines dominated by oak with funky nuances |
| 3 | 31.9 (45) | 33.3 (21) | Harmonious bold wines dominated by oak with less funky nuances |
| All | 100 (141) | 100 (63) | Bold wines dominated by oakiness |
a Bold number indicates higher proportions in the row by Chi-square test at p < 0.05.
3.4.2. White Wines
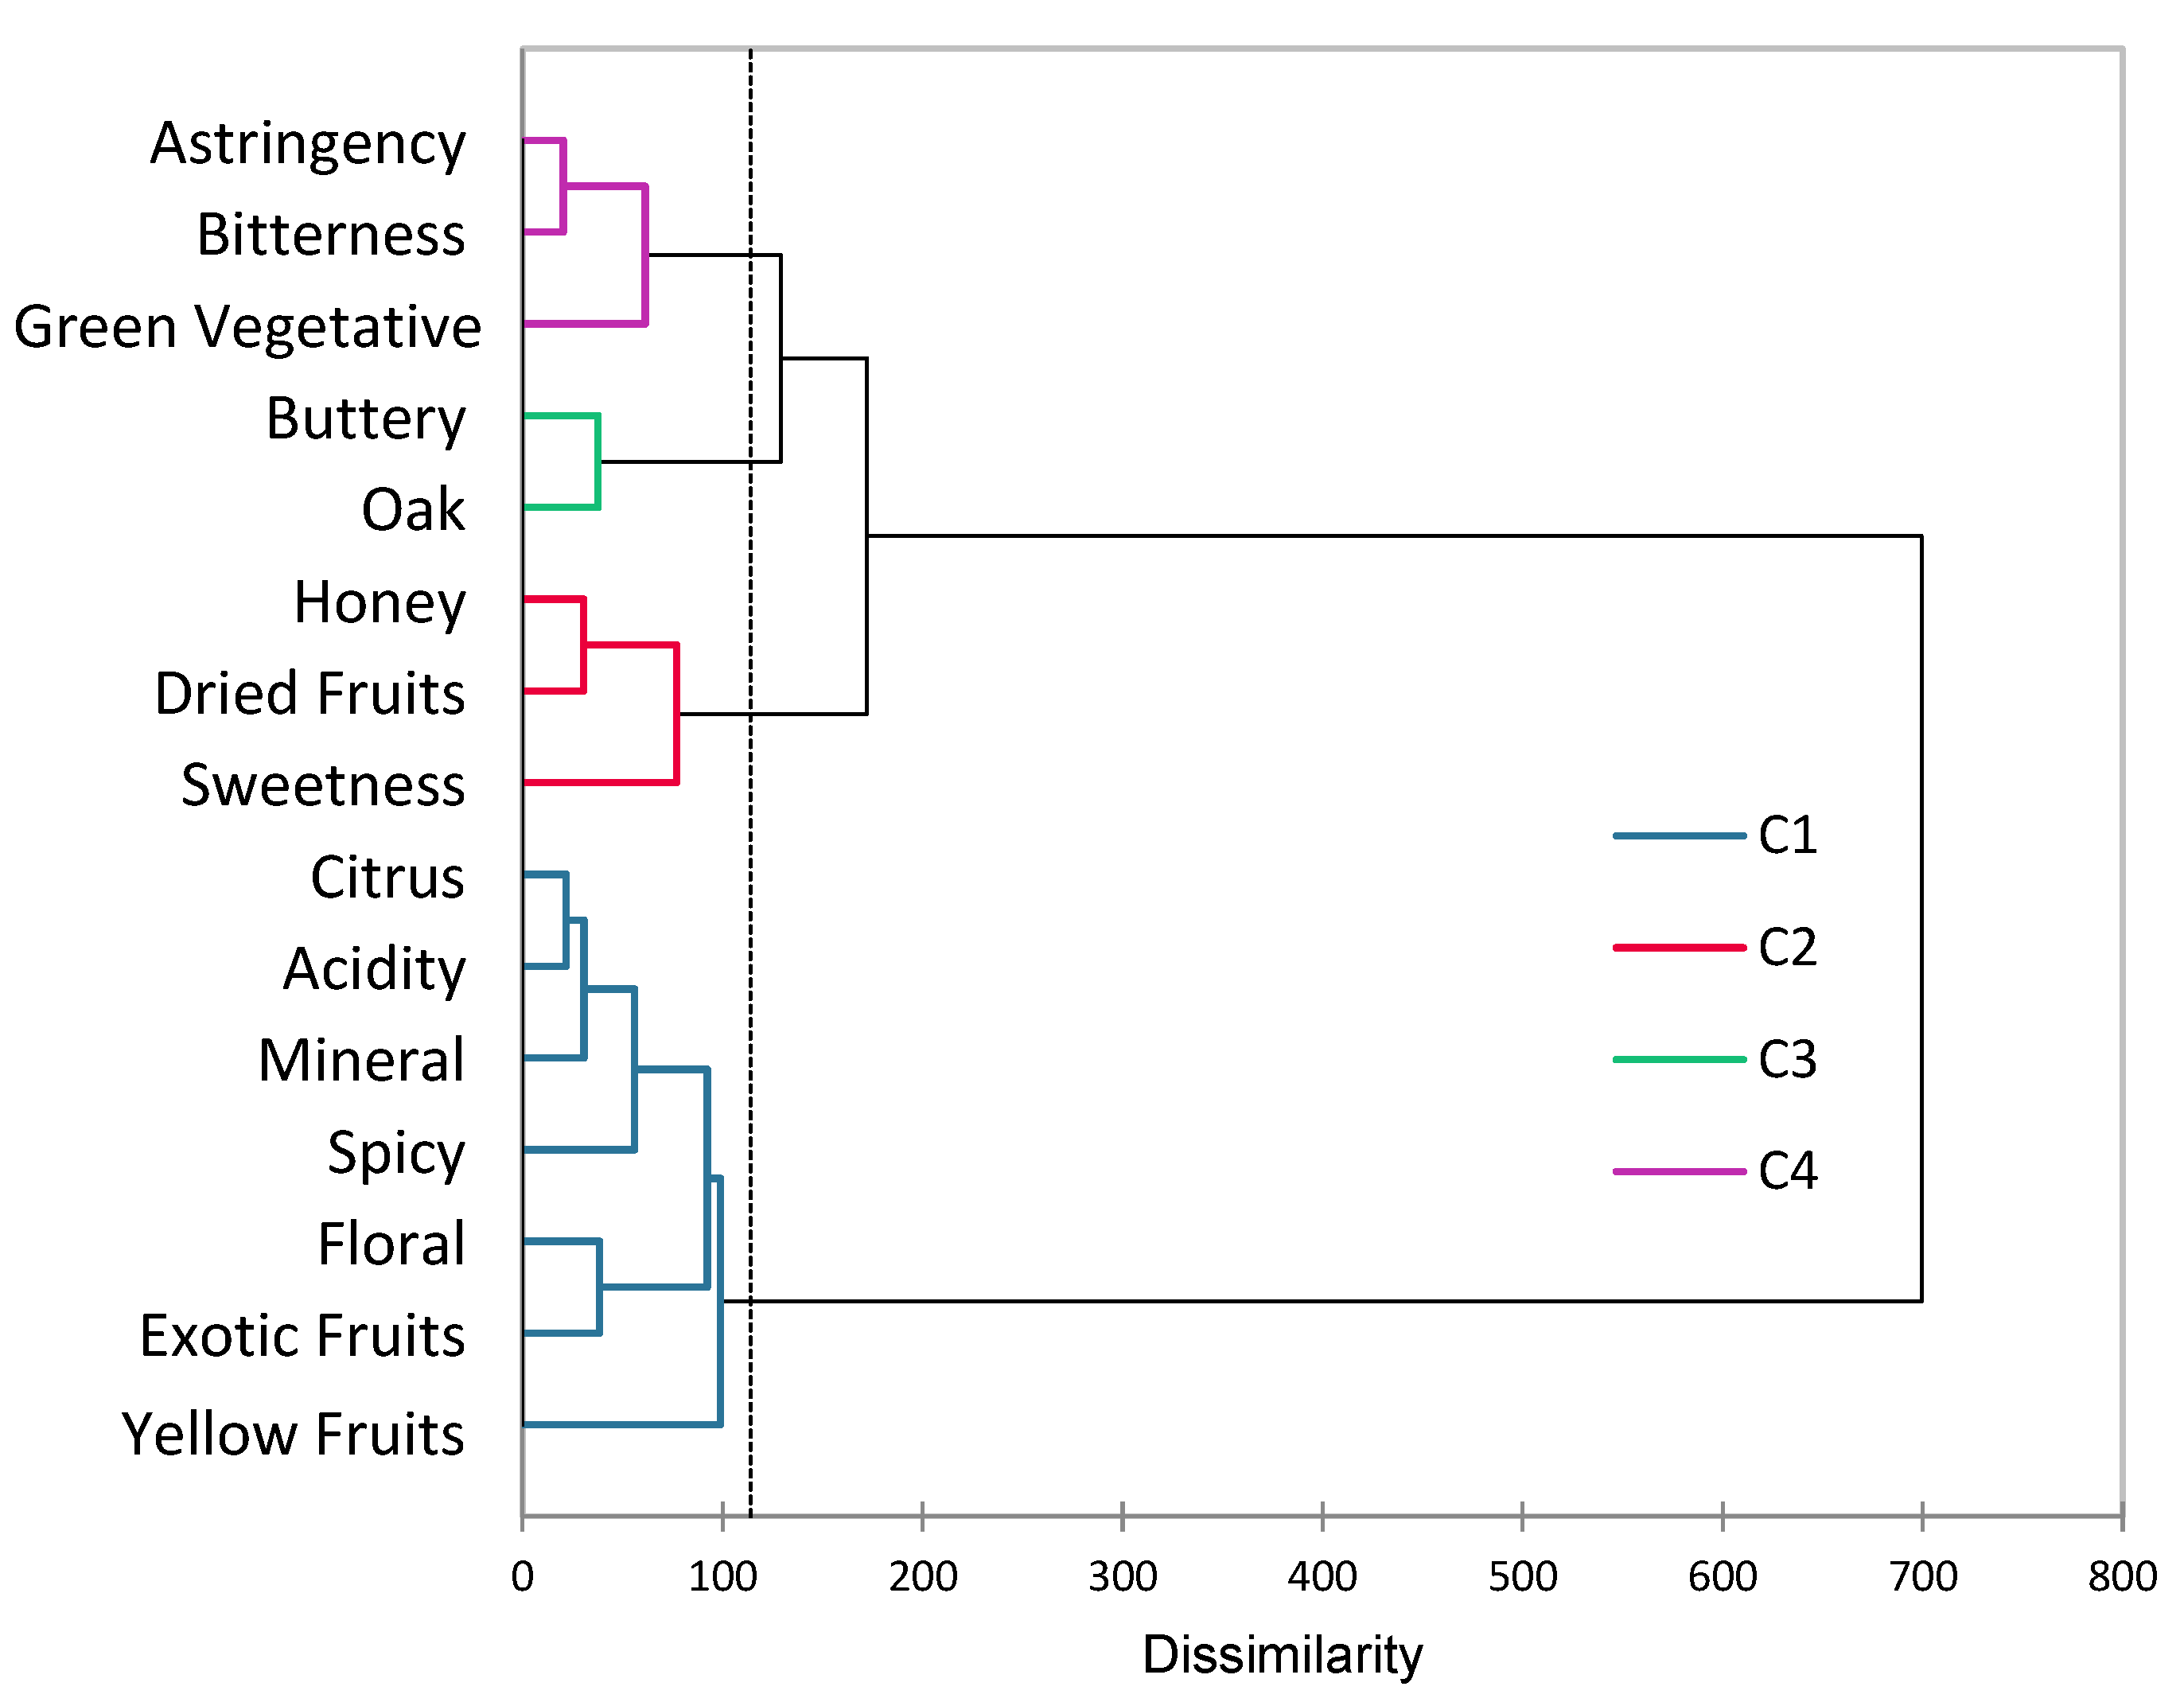
The same strategy was applied to white wines and the AHC dendogram is shown in Figure 4. Table 11 summarizes the flavor composition of each wine cluster, evidencing significant differences for Spicy, Acidity, Dried Fruits, Honey, Oak, Buttery, Astringency and Bitterness. The clustering of the flavor descriptors is shown in Figure 5, enabling the definition of 4 sensory spaces (Freshness, Mellowed, Oakiness and Funkiness) (Table 12). Freshness encompassed the fresh fruity and floral aromas (citrus, exotic fruits, yellow fruits, floral), usually applied to whites when using transparent glasses and the corresponding acid taste [40]. Mineral is also a descriptor associated with Freshness and bears a positive quality significance [41]. The Mellowed family comprised Honey, Dried fruit and Sweetness, being related to proper aging [11,12]. Oak and Buttery are consistent with the influence of barrique aging [44]. The Funkiness family comprises Green-Vegetative aroma and in-mouth perceptions of Bitterness and Astringency [46], which are known to interact and are not expected to be noticeably perceived in conventional white wines.
Figure 4.
AHC of Grand Gold white wines according to their flavor description (wine references in Table 3).
Figure 4.
AHC of Grand Gold white wines according to their flavor description (wine references in Table 3).
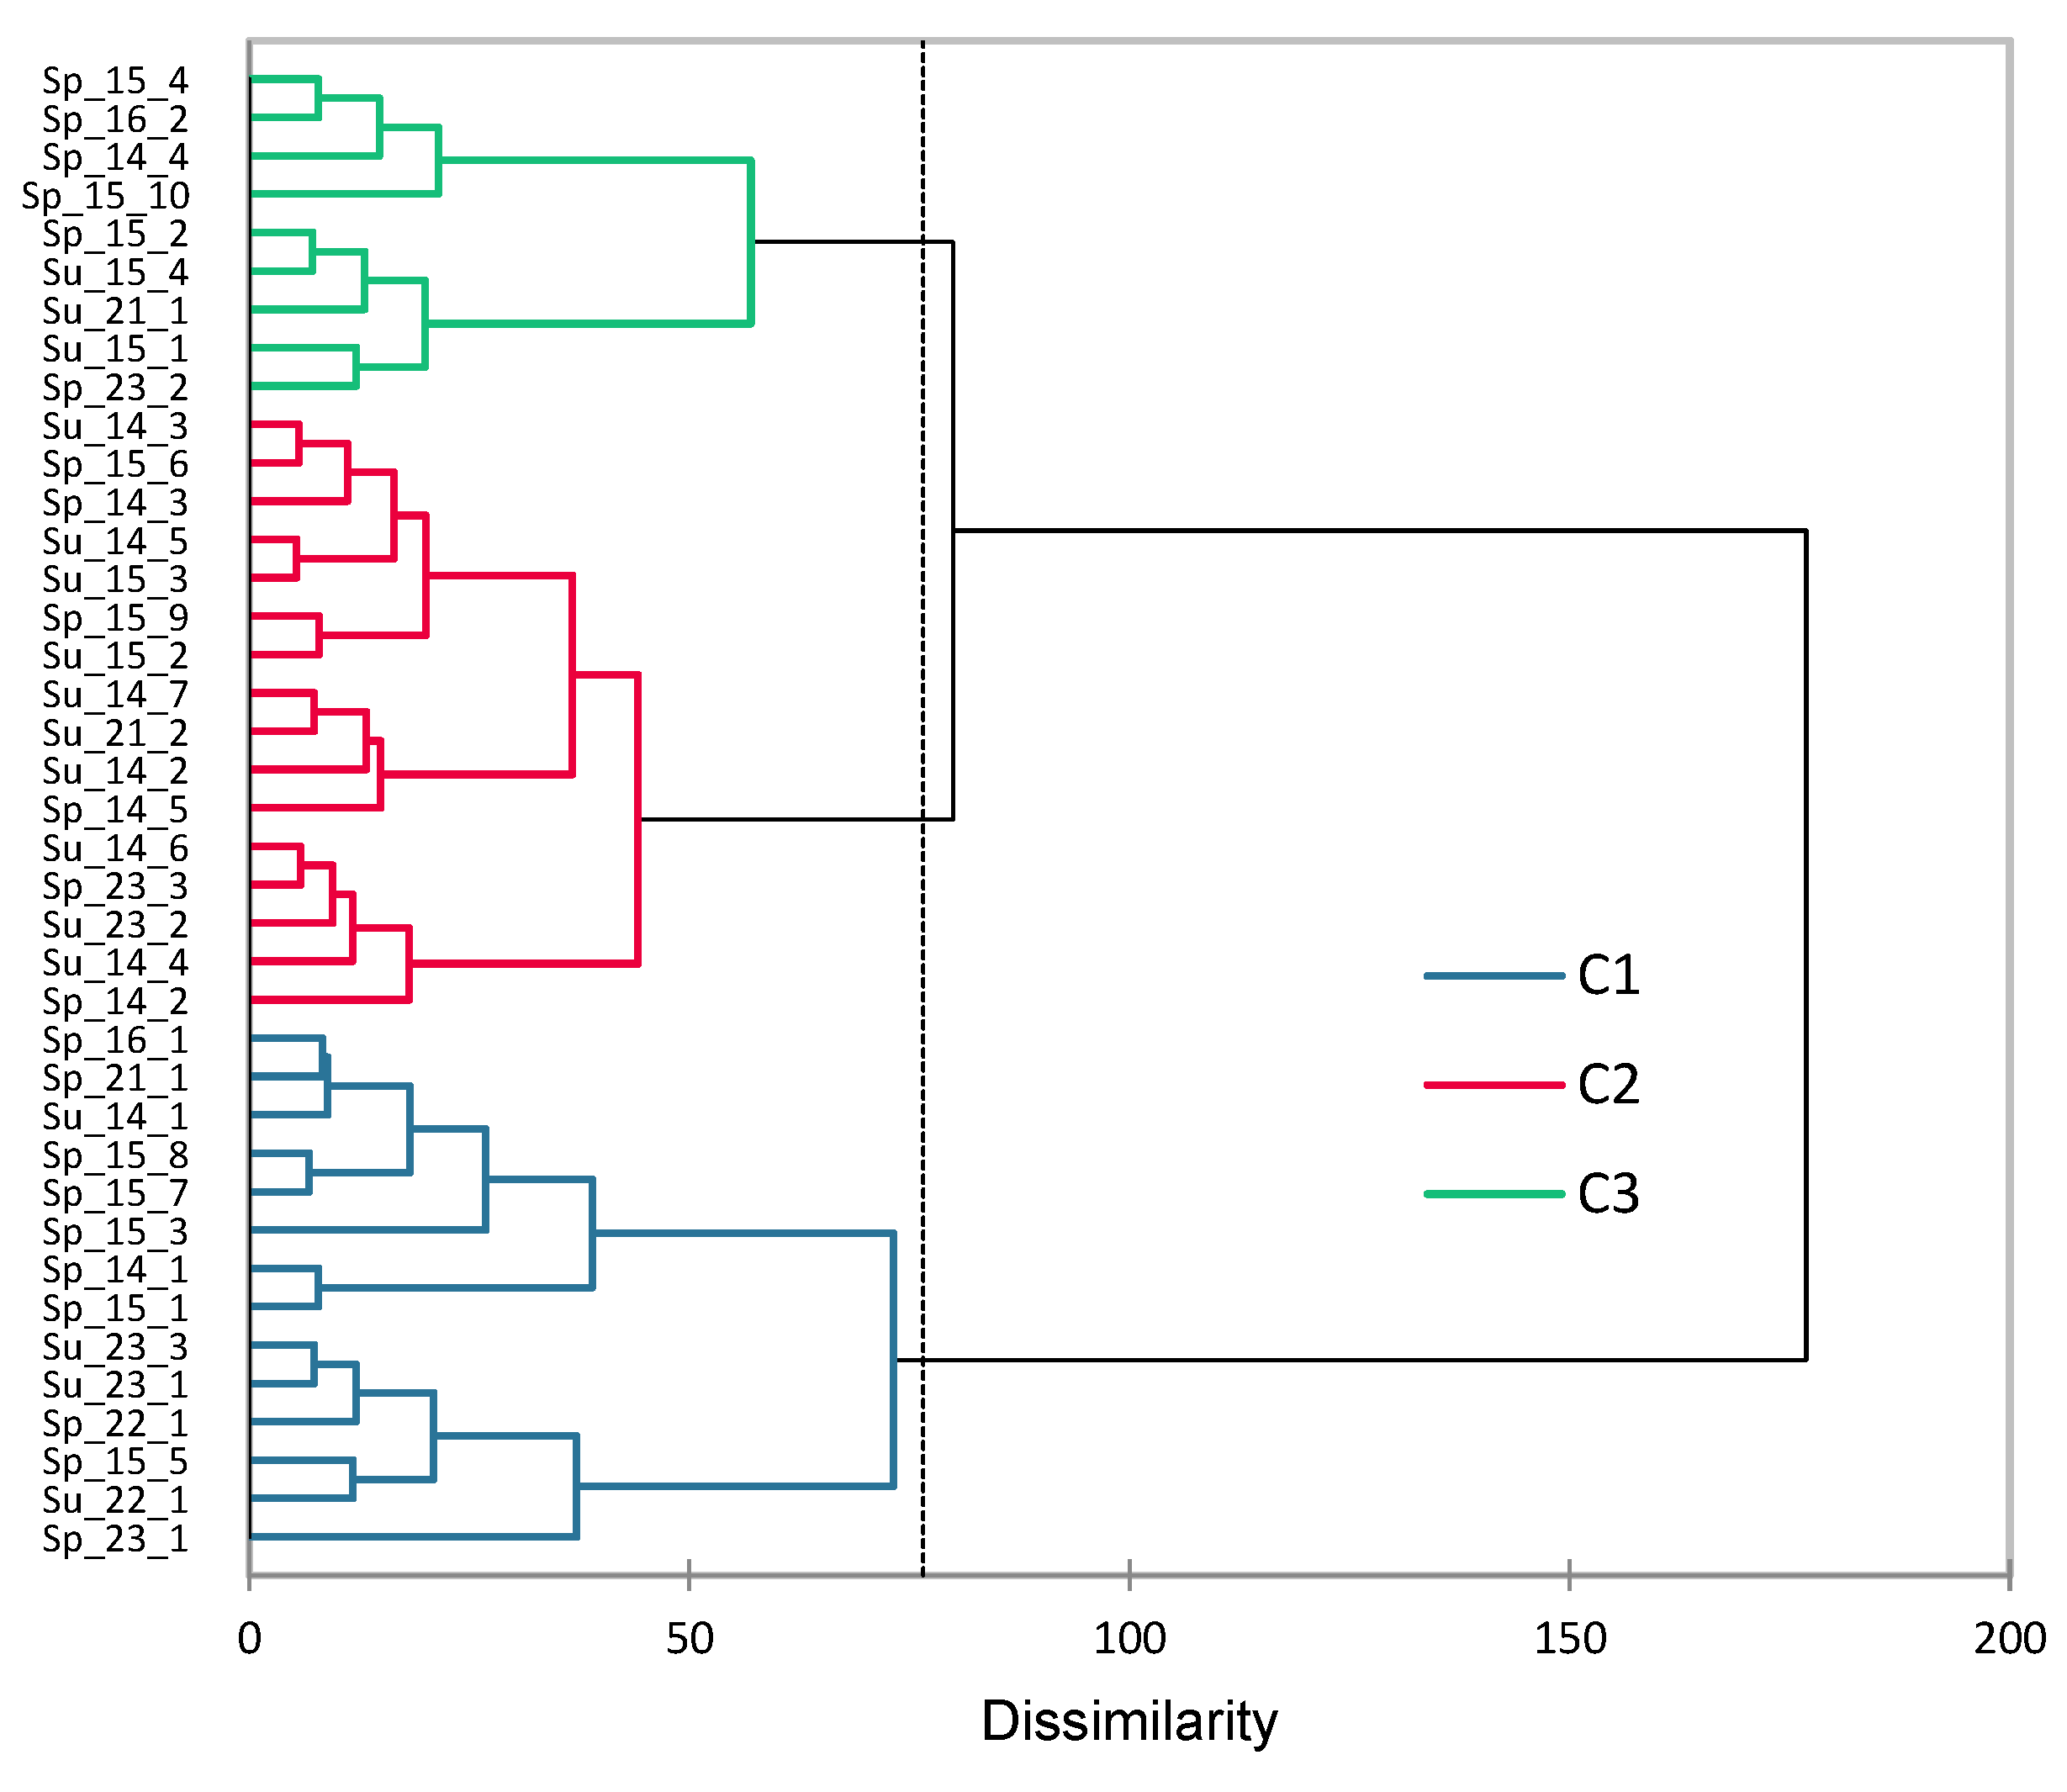
Table 11.
Flavor characterization of the Grand Gold white wines clusters.
| Flavor attribute | Cluster | Pr > F(Model) | ||
|---|---|---|---|---|
| 1 | 2 | 3 | ||
| Yellow Fruits | 5.31 a | 4.89 a | 5.84 a | 0.197 |
| Spicy | 4.63 a | 3.34 b | 3.63 ab | 0.012 |
| Acidity | 4.11 b | 4.42 b | 5.57 a | 0.003 |
| Mineral | 4.08 a | 4.08 a | 4.96 a | 0.181 |
| Exotic Fruits | 4.07 a | 4.12 a | 4.47 a | 0.743 |
| Citrus | 4.01 a | 4.08 a | 4.72 a | 0.230 |
| Dried Fruits | 3.94 a | 2.51 b | 3.16 ab | 0.019 |
| Honey | 3.84 a | 1.78 b | 3.50 a | <0.0001 |
| Oak | 3.59 a | 0.80 b | 0.39 b | <0.0001 |
| Floral | 3.09 a | 3.69 a | 3.19 a | 0.271 |
| Buttery | 2.84 a | 0.85 b | 0.42 b | <0.0001 |
| Sweetness | 2.34 a | 2.53 a | 3.38 a | 0.067 |
| Astringency | 2.24 a | 0.94 b | 2.78 a | <0.0001 |
| Green Vegetative | 2.11 a | 2.61 a | 1.59 a | 0.121 |
| Bitterness | 1.56 ab | 1.17 b | 2.23 a | 0.039 |
a Bold font indicates significant differences (p<0.05) among LS means. b Different letters in the row indicate pair-wise differences (p<0.05) by the Tukey HSD test.
Figure 5.
AHC of the flavor descriptors Grand Gold white wines from 2014-2016 and 2021-2023 editions (C1, Freshness; C2, Mellowed; C3, Oakiness; C4, Funkiness).
Figure 5.
AHC of the flavor descriptors Grand Gold white wines from 2014-2016 and 2021-2023 editions (C1, Freshness; C2, Mellowed; C3, Oakiness; C4, Funkiness).
The wine clusters were distinguished by the flavor intensity given to Mellowed and Oakiness: (a) Cluster 1 comprised samples with higher oak and mellowed flavors; (b) Cluster 2 included wines little oakiness and less mellowed flavors; and (c) Cluster 3 represented fresher wines with mellowed flavors and rather little oak perception. The overall quality parameters were similar across all clusters while Cluster 3 showed higher residual sugar. These results are broadly consistent with the dry, semi-dry unwooded and semi-dry wooded Chenin styles based on numerous tasting notes of a wine journalist [47].
Table 12.
Sensory, quality and chemical characterization of the Grand Gold white wines clustered according to their sensory space description.
Table 12.
Sensory, quality and chemical characterization of the Grand Gold white wines clustered according to their sensory space description.
| Category | Family | Cluster | Pr > F(Model)a | ||
|---|---|---|---|---|---|
| 1 | 2 | 3 | |||
| Flavor | Freshness | 29.29b ab | 28.61 b | 32.38 a | 0.120 |
| Mellowed | 10.11 a | 6.81 b | 10.03 a | <0.0001 | |
| Oakiness | 6.43 a | 1.65 b | 0.81 b | <0.0001 | |
| Funkiness | 5.91 a | 4.75 a | 6.60 a | 0.156 | |
| Quality | Body | 5.56 a | 5.26 a | 5.39 a | 0.656 |
| Potential | 5.15a | 4.92 a | 5.13 a | 0.854 | |
| Harmonious | 5.78 a | 5.91 a | 5.89 a | 0.931 | |
| Complex | 5.66 a | 5.39 a | 6.06 a | 0.273 | |
| Price | 15.6 a | 14.6 a | 18.5 a | 0.526 | |
| Chemical | Residual Sugar | 2.770 b | 3.913 ab | 5.231 a | 0.057 |
| Acidity | 6.127 a | 6.110 a | 7.354 a | 0.105 | |
| Ethanol | 13.321 a | 13.313 a | 12.778 a | 0.101 | |
a Bold font indicates significant differences (p<0.05) among LS means. b Different letters in the row indicate pair-wise differences (p<0.05) by the Tukey HSD test.
The number of wines in each cluster reflects the most preferred sensory features (Table 13). The main difference was the higher percentage of Oakiness in recent editions. Overall, it seems that the Grand Gold white wines did not follow the supposed present tendency to appreciate more wines dominated by fresh flavors or minerality in detriment of oaky flavors.
Table 13.
Synthetic characterization and percentage composition of the wines clusters of the recent and older editions of the Mundus Vini challenges (number of wines between brackets)a.
Table 13.
Synthetic characterization and percentage composition of the wines clusters of the recent and older editions of the Mundus Vini challenges (number of wines between brackets)a.
| Wine cluster | 2020-2023 Editions | 2014-2016 Editions | Synthetic description |
|---|---|---|---|
| 1 | 54.5 (6) | 28.6 (8) | Oaked and mellowed |
| 2 | 27.3 (3) | 46.4 (13) | Unoaked less intense and smoother |
| 3 | 18.2 (2) | 25.0 (7) | Unoaked fresher and sweeter |
| All | 100 (11) | 100 (28) | Fresh fruitiness with occasional oak |
a Bold number indicates higher proportions in the row by Chi-square test at p < 0.05.
4. Limitations and Future Perspectives
The utilization of the method preconized by OIV has several drawbacks that may explain, at least partially, the outputs. Indeed, (a) the tasting of several samples in a rapid sequence tends to favor the most intense wines that overwhelm those more delicate and that take more time to develop; (b) although the scores are individual, there is a tendency to harmonize the assessments among each group of panelists; (c) the tasting sheet favors intensity ratings in aroma and mouthfeel. Moreover, during the attribute characterization, the fact that body is associated with the quality parameters may unconsciously assume that this should be regarded as a quality driver equivalent to harmonious, complex or potential. As a result, the outputs are broadly consistent with academic research, where body, oak and sweetness were predictors of high quality while animal while leather, animal, and acidity and tannin had the opposite effect in a large sample of Bordeaux wines [39].
Overall, in these competitions, the basic rules of sensory science are not followed and ratings are subjected to stochastic errors partially due to their random nature [49]. Nevertheless, blind conditions are guaranteed avoiding the bias induced by brand or region reputation [50,51] that may explain why wines receiving gold medals do not achieve significantly higher critics’ scores than those receiving bronze or silver medals [26]. In addition, score inflation is also not likely to occur since there is a quota for Grand Gold awards. Thus, these limitations associated with online and magazine results are minimized under constant challenge tasting protocols.
The results here reported demonstrate that the assessment of temporal trends remains an endeavor to be tackled by sensory researchers. Future works benefiting from the increasing power of computational approaches must be accompanied with appropriate ecological validation of the sensory related outputs [52].
5. Conclusions
The results showed that the predictable style trends in wine appreciation could not be fully observed using the data retrieved from Mundus Vini competitions along the years. In particular, regarding red and white wines: (i) the relative appreciation of white wines was not increasing when compared with the much higher number of Grand Gold reds; (ii) the oak related flavors continued to be dominant in most Grand Gold awards; (iii) decreasing ethanol content and lower residual sugar were not evidenced. Concerning reds, the single observation consistent with claimed present trends was the apparent higher leniency towards the perception of off-flavors in present editions. Overall, the results of a large international competition did not evidence the presumed increasing appreciation of leaner styles, with less ethanol, body, residual sugar and oak flavors.
Author Contributions
Conceptualization, MMF; data obtention, CF and RL; software, MMF; validation, MMF, CF and RL; data curation, MMF; writing—original draft preparation, MMF; writing—review and editing, MMF; visualization, MMF; supervision, MMF; funding acquisition, MMF. All authors have read and agreed to the published version of the manuscript.
Funding
This work is funded by national funds through FCT – Fundação para a Ciência e a Tecnologia, I.P., through project reference UID/04129: Linking Landscape, Environment, Agriculture and Food Research Centre.
Data Availability Statement
The data is available upon request.
Conflicts of Interest
The authors declare no conflicts of interest.
References
- Lockshin, L.; Corsi, A. Consumer behaviour for wine 2.0: A review since 2003 and future directions. Wine Economics and Policy 2012, 1, 2–23. [Google Scholar] [CrossRef]
- Sogari, G.; Pucci, T.; Aquilani, B.; Zanni, L. Millennial generation and environmental sustainability: The role of social media in the consumer purchasing behavior for wine. Sustainability 2017, 9, 1911. [Google Scholar] [CrossRef]
- Loose, S.M.; del Rey, R. State of the International Wine Markets in 2023. The wine market at a crossroads: Temporary or structural challenges? Wine Economics and Policy 2024, 13, 3–14. [Google Scholar] [CrossRef]
- Fuentes-Fernández, R.; del Campo-Villares, J.L. Exploring the Market for Dealcoholized Wine in Spain: Health Trends, Demographics, and the Role of Emerging Consumer Preferences. Beverages 2025, 11, 41. [Google Scholar] [CrossRef]
- Jürkenbeck, K.; Spiller, A. Importance of sensory quality signals in consumers’ food choice. Food Quality and Preference 2021, 90, 104155. [Google Scholar] [CrossRef]
- Pomarici, E.; Lerro, M.; Chrysochou, P.; Vecchio, R.; Krystallis, A. One size does (obviously not) fit all: Using product attributes for wine market segmentation. Wine Economics and Policy 2017, 6, 98–106. [Google Scholar] [CrossRef]
- Martínez-Navarro, J.; Sellers-Rubio, R. Three decades of research on wine marketing. Heliyon 2024, 10, e30938. [Google Scholar] [CrossRef]
- del Rey, R.; Loose, S. State of the International Wine Market in 2022: New market trends for wines require new strategies. Wine Economics and Policy 2023, 12, 3–18. [Google Scholar] [CrossRef]
- Malfeito-Ferreira, M.; Diako, C.; Ross, C. F. Sensory and chemical characteristics of ‘dry’ wines awarded gold medals in an international wine competition. Journal of Wine Research 2019, 30, 204–219. [Google Scholar] [CrossRef]
- Pickering, G.J.; Kemp, B. Understanding Sparkling Wine Consumers and Purchase Cues: A Wine Involvement Perspective. Beverages 2024, 10, 19. [Google Scholar] [CrossRef]
- Esteves, M.; Sequeira, M.; Malfeito-Ferreira, M. Definition of the Sensory and Aesthetic Spaces of Dry White Wines with Aging Ability by Experienced Tasters. Beverages 2024, 10, 44. [Google Scholar] [CrossRef]
- Marasà, G.; Ferreira, J.; Mota, M.; Malfeito-Ferreira, M. Understanding the Mellowing Effect of Bottle Aging on the Sensory Perceptions of Varietal Dry White Wines. Beverages 2024, 10, 78. [Google Scholar] [CrossRef]
- Harutyunyan, M.; Malfeito-Ferreira, M. Historical and Heritage Sustainability for the Revival of Ancient Wine-Making Techniques and Wine Styles. Beverages 2022, 8, 10. [Google Scholar] [CrossRef]
- Lee, J.; Park, J. Y.; Back, R. M.; Nutta, M.W. Expert wine reviews: exploring trends in wine quality indicators. Journal of Wine Research 2025, 36, 85–103. [Google Scholar] [CrossRef]
- Yavas, C. E.; Kim, J.; Chen, L. Mastering Precision in Pivotal Variables Defining Wine Quality via Incremental Analysis of Baseline Accuracy. IEEE Access 2024, 12, pp. 105429-105459. [Google Scholar] [CrossRef]
- Gastaldello, G.; Schäufele-Elbers, I. , Schamel, G. Factors influencing wine ratings in an online wine community: The case of Trentino–Alto Adige. Journal of Wine Economics 2024, 19, 19–40. [Google Scholar] [CrossRef]
- Kopsacheilis, O.; Analytis, P.; Kaushik, K.; Herzog, S.; Bahrami, B.; Deroy, O. Crowdsourcing the assessment of wine quality: Vivino ratings, professional critics, and the weather. Journal of Wine Economics 2024, 19, 285–304. [Google Scholar] [CrossRef]
- Moreira, D.; Reis, L.; Cortez, P. Using Machine Learning to Predict Wine Quality and Prices: A Demonstrative Case Using a Large Tabular Database. IEEE Access 2024, 12, 182296–182309. [Google Scholar] [CrossRef]
- Sadras, V.O.; Soar, C.J.; Petrie, P.R. Quantification of time trends in vintage scores and their variability for major wine regions of Australia. Australian Journal of Grape and Wine Research 2007, 13, 117–123. [Google Scholar] [CrossRef]
- Kumar, A. P.; Meriluoto, L.; Watt, R. New evidence on using expert ratings to proxy for wine quality in climate change research. Journal of Wine Research 2023, 34, 101–121. [Google Scholar] [CrossRef]
- Dong, Z.; Guo, X.; Rajana, S.; Chen, B. Understanding 21st Century Bordeaux Wines from Wine Reviews Using Naïve Bayes Classifier. Beverages 2020, 6, 5. [Google Scholar] [CrossRef]
- Penagos-Londoño, G. I.; Ruiz-Moreno, F.; Sellers-Rubio, R.; Del Barrio-García, S.; Casado-Díaz, A. B. Consistency of expert product reviews: an application to wine guides. Wine Economics and Policy 2022, 11, 51–60. [Google Scholar] [CrossRef]
- Malfeito-Ferreira, M. Fine wine flavor perception and appreciation: Blending neuronal processes, tasting methods and expertise. Trends in Food Science & Technology 2021, 115, 332–346. [Google Scholar] [CrossRef]
- Whitnall, S.; Alston, J. Climate, weather, and collective reputation: Implications for California’s wine prices and quality. Journal of Wine Economics 2025, 20, 122–167. [Google Scholar] [CrossRef]
- Bodington, J.; Malfeito-Ferreira, M. The 2016 Wines of Portugal Challenge: General implications of more than 8,400 wine-score observations. Journal of Wine Research 2018, 28, 313–325. [Google Scholar] [CrossRef]
- Bitter, C. Wine Competitions: Reevaluating the Gold Standard. Journal of Wine Economics 2017, 12, 395–404. [Google Scholar] [CrossRef]
- Bélisle, F. Are Canada’s best wines from Ontario or British Columbia? An analysis of the All Canadian Wine Championships results, 2010–2022. Journal of Wine Research 2025, 1–10. [Google Scholar] [CrossRef]
- Castriota, S.; Curzi, D.; Delmastro, M. Tasters’ bias in wine guides’ quality evaluations. Applied Economics Letters 2013, 20, 1174–1177. [Google Scholar] [CrossRef]
- OIV. OIV standard for international wine competitions and spirituous beverages of vitivinicultural origin (OIV-CONCOURS 332A-2009) and Guidelines for granting OIV patronage of international wine and spirituous beverages of vitivinicultural origin competitions. Paris: International Organisation of Vine and Wine, 2009.
- Kurtanjek, Ž. Causal Artificial Intelligence Models of Food Quality Data. Food Technology and Biotechnology 2024, 62, 102–109. [Google Scholar] [CrossRef]
- Solis, J.; Luzzini, G.; Slaghenaufi, D.; Ugliano, M. Dimethyl Sulfide (DMS) in Amarone Wines: Influence of Aging, Withering, Grape Variety, and Geographical Origin. Journal of Agricultural and Food Chemistry 2024, 72, 1978–1984. [Google Scholar] [CrossRef]
- Paroissien, E.; Visser, M. The Causal Impact of Medals on Wine Producers' Prices and the Gains from Participating in Contests. American Journal of Agronomy and Economy 2020, 102, 1135–1153. [Google Scholar] [CrossRef]
- Kaimann, D.; Bru, B.; Frick, B. Ratings meet prices: The dynamic relationship of quality signals. Journal of Wine Economics 2023, 18, 226–244. [Google Scholar] [CrossRef]
- Livat, F. , Remaud, H., Fernández-Olmos, M. Factors explaining differences in wine experts’ ratings: The case of gender, credentials, occupation and peer effects. Food Research International 2024, 191, 114689. [Google Scholar] [CrossRef]
- Han, S.; Yang, J.; Choi, K.; Kim, J.; Adhikari, K.; Lee, J. Chemical Analysis of Commercial White Wines and Its Relationship with Consumer Acceptability. Foods 2022, 11, 603. [Google Scholar] [CrossRef] [PubMed]
- Wang, S. , Mantilla, S., Stokes, J., Smith, P., Smyth, H. pH dominates the temporal perception of astringency sub-qualities and saliva friction response – A study under iso-pH and iso-titratable acidity conditions in model wine, Food Hydrocolloids, Volume 146, Part A, 2024, 109274. [CrossRef]
- Barbe, J.-C.; Garbay, J.; Tempère, S. The Sensory Space of Wines: From Concept to Evaluation and Description. A Review. Foods 2021, 10, 1424. [Google Scholar] [CrossRef] [PubMed]
- Garbay, J.; Cameleyre, M.; Riquier, L.; Barbe, J.-C.; Lytra, G. Development of a New Method for the Quantitative Analysis of Aroma Compounds Potentially Related to the Fruity Aroma of Red Wines. Journal of Agricultural and Food Chemistry 2023, 71, 13066–13078. [Google Scholar] [CrossRef]
- Szolnoki, G.; Hoffmann, D.; Herrmann, R. Quantifying the influence of product design on perceived taste and purchase intent for wine using a characteristics model. German Journal of Agricultural Economics 2011, 60, 1–19. [Google Scholar] [CrossRef]
- Li, Y.; Zhang, Q.; Liu, X.; Bian, X.; Li, J.; Meng, N.; Liu, M.; Huang, M.; Sun, B.; and Li, J. Flavor Interactions in Wine: Current Status and Future Directions From Interdisplinary and Crossmodal Perspectives. Comprehensive Reviews Food Science and Food Safety 2025, 24, e70199. [Google Scholar] [CrossRef]
- Malfeito-Ferreira, M. Wine Minerality and Funkiness: Blending the Two Tales of the Same Story. Fermentation 2022, 8, 745. [Google Scholar] [CrossRef]
- Pelonnier-Magimel, É.; Mangiorou, P.; Darriet, P.; De Revel, G.; Jourdes, M.; Marchal, A.; Barbe, J. Sensory characterization of bordeaux red wines produced without added sulfites. OENO One 2020, 54, 687–697. [Google Scholar] [CrossRef]
- Romano, M.; Chandra, M.; Harutyunyan, M.; Savian, T.; Villegas, C.; Minim, V.; Malfeito-Ferreira, M. Off-flavors and unpleasantness are cues for the recognition and valorization of organic wines by experienced tasters. Foods 2020, 9, 105. [Google Scholar] [CrossRef] [PubMed]
- Nguyen, T.; Durner, D. Sensory evaluation of wine aroma: Should color-driven descriptors be used? Food Quality and Preference 2023, 107, 104844. [Google Scholar] [CrossRef]
- Paissoni, M.A.; Boido, M.; Margotti, P.; Giacosa, S.; Río Segade, S.; Gerbi, V.; Rolle, L.; Schuessler, C.; Jung, R.; Rauhut, D.; et al. Exploring the Sensory Typicity of Timorasso Wines: Physicochemical and Sensory Characteristics of Seven Consecutive Vintages. Foods 2025, 14, 591. [Google Scholar] [CrossRef] [PubMed]
- Gawel, R.; Smith, P. A.; Cicerale, S.; Keast, R. The mouthfeel of white wine. Critical Reviews in Food Science and Nutrition 2027, 58, 2939–2956. [Google Scholar] [CrossRef]
- Valente, C.C.; Bauer, F.F.; Venter, F.; et al. Modelling the sensory space of varietal wines: Mining of large, unstructured text data and visualisation of style patterns. Science Reports 2018, 8, 4987. [Google Scholar] [CrossRef]
- Basalekou, M.; Tataridis, P.; Georgakis, K.; Tsintonis, C. Measuring Wine Quality and Typicity. Beverages 2023, 9, 41. [Google Scholar] [CrossRef]
- Bodington, J. Stochastic error and biases remain in blind wine ratings. Journal of Wine Economics 2022, 17, 345–351. [Google Scholar] [CrossRef]
- González, J.; Sánchez-Sáenz, C.; Mejias-Barrera, P. Stochastic model for the process of Wine Award: Visualization and quantification. Ciência e Técnica Vitivinícola 2014, 29, 53–59. [Google Scholar] [CrossRef]
- Oczkowski, E.; Pawsey, N. Community and Expert Wine Ratings and Prices. Economy Papers 2019, 38, 27–40. [Google Scholar] [CrossRef]
- Torrico, D.D.; Han, Y.; Sharma, C.; Fuentes, S.; Gonzalez Viejo, C.; Dunshea, F.R. Effects of Context and Virtual Reality Environments on the Wine Tasting Experience, Acceptability, and Emotional Responses of Consumers. Foods 2020, 9, 191. [Google Scholar] [CrossRef]
Disclaimer/Publisher’s Note: The statements, opinions and data contained in all publications are solely those of the individual author(s) and contributor(s) and not of MDPI and/or the editor(s). MDPI and/or the editor(s) disclaim responsibility for any injury to people or property resulting from any ideas, methods, instructions or products referred to in the content. |
© 2025 by the authors. Licensee MDPI, Basel, Switzerland. This article is an open access article distributed under the terms and conditions of the Creative Commons Attribution (CC BY) license (https://creativecommons.org/licenses/by/4.0/).
Copyright: This open access article is published under a Creative Commons CC BY 4.0 license, which permit the free download, distribution, and reuse, provided that the author and preprint are cited in any reuse.


