
Submitted:
26 December 2024
Posted:
27 December 2024
You are already at the latest version
Abstract
In recent years, there has been a noticeable decline in wine consumption. This trend can be attributed to a shift in consumer preferences towards alcoholic alternatives such as beer and fruit-based mixed drinks. What sets wine apart from these alternatives is its unique identity, is its perceived identity: a combination of brand, heritage, and terroir. The origin and production details of wine significantly influence consumer’s purchasing decisions. In this study, we have produced new sparkling wines using either commercial or native yeast strains along with traditional Italian grape varieties. This approach preserves the unique character of the region, represented by the typical grape varieties, and incorporates the concept of “microbial terroir,” which is linked to the indigenous yeasts. The wines produced have been analyzed for conventional parameters such as pH, titratable acidity, volatile acidity, alcohol content, and residual sugar, as well as for their aromatic profile through GC-MS analysis. To evaluate the acceptance of the wines, a sensory analysis was conducted, and NIR spectra were collected to identify the factors influencing their preferences. The positive reception of these innovative sparkling wines was connected to their chemical composition, offering valuable insights for the future production of similar products.
Keywords:
terroir
; NIR
; GC-MS
; winemaking
; Vitis vinifera
1. Introduction
Italy is among the major vine-growing and wine-exporter countries and is the second-largest wine-producing nation. Italy, like all the major wine exporters, has experienced a decline in wine export volume in the past years [1]. It is difficult to pinpoint the motives behind the observed trend since different reasons could explain this decrease. Anyway, the steady or increasing sale of other alcoholic products such as beer and mixed fruit flavored spirits, indicates a shift in consumers' choice of alcoholic beverages [2]. The only wine-derived product that still maintains a good selling point is sparkling wines, whose volume is concentrated (70–80%) in the European Union, especially in France, Italy, Germany, and Spain, followed by the USA [3]. The Apulia region in Southern Italy is a well-recognized area for wine production. In this area, due to the favorable Mediterranean climate, a wide variety of grape varieties are grown. For over a century, Apulia has been known for producing large quantities of second-rate wines, often used for blending. However, starting in the 1970s, there has been a growing international success of Apulian wines due to improvements in native vine cultivation, leading to the production of high-quality recognized wines [4]. Nowadays, the region's most famous wines are red, full-bodied ones made with ancient winemaking traditions from red grape varieties. Anyway, the change in the attitude of consumers has affected the selling point of traditional Apulian wines. A distinguishing characteristic of wine, setting it apart from other alcoholic beverages, is its perceived “identity”, which is linked to the concepts of heritage and terroir [5]. In this work, we produced novel sparkling wines using the Champenois method on typical Apulian white grape varieties (Greco bianco, Falanghina, Montonico pinto, and Fiano), that are conventionally used to produce white wine, in combination with autochthonous yeasts. The use of native vineyard locally selected yeasts has been introduced as an innovative approach to obtain wines reflecting terroir [6]. Studies involving autochthonous strains, the so called “microbial terroir”, associated to the grape/wine growing area have highlighted the close connection existing among microbial consortium, climate and production area. Their use allows to link wines to the culture and history of their production area [7].
For each wine, we evaluate the conventional parameters including pH, titratable acidity, volatile acidity, alcohol content, and residual sugars. Additionally, the aromatic profile was assessed through GC-MS analysis. Understanding the reasons for the favorable acceptance of these new sparkling wines is important for planning the production of similar new products. Therefore, to evaluate the consumer's appreciation for these novel wines we conducted a sensory analysis in conjunction with NIR spectroscopy evaluation to search for spectral regions that could predict factors influencing testers' preferences. These novel wine products represent a way of maintaining wine identity while adapting to evolving market demands.
2. Materials and Methods
2.1. Winemaking Procedure and General Wine Parameters
The research was conducted in 2022-2024 on grapes collected in 2022 from the “Lamarossa” experimental vineyard of CREA Research Centre for Viticulture and Enology (CREA-VE), which consists of 11 hectares located in the Apulia region, Southern Italy (S.P. 65 snc – 70018 Rutigliano, BA). Four traditional Italian grape varieties of Southern Italy were harvested: Falanghina, Fiano, Greco bianco, and Montonico pinto. Vines were grown under conventional farming conditions with Guyot pruning system. Two main procedures can be followed for sparkling wine production, the traditional method (Champenoise) which is followed for the production of high quality sparkling wines like Champagne in France and Cava in Spain, and the Charmat (or Marinotti) method [8]. We chose to apply the Champenoise method since hedonic sensory evaluations of sparkling wines showed how, upon providing information on the sparkling wines production process, a higher rating was obtained for Champenois wines compared to Charmant ones, while a net different appreciation was not observed without prior information. The authors attributed this preference for the Champenois products to consumers expectations towards the products [9]. In the Champenoise method, the base wine undergoes an in-bottle secondary refermentation after the addition of a solution containing sugar and yeasts (tirage). During the aging on lees period (prise de mousse), the sparkling wine aroma is enriched by the compounds released by the yeast cells and yeast autolysis at the end of secondary fermentation [10]. Therefore, in the traditional method the yeast strain used largely affects the quality of the sparkling wines [11].
The production of base wines was performed in the experimental winery of the CREA-VE of Turi. For each treatment, 100 kg of grapes were employed. For each grape variety, two different types of base wines were produced, one using only a commercial Saccharomyces cerevisiae strain (VB1,Oenobrands) while the other with a sequential inoculation using a Lachancea thermotolerans (Lt) yeast strain collected from an experimental vineyard in Southern Italy [12] followed by the same S. cerevisiae strain (VB1, Oenobrands) to complete the fermentation. L. thermotolerans is a yeast commonly found as part of grape/wine microbiota [13]. Multiple studies have studied its application and performance in oenology, resulting in several L. thermotolerans strains commercially available for mixed-starter fermentations [14].
Two other strains of S. cerevisiae were then used for the secondary fermentation: a commercial S. cerevisiaes train (18-2007 IOC) and a native S. cerevisiae strain directly collected from grape berries growing in North Apulia vineyards (S21) which was previously selected as starter culture due to its performances in base wine fermentation to produce white and rosé Apulian sparkling wines [10]. Selected base wine’s chemical/physical characteristics were determined according to methods recommended by the International Organisation of Vine and Wine (OIV) [15]. Total acidity (TA, titration with NaOH) and pH were determined with a Crison Basic 20pH meter, while volatile acidity, malic acid, lactic acid, total SO2, residual sugar, and polyphenolic content were all determined on wines at racking with a multiparametric enzymatic analyzer (Hyperlab Smart, Steroglass, Italy). The selected base wines were then refermented adding a sugar solution (24 g/L sugarcane) and supplemented with selected yeasts (0.2 g/L) until reaching a stable pressure value (5-6 bar) which took around 1 month depending on the yeast. The choice of the sugar type was based on the known influence of the sugar type on consumer preference and the resulting foam quality in sparkling wines. Research has shown that consumers prefer sparkling wines sweetened with sucrose (cane sugar is entirely composed of sucrose) over those sweetened with glucose or fructose [16]. Additionally, previous studies indicate that increasing levels of sucrose in the dosage, ranging from 0 to 31 g/L, are associated with improved foam formation but reduced stability, possibly due to modifications of the wine’s viscosity [17]. Therefore, we re-fermented our base wines by adding a sugar solution (24 g/L) of sugar cane in a concentration that would ensure enable good foam quality. To follow the organoleptic evolution of the product during aging on lees we performed tasting at different timing: 6 months, 1 year, and 1 and a half year. The first two tastings performed by experienced testers allowed us to choose the most promising wines to finally taste after one and a half years. The dégorgement (removal of yeast sediment from bottles) was performed prior to sensory testing. A total of eight sparkling wines were selected among those produced from the 4 different grape varieties to be tasted during the final sensory evaluation: Falanghina (one wine), Fiano (one wine), Greco (two wines) and Montonico (four wines).
2.2. GC-MS Analysis
The sparkling wines were degassed using an ultrasonic bath, then NaCl was added at a dose of 50 g/L. A 50 ml sample aliquot was added with 250 µl of a solution of 8.20 mg/L of 2-octanol (CAS 4128-31-8) in dichloromethane used as an internal standard. The sample was extracted 2 times in a separating funnel with 5 ml of dichloromethane for an extraction period of 20 min/extraction. The extracted dichloromethane phase was driedoveranhydrousNa2SO4, the supernatant was then filtered on a 0.2 µm Nylon filter and the amount of solvent was concentrated in a roto-evaporator. The sample thus obtained was injected into a GC/MS system, a 6890N gas chromatograph interfaced with a 5973 mass selective detector equipped with a multi sampler 7683B series injector (Agilent, Palo Alto, CA, USA). The column used was HP-INNOWax (30 m × 0.25 mm i.d. × 0.25 μm film thickness, Agilent) silica capillary column. Splitless injection was used. The carrier gas was helium at a flow rate of 1 ml min−1. The oven temperature program was: 50 °C (for 1 min), then increased to 220 °C, at 2 °C min−1, and held for 10 min. The MS detector was set as follows: transfer line temperature 220 °C; emission source temperature 230° while theMS temperature was set at 150°C. The mass range was m/z 30–300. All mass spectra were acquired in the electron impact (EI) mode (Ei = 70 eV, source temperature, 180 °C).The identification of the aromatic molecules of interest and their quantification was carried out as described by Perestrelo et al. 2006.The concentration was calculated as µg/L of 2-octanol (internal standard) [18].
2.3. Chemicals and Reference Compounds
Solid anhydrous sodium sulphate (analytical grade), 2-octanol standard (purity over 97%) and NaOH solution (0.1M) were purchased from Merck (Darmstadt, Germany). Kits for the multiparametric analyzer were purchased from Steroglass. MS grade dichloromethanewas supplied by Carlo Erba (Milan, Italy). Water was obtained from a Milli-Q purification system (Millipore).
2.4. Sensory Analysis
The tasters panel was composed of 14 experienced tasters selected among personnel at CREA-VE, sommeliers, winemakers, wine professionals, and grape growers (11 males and 3 females; mean age of 49.3±11.4). All of the individuals had at least three years of experience working in the wine industry and were considered experts based on the criteria by Parr et al. [19]. The panel was composed of subjects already familiar with the testing procedure. The testers were requested not to smoke or eat for one hour prior to the sensory sessions. The wines were evaluated after 18 months of bottle aging at 18°C. The evaluation was performed in duplicate using a completely randomized design. The attributes characterizing the wines for aroma and flavor by mouth were: fruity (as white fruits and ripened fruits), floral, balsamic, herbaceous, phenolic aromas, sourness, astringency (relative to tannins or procyanidins [20], body (mouthcoat and/or ethanol), persistency (how long the first taste sensation produced by the wine persists on the palate), sapidity (sensation of minerality due to dissolved mineral substances), typicity (the degree to which a wine reflects its varietal originsand the grape from which it was produced) and pleasantness. These attributes, together with colour (relative to colour intensity and tint) and perlage (presence, persistence, and dimension of the bubbles) were evaluated on intensity scales from 1 to 10 (where 1 means absent/negative while 10 intense/excellent). The mean scores of all the attributes were submitted to a Quantitative Descriptive Analysis (QDA). The sensory session was conducted under natural light with 50 mL wine at 10°C in 125 ml ISO wine glasses, labeled with three-digit random numbers, and covered with plastic film.
2.5. NIR Data
NIR absorption measurements were carried on a TANGO FT-NIR spectrometer (Bruker, Germany). NIR spectra were collected by data acquisition software OPUS/QUANT software version 2.0 (Bruker Optik GmbH, Ettlingen, Germany) between 12,000–4000 cm-1 (833–2500 nm), with 8 cm-1 resolution and 64 scans. A background spectrum was automatically recorded, before each sample. Both temperature and relative humidity of the room were kept constant with an air conditioning system.
2.6. Statistical Analysis
The statistical procedures described in detail in the following paragraphs, including analysis of variance, pre-treatments of the original NIR spectra, and Principal Component Analysis (PCA) were performed using R Statistical Software (v 4.4.2; R Core Team 2024) [21]. The R packages used are listed in alphabetical order: corrplot [22], ggbiplot [23], ggplot2 [24], IMIFA [25], and mdatools [26]. Chemical data were subjected to an analysis of variance at 95% significance level (p < 0.05). Prior to PCA data were normalized with a Pareto scaling, to eliminate differences introduced by the different measurement units [27].
3. Results and Discussion
3.1. Basic and Sparkling Wines Chemical Composition
For the production of base wines, a commercial S. cerevisiae strain (VB1,Oenobrands) was inoculated sequentially to a native L. thermotolerans (Lt) strain or, in alternative, only the commercial S. cerevisiae (VB1, Oenobrands) was used. As is typical for non-Saccharomyces yeasts, pure cultures of L. thermotolerans cannot fully ferment all sugars to complete the wine fermentation process. Therefore, they require the simultaneous or sequential addition of another co-starter, usually a strain of S. cerevisiae [28]. Among the various autochthonous starter cultures available for grapevine fermentation, we selected this non-Saccharomyces yeast due to the potential of some L. thermotolerans strains to produce mixed-culture dry wines with pH and ethanol levels that are either comparable to or significantly lower than those of wines fermented exclusively with S. cerevisiae. The relatively extensive fermentation capabilities of L. thermotolerans can positively influence these wines by partially converting sugars into lactic acid during alcoholic fermentation while producing less acetic acid, which significantly affects the pH of the wines [13,28] Unfortunately, due to complications during the fermentation process, it was not possible to obtain a base wine using L. thermotolerans for the Falanghina variety.
The base wines (Table 1) showed values in line with those usually obtained for each variety: Fiano bianco (alcohol 12 – 13.5 % vol, pH 3.1 – 3.5, TA 6.5 – 9.5 g/L), Greco bianco (alcohol 11.5 – 13 %vol, pH 3.0 – 3.4, TA 6.5 – 9.5 g/L), Falanghina (alcohol 11 – 12.5 % vol, pH 3.1 – 3.4, TA 6.5 – 10 g/L), and Montonico (alcohol 12 – 13.5 % vol, pH 3.1 – 3.3, TA 7 – 10 g/L) [29]. The Lt and VB1 base wines of each variety did not differ for pH, TA, ethanol, and malic acid content. A difference in the lactic acid content was observed, with Fiano Lt wine showing the highest content, probably linked to Lt yeast’s lactic acid production ability. For Montonico wines the lactic acid was higher in VB1 compared to Lt, while in the Greco wines, the lactic acid was always absent. Moreover, Greco wines showed the lowest alcohol content among the base wines produced; notably, the alcohol % is in the lowest range of the values usually expected for this variety.
There was a difference in the amount of residual sugars between wines from the same variety, with Lt wines showing the highest amount for Fiano and Greco, while for Montonico it was the wine obtained with VB1 yeast. Residual sugars were absent only in Greco VB1, which indicates that fermentation was fully completed for this wine. The high sugar levels in the Lt base wines suggest that the fermentation was not efficient for both Fiano and Greco when using the Lt yeast. Additionally, we found that volatile acidity was lower in both the Fiano and Greco wines made with VB1 compared to those of the same varieties made with Lt, while no significant difference was found between Montonico base wines produced with the two yeasts. The highest volatile acidity was found in Greco Lt wine. The Lt strain used probably was not able to deliver a low production of acetic acid for Fiano and Greco varieties.Previous studies have highlighted that the composition of wines is influenced by both the yeast strain used and the inoculation method [28]. In our case, the L. thermotolerans yeast that we employed did not produce base wines with all the desirable characteristics obtained with some other strains. This may be related to the ability of the specific isolates of L. thermotolerans used to ferment the selected grape varieties.
The secondary fermentation step poses several problems to yeast survival. This step is carried on at low temperatures (10–15 °C), and yeasts have to carry on fermentation with increasingly high pressure (about 6 atm) and in the presence of high amount of CO2 [30]. For the second fermentation, two different S. cerevisiae strains were used: an indigenous yeast isolated from grape, which has previously been tested on white and rosé sparkling wines for its aptitude to carry on in-bottle secondary fermentation, and a commercial one. The results of the secondary fermentation step can be better understood by examining the chemical composition of the base wines. In addition to the lack of nutrients (like sugar), which are added, these wines pose difficulties for yeast survival due to harsh conditions. These conditions include low pH levels, high ethanol content, elevated polyphenolic content and the presence of SO2 [10,30]. The presence of ethanol in the base wines is the main factor influencing the ability of yeast strains to carry on the secondary fermentation. Another stress factor for yeasts is low pH levels (ranging from 2.9 to 3.2). At low pH levels, weak organic acids like tartaric, malic, lactic, succinic, and acetic acid, which have a pKa higher than the wine pH, can enter yeast cells in their undissociated forms. Once inside the yeast cells, these molecules acidify the cytosol, potentially leading to sluggish or stalled fermentation. Furthermore, there is a negative synergistic effect when low pH and high ethanol levels are combined, as together they inhibit alcoholic fermentation. This inhibition reduces the fermentation rate and decreases the activity of enolase, an enzyme that is involved in metabolic pathways essential to cellular function [30].
Even if no difference in alcohol content was found between base wines from the same varieties, the Montonico and Fiano ones show the highest amount of alcohol compared to all the other base wines. This represents a negative feature in a base wine since fermentation capacity of yeasts decrease with the increase of the ethanol content.
The SO2 level was always higher in VB1 wines, with Montonico showing the highest value. Moreover, for Fiano and Montonico total polyphenols were higher in VB1 wines, while for Greco it was the Lt wine which showed the highest value among of all the base wines. Concerning volatile acidity, expressed as acetic acid, it was quite low in all wines ranging from 0.24 to 0.44 g/L. This data indicate how Montonico base wines showed the least favorable conditions to ensure tolerance of yeasts to the medium.
The main parameters measured on the selected sparkling wines are reported in Table 2. A few wines (two Fiano and two Falanghina wines obtained using Lt in the first fermentation, and two Greco wines) were discarded by our oenologist due to perceived defects.
There was no difference in pH for sparkling wines from the same variety. Both Fiano wines showed the same TA values, and it was also true for the two Greco wines, which showed the highest acidity of all the wines analysed. The Falanghina wine 18-200 showed a higher TA compared to the S21 one. Among Montonico wines Lt-18-2007 had the highest TA. The highest volatile acidity was found in the Falanghina wines and in the two Montonico obtained with Lt in the first fermentation. Malic acid was present in all wines, with the Fiano being characterized by the smallest content, followed by all the four Montonico with a slightly higher content, and Greco and Falanghina showing the highest content. Traces of lactic acid were found in Falanghina VB1-S21, while three out of four Montonico wines (apart from Montonico VB1 -18-2007) showed a slightly higher amount of this acid. Tartaric acid was lower in all the Montonico wines, while the highest amount was found in both the Greco wines. In our base wines, the lowest alcohol content was found in the two Greco wines (10.5%vol), while all the others showed higher alcohol content. The alcohol content for Montonico wines was quite high, since sparkling wines generally range from 10.5% to 12.5% alcohol by volume. Residual sugars were found in small amount in Greco wines, in different amounts in the other wines, with the highest in Montonico Lt+18-2007 (19 g/L) strictly followed by Montonico Lt+S21 (18 g/L) and Vb1+S21 (15 g/L). The high levels of residual sugars in Montonico wines suggest suboptimal secondary fermentation, which was anticipated due to the harsh conditions for yeast survival caused by the base wine composition.
3.2. Sensory Analysis
Among all the sparkling wines, ten were subjected to a sensory evaluation by a panel of expert wine testers. A Person correlation was performed to understand the relationship among the scores of the various sensory parameters. The main parameters highly positively correlated to the perceived pleasantness of the wines are linked to the visual aspect , like color, perlage, and bubble size. This is in agreement with the known relevance of foam characteristics (foamability, persistence, in-mouth aggressiveness, and bubble size) and color for consumers appreciation of sparkling wines [31]. Also, aroma plays an important role in consumer’s liking, indeed another parameter positively correlated with pleasantness is white flowers aroma. Instead, ripen and balsamic aromas negatively influenced the perceived pleasantness of the wines (Figure 1).
The mean aroma-intensity scores for the wines are reported in a radar plot (Figure 2). In the sensory analysis, Fiano and Falanghina wines obtained with both yeast combinations were equally appreciated. Instead, for both Greco and Montonico varieties all the wines obtained using Lt in the first fermentation step were appreciated the least or not at all. Color was also a very important discriminator factor for wine appreciation. The two least appreciated wines showed the lowest rating for this parameter. Indeed, the color of these two wines was way darker than all the others which was probably negatively linked to the supposed appearance of sparkling wines in the eyes of the tasters. The sugar type added during the second fermentation has a great influence on sparkling wines in terms of consumer’s liking. In the liqueur de tirage added for the secondary fermentation, we used cane sugar in a concentration that would have enabled good foam quality in all wines. The difference observed among wines in the foam characteristics could be attributed to a poor secondary fermentation performed by yeasts in Montonico base wines probably linked to the high alcohol representing harsh conditions for yeast survival.
3.3. Volatilome Analysis
The volatile composition of the sparkling wines is shown in Table 3. A total of 62 volatile compounds were detected and quantified in each wine. Based on their chemical structure, there were identified as: 20 alcohols (including polyols and polyphenols), 14 carboxylic acids, 15 esters, 3 terpenoids, 3 lactones, 3 methoxyphenols, and 4 others (aldehydes, ketones, and amides).
The composition of base wine and the choice of yeast strain are the most important factors that influence the sensory quality of sparkling wines [32]. Aroma compounds can be attributed to either the grape variety (pre-fermentative aroma) or to the yeasts used for the fermentation. The yeasts contribute to the aroma at various stages: during the fermentation processes (fermentative aroma) and during the aging period (post-fermentative aroma) [32]. Among various native strains tested for sparkling wines, the autochthonous S. cerevisiae S21 strain was selected for its ability to produce a variety of appreciated volatile organic compounds (VOCs) during in-bottle secondary fermentation together with a low production of acetic acid [10]. Indeed, wines made with the S21 strain showed a lower acetic acid content, with the Fiano Vb+S21 wine displaying no detectable acetic acid. The mean value of acetic acid in our sparkling wines was comparable to the levels reported in the literature (0.6–0.9 g/L level) and below the sensitive threshold (about 0.8 g/L of acetic acid) [10]. Acetic acid and ethyl acetate are the main contributors to perceived volatile acidity, and the presence of the latter increases the acidity sensory perception of wines. In all our wines the ethyl acetate was not detected.
We detected all the higher alcohols, esters and volatile acids that characterized sparkling wines previously obtained with the S21 yeast strain [10]. The main alcohols previously detected were 3-methyl butanol (or isoamyl alcohol) and phenylethanol, which are the main alcohols also detected in all our sparkling wines. Among ethyl esters of fatty acids, the ethyl lactate and monoethyl succinate followed by diethyl succinate and diethyl malate were the prevalent ones, both in the literature and in our wines. Also hexanoic and octanoic acids were found as the most abundant carboxylic acids in accordance with results in previous articles.
It is known that the quali-quantitative nature of VOCs released by S. cerevisiae yeasts is strain-dependent [32,33]. Therefore, in contrast to employment ofcommercial yeasts we expected indigenous yeast strains to produce wines denoted by peculiar flavor highlighting unique properties that differentiate typical regional wines [34]. Anyway, concerning differences in the concentration of the main VOCs between S21 wines and those obtained with commercial yeasts from the same variety, there was not a striking significant difference in favour of S21 wines. The differences observed in the volatile composition of wines obtained from the different S. cerevisiae yeast strains (commercial or authoctonous) appear to be quantitative rather than qualitative, which is in agreement with previous studies [35,36].
Another reason for the difference with previous works could be attributable to the different grape varieties tested in the previous study (Nero di Troia and Bombino bianco) with the S21 yeasts. Indeed, both the composition of the base wine and the choice of yeast strain could influence the final product. As a recent review underlines, in some cases, the autochthonous yeast strains can have a significant impact on the aroma and metabolome of sparkling wines when compared to commercial strains [37]. However, in other cases, the sensory characteristics of the sparkling wines appear to be more influenced by the properties of the base wine than by the yeast strain used [31].
Among the detected VOCs we found three metoxy phenols. In our case, after grape pressing the musts were clarified using commercial pectinase enzymes (0.01g/L Rapidase® Clear by DSM). These pectinases possess enzymatic activities that could have transformed cinnamic acids (such as p-cumaric and ferulic) in metoxy phenols derivatives [38].
3.4. Odour Activity Value and Principal Component Analysis
The knowledge of wine volatilome composition in terms of concentration of individual VOCs is not sufficient to explain the perceived wine aroma. This is because compounds with high concentrations may not necessarily be the primary contributors to the aroma; some molecules can be detected by tasters even at very low levels. To assess the contribution of different compounds, the the odour activity value (OAV) is calculated for each molecule. The OAV is the ratio of the concentration of a specific compound in the sample to its odour perception threshold (OPT). The OPT value is the lowest concentration at which a molecule can be detected by the human nose [39].
Supplementary Table S1 shows the CAS number, OAV, OPT, and odor descriptor for all the metabolites identified in this work.
Aroma compounds with OAVs of 1 or greater are usually considered major contributors to the perceived aroma, whereas those with OAVs lower than 1 are minor contributors [40]. Compounds with OAVs below 0.1 are regarded as irrelevant to the product's aroma [41]. The OAV is as a simple way to assess the importance of a specific compound to the perceived aroma. However, its widespread use has faced criticism, including caution from its creator that proposed this method as a guide that may not be universally applicable [42]. A major concern is that OTP values are often retrived from the literature, where they were not measured in a matrix similar to the sample. The medium used to measure the OPT in the available literature varies greatly (water, hydro-alcoholic solution, model wine, real wine matrix or an organic solvent). Additionally, OAVs fail to account for interactions between different aromatic substances and other non-volatile matrix components, which can significantly alter OTPs. For instance, matrix effects can lead to variations in thresholds for the same compound across different solvents, with some showing differences by factors of 2 or more. Constituents like ethanol can increases the solubility of volatiles impeding their volatilization and sensory recognition, while high concentrations of polyphenols in red wines may further affect sensory perception. Dissolved CO2 and other odor-active volatiles may further mask aroma compounds of interest and increase their OPTs [41,43]. Overall, matrix complexity can mask desired aroma compounds and increase their OTPs.
For all the aforementioned reasons, we included all detected VOCs, regardless of their OAV value, along with the main wine parameters as variables for a principal component analysis (PCA). PCA is a commonly used unsupervised learning technique. Each PCA component is a linear combination of the original variables and explains part of the total variance in the data set [44,45,46]. Since the data were recorded in different units and exhibited large deviations, we applied a Pareto scaling to give equal weight to each variable before the PCA analysis. Unlike conventional autoscaling, Pareto scaling employs the square root of the standard deviation rather than the standard deviation itself. This approach reduces the impact of large fold changes more than that of smaller fold changes, thereby lessening the dominance of large fold changes in the cleaned data [27]. Additionally, the method used for handling missing values involved replacing them with the mean of the non-missing values for each variable (metabolite or parameter) [47].
A total of 65.8% variance was explained by the first two PCs, as shown in Figure 3. The plot shows a clear distinction among wines, with the two least appreciated ones located in the second quadrant (MLtS21 et MLt18) and in the third (MVb18 et MVb21). In contrast, the most appreciated ones are situated in the first and fourth quadrants, with wines of the same variety being very close to each other (the two Fiano and the two Falanghina). The two Greco wines, which received different ratings, are both in the fourth quadrant but are separated from one another. To understand the chemical differences responsible for the wine's placement in the PCA plot, we used the loadings (Figure 4). Loadings range from -1 to 1, with a high absolute value indicating that a variable has a strong influence on that PCA component. The closer to 0 is the variable, the smaller its contribution on that PC. The least appreciated wines (MLtS21 et MLt18) are placed in the second quadrant, which is characterized by high volatile acidity, residual sugar, alcohol content and pH. Moreover, these wines were rich in VOCs mainly linked to unpleasant aromas (rancid acidic, medicinal, alcohol) such as acetic acid, isobutyric acid, isovaleric acid, isobutanol and all three guaiacols detected by GC-MS. Some sweet/floral aromas (vanillin, benzenacetic acid ethyl-9-decenoate, alfa terpineol, epoxylinalol S), a few fruity ones (2,3-butandiol,ethyl lactate,ethyl 3-hydroxybutanoate) and two earthy ones (ethyl pyruvate, epoxylinalol R) also contributed to the positive PC1 and negative PC2. Indeed, in the sensory analysis these least appreciated wines were lacking in herbaceous, floral, and white fruits notes. Instead, they exhibited notes of ripened fruits and balsamic flavors, which are negatively correlated with pleasantness (Figure 1). The two wines in the third quadrant (MVb18 et MVb21), which were slightly more appreciated than the other two Montonico wines, also showed high pH, alcohol, and residual sugar content. Anyway, these wines had a lower volatile acidity and were characterize by a larger number of VOCs, which included only few unpleasant ones, like methoxy phenols, among several other pleasant compounds. Despite the differences in VOCs, the other wines that were perceived as more pleasant showed lower alcohol %, residual sugar, lactic acid, methoxy phenols content and pH. Therefore, higher pH, along with high alcohol % and residual sugar appear to be significant factors contributing to the lack of appreciation for Montonico wines. Among the three varieties that produced the most appreciate wines (Fiano, Falanghina and Greco), the two Falanghina are the only located in the first quadrant (positive PC1). Those wines show a higher volatile acidity and the presence of 9-decenoic acid (waxy type odor and an waxy type flavor) in a concentration with higher OAV compared to Greco and Fiano ones (Supplementary Table S1). Fiano and Greco negative PC1 coordinates indicates the contribution of a large number of VOCs. Among those with higher loading on PC1 and higher OAV there are the diethylsuccinate, ethylhexanoate, isoamyl acetate, ethyl butyrate, and 3-ethoxy-1-propanol with fruity aromas and the 1-hexanol with herbaceous notes. Indeed, the Greco and Fiano wines obtained a high rating for floral parameter and low rating for ripen fruit parameters by tasters. Since the least liked Montonico wines received high rating for ripen fruit parameter, it confirms how this type of aroma is not an appreciated note in sparkling wines. For all wines with positive PC2 testers perceived intense notes of white fruits (both the Falanghina, both the the Greco, as well as Fiano VB1+18). However, the positive PC2 is not characterized by molecules that have a distinct floral character, instead there are cis-3-hexenol (green, bitter, fatty) and 4-methyl 1-pentanol (almond, toasted). Wine aroma results from a combination of various molecules, some volatile and some non-volatile, which can influence each other in a complex way, so it is not easy some volatile and some non-volatile, which can interact and influence each other in a complex way. Therefore, it is challenging to associate "floral" and "fruity" aromas with just a few specific compounds [48]. The strong contribution to the positive PC2 axis of tartaric and malic acids along with their correspondent diethyl esters (diethyl malate and diethyl tartrate), explains the sour taste detected in Greco wines. Indeed, the higher the concentration of tartaric acid and malic acid, the stronger the puckering sensation in the mouth, which leads to increased salivation. Interestingly, a compound that contributes to the negative PC1 axis is tyrosol. This phenolic compound commonly present in wine and formed by yeasts during fermentation possess a remarkable value due to antioxidant properties and beneficial effects at cardiovascular level [49].
3.5. NIR
We decided to perform a NIR analysis to search for specific regions able to provide insights into the outcomes of the sensory analysis. Unfortunately, it was not possible to analyze Fiano Vb1+S21 and Falanghina VB1+18-2007 wines. However, we included Fiano VB1+18-2007IOC and Falanghina VB1+S21 as the other two wines of the same varieties exhibited similar levels of appreciation in the sensory testing. A spectroscopic data scatter correction, the Standard Normal Variate (SNV) was applied to the NIR data [50]. A PCA plot with NIR spectra as variables allowed the selection of the wave numbers that contributed more to the differentiation of the wines, as illustrated in Figure 5. In the plot the PC1 axis is the most important for the differentiation, accounting for 90.3% of the variance. The wines are not grouped by the perceived pleasantness nor by the grape variety. Since CO2 absorbs in the NIR range, the dissolved gas was removed through sonication in cold water. Ice was added to the water bath to keep the temperature low and prevent heating of the samples. We hypothesize that the absence of clustering observed in the PCA could be attributed to the removal of CO2. Indeed, the presence of CO2 plays an important role in perceived pleasantness of the analyzed wines.
In order to better understand the placement of wines in the plot, we selected the wave numbers with the highest weight on PC1 and PC2 (72 negative and 32 positive values) which were used to build a correlation plot (Pearson correlation) with the sensory outcome (Figure 6). Through the correlation values it is clearly visible the contribution of specific wave numbers to selected sensory parameters. The 7324-5292 cm-1 range was positively correlated with astringency, a parameter associated to the presence of tannins or procyanidins. These molecules show a broad variety of complex structures [51]. The wavelengths around 7000 cm−1 and 5300 cm−1 correspond to the first overtones of COH groups, the first overtones of CH2 and CH3 groups, all functional groups compatible with tannins structure [46].
The 5292, 5288, 5116, 4940, 4936, 4172, 4144, 4140, and 4116 cm-1 wave numbers that are associated with the first overtones of CH2 and CH3 groups, and COH combination (stretching and bending) vibrations [46], were highly negatively correlated with balsamic. A few wavelengths were highly correlated with several parameters: 5292, 5160, 4256, 4172, and less 4940, 4128,4124 cm-1, which, again, can be attributed to vibration of several chemical groups. Attributing specific NIR peaks to individual molecules is not straightforward, and this attribution can sometimes be misleading. The peaks that differentiate the samples may be associated with the vibrations of molecular bonds in compounds that are not directly linked to the measured parameters. Instead, these peaks could result from interactions with surrounding compounds. Unfortunately, the limited number of samples available makes it impossible to conduct a reliable prediction or classification analysis.
4. Conclusion
With per capita wine consumption declining significantly, sparkling wines are the only grape-derived beverage still on the rise. Shrinking wine consumption has sparked the search for new products capable of satisfying consumer liking. A unique aspect of wine sets it apart from other alcoholic beverages is its perceived “identity”, which is linked to heritage and terroir. In this work, we produced and analyzed novel sparkling wines using native grape varieties typically used for white wine production, in combination with indigenous yeasts. These novel sparkling wines represent a way of to maintain wine's identity while adapting to changing market demands. Novel product acceptance was tested showing how two varieties, Fiano and Falanghina, produced sparkling wines well appreciated with pleasant floral and white fruit notes. In contrast, wines primarily characterized by flavors of ripe fruits and balsamic notes did not receive as much appreciation. Visual characteristics, such as color, size, and the persistence of CO2 bubbles, also contributed to the positive evaluation of the wines. Unfortunately, the indigenous yeast strains tested did not show significant differences compared to commercial yeasts in terms of the variety of volatile compounds produced; instead, they mainly affected the relative amounts of specific VOCs. These results indicate that wine producers can adapt their products to align with consumer preferences by using classic grape varieties in combination with native yeasts. This approach allows for the creation of various alcoholic products that retain a recognizable identity while being more in tune with evolving purchasing trends.
Supplementary Materials
The following supporting information can be downloaded at the website of this paper posted on Preprints.org, Table S1: Aroma compounds identified in the sparkling wines with their odor activity value (OAV), odor perception threshold (OPT), and odor descriptor.
Author Contributions
Conceptualization, Teodora Basile and Maria Francesca Cardone; Data curation, Teodora Basile, Giambattista Debiase and Francesco Mazzone; Formal analysis, Giambattista Debiase, Francesco Mazzone, Antonio Domenico Marsico and Leonardo Scarano; Project administration, Maria Francesca Cardone; Software, Teodora Basile; Supervision, Maria Francesca Cardone; Writing – original draft, Teodora Basile; Writing – review & editing, Giambattista Debiase, Francesco Mazzone and Maria Francesca Cardone.
Funding
This research was funded by Spumantizzazione E Frizzantatura dei vini Pugliesi, SPUMAPULIA-P.S.R. Puglia 2014/2020, Misura 16-Cooperazione, Sottomisura 16.2. D.A.G. n°194 12 September 2018, published in BURP n°121 20 september 2018.
Data Availability Statement
The original contributions presented in this study are included in the article. Further inquiries can be directed to the corresponding author.
Acknowledgments
The authors thank Dr. Vittorio Capozzi and Dr. Giuseppe Spano of Department of Agricultural Sciences, Food, Natural Resources and Engineering (DAFNE), Università di Foggia for providing the native S. cerevisiae yeast strain S21 used for experiments.
Conflicts of Interest
The authors declare no conflicts of interest. The funders had no role in the design of the study; in the collection, analyses, or interpretation of data; in the writing of the manuscript; or in the decision to publish the results.
References
- International Organization of Vine and Wine (OIV), State of the world vine and wine sector in 2023. Available online: https://www.oiv.int/sites/default/files/2024-04/OIV_STATE_OF_THE_WORLD_VINE_AND_WINE_SECTOR_IN_2023.pdf (accessed on 01 October 2024).
- Italian trade agency, Spirits to outpace beer and wine. Available online: https://www.ice.it/it/news/notizie-dal-mondo/274271 (accessed on 01 October 2024).
- International Organization of Vine and Wine (OIV), OIV Focus The Global Sparkling Wine Market. 2023. Available online: https://www.oiv.int/public/medias/7291/oiv-sparkling-focus-2020.pdf (accessed on 01 October 2024).
- Ritrovato, E. The Wines of Apulia: The Creation of a Regional Brand. In A History of Wine in Europe, 19th to 20th Centuries. Markets, trade and regulation of quality; Conca Messina, S.A., Le Bras, S., Tedeschi, P., Vaquero Piñeiro, M., Eds.; Palgrave Macmillan Cham, Springer Nature: Switzerland, 2019; Volume II, pp. 117–135. [Google Scholar] [CrossRef]
- Harvey, M.; White, L.; Frost, W. Exploring wine and identity. In Wine and Identity: Branding, Heritage, Terroir; Harvey, M., White, L., Frost, W., Eds.; Routledge: United Kingdom, 2014; pp. 1–13. [Google Scholar]
- Padilla, B.; Zulian, L.; Ferreres, À.; Pastor, R.; Esteve-Zarzoso, B.; Beltran, G.; Mas, A. Sequential Inoculation of Native Non-Saccharomyces and Saccharomyces cerevisiae Strains for Wine Making. Front Microbiol. 2017, 8, 1293. [Google Scholar] [CrossRef]
- Tufariello, M.; Maiorano, G.; Rampino, P.; Spano, G.; Grieco, F.; Perrotta, C.; Capozzi, V.; Grieco, F. Selection of an autochthonous yeast starter culture for industrial production of Primitivo “Gioia del Colle” PDO/DOC in Apulia (Southern Italy). LWT 2019, 99, 188–196. [Google Scholar] [CrossRef]
- Garofalo, C.; Arena, M.; Laddomada, B.; Cappello, M.; Bleve, G.; Grieco, F.; Beneduce, L.; Berbegal, C.; Spano, G.; Capozzi, V. Starter cultures for sparkling wine. Fermentation 2016, 2, 21. [Google Scholar] [CrossRef]
- Vecchio, R.; Lisanti, M.T.; Caracciolo, F.; Cembalo, L.; Gambuti, A.; Moio, L.; Siani, T.; Marotta, G.; Nazzarao, C.; Piombino, P. The role of production process and information on quality expectations and perceptions of sparkling wines. J. Sci. Food Agric. 2018, 99, 124–135. [Google Scholar] [CrossRef]
- Garofalo, C.; Berbegal, C.; Grieco, F.; Tufariello, M.; Spano, G.; Capozzi, V. Selection of indigenous yeast strains for the production of sparkling wines from native Apulian grape varieties. Int J Food Microbiol 2018, 285, 7–17. [Google Scholar] [CrossRef] [PubMed]
- Martínez-Rodríguez, A.J.; Carrascosa, A.V.; Barcenilla, J.M.; Pozo-Bayón, M.A.; Polo, M.C. Autolytic capacity and foam analysis as additional criteria for the selection of yeast strains for sparkling wines production. Food Microbiol 2001, 18, 183–191. [Google Scholar] [CrossRef]
- Marsico, A.D.; Velenosi, M.; Perniola, R.; Bergamini, C.; Sinonin, S.; David-Vaizant, V.; Maggiolini, F.A.M.; Hervè, A.; Cardone, M.F.; Ventura, M. Native Vineyard Non-Saccharomyces Yeasts Used for Biological Control of Botrytis cinerea in Stored Table Grape. Microorganisms 2021, 9, 457. [Google Scholar] [CrossRef]
- Hranilovic, A.; Gambetta, J.M.; Schmidtke, L.; Boss, P.K.; Grbin, P.R.; Masneuf-Pomarede, I.; Bely, M.; Albertin, W.; Jiranek, V. Oenological traits of Lachancea thermotolerans show signs of domestication and allopatric differentiation. Sci Rep 2018, 8, 14812. [Google Scholar] [CrossRef]
- Roudil, L.; Russo, P.; Berbegal, C.; Albertin, W.; Spano, G.; Capozzi, V. Non-Saccharomyces commercial starter cultures: scientific trends, recent patents and innovation in the wine sector. Recent Pat Food Nutr Agric 2020, 11, 27–39. [Google Scholar] [CrossRef]
- International Organization of Vine and Wine (OIV), Compendium of methods of wine and must analysis. Available online: https://www.oiv.int/standards/compendium-of-international-methods-of-wine-and-must-analysis (accessed on 01 October 2024).
- McMahon, K.M.; Diako, C.; Aplin, J.; Mattinson, D.S.; Culver, C.; Ross, C.F. Trained and consumer panel evaluation of sparkling wines sweetened to brut or demi sec residual sugar levels with three different sugars. Food Res Int 2017, 99, 173–185. [Google Scholar] [CrossRef] [PubMed]
- Crumpton, M.; Rice, C.J.; Atkinson, A.; Taylor, G.; Marangon, M. The effect of sucrose addition at dosage stage on the foam attributes of a bottle-fermented English sparkling wine. J Sci Food Agric 2018, 98, 1171–1178. [Google Scholar] [CrossRef]
- Perestrelo, R.; Fernandes, A.; Albuquerque, F.F.; Marques, J.C.; Câmara, J.S. Analytical characterization of the aroma of Tinta Negra Mole red wine: Identification of the main odorants compounds. Analytica chimica acta 2006, 563, 154–164. [Google Scholar] [CrossRef]
- Parr, W.V.; White, K.G.; Heatherbell, D.A. Exploring the nature of wine expertise: What underlies wine experts’ olfactory recognition memory advantage. Food Qual Prefer 2004, 15, 411–420. [Google Scholar] [CrossRef]
- Molino, S.; Pilar Francino, M.; Rufián Henares, J.Á. Why is it important to understand the nature and chemistry of tannins to exploit their potential as nutraceuticals? Food Res Int 2023, 173, 113329. [Google Scholar] [CrossRef]
- R Core Team, R: A Language and Environment for Statistical Computing. R Foundation for Statistical Computing, Vienna, Austria. 2024. Available online: https://www.R-project.org/ (accessed on 01 October 2024).
- Wei, T.; Simko, V. R package 'corrplot': Visualization of a Correlation Matrix. (Version 0.95). 2024. Available online: https://github.com/taiyun/corrplot (accessed on 01 October 2024).
- Vu, V.Q. ggbiplot: A ggplot2 Based Biplot. R Package, Version 0.55. 2011. Available online: http://github.com/vqv/ggbiplot (accessed on 01 October 2024).
- Wickham, H. ggplot2: Elegant Graphics for Data Analysis; Springer Cham: New York, USA, 2016; ISBN 978-3-319-24277-4. [Google Scholar] [CrossRef]
- Murphy, K.; Viroli, C.; Gormley, I.C. Infinite Mixtures of Infinite Factor Analysers. Bayesian Anal 2020, 15, 937–963. [Google Scholar] [CrossRef]
- Kucheryavskiy, S. mdatools—R package for chemometrics. Chemom Intell Lab Syst 2020, 198, 103937. [Google Scholar] [CrossRef]
- Seisonen, S.; Vene, K.; Koppel, K. The current practice in the application of chemometrics for correlation of sensory and gas chromatographic data. Food Chem 2016, 210, 530–540. [Google Scholar] [CrossRef] [PubMed]
- Hranilovic, A.; Albertin, W.; Liacopoulos Capone, D.; Gallo, A.; Grbin, P.R.; Danner, L.; Bastian, S.E.P.; Masneuf-Pomarede, I.; Coulon, J.; Bely, M.; Jiranek, V. Impact of Lachancea thermotolerans on chemical composition and sensory profiles of Merlot wines, Food Chem 2021, 349, 129015. [CrossRef]
- Antonacci, D. Grape Vines of Apulia; Publisher: Adda Ed., Bari, Italy, 2009; ISBN 978-8880826217.
- Borrull, A.; Poblet, M.; Rozès, N. New insights into the capacity of commercial wine yeasts to grow on sparkling wine media. Factor screening for improving wine yeast selection. Food Microbiol 2015, 48, 41–48. [Google Scholar] [CrossRef]
- Cravero, M.C. Innovations in Sparkling Wine Production: A Review on the Sensory Aspects and the Consumer’s Point of View. Beverages 2023, 9, 80. [Google Scholar] [CrossRef]
- Di Gianvito, P.; Perpetuini, G.; Tittarelli, F.; Schirone, M.; Arfelli, G.; Piva, A.; Patrignani, F.; Lanciotti, R.; Olivastri, L.; Suzzi, G.; Tofalo, R. Impact of Saccharomyces cerevisiae strains on traditional sparkling wines production. Food Res Int 2018, 109, 552–560. [Google Scholar] [CrossRef]
- Martínez-Rodríguez, A.J.; Polo, M.C. Characterization of the nitrogen compounds released during yeast autolysis in a model wine system. J Agric Food Chem 2000, 48, 1081–1085. [Google Scholar] [CrossRef]
- Tufariello, M.; Maiorano, G.; Rampino, P.; Spano, G.; Grieco, F.; Perrotta, C.; Capozzi, V.; Grieco, F. Selection of an autochthonous yeast starter culture for industrial production of Primitivo “Gioia del Colle” PDO/DOC in Apulia (Southern Italy). LWT 2019, 99, 188–196. [Google Scholar] [CrossRef]
- Mateo, J.J.; Jimenez, M.; Huerta, T.; Pastor, A. Contribution of different yeasts isolated from musts of monastrell grapes to the aroma of wine. Int J Food Microbiol 1991, 14, 153–160. [Google Scholar] [CrossRef]
- Torrens, J.; Urpí, P.; Riu-Aumatell, M.; Vichi, S.; López-Tamames, E.; Buxaderas, S. Different commercial yeast strains affecting the volatile and sensory profile of cava base wine. Int J Food Microbiol 2008, 124, 48–57. [Google Scholar] [CrossRef]
- Tufariello, M.; Palombi, L.; Rizzuti, A.; Musio, B.; Capozzi, V.; Gallo, V.; Mastrorilli, P.; Grieco, F. Volatile and chemical profiles of Bombino sparkling wines produced with autochthonous yeast strains. Food Control 2023, 145, 109462. [Google Scholar] [CrossRef]
- Chatonnet, P.; Dubourdieu, D.; Boidron, J.; Lavigne, V. Synthesis of volatile phenols by Saccharomyces cerevisiae in wines. J Sci Food Agric 1993, 62, 191–202. [Google Scholar] [CrossRef]
- Suriano, S.; Basile, T.; Tarricone, L.; Di Gennaro, D.; Tamborra, P. Effects of skin maceration time on the phenolic and sensory characteristics of Bombino Nero rosé wines. Ital J Agron 2015, 10, 21–29. [Google Scholar] [CrossRef]
- Chunhua Zhu, Qi Lu, Xianyan Zhou, Jinxue Li, Jianqiang Yue, Ziran Wang, Siyi Pan, Metabolic variations of organic acids, amino acids, fatty acids and aroma compounds in the pulp of different pummelo varieties, LWT 2020, 130, 109445. [CrossRef]
- Ferreira, V.; de la Fuente, A.; Sáenz-Navajas, M. P. 1 - Wine aroma vectors and sensory attributes. In Woodhead Publishing Series in Food Science, Technology and Nutrition, Managing Wine Qualit, 2nd ed.; Reynolds, A.G., Ed.; Publisher: Woodhead Publishing, Cambridge, United Kingdom, 2022; pp. 3-39. [CrossRef]
- Patton, S.; Josephson, D.V. A method for determining significance of volatile flavor compounds in foods. J Food Sci 1957, 22, 316–318. [Google Scholar] [CrossRef]
- Gottmann, J. Vestner, J. Fischer, U. Sensory relevance of seven aroma compounds involved in unintended but potentially fraudulent aromatization of wine due to aroma carryover. Food Chem 2023, 402, 134160. [Google Scholar] [CrossRef] [PubMed]
- Martínez-García, R.; García-Martínez, T.; Puig-Pujol, A.; Mauricio, J. C.; Moreno, J. Changes in sparkling wine aroma during the second fermentation under CO2 pressure in sealed bottle. Food Chem 2017, 237, 1030–1040. [Google Scholar] [CrossRef]
- Di Egidio, V.; Sinelli, N.; Giovanelli, G.; Moles, A.; Casiraghi, E. NIR and MIR spectroscopy as rapid methods to monitor red wine fermentation. Eur Food Res Technol 2010, 230, 947–955. [Google Scholar] [CrossRef]
- Marsico, A.D.; Perniola, R.; Cardone, M.F.; Velenosi, M.; Antonacci, D.; Alba, V.; Basile, T. Study of the Influence of Different Yeast Strains on Red Wine Fermentation with NIR Spectroscopy and Principal Component Analysis. J 2018, 1, 133–147. [Google Scholar] [CrossRef]
- Sun, J.; Xia, Y. Pretreating and normalizing metabolomics data for statistical analysis. Genes Diseases 2024, 11, 100979. [Google Scholar] [CrossRef] [PubMed]
- Petronilho, S.; Lopez, R.; Ferreira, V.; Coimbra, M.A.; Rocha, S.M. Revealing the Usefulness of Aroma Networks to Explain Wine Aroma Properties: A Case Study of Portuguese Wines. Molecules 2020, 25, 272. [Google Scholar] [CrossRef] [PubMed]
- Chenglin Zhu, Zhibo Yang, Xuan Lu, Yuwen Yi, Qing Tian, Jing Deng, Dan Jiang, Junni Tang, Luca Laghi, Effects of Saccharomyces cerevisiae strains on the metabolomic profiles of Guangan honey pear cider. LWT 2023, 182, 114816. [CrossRef]
- Basile, T.; Mallardi, D.; Cardone, M.F. Spectroscopy, a Tool for the Non-Destructive Sensory Analysis of Plant-Based Foods and Beverages: A Comprehensive Review. Chemosensors 2023, 11, 579. [Google Scholar] [CrossRef]
- Molino, S.; Francino, M.P.; Rufián Henares, Á. J. Why is it important to understand the nature and chemistry of tannins to exploit their potential as nutraceuticals? Food Res Int 2023, 173 Pt 2, 113329. [Google Scholar] [CrossRef] [PubMed]
- Guth, H. Quantification and sensory studies of character impact odorants of different white wine varieties. J Agric Food Chem 1997, 45, 3027–3032. [Google Scholar] [CrossRef]
- Peinado, R.A.; Mauricio, J.C.; Moreno, J. Aromatic series in sherry wines with gluconic acid subjected to different biological aging conditions by Saccharomyces cerevisiae var. capensis. Food Chem 2006, 94, 232–239. [Google Scholar] [CrossRef]
- Peinado, R.A.; Moreno, J.; Bueno, J.E.; Moreno, J.A.; Mauricio, J.C. Comparitive study of aromatic compounds in two young white wines subjected to pre-fermentative cryomaceration. Food Chem 2004, 84, 589–590. [Google Scholar] [CrossRef]
- Welke, J.E.; Zanus, M.; Lazzarotto, M.; Alcaraz Zini, C. Quantitative analysis of headspace volatile compounds using comprehensive two-dimensional gas chromatography and their contribution to the aroma of Chardonnay wine. Food Res Int 2014, 59, 85–99. [Google Scholar] [CrossRef]
- Leibniz-LSB@TUM Odorant Database. Available online: https://www.leibniz-lsb.de/en/datenbanken/leibniz-lsbtum-odorant-database/odorantdb (accessed on 01 October 2024).
- Meilgaard, M.C. Flavor chemistry of beer: part II: flavor and threshold of 239 aroma volatiles. Techn Q Master Brew Assoc Am 1975, 12, 151–168. [Google Scholar]
- Yang, Y.; Chen, J.; Zheng, F.; Lin, B.; Wu, F.; Verma, K.K.; Chen, G. Assessment of Characteristic Flavor and Taste Quality of Sugarcane Wine Fermented with Different Cultivars of Sugarcane. Fermentation 2024, 10, 628. [Google Scholar] [CrossRef]
- Bueno, M.; Zapata, J.; Culleré, L.; Franco-Luesma, E.; de-la-Fuente-Blanco, A.; Ferreira, V. Optimization and Validation of a Method to Determine Enolones and Vanillin Derivatives in Wines-Occurrence in Spanish Red Wines and Mistelles. Molecules 2023, 28, 4228. [Google Scholar] [CrossRef] [PubMed]
- Suyoung Kang, Han Yan, Yin Zhu, Xu Liu, Hai-Peng Lv, Yue Zhang, Wei-Dong Dai, Li Guo, Jun-Feng Tan, Qun-Hua Peng, Zhi Lin, Identification and quantification of key odorants in the world’s four most famous black teas. Food Res Int 2019, 121, 73-83. [CrossRef]
- Lytra, G.; Cameleyre, M.; Tempere, S.; Barbe, J.-C. J Agric Food Chem 2015, 63, 10484-10491. [CrossRef]
Figure 1.
Correlation plot of sensory analysis outcome.
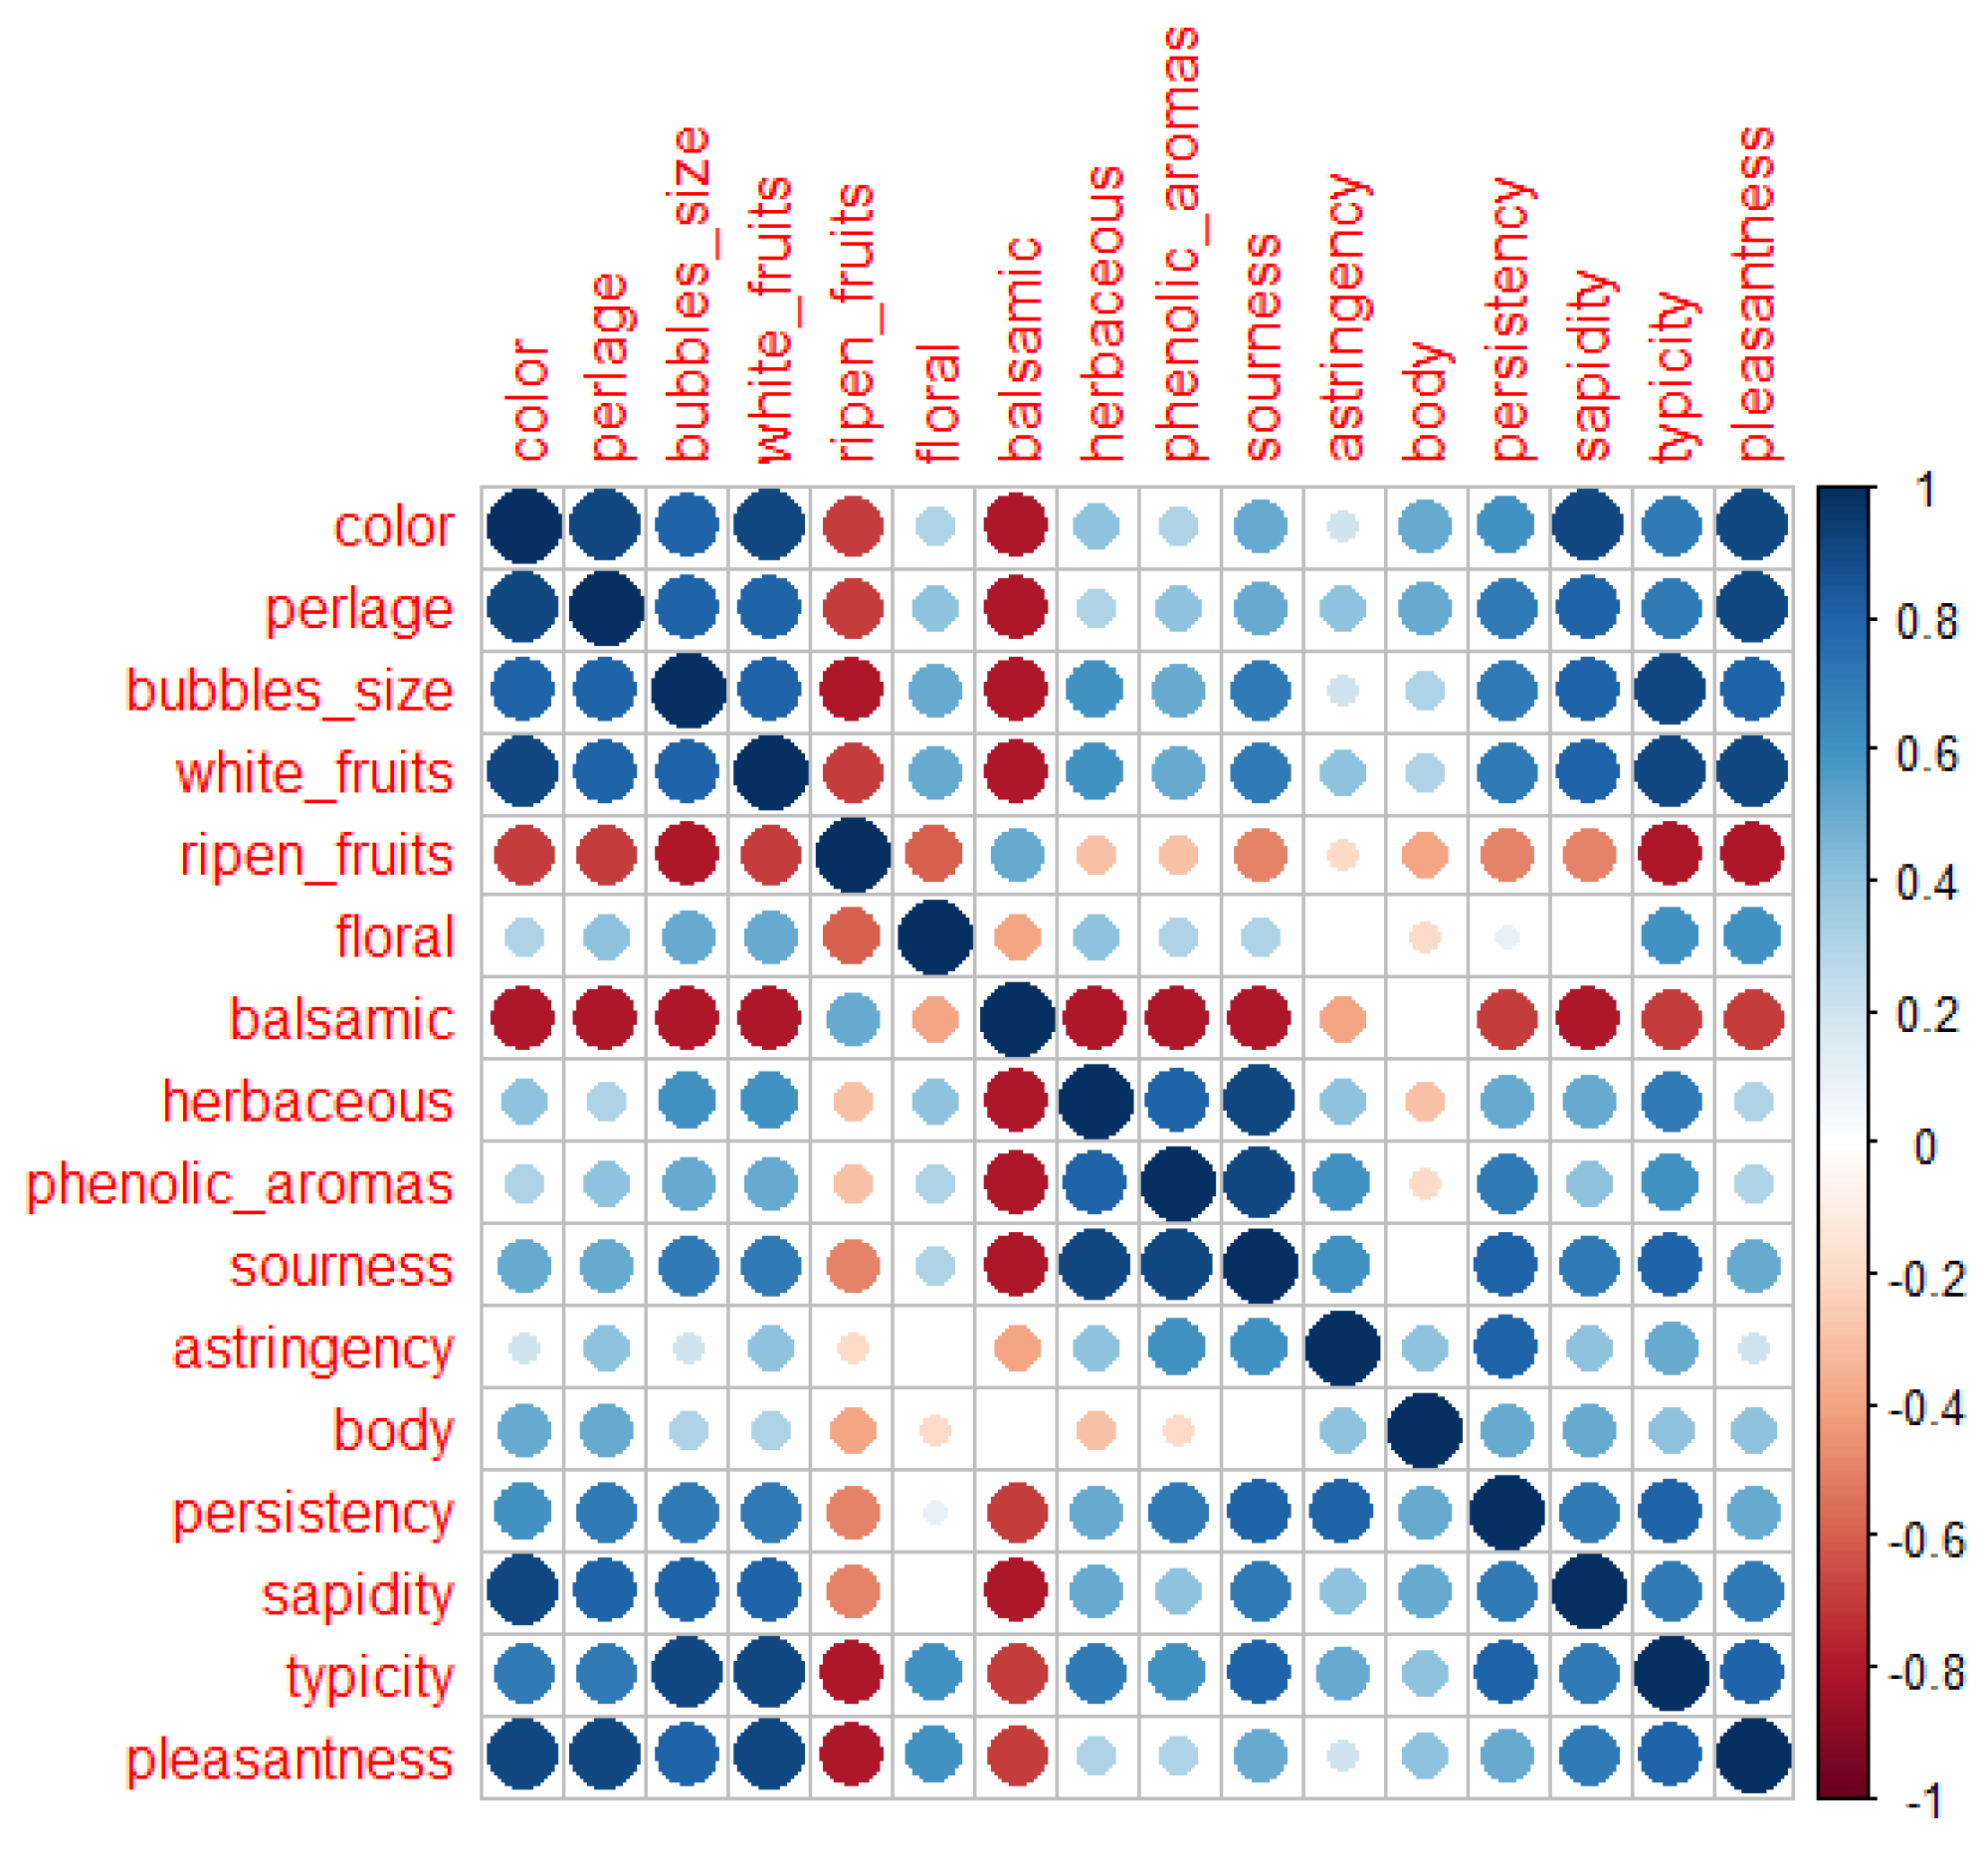
Figure 2.
Quantitative Descriptive Analysis.
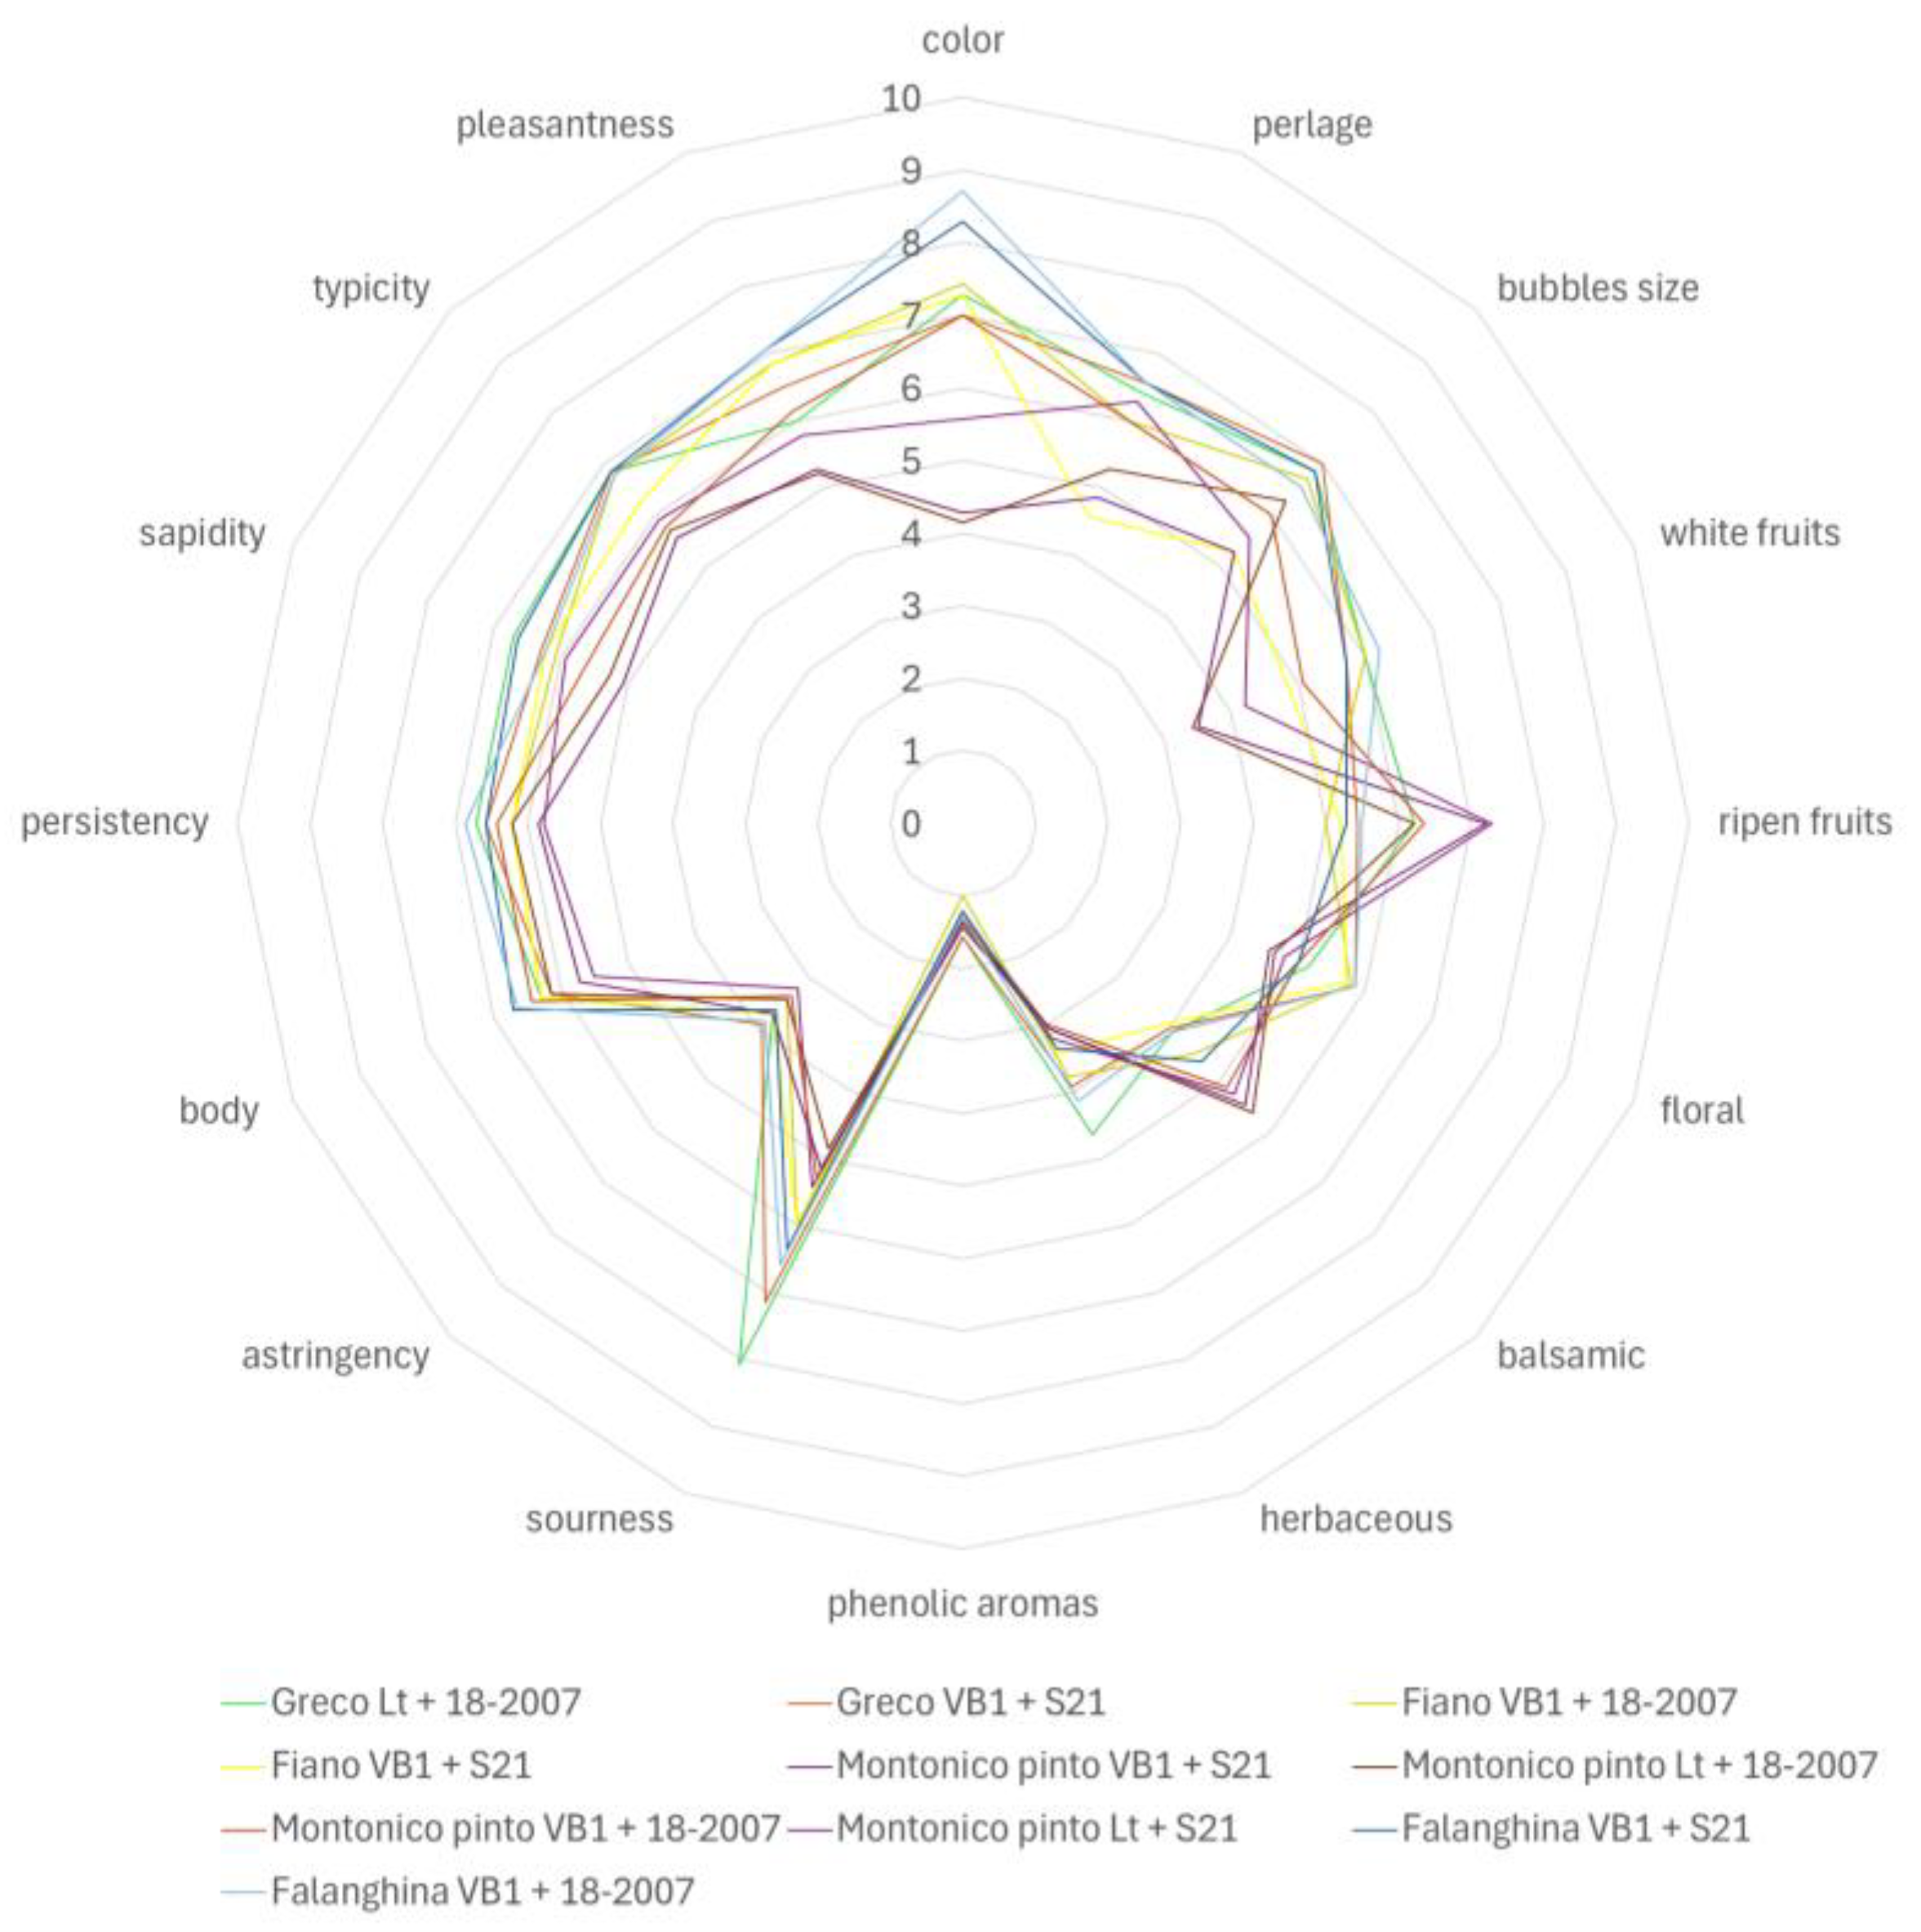
Figure 3.
PCA plot of VOC and chemical data in the sparkling wines tested in the sensory analysis coloured by perceived pleasantness.
Figure 3.
PCA plot of VOC and chemical data in the sparkling wines tested in the sensory analysis coloured by perceived pleasantness.
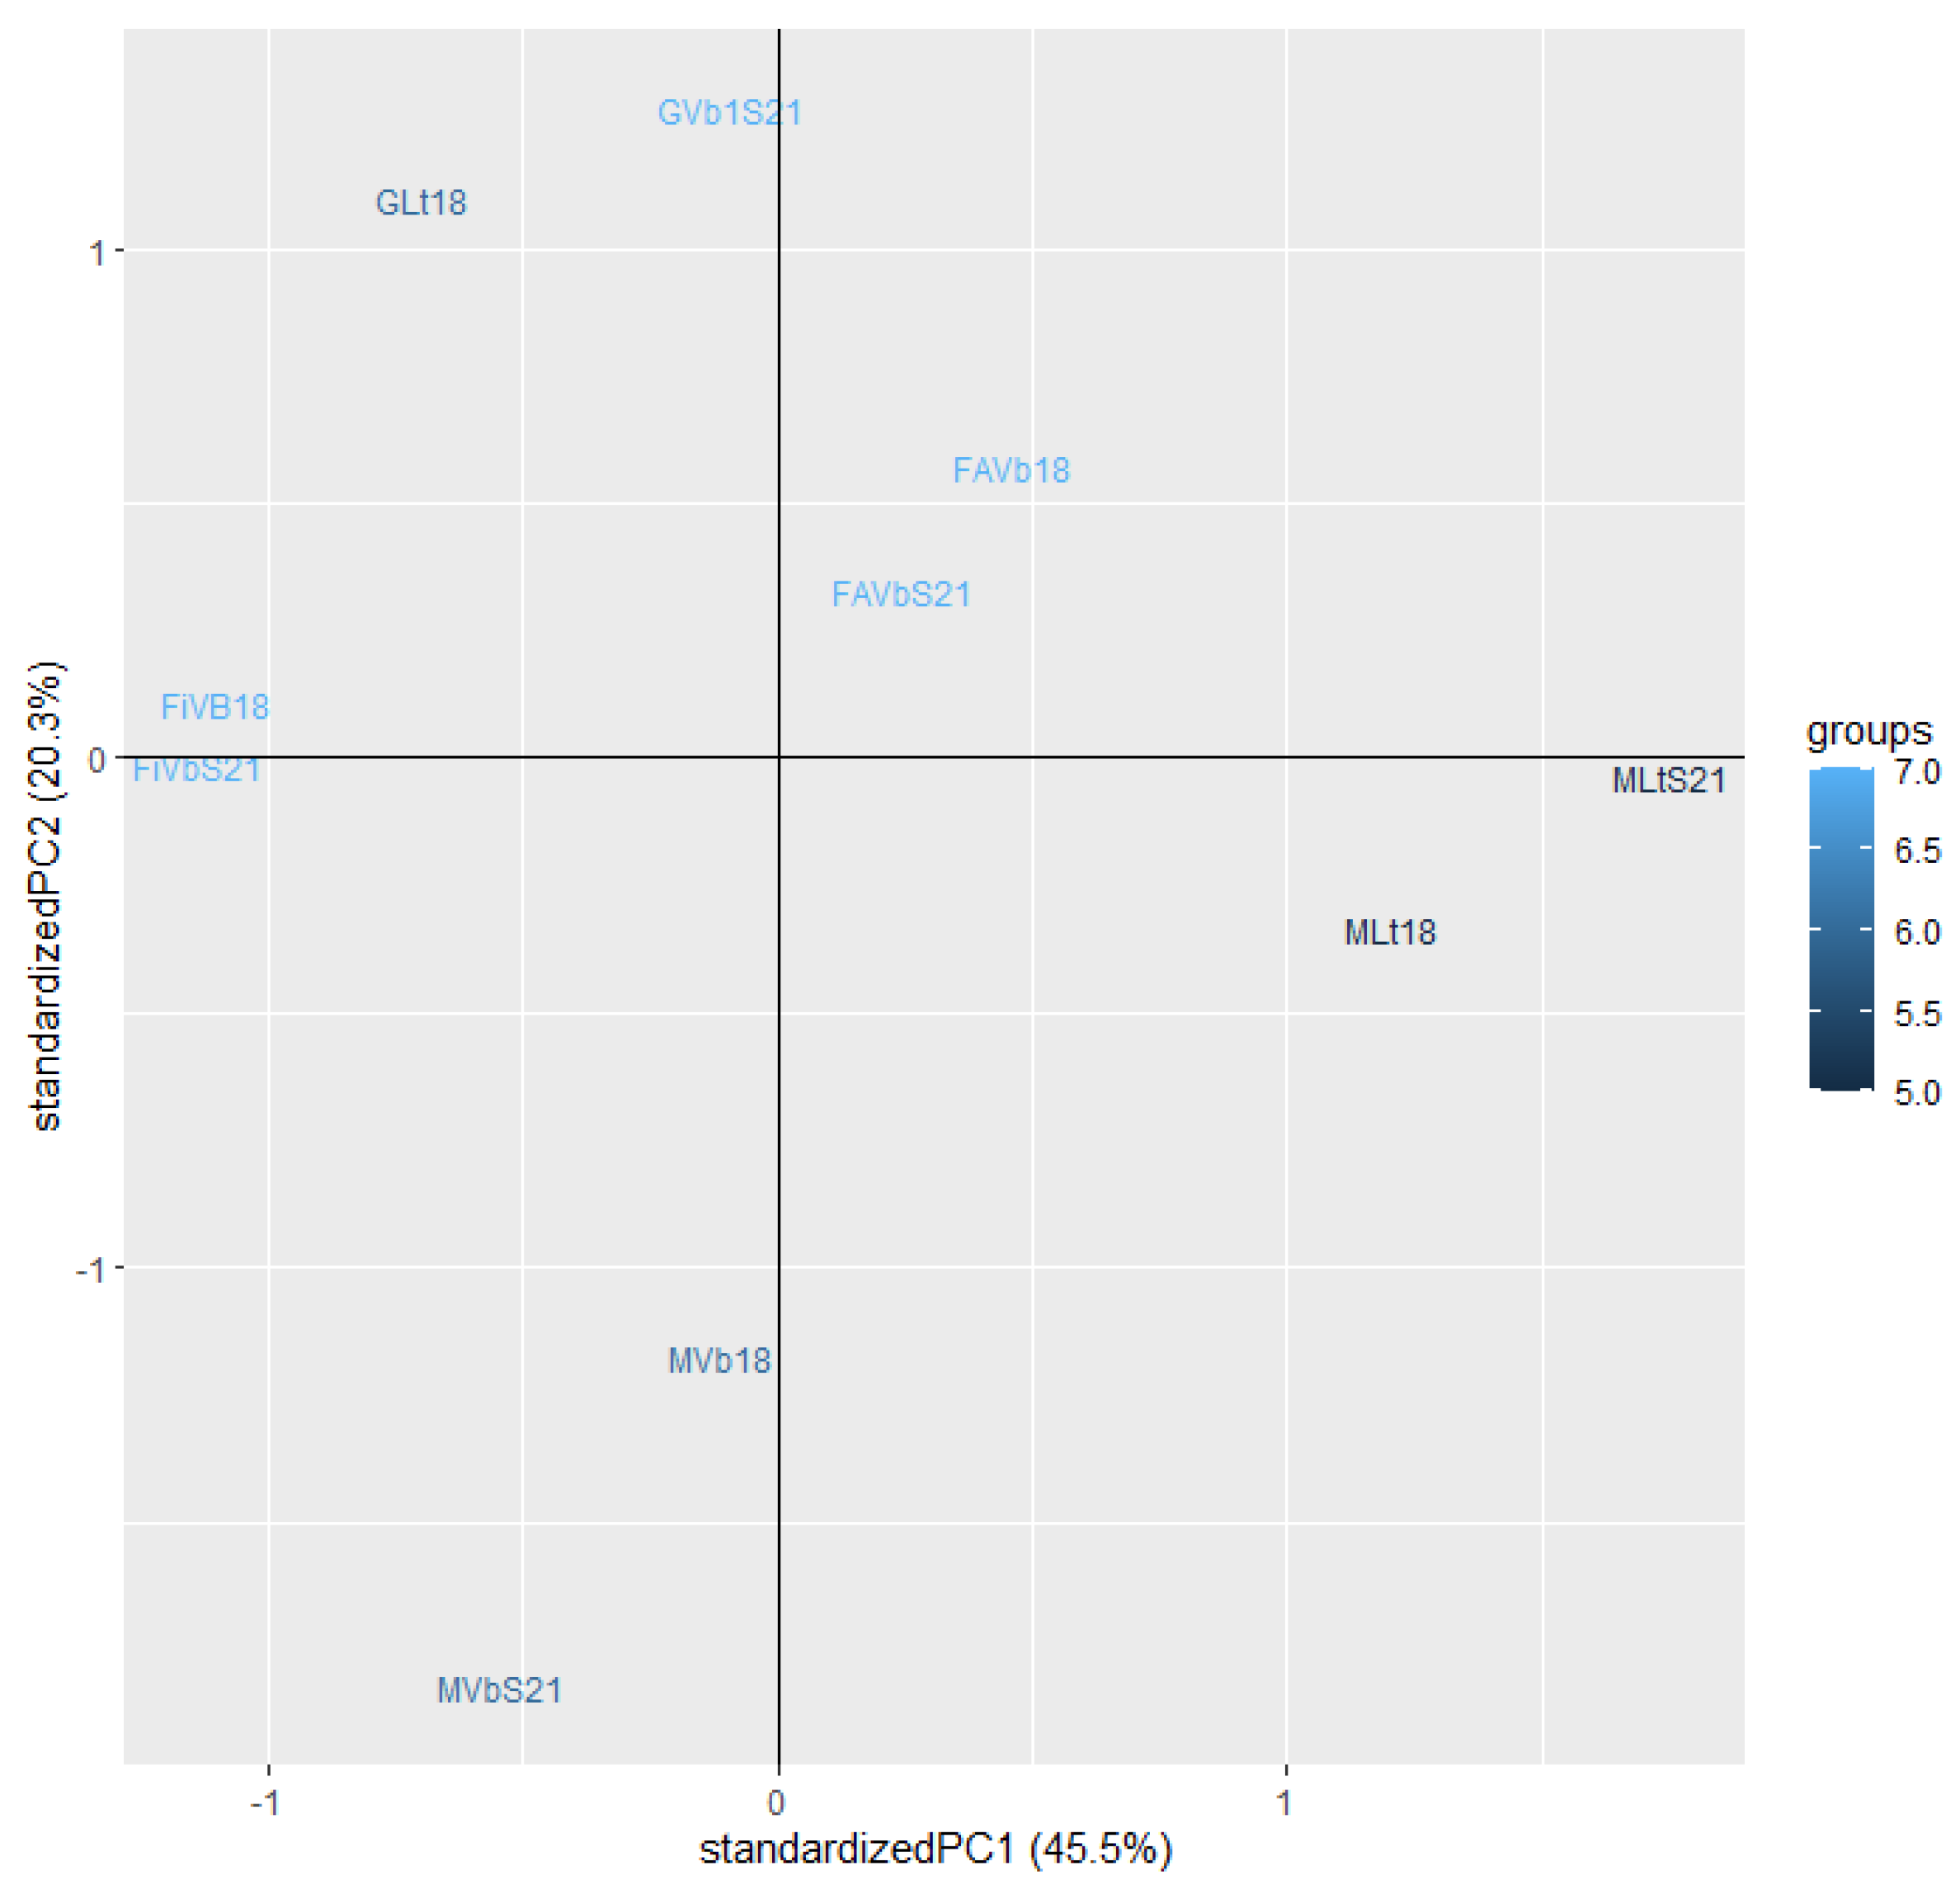
Figure 4.
Loadings of the PCA on PC1 (top) and PC2 (bottom). Green bars represent parameters with a loading > 0.1, instead grey bars represent parameters with loading below 0.1.
Figure 4.
Loadings of the PCA on PC1 (top) and PC2 (bottom). Green bars represent parameters with a loading > 0.1, instead grey bars represent parameters with loading below 0.1.
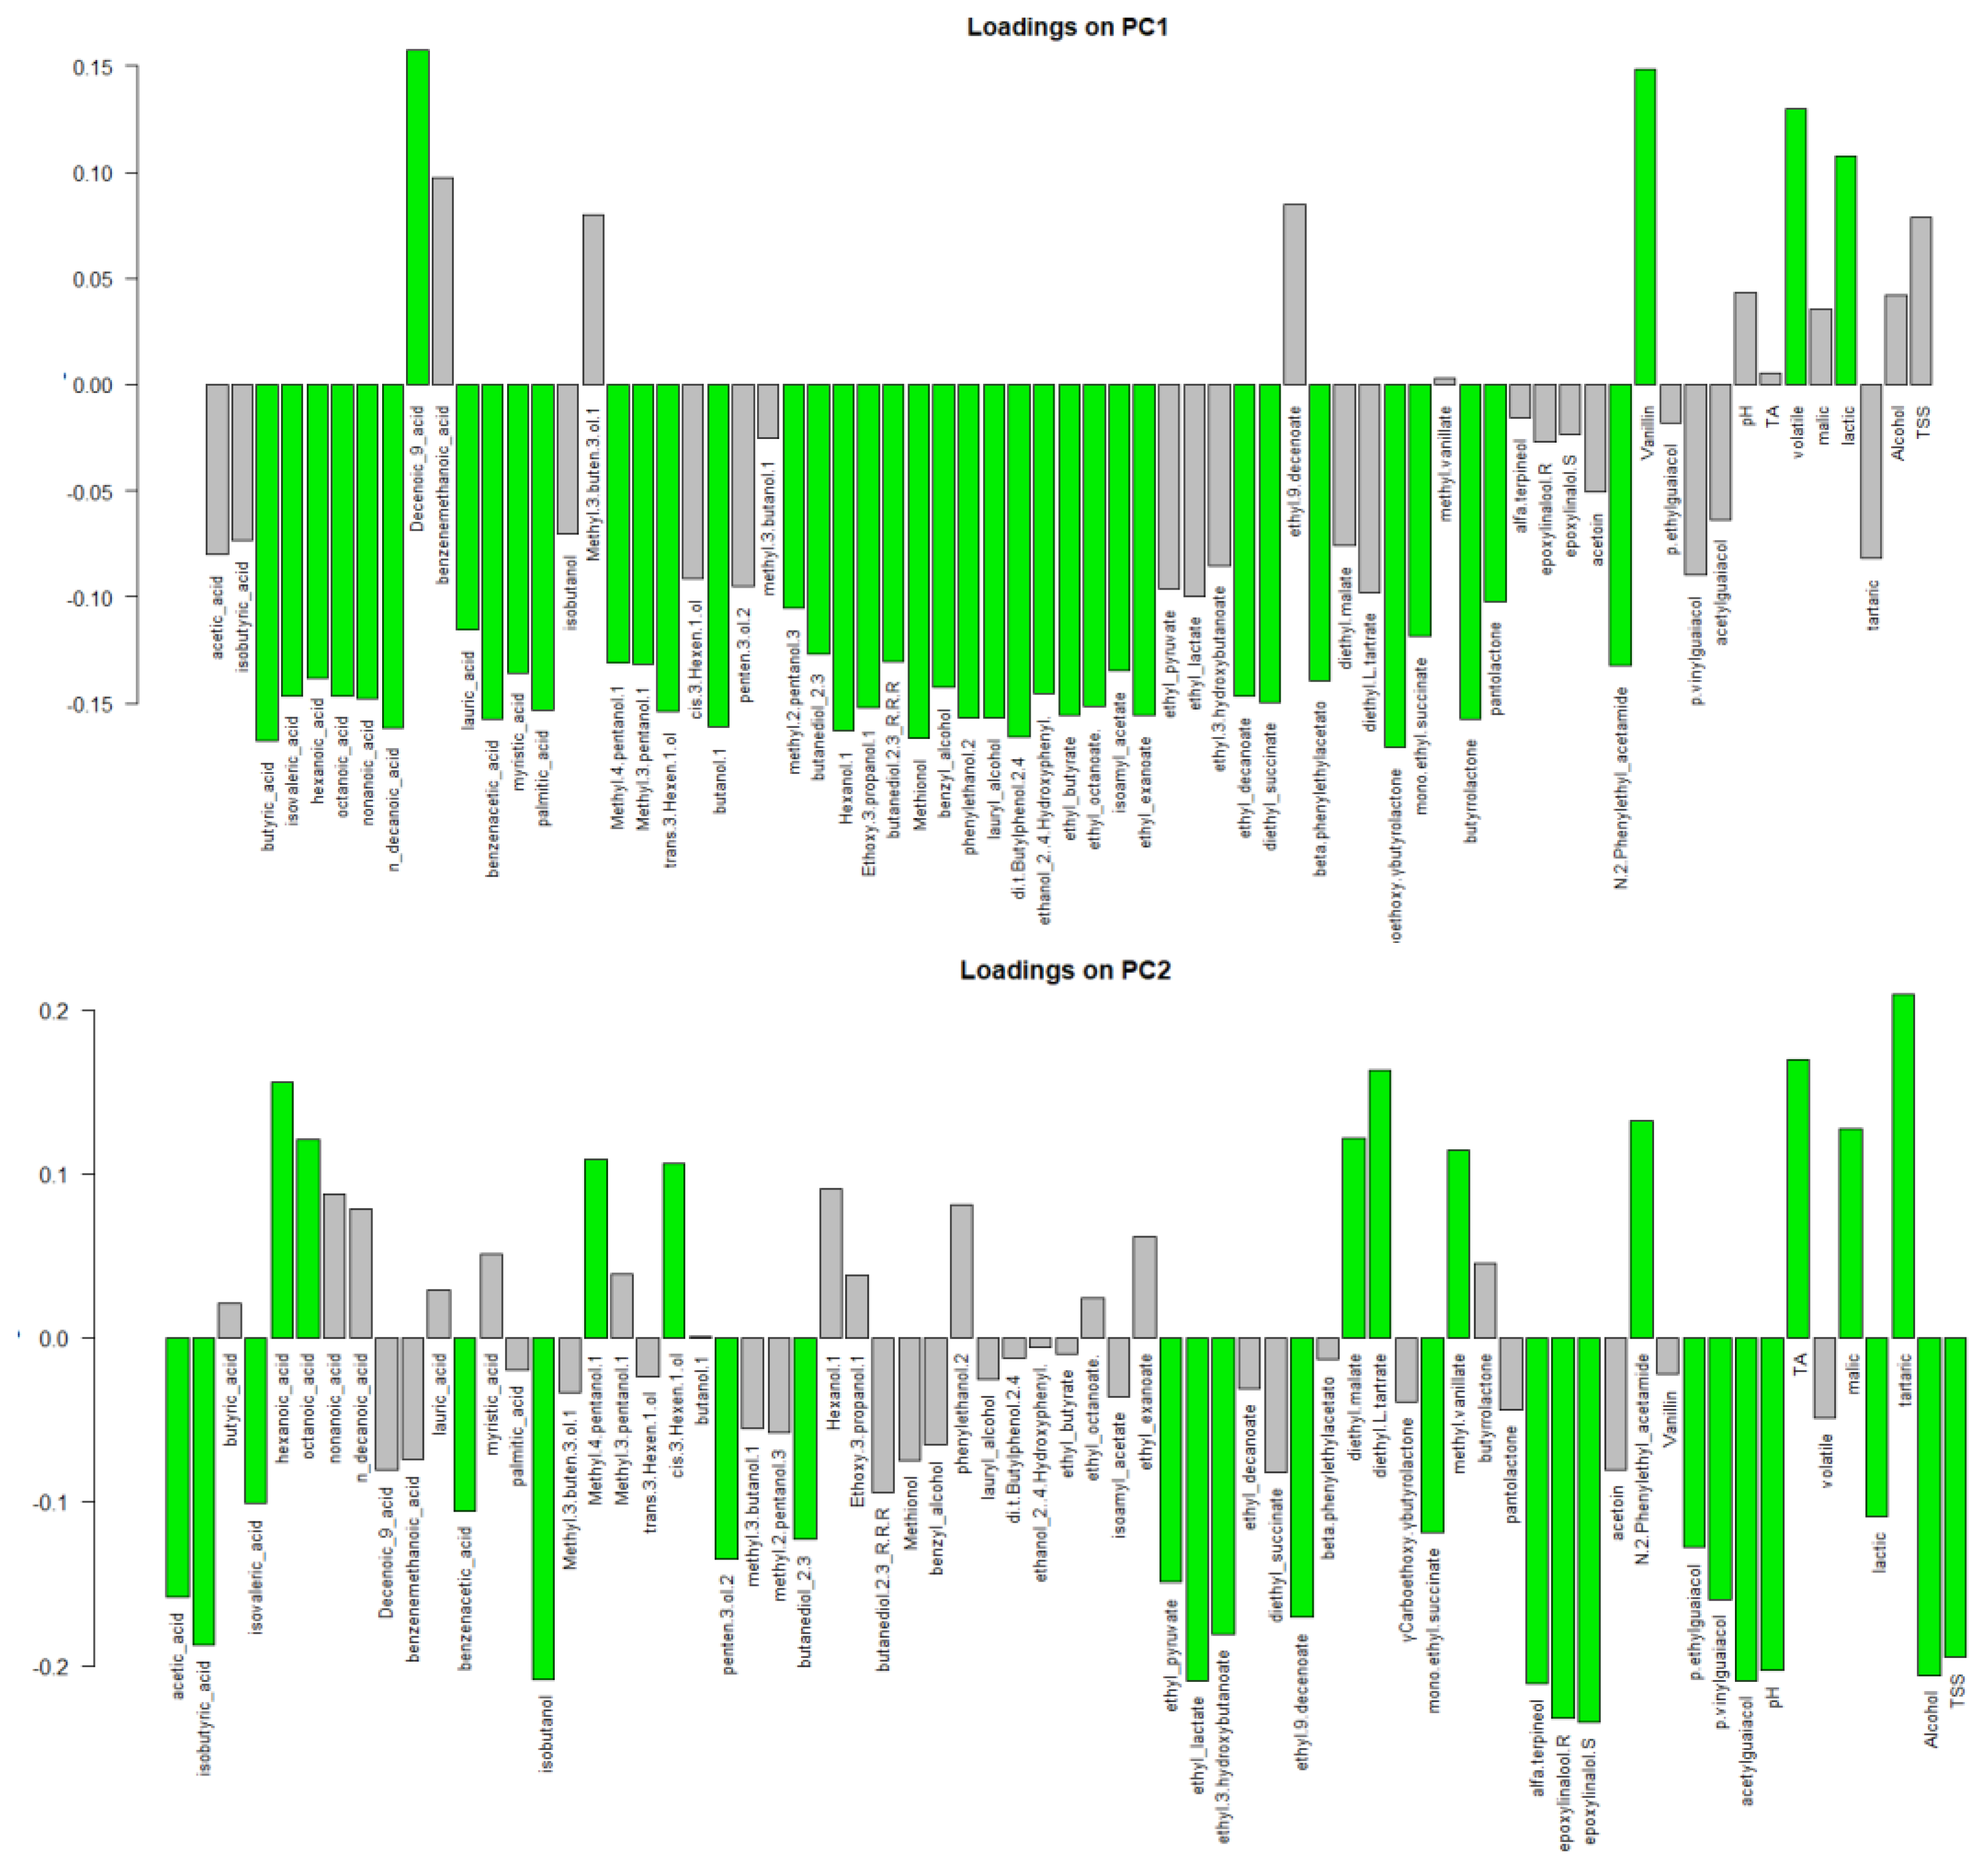
Figure 5.
PCA plot of wines based on NIR spectral data.
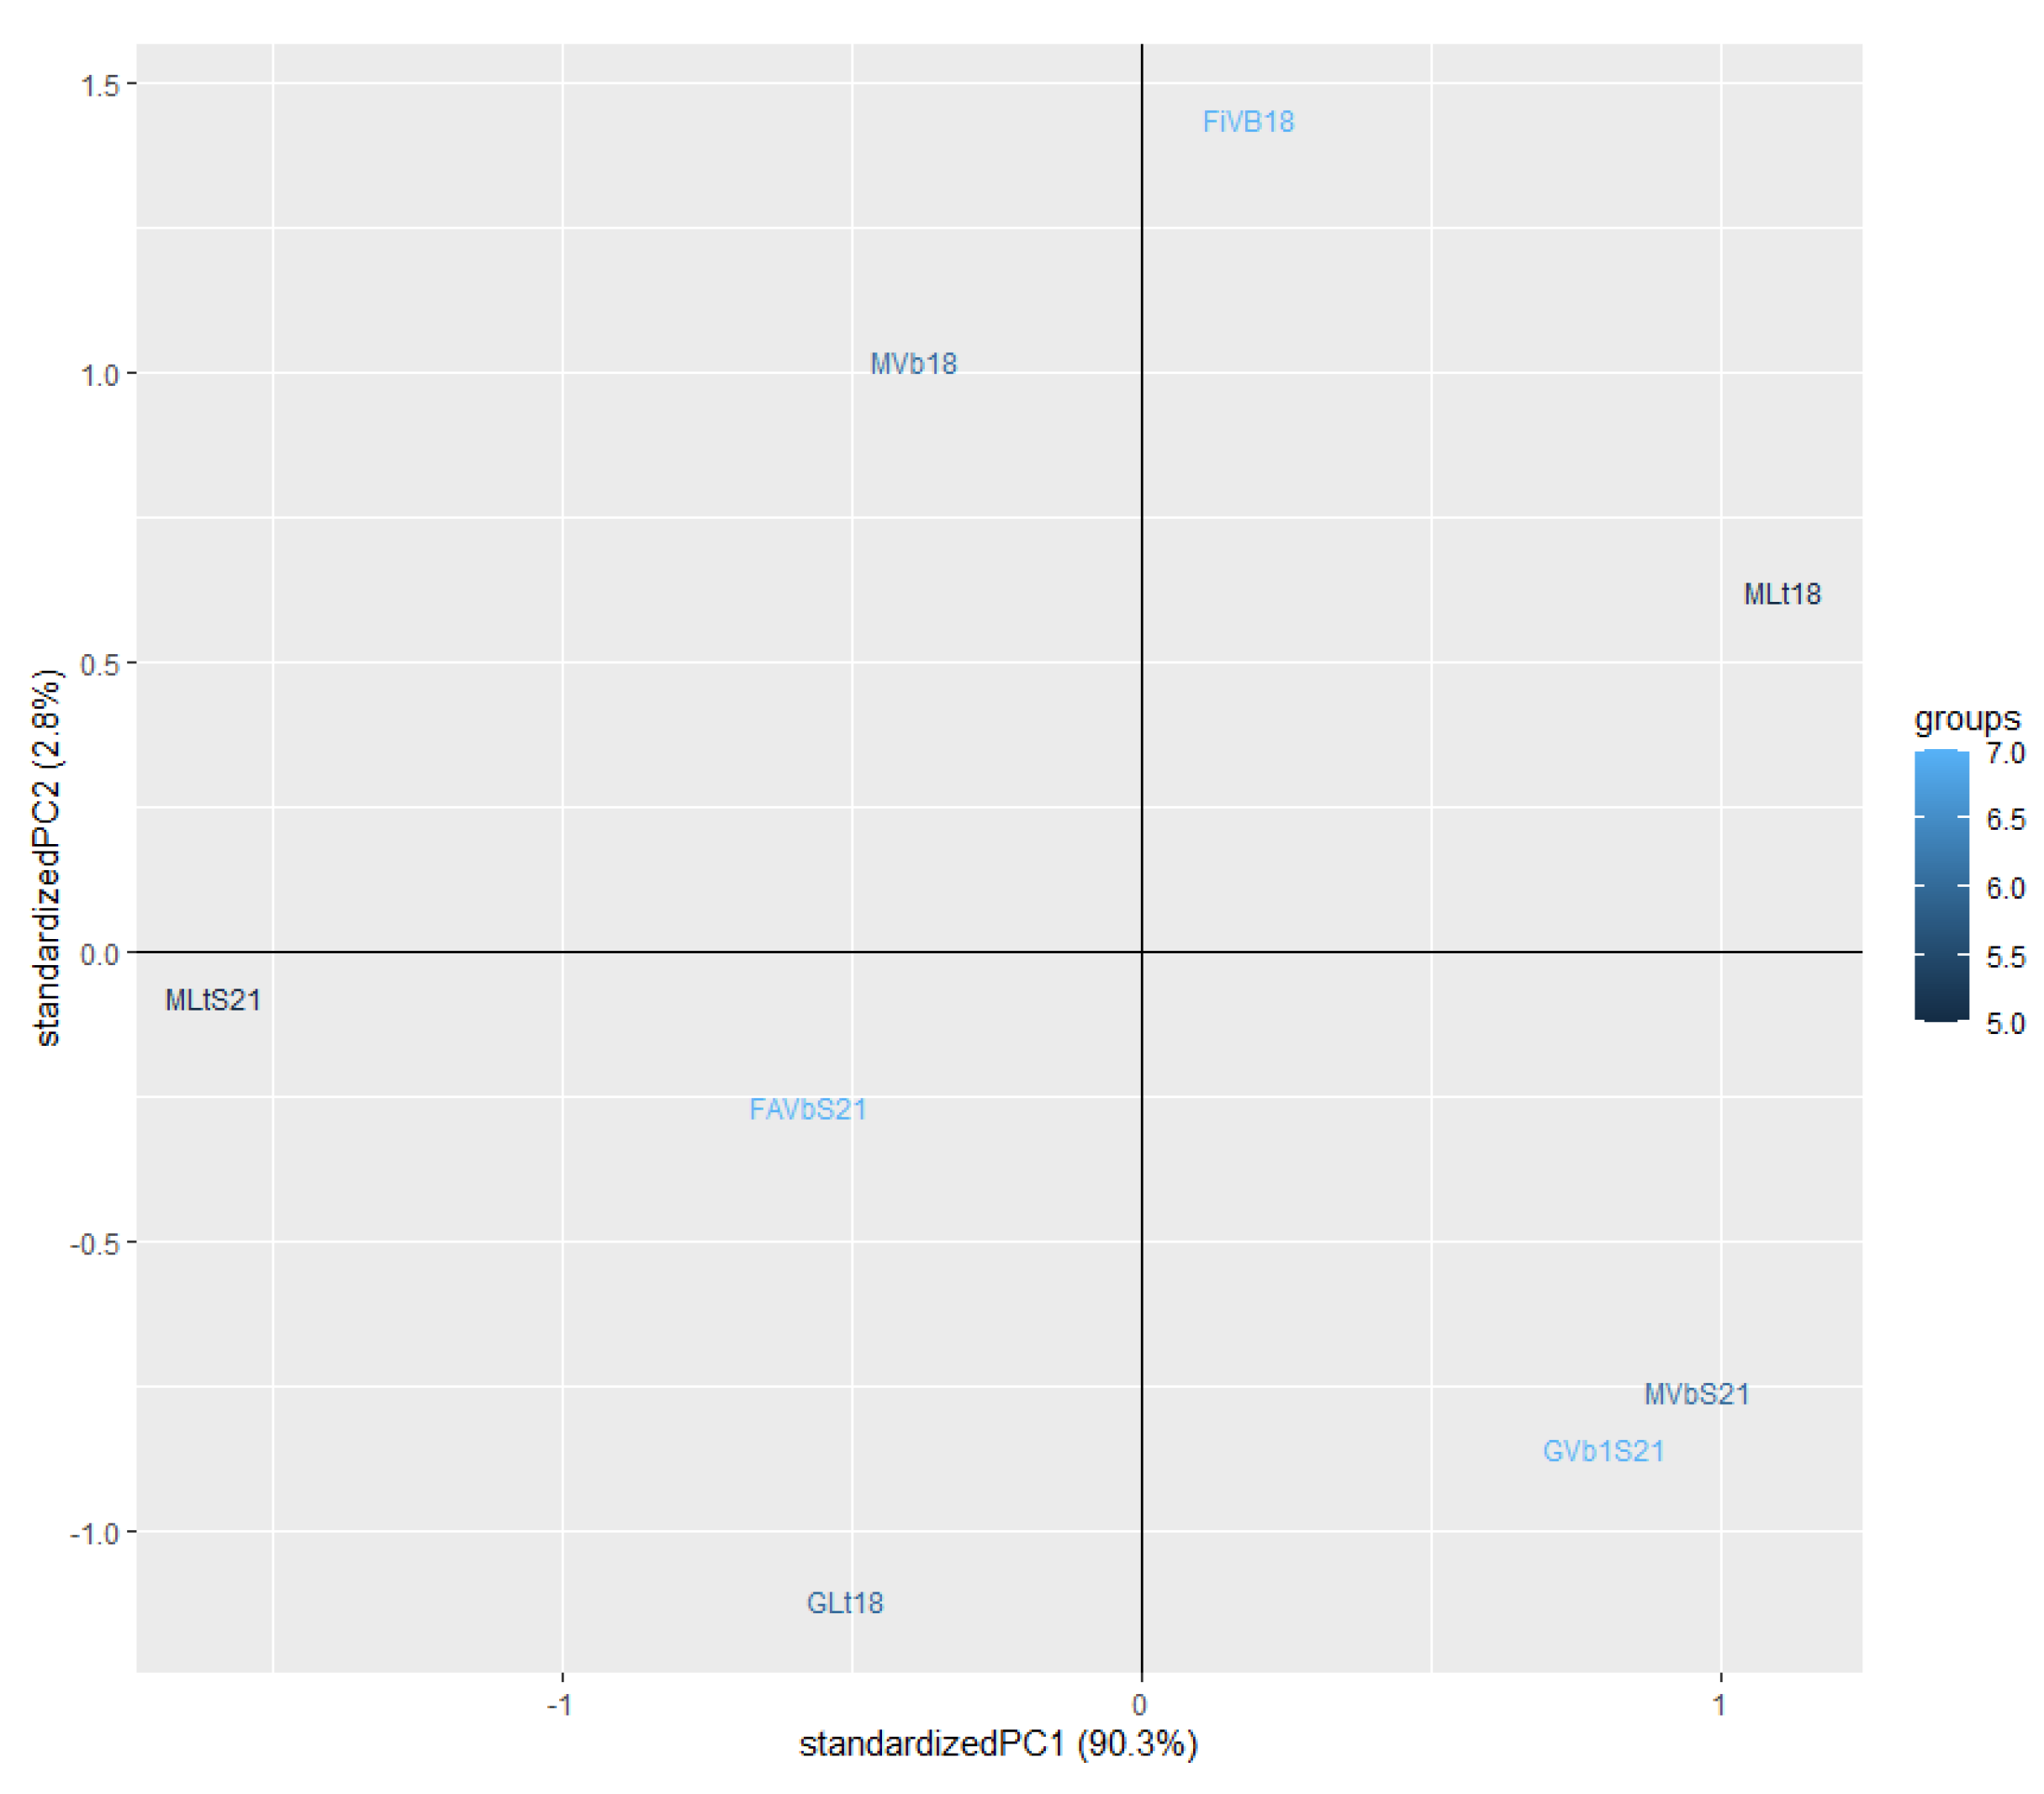
Figure 6.
Correlation plot among sensory and NIR data. Plot has been split in half to ease its readability: correlation with the first 52 wave numbers (top) correlation with the other 52 wave numbers (bottom).
Figure 6.
Correlation plot among sensory and NIR data. Plot has been split in half to ease its readability: correlation with the first 52 wave numbers (top) correlation with the other 52 wave numbers (bottom).
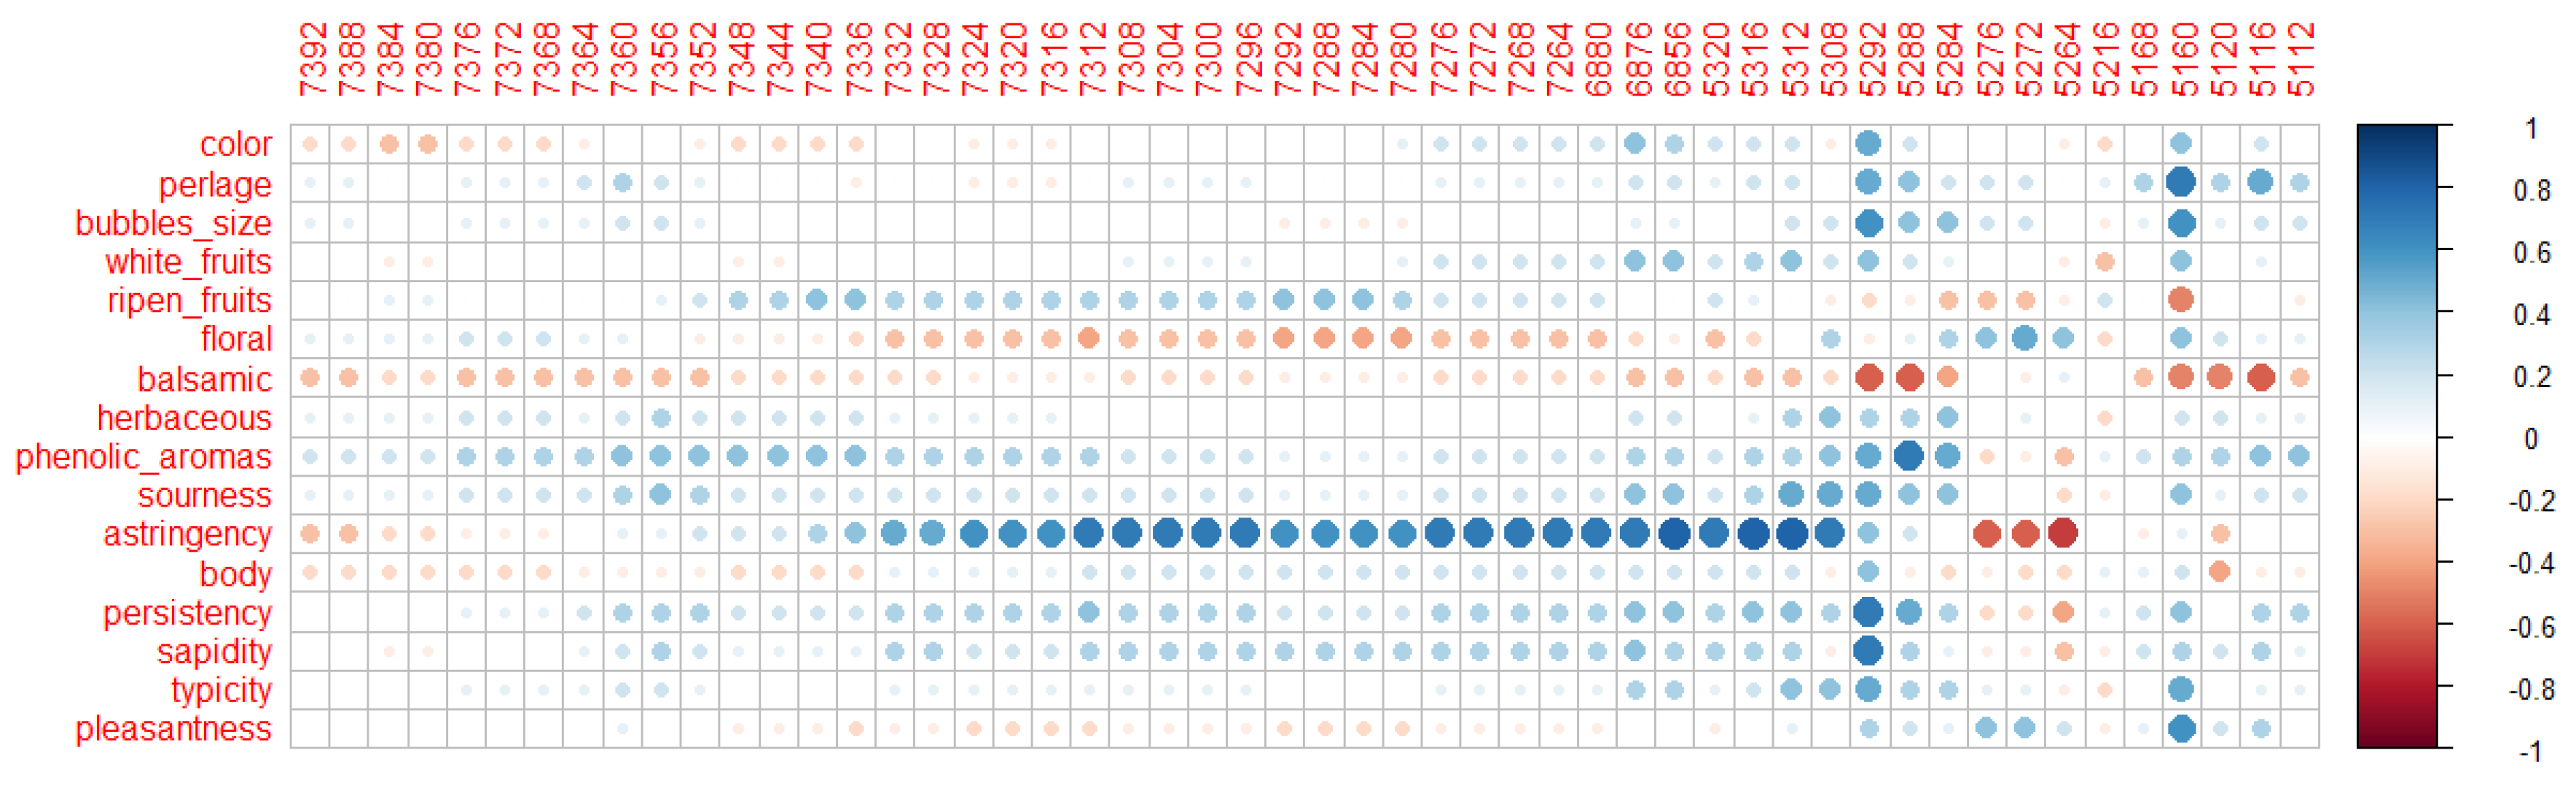
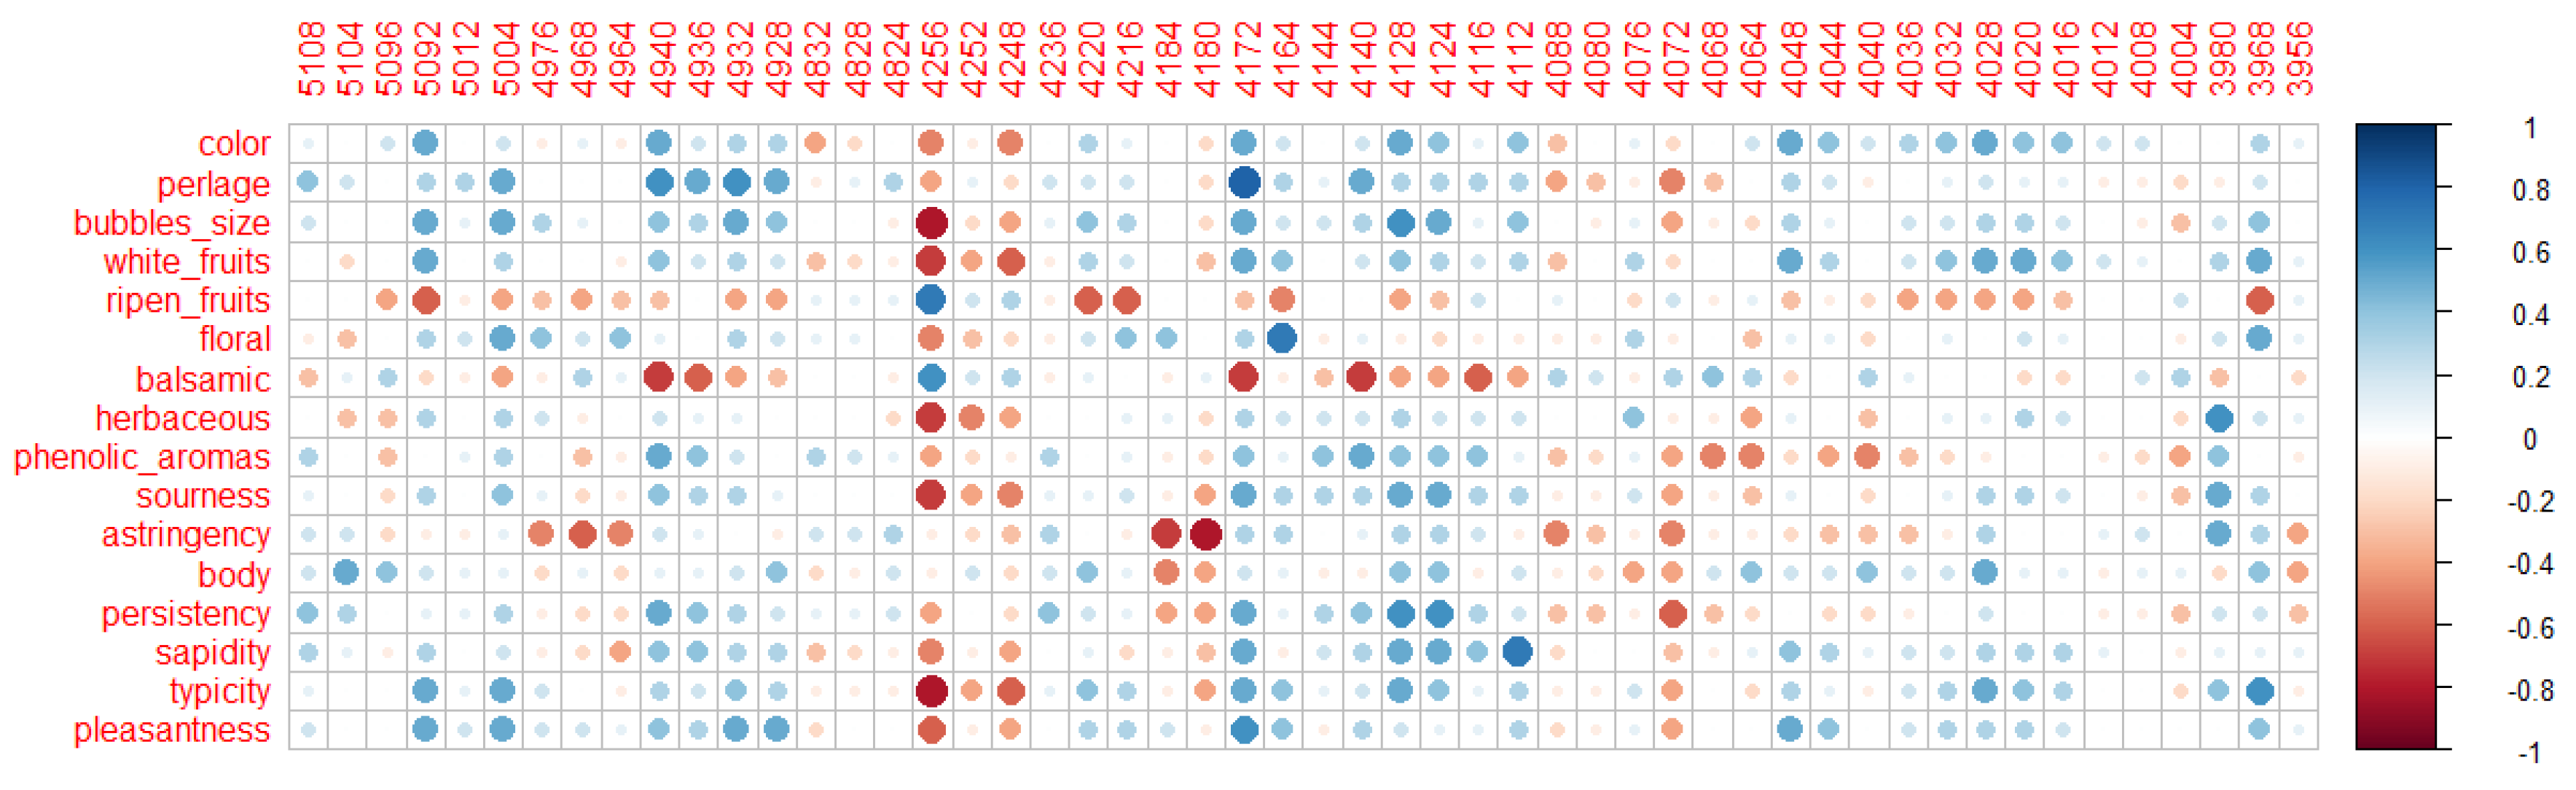

Table 1.
Base wines chemical composition.
| Parameters | Fiano Lt† | Fiano VB1 | Greco Lt | Greco VB1 | Falanghina VB1 |
Montonico Lt |
Montonico Vb1 |
| pH | 3.13±0.10 c | 3.11±0.09 c | 2.74±0.10 a | 2.82±0.09 ab | 2.86±0.07 ab | 3.08±0.08 c | 3.12±0.08 c |
| TA g/L |
6.22±0.28 a | 6.75±0.25 a | 10.12±0.28 d | 9.90±0.23 d | 8.85±0.25 c | 7.50±0.28 b | 7.80±0.25 b |
| Volatile acidity g/L |
0.38±0.03 c | 0.24±0.02 a | 0.45±0.02 d | 0.29±0.03 ab | 0.39±0.02 c | 0.28±0.03 ab | 0.34±0.03bc |
| Malic acid g/L | 1.36±0.11 a | 1.55±0.12 a | 3.42±0.27 c | 3.30±0.26 c | 2.93±0.23 c | 2.34±0.18 b | 2.28±0.15 b |
| Lactic acid g/L | 0.17±0.01 d | 0.00 | 0.00 | 0.00 | 0.01±0.01 a | 0.04±0.01 b | 0.10±0.01 c |
| Alcohol % vol |
12.8±0.3 bc | 12.9±0.5 bc | 10.0±0.4 ab | 9.8±0.3 a | 12.1±0.4 b | 13.6±0.5c | 13.5±0.4c |
| Total SO2 mg/L | 41.0±0.3 a | 48.0±0.2 b | 59.0±0.2 c | 57.0±0.3 b | 57.0±0.2 b | 57.0±0.2 b | 73.0±0.3 d |
| Residual sugars g/L | 0.89±0.08 c | 0.50±0.02 b | 2.37±0.20 d | 0.00 | 0.24±0.02 a | 3.03±0.03 e | 4.47±0.02 f |
| Total polyphenols mg/L | 150±6 a | 163±4 b | 530±12 g | 238±5c | 285±6d | 365±3 e | 431±11 f |
Mean ± standard deviation. Different letters in the same row indicate significant differences (p ≤ 0.05). †Lt is L.thermotolerans;VB1 is commercial S. cerevisiae strain VB1, Oenobrands.
Table 2.
Sparkling wines chemical composition.
| Parameters | Fi VB1 +Sc† | Fi VB1 +S21 | G Lt +Sc | G VB1 +S21 | Fa Vb1 +Sc | FaVb1 +S21 |
M Lt +S21 |
M VB1 +Sc |
M Lt +Sc |
M VB1 +S21 |
| pH | 3.09±0.06bc | 3.08±0.08bc | 2.79±0.05a | 2.77±0.06a | 2.93±0.10ab | 3.08±0.05bc | 3.15±0.05c | 3.10±0.05c | 3.11±0.07c | 3.12±0.05c |
| Total acidity g/L | 6.40±0.27a | 6.70±0.25a | 9.50±0.28d | 9.50±0.25d | 8.70±0.26c | 6.70±0.25a | 6.50±0.26a | 7.01±0.25a | 8.10±0.28b | 6.80±0.25a |
| Volatile acidity g/L | 0.28±0.04ab | 0.27±0.03a | 0.28±0.03ab | 0.24±0.03a | 0.44±0.03d | 0.38±0.03cd | 0.39±0.04cd | 0.30±0.03a | 0.41±0.05d | 0.34±0.03bc |
| Malic acid g/L |
1.41±0.11a | 1.32±0.12a | 2.80±0.12d | 2.70±0.10cd | 2.54±0.12c | 2.53±0.15cd | 1.80±0.11b | 2.10±0.11b | 2.04±0.12b | 1.98±0.11b |
| Lactic acid g/L |
0.00 | 0.00 | 0.00 | 0.00 | 0.00 | 0.01±0.01a | 0.18±0.01c | 0.00 | 0.10±0.01b | 0.12±0.01b |
| Tartaric acid g/L |
3.21±0.05c | 3.21±0.05c | 4.06±0.05d | 4.23±0.06d | 2.88±0.05b | 2.97±0.04b | 2.55±0.05a | 2.57±0.05a | 2.55±0.04a | 2.56±0.04a |
| Alcohol %vol |
12.8±0.6bc | 12.7±0.4bc | 10.5±0.5a | 10.6±0.3a | 12.0±0.4b | 12.7±0.5bc | 13.0±0.5c | 13.2±0.5c | 13.0±0.4c | 12.9±0.5bc |
| Residualsugars g/L | 10.07±0.09c | 13.40±0.11e | 1.22±0.04a | 1.15±0.03a | 9.03±0.09c | 7.18±0.05b | 18.08±0.15g | 13.00±0.12d | 19.08±0.12h | 15.42±0.14f |
Values are reported as mean ± standard deviation. Different letters in the same row indicate significant differences (p ≤ 0.05). †Acronyms used in this table: Fi is Fiano; Fa is Falanghina; G is Greco; M is Montonico; VB1 is commercial S. cerevisiae strain VB1, Oenobrands; Lt is L. thermotolerans; Sc is commercial S. cerevisiae strain 18-2007 IOC; S21 is authoctonous S. cerevisiae strain S21.
Table 3.
Concentration of major volatile compounds in sparkling wines in µg/L.
| CAS | Molecules |
Fi Vb1+Sc† |
Fi Vb1+ S21 |
G Lt+Sc |
G Vb1+ S21 |
Fa Vb1+ Sc |
Fa Vb1+ S21 |
M Lt+Sc |
M Lt +S21 |
M Vb1+Sc |
M Vb1+S21 |
| Acids | |||||||||||
| 64-19-7 | Acetic Acid | 3128.8 ± 472.1 bcd | n.d. | 3317.0±500.5 bc | 1971.0297.4ab | 3417.2±515.6cd | 3390.7±511.6cd | 2853.8±430.6abc | 1503.2±226.8a | 4397.9±663.6d | 4354.6±657.1d |
| 79-31-2 | Isobutyric Acid | 188.1 ±21.7 d | 132.4±15.3 bcd | 165.1±19.1d | 77.6±9.0ab | 134.5±15.5bcd | 91.5±10.6abc | 148.9±17.2cd | 57.6±6.6a | 323.3±37.3f | 252.5±29.1 e |
| 107-92-6 | Butyric Acid | 399.6±37.8 cd | 502.9±47.5 e | 473.8±44.8de | 351.9±33.3cb | 340.9±32.2cb | 346.1±32.7cb | 260.5±24.6b | 151.8±14.4a | 358.6±33.9cb | 402.2±38.0cde |
| 503-74-2 | Isovaleric Acid | 307.8 ± 20.5 cd | 312.8 ±20.8cd | 352.7±23.5 de | 238.3±15.9bc | 245.0±16.3bc | 228.1±15.2bc | 181.8±12.1b | 103.4±6.9a | 374.0±24.9de | 401.4±26.7e |
| 142-62-1 | Hexanoic Acid | 3170.4 ±270.8 ef | 3220.7±275.1 f | 3469.9±296.4f | 2707.9±231.3de | 2454.6±209.7d | 2674.5±228.4d | 1634.1±139.6b | 1239.0±105.8a | 1622.4±138.6b | 1932.5±165.1c |
| 124-07-2 | Octanoic Acid | 3493.2 ±366.5 e | 2946.3±309.2 e | 3393.9±356.1e | 2501.9±262.5d | 1981.0±207.9c | 2498.2±262.1d | 1343.1±140.9a | 1375.4±144.3ab | 1554.5±163.1b | 2104.9±220.9cd |
| 112-05-0 | Nonanoic Acid | 13.4 ±.5 b | 13.9±2.6 bc | 15.8±3.0c | 12.5±2.4bc | 12.4±2.4bc | 13.3±2.5bc | 10.3±2.0b | 6.5±1.2a | 11.2±2.1bc | 12.2±2.3bc |
| 334-48-5 | N-Decanoic Acid | 770.6±95.9 e | 585.0±72.8 d | 573.5±71.4d | 495.9±61.8 c | 368.7±45.9bc | 326.5±40.7bc | 130.5±16.2a | 130.6±16.3a | 294.2±36.6b | 413.2±51.4c |
| 14436-32-9 | 9-Decenoic Acid | 19.6 ±2.0 bc | 14.1±1.4 a | 20.3±2.1 c | 17.9±1.8b | 154.2±15.7ef | 175.8±17.9fg | 213.5±21.8gh | 229.2±23.4h | 89.3±9.1d | 125.5±12.8e |
| 65-85-0 | Benzenemethanoic Acid | 20.0±3.2b | 21.3±3.4 b | 21.9±3.5bc | 14.2±2.3a | 32.0±5.1d | 54.8±8.8e | 54.9±8.8e | 30.3±4.9d | 30.0±4.8cd | 32.1±5.2d |
| 143-07-7 | Lauric Acid | 10.6 ± 1.3 b | 10.9±1.4 b | n.d. | 5.7±0.7a | n.d. | 5.5±0.7a | n.d. | n.d. | 4.7±0.6a | n.d. |
| 103-82-2 | Benzenacetic Acid | 77.5 ±15.0 cd | 82.7±16.0 cd | 67.7±13.1 b c | 49.1±9.5b | 46.8±9.0b | 67.6±13.1bc | 37.0±5.0b | 24.7±4.8a | 77.9±15.1cd | 88.2±15.0d |
| 544-63-8 | Myristic Acid | 13.8±1.9c | 11.9±1.6c | 11.8±1.6c | 12.3±1.7c | 13.7±1.9c | 13.2±1.8c | 7.2±1.0 b | 5.1±0.7a | 10.5±1.4c | 12.4±1.7c |
| 57-10-3 | Palmitic Acid | 166.4±26.6c | 151.0±23.2c | 132.3±29.1bc | 154.3±24.0c | 141.9±21.0c | 146.4±22.2c | 92.8±20.4ab | 68.9±15.2a | 146.3±22.2c | 165.7±30.1c |
| Alcohols | |||||||||||
| 78-83-1 | Isobutanol | 2179.6±197.1e | 1866.1±168.8cd | 1839.0±166.3cd | 1212.9±109.7a | 1333.1±120.6a | 1597.7±144.5bc | 2016.4±182.4de | 1488.8±134.7b | 1946.8±156.1d | 2873.2±159.9f |
| 763-32-6 | 3-Methyl-3-Buten-1-ol | n.d. | n.d. | n.d. | n.d. | n.d. | n.d. | 1.7±0.2 | n.d. | n.d. | n.d. |
| 626-89-1 | 1-Pentanol- 4-Methyl | 49.5±7.0cd | 55.4±7.8d | 43.7±6.1cd | 39.3±5.5c | 25.7±3.6ab | 25.6±3.6ab | 28.5±4.0b | 21.6±3.0ab | 21.2±3.0a | 26.3±3.7ab |
| 589-35-5 | 3-Methyl-1-Pentanol | 181.8±15.8d | 182.9±15.9d | 119.5±10.4c | n.f. | 83.0±7.2b | 78.3±6.8b | 61.4±5.3a | n.f. | 85.2±7.4b | n.f. |
| 928-97-2 | (E)-3-Hexen-1-ol | 57.0±7.5e | 59.3±7.8e | 46.3±6.1de | 38.1±5.0d | 10.7±1.4a | 12.2±1.6ab | 20.0±2.6c | 14.9±2.0ab | 33.1±4.4d | 45.5±6.0de |
| 928-96-1 | (Z)-3-Hexen-1-ol | 23.7±1.5b | 27.4±1.7c | 48.9±3.1e | 39.8±2.5e | 31.0±2.0cd | 30.9±2.0cd | 20.9±1.3b | 14.7±0.9a | 33.1±2.1d | 30.5±1.9cd |
| 71-36-3 | 1-Butanol | 131.6±12.1f | 156.0±13.0f | 81.1±7.7e | 68.7±6.5de | 56.7±5.4c | 67.3±6.4cde | 36.3±3.4b | 23.6±2.2a | 64.9±6.1cd | 85.0±8.0e |
| 1569-50-2 | 3-Penten-2-ol | 3.5±0.9b | 3.1±0.8b | 2.3±0.6ab | n.d. | n.d. | n.d. | 3.1±0.8b | 1.7±0.4a | 2.3±0.6ab | 3.4±0.8b |
| 123-51-3 | 3-Methylbutan-1-ol | 7687.8±397.3a | 10802.7±558.2b | 20426.7±1055.5f | 15401.2±795.9e | 12328.3±637.1c | 14769.6±763.2de | 13682.5±707.0cd | 10606.0±548.1b | 15257.0±788.4e | 21620.4±1117.2f |
| 565-67-3 | 2-Methyl-3-Pentanol | 43.8±2.0d | 100.0±4.6f | 45.1±2.1d | 70.5±3.2e | 29.0±1.3c | 102.1±4.7f | 11.6±0.5a | 15.9±0.7b | 44.2±2.0d | 112.6±5.2f |
| 513-85-9 | 2,3-Butanediol | 6256.1±973.4e | 7063.0±1098.9e | 2265.5±352.5ab | 1783.4±277.5a | 2685.7±417.9b | 3286.0±511.3bc | 2868.0±446.2b | 1679.7±261.3a | 4308.7±670.4cd | 5107.7±794.7de |
| 111-27-3 | 1-Hexanol | 960.2±81.9e | 958.8±81.7e | 980.1±83.6e | 775.3±66.1d | 445.1±37.9b | 449.1±38.3b | 265.8±22.7a | 205.9±17.6a | 496.8±42.4bc | 568.8±48.5c |
| 111-35-3 | 3-Ethoxy-1-Propanol | 136.0±11.7g | 172.5±14.8h | 72.0±6.2f | 65.6±5.6ef | 49.8±4.3cd | 47.4±4.1c | 13.8±1.2b | 3.5±0.3a | 56.3±4.8de | 47.2±4.1c |
| 513-85-9 | 2, 3-Butanediol (R,R,R) | 1404.1±243.1e | 1678.7±250.6e | 446.0±77.2bc | 316.2±54.7ab | 575.2±99.6c | 609.3±105.5c | 501.0±86.7c | 247.8±42.9a | 943.3±163.3d | 931.1±161.2d |
| 505-10-2 | 3-(Methylthio)-1-propanol | 371.8±1.8d | 463.8±39.6e | 355.3±30.3d | 262.8±22.4c | 257.0±22.0c | 278.5±23.8c | 169.6±14.5b | 96.5±8.2a | 387.9±33.1d | 414.5±35.4de |
| 100-51-6 | Benzyl alchol | 19.9±1.0g | 23.4±1.1h | 9.7±0.5d | 9.2±0.4cd | 7.1±0.3b | 7.9±0.4bc | 8.5±0.4c | 5.7±0.3a | 11.7±0.6e | 14.4±0.7f |
| 60-12-8 | 2-Pheny lethanol | 32237.3±1896.1c | 29835.0±1847.3c | 35421.1±1993.2c | 30068.6±1861.8c | 23662.9±1465.2b | 29991.7±1857.0c | 16383.9±1014.5a | 15652.7±969.2a | 23874.4±1478.3b | 28908.4±1790.0c |
| 112-53-8 | Lauric alcohol | 274.2±22.8g | 222.0±18.5ef | 194.5±16.2de | 242.8±20.2fg | 174.3±14.5cd | 158.3±13.2bc | 140.1±11.7b | 97.0±8.1a | 217.7±18.1ef | 241.0±20.1fg |
| 96-76-4 | 2,4-Di-t-Butylphenol | 384.3±54.0d | 370.6±52.0d | 329.4±46.2bcd | 357.5±50.2cd | 309.0±43.4bcd | 286.6±40.2bc | 256.4±36.0b | 172.0±24.1a | 347.0±48.7bcd | 357.6±50.2cd |
| 501-94-0 | 2-(4-Hydroxyphenyl) Ethanol | 4447.5±578.9def | 5731.8±746.1ef | 4620.9±601.5ef | 2877.4±374.5b | 2843.2±370.1b | 3325.5±432.9bc | 3489.9±454.3bcd | 2066.6±269.0a | 3368.8±438.5bc | 3770.3±490.8cde |
| Esters | |||||||||||
| 105-54-4 | Butanoic acid, Ethyl Ester R | 227.6±41.3e | 176.5±32.0de | 197.3±35.8de | 174.4±31.6de | 22.7±4.1a | 61.1±11.1c | 42.1±7.6b | 38.4±7.0b | 144.0±26.1d | 183.8±33.3de |
| 106-32-1 | Octanoic Acid Ethylester | 845.1±157.4e | 569.5±106.1de | 537.8±100.1d | 393.3±73.2cd | 174.5±32.5b | 116.6±21.7a | 108.1±20.1a | 137.9±25.7ab | 281.9±52.5c | 413.9±77.1d |
| 123-92-2 | Isoamyl Acetate | 100.4±18.2e | 62.9±11.4bcd | 108.2±19.7e | 56.9±10.3bc | 25.4±4.6a | 19.2±3.5a | 43.7±7.9b | 20.6±3.7a | 79.6±14.4cde | 82.8±15.0de |
| 123-66-0 | Ethylexanoate | 575.3±66.5f | 441.6±51.1e | 504.1±58.3ef | 350.2±40.5d | 152.7±17.7b | 128.2±14.8b | 92.4±10.7a | 101.0±11.7a | 227.7±26.3c | 296.7±34.3cd |
| 617-35-6 | Ethyl pyruvate | 735.7±7.4d | 823.7±8.2e | 901.3±9.0f | 683.8±6.8c | 741.6±7.4d | 1090.1±10.9g | 284.8±2.8b | 210.3±2.1a | 1135.5±11.4h | 2026.5±20.31i |
| 97-64-3 | Ethyl lactate | 7551.6±109.5f | 7602.0±110.2f | 5191.2±75.3e | 3937.0±57.1b | 4449.8±64.5c | 5143.5±74.6d | 3663.4±53.1b | 2376.8±34.5a | 10776.4±156.2g | 15012.7±217.6h |
| 5405-41-4 | Ethyl-3-hydroxy butanoate | n.d. | 54.7±5.6d | 32.5±3.3b | 26.2±2.7a | 32.1±3.3ab | 34.9±3.6b | n.d. | n.d. | 47.9±4.9c | 54.3±5.6d |
| 110-38-3 | Ethyl decanoate | 194.2 ±36.1g | 131.0±24.3f | 86.1±16.0e | 37.0±6.9c | 23.9±4.4b | 13.1±2.4a | 12.7±2.4a | 16.5±3.1b | 54.4±10.1d | 93.2±17.3ef |
| 123-25-1 | Diethyl succinate | 14348.0±3346.8 | 11410.7±2661.6bc | 12718.3±2966.7c | 9127.0±2129.0b | 9787.8±2283.1b | 11714.0±2732.4c | 4225.3±985.6a | 4208.2±981.6a | 12465.4±2907.7c | 16969.8±1823.4 |
| 67233-91-4 | Ethyl-9-decenoate | n.d. | n.d. | n.d. | n.d. | 8.2±2.0a | 7.5±1.8a | 11.8±2.9ab | 14.6±3.6b | 7.5±1.8a | 17.0±4.2b |
| 103-45-7 | Phenylethylacetate | 77.7±12.0e | 63.4±11.1de | 48.6±8.5cd | 36.0±6.3bc | 62.4±11.0de | 52.1±9.2d | 24.4±4.3a | 26.6±4.7ab | 50.0±8.8cd | 54.4±9.6d |
| 626-11-9 | Diethyl-DL-Malate | 8082.0±1205.2cd | 7451.9±1111.3b | 17044.7±2541.8f | 12292.8±1833.2e | 11033.1±1645.3de | 13616.2±2030.5ef | 5549.4±827.6a | 4503.6±671.6a | 7979.0±1189.9bc | 10753.4±1603.6d |
| 87-91-2 | (+)-Diethyl-L-Tartrate | 1555.3±351.6c | 2020.3±456.7cd | 3964.2±896.0e | 3064.2±692.6e | 1842.6±416.5c | 2290.8±517.8d | 840.5±190.0b | 511.4±115.6a | 1472.1±332.8c | 1592.0±359.8c |
| 1070-34-4 | Ethylhydrogensuccinate | 28759.4±5682.0cd | 17437.1±3445.1b | 27043.5±5343.0cd | 17528.8±3463.2b | 17693.8±3495.8b | 21445.7±4237.0c | 16577.6±3275.2b | 11962.3±2363.4a | 27545.3±5442.1cd | 32455.5±5412.2d |
| 3943-74-6 | Methylvanillate | n.d. | 3.0±0.3a | 5.2±0.3b | n.d. | 6.6±0.4c | 7.4±0.4c | n.d. | n.d. | n.d. | n.d. |
| Terpenes | |||||||||||
| 98-55-5 | A-Terpineol | 4.9±0.4b | 5.4±0.5b | n.d. | n.d. | 3.8±0.3a | 3.5±0.3a | 14.5±1.3c | 12.8±1.1c | 37.9±3.4d | 53.2±4.7e |
| 14049-11-7 | Epoxylinalol R | n.d. | n.d. | n.d. | n.d. | n.d. | n.d. | 3.3±0.1b | 2.5±0.1a | 7.7±0.3c | 10.8±0.4d |
| 14049-11-7 | Epoxylinalol S | n.d. | n.d. | n.d. | n.d. | n.d. | n.d. | 11.4±0.4b | 8.1±0.3a | 23.4±0.8c | 32.7±1.1d |
| Lactones | |||||||||||
| 96-48-0 | Butyrolactone | 1407.2±18.0g | 1675.9±21.4h | 1359.8±17.4f | 1235.5±15.8d | 1287.1±16.4e | 1443.3±18.4g | 754.1±9.6b | 478.7±6.1a | 1143.5±14.6c | 1260.4±16.1de |
| 599-04-2 | Pantolactone | 68.0±11.9bcd | 92.3±16.1d | 74.2±13.0bcd | 57.8±10.1ab | 58.4±10.2ab | 61.8±10.8bc | 79.8±13.9cd | 45.3±7.9a | 65.6±11.5bcd | 70.2±12.3bcd |
| 1126-51-8 | γ-Carboethoxy-γ-Butyrolactone | 1952.8±127.7e | 2235.6±146.2e | 1708.8±111.7d | 1441.1±94.2c | 1497.7±97.9c | 1605.7±105.0d | 927.8±60.7b | 668.3±43.7a | 1687.2±110.3d | 1951.4±127.6e |
| Metoxyphenols | |||||||||||
| 2785-89-9 | p-Ethylguaiacol | n.d. | 3.7±1.4b | 4.3±1.6b | 3.5±1.3b | 4.1±1.6b | 3.8±1.5b | 2.1±0.8ab | 1.4±0.5a | 491.3±187.5d | 36.1±13.8c |
| 7786-61-0 | p-Vinylguaiacol | 84.1±4.4 b | 147.7±7.7f | 118.7±6.2d | 106.4±5.5c | 126.9±6.6e | 131.8±6.9e | 85.2±4.4b | 45.3±2.4a | 187.4±9.8g | 218.4±11.4h |
| 498-02-2 | Acetylguaiacol | 30.6±1.6c | 34.0±1.8c | 31.9±1.7c | 25.4±1.3b | 13.7±0.7a | 14.3±0.7a | 31.0±1.6c | 23.3±1.2b | 56.8±3.0d | 58.6±3.1d |
| Other | |||||||||||
| 513-86-0 | Acetoin | 386.8±24.3d | 1185.6±74.6e | 248.2±15.6bc | 242.5±15.3bc | 274.3±17.3c | 1587.4±99.9f | 170.6±10.7a | 381.2±24.0d | 237.2±14.9b | 1262.7±79.5e |
| 877-95-2 | N-(2-Phenylethyl)Acetamide | 136.2±6.2g | 150.6±6.8h | 99.0±4.5f | 82.7±3.7e | 51.2±2.3d | 50.8±2.3d | 19.0±0.9c | 13.6±0.6a | 16.9±0.8b | 16.6±0.8b |
| 121-33-5 | Vanillin | n.d. | n.d. | n.d. | n.d. | n.d. | n.d. | 2.6±0.2a | 3.6±0.3b | n.d. | n.d. |
Different letters in the same row indicate significant differences. ANOVA (p ≤ 0.05) followed by Tukey post-hoc test. n.d. compound not detected. †Acronyms used in this table: Fi is Fiano; Fa is Falanghina; G is Greco; M is Montonico; VB1 is commercial S. cerevisiae strain VB1, Oenobrands; Lt is L. thermotolerans; Sc is commercial S. cerevisiae strain 18-2007 IOC; S21 is authoctonous S. cerevisiae strain in S21.
Disclaimer/Publisher’s Note: The statements, opinions and data contained in all publications are solely those of the individual author(s) and contributor(s) and not of MDPI and/or the editor(s). MDPI and/or the editor(s) disclaim responsibility for any injury to people or property resulting from any ideas, methods, instructions or products referred to in the content. |
© 2024 by the authors. Licensee MDPI, Basel, Switzerland. This article is an open access article distributed under the terms and conditions of the Creative Commons Attribution (CC BY) license (http://creativecommons.org/licenses/by/4.0/).
Copyright: This open access article is published under a Creative Commons CC BY 4.0 license, which permit the free download, distribution, and reuse, provided that the author and preprint are cited in any reuse.


