
Submitted:
28 June 2025
Posted:
30 June 2025
You are already at the latest version
Abstract
The purpose of this study is to examine the validity of a reflective–formative framework for the push pull tourist motivation model developed by Antonia Correia, Metin Kozak, and Joao Ferradeira in 2013, in comparison to its traditional reflective–reflective framework. An empirical study was conducted using purposive sampling, and the relationships between variables were examined through Partial Least Squares Structural Equation Modelling (PLS-SEM). The study theoretically grounded as well as empirically validated the reflective–formative construct structure for the Push–Pull Tourist Motivation over the existing Reflective–Reflective construct structure. It further found that the reflective–reflective specification may lead to model misspecification, which can result in inaccurate estimation of tourist motivation and perceptions. Due to the population characteristics, purposive sampling was employed; however, a sample size of 319 may be considered limited for a cross-cultural study. This research contributes to the accurate estimation of the Push–Pull Tourist Motivation in a manner consistent with its theoretical framework and helps to reduce the risk of model misspecification and incorrect interpretations.
Keywords:
tourist Satisfaction
; tourist motive
; model misspecifications
; push pull motive
1. Introduction
Tourism is one of the most zestful and evergreen businesses in the world (Streimikiene et al., 2021). A purposive and conscious plan is essential for the development of tourism in congruence with environmental, economic, and societal goals of society (Bikse & Gavinolla, 2021; Scott & Gössling, 2022; Streimikiene et al., 2021). Understanding tourist motives helps market tourism effectively (Fodness, 1994). The two most frequently used measurement models for tourist motives are the self-perception (SP) and importance-rating (IR) approaches; both approaches are equally reliable and valid, producing similar factor structures empirically (Huang, 2010). However, the SP approach was found to be more pervasive in application (Fodness, 1994; Kessler et al., 2020; Kim et al., 2010). Several researchers (Fodness, 1994; Huang, 2010; Meng et al., 2008; Su et al., 2020; Ying & Wen, 2019) observed a lack of conceptual and empirical analogy in tourism motivation models. The development of an inventory to measure tourist motives universally across diverse tourist contexts is considered beyond scope (Huang, 2021), as tourist motivators are heterogeneous and contextual. New tourism concepts continue to emerge, often unattended theoretically or empirically. Nevertheless, some core motivational themes are evident in most tourism contexts (Huang, 2021).
The Push-Pull Model proposed by Dann (1977) is one of the widely adopted tourist motivation measurement models (Yousaf et al., 2018). Several researchers (Battour et al., 2017; Correia et al., 2007; Dunn Ross & Iso-Ahola, 1991; Pestana et al., 2020) have utilized the push-pull model for assessing tourist motivation. However, Dann’s push-pull motivation model lacks a strong theoretical foundation to validate its conceptual soundness (Huang, 2021). In 2013, Correia et al. developed a tourist motivation model based on the push-pull theory proposed by Dann (1977). According to Dann (1977), push factors are intrinsic within tourists, while pull factors represent destination characteristics, indicating some push and pull factors for tourist motivation are fixed in nature. When construct dimensions are fixed, the model should follow a formative structure (Finn & Wang, 2014; Lee & Cadogan, 2013). In contrast, push-pull based motivation measurement approaches (Battour et al., 2017; Correia et al., 2013; Dunn Ross & Iso-Ahola, 1991; Jang & Wu, 2006; Mimi et al., 2011) have been traditionally modeled reflectively. Dann (1977) described “anomie” and “ego-enhancement” within tourists as causing push factors inherent in every individual, meaning changes in these domains affect the tourist’s motivation level. Similarly, certain basic amenities or characteristics, termed “pull factors,” are expected to be universally present, further supporting their fixed nature. This indicates a divergence between the theoretical model of push-pull tourist motivation and its measurement model. Model misspecification can lead to incorrect model fit and misinterpretation, resulting in erroneous conclusions (Jarvis et al., 2003; Roy et al., 2012). Therefore, the objective of this study is to assess the validity of a reflective-formative measurement model of the push-pull theory of Tourist Motivation (TM) over the traditional reflective-reflective model.
2. Research Framework
2.1. Push Pull Tourist Motivation: An Evaluation of Construct Structure
There is no consensus in the literature regarding a conceptual framework or theoretical definition explaining tourist motivation (Huang, 2021). Various conceptual frameworks exist, among which the Push-Pull Model, Travel Career Ladder Model, Escaping-Seeking Model, and Travel Career Patterns Model are well recognized by tourism researchers (Hsu & Huang, 2007; Huang, 2021). For measuring tourist motivation (TM), the Push-Pull Model developed by Correia et al. (2013) is widely recognized (Cong, 2016; Dean & Suhartanto, 2019; Devesa et al., 2010). Within Push-Pull tourism motives, there are motivators that are destination- and context-specific, as well as destination- and context-general (Kozak, 2002). Dynamic modeling of motivation considers tourist motivation as influenced by individual tourist motives and destination-specific characteristics. Contextual tourist motives are affected by destination-specific factors, nationality, culture, and macro-economic variables (Pesonen et al., 2011). Tourist needs and wants continuously change based on individual preferences and travel status (Putri et al., 2021). Such dynamic modeling leads to a lack of common agreement on a theoretical framework within tourism research (Huang, 2010). Modeling TM as a complex psychological construct with individual-specific characteristics contributes to the absence of widely accepted research methodologies and validated measurement constructs (Pearce & Butler, 1993)
According to Dann (1977), certain types of anomie such as “escapism from daily life,” “need for social interaction,” and “need for love and affection” can motivate individuals to travel regardless of their living environment. Ego-enhancement refers to the desire for higher social status (Dann, 1977). When an individual travels from their usual place of residence to a new destination, their previously assigned social position dissolves, as their identity is unknown at the new location (Dann, 1977). Several core motivational factors commonly appear across most tourism contexts (Huang, 2021; Jewell & Crotts, 2002; Klenosky, 2002). Push and pull factors represent two sides of the motivation coin (Goossens, 2000). Both push and pull factors are psychosocial constructs derived from an individual’s intrinsic desires (Baloglu & Uysal, 1996). Tourists are pushed by emotional needs and pulled by the emotional benefits experienced at the destination (Goossens, 2000). Common tourist motivators include escapism, novelty seeking, knowledge acquisition, prestige, dream fulfillment, socialization, relaxation, destination amenities, and health and fitness (Correia et al., 2013; Devesa et al., 2010; Huang, 2021; Kozak, 2002; Seabra et al., 2016). Regional elements are insignificant in determining tourist motivation (Crompton, 1979). Generally, travel motivators can be categorized into three main groups: novelty, knowledge, and facilities at the tourist destination (Andruliene et al., 2018; Correia et al., 2013; Prebensen et al., 2014).
2.2. Push-Pull Tourist Motivation (PPTM): A Reflective–Formative Model
Push and pull factors of tourist motivation are theoretically distinctive (Bayih & Singh, 2020; Dann, 1977). Emotion is a common psychosocial factor influencing both push and pull travel motives; therefore, these factors need to be considered together (Goossens, 2000). Both push and pull factors are psychosocial constructs derived from an individual’s intrinsic desires (Baloglu & Uysal, 1996). According to Dann (1977), push factors such as ego-enhancement and anomie dimensions lack theoretical congruence, indicating that the factor dimensions within the Push-Pull Model of tourist motivation (TM) are independent. The formative model is appropriate when factors are not correlated with each other (Jarvis et al., 2003). Each dimension of push and pull factors within TM is determined by specific items (Correia et al., 2013; Hanqin & Lam, 1999). Reflective measures represent a single dimension and are conceptually interchangeable (Edwards, 2011); thus, altering any measure does not affect the construct’s interpretation (DeVellis, 2016). However, the items within each dimension of push-pull factors are contextual and should be modified according to the tourism context (Cong, 2016; Hsu & Huang, 2007; Klenosky, 2002). Consequently, within the Push-Pull Tourist Motivation (PPTM), the first-order constructs should be structured reflectively.
Unidimensional reflective measurement models cannot accommodate multidimensional constructs (Lee & Cadogan, 2013). The Push-Pull Model of TM is multidimensional (Correia et al., 2013; Dann, 1977; Goossens, 2000; Huang, 2021); thus, it cannot be structured as a second-order reflective construct. Higher-order reflective constructs can lead to misleading interpretations (Lee & Cadogan, 2013), and there is no rationale for developing hierarchical constructs that are reflective at higher levels (Mikulić, 2022). Traditionally, the Push-Pull Model of TM has been structured reflectively at both first and second-order levels (Correia et al., 2013; Dean & Suhartanto, 2019; Hanqin & Lam, 1999; Huang, 2010; Seabra et al., 2016). However, based on theoretical justifications, the Push-Pull Model should adopt a reflective-formative structure. Although not extensively applied in motivational research, formative models have been appropriately adopted in tourism research (Mikulić, 2022). Mis-specification of constructs positioned endogenously, such as TM, can cause downward bias in structural estimates (MacKenzie et al., 2005). Erroneous modeling using a reflective perspective can lead to underestimated relationships (Diamantopoulos & Siguaw, 2006). Thus, a reflective-formative perspective for the Push-Pull Model of TM should significantly explain more variance in outcome variables than a reflective-reflective perspective. The better-fitting model produces superior estimations for path coefficients and parameters (Diamantopoulos & Siguaw, 2006; MacKenzie et al., 2005).
Tourist motivation is classically framed by intrinsic push drives and extrinsic pull attributes, yet most empirical models ignore this distinction. We address this gap by proposing a two-tier motivation model: first-order push factors are treated as formative causes that combine into an overall motivation construct. Hamdy et al. (2023) extended push–pull (as “extrinsic” vs. “intrinsic” motives) to tourist experience and destination image, noting it was the first work to link these facets in an integrated model. Our work complements these by clarifying how to measure push–pull factors in hierarchical models. Across disciplines, studies on hierarchical component models have advocated careful reflective formative specification (e.g., Diamantopoulos & Winklhofer, 2001; Jarvis et al., 2003), and our results empirically validate those recommendations in tourism. In sum, this study adds to the literature by not only applying push–pull theory to tourism motivations but by improving its measurement.
2.3. Hypothesis 1: Social Motive (SM) and Push Pull Tourist Motivation (PPTM)
To empirically assess the better-fitting model between reflective-reflective and reflective-formative structures for PPTM, the construct Social Motive (SM) was selected as a related outcome variable, expected to have significant relationships with TM. SM includes interpersonal and personal seeking (Doran et al., 2015; Qiao et al., 2024). Previous studies have identified and validated the relationship between TM and SM (Chavez, Ruiz, Curras, & Hernandez, 2020; Crompton, 2024; Hsu, Cai, & Wong, 2007; Jensen, 2015; Pearce & Lee, 2005; Ryu, Hyun, & Shim, 2015; Zhou, Liu, Hu, & Cao, 2023). Hence, the following hypothesis is proposed:
H1.
The Reflective–Formative Model of the Push-Pull Tourist Motivation (RFM-PPTM) predicts greater variance in SM than the Reflective–Reflective Model of the Push-Pull Tourist Motivation (RRM-PPTM).
2.4. Hypothesis 2: Self-actualisation (SA) and Push Pull Tourist Motivation (PPTM)
The construct Self-actualisation (SA) was also selected as a related outcome variable, expected to have a significant relationship with TM. SA replicates the ego-enhancement motive, identified as a primary travel motive (Crompton, 2024). Previous research supporting the relationship between TM and SA includes studies by Crompton (2024), Michael, Nyadzayo, Michael, and Balasubramanian (2020), Pearce and Caltabiano (1983), Pearce and Lee (2005), and Šimková and Holzner (2014). Thus, the following hypothesis is proposed:
H2.
The Reflective–Formative Model of the Push-Pull Tourist Motivation (RFM-PPTM) predicts greater variance in SA than the Reflective–Reflective Model of the Push-Pull Tourist Motivation (RRM-PPTM).
2.5. Hypothesis 3: General Self-Efficacy (GSE) and Push Pull Tourist Motivation (PPTM)
The third outcome variable selected for this study is General Self-Efficacy (GSE). GSE is a construct theoretically and logically distinct from TM. It represents an individual’s perceived ability to solve encountered problems independently (Jerusalem & Schwarzer, 1992). Information and literacy self-efficacy significantly influence positive destination image formation (Castañeda-García & Frías-Jamilena, 2024). However, as a distinct construct from TM, GSE should theoretically exhibit no significant relationship with TM. Model misspecification can yield superior predictive power for unrelated outcome variables (Jarvis et al., 2003). Thus, the reflective-reflective model of PPTM may predict greater variance in GSE if mis-specified. Therefore, the following hypothesis is proposed:
H3.
The Reflective–Reflective Model of the Push-Pull Tourist Motivation (RRM-PPTM) predicts greater variance in GSE than the Reflective–Formative Model of the Push-Pull Tourist Motivation (RFM-PPTM).
Figure 1 illustrates the conceptual framework of the study, comparing both the traditional (reflective-reflective) and proposed (reflective-formative) frameworks of PPTM in predicting SM, SA, and GSE.
3. Material and Methods
3.1. Method of Analysis
This research is the theoretical evaluation and empirical validation of the factor structure of the Push-Pull framework of tourist motivation model. Specifically, the study evaluates the suitability of a reflective-formative structure for the Push-Pull tourist motivation model compared to its traditional reflective-reflective structure. Theoretically, the determination of whether a construct should be formative or reflective is based on the construct classification criteria proposed by Hanafiah (2020). According to this criterion, construct structure is evaluated from three perspectives: nature of the construct, direction of causality, and characteristics of indicators. Regarding the nature of the construct, if a latent construct exists independently of its measures, it exemplifies a reflective structure; conversely, if a latent construct depends on its measures, it is indicative of a formative structure (Borsboom et al., 2003; Coltman et al., 2008; Wilcox et al., 2008). In terms of direction of causality, a model is reflective when causality flows from the construct to its indicators; however, if causality flows from the indicators to the construct, a formative model structure is represented (K. A. Bollen & Diamantopoulos, 2017; K. Bollen & Lennox, 1991). Concerning the characteristics of indicators, reflective indicators are interchangeable since they collectively represent a common theme, whereas formative indicators are definite and finite in relation to their construct (Coltman et al., 2008; Hulland, 1999).
Partial Least Squares Structural Equation Modeling (PLS-SEM) was used to estimate the model, specifically employing the ‘seminr’ package in R software. The validation followed the methodological procedures outlined by Hair et al. (2021). The procedures for assessing the validity of a higher-order formative construct differ notably from those of reflective constructs (Diamantopoulos & Winklhofer, 2001; Jarvis et al., 2003; Lee & Cadogan, 2013). To empirically compare the traditional reflective-reflective construct perspective with the proposed reflective-formative perspective of tourist motivation, the PLS-SEM model comparison methodology recommended by various researchers was adopted (see Hair et al., 2021; S. Kim, 2011; MacKenzie et al., 2005; Nguyen, 2020). According to Diamantopoulos and Winklhofer (2001), a theoretically grounded measurement model should demonstrate superior predictive power regarding related outcome variables (in this study, SM and SA) and should have lower AIC and BIC values compared to a theoretically unsound measurement model. Conversely, a theoretically unsound measurement model may exhibit superior predictive power regarding outcome variables unrelated to the construct (in this study, GSE), due to model misspecification (Jarvis et al., 2003).
We chose PLS-SEM over covariance-based SEM for this analysis because it is better suited to our model’s structure and sample size. PLS-SEM makes no distributional assumptions and focuses on maximizing explained variance Seočanac, (2024). Unlike CB-SEM, which emphasizes global fit and relies on shared variance, PLS SEM treats constructs as composites when appropriate and excels in predictive contexts. Recent guides specifically recommend PLS-SEM for higher-order models with formative components (Becker et al., 2012; Hair et al., 2019). By using PLS-SEM, we followed best practices for nomological validation with formative indicators, ensuring that our estimates are robust even with a relatively small sample (Seočanac, 2024).
3.2. Sample and Procedure
Researchers (See, Islam et al., 2021; Kuvaas et al., 2020; Morales-García et al., 2022) recommend employing robust and statistically validated measures to determine the appropriate sample size. As this study primarily employs Partial Least Squares Structural Equation Modeling (PLS-SEM), the a priori sample size calculator for SEM developed by Soper was utilized (Islam et al., 2021; Kanwal et al., 2023; Morales-García et al., 2022). Considering the number of latent variables (N = 7), the corresponding measurement items (N = 24), and commonly accepted threshold values for medium effect size (0.03), probability level (0.05), and desired statistical power level (0.80) (see Soper, 2022), the minimum required sample size was determined to be 170. Data for Study were collected via a crowdsourcing platform known as Clickworkers using purposive sampling. A total of 319 valid responses were retained for analysis (from an initial set of 350 completed questionnaires, 31 responses were invalidated due to failed security checks). The responses were received within one week of initiating the online survey on October 2, 2024. The participation was voluntary in nature and all members of the Clickworkers platform were eligible to participate, provided they had undertaken a vacation or leisure trip within the preceding 12 months. The participants were provided with the information sheet explaining the purpose of the study and no personal identification information were gathered at any phase rather than demographics.
3.3. Measures
Control Variables: The control variables used in the study included tourist demographics such as age, gender, and marital status (Bayih & Singh, 2020; Hanqin & Lam, 1999; Taheri et al., 2014); socio-cultural variables such as education, religion, ethnicity (race), income, and occupation (Hanqin & Lam, 1999; Kozak, 2002; Taheri et al., 2014); and other variables identified as influential to tourist motivation, such as mode of transportation (Cong, 2016; Kim et al., 2021; Wiradnyana et al., 2021).
Push Pull Tourist Motivation. PPTM was measured using the tourist motivation construct developed by Correia et al. (2013). This scale has previously been utilized by several researchers (Martaleni et al., 2021; Pawaskar et al., 2020; Santoso, 2019) and was originally constructed based on Dann’s (1977) Push-Pull theory of tourist motivation. The Correia et al. (2013) scale was selected because it is widely applied and incorporates both push and pull factors together at the first-order level, aligning with the theoretical framework defined by Goossens (2000). The scale comprises 11 items across three dimensions (two push dimensions and one pull dimension) and follows a reflective-formative framework.
Outcome Variables: The research has three outcome variables viz., GSE, SM and SA. GSE representing the construct that is theoretically distinct from TM. Whereas, SM and SA representing the constructs that are theoretically as well as empirically linked with TM General self-efficacy (GSE) was measured using the GSE-6 scale developed by Romppel et al. (2013). The GSE-6 is a six-item unidimensional scale widely cited (319 citations to date) and frequently used due to its concise and practical nature for assessment purposes. Social motive (SM) to travel was measured using the Holiday Motivation Scale developed by Ryan and Glendon. The scale includes three sub-domains, one of which is SM, measured specifically through four items. An example of an SM item from this scale is “build friendships.” Self-actualisation (SA) was measured using an adapted SA scale developed by Yang et al. (2021). This scale is a three-item unidimensional instrument designed to measure self-actualisation as a reflection of an individual’s self-perception.
4. Results
4.1. Participants Profile
The Table 1, shows the profile characteristics of the respondents who participated in the study.
As shown in Table 2, the sample consisted of 319 respondents. Regarding age distribution, 45.5% were below 35 years, 44.5% were between 35 and 54 years, and 10.0% were aged 55 and above. In terms of gender, 47.96% identified as male, 47.96% as female, 0.00% as transgender, and 4.08% chose not to disclose their gender. Marital status was reported as follows: 8.15% were single, 25.08% in a relationship, 57.37% married, and 9.40% divorcees. For educational background, 21.63% had no college degree, 38.56% held an undergraduate degree, and 39.81% had a graduate degree or higher. Annual household income levels were distributed as: 26.65% earning less than $1000, 21.63% earning between $1000 and $3000, 31.35% earning between $3000 and $6000, 17.87% earning between $6000 and $9000, and 2.51% earning more than $9000. Regarding the main mode of transportation at tourist destinations, 26.02% used rentals, 30.72% used private transport, 31.35% used public transport, and 11.91% used other modes. In terms of occupation, 17.55% were unemployed, 18.18% retired, 22.57% employed part-time, and 41.69% employed full-time. For race, 30.09% identified as White/Caucasian, 20.38% as Black/African, 27.90% as Asian/Pacific Islander, and 21.63% as belonging to other races. In terms of religion, 7.21% identified as Atheist, 10.03% as Buddhist, 33.86% as Christian, 10.66% as Hindu, 24.76% as Muslim, and 13.48% as followers of other religions.
4.2. Push–Pull Tourist Motivation: Theoretical Evaluation of Construct Structure
While analysing the Push-Pull Tourist Motivation Model (PPTM) construct structure from the theoretical perspective (i.e., based on construct classification criteria), the higher-order latent variable of the push-pull model tourist motive is a multi-itemised construct with three first-order constructs which are of fixed in nature, viz., novelty, knowledge, and facilities (Correia et al., 2013; Huang, 2010, 2021). This indicates that the TM is dependent on these three variables. That is; while considering the nature of the construct, TM can only be formative in nature.
Further, according to Dann (1977), push factors of TM are intrinsic (ego and anomie) and their dimensions are fixed. The ego enhancement and the anomie level of the tourist determine the motivation level of the tourist (Dann, 1977). This clarifies that the direction of causality is from ego enhancement and anomie to motivation (push). However, the determinants of ego and anomie can have socio-cultural as well as economic dimensions (see Dann, 1977). Therefore, it can be concluded that the direction of causality is from the indicators (ego and anomie) to the construct. Hence, according to the direction of causality, the PPTMM has a higher-order formative and lower-order reflective (i.e., indicators of ego enhancement and anomie are not finite) structure.
Similarly, the push and pull factors are distinctive from the theoretical perspective (see Bayih & Singh, 2020; Dann, 1977). That is, the pull dimension and push dimension have a unique structure, and the indicators are not interchangeable in nature. Further, the sub-constructs of push factors, viz., ego enhancement and anomie, are also distinctive in nature (see Dann, 1981). Therefore, while analysing the characteristics of indicators, PPTMM has a second-order formative and first-order reflective structure. Hence, based on theoretical evaluation, it can be concluded solidly that PPTM has a reflective–formative construct structure rather than the traditional formative–formative construct structure.
4.3. Push-Pull Tourist Motivation: An Empirical Evaluation of Construct Structure
4.3.1. Reliability and Validity
PLS-SEM is used to evaluate and compare the construct structure and dimensionality of the PPTM. The model assessment methodology of PLS-SEM is distinctive from that of CB-SEM (Dash & Paul, 2021; Hair et al., 2011; Henseler et al., 2015). The model assessment of a reflective measurement in PLS-SEM involves four steps, viz., assessing the indicator reliability, assessing the internal consistency reliability, assessing the convergent validity, and assessing the discriminant validity (Hair et al., 2021). In this study, PLS-SEM modelling has been followed, and the quality assessment of the measurement and structural model was conducted as per the methodology proposed by several researchers (Dash & Paul, 2021; Hair et al., 2011, 2021; Henseler et al., 2015). Table 2 illustrates the measurement model assessment statistics of the study.
Table 2 presents the results of the measurement model assessment for the constructs General Self-Efficacy (GSE), Social Motive (SM), Self-Actualisation (SA), Tourist Motivation–Novelty (TMN), Tourist Motivation–Facilities (TMF), Tourist Motivation–Knowledge (TMK), and the second-order construct Push Pull Tourist Motivation (PPTM). The quality of the measurement model was evaluated based on indicator loadings, internal consistency reliability (Cronbach’s alpha and composite reliability), convergent validity (average variance extracted, AVE), and discriminant validity using the heterotrait–monotrait (HTMT) ratio.
The measurement model of both Reflective–Reflective as well as Reflective–Formative PPTMM follows the same structure. As displayed in Table 2, all the indicators have communality values above .50, confirming the indicator reliability (Hair et al., 2011, 2022). Similarly, the composite reliability (ρc) and the Cronbach’s alpha (α) values of all the constructs considered in the study were > .70, indicating the internal consistency reliability of the constructs (Henseler et al., 2015; Trizano-Hermosilla & Alvarado, 2016). Cronbach’s alpha (α) values were .821 for GSE, .772 for SM, .756 for SA, .957 for TMN, .886 for TMF, .953 for TMK, and .894 for PPTM. Composite reliability (ρc) values were .869 for GSE, .854 for SM, .864 for SA, .972 for TMN, .921 for TMF, .966 for TMK, and .878 for PPTM.
The convergent validity is assessed with the help of average variance extracted (AVE), and all constructs have AVE > .50 (see Table 2), validating the convergent validity of the constructs (Hair et al., 2019). Specifically, AVE values were .527 for GSE, .597 for SM, .688 for SA, .921 for TMN, .744 for TMF, .875 for TMK, and .707 for TM, indicating substantial shared variance among the indicators of each construct.
Further, to assess the discriminant validity of the constructs in the model, the heterotrait–monotrait ratio (HTMT) was used. An HTMT < .85 between the constructs indicates discriminant validity (Henseler et al., 2015). According to Table 2, the HTMT ratios between all the constructs, except between the first-order constructs of PPTM and PPTM itself, were well under .85, confirming the discriminant validity of the model. The HTMT values between TM and its first-order constructs—TMN, TMF, and TMK—were .992, .988, and .943, respectively, validating the higher-order construct structure of the PPTMM (Hair et al., 2022). That is, the measurement model demonstrated sufficient levels of indicator reliability, internal consistency reliability, convergent validity, and discriminant validity, thereby supporting the validity and reliability of the model constructs.
4.3.2. Model Comparison
Two models were formulated as part of the study: the Reflective–Reflective Model and the proposed Reflective–Formative Model. The Reflective–Formative Model (RFM) is the model in which the PPTM is structured as first-order reflective and second-order formative. Whereas, the Reflective–Reflective Model (RRM) is the model in which the PPTM is structured as both first-order and second-order reflective (traditional structuring). In PLS-SEM, the model is evaluated based on the path coefficient, R², AIC, and BIC values (Hair et al., 2022). It does not produce the model fit indices that the CB-SEM may produce (Dash & Paul, 2021). Table 3 shows the predictive performance of Reflective–Formative Model of Push Pull Tourist Motivation (RFM-PPTM) and Reflective–Reflective Model of Push Pull Tourist Motivation (RRM-PPTM) predicting SA and SM.
As shown in Table 3, the Reflective–Formative Model of the Push–Pull Tourist Motivation (RFM-PPTM) demonstrated greater explanatory power for social motive to travel (SM; R² = .536) and self-actualisation (SA; R² = .231) than the Reflective–Reflective Model of the Push–Pull Tourist Motivation Model (RRM-PPTM), which accounted for R² = .493 in SM and R² = .217 in SA. For the path from PPTM to SM, the RFM-PPTM yielded a standardized estimate of β = .732 with a 95% confidence interval of [.660, .798], whereas the RRM-PPTM produced β = .702 with a 95% confidence interval of [.624, .770]. For the path from PPTM to SA, the RFM-PPTMM showed β = .481, 95% CI [.388, .582], while the RRM-PPTM produced β = .466, 95% CI [.375, .559]. In terms of model fit, the RFF-PPTMM yielded lower AIC and BIC values for SM (AIC = −241.97; BIC = −234.44) and SA (AIC = −80.85; BIC = −73.32) than the RRF-PPTMM (SM: AIC = −213.45, BIC = −205.92; SA: AIC = −74.96, BIC = −67.43). These results support Hypotheses 1 and 2, indicating that the RFF-PPTM exhibited superior predictive performance and better model fit for the outcome variables SM and SA than the existing Reflective–Reflective Model of the Push–Pull Tourist Motivation (RRM-PPTM). Figure 2, illustrates Reflective-Reflective Model of PPTM predicting GSE, SM and SA.
Table 4 presents the predictive performance of the Reflective–Formative Model and Reflective–Reflective Model of PPTM for general self-efficacy (GSE), a construct that is distinct from tourist motivation (TM).
As shown in Table 4, the Reflective–Reflective Model of the Push–Pull Tourist Motivation (RRM-PPTM) demonstrated greater explanatory power for general self-efficacy (GSE; R² = .018) than the Reflective–Formative Framework of the Push–Pull Tourist Motivation Model (RFM-PPTM; R² = .014). For the path from PPTM to GSE, the standardized coefficient in the RRM-PPTM was β = −.133, with a bootstrap mean of −.152, standard error (SE) = .041, and a 95% confidence interval of [−3.279, −0.080]. The corresponding AIC and BIC values were −2.73 and 4.80, respectively. In the RFM-PPTM, the standardized coefficient for PPTM → GSE was β = −.120, with a bootstrap mean of −.143, SE = .042, and a 95% confidence interval of [−0.223, −0.072]. The AIC and BIC values in the RFM-PPTM were −1.63 and 5.90, respectively. These results support Hypothesis 3, indicating that the RRM-PPTM provided a better predictive accuracy and model fit for GSE, a construct theoretically unrelated to tourist motivation. Figure 4, illustrates the proposed Reflective-Formative Model of PPTM predicting GSE,.
Figure 3.
Reflective-Reflective Model of PPTM predicting GSE, SA and SM.

5. Discussion
The Push–Pull Tourist Motivation Model (PPTMM) is widely regarded as a comprehensive framework to explain behavioral and psychological motives in tourism. Theoretically, it has been classified as a first-order reflective and second-order formative construct (Correia et al., 2013; Dann, 1977; Huang, 2021). The first-order constructs—knowledge, novelty, and facilities—represent reflective dimensions that load onto the higher-order construct of Push–Pull Tourist Motivation (PPTM). This classification is supported by construct classification criteria based on the direction of causality, where the latent variable PPTM is determined by its indicators (Jarvis et al., 2003; MacKenzie et al., 2005). According to Dann (1977), push factors such as ego enhancement and anomie are intrinsic and fixed, implying a formative role for these dimensions in constructing PPTM. The indicators in PPTMM—representing push and pull factors—are distinctive and non-interchangeable, affirming a second-order formative and first-order reflective structure (Bayih & Singh, 2020; Dann, 1981). The higher-order latent variable (Tourist Motivation, TM) depends on three fixed first-order constructs: novelty, knowledge, and facilities, indicating a formative structure. This suggests that the causality flows from indicators to construct, supporting a formative model. Indicators of push and pull factors are not interchangeable and have a definite structure, which supports a reflective measurement at the first-order level. Based on these dimensions, PPTMM should follow a second-order formative and first-order reflective model (i.e., reflective–formative structure).
Empirical evidence further validates this theoretical structuring. For instance, the Reflective–Formative Model of the PPTM (RFM-PPTM) explained more variance in theoretically associated constructs such as Social Motive (SM; R² = .536) and Self-Actualisation (SA; R² = .231), compared to the Reflective–Reflective Model (RRM-PPTM), which accounted for R² = .493 in SM and R² = .217 in SA. In addition, the RFM-PPTM demonstrated lower AIC and BIC values, indicating superior model fit. These findings are supported by research showing significant links between TM and SM (Crompton, 2024; Zhou, Liu, Hu, & Cao, 2023; Chavez, Ruiz, Curras, & Hernandez, 2020; Ryu, Hyun, & Shim, 2015; Jensen, 2015; Hsu, Cai, & Wong, 2007; Pearce & Lee, 2005), as well as between TM and SA (Crompton, 2024; Pearce & Lee, 2005; Michael, Nyadzayo, Michael, & Balasubramanian, 2020; Šimková & Holzner, 2014; Pearce & Caltabiano, 1983). According to Diamantopoulos and Winklhofer (2001), the theoretically grounded measurement model should have a superior predictive power on outcome variables and lower AIC and BIC values which are related to the construct (here in this study SM and SA) than a theoretically unsound measurement model. That is, it can be ascertained that because of the theoretically sound model specification, RFM-PPTM predicts a larger amount of variance on outcome variables viz., SA and SM than the traditionally specified RRM-PPTM. Conversely, the RRM-PPTM showed a better predictive performance for General Self-Efficacy (GSE; R² = .018) than the RFM-PPTM (R² = .014), despite GSE being theoretically unrelated to TM. This supports the assertion that model misspecification can inflate prediction for unrelated constructs (Jarvis et al., 2003). Moreover, the HTMT values for the sub-constructs of PPTM were above the liberal threshold of .900, with TMN = .992, TMF = .988, and TMK = .943, further validating the higher-order construct structure of the PPTMM (Hair et al., 2022). Therefore, both theoretical and empirical evidence suggest that PPTMM should be modelled as a reflective–formative construct rather than a reflective–reflective model to more accurately capture tourist motivation.
This study’s primary novelty lies in realigning the Push–Pull Motivation model with its theoretical foundations. By recognizing that push motivations (internal drivers) and pull motivations (destination attributes) are causally distinct components that collectively constitute overall tourist motivation, we depart rom conventional reflective-only models. Guided by construct validity principles , we demonstrate that push and pull dimensions should form the higher-order construct. Our theoretical analysis (drawing on Dann’s [1977] original push–pull concept and later articulations) establishes that when first-order dimensions are conceptually fixed causes of motivation, the correct measurement model is reflective at the first-order and formative at the second-order. Empirically, our PLS-SEM results confirm this: the reflective formative model achieved stronger explanatory power for motivation-related outcomes than the traditional reflective model . In practical terms, this means our specification provides more accurate estimates of how core motives combine to drive tourist behavior; mis-specification, by contrast, can inflate spurious paths and mislead researchers . Hence, a key contribution is demonstrating both theoretically and empirically that push–pull motivation is best represented via a reflective–formative framework, resolving a gap between theory and measurement in the tourism literature
Our reflective–formative model delivers higher predictive accuracy because it aligns measurement with theory. Conceptually, treating push motives as formative (fixed antecedents) means each motive contributes its unique variance to overall motivation, rather than being interchangeable effects. This preserves their causal influence on outcomes. Consistent with this idea, Nguyen (2020) found that a reflective–formative hierarchical model of authenticity exhibited “strong predictive power” on tourist satisfaction . Likewise, our reflective–formative specification explains substantially more variance in motivation-related outcomes than the conventional model and avoids the inflated spurious paths that appeared when we forced a fully reflective structure.
We build on prior tourism research by reconciling theory and measurement. Earlier studies often modeled push–pull motives reflectively (e.g. Correia et al. 2013; Jang & Wu 2006), implicitly assuming the latent motivation construct causes its dimensions. Recent methodological critiques warn that such mis-specification can produce misleading inferences. Our empirical results reinforce these warnings. For example, Yang et al. (2023) validate push–pull theory in rural educational tourism and find that pull factors directly boost loyalty while push factors have the strongest effect via satisfaction . Nieves-Pavón et al., (2025) show push and pull motives shape willingness-to-pay and eWOM in smart tourism destinations, and they advise managers to tailor digital services to tourists’ motivational profiles. In comparing to prior work, this study engages with a broad base of tourism motivation research that has traditionally modeled push–pull constructs reflectively (e.g. Correia et al., 2013; Jang & Wu, 2006; Dunn Ross & Iso-Ahola, 1991). These earlier models implicitly assumed the aggregate motivation construct “reflects” its dimensions, but they did not test the formative alternative. Our findings resonate with and extend recent methodological critiques in tourism research. For example, Murphy & Hofacker (2009) argued that correct reflective vs. formative specification is crucial because mis-specification can lead to Type I/II errors and “inappropriate conclusions about hypothesized relationships”. Similarly, Mikulić (2022) noted widespread confusion in tourism studies regarding measurement modes, and our study provides a concrete solution within the push–pull context. In terms of content, our results also align with the theoretical view that push and pull factors are conceptually distinct parts of motivation . By structuring the model accordingly, we find consistency with known links between tourist motivation and outcomes; for example, our reflective–formative model yielded expected positive effects on social motives and self actualization (consistent with Crompton 2024; Pearce & Lee 2005) while avoiding the spurious effects seen under reflective-only modeling .
5.1. Theoretical implications
This study bridges a gap between classic push–pull theory and modern measurement. We show that overall tourist motivation is formed by distinct sub-motives, not reflected by them, which enhances construct validity. Future research on tourism motivations (and other composite constructs) should adopt reflective–formative frameworks when theory indicates causal aggregation. By doing so, scholars can avoid the Type I/II errors highlighted in methodological literature and obtain more coherent, interpretable models. In line with Nguyen (2020), our reflective–formative model’s strong explanatory power confirms that respecting constructs’ nature leads to better models.
5.2. Managerial implications
For destination marketers and practitioners, this framework offers a clearer way to segment and reach tourists. By identifying visitors’ formative push motives (e.g. novelty seeking vs. relaxation seeking), managers can tailor offerings and communications to each motivational profile. For instance, Katsikari et al. (2020) segmented tourists by push–pull motives and designed targeted social media content for each group . Similarly, managers could develop marketing messages or destination experiences that specifically address the dominant motives of each segment. Overall, treating push and pull factors as composite drivers enables more precise targeting: destinations can promote attributes (pulls) that best complement a tourist’s intrinsic desires (pushes), thereby improving satisfaction and loyalty.
6. Conclusion
The research uniquely validates a reflective–formative framework for the Push–Pull Tourist Motivation Model (PPTMM), contrasting it against the traditionally used reflective–reflective approach. This is significant because previous models did not appropriately reflect the theoretically independent and formative nature of push and pull dimensions as originally conceptualized by Dann (1977) and later refined by Correia et al. (2013). Model misspecification is a common error in social science research (Mikulić, 2022; Nguyen, 2020). Though highest-order constructs should not be modelled reflectively (MacKenzie et al., 2005), reflective frameworks are still commonly used in theory development within the social sciences (Coltman et al., 2008). However, formative models may offer a more appropriate approach (Coltman et al., 2008). The theoretical evaluation and empirical assessment in this study confirm that the Push–Pull Tourist Motivation Model (PPTM) follows a reflective–formative structure rather than the traditionally followed reflective–reflective structure. This study has demonstrated both theoretically and empirically that the PPTM is best represented by a first-order reflective, second-order formative structure. Moreover, model misspecification results in underestimation and overestimation of predictive relationships, as evidenced by the reduced predictive power of PPTM on Self-Actualisation (SA) and Social Motive (SM) (see Table 3), and the inflated prediction of PPTM on General Self-Efficacy (GSE) when the reflective–reflective framework is used for modelling the PPTM (Finn & Wang, 2014; Lee & Cadogan, 2013; Mikulić, 2022). Incorrect modelling of PPTM can result in deflated or inflated relationships, which may lead to misinformed decisions and misallocation of resources in the tourism sector.
As this research used purposive sampling (N=319) in a single context, so future work could test the reflective–formative model with larger, more diverse and cross-cultural samples to assess generalisability. Nevertheless, the model should also be validated using estimation techniques beyond PLS-SEM (Dash & Paul, 2021; Hair et al., 2011, 2022). The study considered GSE, SA, and SM as outcome variables to validate the RFM-PPTM. Additionally, the current study employed the PLS-SEM approach for model estimation, which does not provide model fit indices (Hair et al., 2021). Therefore, estimating the model using CB-SEM would serve as an effective revalidation of the proposed reflective–formative structure of the PPTM model. Further, enhance the generalizability of the model, future research should incorporate a broader set of variables, including those theoretically related and unrelated to tourist motivation. Researchers should apply the reflective–formative framework to other contexts and outcomes, refine motivational scales with formative indicators, and use robust sampling to validate the generality of our findings. Researchers might integrate additional motivational or contextual factors (such as mooring or risk factors) into a hierarchical push–pull framework, testing how the reflective–formative approach holds for expanded models. Fourth, longitudinal or experimental designs could explore how push–pull motivations evolve and whether formative indicators remain stable over time. Similarly, as we focused on social motives and self-actualization, other outcome variables (e.g. satisfaction, loyalty, revisit intention) could be examined under the correct model to see if similar gains in predictive validity emerge.
Compared to a traditional reflective-only specification, the new model fits the data better and predicts key motivational outcomes (e.g. social motives, self-actualization) much more accurately, while avoiding the spurious effects seen under the mis specified model. The results imply that destination managers should acknowledge tourists’ internal desires and external attractions as distinct, composite drivers of behavior. In practice, this means segmenting and targeting visitors based on their core motivational profiles (push motives) and highlighting destination attributes (pull factors) accordingly. By aligning measurement with classic push–pull theory, our approach closes a theory-to-method gap and yields clearer, more actionable insights for destination marketing.
Author Contributions
Both authors contributed equally to the research.
Funding
This research received no external funding.
Institutional Review Board Statement
In India, non-interventional studies such as surveys, questionnaires, and social media research typically do not require ethical approval or institutional review. This study being followed a voluntary survey methodology without any intervention doesn’t requires institutional review approval.
Informed Consent Statement
Informed consent was obtained from all subjects involved in the study.
Data Availability Statement
The original contributions presented in this study are included in the article. Further inquiries can be directed to the corresponding author.
Conflicts of Interest
The authors declare no conflicts of interest.
Abbreviations
The following abbreviations are used in this manuscript:
| TM | Tourist Motive |
| PPTM | Push Pull Tourist Motivation |
| PPTMM | Push Pull Tourist Motivation Model |
| RFM | Reflective Formative Model |
| RRM | Reflective Reflective Model |
| RFM-PPTM | Reflective Formative Model of Push Pull Tourist Motivation |
| RRM-PPTM | Reflective Reflective Model of Push Pull Tourist Motivation |
| SM | Social Motivation |
| SA | Self Actualisation |
| GSE | General Self Efficiency |
| HTMT | Heterotrait–monotrait |
| TMN | Tourist Motive Novelty |
| TMF | Tourist Motive Facilities |
| TMK | Tourist Motive Knowledge |
| AVE | Average Variance Extracted |
| UL | Upper Limit |
| LL | Lower Limit |
| CI | Confidence Interwall |
| SEM | Structural Equation Modelling |
| PLS-SEM | Partial Least Squares Structural Equation Modelling |
| SE | Standard Error |
| rhoC | Composite Reliability |
References
- Andruliene, R., Macerinskiene, A., & Urbonavicius, S. (2018). Relations of tourist push and pull motivations with their activities: The case of Lithuania. International Journal of Sustainable Development and Planning, 13(6). [CrossRef]
- Baloglu, S., & Uysal, M. (1996). Market segments of push and pull motivations: A canonical correlation approach. International Journal of Contemporary Hospitality Management, 8(3). [CrossRef]
- Battour, M., Ismail, M. N., Battor, M., & Awais, M. (2017). Islamic tourism: an empirical examination of travel motivation and satisfaction in Malaysia. Current Issues in Tourism, 20(1). [CrossRef]
- Bayih, B. E., & Singh, A. (2020). Modeling domestic tourism: motivations, satisfaction and tourist behavioral intentions. Heliyon, 6(9). [CrossRef]
- Becker, J. M., Klein, K., & Wetzels, M. (2012). Hierarchical Latent Variable Models in PLS-SEM: Guidelines for Using Reflective-Formative Type Models. Long Range Planning, 45(5–6), 359–394. [CrossRef]
- Bikse, J., & Gavinolla, M. R. (2021). Water springs as a resource for nature tourism in Latvia: A tourist perspective. Vide. Tehnologija. Resursi - Environment, Technology, Resources, 1. [CrossRef]
- Bollen, K. A., & Diamantopoulos, A. (2017). Notes on measurement theory for causal-formative indicators: A reply to Hardin. In Psychological Methods (Vol. 22, Issue 3). [CrossRef]
- Bollen, K., & Lennox, R. (1991). Conventional wisdom on measurement: A structural equation perspective. Psychological Bulletin, 110(2). [CrossRef]
- Borsboom, D., Mellenbergh, G. J., & Van Heerden, J. (2003). The Theoretical Status of Latent Variables. In Psychological Review (Vol. 110, Issue 2). [CrossRef]
- Coltman, T., Devinney, T. M., Midgley, D. F., & Venaik, S. (2008). Formative versus reflective measurement models: Two applications of formative measurement. Journal of Business Research, 61(12). [CrossRef]
- Cong, L. C. (2016). A formative model of the relationship between destination quality, tourist satisfaction and intentional loyalty: An empirical test in Vietnam. Journal of Hospitality and Tourism Management, 26. [CrossRef]
- Correia, A., Kozak, M., & Ferradeira, J. (2013). From tourist motivations to tourist satisfaction. International Journal of Culture, Tourism, and Hospitality Research, 7(4). [CrossRef]
- Correia, A., Oom do Valle, P., & Moço, C. (2007). Why people travel to exotic places. International Journal of Culture, Tourism and Hospitality Research, 1(1). [CrossRef]
- Crompton, J. L. (1979). An Assessment of the Image of Mexico as a Vacation Destination and the Influence of Geographical Location Upon That Image. Journal of Travel Research, 17(4). [CrossRef]
- Dann, G. M. S. (1977). Anomie, ego-enhancement and tourism. Annals of Tourism Research, 4(4). [CrossRef]
- Dann, G. M. S. (1981). Tourist motivation an appraisal. Annals of Tourism Research, 8(2). [CrossRef]
- Dash, G., & Paul, J. (2021). CB-SEM vs PLS-SEM methods for research in social sciences and technology forecasting. Technological Forecasting and Social Change, 173. [CrossRef]
- Dean, D., & Suhartanto, D. (2019). The formation of visitor behavioral intention to creative tourism: the role of push–Pull motivation. Asia Pacific Journal of Tourism Research. [CrossRef]
- DeVellis, R. F. (2016). Scale Development Theory and Applications (Fourth Edition). SAGE Publication, 4.
- Devesa, M., Laguna, M., & Palacios, A. (2010). The role of motivation in visitor satisfaction: Empirical evidence in rural tourism. Tourism Management, 31(4). [CrossRef]
- Diamantopoulos, A., & Siguaw, J. A. (2006). Formative versus reflective indicators in organizational measure development: A comparison and empirical illustration. British Journal of Management, 17(4), 263–282. [CrossRef]
- Diamantopoulos, A., & Winklhofer, H. M. (2001). Index construction with formative indicators: An alternative to scale development. Journal of Marketing Research, 38(2), 269–277. [CrossRef]
- Doran, R., Larsen, S., & Wolff, K. (2015). Different but Similar: Social Comparison of Travel Motives Among Tourists. International Journal of Tourism Research, 17(6). [CrossRef]
- Dunn Ross, E. L., & Iso-Ahola, S. E. (1991). Sightseeing tourists’ motivation and satisfaction. Annals of Tourism Research, 18(2), 226–237. [CrossRef]
- Edwards, J. R. (2011). The fallacy of formative measurement. Organizational Research Methods, 14(2). [CrossRef]
- Finn, A., & Wang, L. (2014). Formative vs. reflective measures: Facets of variation. Journal of Business Research, 67(1). [CrossRef]
- Fodness, D. (1994). Measuring tourist motivation. Annals of Tourism Research, 21(3), 555–581. [CrossRef]
- Goossens, C. (2000). Tourism information and pleasure motivation. Annals of Tourism Research, 27(2). [CrossRef]
- Guyon, H. (2018). The fallacy of the theoretical meaning of formative constructs. In Frontiers in Psychology (Vol. 9, Issue FEB). [CrossRef]
- Hamdy, A., Zhang, J., & Eid, R. (2023). Pull-Extrinsic and Push-Intrinsic Motivations Effect on Destination Image Formation: The Moderate Effect of Tourists’ Experiences. Frontiers in Artificial Intelligence and Applications, 367, 250–257. [CrossRef]
- Hair, J. F., Hult, G. T. M., Ringle, C. M., Sarstedt, M., Danks, N. P., & Ray, S. (2021). Partial Least Squares Structural Equation Modeling (PLS-SEM) Using R. In Practical Assessment, Research and Evaluation (Vol. 21, Issue 1).
- Hair, J. F., Ringle, C. M., & Sarstedt, M. (2011). PLS-SEM: Indeed a silver bullet. Journal of Marketing Theory and Practice, 19(2). [CrossRef]
- Hair, J. F., Ringle, C. M., Hult, G. T. M., & Sarstedt, M. (2022). Specifying The Path Model And Examining Data. In A Primer on Partial Least Squares Structural Equation Modeling (PLS-SEM).
- Hair, J. F., Risher, J. J., Sarstedt, M., & Ringle, C. M. (2019). When to use and how to report the results of PLS-SEM. In European Business Review (Vol. 31, Issue 1). [CrossRef]
- Hanafiah, M. H. (2020). FORMATIVE VS. REFLECTIVE MEASUREMENT MODEL: GUIDELINES FOR STRUCTURAL EQUATION MODELING RESEARCH. International Journal of Analysis and Applications, 18(5). [CrossRef]
- Hanqin, Z. Q., & Lam, T. (1999). An analysis of Mainland Chinese visitors’ motivations to visit Hong Kong. Tourism Management, 20(5). [CrossRef]
- Henseler, J., Ringle, C. M., & Sarstedt, M. (2015). A new criterion for assessing discriminant validity in variance-based structural equation modeling. Journal of the Academy of Marketing Science, 43(1). [CrossRef]
- Hsu, C. H. C., & Huang, S. (2007). Travel motivation: A critical review of the concept’s development. In Tourism Management: Analysis, Behaviour and Strategy. [CrossRef]
- Huang, S. S. (2010). Measuring tourist motivation: Do scales matter? Tourismos, 5(1).
- Huang, S. S. (2021). Tourist motivation: A critical overview. In Routledge Handbook of the Tourist Experience. [CrossRef]
- Hulland, J. (1999). Use of partial least squares (PLS) in strategic management research: A review of four recent studies. Strategic Management Journal, 20(2). [CrossRef]
- Islam, Z. ul, Khan, M. A., Farooq, A., & Aslam, S. (2021). Impact of Gratitude on Mental Health of Adults: Mediating Role of Prosocial Behavior Authors. Pakistan Journal of Applied Psychology, 1(1). [CrossRef]
- Jang, S. C., & Wu, C. M. E. (2006). Seniors’ travel motivation and the influential factors: An examination of Taiwanese seniors. Tourism Management, 27(2). [CrossRef]
- Jarvis, C. B., Mackenzie, S. B., Podsakoff, P. M., Giliatt, N., & Mee, J. F. (2003). A Critical Review of Construct Indicators and Measurement Model Misspecification in Marketing and Consumer Research. In Journal of Consumer Research (Vol. 30, Issue 2). [CrossRef]
- Jewell, B., & Crotts, J. C. (2002). Adding psychological value to heritage tourism experiences. Journal of Travel and Tourism Marketing, 11(4). [CrossRef]
- Kanwal, F., Iqbal, S., & Javed, A. (2023). Stalking and Relationship Satisfaction among Partners. Qlantic Journal of Social Sciences and Humanities, 4(3). [CrossRef]
- Katsikari, C., Hatzithomas, L., Fotiadis, T., & Folinas, D. (2020). Push and pull travel motivation: Segmentation of the greek market for social media marketing in tourism. Sustainability (Switzerland), 12(11). [CrossRef]
- Kessler, D., Lee, J. H., & Whittingham, N. (2020). The wellness tourist motivation scale: a new statistical tool for measuring wellness tourist motivation. International Journal of Spa and Wellness, 3(1). [CrossRef]
- Kim, E. J., Kim, Y., Jang, S., & Kim, D. K. (2021). Tourists’ preference on the combination of travel modes under Mobility-as-a-Service environment. Transportation Research Part A: Policy and Practice, 150. [CrossRef]
- Kim, S. (2011). Testing a revised measure of public service motivation: Reflective versus formative specification. Journal of Public Administration Research and Theory, 21(3). [CrossRef]
- Kim, Y. H., Goh, B. K., & Yuan, J. J. (2010). Development of a multi-dimensional scale for measuring food tourist motivations. Journal of Quality Assurance in Hospitality and Tourism, 11(1). [CrossRef]
- Klenosky, D. B. (2002). The “Pull” of Tourism Destinations: A Means-End Investigation. Journal of Travel Research, 40(4). [CrossRef]
- Kozak, M. (2002). Comparative analysis of tourist motivations by nationality and destinations. Tourism Management, 23(3). [CrossRef]
- Kuvaas, B., Buch, R., & Dysvik, A. (2020). Individual variable pay for performance, controlling effects, and intrinsic motivation. Motivation and Emotion, 44(4). [CrossRef]
- Lee, N., & Cadogan, J. W. (2013). Problems with formative and higher-order reflective variables. Journal of Business Research, 66(2). [CrossRef]
- MacKenzie, S. B., Podsakoff, P. M., & Jarvis, C. B. (2005). The problem of measurement model misspecification in behavioral and organizational research and some recommended solutions. In Journal of Applied Psychology (Vol. 90, Issue 4). [CrossRef]
- Martaleni, M., Hadiyati, E., Pertiwi, Y. I., & Kerti Yasa, N. N. (2021). Role of tourist motivation as mediating variable on visitor decisions at Indonesian tourism village. Innovative Marketing, 17(3). [CrossRef]
- Meng, F., Tepanon, Y., & Uysal, M. (2008). Measuring tourist satisfaction by attribute and motivation: The case of a nature-based resort. Journal of Vacation Marketing, 14(1). [CrossRef]
- Mikulić, J. (2022). Fallacy of higher-order reflective constructs. Tourism Management, 89. [CrossRef]
- Mimi, L., Tong, W., & Ariel, L. (2011). An Exploratory Study of the Travel Motivation of Chinese Female Outbound Tourists. Journal of China Tourism Research, 7(4). [CrossRef]
- Morales-García, W. C., Huancahuire-Vega, S., Saintila, J., Morales-García, M., Fernández-Molocho, L., & Ruiz Mamani, P. G. (2022). Predictors of Intention to Vaccinate Against COVID-19 in a Peruvian Sample. Journal of Primary Care and Community Health, 13. [CrossRef]
- Murphy, J., & Hofacker, C. F. (2009). RIGOR IN TOURISM RESEARCH. Formative and Reflective Constructs. Annals of Tourism Research, 36(4). [CrossRef]
- Nguyen, T. H. H. (2020). A Reflective–Formative Hierarchical Component Model of Perceived Authenticity. Journal of Hospitality and Tourism Research, 44(8). [CrossRef]
- Nieves-Pavón, S., López-Mosquera, N., & Sánchez González, M. J. (2025). Unlocking Tourist Motivations in a Smart Tourism Destination: An Application of the Push–Pull Theory. Societies, 15(4). [CrossRef]
- Pawaskar, P., Mekoth, N., & Thomson, A. R. (2020). Travel motivation and choice of destination attributes: Empirical evidences based on tourist perceptions. International Journal of Advanced Science and Technology, 29(8 Special Issue).
- Pestana, M. H., Parreira, A., & Moutinho, L. (2020). Motivations, emotions and satisfaction: The keys to a tourism destination choice. Journal of Destination Marketing and Management, 16. [CrossRef]
- Prebensen, N. K., Woo, E., & Uysal, M. S. (2014). Experience value: antecedents and consequences. Current Issues in Tourism, 17(10). [CrossRef]
- Qiao, G., Huang, S., & Vorobjovas-Pinta, O. (2024). Seeking tourism in a social context: an examination of Chinese rural migrant workers’ travel motivations and constraints. Leisure Studies, 43(4). [CrossRef]
- Roy, S., Tarafdar, M., Ragu-Nathan, T. S., & Marsillac, E. (2012). The effect of misspecification of reflective and formative constructs in operations and manufacturing management research. Electronic Journal of Business Research Methods, 10(1).
- Santoso, S. (2019). Examining Relationships between Destination Image, Tourist Motivation, Satisfaction, and Visit Intention in Yogyakarta. Expert Journal of Business and Management, 7(1).
- Scott, D., & Gössling, S. (2022). A review of research into tourism and climate change - Launching the annals of tourism research curated collection on tourism and climate change. Annals of Tourism Research, 95. [CrossRef]
- Seabra, C., Silva, C., Luís Abrantes, J., Vicente, M., & Herstein, R. (2016). The influence of motivations in tourists’ involvement. Anatolia, 27(1). [CrossRef]
- Seočanac, M. (2024). PLS-SEM: A hidden gem in tourism research methodology. Menadzment u Hotelijerstvu i Turizmu, 12(1), 115–131. [CrossRef]
- Soper, D. (2022). A-Priori Sample Size for Structural Equation Models (Software). Free Statistics Calculators.
- Streimikiene, D., Svagzdiene, B., Jasinskas, E., & Simanavicius, A. (2021). Sustainable tourism development and competitiveness: The systematic literature review. In Sustainable Development (Vol. 29, Issue 1). [CrossRef]
- Su, D. N., Johnson, L. W., & O’Mahony, B. (2020). Analysis of push and pull factors in food travel motivation. Current Issues in Tourism, 23(5). [CrossRef]
- Taheri, B., Jafari, A., & O’Gorman, K. (2014). Keeping your audience: Presenting a visitor engagement scale. Tourism Management, 42. [CrossRef]
- Trizano-Hermosilla, I., & Alvarado, J. M. (2016). Best alternatives to Cronbach’s alpha reliability in realistic conditions: Congeneric and asymmetrical measurements. Frontiers in Psychology, 7(MAY). [CrossRef]
- Wilcox, J. B., Howell, R. D., & Breivik, E. (2008). Questions about formative measurement. Journal of Business Research, 61(12). [CrossRef]
- Wiradnyana, I. G. N. P., Suthanaya, P. A., Wedagama, D. M. P., Yana, A. A. G. A., & Dissanayake, D. (2021). Analysing the choice and pattern of needs of transportation mode for domestic tourists in Bali. IOP Conference Series: Earth and Environmental Science, 673(1). [CrossRef]
- Yang, F., Ayavoo, R., & Ab Aziz, N. (2023). Exploring Students’ Push and Pull Motivations to Visit Rural Educational Tourism Sites in China. Sustainability (Switzerland), 15(20). [CrossRef]
- Yousaf, A., Amin, I., & Jose Antonio, C. (2018). Tourists’ motivations to travel: A theoretical perspective on the existing literature. In Tourism and Hospitality Management (Vol. 24, Issue 1). [CrossRef]
- Ying, T., & Wen, J. (2019). Exploring the male Chinese tourists’ motivation for commercial sex when travelling overseas: Scale construction and validation. Tourism Management, 70. [CrossRef]
Figure 1.
Proposed Theoretical Framework of the Study.
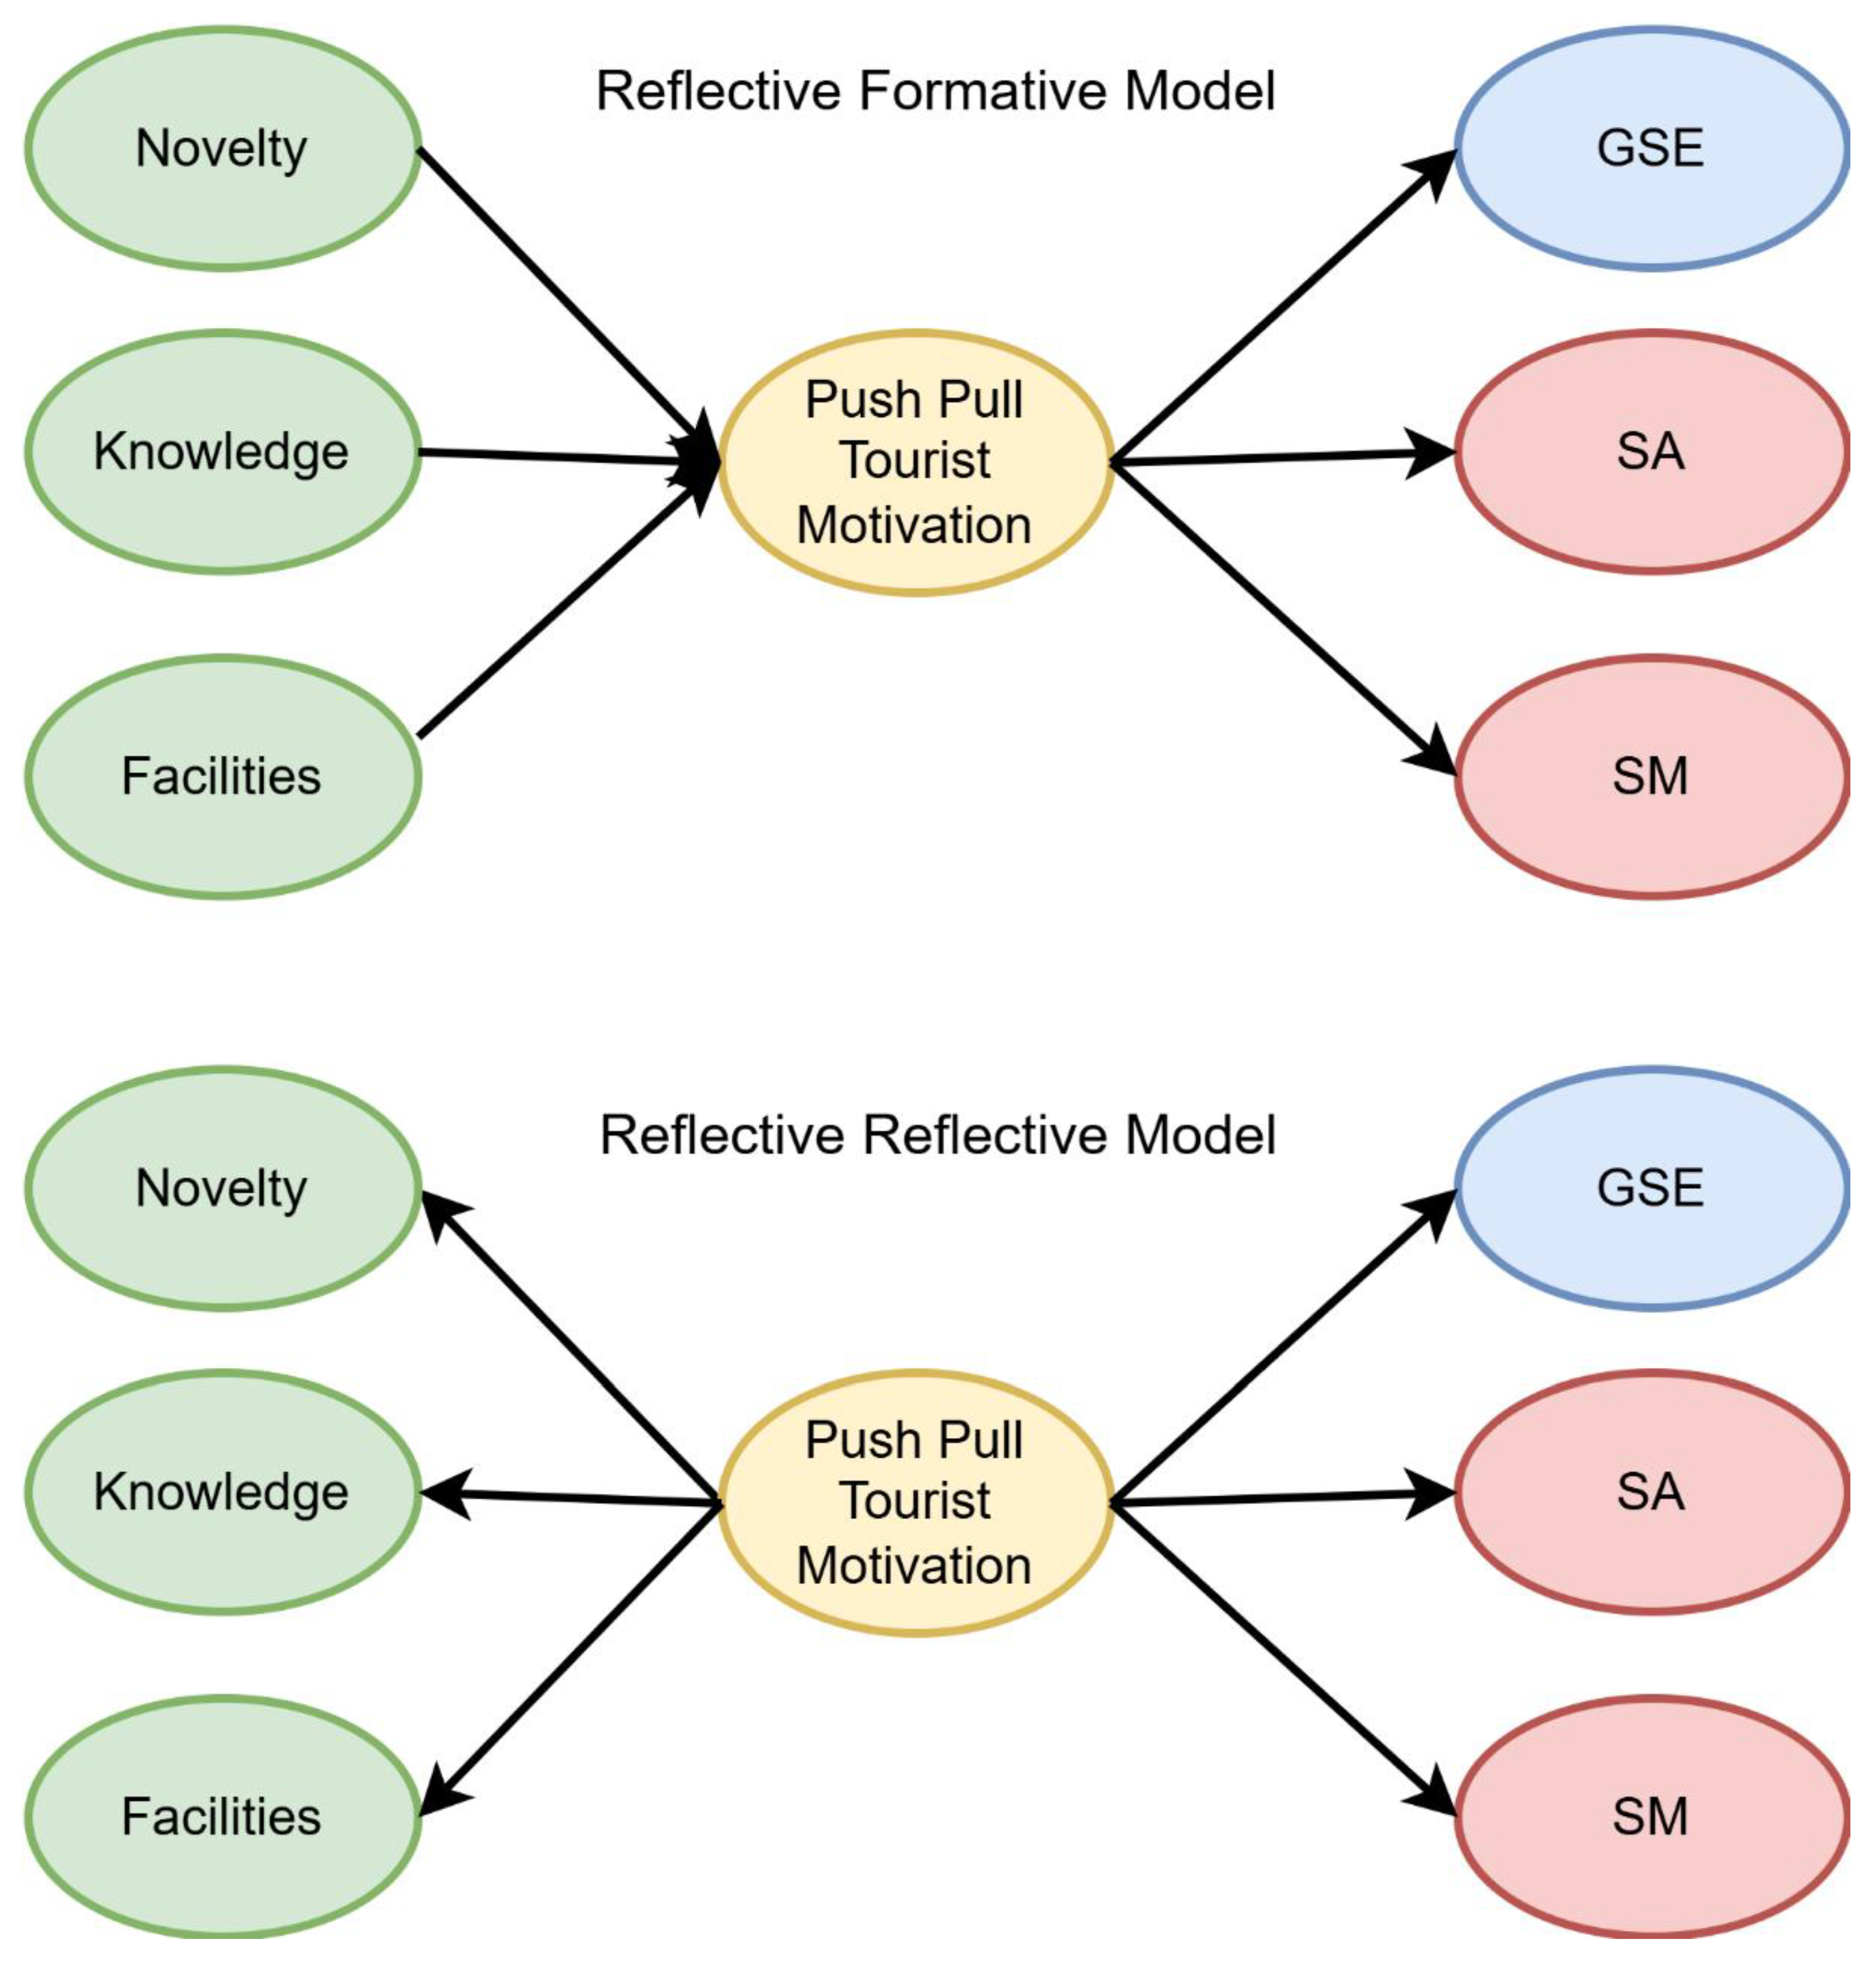
Figure 2.
eflective-Reflective Model of PPTM predicting GSE, SA and SM.
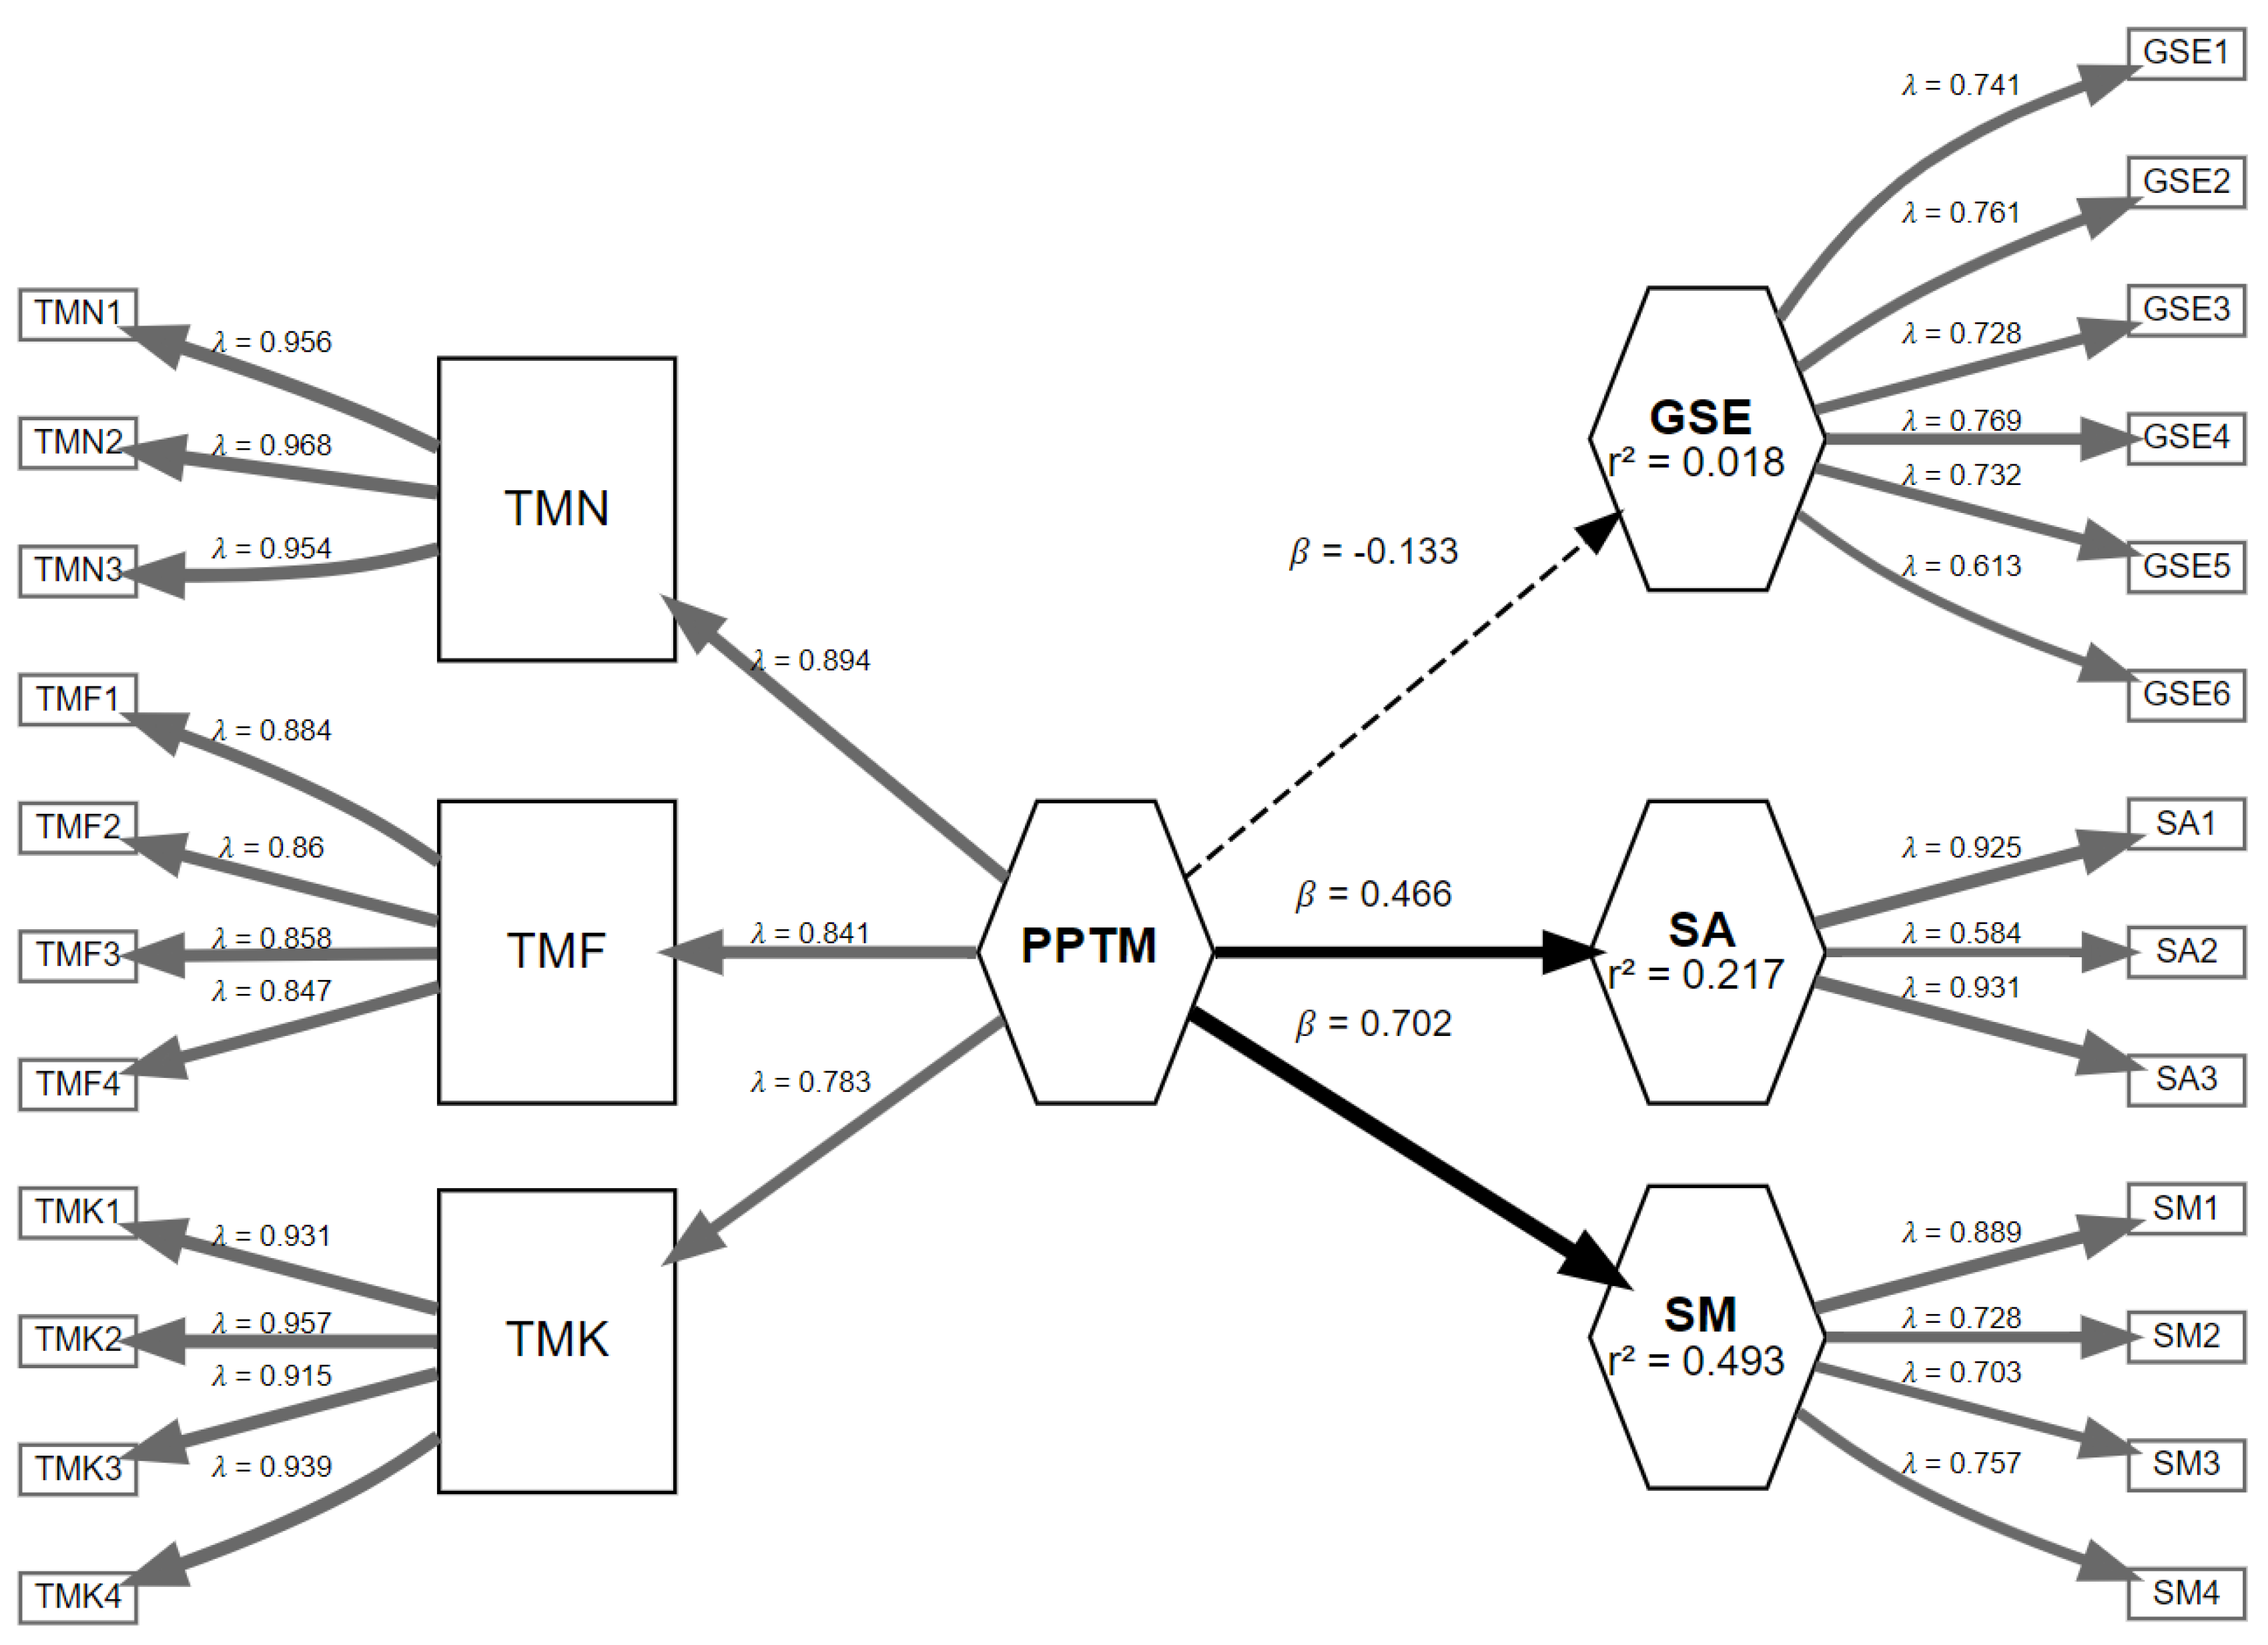

Table 1.
Sample Characteristics of Study.
| (N = 319) | |||
| N | Percentage % | ||
| Age Group | Below 35 | 145 | 45.5% |
| 35-54 | 142 | 44.5% | |
| 55 and above | 32 | 10.0% | |
| Total | 319 | 100.0% | |
| Gender | Male | 153 | 47.96% |
| Female | 153 | 47.96% | |
| Transgender | 0 | 0.00% | |
| Not willing to disclose | 13 | 4.08% | |
| Total | 319 | 100.00% | |
| Marital Status | Single | 26 | 8.15% |
| In-relationship | 80 | 25.08% | |
| Married | 183 | 57.37% | |
| Divorcee | 30 | 9.40% | |
| Total | 319 | 100.00% | |
| Education | No college degree | 69 | 21.63% |
| Undergraduate degree | 123 | 38.56% | |
| Graduate degree or higher | 127 | 39.81% | |
| Total | 319 | 100.00% | |
| Household income (annual) | <$1000 | 85 | 26.65% |
| $1000 - $3000 | 69 | 21.63% | |
| $3000 - $6000 | 100 | 31.35% | |
| $6000 - $9000 | 57 | 17.87% | |
| >$9000 | 8 | 2.51% | |
| Total | 319 | 100.00% | |
| Main mode of Transportation at Tourist Destination | Rental | 83 | 26.02% |
| Private | 98 | 30.72% | |
| Public | 100 | 31.35% | |
| Other Modes | 38 | 11.91% | |
| Total | 319 | 100.00% | |
| Occupation | Unemployed | 56 | 17.55% |
| Retired | 58 | 18.18% | |
| Employed Part-time | 72 | 22.57% | |
| Employed Full-time | 133 | 41.69% | |
| Total | 319 | 100.00% | |
| Race | White/Caucasian | 96 | 30.09% |
| Black/African | 65 | 20.38% | |
| Asian/Pacific islander | 89 | 27.90% | |
| Other Race | 69 | 21.63% | |
| Total | 319 | 100.00% | |
| Religion | Atheist | 23 | 7.21% |
| Buddhism | 32 | 10.03% | |
| Christian | 108 | 33.86% | |
| Hindu | 34 | 10.66% | |
| Muslim | 79 | 24.76% | |
| Other Religion | 43 | 13.48% | |
| Total | 319 | 100.00% | |
Table 2.
Measurement Model Statistics.
|
|
GSE |
SM |
SA |
TMN |
TMF |
TMK |
PPTM |
α |
rhoC |
AVE |
HTMT | |||||
| GSE | SM | SA | TMN | TMF | TMK | |||||||||||
| GSE1 | 0.741 | 0.821 | 0.869 | 0.527 | ||||||||||||
| GSE2 | 0.761 | |||||||||||||||
| GSE3 | 0.728 | |||||||||||||||
| GSE4 | 0.769 | |||||||||||||||
| GSE5 | 0.732 | |||||||||||||||
| GSE6 | 0.613 | |||||||||||||||
| SM1 | 0.889 | 0.772 | 0.854 | 0.597 | 0.169 | |||||||||||
| SM2 | 0.728 | |||||||||||||||
| SM3 | 0.703 | |||||||||||||||
| SM4 | 0.757 | |||||||||||||||
| SA1 | 0.925 | 0.756 | 0.864 | 0.688 | 0.166 | 0.840 | ||||||||||
| SA2 | 0.584 | |||||||||||||||
| SA3 | 0.931 | |||||||||||||||
| TMN1 | 0.956 | 0.957 | 0.972 | 0.921 | 0.101 | 0.810 | 0.494 | |||||||||
| TMN2 | 0.968 | |||||||||||||||
| TMN3 | 0.954 | |||||||||||||||
| TMF1 | 0.884 | 0.886 | 0.921 | 0.744 | 0.144 | 0.672 | 0.504 | 0.653 | ||||||||
| TMF2 | 0.860 | |||||||||||||||
| TMF3 | 0.858 | |||||||||||||||
| TMF4 | 0.847 | |||||||||||||||
| TMK1 | 0.931 | 0.953 | 0.966 | 0.875 | 0.137 | 0.529 | 0.366 | 0.596 | 0.534 | |||||||
| TMK2 | 0.957 | |||||||||||||||
| TMK3 | 0.915 | |||||||||||||||
| TMK4 | 0.939 | |||||||||||||||
| TMN | 0.894 | 0.794 | 0.878 | 0.707 | 0.159 | 0.689 | 0.585 | 0.992 | 0.988 | 0.943 | ||||||
| TMF | 0.841 | |||||||||||||||
| TMK | 0.783 | |||||||||||||||
Table 3.
Predictive Performance RFM-PPTM and RRM-PPTM for SA and SM.
| Model | Path | β | Bootstrap β | SE | 95% CI (LL) | 95% CI (UL) | AIC | BIC | R2 |
| RFM | PPTM→SA | 0.481 | 0.488 | 0.050 | 0.388 | 0.582 | -80.850 | -73.319 | 0.231 |
| RRM | PPTM→SA | 0.466 | 0.470 | 0.049 | 0.375 | 0.559 | -74.964 | -67.433 | 0.217 |
| RFM | PPTM→SM | 0.732 | 0.734 | 0.036 | 0.660 | 0.798 | -241.971 | -234.440 | 0.536 |
| RRM | PPTM→SM | 0.702 | 0.705 | 0.036 | 0.624 | 0.770 | -213.446 | -205.916 | 0.493 |
Table 4.
Predictive Performance of RFM-PPTM and RRM-PPTM for GSE.
| Model | Path | β | Bootstrap β | SE | 95% CI (LL) | 95% CI (UL) | AIC | BIC | R2 |
| RFM | PPTM→GSE | -0.120 | -0.143 | 0.042 | -0.223 | -0.072 | -1.630 | 5.901 | 0.014 |
| RRM | PPTM→GSE | -0.133 | -0.152 | 0.041 | -3.279 | -0.080 | -2.728 | 4.803 | 0.018 |
Disclaimer/Publisher’s Note: The statements, opinions and data contained in all publications are solely those of the individual author(s) and contributor(s) and not of MDPI and/or the editor(s). MDPI and/or the editor(s) disclaim responsibility for any injury to people or property resulting from any ideas, methods, instructions or products referred to in the content. |
© 2025 by the authors. Licensee MDPI, Basel, Switzerland. This article is an open access article distributed under the terms and conditions of the Creative Commons Attribution (CC BY) license (http://creativecommons.org/licenses/by/4.0/).
Copyright: This open access article is published under a Creative Commons CC BY 4.0 license, which permit the free download, distribution, and reuse, provided that the author and preprint are cited in any reuse.


