
Submitted:
27 June 2025
Posted:
30 June 2025
You are already at the latest version
Abstract
Objectives: Torus mandibularis (TM) is a benign bony exostosis on the lingual surface of the mandible, typically developing from the third decade of life with slow progression. Its etiology remains unclear. As TM excision causes no functional or aesthetic deficits, its use as autologous bone graft material (e.g., for pre-implant or sinus lift augmentation) has been suggested. This study investigates the prevalence and expression of TM in a southern German population with regard to age and gender. Additionally, it examines whether TM undergoes dynamic changes over time. The hypothesis is that TM may show temporal growth. Material and Methods: A retrospective analysis of CBCT scans from 210 randomly selected patients (105 males, 105 females) was performed. Patients were divided into three age groups (≤40, 41–60, ≥61 years; 70 per group). TM was measured using OsiriX MD. For the longitudinal study, 146 CBCTs from 73 patients were compared over intervals of 2–9 years. Surface changes were assessed via 3D overlay using GOM Inspect. Results: TM was found in 30.5% of patients. Prevalence was significantly higher in males (38%) than females (23%). No age-related differences were identified. Most TMs measured <2 mm (n=51); only five exceeded this size. No dynamic growth was observed over time. Conclusion and Clinical Implications: TM is a common anatomical variant, more frequently detected by 3D imaging than clinical examination. In most cases, size remains minimal (<2 mm), limiting its clinical use as augmentation material to rare individual cases.
Keywords:
oral torus
; torus mandibular
; oral exostoses
; computed tomography
; morphological analysis
1. Introduction
The torus mandibularis (TM) is a frequently occurring, benign bone bulge (exostosis) on the lingual surface of the mandible [1]. The torus mandibularis is usually located bilaterally, between the canines and molars and superior to the mylohyoid line (Figure 1) [2].
The mandibular tori usually consist of a very dense cortical bone, small amounts of cancellous bone and fatty pulp and are covered by normal but thin oral mucosa with underlying periosteum [3]. According to Dou et al. mesenchymal stem cells of the TM have a higher osteogenic activity in vitro than stem cells from normal jawbone and are therefore rich in osteoblasts [4].
The development of a torus mandibularis usually begins in the 3rd decade of life, tends to grow slowly and is most frequently observed in middle-aged people [5]. Mandibular torus thickness showed a clear age-related increase, with the strongest effects observed in males with maintained occlusal contact. Multivariable regression analysis confirmed a significant association between age and torus thickness, which was further influenced by occlusal status and sex.[6]
The etiology and pathogenesis of TM is still unclear. A genetic predisposition and a multifactorial threshold effect are being discussed [7]. Connections with dysfunctions, genetic causes and environmental factors are discussed [7,8,9,10,11,12]. Mandibular torus may have a multifactorial etiology, with evidence suggesting that severe tooth wear and loss contribute through increased masticatory stress. Its higher prevalence in males across populations indicates a potential role of functional and biomechanical factors rather than solely genetic or demographic influences [13]. Additional research indicates a positive correlation between mandibular torus size and bite force, supporting the theory of functional adaptation [11,14,15,16]. The prevalence is around 12-29%, slightly higher in men than in women [17].
Ethnic frequencies can be observed. For example, inhabitants of the northern hemisphere, e.g., Scandinavians and Eskimos, are more likely to have TM. Southeast Asia and Japan also show an increased prevalence [3].
TM are usually asymptomatic, but with increasing growth can lead to articulation difficulties, foreign body sensation, obstructive sleep apnea or psychological problems such as carcinophobia, among others [18,19]. Based on two case reports, it is proposed that the presence of mandibular tori may alter salivary flow dynamics and thereby increase the risk of sialolithiasis [20]. They can also negatively affect the fit of a prosthetic denture. In these cases, removal of the bone structure would be indicated. Excision of the torus mandibularis does not lead to functional, esthetic or structural losses for the patient [21].
A practical application could be the use of the mandibular torus as autologous bone graft material for augmentation procedures, e.g., prior to implantation, in periodontal bone lesions or for sinus lifting [21,22,23,24].
Previous studies have mainly investigated the etiology and size of TM. Haugen [25] and Eggen et al. [26,27] classified the TM into smaller than 2 mm, medium size of 2-4 mm and large with more than 4 mm. Reichert et al. [28] divided the size of the TM into grades 1-3. Grade 1 corresponded to a TM of up to 3 mm, grade 2 to 3-6 mm and grade 3 to more than 6 mm.
Some studies have even shown increased bone density in patients with a torus mandibularis [1,17]. Many studies on the torus mandibularis have dealt with investigations into the etiology, prevalence or a snapshot of the bone structure, whereby the temporal development has so far remained unnoticed [3].
This study is the first to focus on the temporal development of a torus mandibularis.
With the help of software, cone beam computed tomography (CBCT) images taken at different points in time are converted into surfaces. These surfaces are superimposed and thus allow calculations of the temporal change in the dimension of the bone structure. In the first, descriptive part of this work, we use CBCT measurements to investigate the location, extent and prevalence of the torus mandibularis in a southern German population. In the second, explorative part of the investigations, we examine the development of the extent of the exostosis in a patient over a defined period of time and draw conclusions about the dynamics.
2. Material and Methods
The data was collected as part of a retrospective, randomized study. The CBCTs examined in this scientific study were taken at Zentrum für Zahnmedizin Dr. Schnutenhaus MVZ GmbH in Hilzingen, Germany, between December 21, 2001 and December 2019. The patients were not x-rayed for study purposes. The images were taken exclusively during the course of treatment and were examined retrospectively. The data was collected after a positive vote was granted by the Ethics Committee of the Baden-Württemberg Medical Association F-2020-024-z on March 6, 2020. In this study, a bone structure is measured. This requires suitable imaging for three-dimensional representation of the bone structure.
A cone bean computed tomography (CBCT) (Gendex CB500, Gendex Dental Systems, Des Plaines, USA) with a resolution of 0.2-0.4 voxels was used for the X-ray exposure. The maximum turnaround time was 23 seconds.
Study Design
This study was divided into two different evaluations,
In the first, descriptive round, CBCTs of 210 patients were measured and statistically analyzed. Three age groups were formed, each with 70 patients. Each group consisted of 35 male and 35 female participants. Group one included all patients younger than 41 years, group two patients between 41 and 60 years of age and group three all examined patients over 61 years of age.
In the second, exploratory part, two data sets from one patient were processed, superimposed, measured and statistically analyzed. A total of 146 CBCTs from 73 patients of different ages were compared with each other. Year groups were determined based on the interval between the first and second X-ray of a patient. The time interval between CBCTs was a minimum of two years and a maximum of nine years.
Patients in whom an exostosis was not clearly recognizable were documented, jointly assessed, discussed and evaluated by the team.
Files that could not be evaluated were excluded from the examination and replaced. The reasons for this were mostly excessive artifacts or an insufficiently depicted lower jaw.
The DICOM (Digital Imaging and Communications in Medicine) data sets were evaluated in anonymized form. The modiCAS/anonymizer software (modiCAS GmbH, Erlangen, Germany) was used to anonymize all patient data. The CBCTs were analyzed in the OsirixMD software (Pixmed SARL, Bernex, Switzerland). This software was also used to convert the CBCT data into stl (Surface Tesselation Language) surface data.
To find the maximum extension of the torus mandibularis, the lingual cortical bone was tracked under dynamic observation. The maximum extension was determined again in each plane.
The first step was to find the plane in which the structure to be examined has its maximum axial extension.
The maximum extension of the torus mandibularis in the sagittal direction is marked by drawing a tangent line A. Starting from this straight line, an orthogonal line B is drawn through the TM in its maximum transversal extension (Figure 2).
This straight line was extended to the vestibular cortex of the mandible and a straight line was inserted from there to the mental foramen. This gives the distance between the TM and the mental foramen (Figure 3) and thus a statement about the localization of the TM.
The maximum extension of the base in the vertical is determined in the frontal (coronal) view. By dynamically viewing the TM in the frontal view, the maximum extension is again found and a straight line is drawn through it (Figure 2 and Figure 3).
To evaluate the dynamics of the TM, the CBTC images were converted into surface data sets. The analysis was carried out using the GOM Inspect software (GOM GmbH, Braunschweig, Germany).
The surface data sets were prepared for subsequent overlay by removing artifacts, the spine, the teeth and, if necessary, the distal mandible from the jaw angle (Figure 4).
The two surface data were displayed superimposed using the best fit method calculated by the program. The overlay was checked and, if necessary, corrected using “3-point alignment”. If the overlays were still too imprecise, the data sets were eliminated from the analysis and evaluated as a complete dropout. Critical cases were discussed in the team and a decision was made as to whether the case should be eliminated.
If the surfaces overlapped sufficiently well, a surface comparison was carried out by the software in the area of the marked region of interest (ROI) (Figure 5). The region of interest (ROI) was limited to the region lingual to the canines and premolars and above the attachment of the mylohyoid muscle.
The data from both evaluations were collected in an Excel spreadsheet and analyzed in the statistical program SPSS Version 26 (IBM Corp. Released 2019. IBM SPSS Statistics for Windows, Version 26.0. Armonk, NY, USA). The mean value (MW), the maximum (Max) and minimum (Min), the standard deviation (SD) and the 95 % confidence interval (CI95 %) were determined as continuous variables. A test for normal distribution was performed. Accordingly, parametric and non-parametric tests were used. The T-test or Wilcoxon rank sum test was used to compare two dependent samples. To compare more than two independent samples, the Kruskal Wallis test was used.
The T-test was used to compare the mean value of two groups (gender), while ANOVA was used to compare the mean value of more than two groups (year groups).
The chi-square test was used to test the correlation between the variables in terms of stochastic independence and presented using cross-tabulations. The linear correlation between two variables was determined using the Pearson correlation.
The retrospective processing of the data means that all statistical results are interpreted as hypothesis-confirming and not generating. The significance level for all statistical tests was alpha = 0.05.
3. Results
3.1. Population
In the first, descriptive, part of this study, 210 patients were divided into three groups of 70 patients each on the basis of age.
The gender distribution was set at 50% in each group.
Group one comprises all patients under the age of 41. Group two comprised patients between 41 and 60 years of age and group three all patients over the age of 61 who were examined. The youngest patient examined in this study was 9 years old at the time of admission, while the oldest patient was 84 years old. The average age was 33 years in the first group, 50 years in the second group and 69 years in the third group.
In the second, exploratory, part of the study, two CBCT images were collected from each of a total of 73 patients.
After deducting the dropouts, the remaining 41 patients were also divided into three groups based on the interval between the first and second CBCT scans. Group one comprises all data sets in which the interval between the two CBCT scans was in the third and fourth year. In group two, the second CBCT was taken in the fifth or sixth year and in group three, the second CBCT was taken in the seventh to ninth year after the first CBCT was taken. The shortest interval between the scans was 2 years and the maximum interval was 9 years. On average, the interval between CBCT scans was 5 years.
The average age at the time of the first CBCT scan was 50 years.
The gender distribution (relation?) was twelve women (66.6 %) to six men (33.3 %) in group one, eight women (53.3 %) and seven men (46.6 %) in group two and seven women (87.5 %) and one man (12.5 %) in group three.
Overall, the gender distribution in the exploratory evaluation round was 65.9% (27) female and 34.1% (14) male patients.
3.2. Overlay Accuracy
The superimposition of the data sets in the second, explorative part was carried out using the reference point of the mental foramen or a multi-point assignment, e.g., using existing tooth structure.
This resulted in an average deviation of 0.27 mm.
3.3. Descriptive Part - Prevalence
In group one, 22 (31 %) of 70 patients had a torus mandibularis, in group two 23 (32 %) of 70 and in group three 19 (27 %) of 70 patients. Out of a total of 105 male patients, 40 (38 %) had a torus, compared to 24 (23 %) of 105 females. The overall prevalence is therefore 30.5 % regardless of gender (Abb. 2).
The sagittal base showed a mean value of 11.64 mm in the women and 11.98 mm in the men with a SD of 3.45 mm in the women and 4.84 mm in the men.
The vertical base was on average 8.38 mm for women and 9.53 mm for men, with an SD of 2.81 mm for women and 4.19 mm for men.
Maximum deviations showed a mean value of 1.16 mm for women and 1.39 mm for men, with an SD of 0.43 mm for women and 0.71 mm for men.
The T-test shows significance for the maximum deviation on the left in the gender distribution. Here the value is P = 0.05. Otherwise, the T-test did not show significance for any other parameters (years/groups).
There were no significant differences in the distribution of TM on the right and left between the age groups.
3.4. Exploratory Part - Dynamics
In the second part of the evaluation round, CBCTs from 41 subjects were superimposed. These overlays were measured for surface deviations in the area of the right and left torus mandibularis and thus the dynamics of the TM were examined.
The average deviation on the left was 0.03 mm for women (95 % confidence interval -0.05 - 0.11 mm, standard deviation (SD) of 0.04). The mean value for men was 0.07 mm (95 % confidence interval -0.28 - 0.14 mm, standard deviation (SD) of 0.10).
The mean value of the maximum transverse deviation for women was 2.85 mm (95 % confidence interval 1.77 - 3.93 mm, standard deviation (SD) of 0.53). The mean value for men was 2.80 mm (95 % confidence interval 1.85 - 3.74 mm, standard deviation (SD) of 0.44).
Individual, very high deviations suggest that these were artifacts.
In terms of the average deviation, there was no difference between the women’s overlay accuracy and the voxel inaccuracy. The average deviation is approximately the same as the evaluation accuracy, which on the one hand indicates accurate superimposition, but on the other hand also means that there was no significant increase in TM over time. Due to different slice thicknesses (200-400 µm) when recording the CBCTs, the data can only be superimposed with a maximum accuracy corresponding to the slice thickness.
A comparison of the year groups using ANOVA showed that the year groups had no significant influence. The value of the average deviation in relation to the years between the groups was 0.076 and is therefore higher than the significance value of p<0.05.
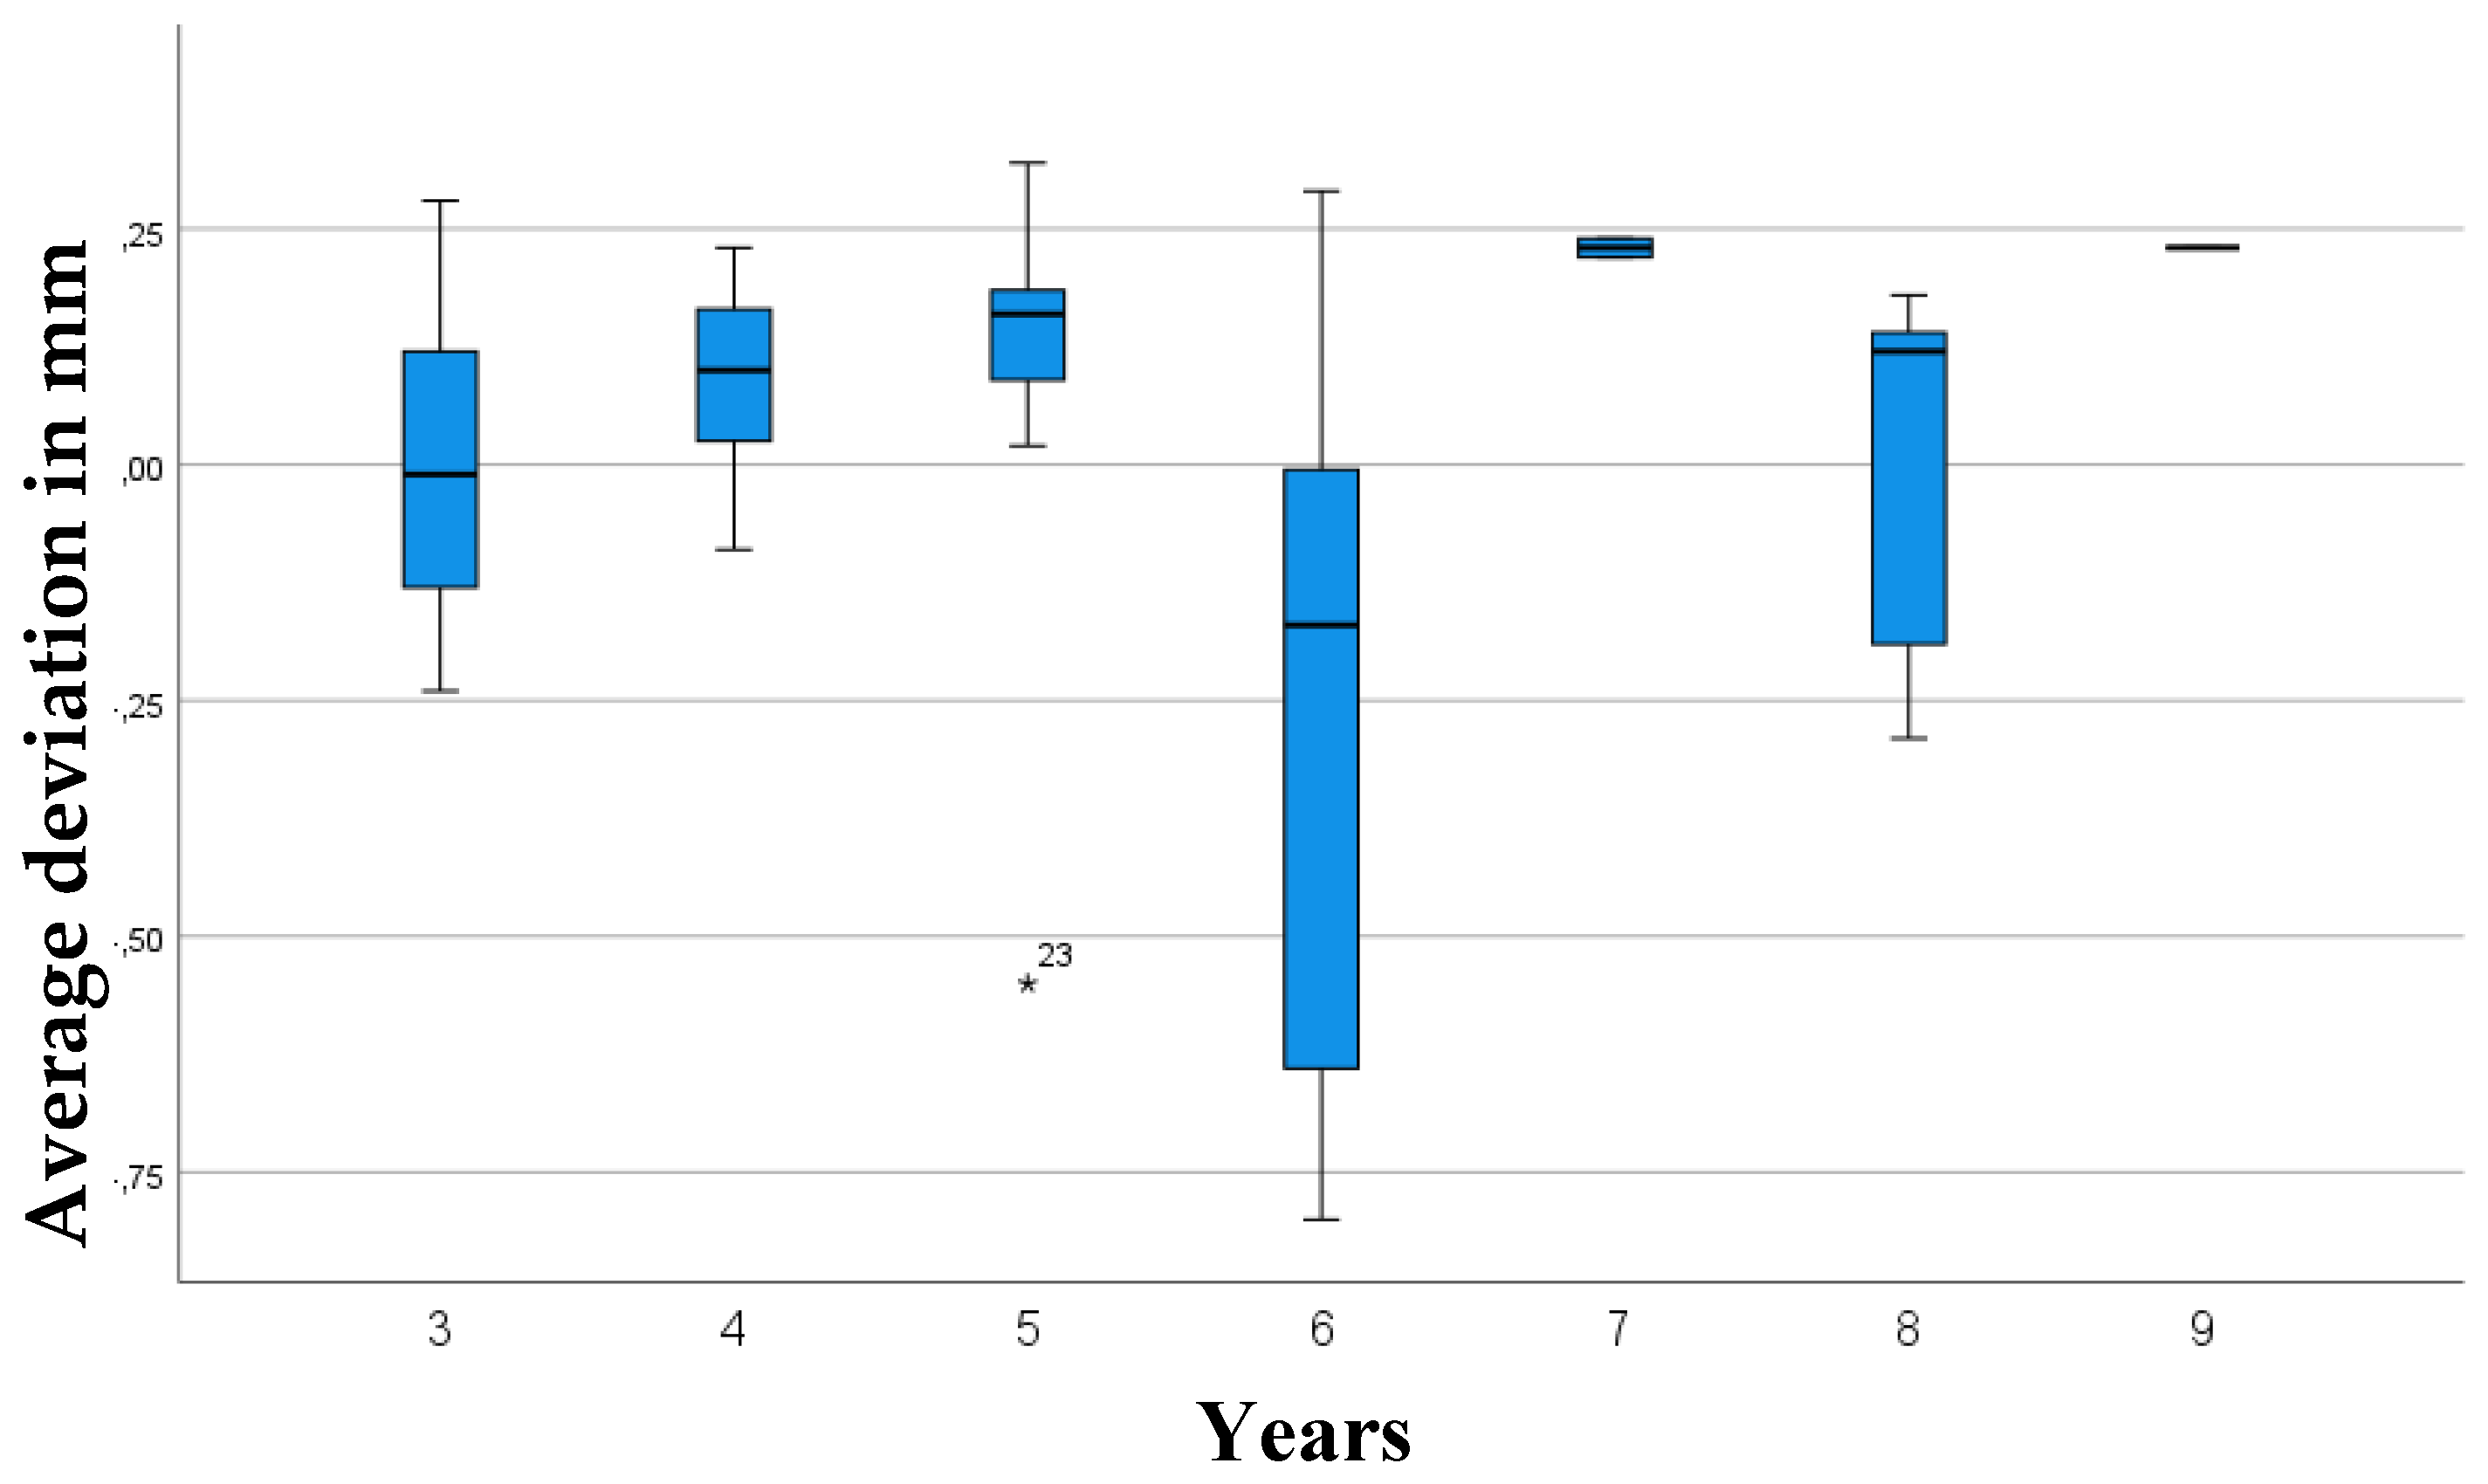
Based on the box plots, one could visually interpret a slight growth trend among the year groups, which are, however, below the significance level and therefore not statistically significant (Figure 6 and Figure 7).
From the overlays of the CBCT images at different points in time, conclusions can be drawn regarding possible dynamics:
- the distribution of the average and maximum deviation to the left and right is identical by gender
- there are no significant differences in the surface change among the year groups.
4. Discussion
The torus mandibularis is a bone structure that often initially remains asymptomatic and unnoticed by patients.
With the help of three-dimensional imaging and precise image processing programs, it is now possible to precisely measure bone structures and determine the dynamics of bone structure growth by superimposing surfaces at different points in time.
The aim of this study was to determine the prevalence and growth tendency of the torus mandibularis.
A three-dimensional imaging procedure was chosen for examinations. This was to ensure that two data sets of a patient could be superimposed as accurately as possible at a later date.
In the first part of the evaluation, the descriptive analysis of the torus mandibularis, the TM was localized by dynamic observation of the individual CBCTs and then measured in all planes in its respective maximum extent. If there were several tori in close positional relationship, the one with the maximum extension was always located and measured.
When measuring the maximum transversal extension of the torus mandibularis, the lingual concavity of the mandible was neglected and measured based on the straight line A (maximum sagittal extension). It can therefore be assumed that the transversal extension tends to be measured too small than it is in reality.
In other studies, the TM was measured using plaster models [7]. This type of measurement made it possible to simultaneously examine the tooth hardness substance for signs of grinding facets in order to demonstrate a connection to bruxism. The measurement on the plaster model enables a good representation of the extent of the TM in the sagittal and frontal plane. However, measurement in the transverse plane is likely to be more difficult than in our CBCT examinations. The plaster model also shows the mucosa, which is often very thin over the TM, but already leads to distortions. It can therefore be assumed that this type of measurement tends to show the TM larger than it actually is.
In their study, Choi et al. used computer tomography (CT) and 3D software to measure the TM [29]. With this approach, similar results to our study using CBCT can be expected, although the higher radiation exposure from the CT should be mentioned as a disadvantage of this examination.
Hassan et al. [22] in their study first examined the TM clinically, then radiographically, histologically after excision and again radiographically for follow-up after use of the TM as bone augmentation material. In the clinical examination, it can be assumed that larger TMs tend to be detected by eye than is possible by radiographic measurement. The histological examination is interesting for the structure of the TM, but not appropriate for exact measurements due to impacts by surgery and histological procedures.
In the study by Scott et al. skeletons were measured [32]. Similar to the measurement of plaster models, assessment in the transverse plane is also likely to be problematic here.
Other studies showed a wide range in the incidence of TM. Studies with smaller samples often showed [33] a higher incidence than studies with larger numbers of subjects [2]. The percentages ranged from 0.44-42.6%. Our patient sample shows a high incidence of TM. In the present study, a percentage of 30% (23% of women and 38% of men) had TM.
Previous study results disagree as to whether the prevalence is dependent on gender. Some studies have found a statistically significant difference.
Kolas et al. conducted a study of 2478 patients in 1953 and found no differences in the prevalence of TM by gender [34]. 7.75 % of all patients showed TM. In this study, Kolas et al. also described that TM was most frequently recognized in patients in the 3rd decade of life and that no statistically significant difference in prevalence could be detected after this age.
A comparison of 1317 German and 947 Thai patients carried out in 1988 showed that 5.2% of German (8.6% of men and 2.4% of women), 9.4% of Thai men and 9% of Thai women had TM [28].
In 2006, Ihunwo et al. examined 284 South African skeletons for the presence of a TM. Of 246 dentulous skulls, 60 (24.4 %) had a TM. There were significantly fewer in the edentulous skulls (4.3 %). 80 % of the TM were found in the male skeletons, 20 % in the female skeletons [35].
In his 2015 study, Romanos et al. also described a higher incidence (52%) of TM in male patients [36].
In contrast, in a large study of 2500 patients in India, torus mandibularis was observed in only 11 patients with a prevalence of 0.24 % in women and 0.2 % in men. This study by Jain S. et al. from 2019 is the only one of the studies listed here in which the distribution of TM is in favor of women [2].
Simunkovic et al. conducted a study in Croatia in 2011 on 1679 patients, including 985 women and 694 men aged 9-99 years. Overall, 12.6% of the patients were found to have TM. This included 11.3 % of women and 14.6 % of men. While the difference in prevalence was found to be statistically significant in gender, no statistically significant difference was seen in age in this study [37]. Our study showed a clustering of TM within the fourth and sixth decade of life.
In the examination of 1000 patients, 1.4 % showed TM. TM and TP were found most frequently in patients aged 11 to 30 years and only rarely in patients younger than 10 years [38].
In a sample of 47 edentulous patients conducted in Jordan in 2006, the overall prevalence of TM was 42.6% [33]. Another study of 618 patients in Jordan with a wider age range of 10 to 82 and excluding dentition, showed a prevalence of TM of 25.7% [39].
Of 1520 Thai patients, 32.2% showed TM. TM was most common in patients in their third decade of life [5].
The study by Al-Zarea et al. on 847 edentulous Arab patients showed 83 (9.8%) TM with a cluster in the 60-69 age group. The age group studied was between 51 and 79 years [40].
In contrast, the study by Maduakor et al. showed an accumulation of TM in the fifth decade of life in the examination of 3000 patients in south-eastern Nigeria in 2017. 8% of the patients examined showed TM [41].
2666 Malaysian patients aged 11-90 years were examined for the occurrence of TM in the study by Kumar Singh et al. Overall, 10.5% of patients showed TM, with the highest incidence in the 31-40 age group [42].
In 2019, Lahari A. Telang et al. observed a TM in 0.9% of the 4443 Malaysian patients examined. The size of the TM varied between 0.5 and 5 cm. Patients with an age between 20-29 showed TM most frequently [43].
Of 1532 Malaysian patients in the study by K. Sathya et al. (2019), 2.8% had TM.
One explanation for this high prevalence could be the diagnosis with the aid of three-dimensional X-rays and the associated possible detection of smaller mandibular tori. Very small mandibular tori may not be detected in clinical situations.
As to now, there are no comparable studies dealing with the change in TM over time.
We could not detect any significant surface growth of the TM over time. For the first appearance of the TM, an average age of 39.2 years [44] or an age between 30 and 50 years [25,45,46] rarely at a younger age [38]. Conclusions about the dynamics of TM cannot be drawn from current studies and our own study.
According to our findings, mandibular tori appear to exhibit static behavior. However, other studies suggest a potential association with functional bite forces. Future research should extend over a significantly longer observation period to detect any possible dynamic changes [11,14,15,16].
According to the classification by Haugen [25] and Eggen et al. [26,27,47] our examinations mainly showed TMs of the smallest extent (smaller than 2 mm), assuming measurement in the transverse direction. Fifty-one of the 210 patients had a TM of the smallest size according to Haugen on the right side and four of the 210 patients had a TM of medium size according to Haugen (2-4 mm). None of the 210 patients had a TM larger than 4 mm. On the left side, the results were similar: 41 of the 210 patients had a TM smaller than 2 mm, 4 patients had a TM between 2 and 4 mm and one patient had a TM larger than 4 mm. Based on the sagittal and vertical measurements, TMs in the largest category according to Haugen (greater than 4 mm) were found in both men and women.
The first source of error, which can lead to subsequent inaccuracies in the measurement, is the imaging parameters of the CBCT. The patients were x-rayed for the purpose of further diagnostics for medical reasons. Due to the different focus search in one patient, different slice thicknesses and settings were used in some cases. This led to distortions and inaccuracies in the overlays of the CBCTs with different slice thicknesses.
5. Summary
The primary aim of this study was to investigate the shape and prevalence of the torus mandibularis.
The secondary aim of this retrospective study was to evaluate and describe the growth dynamics of the torus mandibularis. The accuracy of the overlays was also considered.
TM is a common bone structure with a prevalence of 30.5% regardless of age and gender.
In our study, the torus mandibularis proved to be a very stable bone structure that showed no significant changes over the average period of 5 years that we examined.
Thanks to modern, three-dimensional imaging techniques and precise image analysis programs, no growth tendency of the torus mandibularis can be detected. The superimposition accuracy is limited by the voxel size of the digital volume tomography image. Our investigations in this study reflect this accuracy. On the one hand, this speaks in favor of an exact superimposition, but on the other hand it also indicates that the bone has not changed significantly over time.
The use of the torus mandibularis for augmentations, for example prior to implantation, is conceivable due to the individual assessment of the bone structure and has been described as successful in various studies.
Further retrospective studies over a long period of time, also in younger patients, would be useful to confirm or question these results.
Funding
None.
Conflicts of Interest
The authors declare no conflicts of interest.
References
- Koc, N.; Cagirankaya, L.B. Mandibular tori are associated with mandibular bone quality: a case-control study. Folia Morphol (Warsz) 2018, 77, 736–741. [Google Scholar] [PubMed]
- Jain, S.; Wilson, T. A clinical study and an invstigation on the relation of torus palatinus and torus mandibularis with TMD. Int J Cur Res 2019.
- Götz, W.; Schnutenhaus, S. Der Toris mandibilaris: eine orale Xostose unklarer Genese. ZWR 2019, 128, 476–482. [Google Scholar]
- Dou, X.W.; Park, W.; Lee, S.; Zhang, Q.Z.; Carrasco, L.R.; Le, A.D. Loss of Notch3 Signaling Enhances Osteogenesis of Mesenchymal Stem Cells from Mandibular Torus. J Dent Res 2017, 96, 347–354. [Google Scholar] [CrossRef]
- Jainkittivong, A.; Apinhasmit, W.; Swasdison, S. Prevalence and clinical characteristics of oral tori in 1,520 Chulalongkorn University Dental School patients. Surg Radiol Anat 2007, 29, 125–131. [Google Scholar] [CrossRef]
- Mizuno, S.; Ono, S.; Makino, Y.; Kobayashi, S.; Torimitsu, S.; Yamaguchi, R.; et al. Mandibular torus thickness associated with age: Postmortem computed tomographic analysis. Leg Med (Tokyo) 2024, 69, 102449. [Google Scholar] [CrossRef]
- Auskalnis, A.; Rutkunas, V.; Bernhardt, O.; Sidlauskas, M.; Salomskiene, L.; Baseviciene, N. Multifactorial etiology of Torus mandibularis: study of twins. Stomatologija 2015, 17, 35–40. [Google Scholar]
- Al-Dwairi, Z.N.; Al-Daqaq, A.N.F.; Kielbassa, A.M.; Lynch, E. Association between oral tori, occlusal force, and mandibular cortical index. Quintessence Int 2017, 48, 841–849. [Google Scholar]
- Bertazzo-Silveira, E.; Stuginski-Barbosa, J.; Porporatti, A.L.; Dick, B.; Flores-Mir, C.; Manfredini, D.; et al. Association between signs and symptoms of bruxism and presence of tori: a systematic review. Clin Oral Investig 2017, 21, 2789–2799. [Google Scholar] [CrossRef]
- Mendes da Silva, J.; Perola Dos Anjos Braga Pires, C.; Angelica Mendes Rodrigues, L.; Palinkas, M.; de Luca Canto, G.; Batista de Vasconcelos, P.; et al. Influence of mandibular tori on stomatognathic system function. Cranio 2017, 35, 30–37. [Google Scholar] [CrossRef]
- Jeong, C.W.; Kim, K.H.; Jang, H.W.; Kim, H.S.; Huh, J.K. The relationship between oral tori and bite force. Cranio 2019, 37, 246–253. [Google Scholar] [CrossRef]
- Khan, S.; Shah, S.A.H.; Ali, F.; Rasheed, D. Concurrence of Torus Palatinus, Torus Mandibularis and Buccal Exostosis. J Coll Physicians Surg Pak 2016, 26, 111–113. [Google Scholar] [PubMed]
- Lease, L.R. Correlations between dental wear and oral cavity characteristics: Mandibular torus, palatine torus, and oral exostoses. Am J Hum Biol 2021, 33, e23446. [Google Scholar] [CrossRef]
- Lee, H.M.; Kang, D.W.; Yun, P.Y.; Kim, I.H.; Kim, Y.K. Associations between mandibular torus and types of temporomandibular disorders, and the clinical usefulness of temporary splint for checking bruxism. BMC Oral Health 2021, 21, 182. [Google Scholar] [CrossRef] [PubMed]
- Tagger-Green, N.; Nemcovsky, C.; Fridenberg, N.; Berg, Y.S.; Kolerman, R. Radiographic signs of excessive occlusal forces are associated with marginal bone loss: a retrospective clinical study. Quintessence Int 2023, 54, 672–679. [Google Scholar]
- Shibaguchi, K.; Morinaga, K.; Magori, Y.; Kagawa, T.; Matsuura, T. Computed Tomographic Analysis of Mandibular Tori and Their Relationship to Remaining Teeth. Diagnostics (Basel) 2025, 15. [Google Scholar] [CrossRef] [PubMed]
- Yoshinaka, M.; Ikebe, K.; Furuya-Yoshinaka, M.; Maeda, Y. Prevalence of torus mandibularis among a group of elderly Japanese and its relationship with occlusal force. Gerodontology 2014, 31, 117–122. [Google Scholar] [CrossRef]
- Ahn, S.H.; Ha, J.G.; Kim, J.W.; Lee, Y.W.; Yoon, J.H.; Kim, C.H.; et al. Torus mandibularis affects the severity and position-dependent sleep apnoea in non-obese patients. Clin Otolaryngol 2019, 44, 279–285. [Google Scholar] [CrossRef]
- Lavigne, G.J.; Herrero Babiloni, A.; Beetz, G.; Dal Fabbro, C.; Sutherland, K.; Huynh, N.; et al. Critical Issues in Dental and Medical Management of Obstructive Sleep Apnea. J Dent Res 2020, 99, 26–35. [Google Scholar] [CrossRef]
- Shaver, T.B.; Joshi, A.S. Torus mandibularis and its implication as a risk factor for the formation of sialolithiasis. BMJ Case Rep 2023, 16. [Google Scholar] [CrossRef]
- Pal, M.; Gupta, K.; Kumar, S.; Gopalkrishna, P. Use of a mandibular torus for autogenous grafting: a case report. Gen Dent 2018, 66, 73–76. [Google Scholar]
- Hassan, K.S.; Al-Agal, A.; Abdel-Hady, A.I.; Swelam, W.M.; Elgazzar, R.F. Mandibular tori as bone grafts: an alternative treatment for periodontal osseous defects - clinical, radiographic and histologic morphology evaluation. J Contemp Dent Pract 2015, 16, 192–200. [Google Scholar] [CrossRef] [PubMed]
- Karaca, I.R.; Ozturk, D.N.; Akinci, H.O. Mandibular Torus Harvesting for Sinus Augmentation: Two-Year Follow-Up. J Maxillofac Oral Surg 2019, 18, 61–64. [Google Scholar] [CrossRef] [PubMed]
- Santhanakrishnan, M.; Rangarao, S. Mandibular Tori: A source of autogenous bone graft. J Indian Soc Periodontol 2014, 18, 767–771. [Google Scholar] [CrossRef] [PubMed]
- Haugen, L.K. Palatine and mandibular tori. A morphologic study in the current Norwegian population. Acta Odontol Scand 1992, 50, 65–77. [Google Scholar] [CrossRef]
- Eggen, S.; Natvig, B. Relationship between torus mandibularis and number of present teeth. Scand J Dent Res 1986, 94, 233–240. [Google Scholar] [CrossRef]
- Eggen, S. Torus mandibularis: an estimation of the degree of genetic determination. Acta Odontol Scand 1989, 47, 409–415. [Google Scholar] [CrossRef]
- Reichart, P.A.; Neuhaus, F.; Sookasem, M. Prevalence of torus palatinus and torus mandibularis in Germans and Thai. Community Dent Oral Epidemiol 1988, 16, 61–64. [Google Scholar] [CrossRef]
- Choi, Y.; Park, H.; Lee, J.S.; Park, J.C.; Kim, C.S.; Choi, S.H.; et al. Prevalence and anatomic topography of mandibular tori: computed tomographic analysis. J Oral Maxillofac Surg 2012, 70, 1286–1291. [Google Scholar] [CrossRef]
- Koc, N.; Cagirankaya, L.B. Investigation of the determinants of the mandibular cortical morphology. Dent Med Probl 2019, 56, 21–25. [Google Scholar] [CrossRef]
- Scrieciu, M.; Mercu, T.V.; Mercu, T.R.; Birjovanu, C.; Stan, M.C.; Marinescu, I.R.; et al. Morphological and clinical characteristics of the torus palatinus and torus mandibularis in a sample of young and adults’ Romanian people. Rom J Morphol Embryol 2016, 57, 139–144. [Google Scholar]
- Scott, G.R.; Schomberg, R.; Swenson, V.; Adams, D.; Pilloud, M.A. Northern exposure: Mandibular torus in the Greenlandic Norse and the whole wide world. Am J Phys Anthropol 2016, 161, 513–521. [Google Scholar] [CrossRef]
- Al Quran, F.A.; Al-Dwairi, Z.N. Torus palatinus and torus mandibularis in edentulous patients. J Contemp Dent Pract 2006, 7, 112–119. [Google Scholar] [CrossRef] [PubMed]
- Kolas, S.; Halperin, V.; Jefferis, K.; Huddleston, S.; Robinson, H.B. The occurrence of torus palatinus and torus mandibularis in 2,478 dental patients. Oral Surg Oral Med Oral Pathol 1953, 6, 1134–1141. [Google Scholar] [CrossRef] [PubMed]
- Ihunwo, A.O.; Phukubye, P. The frequency and anatomical features of torus mandibularis in a Black South African population. Homo 2006, 57, 253–262. [Google Scholar] [CrossRef] [PubMed]
- Romanos, G.E.; Sarmiento, H.L.; Yunker, M.; Malmstrom, H. Prevalence of torus mandibularis in Rochester, New York, region. N Y State Dent J 2013, 79, 25–27. [Google Scholar]
- Simunkovic, S.K.; Bozic, M.; Alajbeg, I.Z.; Dulcic, N.; Boras, V.V. Prevalence of torus palatinus and torus mandibularis in the Split-Dalmatian County, Croatia. Coll Antropol 2011, 35, 637–641. [Google Scholar]
- Shah, D.S.; Sanghavi, S.J.; Chawda, J.D.; Shah, R.M. Prevalence of torus palatinus and torus mandibularis in 1000 patients. Indian J Dent Res 1992, 3, 107–110. [Google Scholar]
- Sawair, F.A.; Shayyab, M.H.; Al-Rababah, M.A.; Saku, T. Prevalence and clinical characteristics of tori and jaw exostoses in a teaching hospital in Jordan. Saudi Med J 2009, 30, 1557–1562. [Google Scholar]
- AlZarea, B.K. Prevalence and pattern of torus palatinus and torus mandibularis among edentulous patients of Saudi Arabia. Clin Interv Aging 2016, 11, 209–213. [Google Scholar] [CrossRef]
- Maduakor, S.N.; Nwoga, M.C. Prevalence of mandibular and palatine tori among the Ibos in Enugu, South-East Nigeria. Niger J Clin Pract 2017, 20, 57–60. [Google Scholar]
- Kumar Singh, A.; Sulugodu Ramachandra, S.; Arora, S.; Dicksit, D.D.; Kalyan, C.G.; Singh, P. Prevalence of oral tori and exostosis in Malaysian population - A cross-sectional study. J Oral Biol Craniofac Res 2017, 7, 158–160. [Google Scholar] [CrossRef] [PubMed]
- Telang, L.A.; Telang, A.; Nerali, J.; Pradeep, P. Tori in a Malaysian population: Morphological and ethnic variations. J Forensic Dent Sci 2019, 11, 107–112. [Google Scholar] [CrossRef]
- Al-Bayaty, H.F.; Murti, P.R.; Matthews, R.; Gupta, P.C. An epidemiological study of tori among 667 dental outpatients in Trinidad & Tobago, West Indies. Int Dent J 2001, 51, 300–304. [Google Scholar] [PubMed]
- Bruce, I.; Ndanu, T.A.; Addo, M.E. Epidemiological aspects of oral tori in a Ghanaian community. Int Dent J 2004, 54, 78–82. [Google Scholar] [CrossRef] [PubMed]
- Eggen, S.; Natvig, B. Concurrence of torus mandibularis and torus palatinus. Scand J Dent Res 1994, 102, 60–63. [Google Scholar] [CrossRef]
- Eggen, S. Correlated characteristics of the jaws: association between torus mandibularis and marginal alveolar bone height. Acta Odontol Scand 1992, 50, 1–6. [Google Scholar] [CrossRef]
Figure 1.
Patient with bilateral torus mandibularis, male. 47 years old.
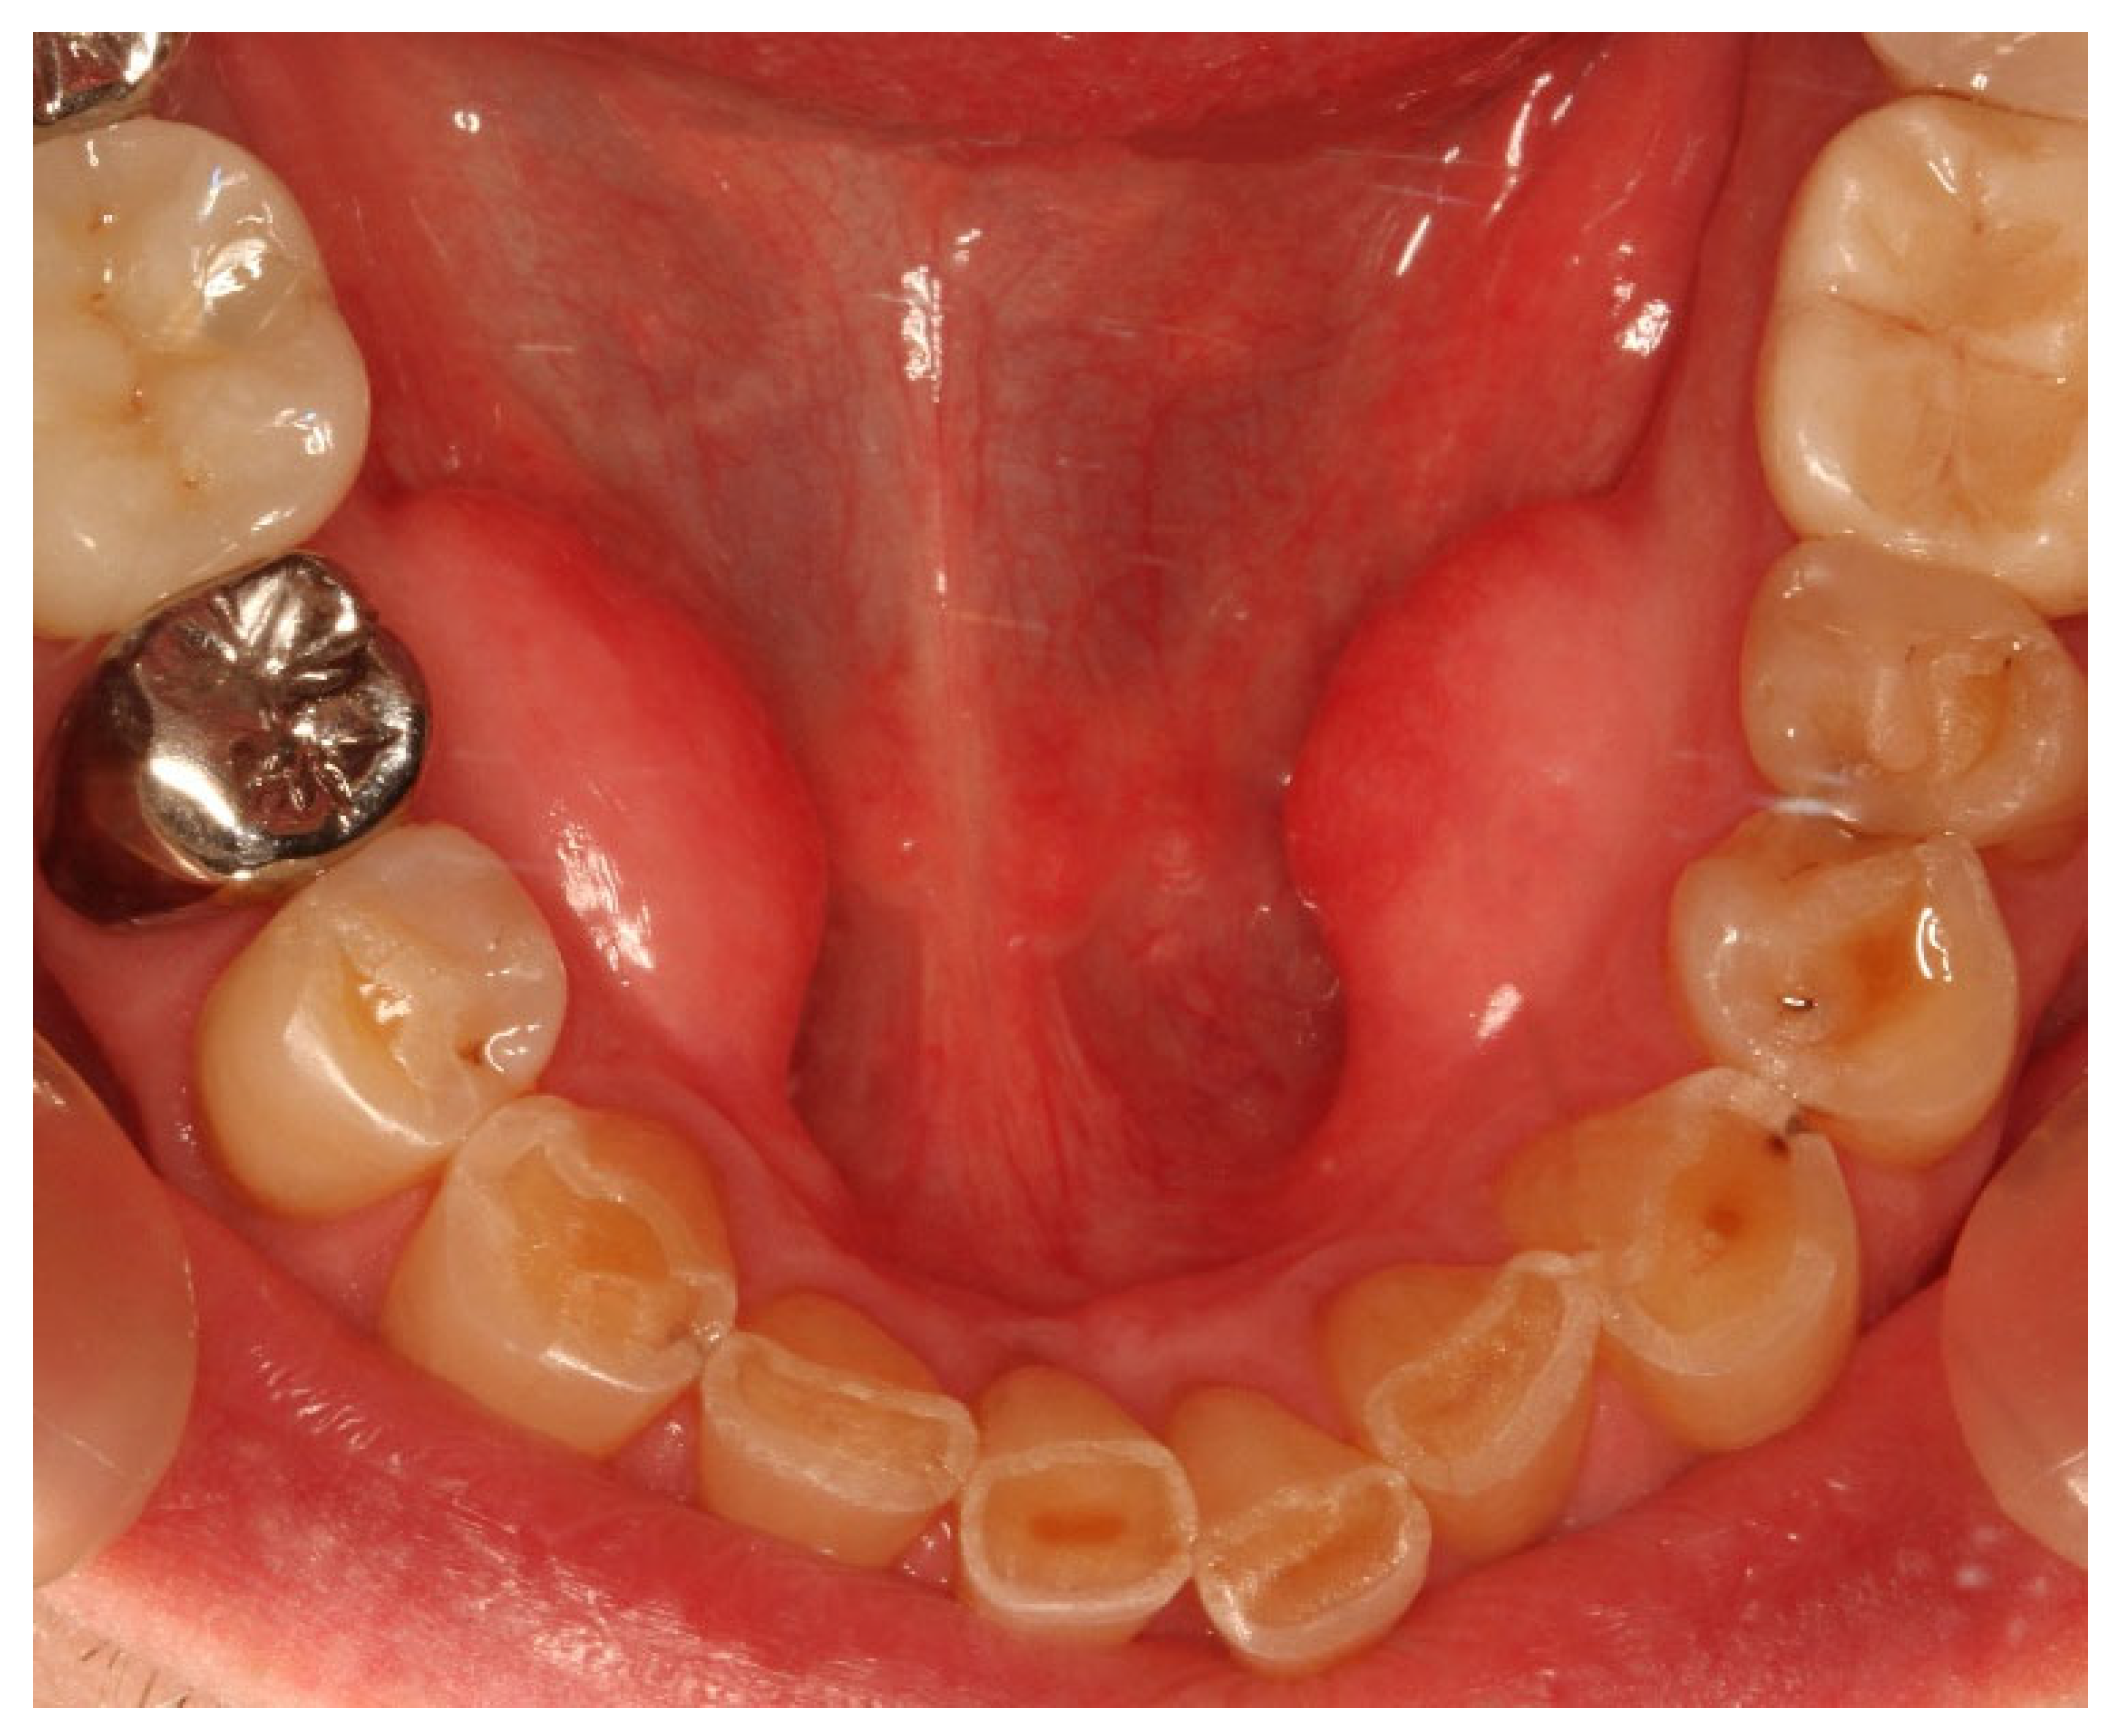
Figure 2.
Data set of the digital volume tomography opened in OsiriXMD for measuring the left torus mandibularis in the axial and frontal plane. In the upper left window, line A shows the maximum extension in the sagittal direction and line B in the transversal direction. Line C is the extension of B to the vestibular cortex of the mandible. The distance to the mental foramen was measured from here. In the lower right window, the green line shows the maximum extension of the TM in the vertical direction.
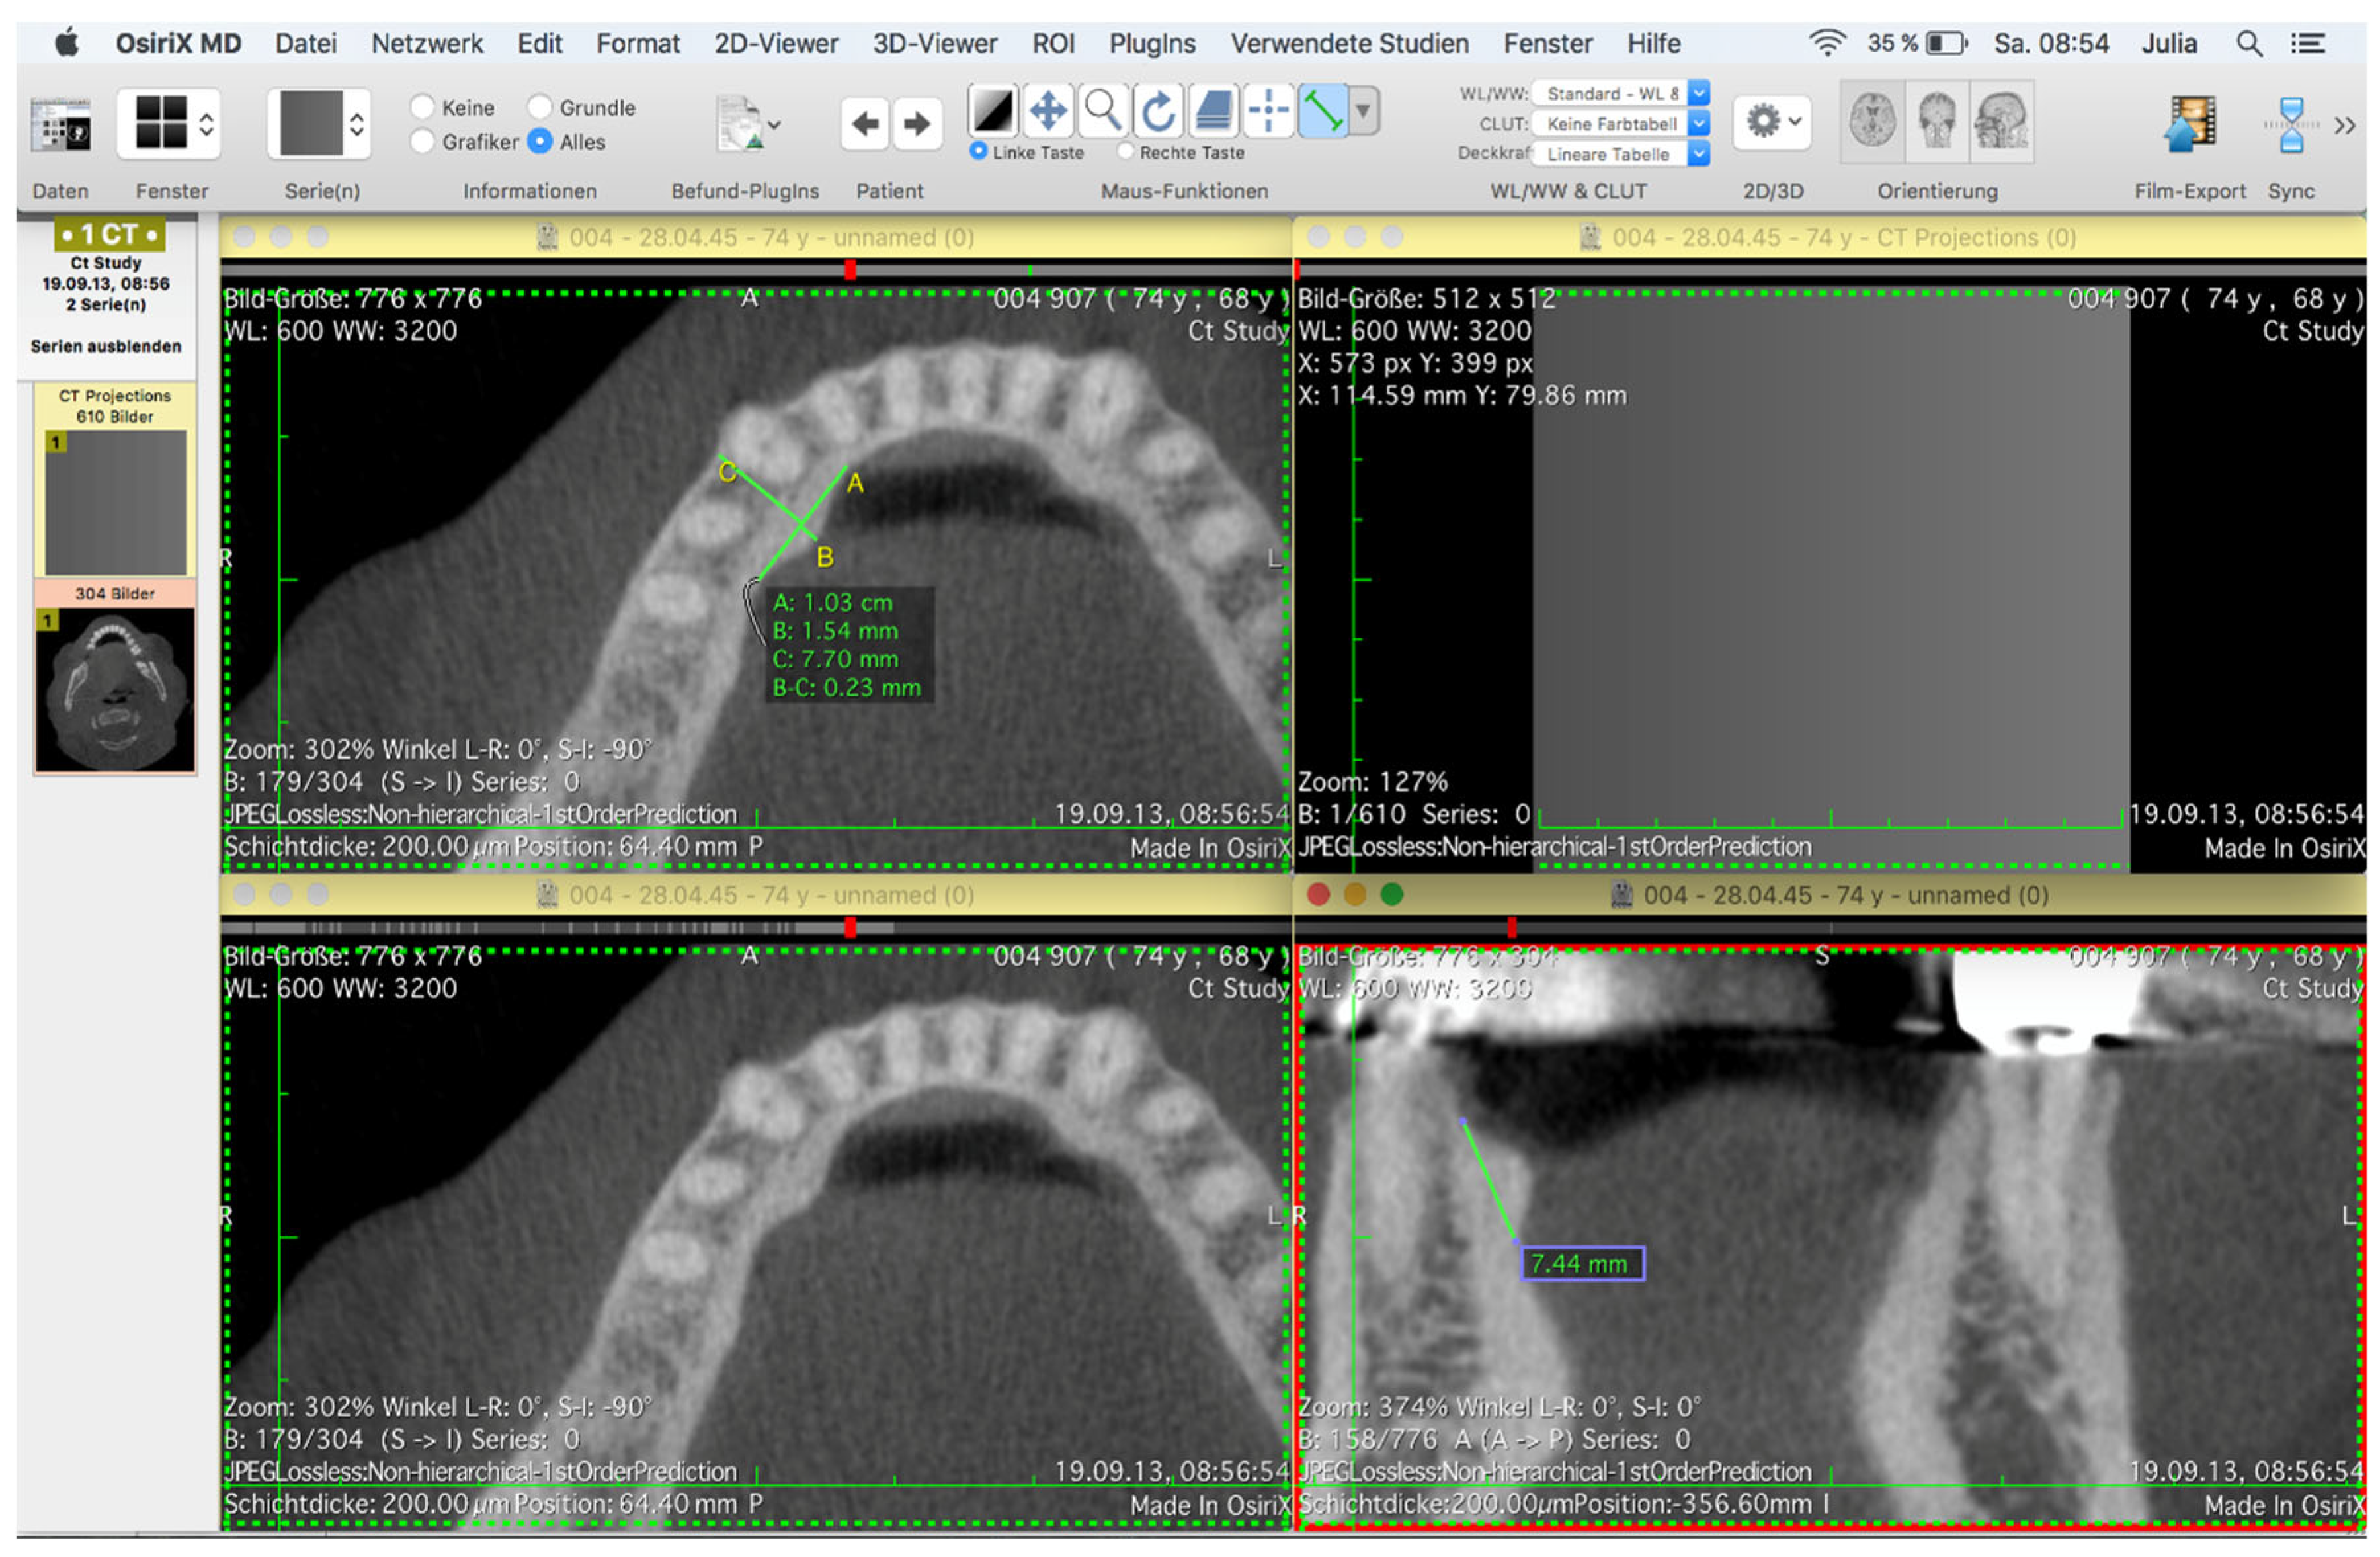
Figure 3.
Data set of the digital volume tomography, opened in OsiriXMD to measure the torus mandibularis in the axial plane. Sagittal and transversal maximum extension of the torus mandibularis on both sides are indicated by lines A and B. The lines on the vestibular cortical bone of the mandible indicate the distance of the left and right mental foramen from an extension (C) through the maximum transversal extension of the TM.
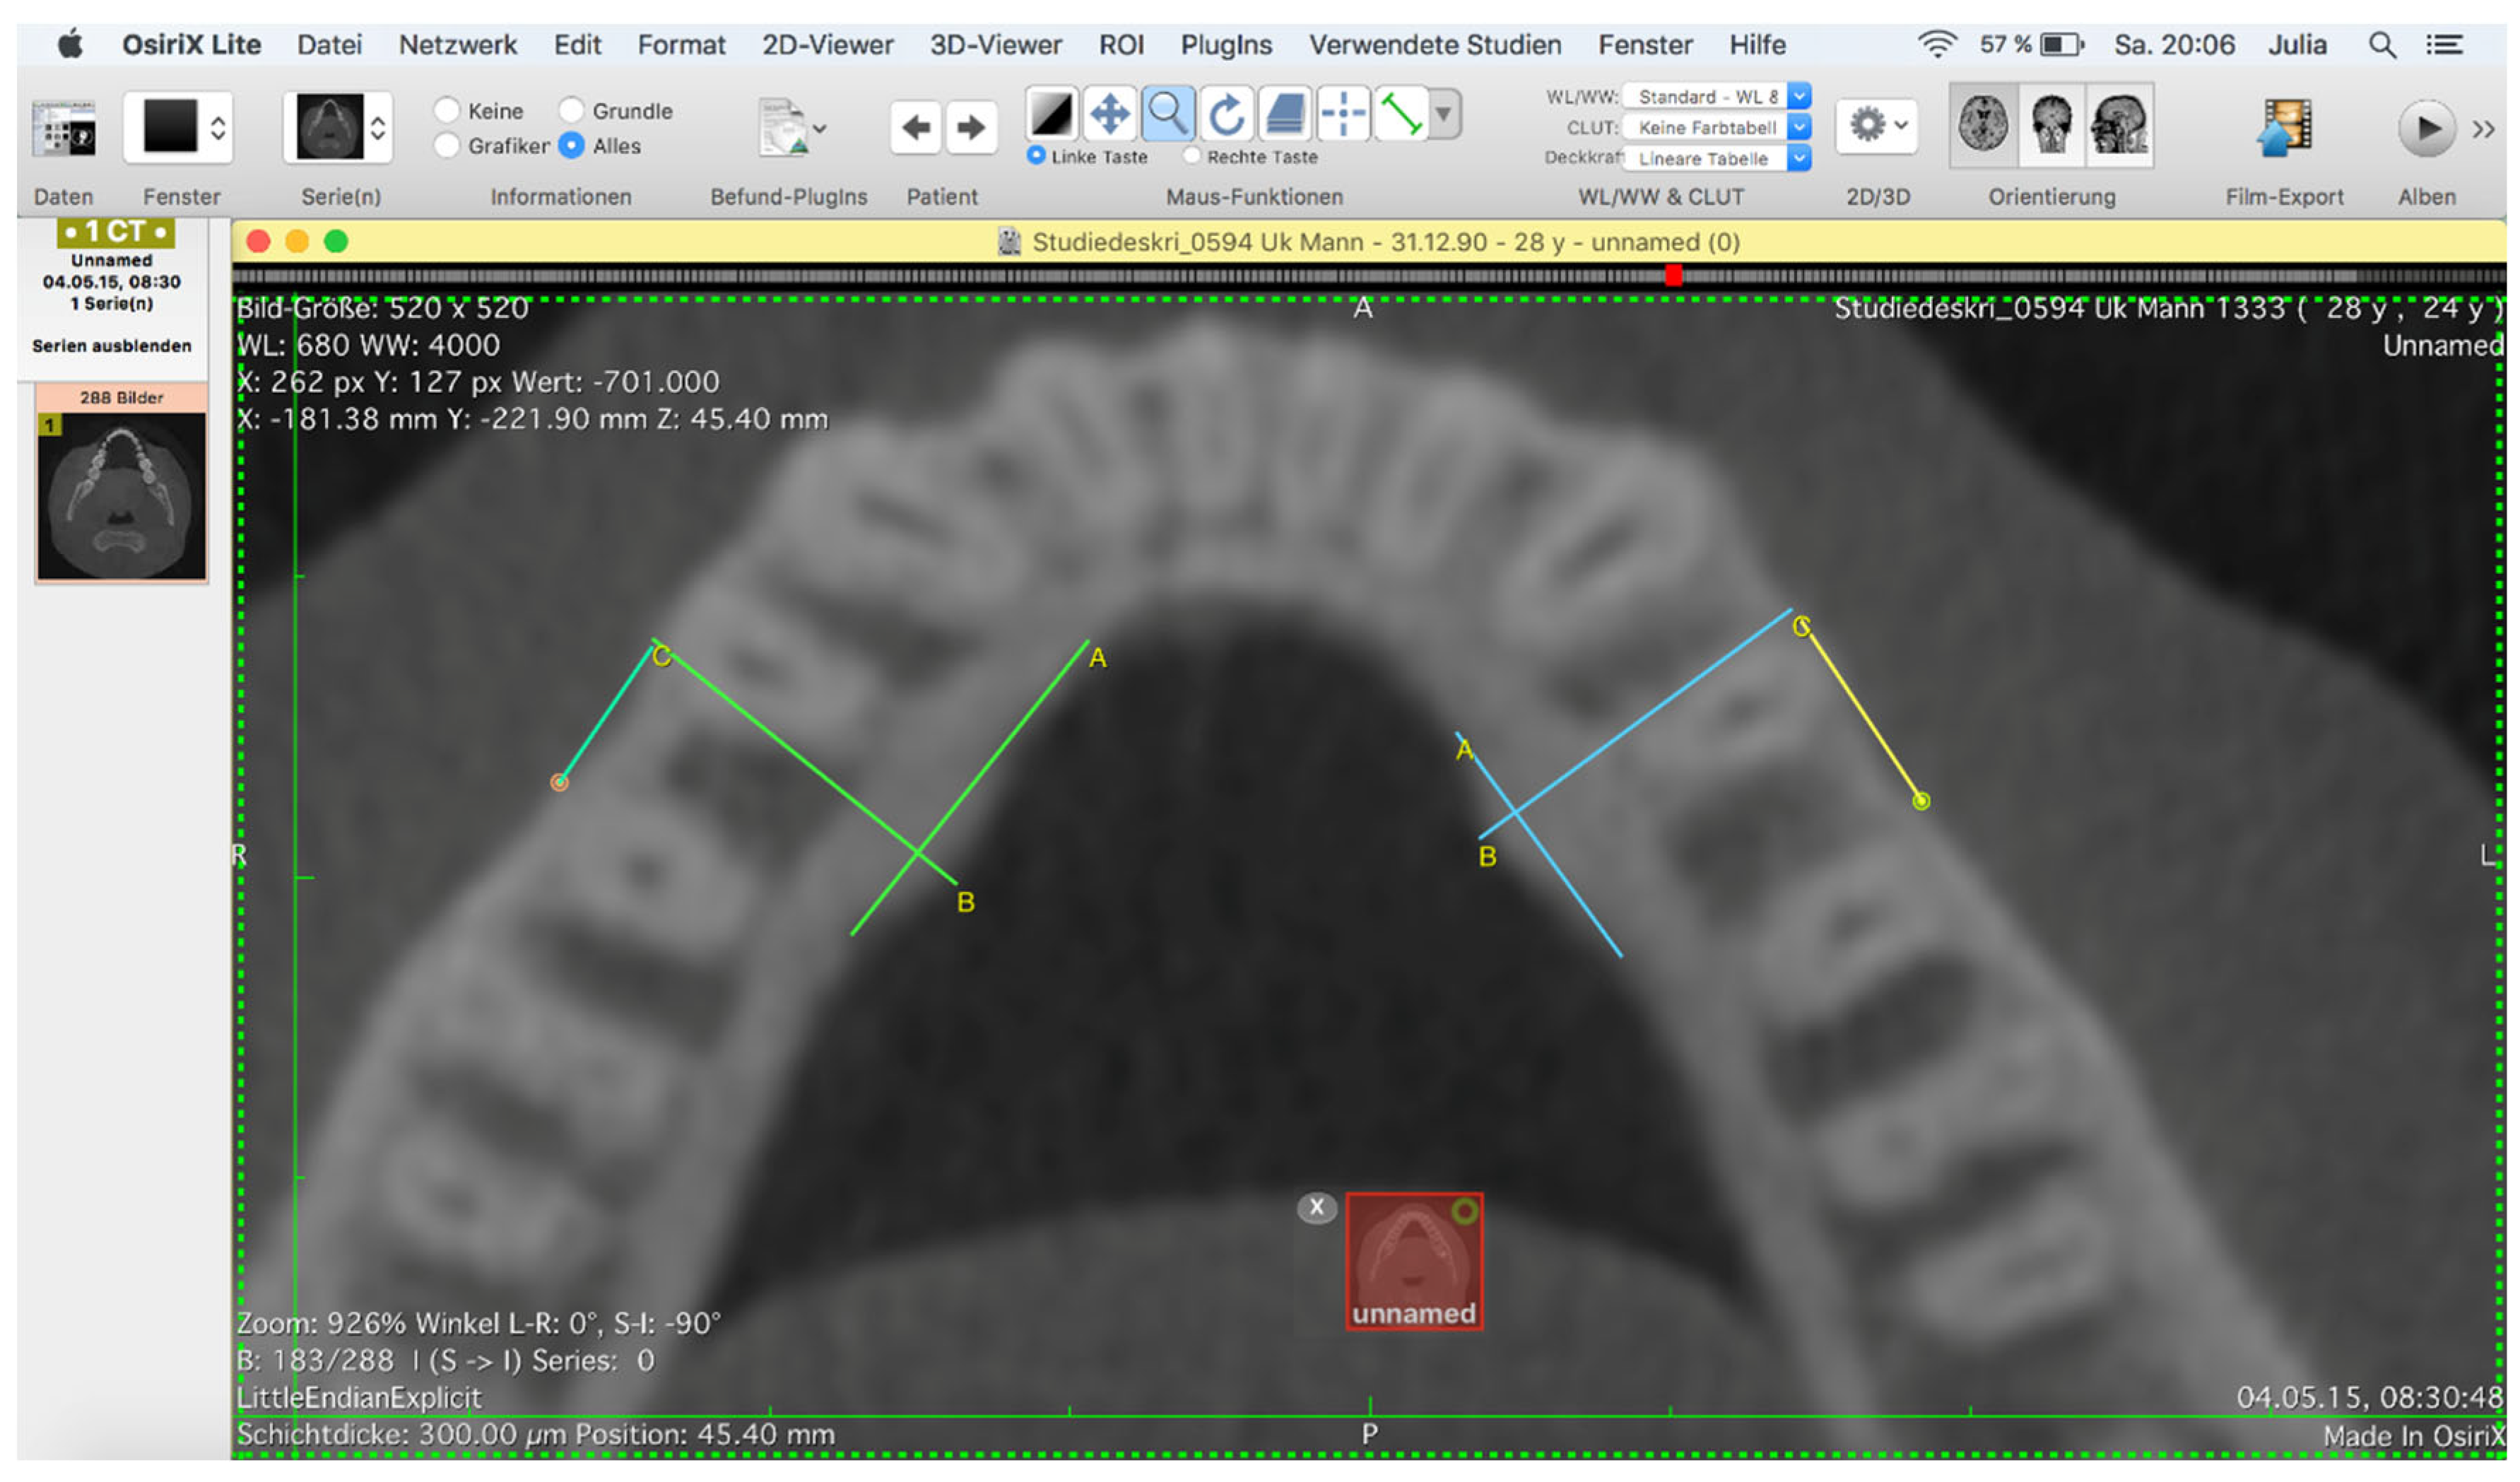
Figure 4.
Data set of the digital volume tomography converted into a surface data set opened in GOM before (left) and after (right) after processing the artifacts in GOM.
Figure 4.
Data set of the digital volume tomography converted into a surface data set opened in GOM before (left) and after (right) after processing the artifacts in GOM.
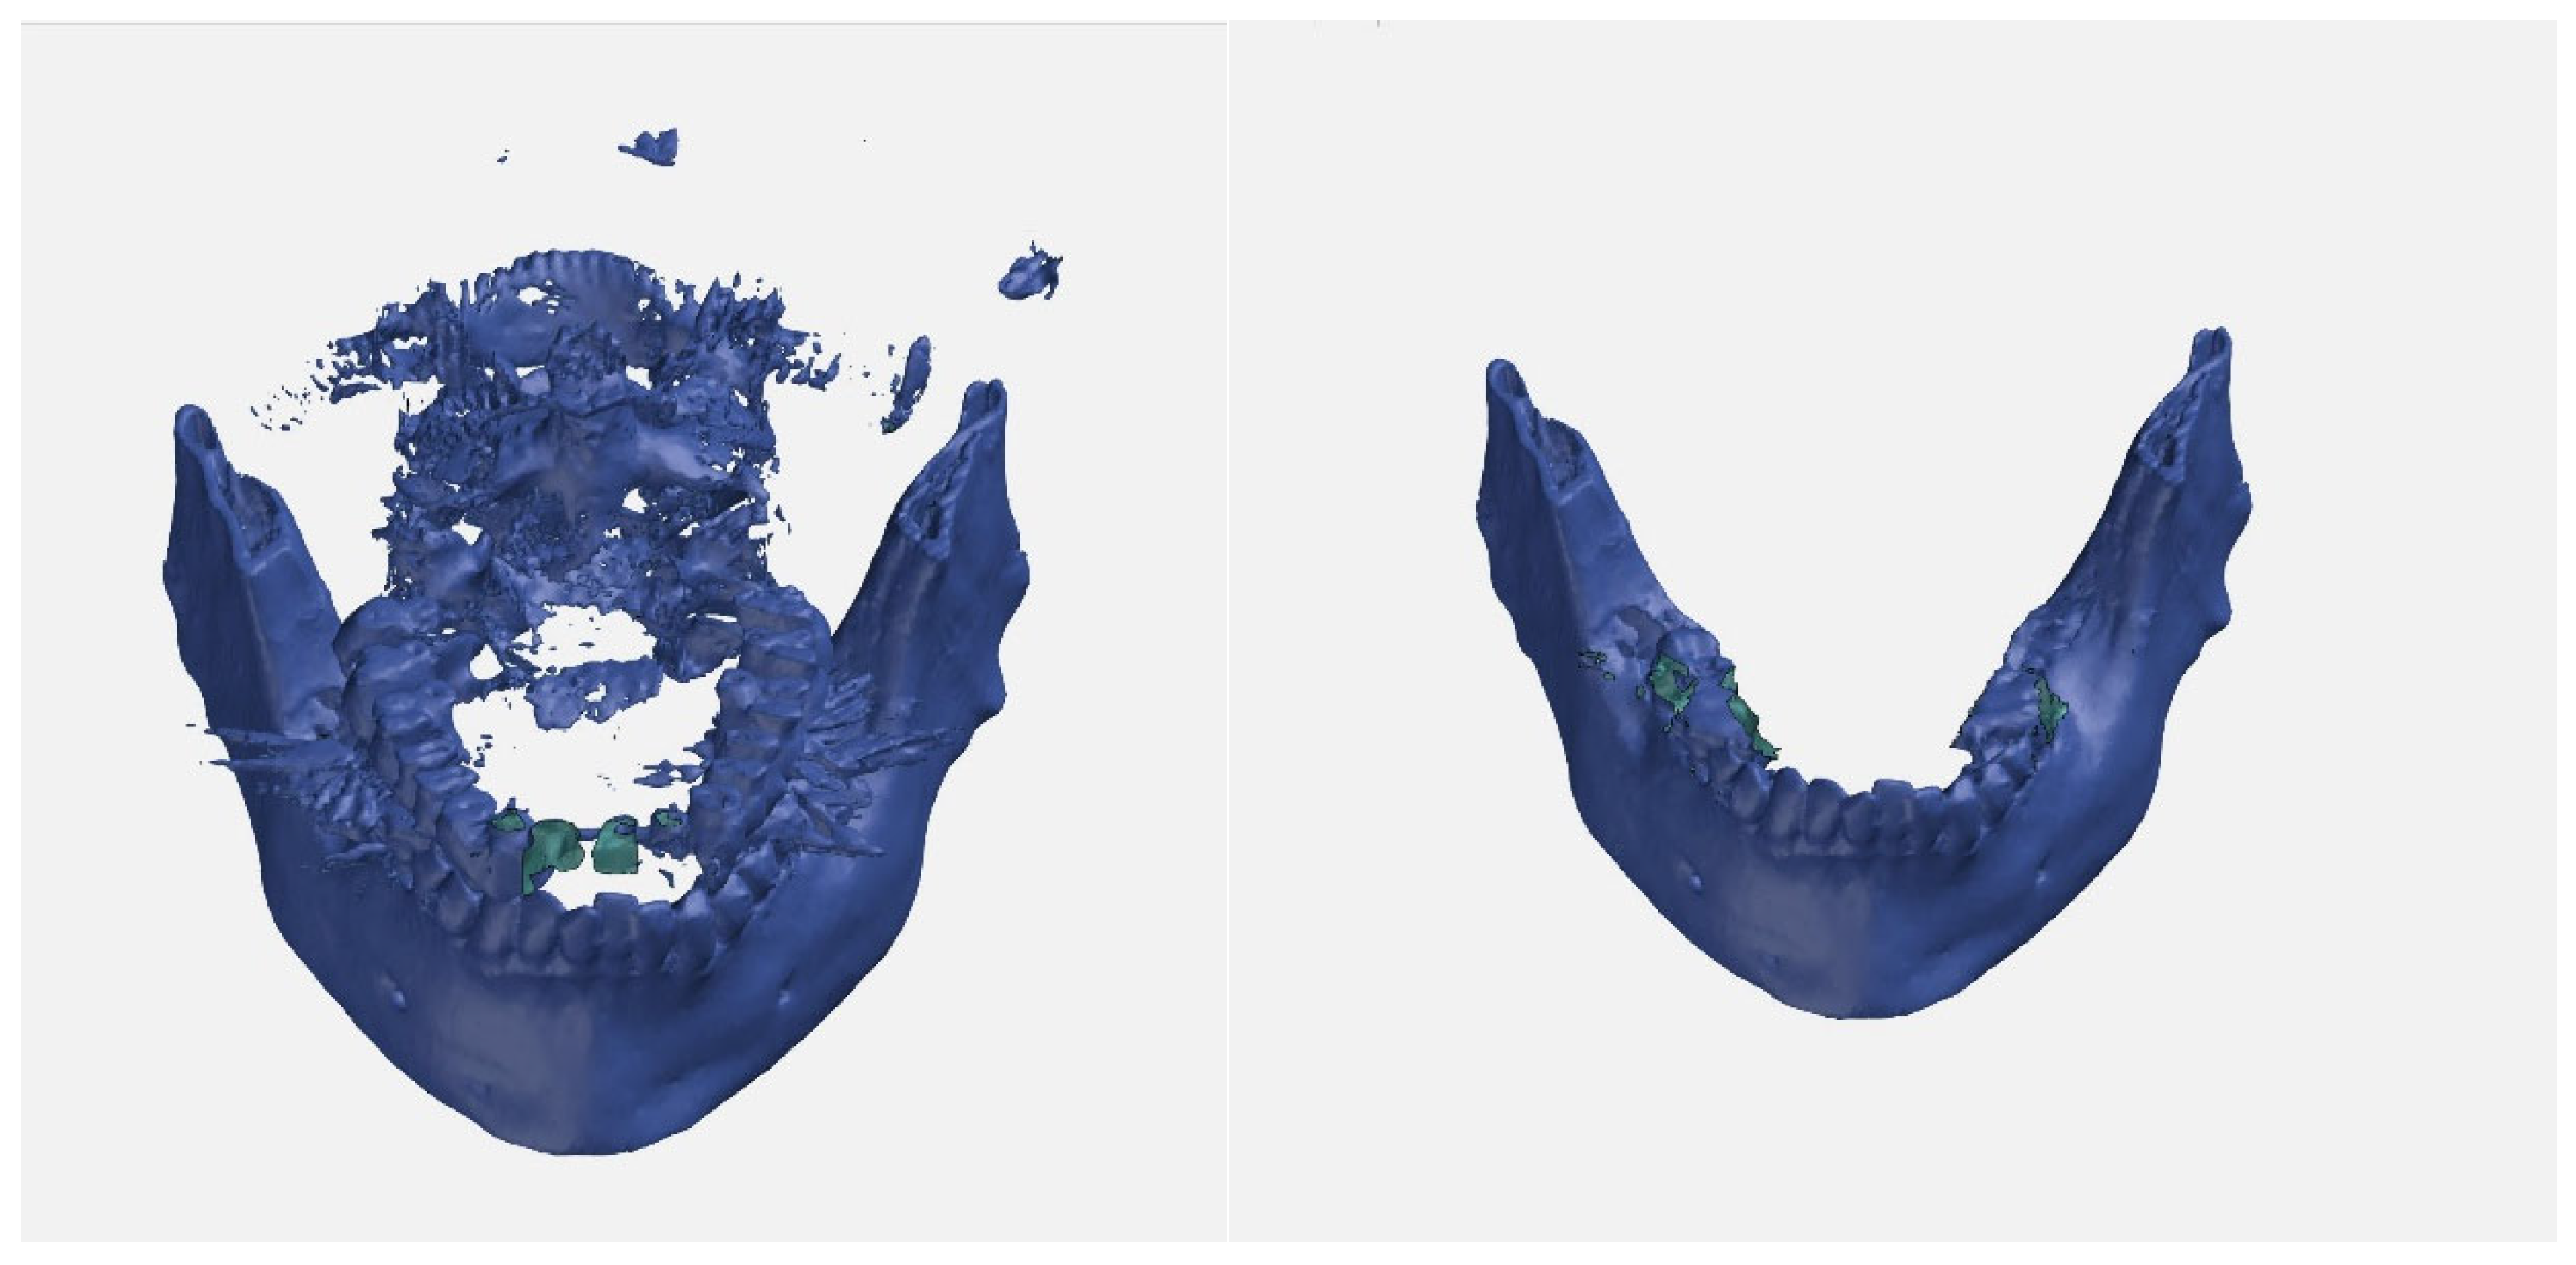
Figure 5.
The original data set was converted into an STL surface using OsiriXMD. The figure shows these surfaces recorded at different points in time opened in GOM with a surface comparison of the region of interest on the left and right on a grid with deviation flags “Max”, “Min” and “arythmetic mean”. The color scale on the right of the image shows at a glance that there are no serious deviations in this overlay.
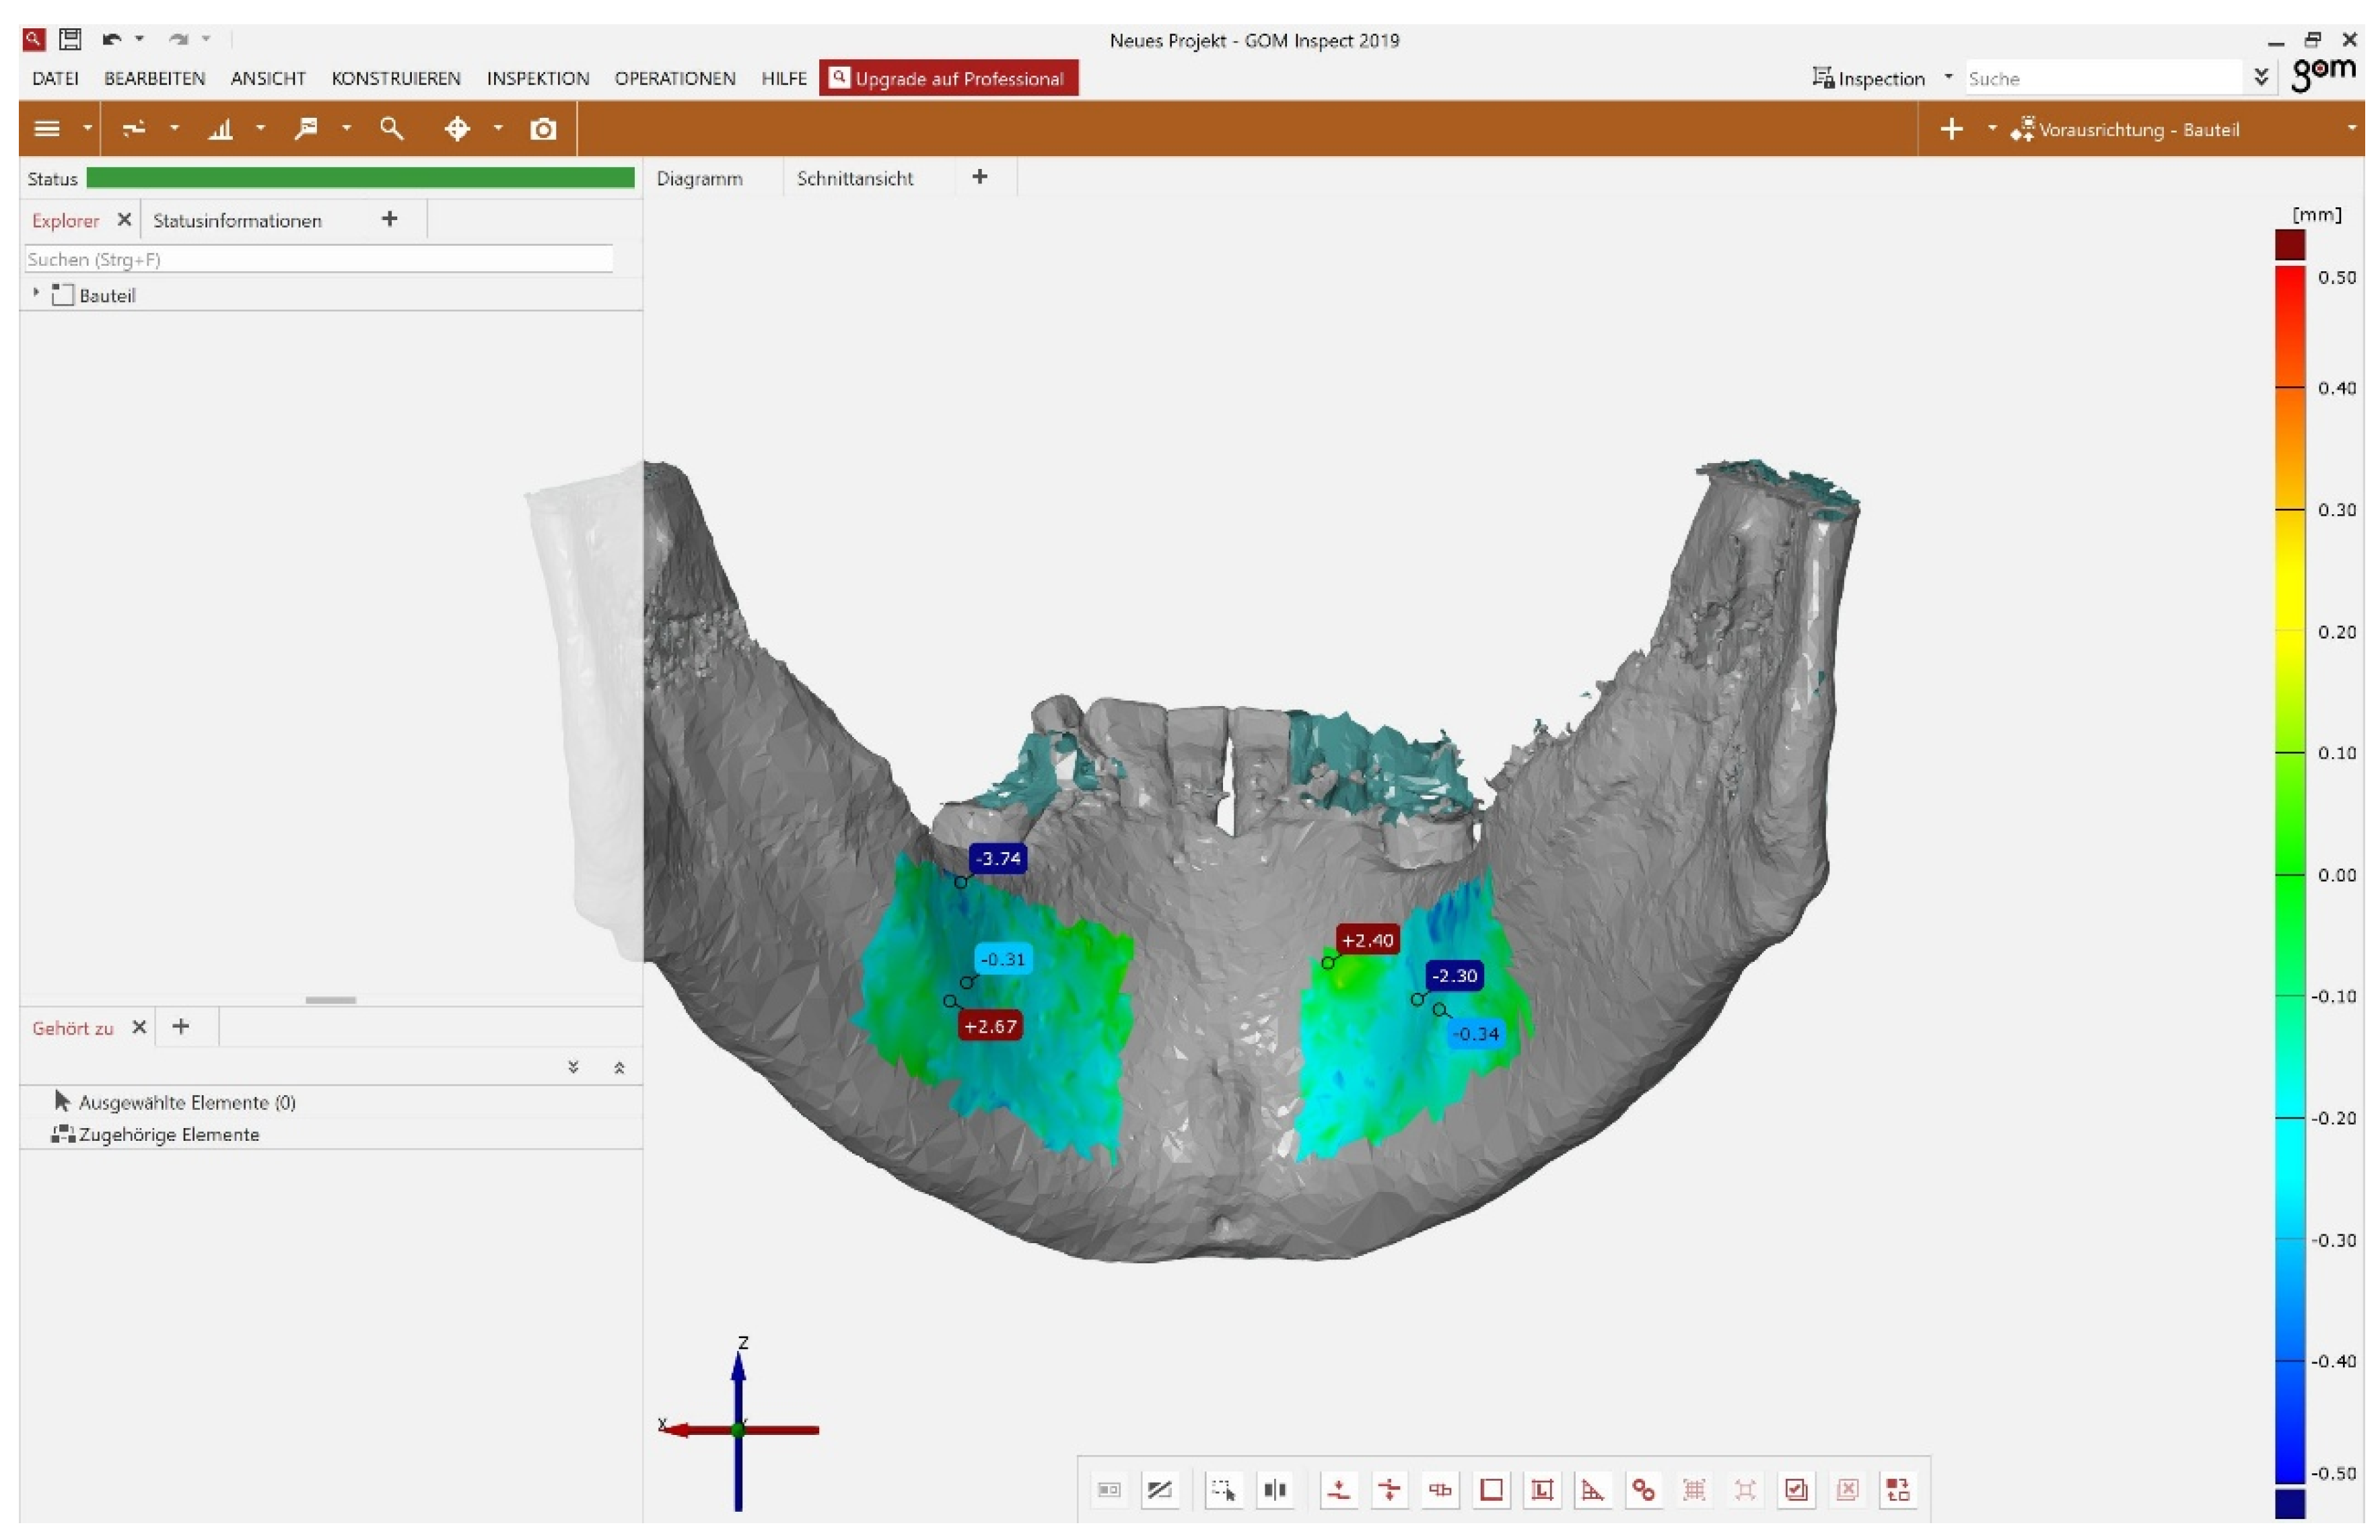
Figure 6.
The patients in the exploratory part were divided according to the interval between image one and image two of the digital volume tomography (CBCT). Group one comprises all data sets in which the interval between the two images was in the third and fourth year. In group two, the second CBCT was taken in the fifth or sixth year and in group three, the second CBCT was taken in the seventh to ninth year after the first CBCT was taken. The two data sets were superimposed and the average deviation in the left and right torus mandibularis was measured in millimeters (mm). The box plot shows the average deviation between the two data sets of the digital volume tomography of the left and right torus mandibularis within the year groups on a scale of -0.75 millimeters to 0.25 millimeters.
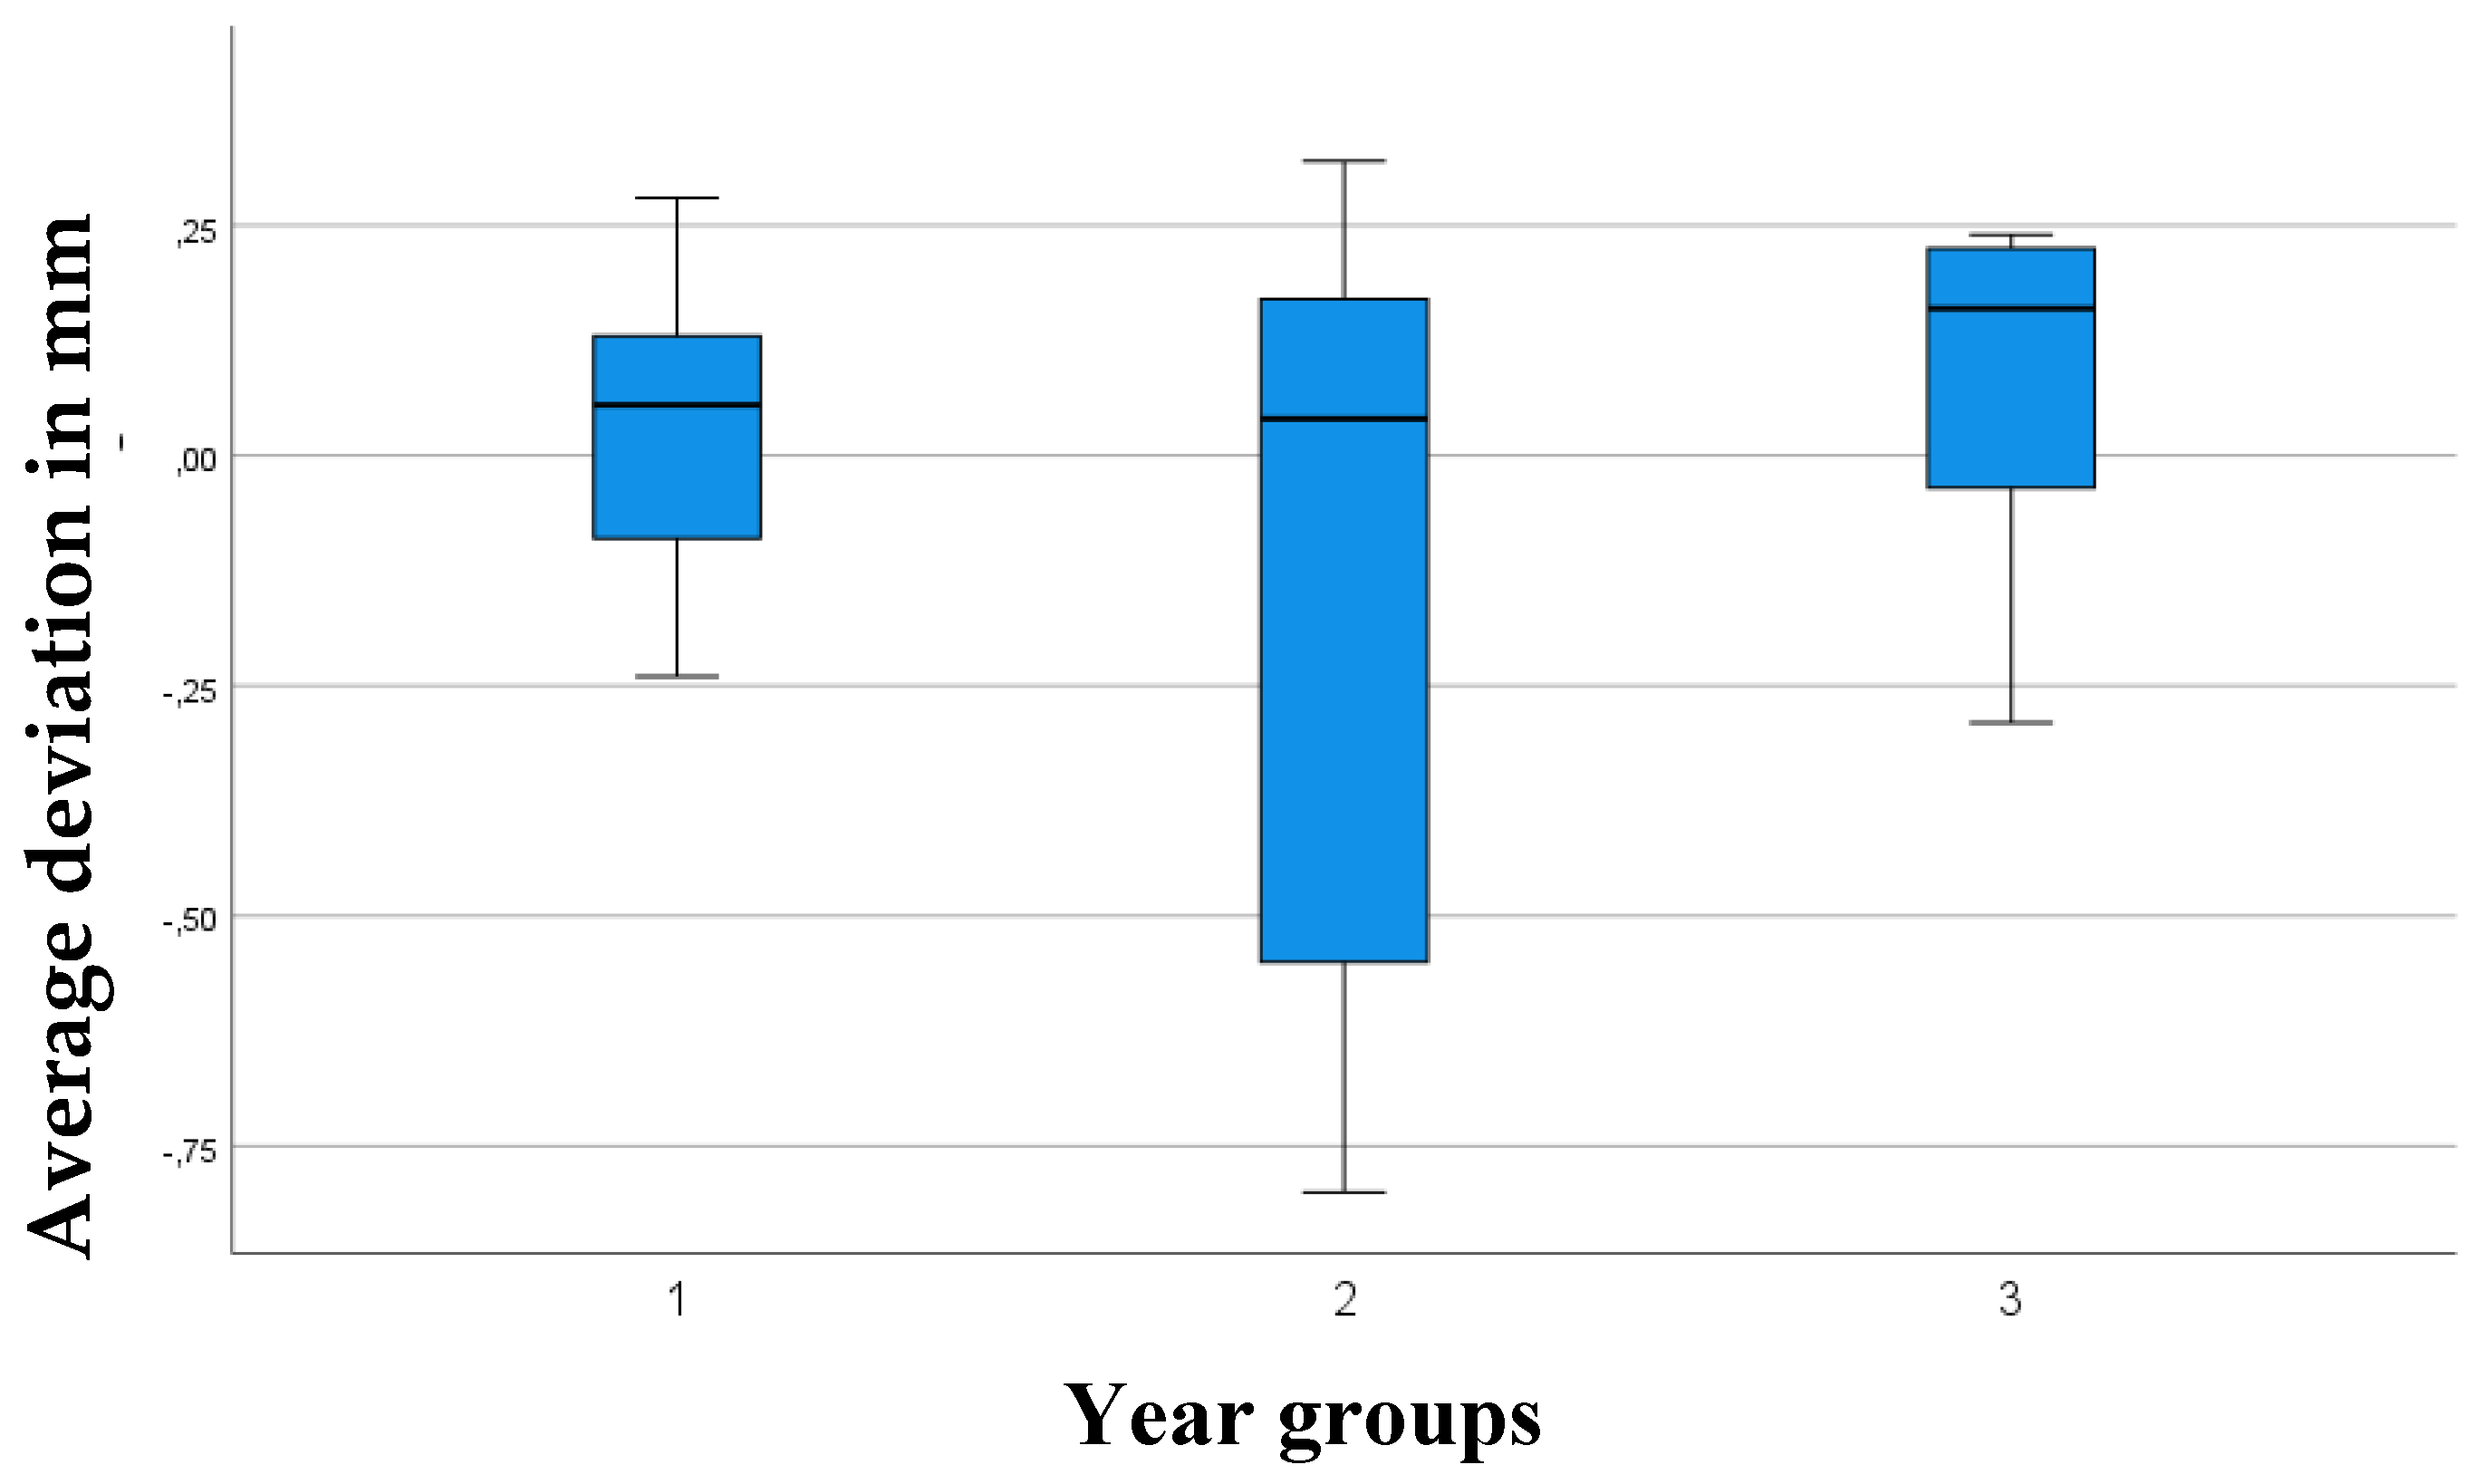
Figure 7.
The box plot shows the average deviation between the two data sets of the digital volume tomography of the left and right torus mandibularis in relation to the past years (3-9 years) between the images on a scale of -0.75 millimeters to 0.25 millimeters including outliers (point). Year 6 breaks out of the upward trend of years 3-5.
Disclaimer/Publisher’s Note: The statements, opinions and data contained in all publications are solely those of the individual author(s) and contributor(s) and not of MDPI and/or the editor(s). MDPI and/or the editor(s) disclaim responsibility for any injury to people or property resulting from any ideas, methods, instructions or products referred to in the content. |
© 2025 by the authors. Licensee MDPI, Basel, Switzerland. This article is an open access article distributed under the terms and conditions of the Creative Commons Attribution (CC BY) license (http://creativecommons.org/licenses/by/4.0/).
Copyright: This open access article is published under a Creative Commons CC BY 4.0 license, which permit the free download, distribution, and reuse, provided that the author and preprint are cited in any reuse.


