
Submitted:
18 January 2025
Posted:
20 January 2025
You are already at the latest version
Abstract
Mandibular tori (bilateral, asymptomatic, lingual mandibular protuberances) often remain untreated. When considering surgical resection, understanding the shape, size, and position of the tori at bone level is crucial. However, collecting accurate information regarding these characteristics is challenging in cases where the oral mucosa is prominent on the floor of the mouth. We conducted retrospective surveys at Fukuoka Dental College Medical and Dental General Hospital using computed tomographic (CT) image analysis software. The specific aims of this study were to evaluate the appearance rate of mandibular tori by morphological type, size, location, and CT values, and their relationship with the remaining teeth in 1,176 patients. These patients underwent simple mandibular CT tomography. We used t-tests to analyze the data. Approximately 10% of the identified tori were pedunculated and difficult to diagnose by visual inspection alone. In all age groups > 30 years, patients with mandibular tori had a lower rate of tooth loss and a higher rate of remaining occlusal support than healthy subjects. The mean CT value of the mandibular tori was > 1,350 Hounsfield units (HU). These findings provide insights into future classification and treatment planning for mandibular tori, such as mandibular ridge resection and factors that may contribute to mandibular torus development or progression, and validate the use of excised bone tissue as a bone graft material.
Keywords:
mandibular tori
; computed tomography
; morphological analysis
; CT value
; autogenous bone graft material
; remaining teeth
1. Introduction
Mandibular tori are asymptomatic bulges of the jawbone that commonly occur between the canines and premolars on the lingual side of the mandible [1,2,3,4]. The prevalence of mandibular tori varies by region and age, with incidences of 5.2%-18.8% in Europeans [5,6], 12.1% in Africans [7], and 9.2–29.9% in Asians [5,8], with most cases affecting people aged 30–50 years. In Japan, 26.5% of the studies on mandibular tori targeted people over 60 years of age, whereas 58.3% of the studies targeted young dentate adults [9,10]. Mandibular tori usually present with few symptoms; therefore, treatment is usually limited to follow-up and observation. However, depending on their size, shape, and area of occurrence, they may interfere with dental treatment and daily living [11,12]. Specifically, the mandibular tori can interfere with the design or removal of mandibular dentures [13,14], and plaque control. Mandibular tori have also been reported to cause sleep apnea [15,16]. Surgical resection was performed in these patients. Mandibular torus is usually diagnosed via inspection and palpation of the oral cavity [17,18]. X-ray examinations are also commonly used but are not very effective. Indeed, studies and classifications of the morphology of the mandibular tori by Jainkittivong et al., Eggen et al., and Monica et al. made diagnoses based on inspection and palpation during intraoral examinations [19,20,21].
However, the mandibular tori are typically covered by oral mucosa. Therefore, when a mandibular torus is located beneath the mucosa lining the floor of the mouth or develops into a pedunculated shape, accurately characterize the protuberance becomes difficult. Incorrect determination of the torus shape may lead to inaccurate information being obtained during preoperative examination prior to surgical resection [22,23] and treatment planning or improper setting of the incision line. Therefore, developing an appropriate method to accurately determine the location, size, and morphology of mandibular tori is essential. We utilized the computed tomographic (CT) image analysis software SIMPLANT® by Dentsply Sirona, which offers accurate three-dimensional image construction and detailed image resolution. This software, frequently used in treatment planning for dental implants, can recognize the three-dimensional morphology of hard tissue and calculate bone volume and density [24,25]. This information is related to the position and size of the gingival incision used for flap deployment during the resection of the mandibular torus.
This study aimed to provide a clinically relevant reference for determining the necessity of investigation and interventions in the treatment of mandibular tori and to obtain information that would help in concluding whether the presence of teeth and occlusal forces is associated with the appearance of mandibular torus. To date, no studies have applied CT analysis software to large-scale surveys of the incidence, size, and shape of mandibular tori. Therefore, we used a CT image analysis software to investigate the location, size, morphology, and bone density of the mandibular tori in more detail. The investigators hypothesized that this large-scale investigation, using CT analysis software, would enable a more accurate epidemiological study regarding the shape, size, and location of mandibular prominences, especially when located deep in the floor of the mouth. The specific aim of this study was to investigate the appearance rate of mandibular tori by morphological type, accurate size, location in terms of vertical position, and CT values, which are difficult to diagnose accurately by visual inspection of the oral cavity alone. Based on this information, they determined the depth of the mandibular tori at which oral functioning was affected and the likelihood of protuberance during resectioning. Another aim of this study was to compare the tooth loss and residual occlusal support rates.
2. Materials and Methods
2.1. Participants
Data were obtained from patients who underwent plain mandibular computed tomography (CT) at the Department of Radiology, Fukuoka Dental College Hospital between April 1, 2015, to March 31, 2020. A total of 2,158 people were eligible, with 147 randomly selected from the teenage group, which had the lowest number of patients. An equal number of 147 individuals were selected from each of the other age groups to ensure a consistent sample size across all age groups. Those aged 80 years were placed in a separated group, and a total of 1,176 people were surveyed. Medical records and CT images from our hospital were used for the survey. To identify and evaluate the mandibular tori, clinical evaluations based on intraoral findings by physicians and radiographic interpretation reports by radiology technicians were performed. The survey contents included age at the time of CT imaging, sex, presence or absence of a mandibular torus, and detailed information on the mandibular torus (site of occurrence, thickness, shape, volume, and bone density). Detailed information on the mandibular ridge was obtained by converting the files into three-dimensional CT images using SIMPLANT® (Dentsply Sirona) (Figure 1). Patients who underwent CT were included if the imaging was conducted to (1) obtain accurate diagnoses before implant placement surgery, (2) understand the positional relationship between the impacted mandibular wisdom teeth and the mandibular canal, (3) diagnose residual apical tooth lesions and cysts, and/or (4) identify the presence and extent of fracture lines at the time of trauma. The subjects were patients who underwent plain CT imaging of the mandible to diagnose pathological conditions that did not cause major anatomical changes and to formulate treatment plans. The following participants were excluded: 1) those whose continuity of normal cortical bone was lost due to trauma, tumors, or tumorous bone swelling; 2) those with a history of surgical jawbone reshaping and tumor resection; 3) those who refused to participate in the study; and/or 4) those judged unsuitable as research subjects.
2.2. Classification of Morphology and Size
The morphologies of the mandibular tori were classified as types I to IV according to the classification method used in previous studies [1,21,22] (Figure 2). The thickness of the torus was measured from the outline of the normal cortical bone to the crest of the ridge (Figure 3) and was classified into the following categories in accordance with previous studies [17,22,26]: <3 mm, mild; 3–6 mm, moderate; 6 mm or more, severe. When the mandibular torus was polycystic, it was classified on the basis of its thickness.
2.3. Bone Density Assessment
The CT value of the mandibular torus was the mean of the CT values measured at the base, center, and top of the bone (Figure 4). Three points on the cortical bone, without any obvious bulging, were arbitrarily selected and measured, with the mean of these values was used as the control value. The apical positions of the teeth were demarcated on the cross-sectional plane to provide a reference for the vertical position of the tori. The bone on the coronal side of this line was considered the alveolar bone, and the bone on the apical side was considered the mandibular bone.
2.4. Definition of Remaining Teeth and Occlusal Support
Regarding the presence or absence of remaining teeth, those whose roots were found to remain, regardless of the condition of the crown, were considered to have remaining teeth. Areas where implants were applied were classified as “remaining teeth.” Fixed bridge pontics were classified as “no remaining teeth.” Molars that underwent root resection, hemisection, trisection, or root separation were also classified as “remaining teeth.” As for the definition of occlusal relationship, cases in which the same type of tooth was found to remain in the upper and lower jaws on the same side of the left and right were defined as “occlusal support relationship.”
2.5. Statistical Methods
A t-test was used to analyze the collected data, with the significance level set at p < 0.05.
3. Results
3.1. Prevalence of Mandibular Tori
Of the 1,176 patients, 334 (28.4%) had mandibular tori, and 79.5% had bilateral tori. The prevalence of mandibular tori increased and then decreased with age, peaking in patients in their 40s (Table 1). Specifically, tori were observed in 49.7% of people in their 40s, which was the highest incidence rate, followed by 40.1% of people in their 50s and 39.5% of people in their 30s.
3.2. Frequently Occurring Site of Mandibular Tori
Of all tori, 84.9% appeared in the canine-premolar region (Figure 5). The incidence was the highest in the first premolar region, accounting for 32.3% of all cases. Regarding vertical position, more than 80% of the lesions were localized in the alveolar bone across all age groups.
3.3. Appearance Rate of Mandibular Tori by Morphological Type
Regarding tori morphology, the monocystic and stemless types were the most common (57.9%); 5.47% of mandibular tori were of the monocystic and pedunculated types, and 5.17% were of the multivesticular and pedunculated types (Figure 6). In total, 10.5% of the mandibular tori were of the pedunculated type, which is often difficult to accurately diagnose by visual inspection of the oral cavity alone. Regarding size classification, > 50% of cases across all age groups were classified as mild. Among the patients in their 30s, 50s, and 60s, > 40% were classified as moderate. The most prominent mandibular tori measured 10.5 mm from the base to the point of maximum protrusion. Investigations of the tori volume revealed a maximum volume of 1826 mm3.
3.4. Bone Density of Mandibular Tori and Healthy Cortical Bone
When compared with the control group, the mean CT value of the mandibular tori was approximately 200 HU (Hounsfield Unit, a unit used in CT to measure the X-ray attenuation coefficient and, subsequently, bone density) lower in individuals aged up to 80 years (from their 10s to 70s). This difference was significant (Figure 7). Across all age groups, the mandibular tori had an average bone density greater than 1350 HU.
3.5. Comparison of Mandibular Tori and Tooth Loss Rate
In all age groups (> 30 years), patients with mandibular tori had a lower rate of tooth loss than the healthy subjects. A statistically significant difference was observed, especially in the groups aged > 50s, 70s, and 80s and older groups (Figure 8). Comparing the percentage of missing teeth by tooth type, the percentage of missing teeth of all tooth types was lower in patients with mandibular torus compared to healthy subjects, especially in their 40s and older. Similarly, when comparing the area from the canine to the premolar region, which is the most common site of mandibular torus, the proportion of missing teeth was lower in patients with mandibular torus than in healthy subjects in all age groups. Statistically significant differences were observed in the 50s, 70s, 80s, and older groups (Figure 9). These relationships did not differ significantly between sexes.
3.6. Comparison of Mandibular Tori and Occlusal Support
In patients with mandibular tori, occlusal support relationships were maintained for all tooth types in all groups aged 30 years or older. In all age groups > 30 years, the rate of remaining occlusal support was higher in patients with mandibular torus than in healthy subjects, and statistically significant differences were observed in the 30s, 60s, and older age groups (Figure 10). Similarly, in the canine to premolar region, a comparison of the proportion of patients who maintained occlusal support showed that patients in their 30s and older had better occlusal support than healthy subjects, with a statistically significant difference observed in those in their 60s and older (Figure 11). Among the patients with mandibular torus, only one patient in the 60s group had an occlusal support number below 5 for both the upper and lower jaws; no other cases were observed. Edentulous jaws in both the upper and lower jaws were found in 6.1% of healthy individuals in their 60s and 11.1 percent of the patients were in their 70s, and 17.2% were over 80 years of age, but no mandibular torus cases were observed in any age group. These results differ from those of a previous study that investigated the incidence of mandibular torus in edentulous individuals.
4. Discussion
This study aimed to evaluate the incidence, site of occurrence, shape, volume, and CT values of mandibular tori in 1,176 patients using CT analysis software. The main reason is the difficulty in accurately characterizing the mandibular ridge when it is beneath the mucous membrane of the floor of the mouth; therefore, detailed characterization by three-dimensional analyses is considered necessary. In this study, three-dimensional analyses were performed using CT analysis software to obtain accurate information regarding the shape, size, and location of each mandibular torus at the bone level. Of all tori, 10.5% were of the pedunculated type. Regarding vertical position, more than 80% of the lesions were localized in the alveolar bone. The incidence was the highest in the first premolar region, accounting for 32.3% of all cases. The most prominent mandibular tori had a bulge of 10.5 mm, and a maximum volume of 1826 mm3. Accurately diagnosing this condition through visual inspection of the oral cavity alone is challenging. However, mandibular tori can be excised relatively easily by resecting them at the base. However, if the torus is not pedunculated or is located from the alveolar bone area to the body of the mandible, a larger incision surface area is required to fully resect the torus, which increases the technical difficulty of the procedure and burden on the patient. The extent of gingival mucosa required for resection may vary from case to case. Therefore, the results of our study emphasize the importance of using CT analysis software for preoperative examinations when performing mandibular torus resection. A notable component of this study was that the CT analysis software was applied to over 1,000 participants. This allowed us to accurately classify the size and morphology of the tori and compare the bone density between the torus and healthy bone in the same patient. Jean-Daniel et al. performed a morphological analysis of the mandibular tori using micro-CT [27]; however, the sample size was very small (n=16). Conversely, in this study, morphological analysis via CT was performed on 334 patients with mandibular tori. Our larger sample size increased the statistical validity of our findings. In a systematic review of the incidence of mandibular tori by Garcia-Garcia et al. [1], all 13 cited studies used visual inspection and palpation to diagnose mandibular tori [6,7,18,19,26,28]. Thus, no previous studies have investigated the incidence and common sites of mandibular tori in a large patient pool using CT analysis software. Furthermore, in our image analysis pipeline, we extracted and calculated only the volumes of the mandibular tori. In previous studies, most methods for estimating torus size involved measuring the distance to the maximum bulge point of the torus [10,13,17,21,27]. In this study, in addition to the measurement method, mandibular tori were digitally extracted, and the volume of this portion was calculated. Therefore, this method proved valid for determining the scale of the entire mandibular torus. CT image analysis can also be used to accurately determine the bone density using CT values [25,29]. Youna et al. investigated the thickness and CT values of the mandibular tori using CT image analysis [24]. However, in our study, we compared the densities of the mandibular tori and healthy bones. Therefore, from a radiological perspective, we could discern whether each mandibular torus was merely a swelling of the cortical bone or a tumor with a distinct tissue structure.
In this study, the mandibular torus occurred within the range of the canine to the premolar, and over 80% of cases occurred within the range of the alveolar bone. In addition, the rate of tooth loss was significantly lower in patients with mandibular torus in their 40s and older. This suggests that the occurrence of mandibular torus may be closely related to the presence of the remaining teeth and alveolar bone. Consequently, the conclusions of previous studies [6,27] were confirmed more concretely through this survey. The older the age group, the greater the difference in the proportion of missing teeth between patients with torus and healthy subjects. This may be because the proportion of people with missing teeth was low in younger age groups; therefore, the difference in the proportion of missing teeth between torus patients and healthy subjects was small, and the proportion of people with missing teeth generally increased as the age group increased. The rate at which the occlusal support relationship was maintained was significantly higher in patients with mandibular torus than in healthy subjects, suggesting a relationship between the development of mandibular torus and occlusal support. Previous research has shown that the occurrence of mandibular torus is significantly related to the wear of the remaining teeth and position of the occlusal contacts [9], which may support the findings of this study.
The novelty of this study is that it examined the relationship between the appearance of the mandibular torus and the remaining teeth when examining all tooth types as the target area and when examining only the canine to premolar area, where the mandibular torus is most likely to appear. As a result, similar trends were observed when examining the entire oral cavity, and when examining only the canine to premolar area, a statistically significant difference was observed. This tendency was observed both when comparing the appearance rate of the mandibular torus with the rate of tooth loss and when comparing the appearance rate of the mandibular torus with the presence of occlusal support. In other words, it was suggested that similar results were obtained when examining the presence or absence of remaining teeth in the area where mandibular torus is most likely to appear and when examining the presence or absence of remaining teeth in the entire oral cavity. This can also be explained by the importance of examining the number of remaining teeth and the presence or absence of occlusal relationships in the entire oral cavity. Therefore, investigating the occurrence rate of mandibular torus and the number of remaining teeth in the entire oral cavity will support the findings of previous studies that have pointed out the possibility of a relationship between mandibular torus and the remaining teeth, occlusal relationship, and biting force [6,30]. Recent studies have explored the relationship between parafunctional activities, such as bruxism, and the incidence of mandibular torus [8,31]. Previous reports have shown that tooth loss eliminates the stimulation of the alveolar bone, causing a loss of bone width and height [32,33]. A follow-up study of edentulous patients showed that the mandible underwent greater resorption than the maxilla [34].
The excised mandibular tori are usually discarded. However, in recent years, they have also been used for the pretreatment of prosthetics at sites scheduled for implantation surgery [35,36,37,38,39]. In addition, some case reports have described the use of excised tori as autogenous bone grafts to treat the vertical alveolar bone density, which is important for determining the extent of bone recovery from autogenous bone grafting. Histological evaluation of the mandibular tori has been reported to indicate autologous bone graft material [40]. However, a detailed radiological investigation of mandibular tori has not yet been conducted. Hounsfield unit (HU) is a radiographic measure of bone density [29]. The CT values of the mandibular tori were significantly lower than those of the healthy cortical bone in each age group; however, the average value was over 1350 HU. This corresponds to “Grade: D1” (1250 HU or more), considered the most predictable in Misch’s bone quality classification [29]. Therefore, it was suggested that the mandibular tori have densities that are considered normal on radiography. Thus, our findings provide a scientific basis for the application of mandibular tori as bone graft material.
The retrospective design of this study, which used data collected from past patient records and CT images, may have introduced patient selection bias and limited the reliability of the data collection methods and patient characteristics. In addition, the study included patients who underwent plain mandibular CT scans, which limits its generalizability and excluded cases of mandibular tori diagnosed using methods other than CT. Thus, the results do not reflect the true prevalence of mandibular tori. Furthermore, a monomodal diagnostic approach does not consider other diagnostic methods or clinical evaluations that may provide complementary information. In addition, in cases in which CT scans were performed within a short period after the loss of the remaining teeth located at the site where the mandibular torus developed, the mandibular torus was considered to have developed at the site where the teeth were missing. Therefore, the validity of analyzing the relationship between the presence of mandibular torus and the presence of remaining teeth or the presence or absence of occlusal support may be reduced. However, due to the limited number of studies employing this research design, this information is important in considering the possibility that mechanical factors, such as the presence of remaining teeth and occlusal support, are involved in the development and maintenance of the mandibular torus. Furthermore, the number of remaining teeth and the presence or absence of occlusal support in the area from the canine to the premolar, which is the most common site for mandibular torus, represents a highly novel aspect of this study.
This study allowed us to investigate the shape-positional relationship of the mandibular tori in more detail. More detailed information is required to understand this relationship, and the importance of CT analysis in software-based investigations has been emphasized. Furthermore, although radiological bone density was evaluated in this study, we need to conduct further histological evaluations and investigate the differences in constituent cells and gene expression when considering the application of excised mandibular tori as an autogenous bone graft material.
Using a CT analysis software, we obtained detailed information on the shape, size, and location of the mandibular tori. Approximately 10% of all cases include pedunculated tori, the morphology of which is difficult to characterize by visual inspection and palpation alone. This emphasizes the importance of preoperative testing and epidemiological surveys using CT image analysis software. The bone density of the mandibular tori was significantly lower than that of the healthy cortical bone; however, the average bone density was over 1350 HU, which is sufficient for implant placement. Thus, the results of this study reinforce the scientific validity of using resected tori as bone graft material.
Author Contributions
Conceptualization, T. M. and K. S.; methodology, K. S.; software, K. M.; validation, K. S., K. M., and Y. M.; formal analysis, K. S. and K. M.; investigation, K.S., K.M., and Y. M.; resources, T. K.; data curation, K. S.; writing—original draft preparation, K. S.; writing—review and editing, K.S., and T. M.; visualization, K. S.; supervision, T. M.; project administration, K. S.; funding acquisition, T. M. All authors have read and agreed to the published version of the manuscript.
Funding
This study received no external funding.
Institutional Review Board Statement
The study protocol was approved by the Fukuoka Gakuen Institutional Review Board (IRB; approval number 514) and complied with the Declaration of Helsinki.
Informed Consent Statement
Because collected information was intended for research use, it was posted on the Fukuoka Dental University Hospital website, and research participants and/or their guardians were provided with an opportunity to opt out of participation.
Data Availability Statement
The Data presented in this study are available upon request.
Acknowledgments
The authors thank all the researchers and participants of this study for their time, willingness, and cooperation.
Conflicts of Interest
The funders had no role in the study design; collection, analyses, or interpretation of data; writing of the manuscript; or decision to publish the results.
References
- García- García, A.S.; Martínez-González, J-M.; Gómez-Font, R.; Soto-Rivadeneira, A.; Oviedo-Roldán, L. Current status of the torus palatinus and torus mandibularis. Med Oral Patol Oral Cir Bucal. 2010, 15, e353–360. [Google Scholar] [CrossRef] [PubMed]
- Hiremath, V.K.; Husein, A.; Mishra, N. Prevalence of torus palatinus and torus mandibularis among Malay population. J Int Soc Prev Community Dent. 2011, 1, 60–64. [Google Scholar] [CrossRef] [PubMed]
- Chaubal, T.V.; Bapat, R.; Poonja, K. Torus mandibularis. Am J Med. 2017, 130, e451. [Google Scholar] [CrossRef]
- Mermod, M.; Hoarau, R. Mandibular tori. CMAJ. 2015, 187, 826. [Google Scholar] [CrossRef] [PubMed]
- Reichart, P.A.; Neuhaus, F.; Sookasem, M. Prevalence of torus palatinus and torus mandibularis in German and Thai. Community Dent Oral Epidemiol. 1988, 16, 61–64. [Google Scholar] [CrossRef] [PubMed]
- Eggen, S.; Natvig, B. Relationship between torus mandibularis and number of present teeth. Scand J Dent Res. 1986, 94, 233–240. [Google Scholar] [CrossRef] [PubMed]
- Bruce, I.; Ndanu, T.A.; Addo, M.E. Epidemiological aspects of oral tori in a Ghanaian community. Int Dent J. 2004, 54, 78–82. [Google Scholar] [CrossRef] [PubMed]
- Kerdpon, D.; Sirirungrojying, S. A clinical study of oral tori in southern Thailand: prevalence and the relation to parafunctional activity. Eur J Oral Sci. 1999, 107, 9–13. [Google Scholar] [CrossRef]
- Morita, K.; Tsuka, H.; Shintani, T.; Yoshida, M.; Kurihara, H.; Tsuga, K. Prevalence of torus mandibularis in young healthy dentate adults. J Oral Maxillofac Surg. 2017, 75, 2593–2598. [Google Scholar] [CrossRef]
- Yoshinaka, M.; Ikebe, K.; Furuya-Yoshinaka, M.; Maeda, Y. Prevalence of torus mandibularis among a group of elderly Japanese and its relationship with occlusal force. Gerodontology. 2014, 31, 117–122. [Google Scholar] [CrossRef]
- Lame, E.L. Torus mandibularis. Am J Roentgenol Radium Ther Nucl Med. 1964, 91, 1024–1025. [Google Scholar] [PubMed]
- Sathya, K.; Kanneppady, S.K.; Arishiya, T. Prevalence and clinical characteristics of oral tori among outpatients in Northern Malaysia. J Oral Biol Craniofac Res. 2012, 2, 15–19. [Google Scholar] [CrossRef]
- Kumar, D.R.; Malik, D.M.; Laller, D.S.; Priti, D. Bilateral torus mandibularis: a case report with mini review. Int J Clin Diagn Pathol. 2018, 1, 27–28. [Google Scholar] [CrossRef]
- AlZarea, B.K. Prevalence and pattern of torus palatinus and torus mandibularis among edentulous patients of Saudi Arabia. Clin Interv Aging. 2016, 11, 209–213. [Google Scholar] [CrossRef] [PubMed]
- Saffran, A.J.; Clark, R.F. Torus mandibularis: an unusual cause of obstructive sleep apnea. Ear Nose Throat J. 2004, 83, 324. [Google Scholar] [CrossRef]
- Ahn, S.H.; Ha, J-G.; Kim, J.W.; Lee, Y.W.; Yoon, J-H.; Kim, C-H.; Cho, H-J. Torus mandibularis affects the severity and position-dependent sleep apnoea in non-obese patients. Clin Otolaryngol. 2019, 44, 279–285. [Google Scholar] [CrossRef] [PubMed]
- Al-Bayaty, H.F.; Murti, P.R.; Matthews, R.; Gupta, P.C. An epidemiological study of tori among 667 dental outpatients in Trinidad and Tobago, West Indies. Int Dent J. 2001, 51, 300–304. [Google Scholar] [CrossRef]
- Haugen, L.K. Palatine and mandibular tori. A morphologic study in the current Norwegian population. Acta Odontol Scand. 1992, 50, 65–77. [Google Scholar] [CrossRef]
- Jainkittivong, A.; Apinhasmit, W.; Swasdison, S. Prevalencce and clinical characteristics of oral tori in 1,520 Chulalongkorn University Dental School patients. Surg Radiol Anat. 2007, 29, 125–131. [Google Scholar] [CrossRef]
- Eggen, S.; Natvig, B. Variation in torus mandibularis prevalence in Norway. A statistical analysis using logistic regression. Community Dent Oral Epidemiol. 1991, 19, 32–35. [Google Scholar] [CrossRef]
- Scrieciu, M.; MercuŢ, V.; MercuŢ, R.; Bîrjovanu, C.; Stan, M.C.; Marinescu, I.R.; Niculescu, M.; Iorgulescu, D.; Bătăiosu, M. Morphological and clinical characteristics of the torus palatinus and torus mandibularis in a sample of young and adult’s Romanian people. Rom J Morphol Embryol. 2016, 57, 139–144. [Google Scholar]
- Goncalves, T.M.; de Oliveira, J.A.; Sanchez-Ayala, A.; Rodrigues Garcia, R.C. Surgical resection and prosthetic treatment of an extensive mandibular torus. Gen Dent. 2013, 61, 65–68. [Google Scholar]
- Sonnier, K.E.; Horning, G.M.; Cohen, M.E. Palatal tubercles, palatal tori, and mandibular tori: prevalence and anatomical features in a U.S. population. J Periodontol. 1999, 70, 329–336. [Google Scholar] [CrossRef]
- Choi, Y.; Park, H.; Lee, J-S.; Park, J-C.; Kim, C-S.; Choi, S-H.; Cho, K-S.; Chai, J-K.; Jung, U-W. Prevalence and anatomic tomography of mandibular tori: computed tomographic analysis. J Oral Maxillofac Surg. 2012, 70, 1286–1291. [Google Scholar] [CrossRef]
- Kün-Darbois, J.D.; Guillaume, B.; Chappard, D. Asymmetric bone remodeling in mandibular and maxillary tori. Clin Oral Investig. 2017, 21, 2781–2788. [Google Scholar] [CrossRef]
- Eggen, S.; Natvig, B. Concurrence of torus mandibularis and torus palatinus. Scand J Dent Res. 1994, 60–63. [Google Scholar] [CrossRef] [PubMed]
- Eggen, S. Correlated characteristics of the jaws: association between torus mandibularis and marginal alveolar bone height. Acta Odontol Scand. 1992, 50, 1–6. [Google Scholar] [CrossRef] [PubMed]
- Sirirungrojying, S.; Kerdpon, D. Relationship between oral tori and temporomandibular disorders. Int Dent J. 1999, 49, 101–104. [Google Scholar] [CrossRef]
- Misch, C.E. Density of bone: effect on treatment plans, surgical approach, healing, and progressive bone loading. Int Oral Implantol. 1990, 6, 23–31. [Google Scholar]
- Loren, R.L. Correlations between dental wear and oral cavity characteristics: Mandibular torus, palatine torus, and oral exostoses. Am J Hum Biol. 2021, 33, e23446. [Google Scholar]
- Eduardo, B-S.; Juliana, S-B.; André, L.P.; Bruce, D.; Carlos, F-M.; Daniele, M.; Graziela, D.L.C. Association between signs and symptoms of bruxism and presence of tori: a systematic review. Clin Oral Investig. 2017, 21, 2789–2799. [Google Scholar]
- Pietrokovski, J. The bony residual ridge in man. J Prosthet Dent. 1975, 34, 456–462. [Google Scholar] [CrossRef] [PubMed]
- Carlsson, G.; Persson, G. Morphologic changes of the mandible after extraction and wearing of dentures: a longitudinal clinical and X-ray cephalometric study covering 5 years. Odont Revy. 1967, 18, 27–54. [Google Scholar]
- Tallgren, A. The reduction in face height of edentulous and partially edentulous subjects during long-term denture wear: a longitudinal roentgenographic cephalometric study. Acta Odontol Scand. 1966, 24, 195–239. [Google Scholar] [CrossRef] [PubMed]
- Ganz, S.D. Mandibular tori as a source for onlay bone graft augmentation: a surgical procedure. Pract Periodontics Aesthet Dent. 1997, 9, 973–982. [Google Scholar] [PubMed]
- Wang, C.W.; Haung, C.H.; Grossman, S.H.; Pourati, J. Vertical ridge augmentation with mandibular lingual torus block graft. J Oral Implantol. 2016, 4, 369–372. [Google Scholar] [CrossRef]
- Santhanakrishnan, M.; Rangarao, S. Mandibular Tori: A source of autogenous bone graft. J Indian Soc Periodontol. 2014, 18, 767–771. [Google Scholar] [CrossRef]
- Karaca, I.R.; Ozturk, D.N.; Akinci, H.O. Mandibular torus harvesting for sinus augmentation: two-year follow-up. J Maxillofac Oral Surg. 2019, 18, 61–64. [Google Scholar] [CrossRef]
- Hassan, K.S.; Al-Agal, A.; Abdel-Hady, A.I.; Swelam, W.M.; Elgazzar, R.F. Mandibular tori as bone grafts: an alternative treatment for periodontal osseous defects – clinical, radiographic and histologic morphology evaluation. J Contemp Dent Pract. 2015, 16, 192–200. [Google Scholar] [CrossRef]
- Proussaefs, P. Clinical and histologic evaluation of the use of mandibular tori as donor site for mandibular block autografts: report of three cases. Int Periodontics Restorative Dent. 2006, 26, 43–51. [Google Scholar]
Figure 1.
Identification and analysis of mandibular tori using computed tomography analysis software. The arrow points to the identified mandibular tori. This allows for the evaluation of morphology, size, bone density, etc., at specific locations.
Figure 1.
Identification and analysis of mandibular tori using computed tomography analysis software. The arrow points to the identified mandibular tori. This allows for the evaluation of morphology, size, bone density, etc., at specific locations.
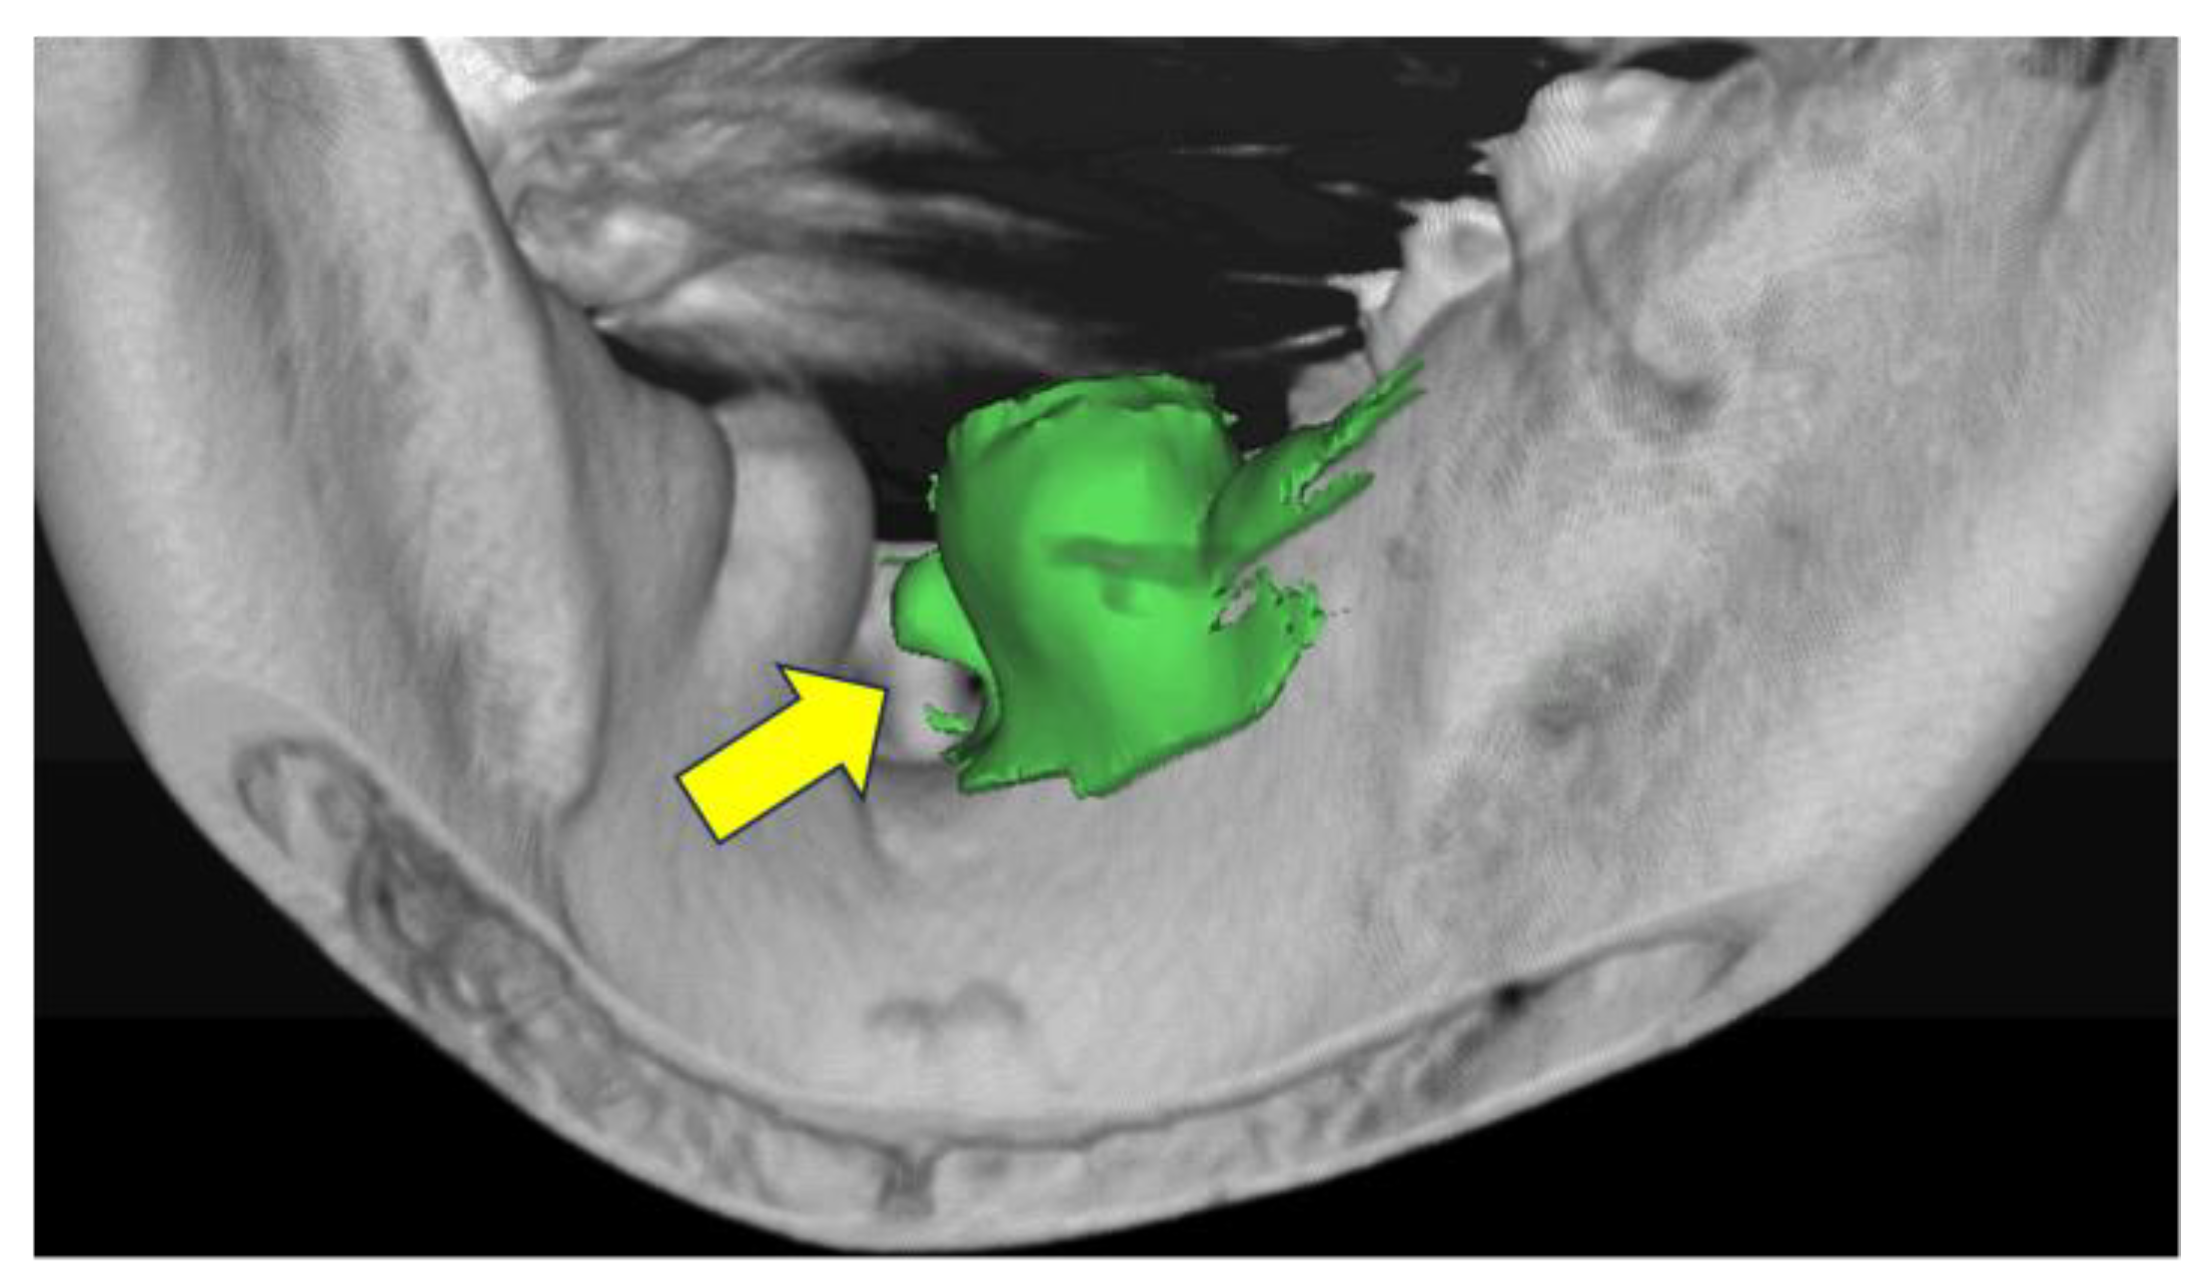
Figure 2.
Morphological classification of mandibular tori by computed tomography images. Mandibular tori were categorized into four types based on their morphology. The examples are displayed in sequence from Type I to Type IV, starting from the left. Type I: Monocystic and stemless (A). Type II: Multivesicular and stemless (B). Type III: Monocystic and pedunculated (C). Type IV: Multivesicular and pedunculated (D).
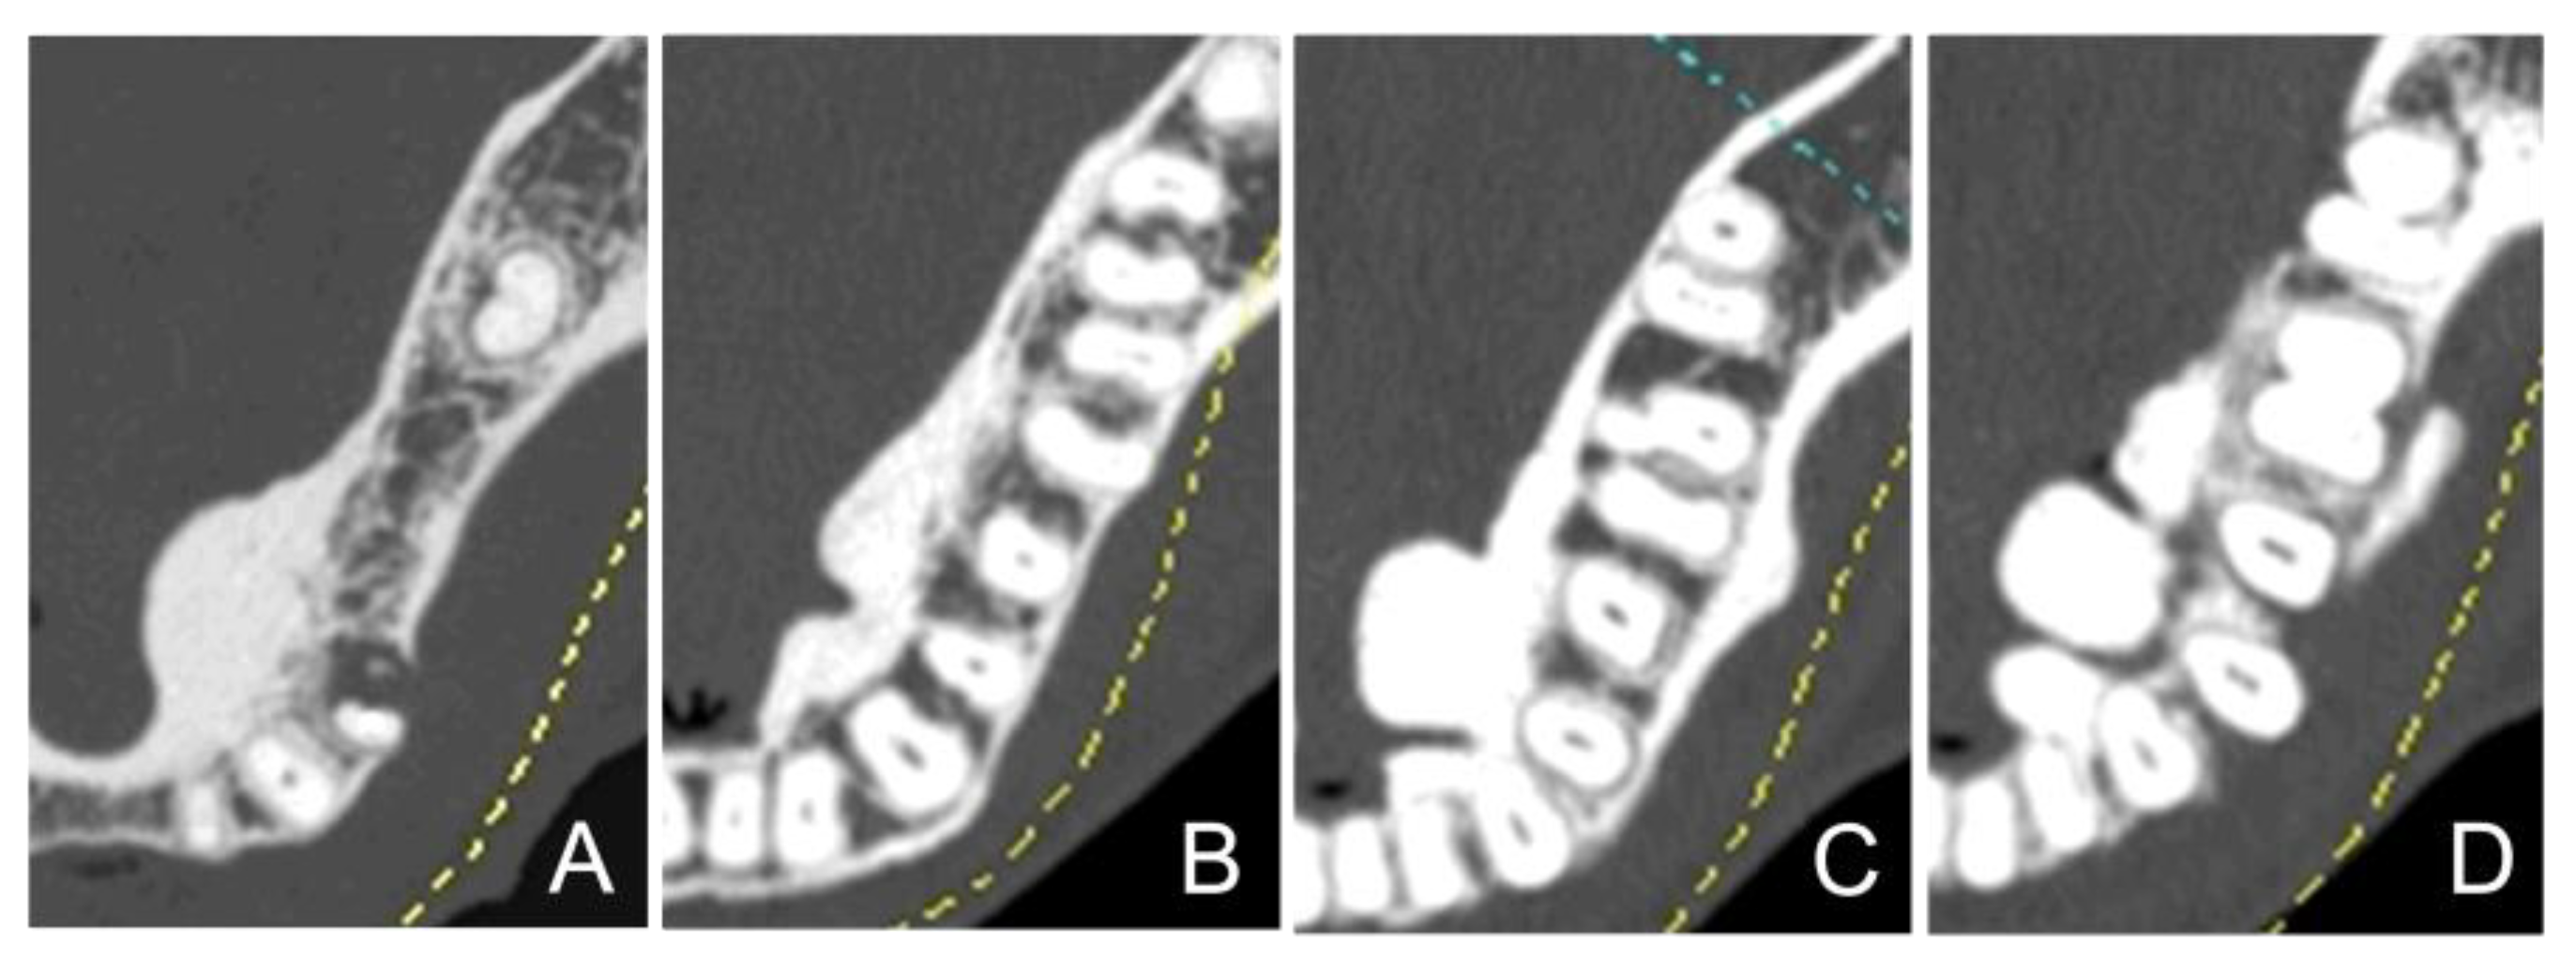
Figure 3.
Measurement points for determining the size of mandibular tori. The distance from the outline of the normal cortical bone (represented by the dotted line in the figure) to the point of maximum protrusion (indicated by the double-headed arrow) was measured. This distance is defined as the size of mandibular tori.
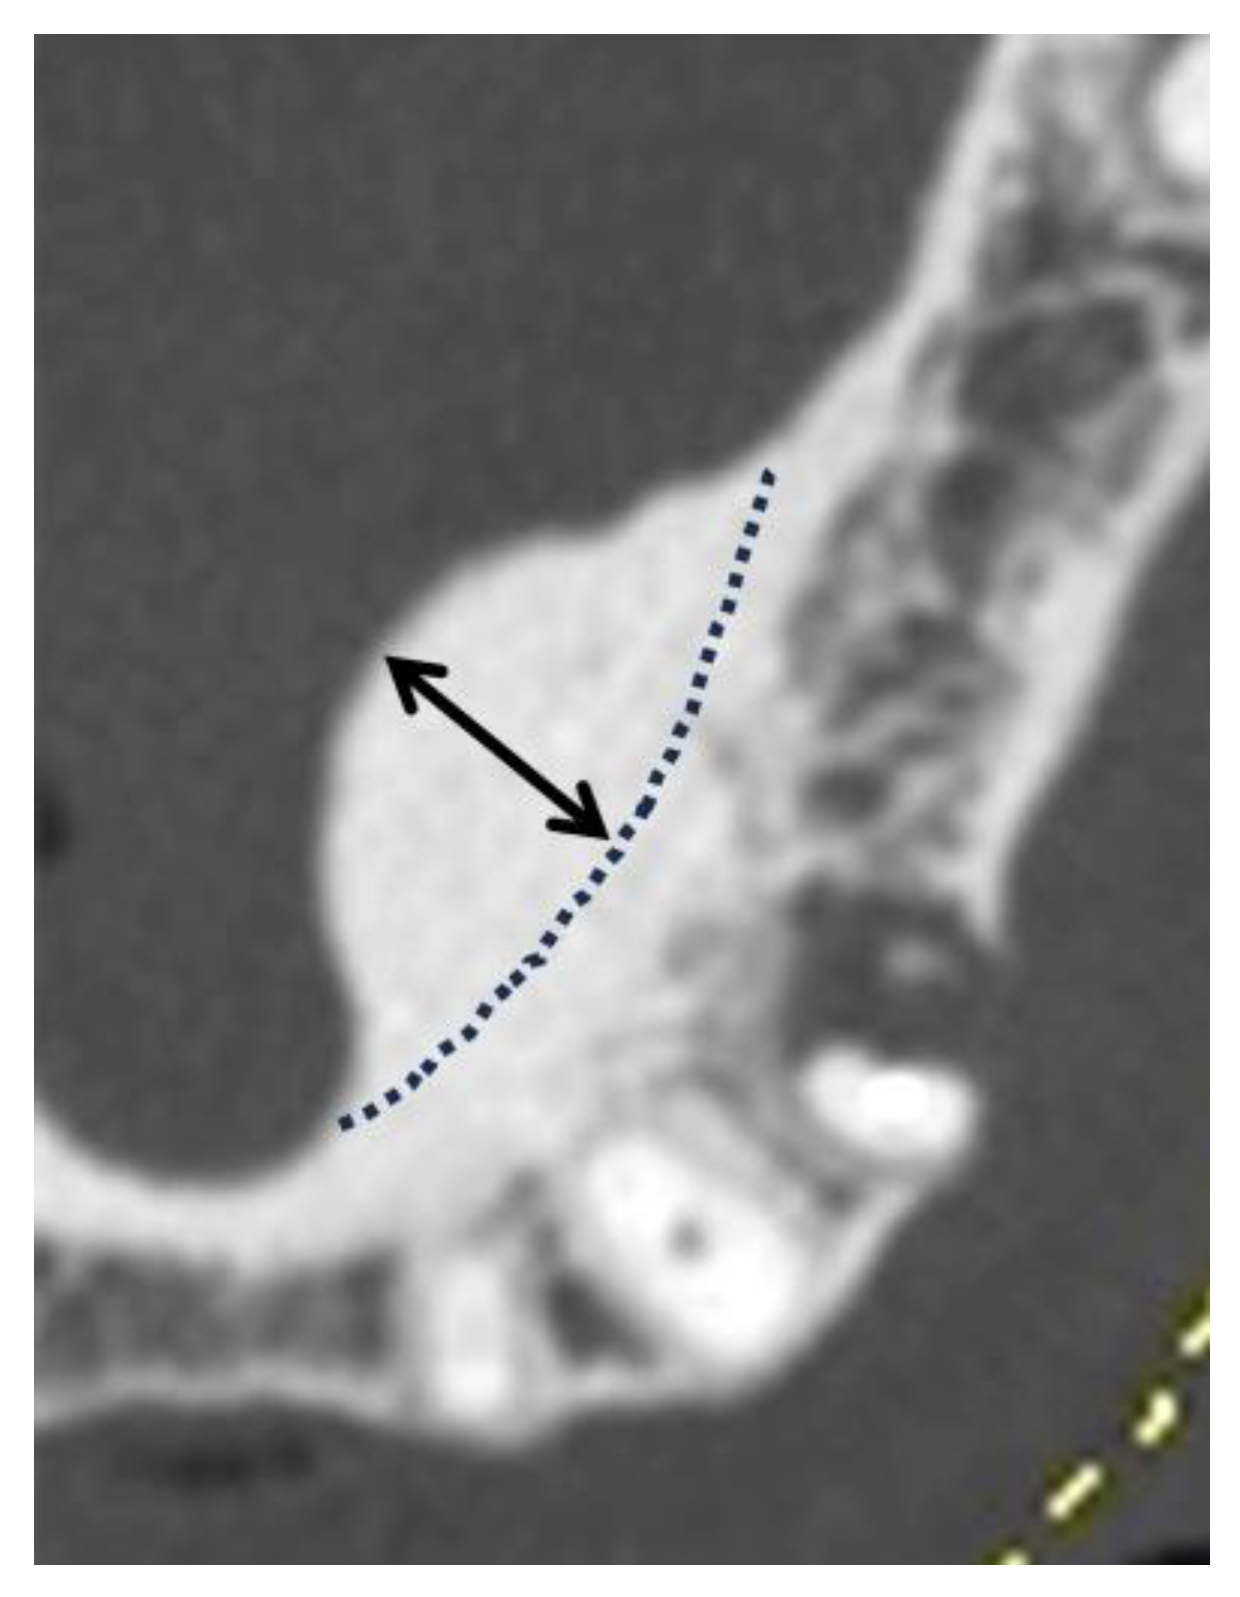
Figure 4.
Computed tomography (CT) value calculation of mandibular tori. (A) A panoramic curve set in the horizontal section of the CT image. (B) A cross-sectional surface in the vertical direction. (C) After setting the boundaries of the expected anatomical cortical bone (dotted line), three areas were defined: 1: The base area, 2: the central area, and 3: the maximum bulge area.
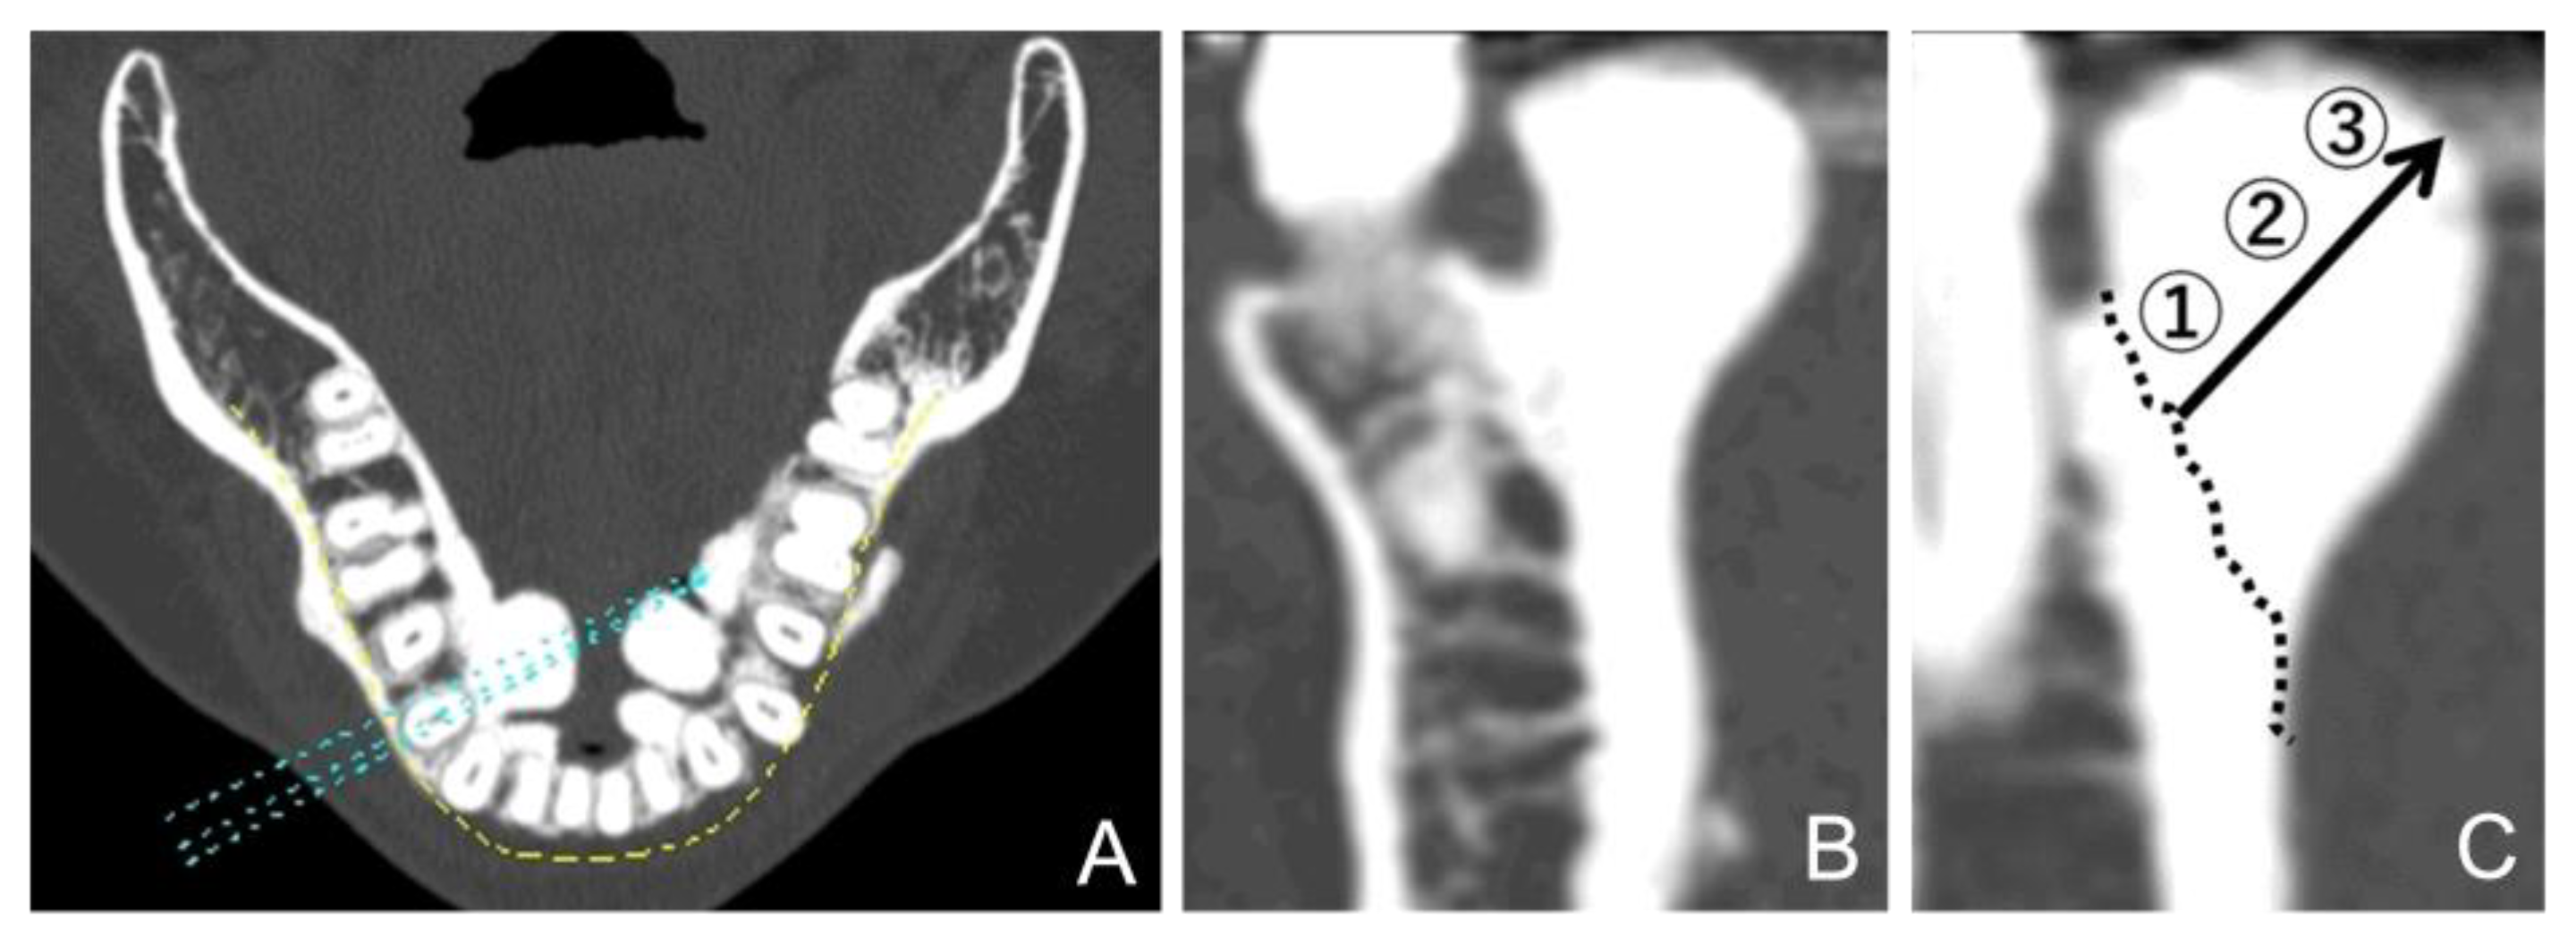
Figure 5.
Prevalence of mandibular tori compared by tooth type area. Values on the horizontal axis indicate the tooth types, presented using the universal numbering system. The vertical axis shows the prevalence (%) of mandibular tori.
Figure 5.
Prevalence of mandibular tori compared by tooth type area. Values on the horizontal axis indicate the tooth types, presented using the universal numbering system. The vertical axis shows the prevalence (%) of mandibular tori.
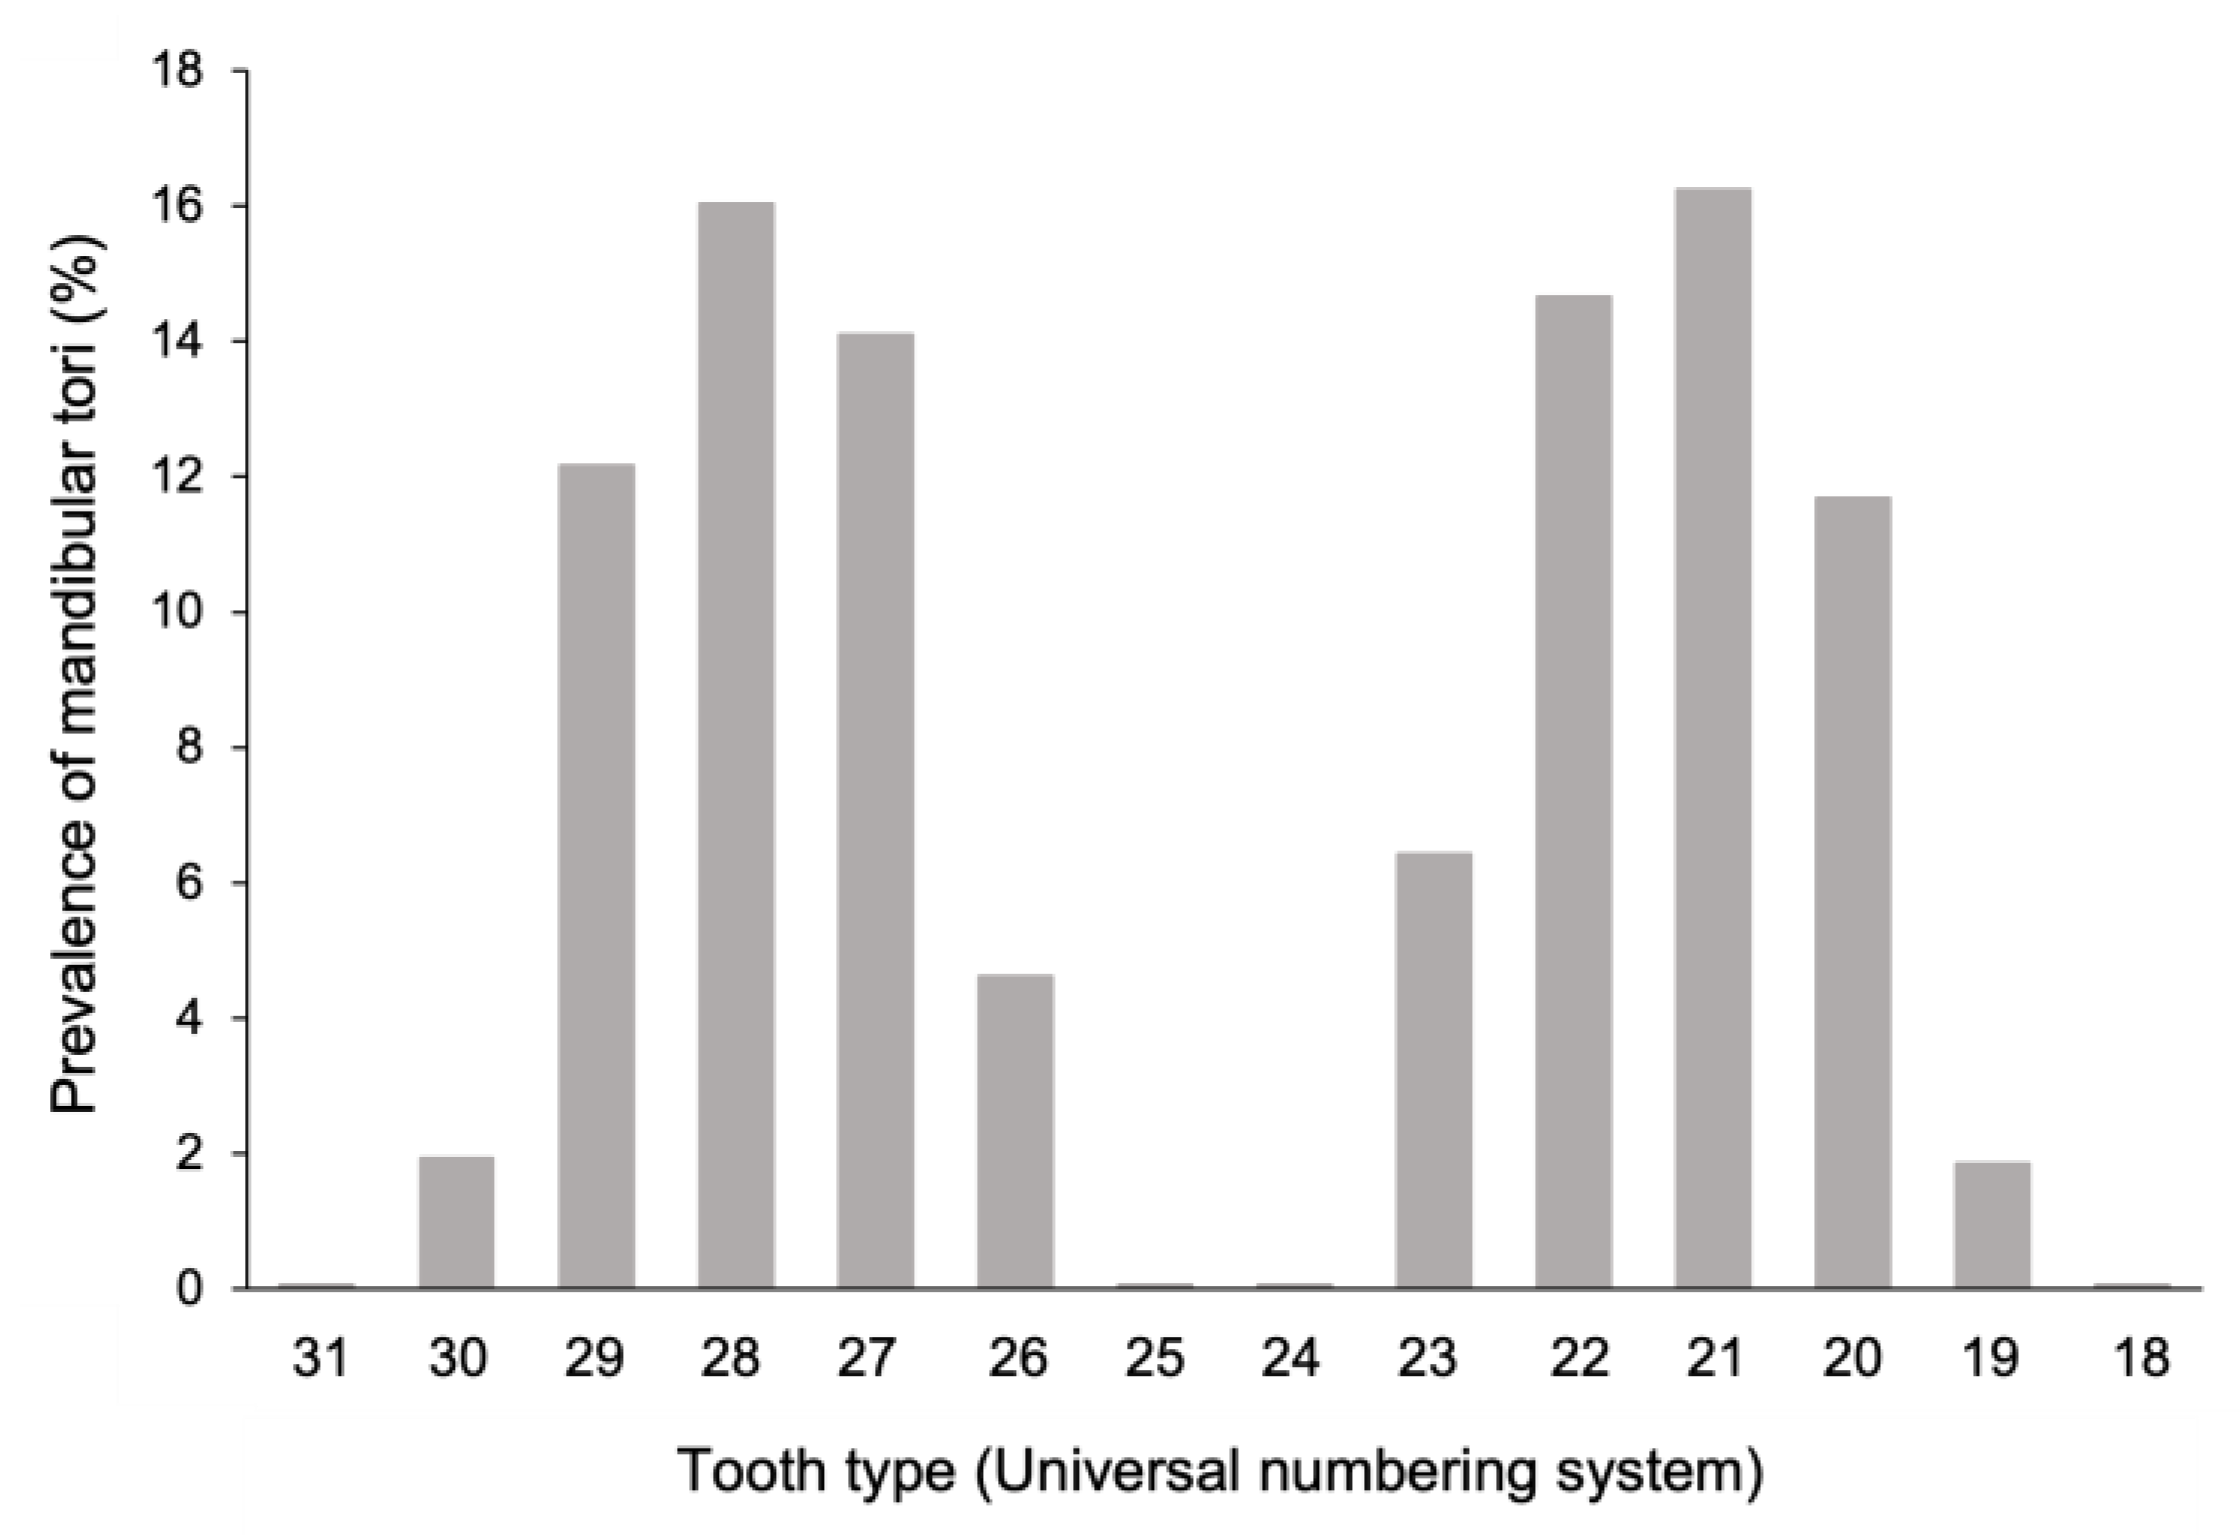
Figure 6.
Breakdown of mandibular tori by morphological type. Type I indicate Monocystic and stemless type. Type II: Multivesicular and stemless type. Type III: Monocystic and pedunculated type. Type IV: Multivesicular and pedunculated type.
Figure 6.
Breakdown of mandibular tori by morphological type. Type I indicate Monocystic and stemless type. Type II: Multivesicular and stemless type. Type III: Monocystic and pedunculated type. Type IV: Multivesicular and pedunculated type.
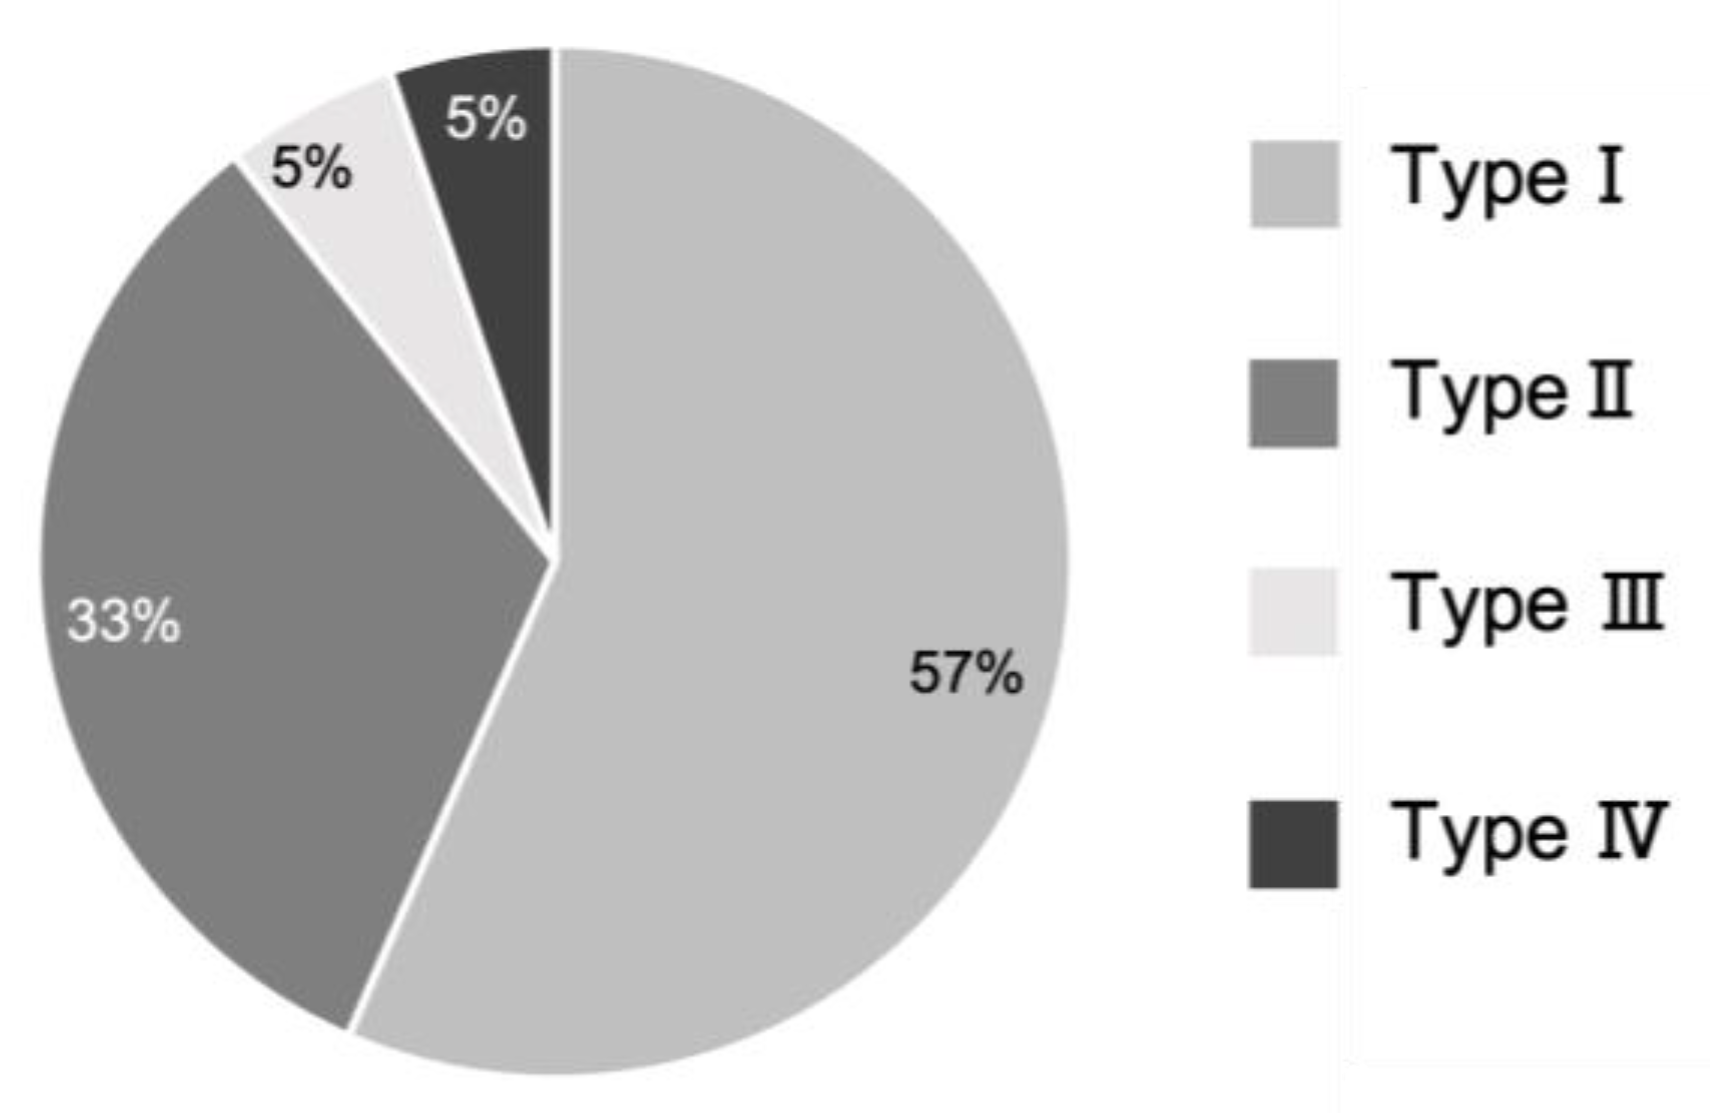
Figure 7.
Comparison of bone density between mandibular tori and healthy cortical bone in each age group. The horizontal axis represents different age groups, while the vertical axis displays the CT value (Hounsfield Unit). A t-test was used for statistical analysis. An asterisk designates network metrics with a significant difference (“*”: p < 0.05, “**”: p < 0.01).
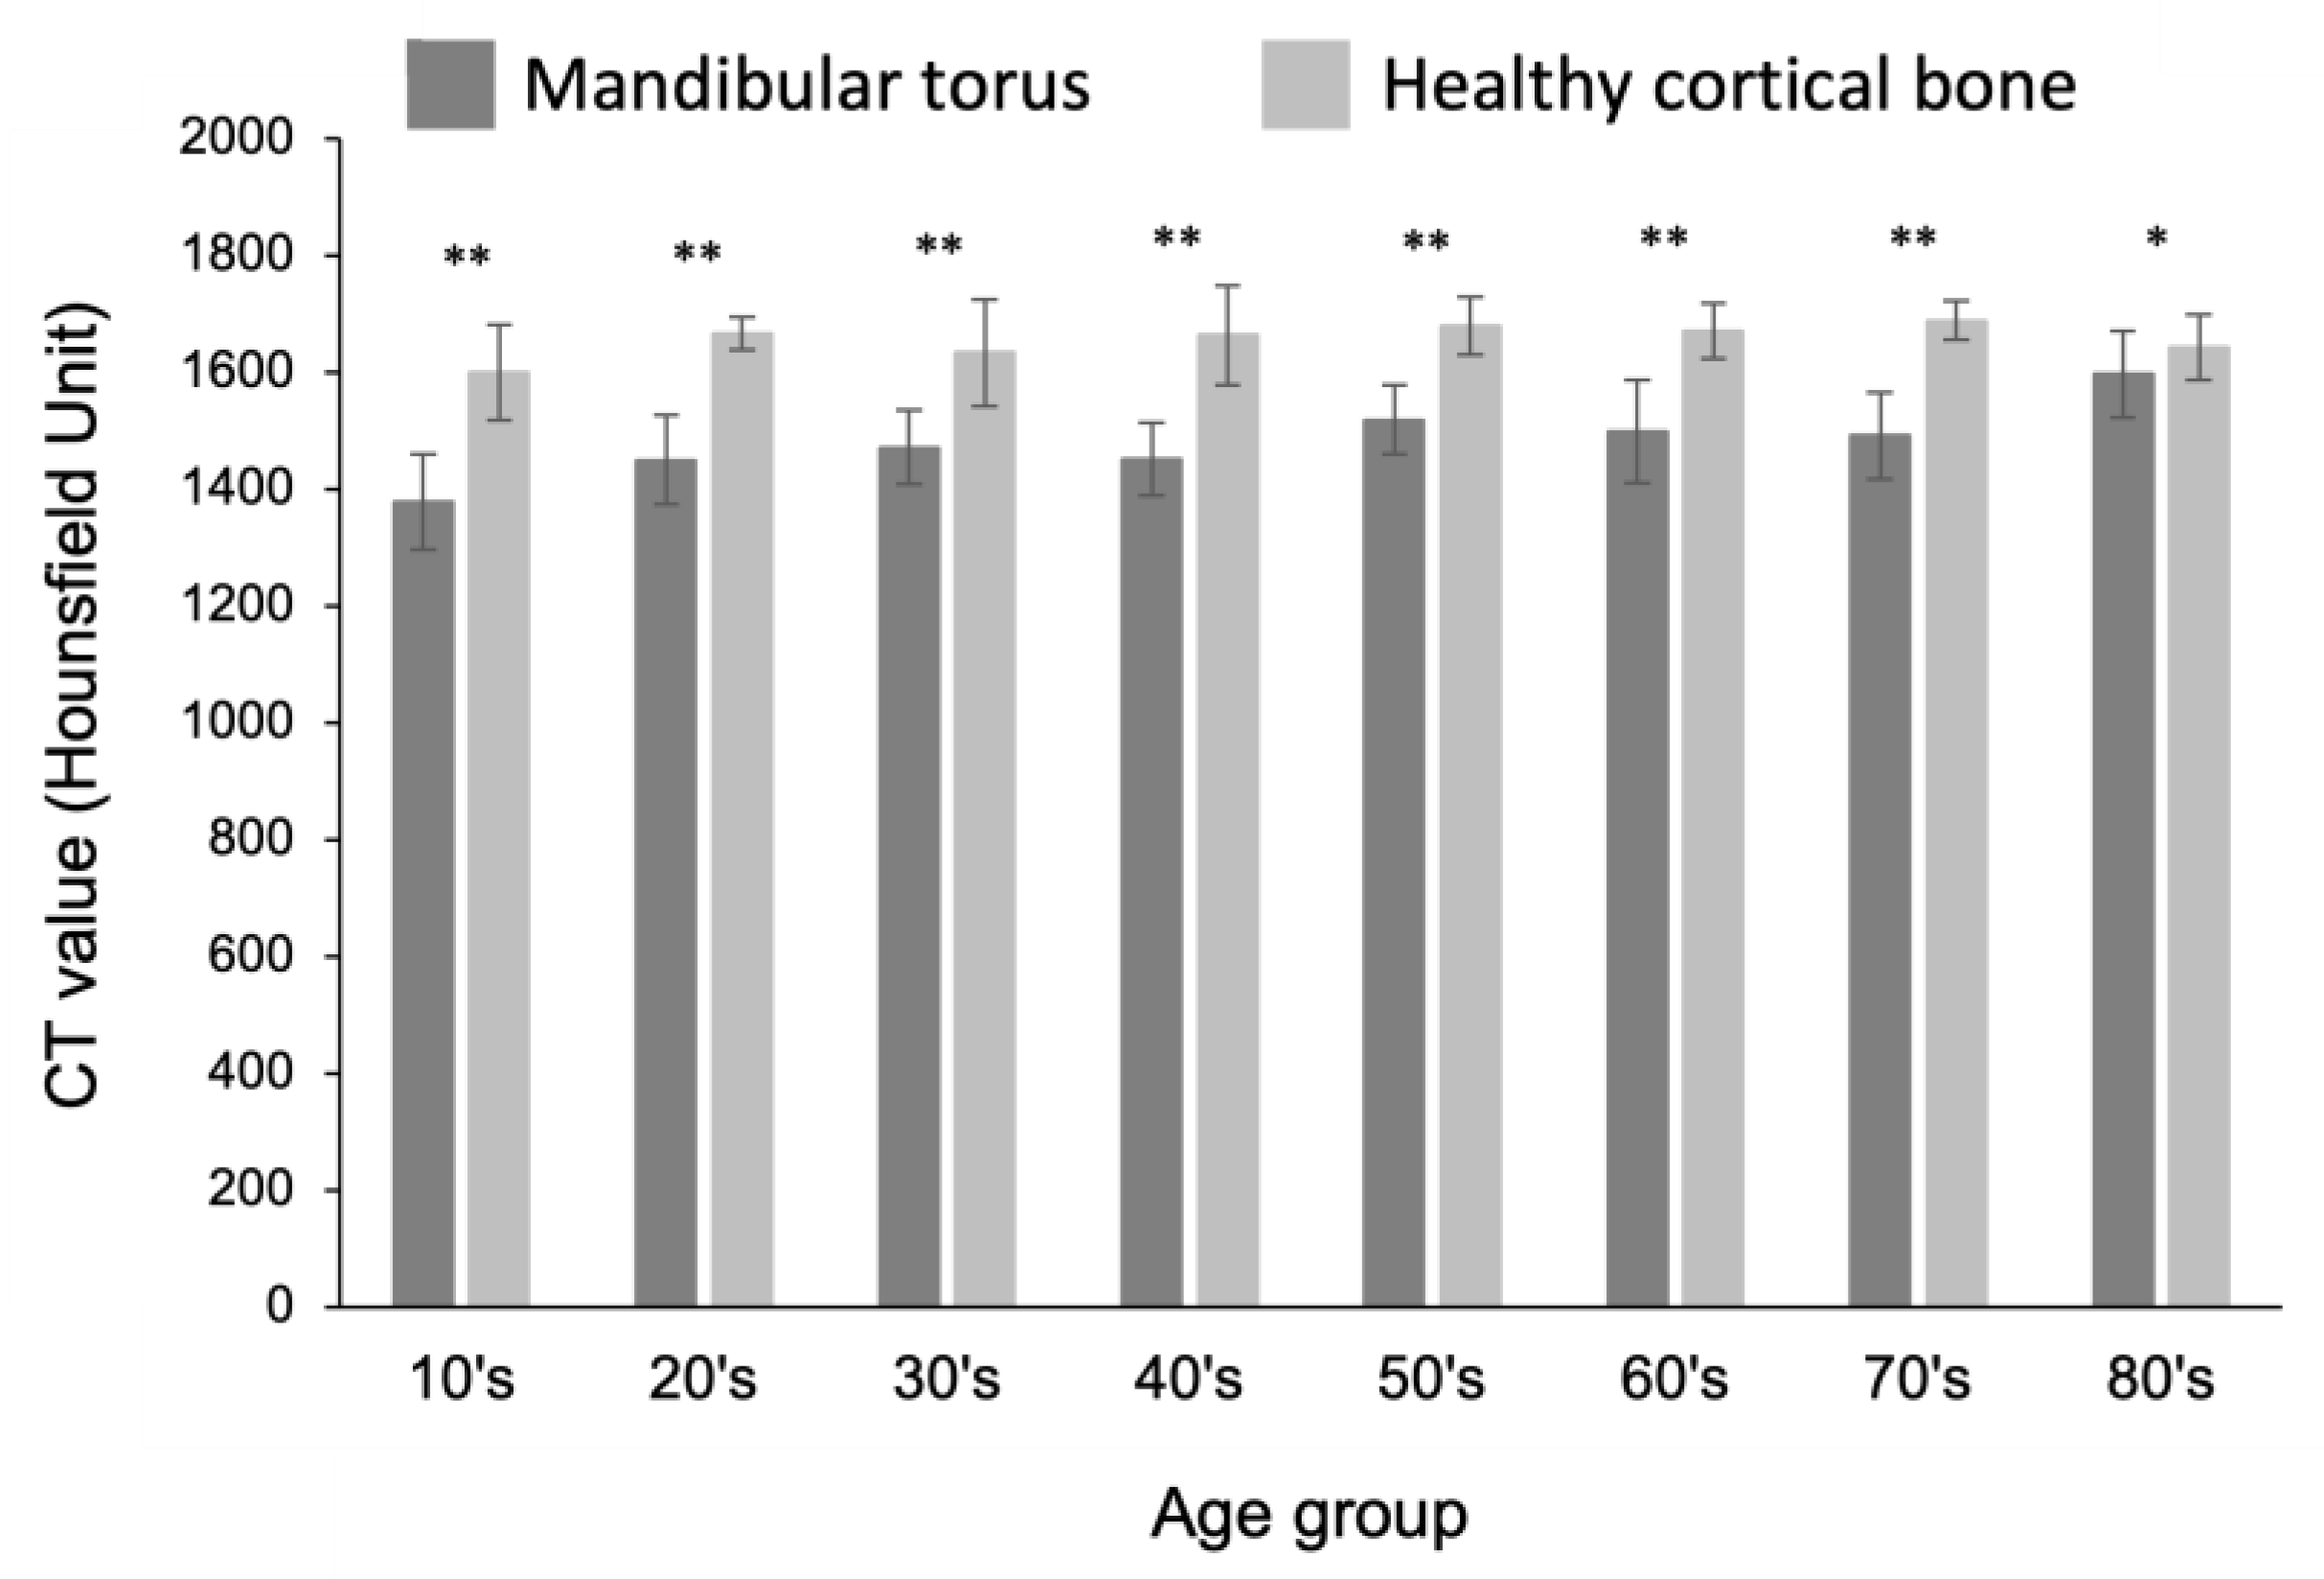
Figure 8.
Comparison of tooth loss rate between patients with mandibular torus and healthy subjects. The rate of tooth loss was lower in patients with mandibular torus than in healthy individuals in all age groups over 30 years old. Statistically significant differences were observed, especially in the 50s, 70s, and 80s. A t-test was used for statistical analysis. An asterisk designates network metrics with a significant difference (“*”: p < 0.05, “**”: p < 0.01).
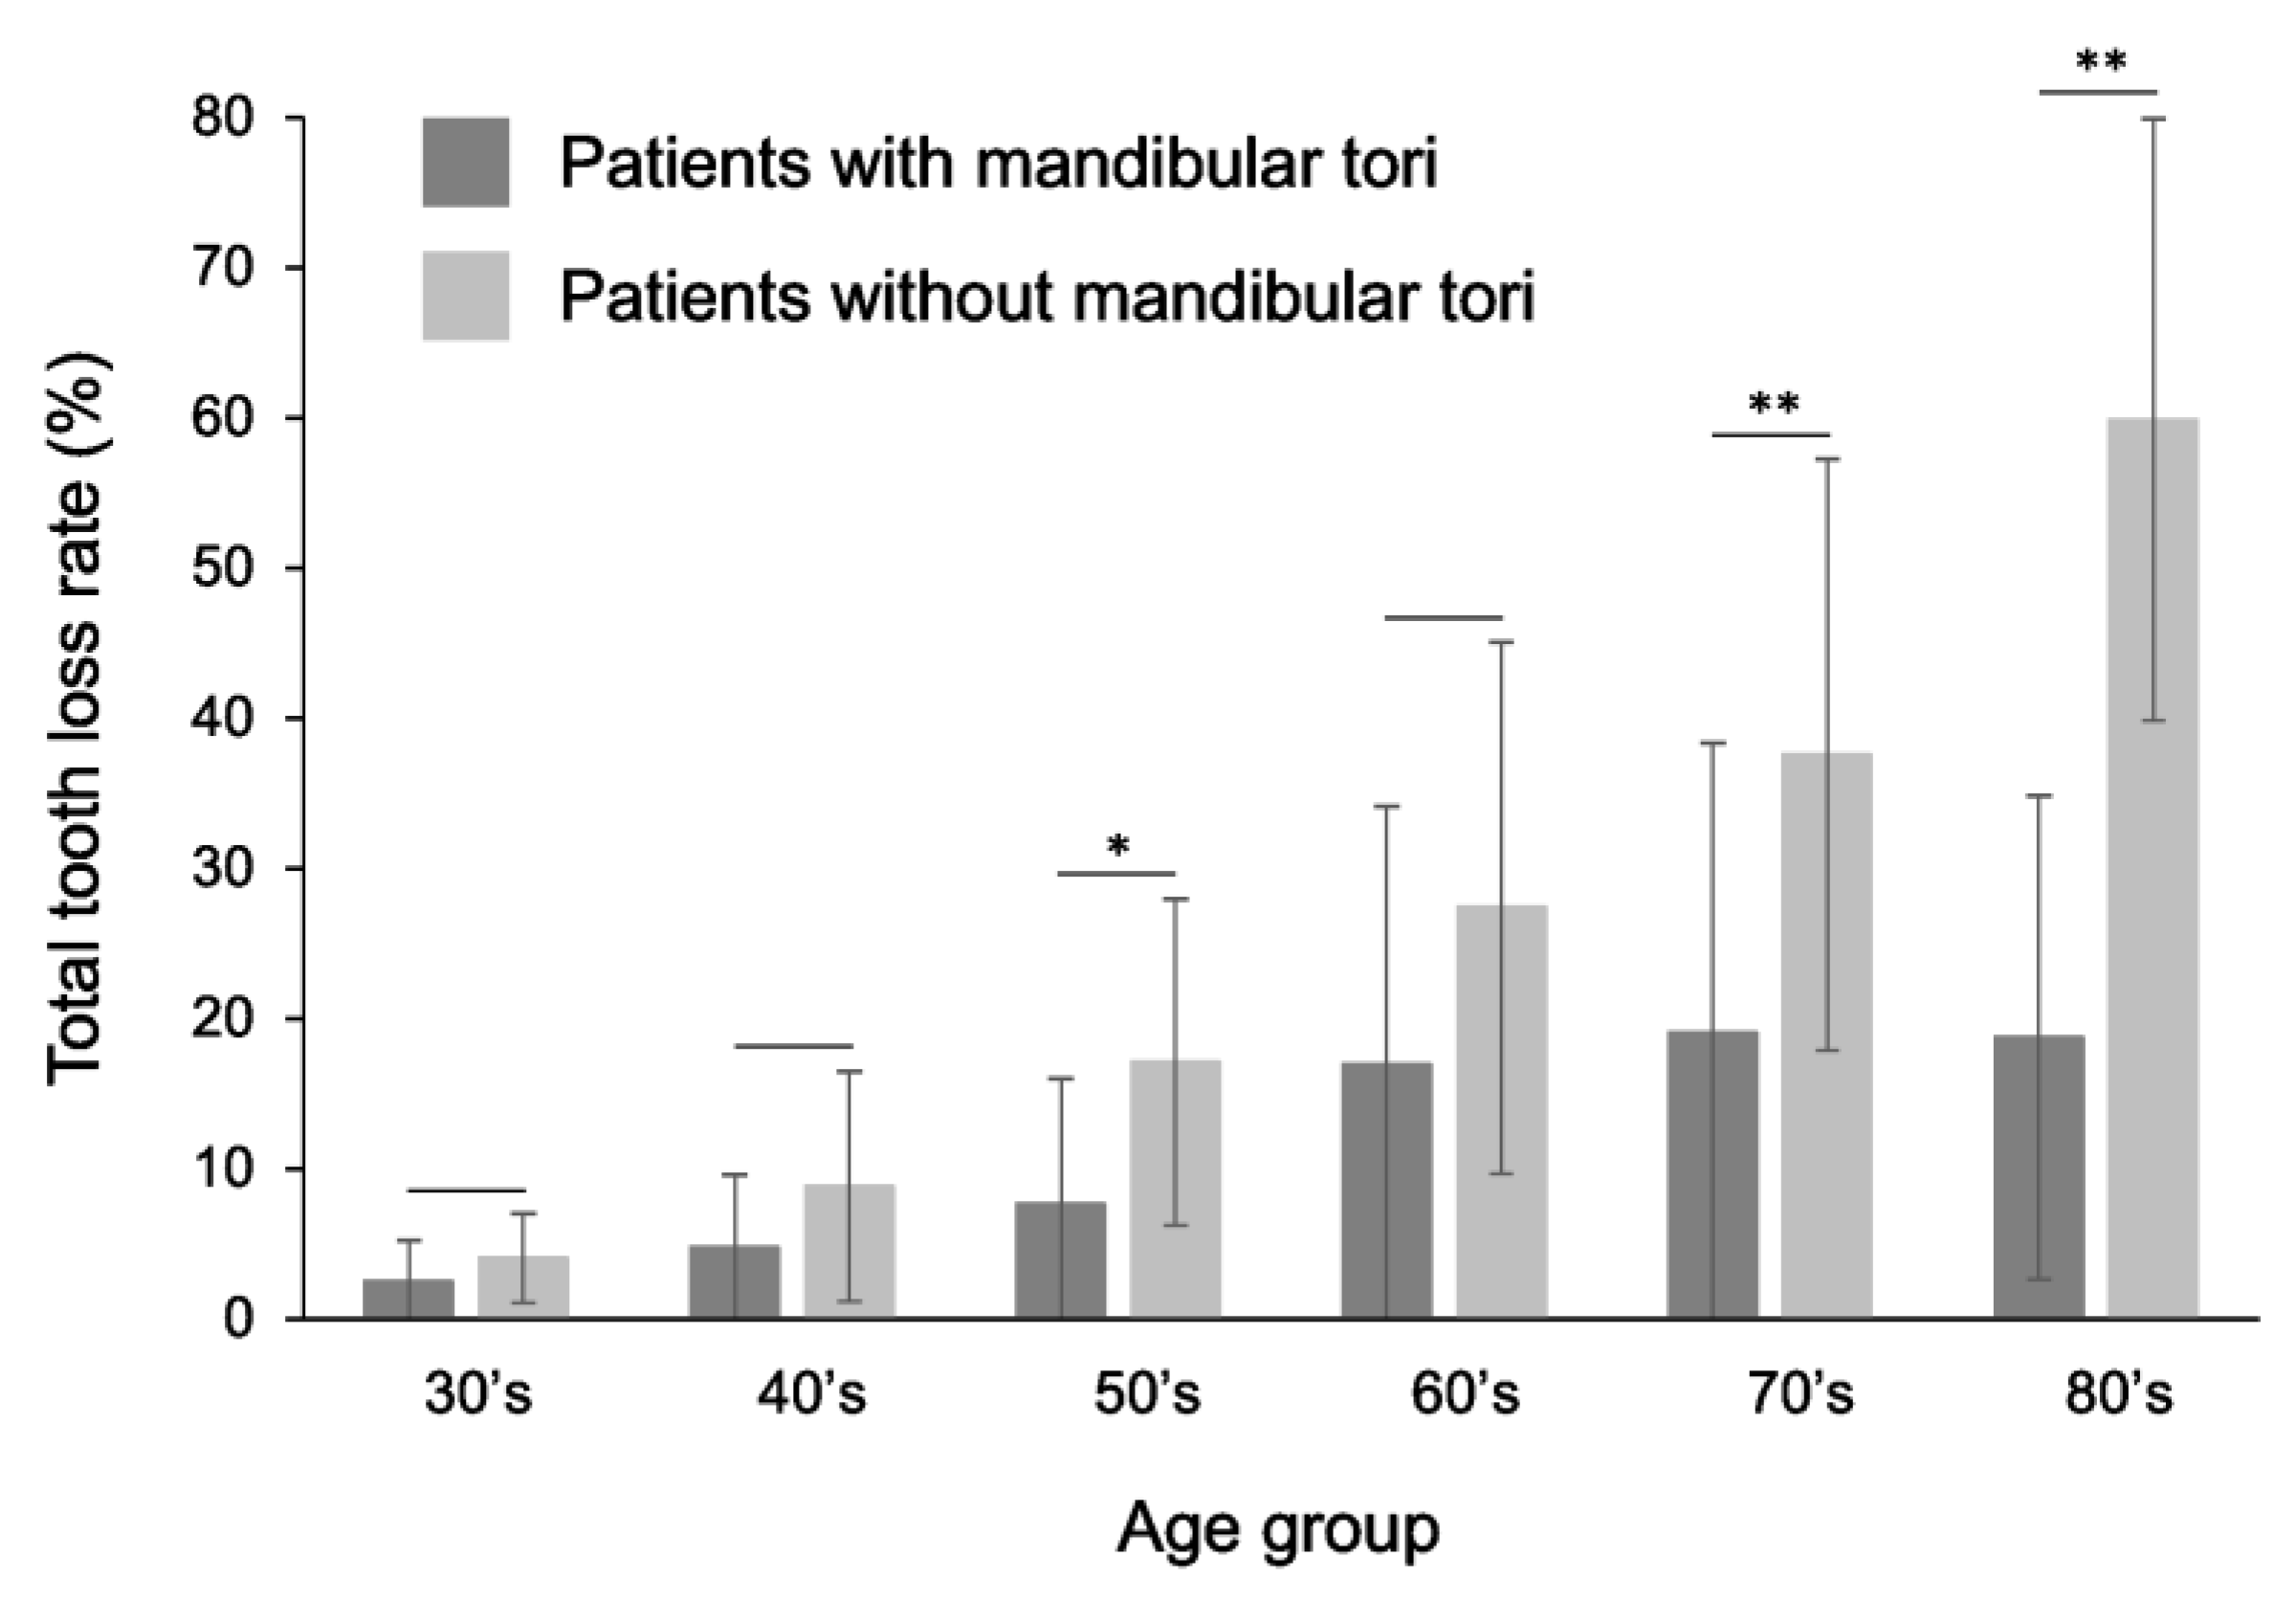
Figure 9.
Comparison of tooth loss rate between patients with mandibular torus and healthy subjects, focusing only on the canine to premolar area. The rate of tooth loss was lower in patients with mandibular torus than in healthy individuals in all age groups over 30 years old. Statistically significant differences were observed, especially in the 50s, 70s, and 80s. A t-test was used for statistical analysis. An asterisk designates network metrics with a significant difference (“*”: p < 0.05, “**”: p < 0.01).
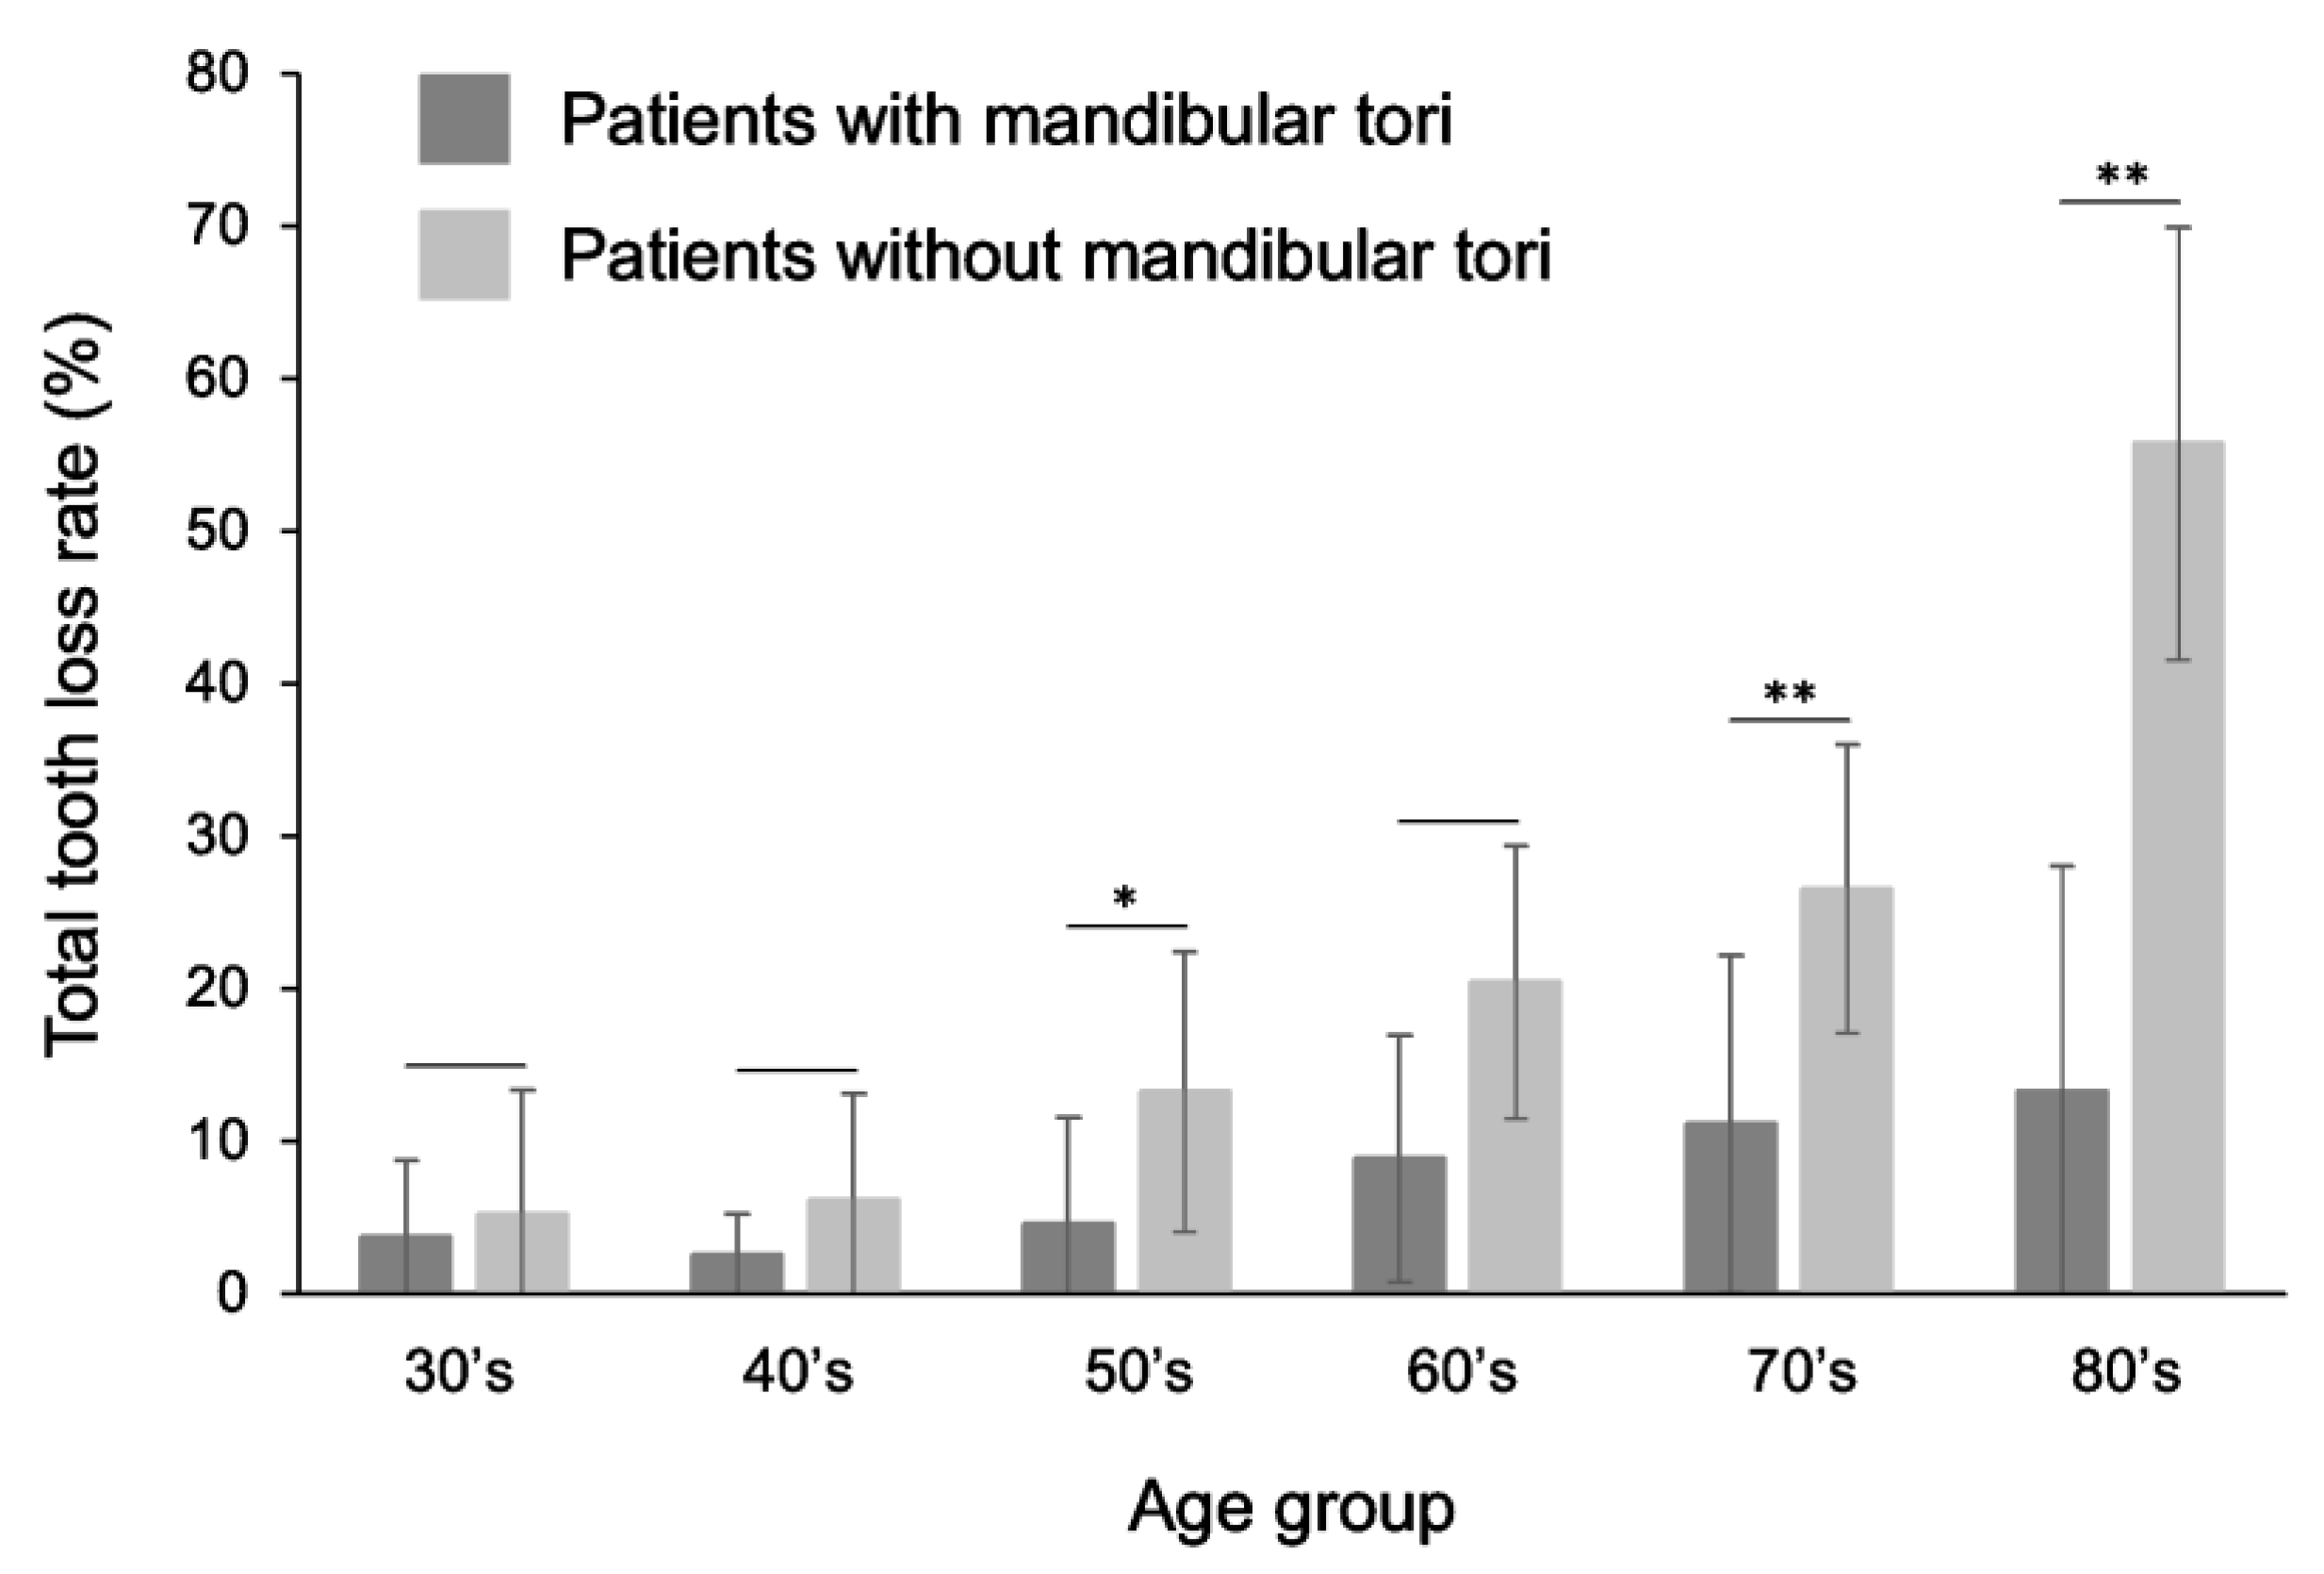
Figure 10.
Comparison of the rate of occlusal support between patients with mandibular torus and healthy subjects. The rate of tooth loss was lower in patients with mandibular torus than in healthy individuals in all age groups over 30 years old. Statistically significant differences were observed, especially in the 50s, 70s, and 80s. A t-test was used for statistical analysis. An asterisk designates network metrics with a significant difference (“*”: p < 0.05, “**”: p < 0.01).
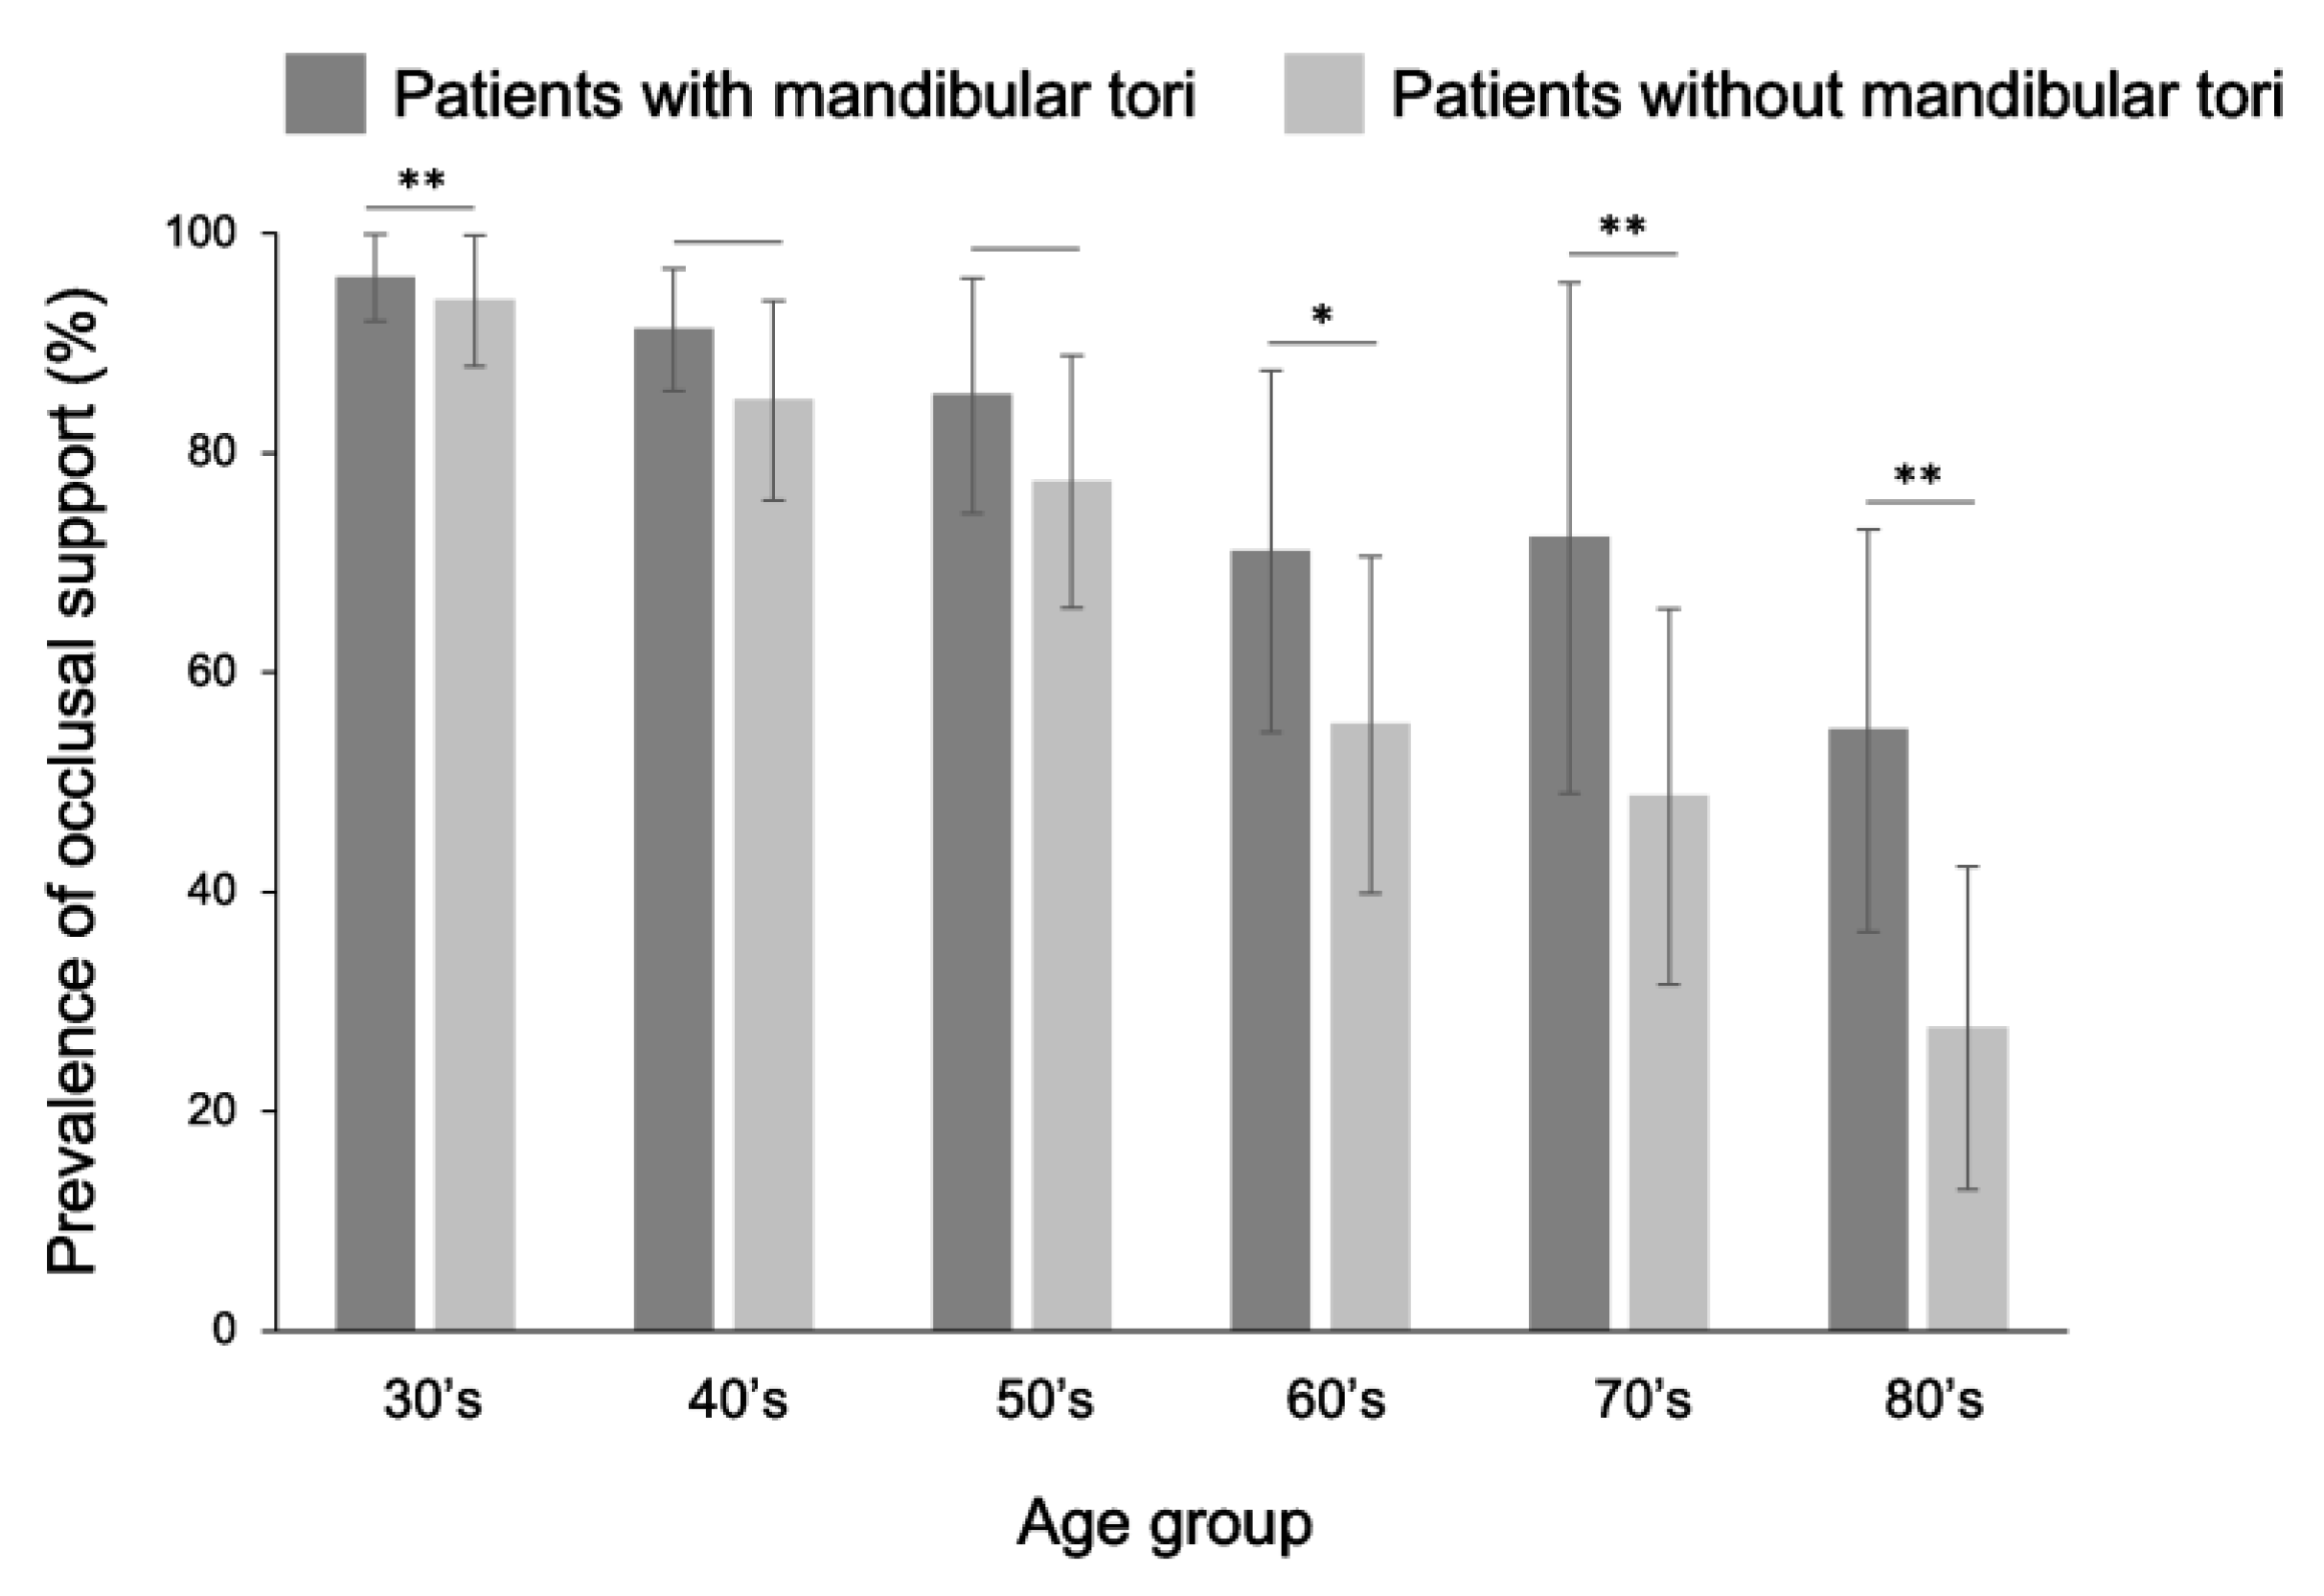
Figure 11.
Comparison of the rate of occlusal support between patients with mandibular torus and healthy subjects, focusing only on the canine to premolar area. The rate of tooth loss was lower in patients with mandibular torus than in healthy individuals in all age groups over 30 years old. Statistically significant differences were observed, especially in the 50s, 70s, and 80s. A t-test was used for statistical analysis. An asterisk designates network metrics with a significant difference (“*”: p < 0.05, “**”: p < 0.01).
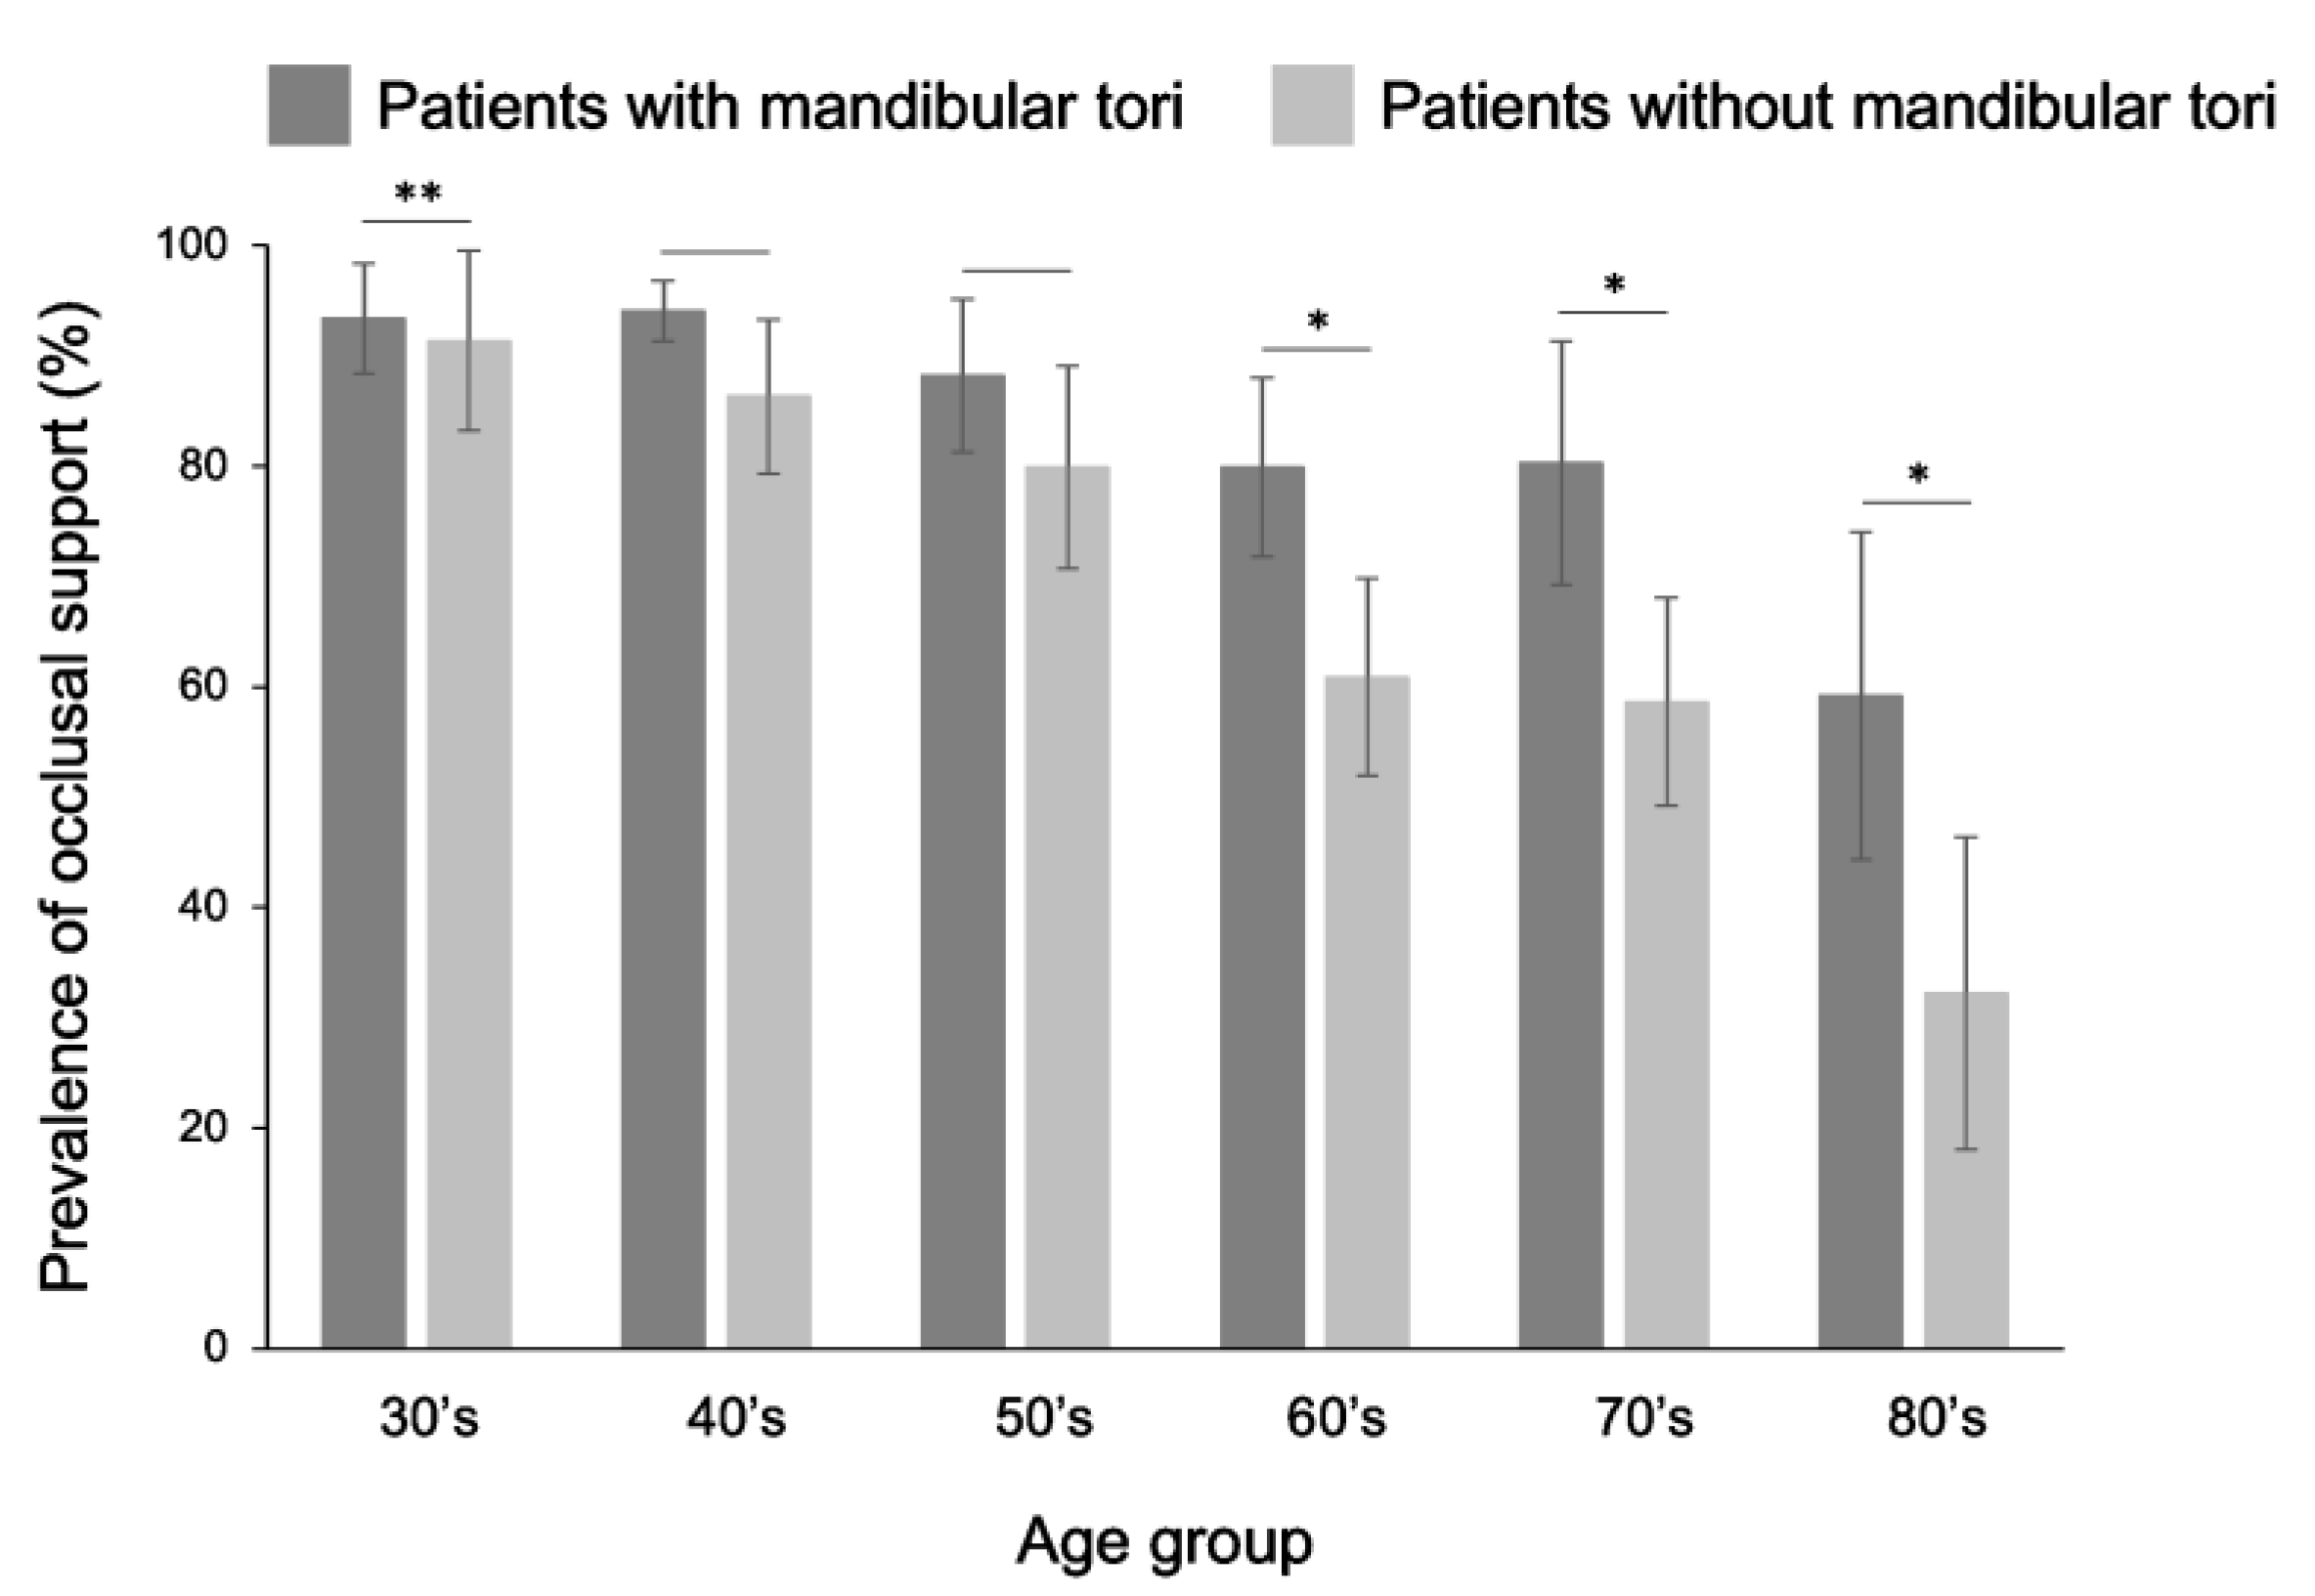

Table 1.
Prevalence of mandibular tori in each age group.
| Age group | Prevalence (%) | Number of subjects |
|---|---|---|
| 10s | 8.2 | 147 |
| 20s | 18.4 | 147 |
| 30s | 39.5 | 147 |
| 40s | 49.7 | 147 |
| 50s | 40.1 | 147 |
| 60s | 33.3 | 147 |
| 70s | 18.4 | 147 |
| 80s and above | 19.7 | 147 |
The table presents the prevalence (%) of mandibular tori in the 147 individuals in each age group.
Disclaimer/Publisher’s Note: The statements, opinions and data contained in all publications are solely those of the individual author(s) and contributor(s) and not of MDPI and/or the editor(s). MDPI and/or the editor(s) disclaim responsibility for any injury to people or property resulting from any ideas, methods, instructions or products referred to in the content. |
© 2025 by the authors. Licensee MDPI, Basel, Switzerland. This article is an open access article distributed under the terms and conditions of the Creative Commons Attribution (CC BY) license (http://creativecommons.org/licenses/by/4.0/).
Copyright: This open access article is published under a Creative Commons CC BY 4.0 license, which permit the free download, distribution, and reuse, provided that the author and preprint are cited in any reuse.


