
Submitted:
18 September 2024
Posted:
19 September 2024
You are already at the latest version
Abstract
(1) Background: This retrospective cohort study aimed to investigate the cephalometric evaluation of facial height ratio (FHR) and growth patterns. (2) Methods: We assessed facial height ratios, Y-axis to SN angle, and growth patterns in 94 participants from Timis county using digital cephalograms. Participants were categorized based on Angle’s classification. Cephalograms were digitally traced and analyzed using WebCeph imaging software. Statistical analysis was conducted using Python version 3.11.9. (3) Results: Significant correlations were observed between FHR and craniofacial development, particularly regarding hypodivergent growth patterns. In a sample of 94, molar classes showed varying patterns: Class I—33.3% hyperdivergent, 61.5% normodivergent, 33.3% hypodivergent. Class II—50% hyperdivergent, 30.8% normodivergent, 52% hypodivergent. Class III—16.7% hyperdivergent, 7.7% normodivergent, 14.7% hypodivergent. Y-axis to SN angle values were within normal limits across groups (Group I: 65.0 (IQR: 61.2-69.0), Group II: 65.0 (IQR: 62.0-69.0), Group III: 67.0 (IQR: 59.7- 69.0). A strong negative correlation was found between Y-axis to SN angle and Jarabak’s ratio (r = -0.72, p < 0.001), highlighting the need for holistic assessment methods in orthodontic practice. (4) Conclusion: Patients from Timis county predominantly exhibit a hypodivergent growth pattern across all malocclusion types. Understanding these patterns is essential for comprehensive orthodontic treatment planning. Further research is needed to explore the implications of these findings on treatment outcomes and patient care.
Keywords:
digital cephalometric analysis
; sagittal relationship
; normodivergent
; hypodivergent
; hyperdivergent
; Jarabak’s ratio
; growth pattern
; orthodontics
1. Introduction
Cephalometry, an essential diagnostic tool in orthodontics, allows for the evaluation of the relationship between skeletal, dental, and soft tissue components of the face. The analysis of anteroposterior and vertical dimensions is crucial for assessing malocclusion severity, particularly in the anterior–posterior direction, which can impact vertical alterations [1]. Facial growth, relative to the cranial base line, comprises horizontal forward development and vertical downward growth. Mandibular growth significantly influences facial development, with hypodivergent patterns observed in short faces and hyperdivergent patterns in long faces. Various factors influence craniofacial development, leading to diverse facial morphologies. This variability in growth patterns underscores the multifactorial nature of craniofacial development, giving rise to diverse facial morphologies [2].
Orthodontic diagnosis emphasizes the anteroposterior connection between maxillary and mandibular apical bases. Sagittal discrepancies in jaw connection often accompany vertical disharmonies, detectable through careful cephalometric analysis of linear and angular measurements [3]. Achieving appropriate vertical proportions during orthodontic treatment involves categorizing vertical facial forms into distinct categories, such as long, average, and short faces. Sassouni observed clear associations between facial patterns and anterior vertical facial proportions, measured by parameters like anterior facial height (AFH) and posterior face height (PFH) [4].
Accurate diagnosis and evaluation of developing patients are imperative in orthodontics for effective therapy planning and prognostic assessments [5]. However, predicting individual facial growth remains a formidable challenge due to the inherent variability in growth direction and magnitude [6,7]. This challenge is further compounded by genetic and environmental influences on the craniofacial system, necessitating the development of predictive models to infer dentoalveolar imbalance progression in line with growth principles [8,9].
The complexity of growth pattern prediction is by genetic and environmental influences on the craniofacial system [9]. Predictive models integrate relevant components to infer dentoalveolar imbalance progression according to growth principles [10]. Facial structure development involves variable growth vectors along horizontal and vertical axes. Balanced growth along these axes is essential to prevent facial imbalances. Extreme facial forms result from disproportionate vertical development, such as in long face syndrome [11]. Precise diagnosis considers the sagittal jaw base relationship, as highlighted by Angle’s classification of malocclusion in the late 19th century. This classification system, still in use, categorizes occlusion based on the relationship between the first permanent molars.
Linear measurements of sagittal jaw base relationship offer a more accurate diagnosis of anteroposterior discrepancies than angular measurements. Both linear and angular measures are integrated into cephalometric assessments to determine treatment strategies [12]. The soft tissue paradigm, introduced in the 21st century, emphasizes the role of soft tissue in orthodontic and orthognathic treatment planning. Jarabak’s findings on vertical inter-maxillary correlations in the Caucasian population underscore the importance of cephalometric tests in understanding facial growth patterns. Consequently, examining facial height ratios and growth patterns, along with correlations between facial height ratio (FHR) and specific cephalometric angles, provides valuable insights for diagnosis and treatment planning in diverse malocclusions [13].
The aim of this retrospective cohort study was to investigate the cephalometric evaluation of FHR and growth patterns among a diverse range of malocclusions in a group of patients from Timis County, Romania. Specifically, the study aimed to assess the correlation between FHR and various cephalometric measurements including the Y axis to SN angle, total anterior facial height (TAFH), and total posterior facial height (TPFH). By examining these parameters, the study sought to contribute to a deeper understanding of craniofacial development and aid in the diagnosis and treatment planning of malocclusions.
2. Materials and Methods
This retrospective cohort study utilized preparatory data from the Department of Orthodontics and Dentofacial Orthopedics of Timisoara. The study focused on investigating cephalometric evaluation of facial height ratio and growth patterns. A total of 94 patient records formed the study population. These records were retrieved from consultations conducted between March 2021 and December 2022. All patients included in the study were residents of Timis County, Romania.
The samples for the study were selected from patients attending the Discipline of Orthodontics I, Faculty of Dental Medicine, “Victor Babes” University of Medicine and Pharmacy Timisoara. Each and every person who took part in the study was required to provide written informed consent. The ethical clearance was obtained from the Institutional Ethics Committee of the University of Medicine and Pharmacy “Victor Babes” in Timisoara, Romania (CECS nr.13/26.03.2021).
The Angle classification, proposed by Edward H. Angle in 1899, was employed to categorize dentoalveolar malocclusion. Pre-treatment study models, complemented by photographs and clinical questionnaire records, were utilized to evaluate malocclusion and confirm the Angle classification. All 94 subjects were divided into three groups based on Angle’s dentoalveolar malocclusion, which was evaluated using pre-treatment study models, photographs, and clinical questionnaire records for confirmation (Table 1).
2.1. Procedure Methodology
Lateral cephalograms were obtained using a PLANMECA (PROMAX) device, ensuring the subjects were in the normal head position. The optimal natural head posture was determined using the procedure outlined by Beni Solow [14]. Pretreatment digital cephalograms were analyzed using the WebCeph (version 1.00.00) imaging cephalometric program. Digital tracing was performed, and a composite cephalometric analysis was conducted, incorporating two linear measures and one angular measurement.

Table 1.
List of measurement and landmarks.
| S. No | Measurement | Description |
|---|---|---|
| 1 | Total Anterior Facial Height | Measured along the N–Me line. |
| 2 | Total Posterior Facial Height | Measured along the S–Go line. |
| 3 | FHR | Calculated as the ratio of TPFH to TAFH multiplied by 100, also known as the Jarabak’s ratio. Facial morphology classified into three patterns based on FHR: 1) Hyperdivergent growth pattern: FHR < 59%, predominantly vertical growth pattern. 2) Neutral or normodivergent growth pattern: FHR between 59 and 63%. 3) Hypodivergent growth pattern: FHR > 63%, predominantly horizontal growth pattern [15]. Nahidh et al. reported that the vertical relation is better measured using the sum of posterior angles and the Jarabak ratio [16]. |
| 4 | S–Gn (Y-Axis) Angle | Defines the location of the mandible in relation to the cranial base. A mean value of 66° indicates a posterior mandibular position and dominance of vertical growth; smaller angles indicate an anterior mandibular position and dominance of anterior growth [17]. |
| 5 | Y SN Angle | Formed by the SN plane and the Y axis, reflects the downward and forward posture of the chin relative to the upper face [18,19,20,21]. |
*FHR: Facial Height Ratio; TAFH: Total anterior facial height; TPFH: Total posterior facial height.
The cephalometric landmarks, including S (Sella turcica), N (Nasion), Go (Gonion), and Me (Menton), were pivotal for facial analysis. S represented the midpoint of the hypophyseal fossa; N, the most anterior point on the naso-frontal suture; Go, the intersection of the posterior ramal plane and mandibular plane; Me, the lowest point in the chin’s median plane. These landmarks served as crucial reference points for precise measurement. The constructed planes were N-Me (Nasion–Menton) and S-Go (Sella–Gonion).
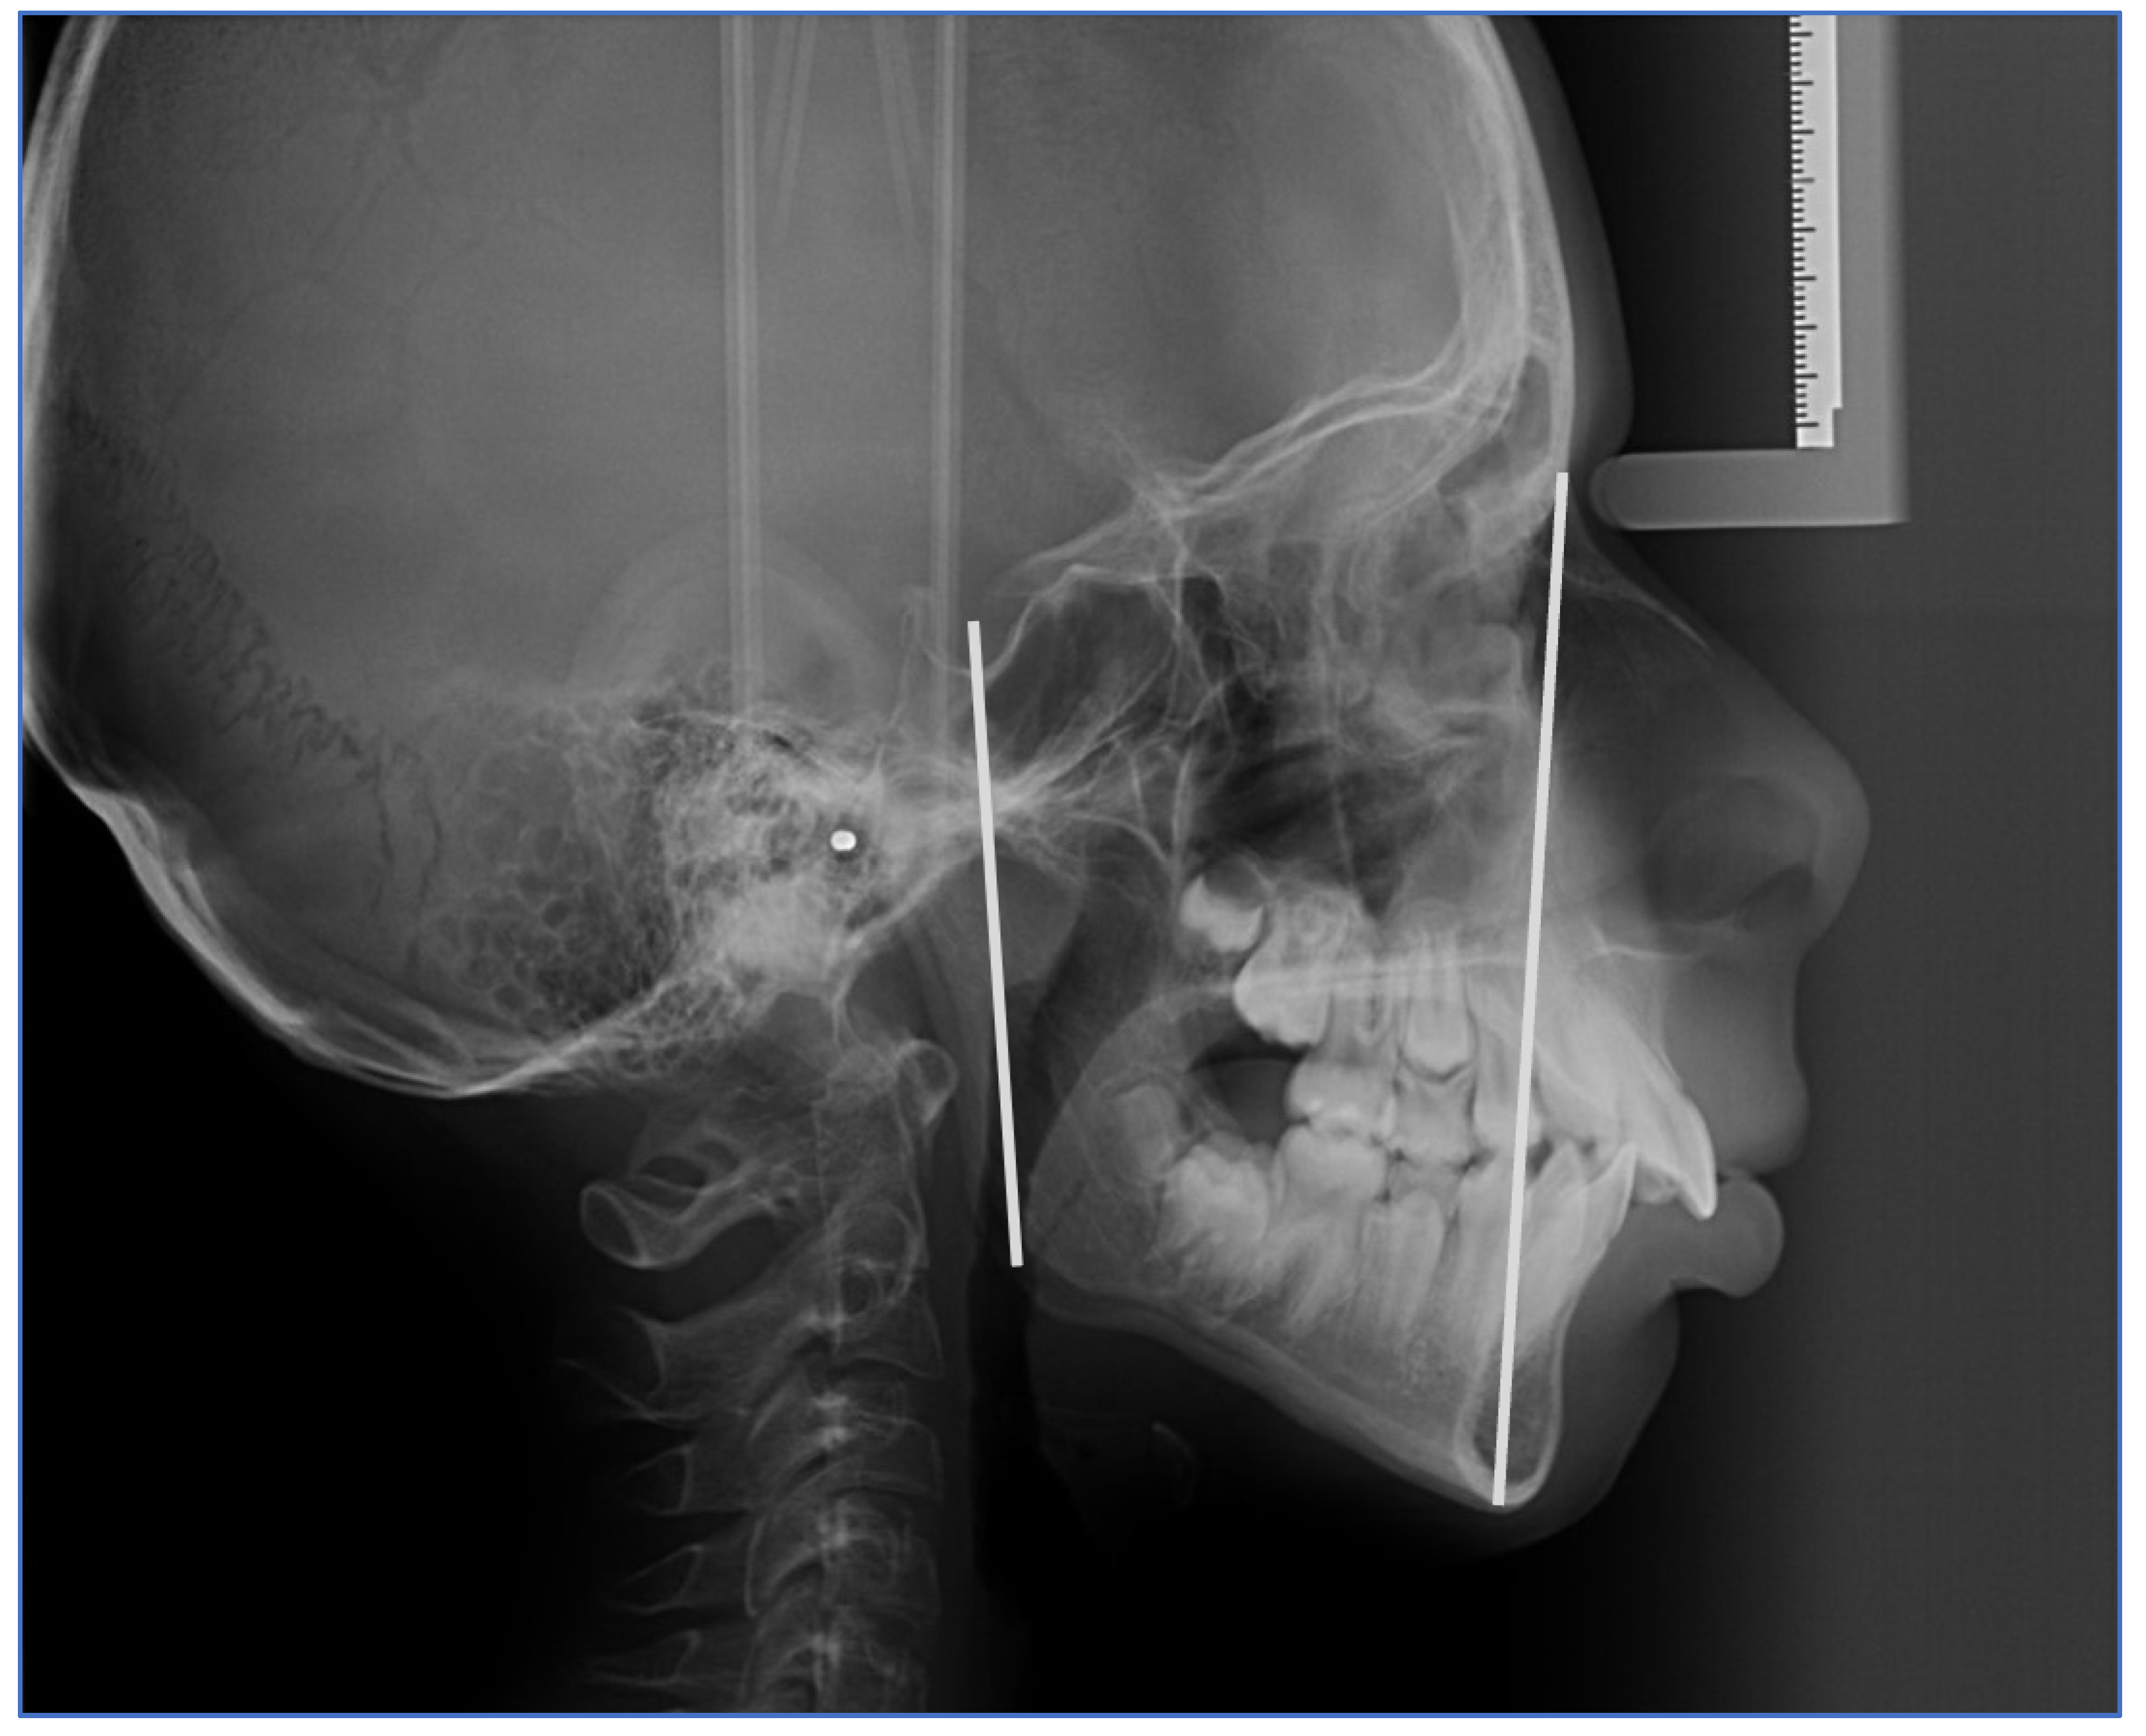
Figure 1.
Constructed planes and cephalometric markers: Nasion–Menton and Sella–Gonion.
Figure 2a present the WebCeph program measurements, while Figure 2b shows the corresponding outcomes from the digital version.
Measurements were taken based on these landmarks and planes are presented in table 1 below.
Figure 3 illustrates the digitally drawn Y-axis at SN, constructed from Sella–Nasion and Sella–Gnathion. To minimize error, all radiographs were traced and measured by the same investigator, with measurements repeated after 2 weeks to reduce intra-observer error. The parameters were then tabulated for analysis.
2.2. Statistical Analysis
Statistical analysis was conducted using Python version 3.11.9. Descriptive statistics were utilized to summarize the data. Continuous variables were expressed as mean with standard deviation (SD) for normally distributed data and as median with interquartile range (IQR) for nonparametric data. Categorical variables were presented as frequencies and percentages. Group differences in normally distributed continuous data were assessed using Welch’s t-test for two groups or ANOVA (Analysis of variance) for more than two groups. Nonparametric continuous data were analyzed using the Mann-Whitney U test or the Kruskal-Wallis test for association between molar class distribution and anthropometric measurements of facial size. Differences in categorical data were examined using the χ2 test or Fisher’s exact test. The Shapiro-Wilk test was employed to assess the normality of continuous data and to test normality assumptions. Additionally, logistic regression was employed for further analysis to predict the predictors of divergence type based on anthropometric measurements.
3. Results
3.1. Baseline Characteristic of Included Sample
In this study, 94 patient records were analyzed, comprising 35 men and 59 women. Table 2 provides baseline characteristics of anthropometric parameters for the study sample of 94 individuals. The median age was 21 years (IQR: 14 to 28), indicating a wide age range among participants. TPFH and TAFH had median values of 76 (IQR: 70 to 81) and 112 (IQR: 104 to 120) respectively, reflecting variation in facial dimensions within the sample. The median Jarabak’s ratio, a measure of facial morphology, was 67.0 (IQR: 64.0 to 72.0). Molar class distribution revealed that the majority of individuals were in class 2 (49%), followed by class 1 (37%) and class 3 (14%). Y-axis to SN angle had a median value of 65.0 (IQR: 62.0 to 69.0), indicating variation in mandibular position relative to the cranial base. Gender distribution showed that 63% were female and 37% were male within the sample.
3.2. Molar Class Distribution
Additionally, all patients were categorized into three groups based on Angle’s dentoalveolar malocclusion, assessed using pre-treatment study models, photographs, and clinical questionnaire records. The association between gender and molar class distribution was examined using a chi-square test, as shown in Table 3. The table indicates the distribution of molar classes among male and female participants, with a total sample size of 94 individuals. Across the three molar class groups (Group I, Group II, and Group III), no significant gender-based differences were observed (p = 0.223), suggesting a comparable distribution of molar classes between males and females in the study population.
The association between molar class distribution and anthropometric measurements of facial size are presented in Table 4. This table presents the distribution of Y axis to SN, TPFH, and TAFH measurements across three molar class groups (I, II, and III). Statistical analysis using Kruskal-Wallis tests revealed no significant differences between molar class distribution and Y axis to SN (χ² = 0.00, p = 1.001), TPFH (χ² = 0.30, p = 0.741), or TAFH (χ² = 0.26, p = 0.771). These findings suggest that molar class distribution did not influence the measured anthropometric facial size parameters among the study participants.
The distribution of molar class and gender across hyperdivergent, normodivergent, and hypodivergent facial skeletal patterns was analyzed (Table 5). Among the 94 individuals included, 6 were hyperdivergent, 13 were normodivergent, and 75 were hypodivergent. Molar class I comprised 33.3% hyperdivergent, 61.5% normodivergent, and 33.3% hypodivergent patterns. Conversely, molar class II exhibited 50% hyperdivergent, 30.8% normodivergent, and 52% hypodivergent patterns, while molar class III showed 16.7% hyperdivergent, 7.7% normodivergent, and 14.7% hypodivergent patterns. No statistically significant association was found between molar class distribution and gender (p = 0.4281).
Females were notably more represented in the hyperdivergent group (83.3%) compared to normodivergent (53.8%) and hypodivergent (62.7%) groups, whereas males were less represented in the hyperdivergent group (16.7%) compared to normodivergent (46.2%) and hypodivergent (37.3%) groups. The association between gender and molar class distribution was not statistically significant (p = 0.4661) based on Pearson’s Chi-squared test.
3.3. Predictors of Gender Differentiation
In the logistic regression model assessing predictors of gender differentiation based on anthropometric measurements (Table 6). TPFH did not show a statistically significant effect on gender differentiation (p = 0.863, OR = 0.991, 95% CI [0.897, 1.095]). The confidence intervals provide a range within which the true OR is likely to fall. TAFH showed a statistically significant positive effect on gender differentiation (Estimate = 0.10096, p = 0.022, OR = 1.106, 95% CI [1.015, 1.206]). This indicates that for each unit increase in TAFH, the odds of being male increased by a factor of 1.106. Conversely, Y axis to SN had a statistically significant negative effect on gender differentiation (Estimate = -0.15276, p = 0.041, OR = 0.858, 95% CI [0.741, 0.994]). For each unit increase in Y axis to SN, the odds of being male decreased by a factor of 0.858.
Figure 4 illustrates significant correlations among anthropometric measures. A strong negative correlation (R = -0.72, p < 0.001) between the Jarabak’s ratio and Y-axis to SN indicates that as the Jarabak’s ratio decreases, the Y-axis to SN angle increases. Additionally, a moderate positive correlation (R = 0.53, p < 0.001) was observed between Y-axis to SN and TAFH, suggesting that as the former increases, the latter tends to increase. Furthermore, a moderate correlation (R = 0.60, p < 0.01) between TPFH and TAFH. These findings emphasize the interconnectedness of different facial measurements, offering insights into craniofacial morphology.
Table 7 presents the predictors of divergence type based on anthropometric measurements. For the comparison between Hyperdivergent and Normodivergent groups, the intercept estimate was significant (Estimate = 24.8994, SE = 12.1376, p = 0.040), indicating a difference in divergence type. Age did not significantly influence the odds of divergence type (Estimate = -0.0564, SE = 0.1059, p = 0.594, OR = 0.945), while Y-axis to SN exhibited significance (Estimate = 0.3547, SE = 0.1732, p = 0.041, OR = 1.426). In the comparison between Hypodivergent and Normodivergent groups, the intercept estimate was significant (Estimate = 21.0955, SE = 7.1048, p = 0.003), indicating a difference in divergence type. Age also did not significantly impact the odds of divergence type (Estimate = 0.0475, SE = 0.0468, p = 0.310, OR = 1.049), while Y-axis to SN was significant (Estimate = -0.3050, SE = 0.1052, p = 0.004, OR = 0.737). These results indicate that Y-axis to SN plays a crucial role in distinguishing between hyperdivergent and normodivergent, as well as hypodivergent and normodivergent facial skeletal patterns.
4. Discussion
In our retrospective cohort study, we aimed to explore cephalometric parameters related to FHR and growth patterns, offering insights into the intricate relationship between various anthropometric measurements and craniofacial morphology. The vertical development of the mandible plays a pivotal role in determining facial harmony, with mandibular rotation significantly impacting facial patterns [22]. While previous studies have investigated growth patterns across various malocclusions and populations, it’s important to note that findings cannot be indiscriminately generalized across diverse racial and ethnic groups due to substantial differences in facial morphology [23]. Hence, our study focused on assessing the relationships between facial height and growth patterns specifically within the population of Timis County.
Our analysis unveiled significant associations between FHR and growth patterns, categorizing individuals into hyperdivergent, normodivergent, and hypodivergent patterns based on FHR, thereby providing valuable insights into facial growth and development. Consistent with the findings of Milacic et al., we observed a strong association between sagittal skeletal relationship and molar relationship, with vertical growth pattern significantly influencing an individual’s facial height [11]. By dividing participants into three main groups based on Angle’s classification, we were able to assess parameters of vertical growth pattern more comprehensively [24].
Jarabak’s ratio, determining anterior and posterior facial proportions, revealed interesting insights. In our study, Class I malocclusion exhibited 33.3% hyperdivergent, 61.5% normodivergent, and 33.3% hypodivergent growth patterns differing with findings by Lall et al. and Padarthi et al. [11,25]. Notably, a higher prevalence of normodivergent individuals was observed in molar class I, contrasting with lower prevalence in molar class II, suggesting a potential correlation between molar class and growth pattern. This emphasizes the importance of considering both dental and skeletal factors in assessing facial morphology. While our findings aligned from those of Siriwat and Jarabak [15], who reported normodivergent growth patterns as dominant in Class I, our study highlighted also highlighted normodivergent growth patterns as more prevalent in skeletal Class I subjects, potentially reflecting racial variations. The growth of the musculoskeletal system is directly impacted by a number of factors and demographic traits, as has been noted in other types of craniofacial diseases. [26]
Our study delved into gender disparities within growth pattern distributions, revealing a higher proportion of females among hyperdivergent and hypodivergent groups individuals, while normodivergent displayed more balanced gender distributions, albeit not statistically significant. Detecting subtle gender-related differences in growth patterns may require larger sample sizes for accuracy.
Regarding PFH and AFH, prior studies by Maskey and Shrestha [27], Taner et al. [28], and Wang et al. [29] underscored sexual dimorphism, with females generally exhibiting smaller PFH compared to males. In our investigation, we observed a connection between PFH and Jarabak’s ratio specifically in the hypodivergent group, along with sexual dimorphism concerning AFH, PFH, and Jarabak’s ratio within the hypodivergent group. This aligns with findings indicating the lowest sexual dimorphism in Class I malocclusion, as noted by Siriwat and Jarabak [15].
Comparing our findings with those of Siriwat and Jarabak [15]., disparities in PFH, AFH, and FHR among different malocclusions were evident. In our study, Class I malocclusion demonstrated TAFH of 112.0 (IQR: 104.0, 122.8), TPFH of 77.0 (IQR: 71.2, 81.0) and Y axis to SN of 65.0 (IQR: 61.2, 69.0), while Class II malocclusion exhibited TAFH of 112.0 (IQR: 104.0, 119.1), TPFH of 75.0 (IQR: 69.0, 81.1) and Y axis to SN of 65.0 (IQR: 62.0, 69.0). Additionally, Class III malocclusion displayed TAFH of 113.0 (IQR: 107.0, 116.3), TPFH of 76.0 (IQR: 70.7.0, 78.3) and Y axis to SN of 67.0 (IQR: 59.7, 69.0). Notably, our study identified different distributions of malocclusions among growth patterns for females and males, showcasing variations across different classifications. While our findings broadly align with Siriwat and Jarabak’s observations, discrepancies exist, highlighting potential racial variations and underscoring the need for further investigation to elucidate underlying mechanisms.
Overall, our study adds valuable insights into the gender-specific distribution of growth patterns and further delineates the relationship between cephalometric parameters and malocclusions. However, future research with larger cohorts is warranted to validate and expand upon our findings, providing a comprehensive understanding of the complex interplay between gender, cephalometric parameters, and growth patterns in craniofacial development.
The correlation analysis conducted in our study between cephalometric measurements provided valuable insights into craniofacial relationships. Notably, strong negative correlations were observed between the Jarabak ratio and Y-axis to SN angle, indicating a dynamic interplay between facial height and mandibular position. Additionally, moderate positive correlations were found between Y-axis to SN and TAFH, as well as between TPFH and TAFH. These findings underscore the intricate nature of craniofacial morphology, emphasizing the importance of employing comprehensive assessment methods [18].
Our findings align with previous research by Manish Valiathan et al., who reported Y axis to SN angles of 63.67 ± 3.39° for class I males and 64.74 ± 3.61° for females [18]. In our study, we observed values in similar range across the both gender groups (Group I: 65.0 (IQR: 61.2-69.0), Group II: 65.0 (IQR: 62.0-69.0), Group III: 67.0 (IQR: 59.7- 69.0). These variations may reflect inherent differences across populations and underscore the importance of considering regional factors in cephalometric analyses.
Changes in the mandibular and maxillary jaw base, as noted by Holdaway, can significantly influence soft tissue drape [30]. Our study sought to contribute to this understanding by assessing facial height ratios and growth patterns in individuals with various malocclusions from Timis county. Interestingly, our results suggest that with increasing age, craniofacial characteristics become more defined, particularly in the adult sample [31]. This underscores the dynamic nature of facial growth and the importance of considering age-related changes in cephalometric analyses.
Facial traits often undergo significant variation during growth, necessitating a comprehensive assessment approach. Thus, for our study, participants aged from 9 to 48 were selected to mitigate bias in interpreting facial patterns. Vertical development patterns play a pivotal role in jaw growth direction, with implications for facial height [32]. Classification of facial patterns as hypodivergent or hyperdivergent based on jaw rotation informs treatment approaches and underscores the utility of Angle’s classification in characterizing vertical development patterns [33].
Furthermore, growth projections are essential for estimating future growth and predicting outcomes in orthodontic treatment. Understanding the volume and direction of growth aids in achieving accurate forecasts and guiding treatment decisions [34]. Both hypodivergent and hyperdivergent facial forms are considered unattractive and are commonly recorded in orthodontic problem databases, underscoring the clinical significance of our findings [35]. Overall, our study contributes valuable insights into the complex relationship between cephalometric measurements, growth patterns, and facial morphology, with implications for orthodontic treatment planning and patient care.
Limitations of our study include the use of lateral cephalograms from patients in Timis county, which may not represent the entire population. A broader study encompassing all skeletal malocclusions would provide a more accurate understanding of how different malocclusions impact growth patterns. Additionally, while our investigation sheds light on the relationship between cephalometric measurements and growth patterns, other variables contributing to malocclusion, such as muscle, bone, and teeth changes, were not fully explored. Future research could benefit from considering these factors comprehensively [36,37]. Moreover, the orthodontic treatment’s goal to achieve normal vertical proportions for optimal esthetics underscores the importance of a detailed assessment of the dentofacial complex in both anterior and posterior regions. Integrating fixed and functional appliances during specific growth stages may offer better outcomes than using them separately, highlighting the potential for further investigation into treatment strategies [4,38]. The growth of the musculoskeletal system is directly impacted by a number of factors and demographic traits, as has been noted in other types of craniofacial diseases. [39]
5. Conclusions
This study revealed significant associations between FHR and craniofacial development, emphasizing the importance of recognizing gender differences and investigating skeletal malocclusions’ impact on growth patterns. Treatment planning should integrate both hard and soft tissue alterations, considering the prevalent hypodivergent growth pattern observed in participants. The strong negative correlation between FHR and the Y-axis to SN angle underscores the need for comprehensive treatment strategies. Overall, our findings contribute to understanding facial harmony and guide orthodontic treatment toward optimal esthetic and functional outcomes, emphasizing the importance of individualized planning based on cephalometric evaluation.
Author Contributions
Conceptualization: A.-A.S., C.-A.S. and F.V.; methodology: A.C.M.; validation: R.N., A.P. and C.-A.S.; formal analysis: A.C.M. and A.A.H.; investigation: A.-A.S., A.A.H., and A.C.M.; resources: C.-A.S. and F.V.; data curation: A.A.H.; writing—original draft preparation: A.-A.S.; writing—review and editing: C.-A.S.; visualization: R.N. and A.P.; supervision: C.-A.S. and F.V.; project administration: C.-A.S. All authors have read and agreed to the published version of the manuscript.
Funding
This research has received funding for publication expenses from University of Medicine and Pharmacy “Victor Babe¸s” Timisoara, 9 No., Revolutiei Bv., 300041 Timisoara, Romania.
Institutional Review Board Statement
The study was conducted in accordance with the Declaration of Helsinki and approved by the Institutional Ethics Committee of University of Medicine and Pharmacy “Victor Babes” Timisoara, Romania (CECS nr.13/26.03.2021).
Informed Consent Statement
Informed consent was obtained from all subjects involved in the study.
Data Availability Statement
All data regarding this manuscript can be requested from the corresponding author at andra.stancioiu@umft.ro.
Conflicts of Interest
The authors declare that they have no conflicts of interest regarding this manuscript.
References
- Amatya, S.; Shrestha, R.M.; Napit, S. Growth pattern in skeletal Class I malocclusion: A Cephalometric Study. Orthod. J. Nepal 2021, 11, 49–54. [Google Scholar] [CrossRef]
- Gowda, R.S.; Raghunath, N.; Sahoo, K.C.; Shivlinga, B.M. Comparative study of mandibular morphology in patients with hypodivergent and hyperdivergent growth patterns: A cephalometric study. J. Indian Orthod. Soc. 2013, 47 (Suppl. 3), 377–381. [Google Scholar] [CrossRef]
- Vashisht, L.; Negi, S.; Aggarwal, M.; Sandhu, G.P.S.; Kaushal, B. TO check the reliability of various cephalometric parameters used for predicting the types of malocclusion and growth pattern. J. Adv. Med. Dent. Sci. Res. 2016, 4, 15. [Google Scholar]
- Yadav, R.; Dutta, K.; Gosain, N.; Yadav, A.K.; Yadav, N.; Singh, K.K. Vertical Proportion of the Face: A Cephalometric study. Orthod. J. Nepal 2021, 11, 24–28. [Google Scholar] [CrossRef]
- Alhaija, E.S.A.; Richardson, A. Growth prediction in Class III patients using cluster and discriminant function analysis. Eur. J. Orthod. 2003, 25, 599–608. [Google Scholar] [CrossRef]
- Wins, S.M.; Antonarakis, G.S.; Kiliaridis, S. Predictive factors of sagittal stability after treatment of Class II malocclusions. Angle Orthod. 2016, 86, 1033–1041. [Google Scholar] [CrossRef] [PubMed]
- Cruz, C.V.; Mattos, C.T.; Maia, J.C.; Granjeiro, J.M.; Reis, M.F.; Mucha, J.N.; Vilella, B.; Ruellas, A.C.; Luiz, R.R.; Costa, M.C.; et al. Genetic polymorphisms underlying the skeletal Class III phenotype. Am. J. Orthod. Dentofac. Orthop. 2017, 151, 700–707. [Google Scholar] [CrossRef] [PubMed]
- Auconi, P.; Scazzocchio, M.; Defraia, E.; McNamara, J.A.; Franchi, L. Forecasting craniofacial growth in individuals with class III malocclusion by computational modelling. Eur. J. Orthod. 2014, 36, 207–216. [Google Scholar] [CrossRef] [PubMed]
- Jiménez-Silva, A.; Carnevali-Arellano, R.; Vivanco-Coke, S.; Tobar-Reyes, J.; Araya-Díaz, P.; Palomino-Montenegro, H. Craniofacial growth predictors for class II and III malocclusions: A systematic review. Clin. Exp. Dent. Res. 2021, 7, 242–262. [Google Scholar] [CrossRef]
- Hakeem, U.U.H.; Sidhu, M.S.; Prabhakar, M. A Cephalometric evaluation of dentoskeletal variables and ratios in three different facial types. J. Adv. Med. Dent. Sci. Res. 2021, 9, 51–63. [Google Scholar]
- Padarthi, S.C.; Vijayalakshmi, D.; Apparao, H. Evaluation of Facial Height Ratios and Growth Patterns in Different Malocclusions in a Population of Dravidian Origin–A Cephalometric study. IOSR J. Dent. Med. Sci. 2019, 18, 59–66. [Google Scholar]
- Proffit, W.R.; Fields, H.; Msd, D.M.; Larson, B.; Sarver, D.M. Contemporary Orthodontics, 6e: South Asia Edition-E-Book; Elsevier India: Gurugram, India, 2019. [Google Scholar]
- Nadim, K.A.R.; Rizwan, S. Prevalence of angles malocclusion according to age groups and gender. Pak. Oral Dent. J. 2014, 34. [Google Scholar]
- Solow, B.; Tallgren, A. Head posture and craniofacial morphology. Am. J. Phys. Anthropol. 1976, 44, 417–435. [Google Scholar] [CrossRef]
- Siriwat, P.P.; Jarabak, J.R. Malocclusion and facial morphology is there a relationship? An epidemiologic study. Angle Orthod. 1985, 55, 127–138. [Google Scholar] [PubMed]
- Ahmed, H.M.; Mahmoud, A.B.; Al-Shaham, S.A. The relation among different methods for assessing the vertical jaws relation. IOSR J. Dent. Med. Sci. 2016, 15, 33–38. [Google Scholar]
- Rakosi, T.; An Atlas and Manual of Cephalometric Radiology, U.K., London:Wolfe Medical, 1982.
- Valiathan, M.; Valiathan, A.; Ravinder, V. Jarabak cephalometric analysis reborn. J. Indian Orthod. Soc. 2001, 35, 66–76. [Google Scholar] [CrossRef]
- Alizadeh, V.S.; Nucci, L.; Farahmand, M.; Aghdam, H.M.; Fateh, A.; Jamilian, A.; d’Apuzzo, F. Hard and Soft Tissue Changes in Patients with Borderline Class III Malocclusion after Maxillary Advancement or Mandibular Setback Surgery: A Cross-Sectional Study. Science Repository. 2020.
- Mucedero, M.; Coviello, A.; Baccetti, T.; Franchi, L.; Cozza, P. Stability factors after double-jaw surgery in Class III malocclusion: A systematic review. Angle Orthod. 2008, 78, 1141–1152. [Google Scholar] [CrossRef]
- Abeltins, A.; Jakobsone, G.; Urtane, I.; Bigestans, A. The stability of bilateral sagittal ramus osteotomy and vertical ramus osteotomy after bimaxillary correction of class III malocclusion. J. Cranio-Maxillofac. Surg. 2011, 39, 583–587. [Google Scholar] [CrossRef] [PubMed]
- Mangla, R.; Singh, N.; Dua, V.; Padmanabhan, P.; Khanna, M. Evaluation of mandibular morphology in different facial types. Contemp. Clin. Dent. 2011, 2, 200. [Google Scholar] [CrossRef]
- Vieira, F.P.; Pinzan, A.; Janson, G.; Fernandes, T.M.F.; Sathler, R.C.; Henriques, R.P. Facial height in Japanese-Brazilian descendants with normal occlusion. Dent. Press J. Orthod. 2014, 19, 54–66. [Google Scholar] [CrossRef] [PubMed]
- Al-Jabaa, A.H.; Aldrees, A.M. ANB, Wits and Molar Relationship, Do they correlate in Orthodontic Patients? Dentistry 2014, 4, 1. [Google Scholar]
- Sahu, A.; Kumar, V.; Thakur, S.; Rai, S.; Bharti, P. Facial Morphology and Malocclusion Is there any Relation? A Cephalometric Analysis in Hazaribag Population. J. Contemp. Orthod. 2018, 2, 64–69. [Google Scholar]
- Roi, A.; Roi, C. I.; Andreescu, N. I.; Riviş, M.; Badea, I. D.; Meszaros, N.; Rusu, L.C.; Iurciuc, S. Oral cancer histopathological subtypes in association with risk factors: A 5-year retrospective study. Romanian Journal of Morphology and Embryology, 2020, 61, 1213. [Google Scholar] [CrossRef] [PubMed]
- Maskey, S.; Shrestha, R. Cephalometric approach to vertical facial height. Orthod. J. Nepal 2019, 9, 54–58. [Google Scholar] [CrossRef]
- Taner, L.; Gürsoy, G.M.; Uzuner, F.D. Does Gender Have an Effect on Craniofacial Measurements? Turk. J. Orthod. 2019, 32, 59. [Google Scholar] [CrossRef] [PubMed]
- Wang, M.F.; Otsuka, T.; Akimoto, S.; Sato, S. Vertical facial height and its correlation with facial width and depth: Three dimensional cone beam computed tomography evaluation based on dry skulls. Int. J. Stomatol. Occlusion Med. 2013, 6, 120–129. [Google Scholar] [CrossRef]
- Holdaway, RA. A Soft Tissue Cephalometric Analysis and Its Use In Orthodontic Treatment Planning Part II. Am. J. Orthod. 1984, 84, 1–28. [Google Scholar] [CrossRef] [PubMed]
- Kerr, W.J.S.; Hirst, D. Craniofacial characteristics of subjects with normal and postnormal occlusions—A longitudinal study. Am. J. Orthod. Dentofac. Orthop. 1987, 92, 207–212. [Google Scholar] [CrossRef]
- Björk, A. The nature of facial prognathism and its relation to normal occlusion of the teeth. Am. J. Orthod. 1951, 37, 106–124. [Google Scholar] [CrossRef] [PubMed]
- Schudy, F.F. Vertical growth versus anteroposterior growth as related to function and treatment. Angle Orthod. 1964, 34, 75–93. [Google Scholar]
- Johnston, L.E. A simplified approach to prediction. Am. J. Orthod. 1975, 67, 253–257. [Google Scholar] [CrossRef] [PubMed]
- Opdebeeck, H.; Bell, W.H. The short face syndrome. Am. J. Orthod. 1978, 73, 499–511. [Google Scholar] [CrossRef] [PubMed]
- Francisconi, M.F.; Henriques, J.F.C.; Janson, G.; Freitas, K.M.S.D.; Santos, P.B.D.D. Stability of Class II treatment with the Bionator followed by fixed appliances. J. Appl. Oral Sci. 2013, 21, 547–553. [Google Scholar] [CrossRef] [PubMed]
- Miguel, J.A.M.; Cunha, D.L.; Calheiros, A.D.A.; Koo, D. Rationale for referring class II patients for early orthodontic treatment. J. Appl. Oral Sci. 2005, 13, 312–317. [Google Scholar] [CrossRef]
- Michele, C.; Federica, A.; Alessandro, S. (2015). Two-dimensional and three-dimensional cephalometry using cone beam computed tomography scans. J. Craniofacial Surg. 2015, 26, e311–e315. [Google Scholar]
Figure 2.
(a) WebCeph-Line analysis, displaying the Y axis to SN, anterior facial height, and posterior facial height; (b) WebCeph-Chart, presenting mean values, standard deviation, resulting values, severity, polygonal chart, and their interpretations.
Figure 2.
(a) WebCeph-Line analysis, displaying the Y axis to SN, anterior facial height, and posterior facial height; (b) WebCeph-Chart, presenting mean values, standard deviation, resulting values, severity, polygonal chart, and their interpretations.
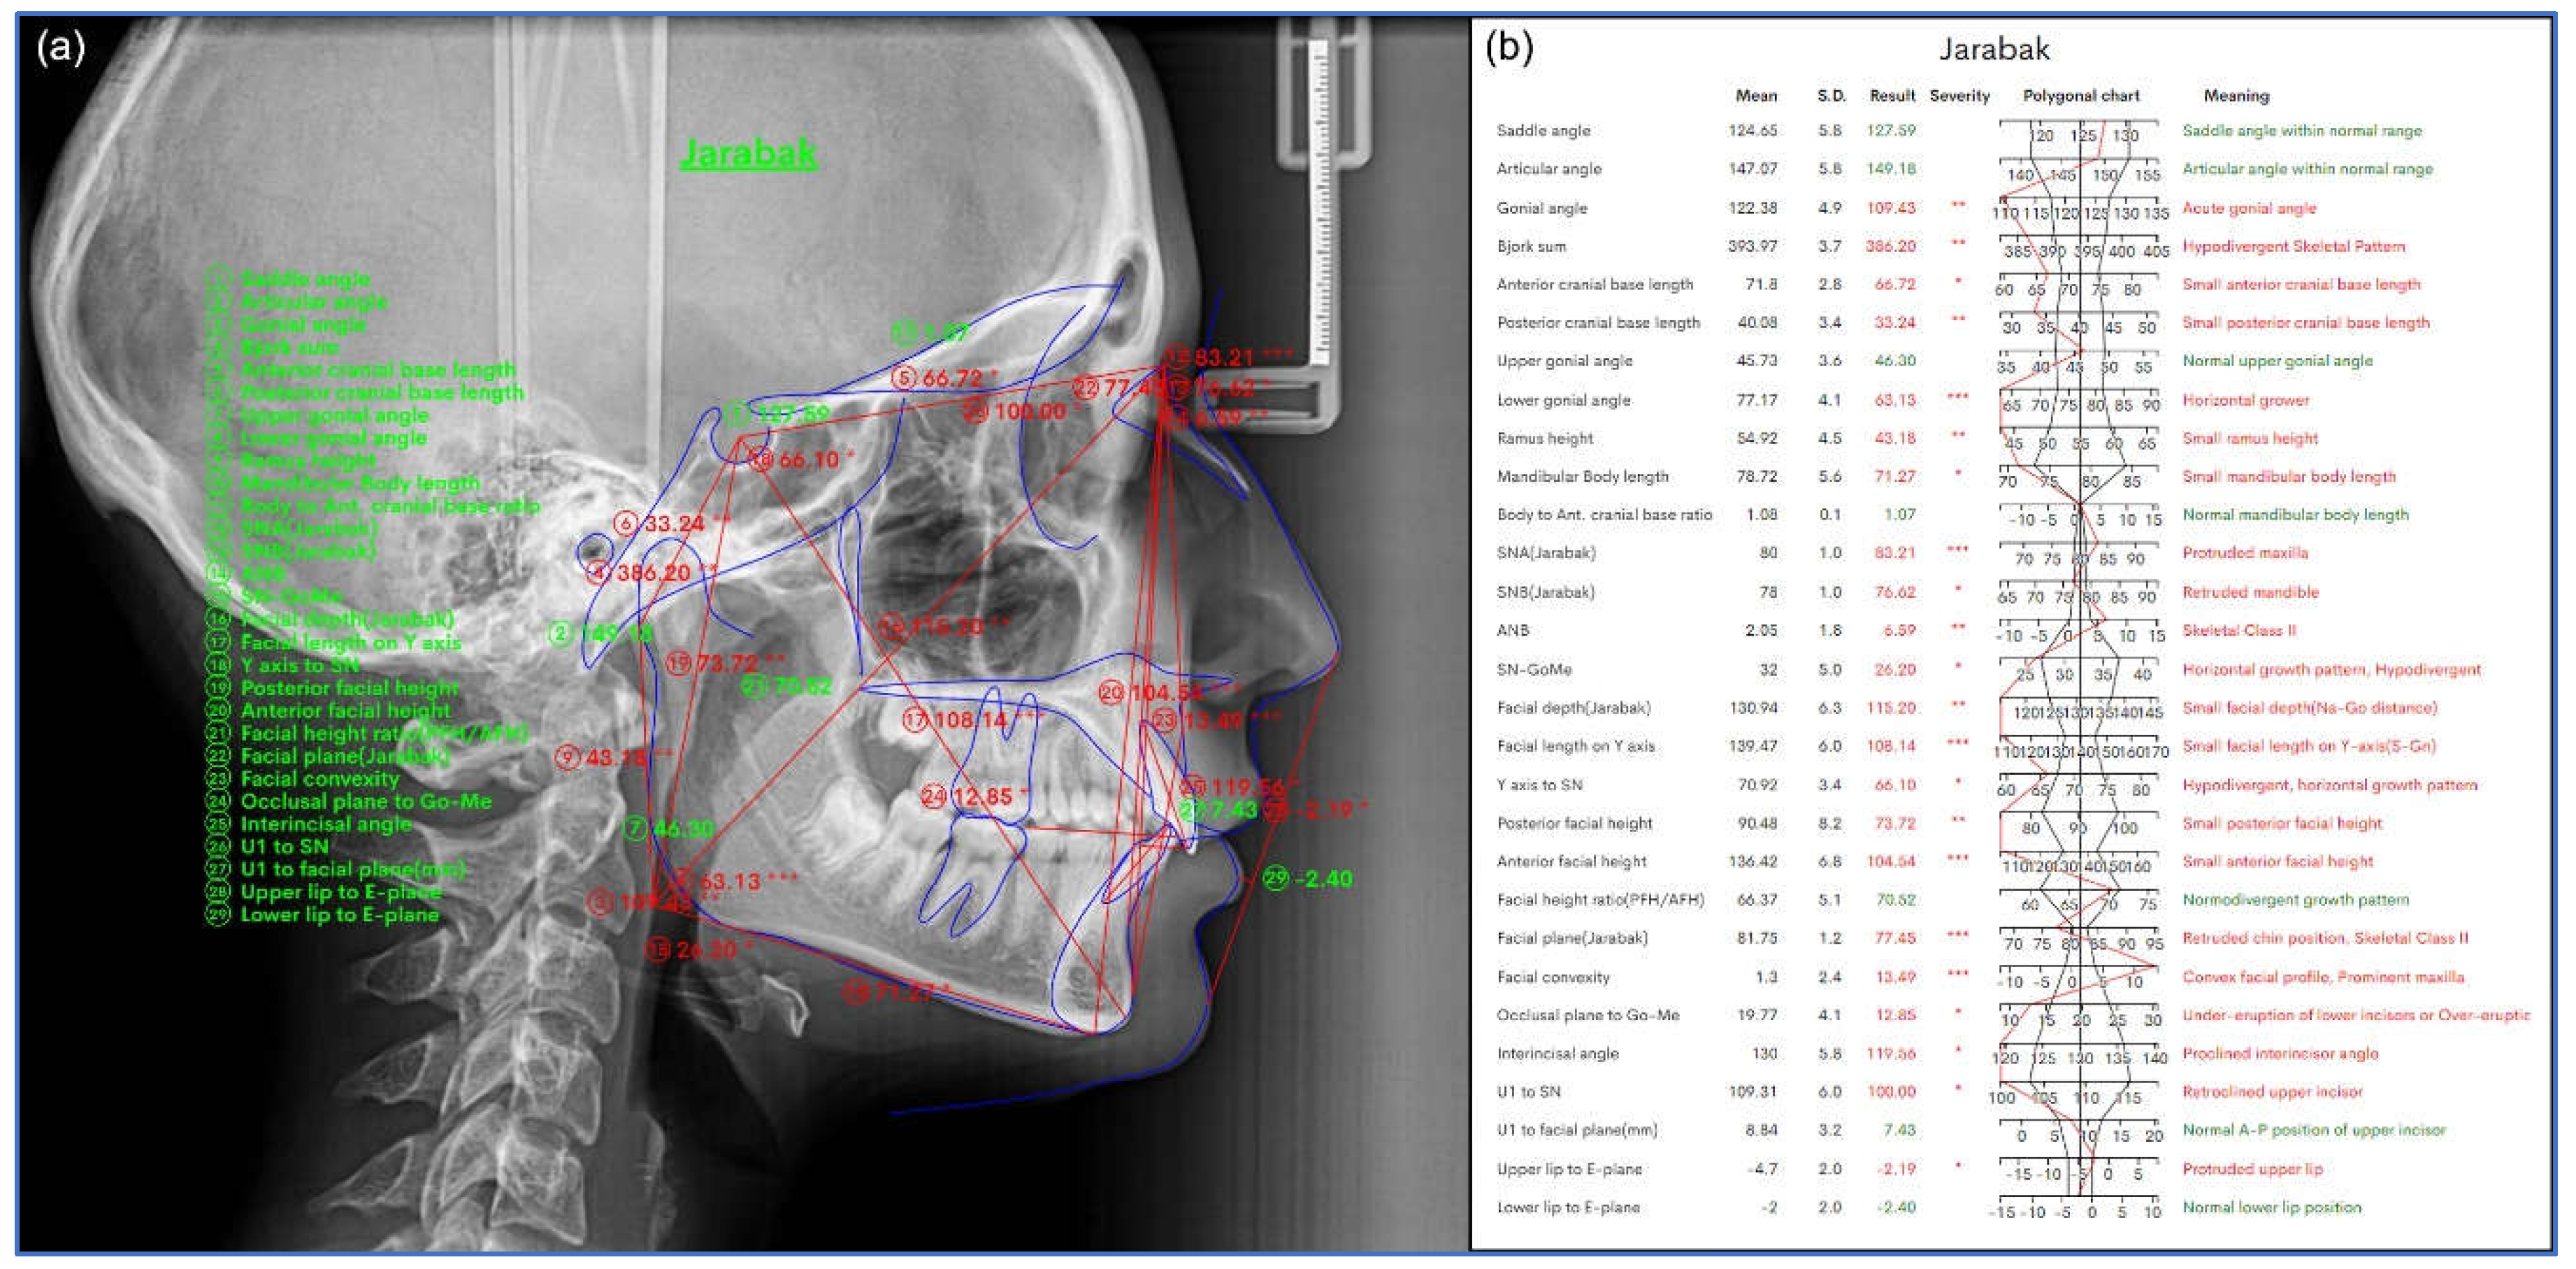
Figure 3.
Y Axis to SN (Sella-Nasion and Sella-Gnathion) Measurement (N-S-Gn).
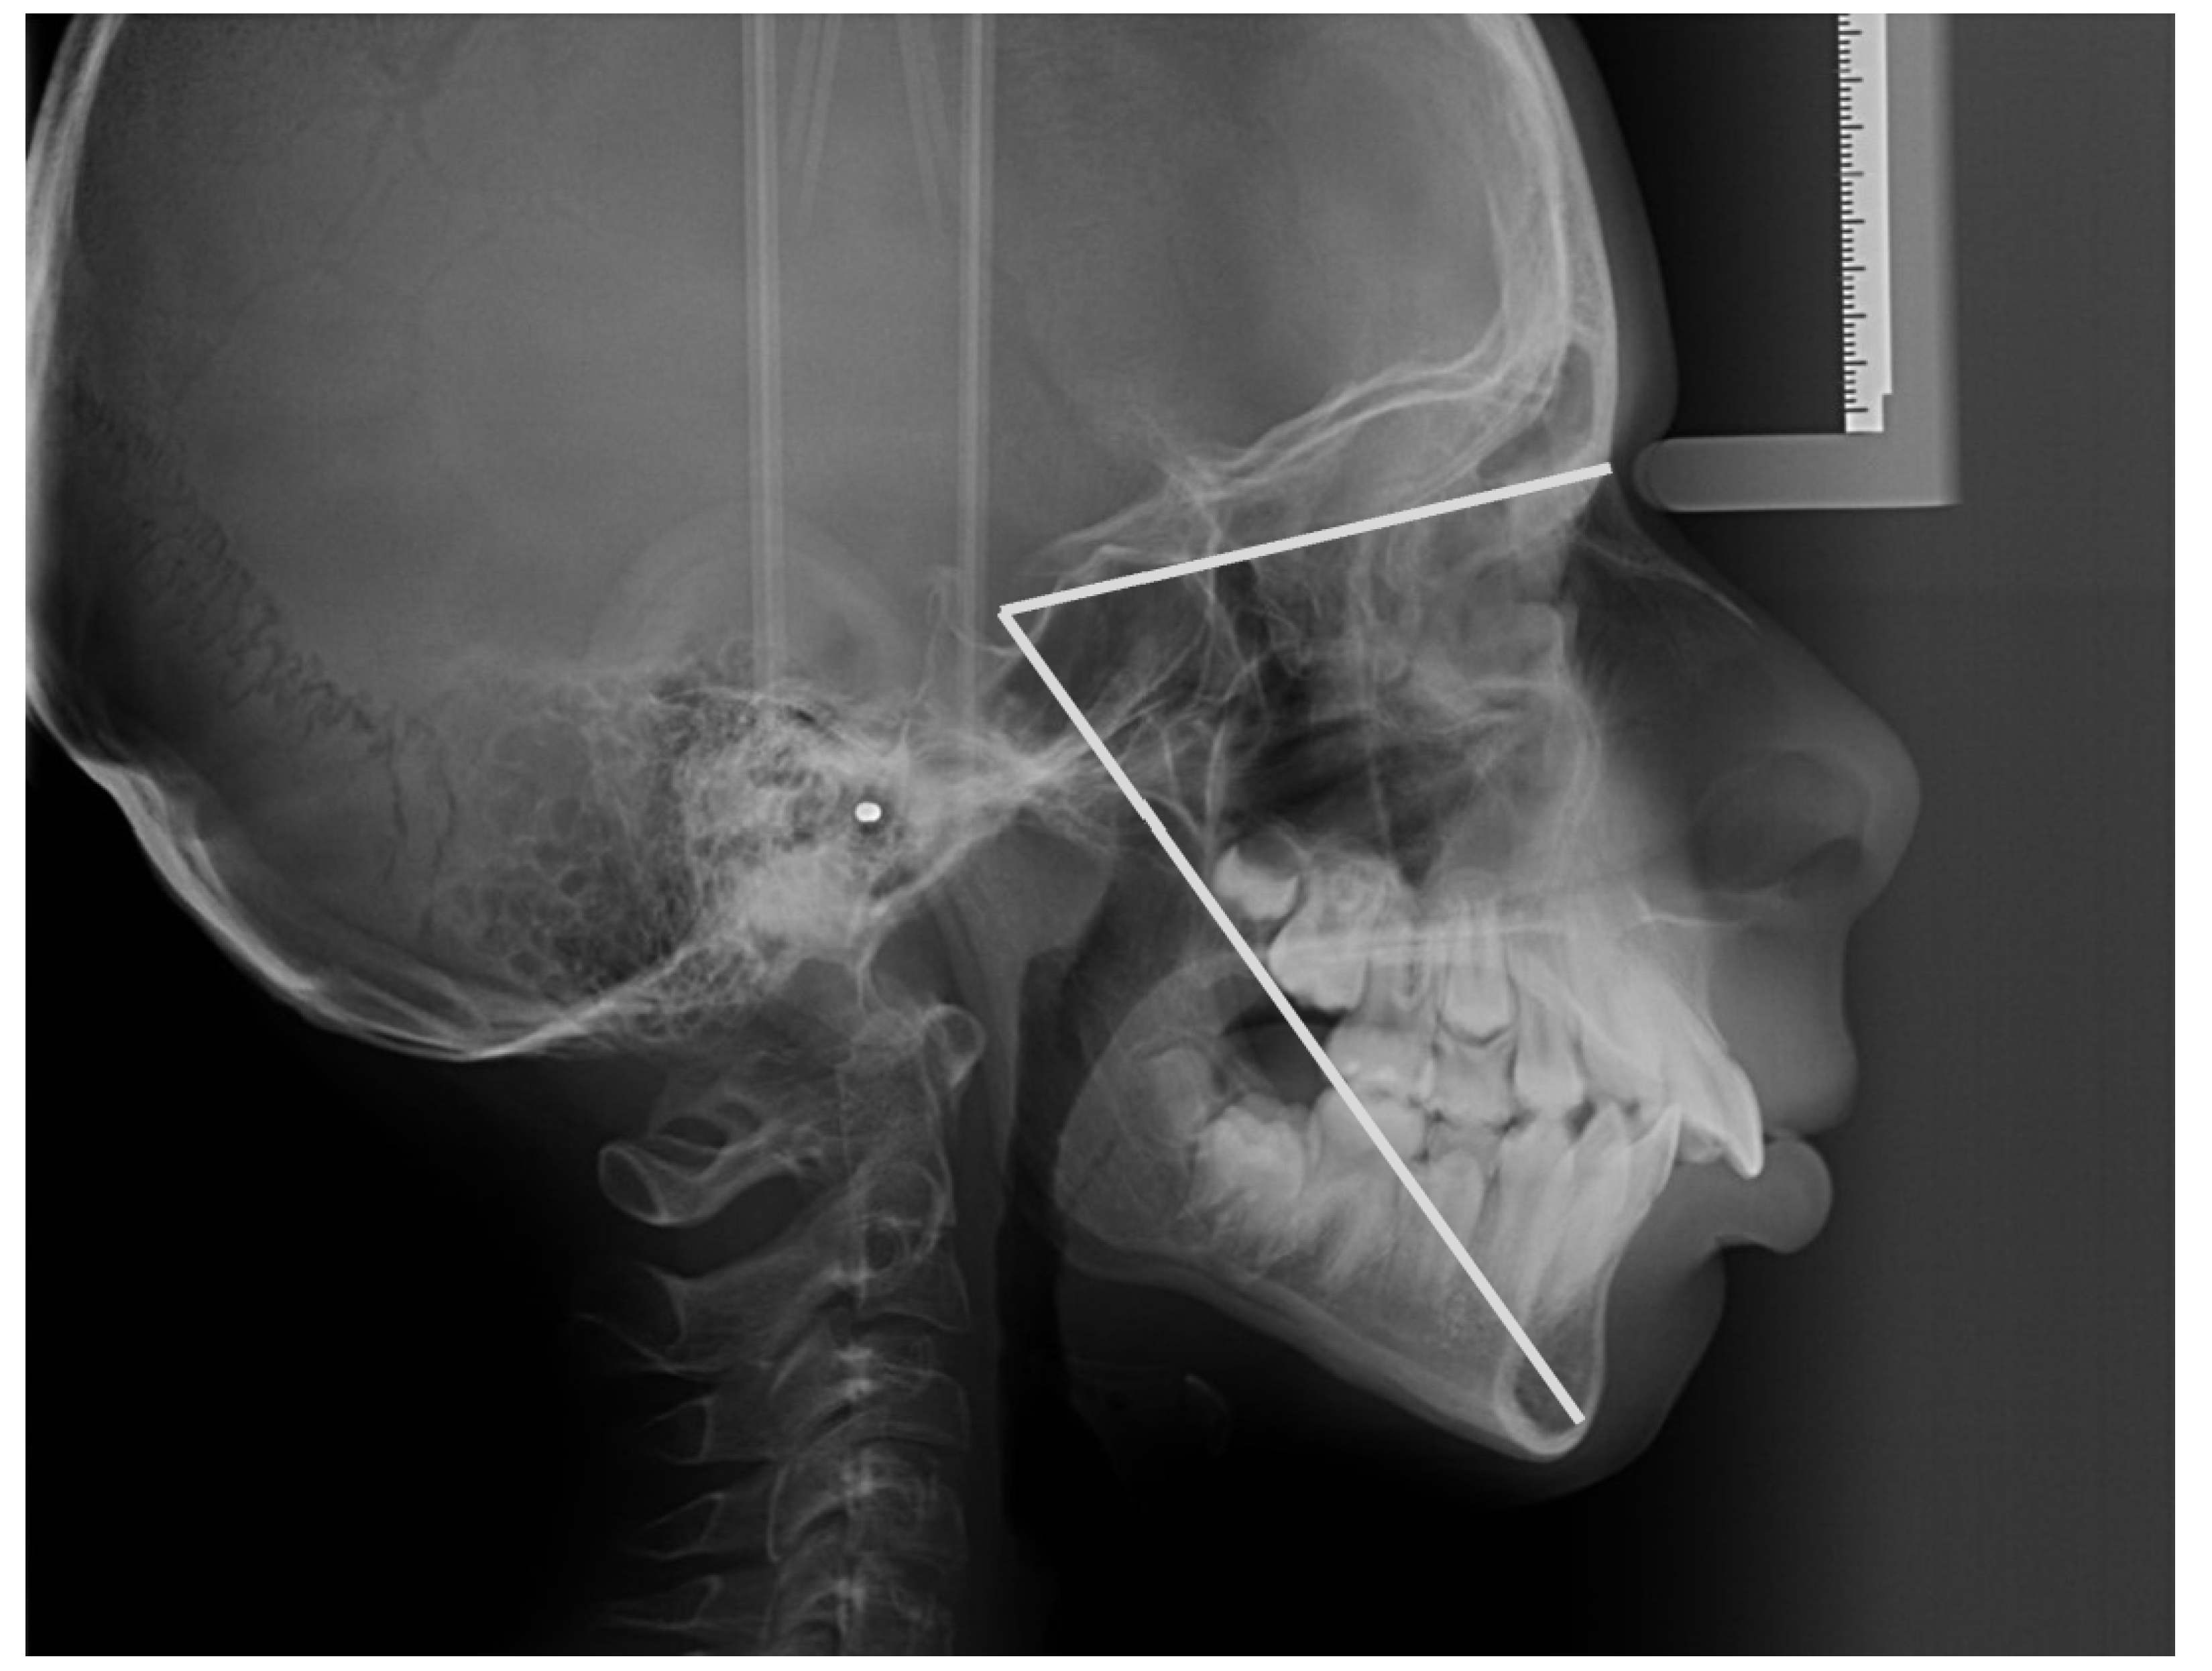
Figure 4.
Correlation between the TPFH, TAFH, Jarabak’s ratio and Y axis to SN.
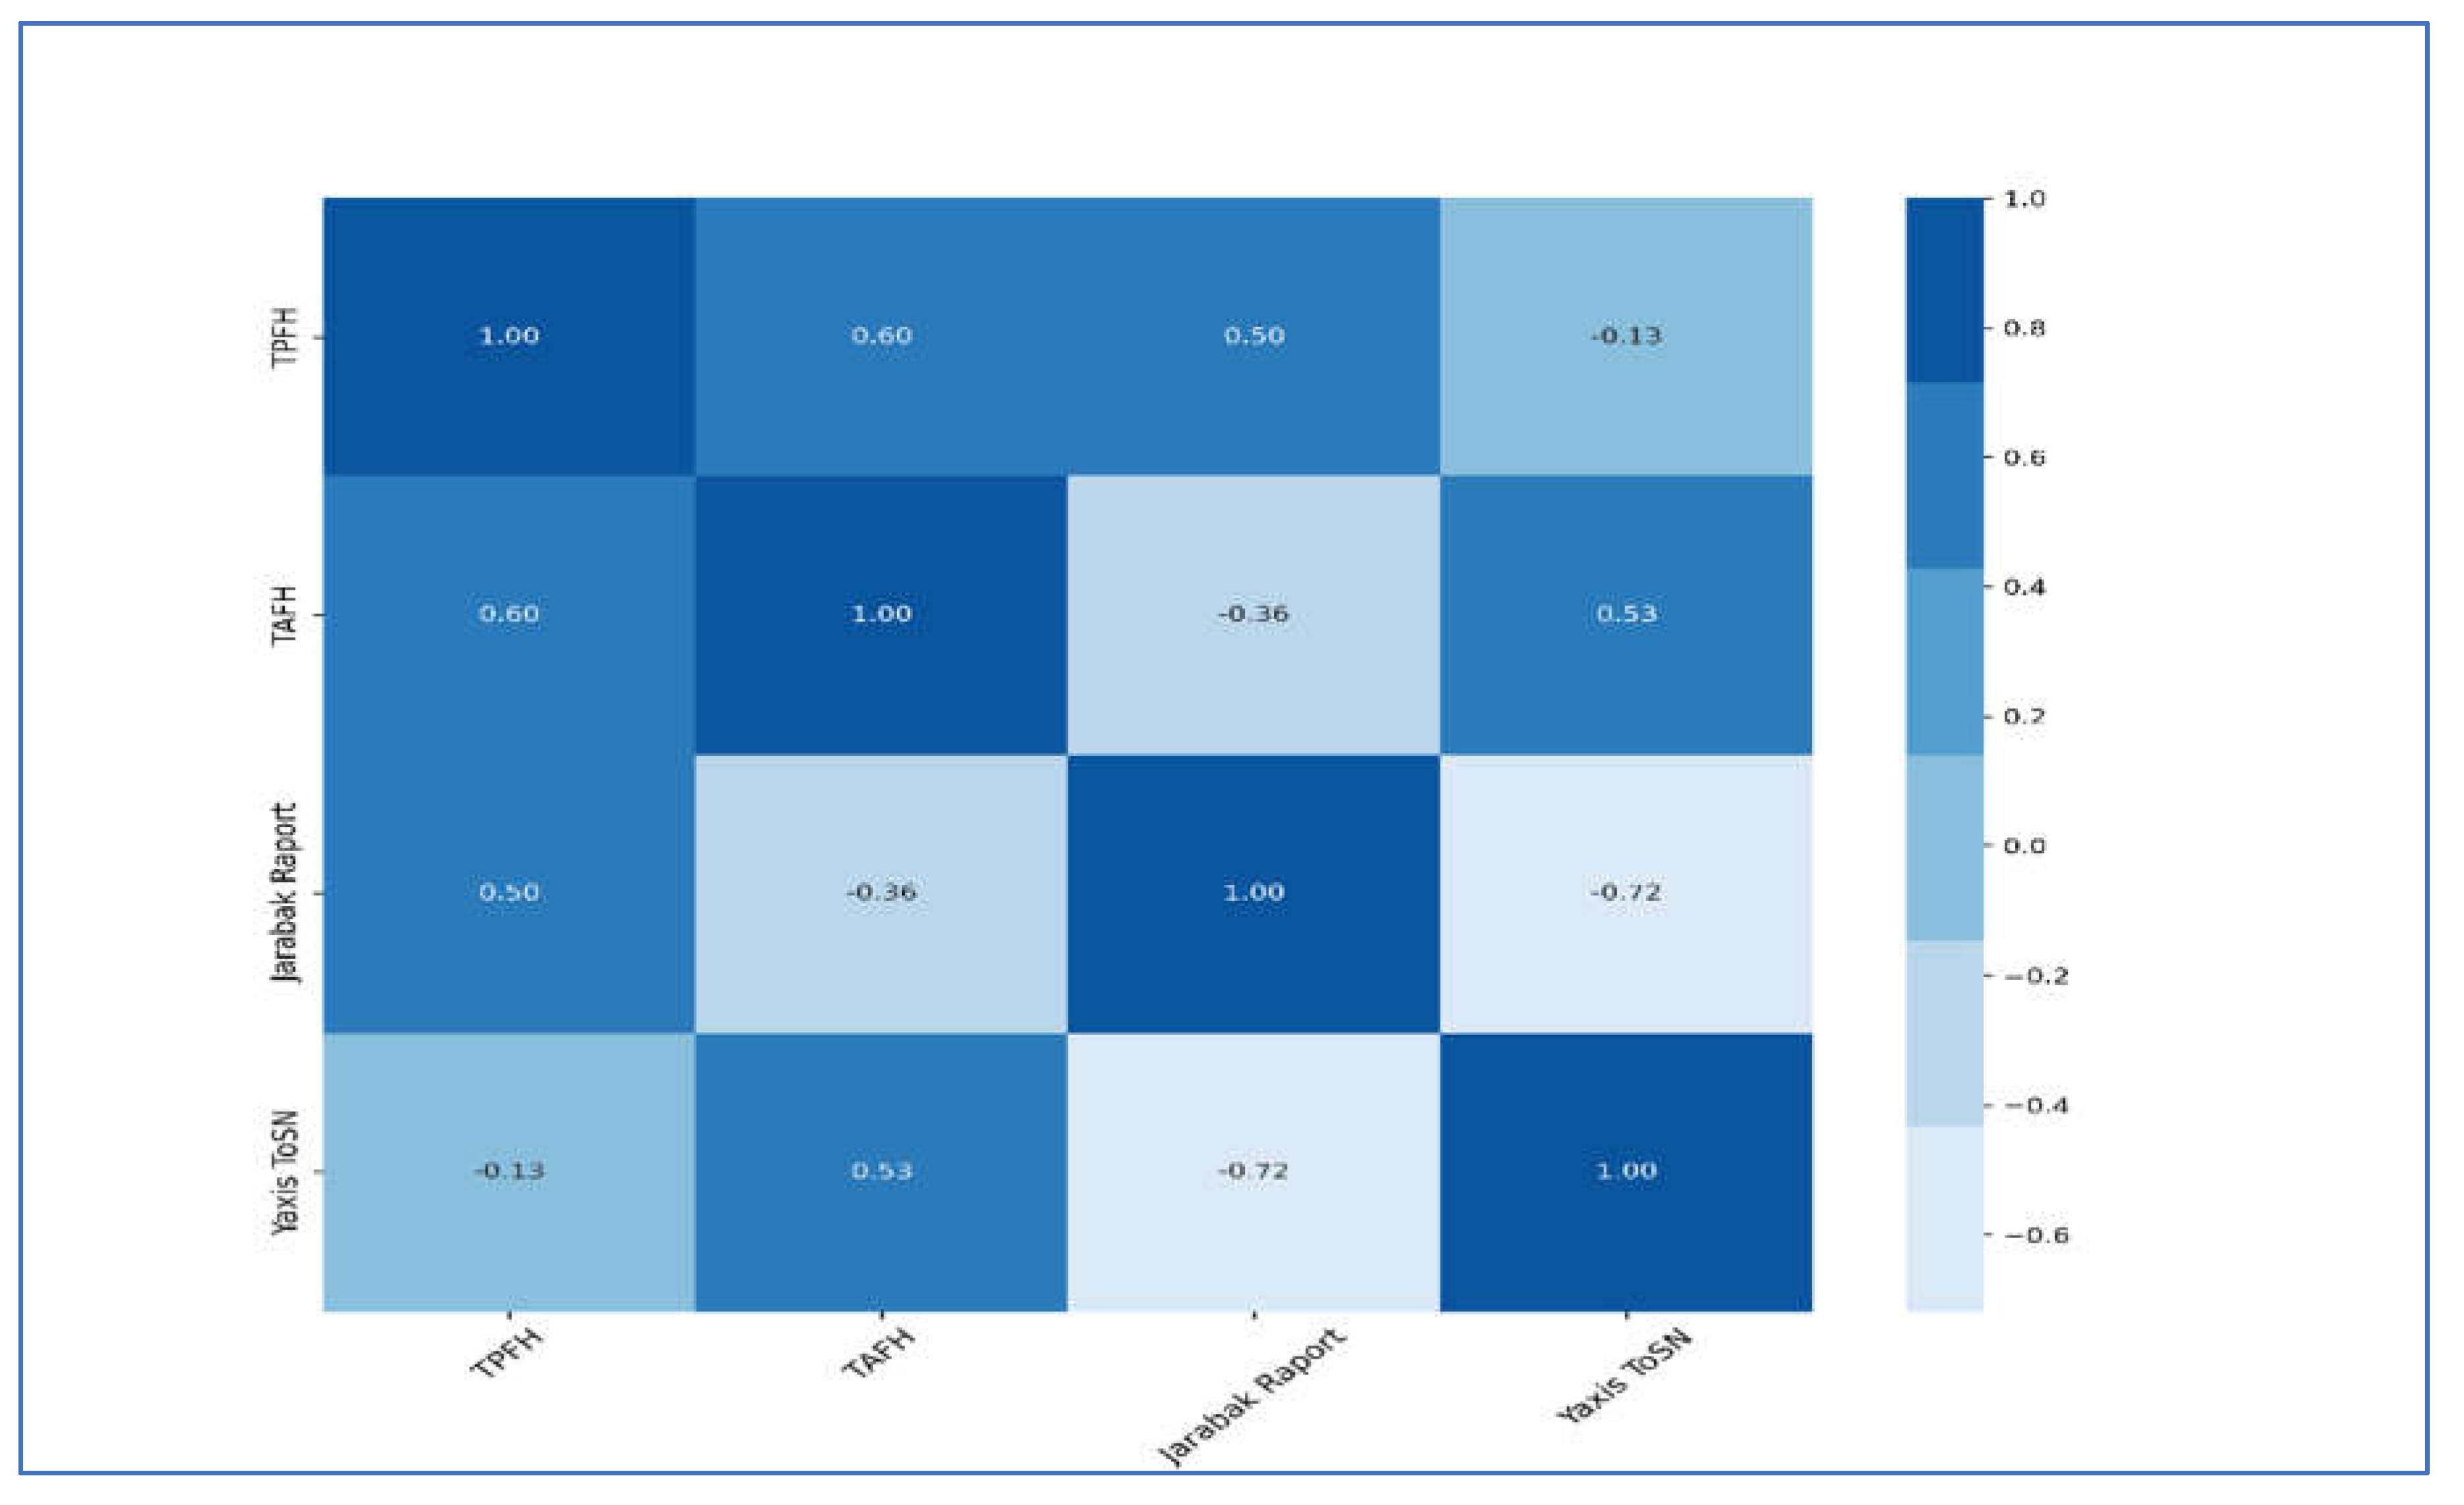
Table 2.
Baseline characteristic of the anthropometric parameters.
| Characteristic | N = 94 |
|---|---|
| Age | 21 (14, 28) |
| TPFH | 76 (70, 81) |
| TAFH | 112 (104, 120) |
| Jarabak’s ratio | 67.0 (64.0, 72.0) |
| Molar Class | |
| 1 | 35 (37%) |
| 2 | 46 (49%) |
| 3 | 13 (14%) |
| Y axis to SN | 65.0 (62.0, 69.0) |
| Gender | |
| M | 35 (37%) |
| F | 59 (63%) |
| 1 Median (IQR); n (%) |
TAFH: Total anterior facial height; TPFH: Total posterior facial height.
Table 3.
Association between molar class distribution and gender.
| Male (N=35) | Female (N=59) | Total (N=94) | p value | |
|---|---|---|---|---|
| Group I | 13.0 (38.2%) | 21.0 (35.6%) | 34.0 (36.6%) | 0.2231 |
| Group II | 19.0 (55.9%) | 27.0 (45.8%) | 46.0 (49.5%) | |
| Group III | 2.0 (5.9%) | 11.0 (18.6%) | 13.0 (14.0%) |
1Pearson’s Chi-squared test, n (%)—number and percentages.
Table 4.
Association between molar class distribution and the anthropometric measurements of facial size.
Table 4.
Association between molar class distribution and the anthropometric measurements of facial size.
| N | I | II | III | Test Statistic | |
|---|---|---|---|---|---|
| (N=35) | (N=46) | (N=13) | |||
| Y axis to SN | 94 | 61.2 65.0 69.0 | 62.0 65.0 69.0 | 59.7 67.0 69.0 | F2,91=0.00, P=1.001 |
| TPFH | 94 | 71.2 77.0 81.0 | 69.0 75.0 81.1 | 70.7 76.0 78.3 | F2,91=0.30, P=0.741 |
| TAFH | 94 | 104.0 112.0 122.8 | 104.0 112.0 119.1 | 107.0 113.0 116.3 | F2,91=0.26, P=0.771 |
N is the number of non-missing value. 1Kruskal-Wallis. n(number), Median+ IQR.
Table 5.
Distribution of molar class and gender between hyperdivergent, normodivergent and hypodivergent facial skeletal patterns.
Table 5.
Distribution of molar class and gender between hyperdivergent, normodivergent and hypodivergent facial skeletal patterns.
| Hyperdivergent (N=6) | Normodivergent (N=13) | Hypodivergent (N=75) | Total (N=94) | p value | |
|---|---|---|---|---|---|
| Molar Class | 0.4281 | ||||
| I | 2.0 (33.3%) | 8.0 (61.5%) | 25.0 (33.3%) | 35.0 (37.2%) | |
| II | 3.0 (50.0%) | 4.0 (30.8%) | 39.0 (52.0%) | 46.0 (48.9%) | |
| III | 1.0 (16.7%) | 1.0 (7.7%) | 11.0 (14.7%) | 13.0 (13.8%) | |
| Gender | 0.4661 | ||||
| F | 5.0 (83.3%) | 7.0 (53.8%) | 47.0 (62.7%) | 59.0 (62.8%) | |
| M | 1.0 (16.7%) | 6.0 (46.2%) | 28.0 (37.3%) | 35.0 (37.2%) |
1Pearson’s Chi-squared test.
Table 6.
Predictors of gender differentiation based on anthropometric measurements.
| Model Coefficients—Gender | ||||||||||||||||||||||
|---|---|---|---|---|---|---|---|---|---|---|---|---|---|---|---|---|---|---|---|---|---|---|
| 95% Confidence Interval | ||||||||||||||||||||||
| Predictor | Estimate | SE | Z | p | Odds ratio | Lower | Upper | |||||||||||||||
| Intercept | -1.30310 | 4.5273 | -0.288 | 0.773 | 0.272 | 3.81e-5 | 1939.431 | |||||||||||||||
| TPFH | -0.00882 | 0.0510 | -0.173 | 0.863 | 0.991 | 0.897 | 1.095 | |||||||||||||||
| TAFH | 0.10096 | 0.0441 | 2.291 | 0.022 | 1.106 | 1.015 | 1.206 | |||||||||||||||
| Y axis to SN | -0.15276 | 0.0748 | -2.043 | 0.041 | 0.858 | 0.741 | 0.994 | |||||||||||||||
Note. Estimates represent the log odds of “Gender = M” vs. “Gender = F”.
Table 7.
Predictors of divergence type based on anthropometric measurements.
| Model Coefficients—Divergent | 95% Confidence Interval | |||||||
|---|---|---|---|---|---|---|---|---|
| Divergent | Predictor | Estimate | SE | Z | p | Odds ratio | Lower | Upper |
|
Hyperdivergent—Normodivergent |
Intercept | 24.8994 | 12.1376 | -2.051 | 0.040 | 1.54e-11 | 7.16e-22 | 0.330 |
| Age | -0.0564 | 0.1059 | -0.532 | 0.594 | 0.945 | 0.768 | 1.163 | |
| Yaxis_to_SN | 0.3547 | 0.1732 | 2.047 | 0.041 | 1.426 | 1.015 | 2.002 | |
|
Hypodivergent—Normodivergent |
Intercept | 21.0955 | 7.1048 | 2.969 | 0.003 | 1.45e0+9 | 1300.356 | 1.62e+15 |
| Age | 0.0475 | 0.0468 | 1.015 | 0.310 | 1.049 | 0.957 | 1.149 | |
| Yaxis to_SN | -0.3050 | 0.1052 | -2.900 | 0.004 | 0.737 | 0.600 | 0.906 | |
SE: Standard error.
Disclaimer/Publisher’s Note: The statements, opinions and data contained in all publications are solely those of the individual author(s) and contributor(s) and not of MDPI and/or the editor(s). MDPI and/or the editor(s) disclaim responsibility for any injury to people or property resulting from any ideas, methods, instructions or products referred to in the content. |
© 2024 by the authors. Licensee MDPI, Basel, Switzerland. This article is an open access article distributed under the terms and conditions of the Creative Commons Attribution (CC BY) license (http://creativecommons.org/licenses/by/4.0/).
Copyright: This open access article is published under a Creative Commons CC BY 4.0 license, which permit the free download, distribution, and reuse, provided that the author and preprint are cited in any reuse.


