
Submitted:
27 June 2025
Posted:
30 June 2025
You are already at the latest version
Abstract
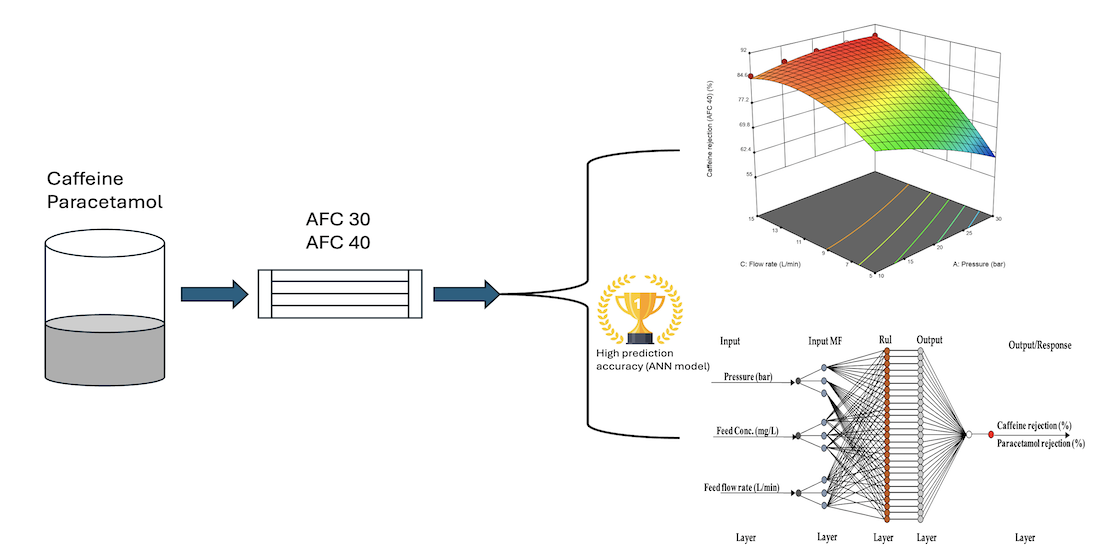
The integration of computational intelligence techniques into pharmaceutical wastewater treatment offers promising opportunities to improve process efficiency and minimize op-erational costs. This study compares the predictive capabilities of Response Surface Methodology (RSM) and Artificial Neural Network (ANN) models in forecasting the rejec-tion efficiencies of caffeine and paracetamol using AFC 40 and AFC 80 nanofiltration (NF) membranes. Experiments were conducted under varying operating conditions, including transmembrane pressure, feed concentration, and flow rate. The predictive performance of both models was evaluated using statistical metrics such as the Coefficient of Determina-tion (R²), Root Mean Square Error (RMSE), Marquardt’s Percentage Squared Error Devia-tion (MPSED), Hybrid fractional error function (HYBRID), and Average Absolute Devia-tion (AAD). Both models demonstrated strong predictive accuracy, with R² values of 0.9867 and 0.9832 for RSM and ANN, respectively, in AFC 40 membranes, and 0.9769 and 0.9922 in AFC 80 membranes. While both approaches closely matched the experimental results, the ANN model consistently yielded lower error values and higher R², indicating superior predictive performance. These findings support the application of ANN as a ro-bust modelling tool in optimizing NF membrane processes for pharmaceutical removal.
Keywords:
caffeine
; paracetamol
; artificial neural networks (ANN)
; response surface methodology (RSM)
; nanofiltration (NF)
1. Introduction
The world’s rivers are full of pharmaceuticals, which is unsustainable. Wilkinson et al. [1] obtained samples from 258 rivers across all continents. They analysed each sample for traces of pharmaceuticals. Their findings showed that only one indigenous village in Venezuela, where modern medicines are not used, and Iceland was free from contamination. In all other rivers, traces of pharmaceuticals were detected. The findings of this study are conclusive and provide strong evidence for pharmaceutically active compounds (PhACs) in water bodies, which potentially threaten aquatic ecosystems and human health. These PhACs in marine ecosystems originate from domestic sewage, hospital effluent, pharmaceutical manufacturing industries, animal husbandry, and other sources [2].
To address these issues, pharmaceutical wastewater typically undergoes a series of treatment processes. The primary treatment focuses on removing suspended solids and particulate matter, while the secondary treatment targets the reduction of biodegradable organic compounds. Despite the effectiveness of these stages, trace amounts of suspended solids and dissolved organic matter may still exist in the wastewater [3]. These residual contaminants can pose significant environmental risks if discharged without adequate treatment. As a result, the continued development and improvement of advanced wastewater treatment technologies are essential to ensure the safe and effective treatment of pharmaceutical and other industrial wastewater.
Pressure-driven membrane processes are the most widely used among the various methods used for advanced wastewater treatment. These processes operate on the principle of hydraulic pressure to effect separation. The four main types of pressure-driven membrane processes are microfiltration (MF), ultrafiltration (UF), nanofiltration (NF), and reverse osmosis (RO) [4]. Compared to other pressure-driven membrane processes, NF is highly known for its efficiency in separating small particles with a pore size between 0.1 and 1nm; NF membranes allow water and monovalent salts to pass through the membrane while retaining multivalent ions, low molecular weight molecules, sugars, proteins, and other organic compounds. This technology has become a promising solution for removing pharmaceuticals from contaminated wastewater, combining high selectivity, energy efficiency, and cost-effectiveness. The NF membrane is influenced by several factors, including the chemical composition of the feed solution (water characteristics, pH, ionic strength, and solute concentration) and separation conditions (transmembrane pressure, feed flow rate, and temperature) [5]. Additionally, the membrane’s properties, including its hydrophilicity or hydrophobicity, surface charge, morphology, pore size, and roughness, play significant roles in the membrane fouling [5]. These parameters have been extensively studied in various research studies [6,7].
Pharmaceutical contaminants, including analgesics and stimulants, are among the most frequently detected pollutants in rivers across many countries [1]. Paracetamol (acetaminophen), a widely used analgesic, is one of the most common micropollutants in the environment due to its high water solubility, presence in more than 600 over-the-counter medicines [8], and low biodegradability [9]. Similarly, caffeine, a common stimulant and lifestyle pharmaceutical compound, is prevalent in aquatic environments due to its widespread consumption and subsequent discharge. Given their universality, environmental persistence, and potential ecological impact, paracetamol and caffeine were selected as model pollutants for this study to investigate their removal efficiency in an NF process.
In membrane science and technology, modelling has emerged as a valuable tool for predicting membrane separation processes by establishing a relationship between system variables and their responses. This capability not only aids in understanding complex interactions within membrane systems but also offers practical advantages. Using numerical mathematical methods, modelling helps save costs and time by reducing the need for extensive physical experimentation. Furthermore, it enhances process efficiency, enables predictive modelling, minimizes errors, and optimizes resource use. These benefits make it a critical tool for researchers and industries seeking to streamline chemical process development and operations [10].
Some modelling tools that can solve linear and non-linear multivariate regression problems are Response Surface Methodology (RSM) and Artificial Neural Network (ANN).
In recent years, RSM based on the design of experiments (DoE) has been applied successfully in different areas of membrane technology [5,11,12,13,14,15,16]. RSM is a widely used statistical and mathematical tool for experimental design and optimization, particularly in complex systems involving multiple input parameters and searching optimum conditions of variables to predict targeted responses [17]. The input parameters that affect the process are called independent variables, while the responses are called dependent variables [18].
RSM provides a structured framework with three key components: experimental design, model fitting, and optimization [19]. The experimental design phase ensures accuracy by spanning a broad range of input variable values, using designs such as the central composite design (CCD), the Box-Behnken design (BBD), the Central Composite Rotatable Design (CCRD) [18] or the custom design [20]. Subsequently, a mathematical model is developed to describe the relationship between inputs and the response, typically expressed as a polynomial equation. Regression methods, such as least squares, estimate the model’s coefficients. Finally, the optimization phase identifies the ideal input values that yield the desired response.
Similarly, RSM has proven to be a valuable tool for optimizing various membrane-based processes. For instance, Mohammad et al. [21] applied RSM based on BBD to determine the optimal conditions for fabricating polyethersulfone (PES) NF membranes by phase inversion. Four essential parameters, including PES polymer concentration, polyvinylpyrrolidone (PVP) concentration, evaporation time and coagulation bath temperature, were the factors influencing the separation process, and the optimization objectives were water flux and rejection. The analysis of variance shows that all four independent parameters are statistically significant, and the final model is reasonably accurate. This research underscores the adaptability of RSM in optimizing operational parameters and improving process efficiency across various membrane technology applications.
On the other hand, an artificial neural network (ANN) is a computational model inspired by the superior qualities of the human brain, designed to recognize patterns and solve complex problems. This modern computational approach utilizes non-linear modelling and complex datasets [22]. The system is designed to operate as a black box model that describes the relationship between the input and the output system[23] without needing to understand the physical characteristics of the process [24]. A typical ANN consists of an input (independent) layer, one or more hidden layers with many hidden neurons and an output (dependent) layer [25]. Weights and biases mathematically link these layers [26]. This relationship is established from a learning process in which a data set is provided to the network; hence, it is a data-driven model.
Coskun et al. [27] developed an ANN model to analyse flux behaviour during cross-flow microfiltration of a phosphate and fly ash wastewater mixture under varying conditions. Two ANN architectures (NN1, NN2) were designed and evaluated using different algorithms and network types. The models demonstrated superior predictive accuracy, achieving high correlation values (R² = 0.991 and 0.988), low error distributions and precise normalized flux predictions. This highlights the ANN’s capability to reliably capture the effects of key process variables, such as time, pressure, concentrations, and membrane type, on flux behaviour.
This study aims to evaluate and compare the performance of two statistical mathematical models, RSM and ANN, to predict and optimize pharmaceutical rejection using polymeric composite membranes (AFC 40 and AFC 80) in NF processes. Experimental data were used to model and predict the rejection behaviour of two pharmaceutical compounds: caffeine and paracetamol. The analysis considered key input variables such as feed concentration (5, 10, and 20 mg/L), transmembrane pressure (10, 15, 20, 25, 30 bar), and feed flow rate (5, 10, and 15 L/min) to forecast pharmaceutical rejection efficiencies. Caffeine rejection was assessed using AFC 40 membranes, while paracetamol rejection was evaluated using AFC 80 membranes. Notably, this work presents the first direct comparison of RSM and ANN in the context of caffeine and paracetamol removal through NF membranes, contributing valuable insights into model accuracy and process optimization in pharmaceutical wastewater treatment.
2. Materials and Methods
2.1. Feed Solution Preparation
The pharmaceuticals selected for this study have molecular weights of 194.2 and 151.2 g/mol (caffeine and paracetamol), respectively. To carry out this experiment, each of these pharmaceuticals was diluted in pure water at 300 mg/L, and these stock solutions were stored in a refrigerator at approximately 5 °C.
The pharmaceutical tablets were ground using a mortar and pestle to prepare the feed solution, followed by ultrasonication of the solution for 30 min. This solution was then filtered using a 0.7 µm glass filter in a dead-end filtration unit at a 0.5 bar vacuum and diluted as required. All solutions were prepared using distilled water with a conductivity of approximately 15 μS/cm.
2.2. Experimental Set-Up and Procedures
The membranes were received as tubular polymeric NF membranes (AFC 40 and AFC 80). They were purchased from PCI Membrane Systems, Poland. They were gently washed with demineralized water to remove preservatives and stored in demineralized water at 25 °C. The membranes were first wetted in demineralized water for at least 24 h. Before NF experiments, the membrane was compacted under 31 bar transmembrane pressure with demineralized water as the feed for 2 h until there was no variation in permeate flux.
The NF unit consisted of a 10 L feed tank equipped with an NF membrane module (FT 18, Armfield, GB, Ringwood, United Kingdom (UK). The membrane module contained two tubular AFC 40 membranes for separating solutes from wastewater. Furthermore, caffeine was removed from the pharmaceutical-contaminated water using two tubular AFC 80 membranes. The pharmaceutical separation was carried out individually, and the conditions were optimized.
A pH meter (inoLab pH 7110 - pH/mV meter + SenTix 21 electrode) was incorporated into the feed tank, and a pH ranging from 6.3 to 6.6 was maintained. The feed solution temperature was maintained at 25 ± 0.5 °C using a TAEevo heat exchanger. The NF experiments operated in a total recirculation mode in which concentrate and permeate streams were returned to the feed tank to keep the feed concentration constant. Finally, a weighing machine (Balance KERN KB, Balingen, Germany) with an accuracy of ± 0.01 g gravimetrically measured the permeate flux. A schematic diagram of the NF unit is shown in Figure 1.
2.3. Pharmaceuticals Rejection Tests
Pharmaceutical rejections were evaluated using 5, 10, and 20 mg/L of caffeine and paracetamol solutions. The transmembrane pressure for AFC 40 and AFC 80 membranes was varied in the range of 10–30 bar. The feed solution pH ranged from 6.3 to 6.6 while the feed solution temperature was kept constant at 25.0 ± 0.5 °C throughout the experiments. Feed and permeate samples were collected after the system was equilibrated for 1 h under each condition and analysed as described in Equations (1) and (2). The solute rejection performance () was calculated based on the concentration of each PhAC in the permeate (, mg/L) and feed (, mg/L) streams, as shown in Equation (1).
The pharmaceutical concentration in the feed solution () and permeate () were calculated by using high-performance liquid chromatography (HPLC, Agilent 1260 infinity II Prime LC, Santa Clara, CA, United States (USA)). A sample volume of 1 μL was injected into a C18 column (5 μm, 250 mm × 4 mm) and a diode array detector (DAD). A mobile phase gradient of a solvent comprising 45% acetonitrile and 55% water at a flow rate of 0.5 mL min–1.
The permeate flux () was determined by measuring the volume of permeate (, L) collected at regular time intervals (, h) as follows:
where is the membrane cell’s effective area (m2).
2.4. Experimental Design
2.4.1. Modelling of NF Membranes Using RSM
A custom design approach involving RSM was employed to evaluate and optimize the operational parameters influencing pharmaceutical rejection by NF membranes. The modelling and experimental design were performed using Design-Expert® software (Version 22.0, Stat-Ease Inc., Minneapolis, MN, USA). This approach allowed flexibility in defining specific experimental runs tailored to the research objectives, rather than relying on standard designs such as Box-Behnken or Central Composite Design.
Three independent variables were considered: pressure (X₁), feed concentration (X₂), and feed flow rate (X₃). Following previous methodologies [28,29], the experimental rejection efficiency served as the response input for the polynomial model as described in Equation (3). Their ranges and levels are mentioned in Table 1.
where is the predicted response variable; , , and constant coefficients; k is the number of factors studied and optimized in the experiment; and are the coded independent variables or factors; is random error. The average values from the duplicated experimental runs were calculated to ensure precision.
The custom RSM design generated a quadratic polynomial model incorporating linear, interaction, and squared terms. The experimental data were fitted to this model to derive a predictive equation capable of simulating the system behaviour under varying conditions. The adequacy of the model was assessed using analysis of variance (ANOVA), coefficient of determination (R²), and residual diagnostics. Finally, the optimized operating conditions for maximum pharmaceutical rejection were determined by solving the polynomial equation and analysing response surface plots.
The model calculates the coefficients for each main effect, interaction effect, and quadratic effect. Optimal conditions were determined by solving the quadratic equation and analysing the resulting response surface and contour plots. The key steps for implementing RSM are summarized in Figure 2.
2.4.2. Modelling of NF Membranes Using ANN
ANN modelling was employed to predict the rejection of pharmaceuticals using nanofiltration membranes. The analysis was conducted using the Neural Network Toolbox of MATLAB 7.0.1 (The MathWorks Inc., Natick, MA, USA). A multilayer perceptron (MLP) architecture was adopted for the modelling framework. Figure 3 shows the ANN architecture of the pharmaceutical rejection process.
The input variables for the ANN model were pressure, feed concentration, and feed flow rate, identical to those used in the RSM analysis. The output variable was the pharmaceutical rejection percentage. A supervised learning approach was used, applying the Levenberg–Marquardt backpropagation algorithm as the training method due to its speed and accuracy in nonlinear data fitting.
To determine the optimal architecture, various network structures were evaluated by varying the number of neurons in the hidden layer. The best-performing configurations were selected based on the lowest prediction error and highest correlation between predicted and experimental data. The tangent sigmoid transfer function was used in both the hidden and output layers to introduce nonlinearity into the model. The dataset was divided into training, validation, and testing sets to evaluate the generalization performance of the ANN model.
3. Results and Discussion
3.1. Development and Validation
The RSM experimental design results highlighting the effects of process parameters on AFC 40 and AFC 80 membranes are presented in Table 2. The significant variation in responses across different experimental runs indicates that the independent variables substantially affected the rejection efficiency. A custom design approach was employed to study the combined effects of pressure, feed concentration, and flow rate on the pharmaceutical rejection process.
3.1.1. ANOVA for Reduced Quadratic Model
present the summary of the analysis of variance (ANOVA), which was used to evaluate the significance of the quadratic model for caffeine and paracetamol, respectively. The quadratic model’s significance and independent terms were evaluated using Fisher’s F-test. This was calculated as the ratio of the model mean square to the residual mean square [30]. Each model term was examined for significance in terms of F-values and p-values. A high F-value is desired, and a p-value less than 0.05 shows the significance of the model, hence, it has an interaction effect on the response.
Table 3 displays the ANOVA regression model for caffeine rejection using the AFC 40 membrane. The model was significant with an F-value of 282.59, and a p-value less than 0.0001 was obtained. The p-values for the process variables were less than 0.05, indicating that each model term had an interactive influence on the caffeine rejection.
Table 4 shows the ANOVA results for the reduced quadratic model of paracetamol rejection using the AFC 80 membrane. The model terms demonstrated lower p-values (p<0.05) and higher F-values, indicating strong predictive capability for paracetamol rejection. Generally, the very low p-values illustrate the significance of linear, quadratic, and interaction terms, establishing model validity for response prediction [31].
Both reduced quadratic models shown in Table 3 and Table 4 demonstrated excellent predictive capability, as confirmed by near-unity R² values significantly exceeding the 0.90 threshold for robust fit in membrane separation studies [32]. For caffeine rejection, the model achieved an R² of 0.9867 (adjusted R² = 0.9832), explaining >98% of response variability. Similarly, paracetamol rejection was characterized by R² = 0.9815 (adjusted R² = 0.9723). The close agreement (<0.02 difference) between R² and adjusted R² for both models indicate minimal overfitting despite model complexity. These metrics collectively confirm exceptional alignment between experimental data and model predictions.
3.1.2. Regression Equation
A quadratic polynomial is established to identify the relationship between the Yi response and the various factors. The pharmaceutical rejection regression equations generated regarding actual factors for AFC 40 and AFC 80 are Equations (4) and (5), respectively. Insignificant factors with p-values greater than 0.05 were removed from the initial model, and the reduced quadratic regression model in terms of actual factors was developed as follows:
YRSM (AFC 40) = +65.72100 – 0.636464X1 + 3.70135X3 + 0.095043X1X3 – 0.015017X12 – 0.191160X32
YRSM (AFC 80) = +81. 35275 + 0.845238X1 + 0.231950X2 - 0.006345X1X2 – 0.012509X12
Where X1 is the pressure, X2 is the feed concentration, and X3 is the feed flow rate. As shown in Equation (4), the feed concentration was eliminated from the regression model, whereas pressure and feed flow rate were introduced as significant input parameters. For Equation (5), the feed flow rate has no significant effect on paracetamol, while pressure and feed concentration were introduced as significant input parameters.
3.1.3. Effects of Transmembrane Pressure, Feed Concentration and Flow Rate on Caffeine and Paracetamol Rejection Using RSM Plots.
Three-dimensional response surface plots and contour line maps of caffeine and paracetamol rejection rate in Figure 4 and Figure 5 were obtained from the Design-Expert software to visualize the predicted models in RSM. The three-dimensional response surface plot in Figure 4a and 4b show the relationship between two independent variables (transmembrane pressure and flow rate) and the response (caffeine rejection percentage). In contrast, the third variable (concentration) was constant at 10 mg/L. The corresponding 2D contour plots (bottom plane) display lines of constant response, enabling identification of optimal operating zones. AFC 40 significantly affects pressure and flow rate on caffeine rejection. However, the effect of concentration was less critical. The 3D response surface in Figure 4a reveals a nonlinear interaction between pressure and flow rate in determining caffeine rejection by the AFC40 membrane. Below 10 L/min, increasing pressure from 10 to 30 bar resulted in a decline in caffeine rejection, possibly due to concentration polarization at the membrane surface, which can reduce effective rejection performance. In contrast, caffeine rejection increased steadily with pressure at higher flow rates, reaching up to 88.39%. This highlights the importance of optimizing both operating parameters simultaneously, as their interaction significantly influences separation efficiency.
The three-dimensional response surface and contour plot for paracetamol rejection versus concentration and transmembrane pressure are depicted in Figure 5a and 5b at a constant flow rate of 10 L/min. The plots were utilized to explain the process parameters’ combined effects on the percentage of paracetamol rejected by the AFC 80 membrane. The 3D response surface analysis demonstrated that paracetamol rejection is maximized (96.28%) at 30 bar and 20 mg/L, with both pressure and concentration exhibiting positive effects. The observed increase in paracetamol rejection as the feed concentration increases contradicts conventional membrane fouling behaviour, where higher solute concentrations typically reduce rejection due to fouling or concentration polarization [33,34,35].
This anomaly aligns with findings by Jorge Garcia-Ivars et al. [36], who observed similar concentration-enhanced rejection of paracetamol across three NF membranes. They proposed that at higher concentrations, paracetamol forms dynamic, loosely bound aggregates near the membrane surface at higher concentrations. This secondary layer may enhance steric selectivity by blocking smaller solutes while allowing solvent to permeate through the membrane.
3.2. Predictive Modelling Using ANN
The ANN architecture comprised interconnected layers of neurons that function like the human neural system [37], providing a robust framework for optimizing membrane processes. This data-driven framework enabled robust optimization of membrane performance beyond traditional RSM. The ANN network was trained with Levenberg-Marquardt Algorithm (LMA) backpropagation algorithm, one of the Multi-Layer Perceptron (MLP) networks used for error minimization. The Neural Network Toolbox V4.0 of MATLAB mathematical software was used to develop the ANN model.
The ANN was successfully developed using the experimental dataset presented in Table 2. The input variables for the neural network were identical to the factors considered in the RSM approach, namely, pressure, feed concentration, and feed flow rate. Similarly, the pharmaceutical rejection percentage was considered as the response variable for ANN modelling.
For the prediction of caffeine rejection, the optimal ANN architecture consisted of three input nodes, ten hidden neurons, and one output node, employing a tangent sigmoid transfer function in both the hidden and output layers. The Levenberg–Marquardt training algorithm provided the best prediction performance. In the case of paracetamol rejection, the most effective ANN configuration was a 3–11–1 structure, corresponding to three input parameters, eleven neurons in the hidden layer, and one output node.
3.2.1. Training, Testing, and Validation of the Model ANN
The experimental data in Table 2 were partitioned into training, validation, and testing subsets to prevent overtraining and overparameterization. Training is the manipulation of input weights. The ANN was trained by iteratively adjusting input weights, which were initially randomized, to minimize the error between predicted and actual rejection values [38]. Input vectors included pressure, flow rate, and feed concentration, while the output vector represented rejection efficiency. Once the ANN has been trained and tested with the appropriate weights, it can be used to predict the output [22].
The trained ANN demonstrated robust predictive capability for both membranes as depicted in Figure 6 and Figure 7. The regression coefficients (R-values) obtained for the AFC 40 membrane were 0.99977, 0.9988, 0.99329, and 0.99159 for training, validation, testing, and overall data, respectively. In comparison, the R-values for the AFC 80 membrane were even higher, recorded at 1, 0.99949, 0.99909, and 0.99609, respectively. These results confirm the model’s robustness in simulating the rejection behaviour of pharmaceutical compounds under varying operational conditions. Notably, the high R-values for validation and testing phases show that the model performs well even with new data. This addresses a key gap in membrane modelling, where most traditional empirical models often struggle to predict membrane performance accurately when conditions change.
3.3. Comparative Study of the RSM and ANN Models
RSM and ANN are powerful modelling tools that address linear and nonlinear multivariate regression problems in membrane filtration studies [39]. The experimental, predicted, and residual values for pharmaceutical rejection by AFC 40 and AFC 80 membranes are summarized in Table 2. While both models demonstrated reasonable accuracy in predicting rejection efficiency, a closer examination of residuals showing the differences between experimental and predicted values revealed that ANN consistently outperformed RSM, exhibiting significantly smaller deviations.
Visual validation of model performance is provided in Figure 8, which compares experimental results with RSM and ANN predictions. The plots confirm a strong correlation for both models, though ANN’s predictions align more tightly with experimental data.
However, additional statistical analyses were used to further compare the models’ predicted pharmaceutical rejection values with the experimental efficiency and rank the models as shown in Table 5. To evaluate the predictive accuracy of the RSM and ANN models for caffeine (AFC 40) and paracetamol (AFC 80) rejection, several statistical error functions were applied, including the Coefficient of Determination (R2), Root Mean Square Error (RMSE), Marquardt’s Percentage Squared Error Deviation (MPSED), Hybrid fractional error function (HYBRID), and Average Absolute Deviation (AAD). These error functions are defined by Equations (6) – (10), respectively:
where n is the number of experimental runs; Yi,e, are the experimental values of the ith experiment; Yi,p, are the model predictions; while P is the number of model parameters.
The ANN model demonstrated superior predictive capability, particularly for Table 5, which indicates that the ANN model generally provides better predictive accuracy and reliability than the RSM model, particularly in simulating paracetamol rejection using the AFC 80 membrane. In most cases, the ANN model yielded higher R² values and lower error metrics, indicating stronger agreement between predicted and experimental values. Although the RSM model achieved slightly lower RMSE and HYBRID values for the AFC 40 membrane, the overall performance of ANN, evidenced by its lower errors across a greater number of metrics and consistently higher R² values, confirms its superior predictive capability. These findings are consistent with previous studies by Onu et al. [30], Addar et al. [40] and Ohale et al. [41], who also reported that ANN outperformed RSM in modeling complex nonlinear processes.
4. Conclusions
A comparative study was conducted using RSM and ANN models to predict caffeine and paracetamol rejection by AFC 40 and AFC 80 NF membranes. The models incorporated three key operational variables: feed pressure, concentration, and flow rate.
Optimization using RSM enabled the identification of optimum operating conditions for both membranes. For the AFC 40 membrane, pressure and flow rate significantly influenced caffeine rejection, while feed concentration had a negligible impact. In contrast, for the AFC 80 membrane, pressure and feed concentration were the dominant variables influencing paracetamol rejection, with flow rate playing a minimal role. Both RSM and ANN models demonstrated strong predictive capabilities in modelling pharmaceutical rejection.
The performance of both models was validated using statistical metrics, including the R², RMSE, MPSED, HYBRID, and AAD. For AFC 40, the R² values were 0.9867 and 0.9832 for RSM and ANN, respectively, while for AFC 80, they were 0.9769 (RSM) and 0.9922 (ANN). Although RSM yielded slightly lower RMSE and HYBRID values for AFC 40, the ANN model consistently produced lower error metrics across more parameters and achieved higher R² values for both membranes.
The comparative analysis confirmed that the ANN model offered superior predictive accuracy and generalizability compared to the RSM model, particularly in capturing complex nonlinear relationships in membrane-based pharmaceutical rejection processes.
Author Contributions
Conceptualization, N.E., C.O. and P.M.; methodology, N.E., J.C. and C.O.; software, N.E. and C.O.; validation, N.E., C.O. and O.A.; formal analysis, N.E. and C.O.; investigation, N.E. and P.M.; resources, N.E., J.C., C.O. and P.M; data curation, N.E., J.C. and C.O.; writing—original draft preparation, N.E.; writing—review and editing, C.O., J.C. and P.M.; visualization, N.E. and C.O.; supervision, P.M.
Funding
This research was funded by the Ministry of Education, Youth and Sports of the Czech Republic, Project “Specific university research” and University of Pardubice, Project SGS_2025_002.
Data Availability Statement
All data are included in the article.
Acknowledgements
The authors thank the Ministry of Education, Youth and Sports of the Czech Republic, Project “Specific university research” and the University of Pardubice, Project SGS_2025_002, for financial support.
Conflicts of Interest
The authors declare no conflicts of interest.
References
- Wilkinson, J.L.; Boxall, A.B.A.; Kolpin, D.W.; Leung, K.M.Y.; Lai, R.W.S.; Galbán-Malagón, C.; Adell, A.D.; Mondon, J.; Metian, M.; Marchant, R.A.; et al. Pharmaceutical pollution of the world’s rivers. Proc Natl Acad Sci U S A 2022, 119. [Google Scholar] [CrossRef] [PubMed]
- Majumder, A.; Gupta, B.; Gupta, A.K. Pharmaceutically active compounds in aqueous environment: A status, toxicity and insights of remediation. Environmental Research 2019, 176, 108542. [Google Scholar] [CrossRef]
- Guo, Y.; Qi, P.S.; Liu, Y.Z. A Review on Advanced Treatment of Pharmaceutical Wastewater. IOP Conference Series: Earth and Environmental Science 2017, 63, 012025. [Google Scholar] [CrossRef]
- Obotey Ezugbe, E.; Rathilal, S. Membrane Technologies in Wastewater Treatment: A Review. Membranes (Basel) 2020, 10. [Google Scholar] [CrossRef] [PubMed]
- Khayet, M.; Seman, M.N.A.; Hilal, N. Response surface modeling and optimization of composite nanofiltration modified membranes. Journal of Membrane Science 2010, 349, 113–122. [Google Scholar] [CrossRef]
- Hilal, N.; Al-Zoubi, H.; Mohammad, A.W.; Darwish, N.A. Nanofiltration of highly concentrated salt solutions up to seawater salinity. Desalination 2005, 184, 315–326. [Google Scholar] [CrossRef]
- Anike, O.; Cuhorka, J.; Ezeogu, N.; Mikulášek, P. Separation of Antibiotics Using Two Commercial Nanofiltration Membranes—Experimental Study and Modelling. Membranes 2024, 14, 248. [Google Scholar] [CrossRef]
- U.S. Food and Drug Administration, Don’t Overuse Acetaminophen, FDA. Available online: https://www.fda.gov/consumers/consumer-updates/dont-overuse-acetaminophen (accessed on October 24).
- Ivanova, D.; Tzvetkov, G.; Kaneva, N. Degradation of Paracetamol in Distilled and Drinking Water via Ag/ZnO Photocatalysis under UV and Natural Sunlight. Water 2023, 15, 3549. [Google Scholar] [CrossRef]
- Emami, M.R.S.; Amiri, M.K.; Zaferani, S.P.G. Removal efficiency optimization of Pb2+ in a nanofiltration process by MLP-ANN and RSM. Korean Journal of Chemical Engineering 2021, 38, 316–325. [Google Scholar] [CrossRef]
- Alghooneh, A.; Razavi, S.M.A.; Mousavi, S.M. Nanofiltration treatment of tomato paste processing wastewater: process modeling and optimization using response surface methodology. Desalination and Water Treatment 2016, 57, 9609–9621. [Google Scholar] [CrossRef]
- Mojarrad, M.; Noroozi, A.; Zeinivand, A.; Kazemzadeh, P. Response surface methodology for optimization of simultaneous Cr (VI) and as (V) removal from contaminated water by nanofiltration process. Environmental Progress & Sustainable Energy 2018, 37, 434–443. [Google Scholar]
- Ghaemi, N.; Madaeni, S.S.; Daraei, P.; Rajabi, H.; Shojaeimehr, T.; Rahimpour, F.; Shirvani, B. PES mixed matrix nanofiltration membrane embedded with polymer wrapped MWCNT: Fabrication and performance optimization in dye removal by RSM. Journal of Hazardous Materials 2015, 298, 111–121. [Google Scholar] [CrossRef] [PubMed]
- Srivastava, A.; K, A.; Nair, A.; Ram, S.; Agarwal, S.; Ali, J.; Singh, R.; Garg, M.C. Response surface methodology and artificial neural network modelling for the performance evaluation of pilot-scale hybrid nanofiltration (NF) & reverse osmosis (RO) membrane system for the treatment of brackish ground water. Journal of Environmental Management 2021, 278, 111497. [Google Scholar] [PubMed]
- Abadikhah, H.; Zokaee Ashtiani, F.; Fouladitajar, A. Nanofiltration of oily wastewater containing salt; experimental studies and optimization using response surface methodology. Desalination and Water Treatment 2015, 56, 2783–2796. [Google Scholar] [CrossRef]
- Gasemloo, S.; Khosravi, M.; Sohrabi, M.R.; Dastmalchi, S.; Gharbani, P. Response surface methodology (RSM) modeling to improve removal of Cr (VI) ions from tannery wastewater using sulfated carboxymethyl cellulose nanofilter. Journal of Cleaner Production 2019, 208, 736–742. [Google Scholar] [CrossRef]
- Rajkumar, K.; Muthukumar, M. Response surface optimization of electro-oxidation process for the treatment of C.I. Reactive Yellow 186 dye: reaction pathways. Applied Water Science 2017, 7, 637–652. [Google Scholar] [CrossRef]
- Koç, B.; Kaymak-Ertekİn, F. Response surface methodology and food processing applications. GIDA - Journal of Food 2010, 35, 63–70. [Google Scholar]
- Aydar, A.Y. Utilization of response surface methodology in optimization of extraction of plant materials. Statistical approaches with emphasis on design of experiments applied to chemical processes 2018, 157–169. [Google Scholar]
- Jomy, J.; Prabhu, D. Custom design approach of design of experiment as a tool for the optimisation of parameters for corrosion inhibition study of (+)-arabinogalactan on AISI 5140 steel. Corrosion Engineering, Science and Technology 2024, 0, 1478422X241272083. [Google Scholar] [CrossRef]
- Peydayesh, M.; Bagheri, M.; Mohammadi, T.; Bakhtiari, O. Fabrication optimization of polyethersulfone (PES)/polyvinylpyrrolidone (PVP) nanofiltration membranes using Box–Behnken response surface method. RSC Advances 2017, 7, 24995–25008. [Google Scholar] [CrossRef]
- Okonkwo, C.P.; Ajiwe, V.I.E.; Obiadi, M.C.; Okwu, M.O.; Ayogu, J.I. Production of biodiesel from the novel non-edible seed of Chrysobalanus icaco using natural heterogeneous catalyst: Modeling and prediction using Artificial Neural Network. Journal of Cleaner Production 2023, 385, 135631. [Google Scholar] [CrossRef]
- Okwu, M.O.; Tartibu, L.K.; Samuel, O.D.; Omoregbee, H.O.; Ivbanikaro, A.E. Predictive Ability of Response Surface Methodology (RSM) and Artificial Neural Network (ANN) to Approximate Biogas Yield in a Modular Biodigester. Cham, 2021; pp. 202-215.
- Al-Abri, M.; Hilal, N. Artificial neural network simulation of combined humic substance coagulation and membrane filtration. Chemical Engineering Journal 2008, 141, 27–34. [Google Scholar] [CrossRef]
- Ibrahim, M.; Haider, A.; Lim, J.W.; Mainali, B.; Aslam, M.; Kumar, M.; Shahid, M.K. Artificial neural network modeling for the prediction, estimation, and treatment of diverse wastewaters: A comprehensive review and future perspective. Chemosphere 2024, 362, 142860. [Google Scholar] [CrossRef] [PubMed]
- Addar, F.Z.; Farah, M.; Belfaquir, M.; Tahaikt, M.; Taky, M.; Elmidaoui, A. Comparison of response surface method and artificial neural network in predicting fluoride removal by nanofiltration. Desalination and Water Treatment 2023, 297, 215–226. [Google Scholar]
- Aydiner, C.; Demir, I.; Yildiz, E. Modeling of flux decline in crossflow microfiltration using neural networks: the case of phosphate removal. Journal of Membrane Science 2005, 248, 53–62. [Google Scholar] [CrossRef]
- Samuel, O.D.; Okwu, M.O. Comparison of Response Surface Methodology (RSM) and Artificial Neural Network (ANN) in modelling of waste coconut oil ethyl esters production. Energy Sources, Part A: Recovery, Utilization, and Environmental Effects 2019, 41, 1049–1061. [Google Scholar] [CrossRef]
- Silva, G.F.; Camargo, F.L.; Ferreira, A.L.O. Application of response surface methodology for optimization of biodiesel production by transesterification of soybean oil with ethanol. Fuel Processing Technology 2011, 92, 407–413. [Google Scholar] [CrossRef]
- Onu, C.E.; Nwabanne, J.T.; Ohale, P.E.; Asadu, C.O. Comparative analysis of RSM, ANN and ANFIS and the mechanistic modeling in eriochrome black-T dye adsorption using modified clay. South African Journal of Chemical Engineering 2021, 36, 24–42. [Google Scholar] [CrossRef]
- Addar, F.; Qaid, S.; Zeggar, H.; El Hajji, H.; Tahaikt, M.; Elmidaoui, A.; Taky, M. Ultrafiltration of Moroccan Valencia orange juice: juice quality, optimization by custom designs and membranefouling. Sustainability, Agri, Food and Environmental Research-DISCONTINUED 2023, 11. [Google Scholar] [CrossRef]
- Zheng, Y.; Wang, A. Removal of heavy metals using polyvinyl alcohol semi-IPN poly (acrylic acid)/tourmaline composite optimized with response surface methodology. Chemical Engineering Journal 2010, 162, 186–193. [Google Scholar] [CrossRef]
- Gherasim, C.-V.; Mikulášek, P. Influence of operating variables on the removal of heavy metal ions from aqueous solutions by nanofiltration. Desalination 2014, 343, 67–74. [Google Scholar] [CrossRef]
- Fang, J.; Deng, B. Arsenic Rejection by Nanofiltration Membranes: Effect of Operating Parameters and Model Analysis. Environmental Engineering Science 2014, 31, 496–506. [Google Scholar] [CrossRef]
- Ghorbani, A.; Bayati, B.; Drioli, E.; Macedonio, F.; Kikhavani, T.; Frappa, M. Modeling of Nanofiltration Process Using DSPM-DE Model for Purification of Amine Solution. Membranes 2021, 11, 230. [Google Scholar] [CrossRef]
- Garcia-Ivars, J.; Martella, L.; Massella, M.; Carbonell-Alcaina, C.; Alcaina-Miranda, M.-I.; Iborra-Clar, M.-I. Nanofiltration as tertiary treatment method for removing trace pharmaceutically active compounds in wastewater from wastewater treatment plants. Water Research 2017, 125, 360–373. [Google Scholar] [CrossRef] [PubMed]
- Onu, C.E.; Ohale, P.E.; Ekwueme, B.N.; Obiora-Okafo, I.A.; Okey-Onyesolu, C.F.; Onu, C.P.; Ezema, C.A.; Onu, O.O. Modeling, optimization, and adsorptive studies of bromocresol green dye removal using acid functionalized corn cob. Cleaner Chemical Engineering 2022, 4, 100067. [Google Scholar] [CrossRef]
- Arulsudar, N.; Subramanian, N.; Murthy, R. Comparison of artificial neural network and multiple linear regression in the optimization of formulation parameters of leuprolide acetate loaded liposomes. J Pharm Pharm Sci 2005, 8, 243–258. [Google Scholar]
- Fetimi, A.; Dâas, A.; Benguerba, Y.; Merouani, S.; Hamachi, M.; Kebiche-Senhadji, O.; Hamdaoui, O. Optimization and prediction of safranin-O cationic dye removal from aqueous solution by emulsion liquid membrane (ELM) using artificial neural network-particle swarm optimization (ANN-PSO) hybrid model and response surface methodology (RSM). Journal of Environmental Chemical Engineering 2021, 9, 105837. [Google Scholar] [CrossRef]
- Addar, F.; Farah, M.; Tahaikt, M.; Taky, M.; Fatima Zahra, A. Desalination and Water Treatment Comparison of response surface method and artificial neural network in predicting fluoride removal by nanofiltration. 2023.
- Ohale, P.E.; Onu, C.E.; Nwabanne, J.T.; Aniagor, C.O.; Okey-Onyesolu, C.F.; Ohale, N.J. A comparative optimization and modeling of ammonia–nitrogen adsorption from abattoir wastewater using a novel iron-functionalized crab shell. Applied Water Science 2022, 12, 193. [Google Scholar] [CrossRef]
Figure 1.
Schematic diagram of the experimental NF system.
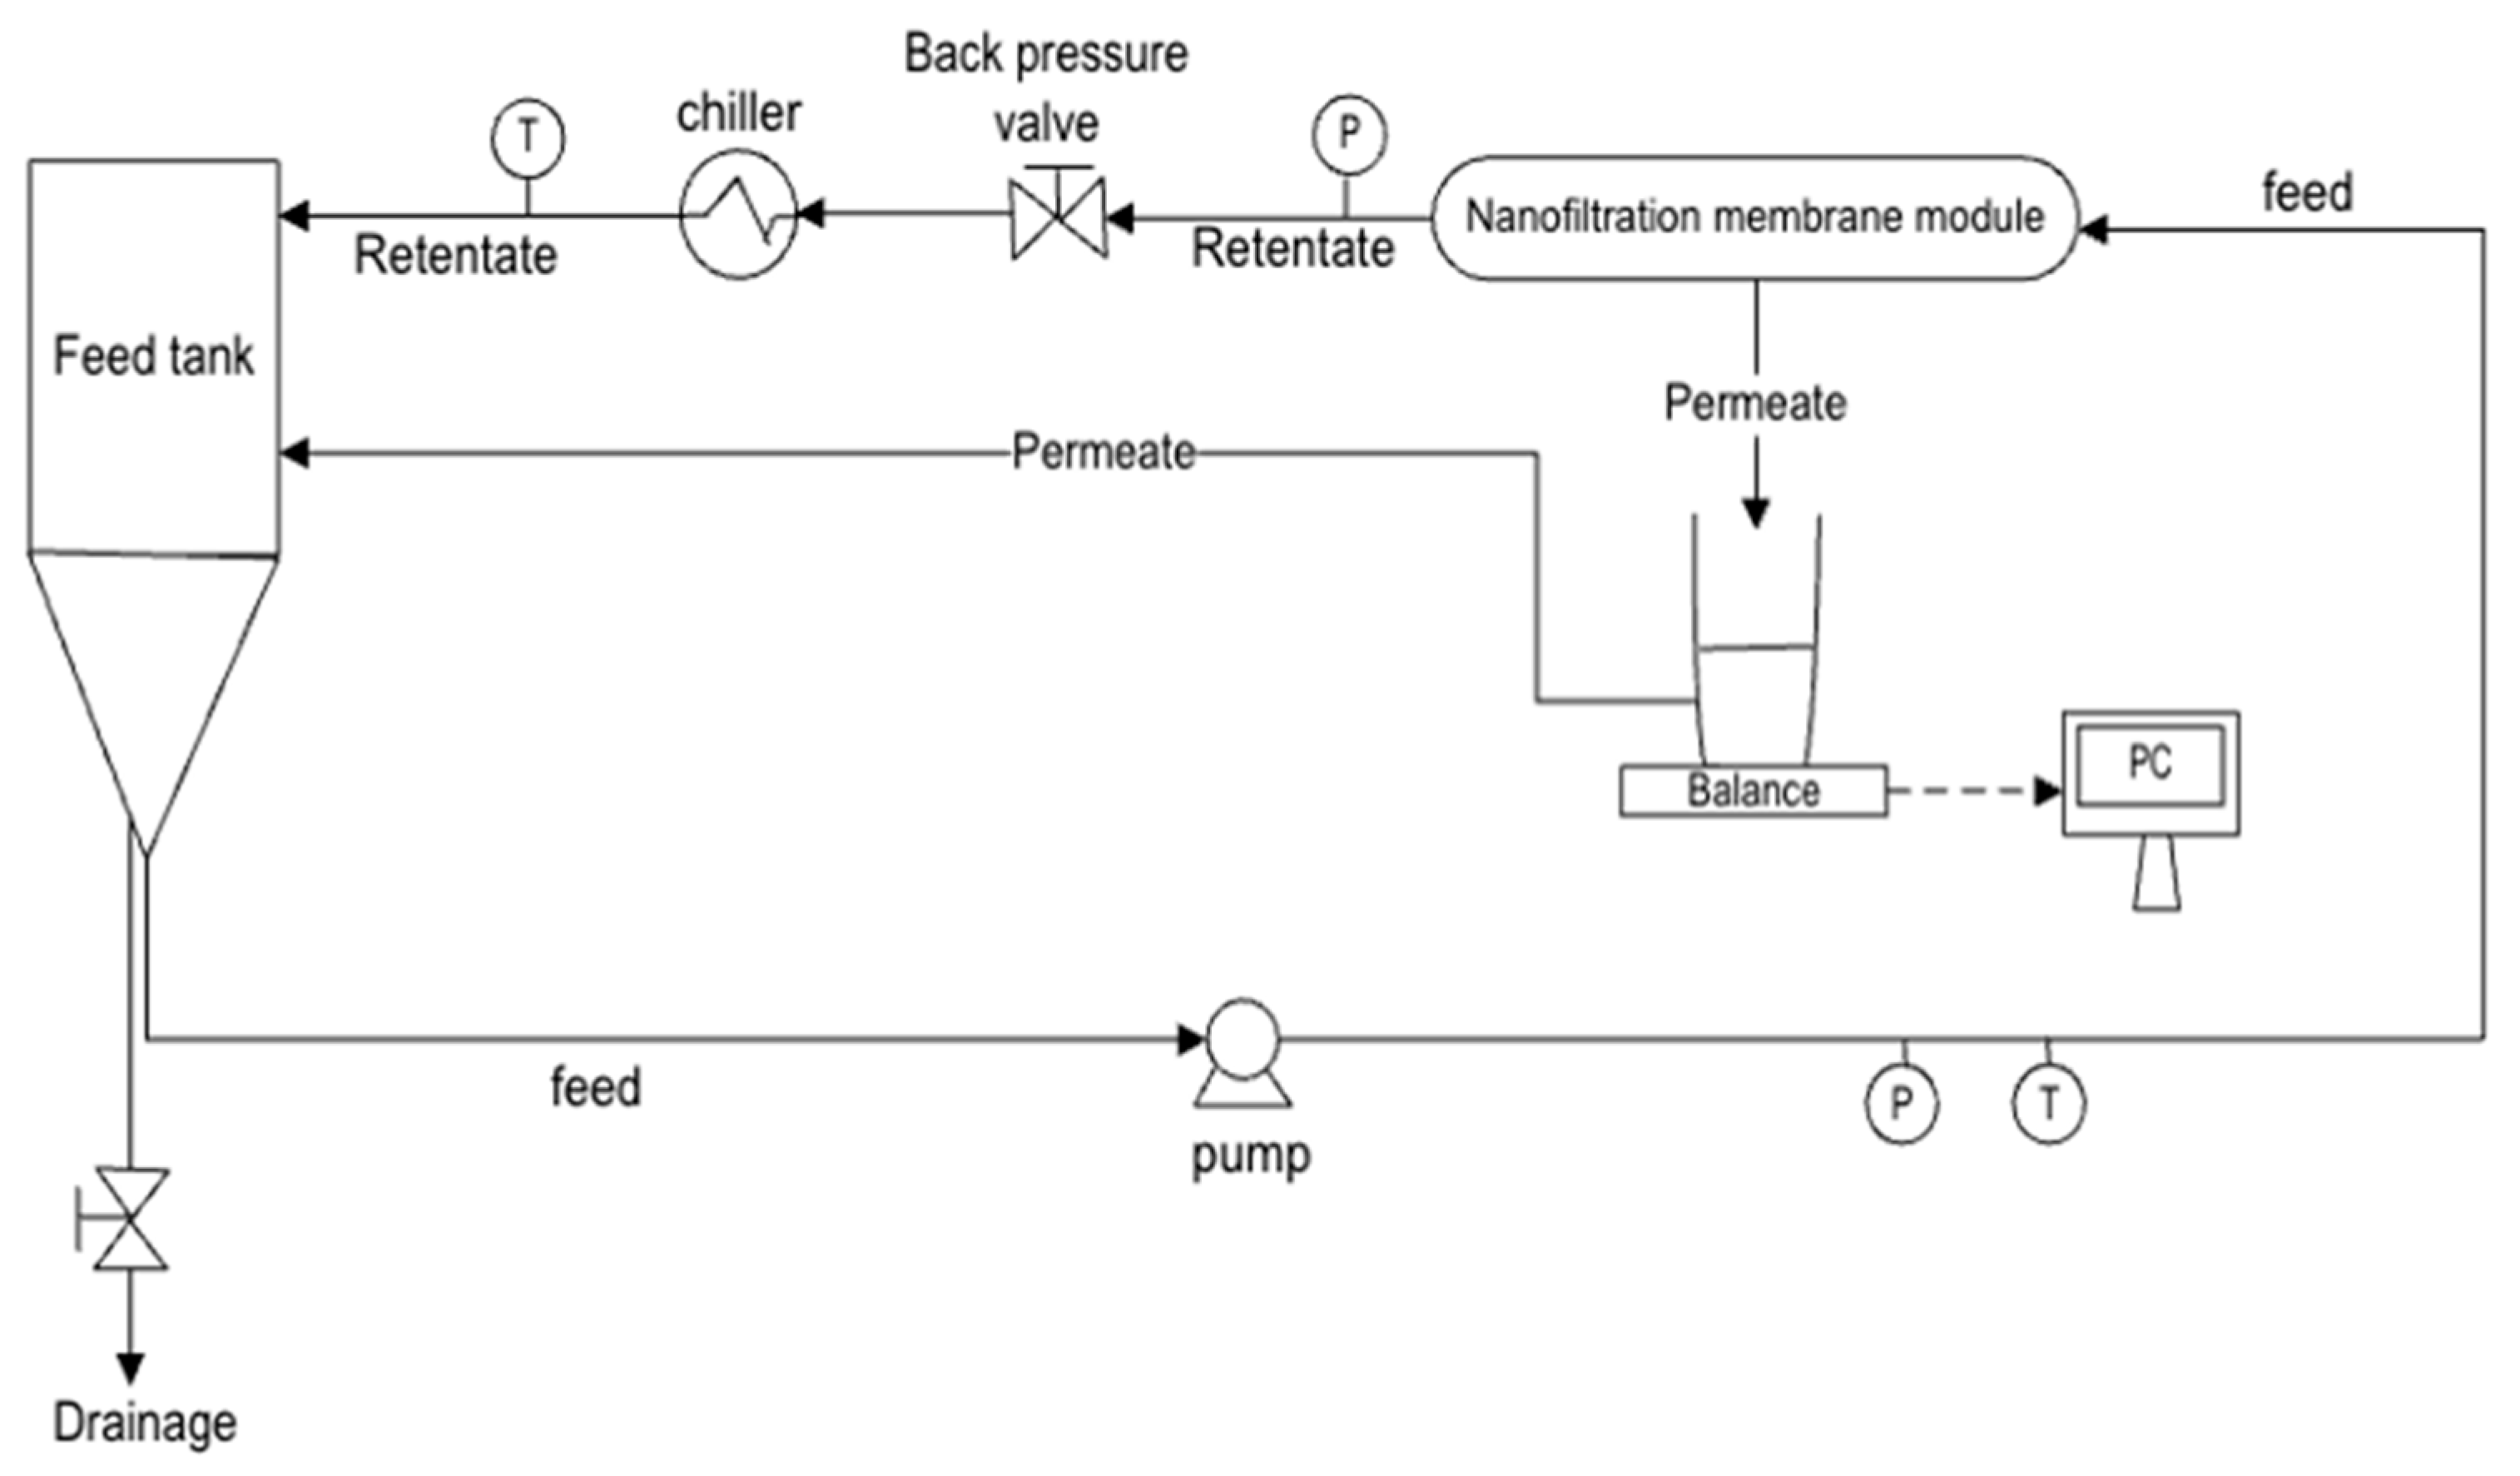
Figure 2.
Steps for response surface methodology.
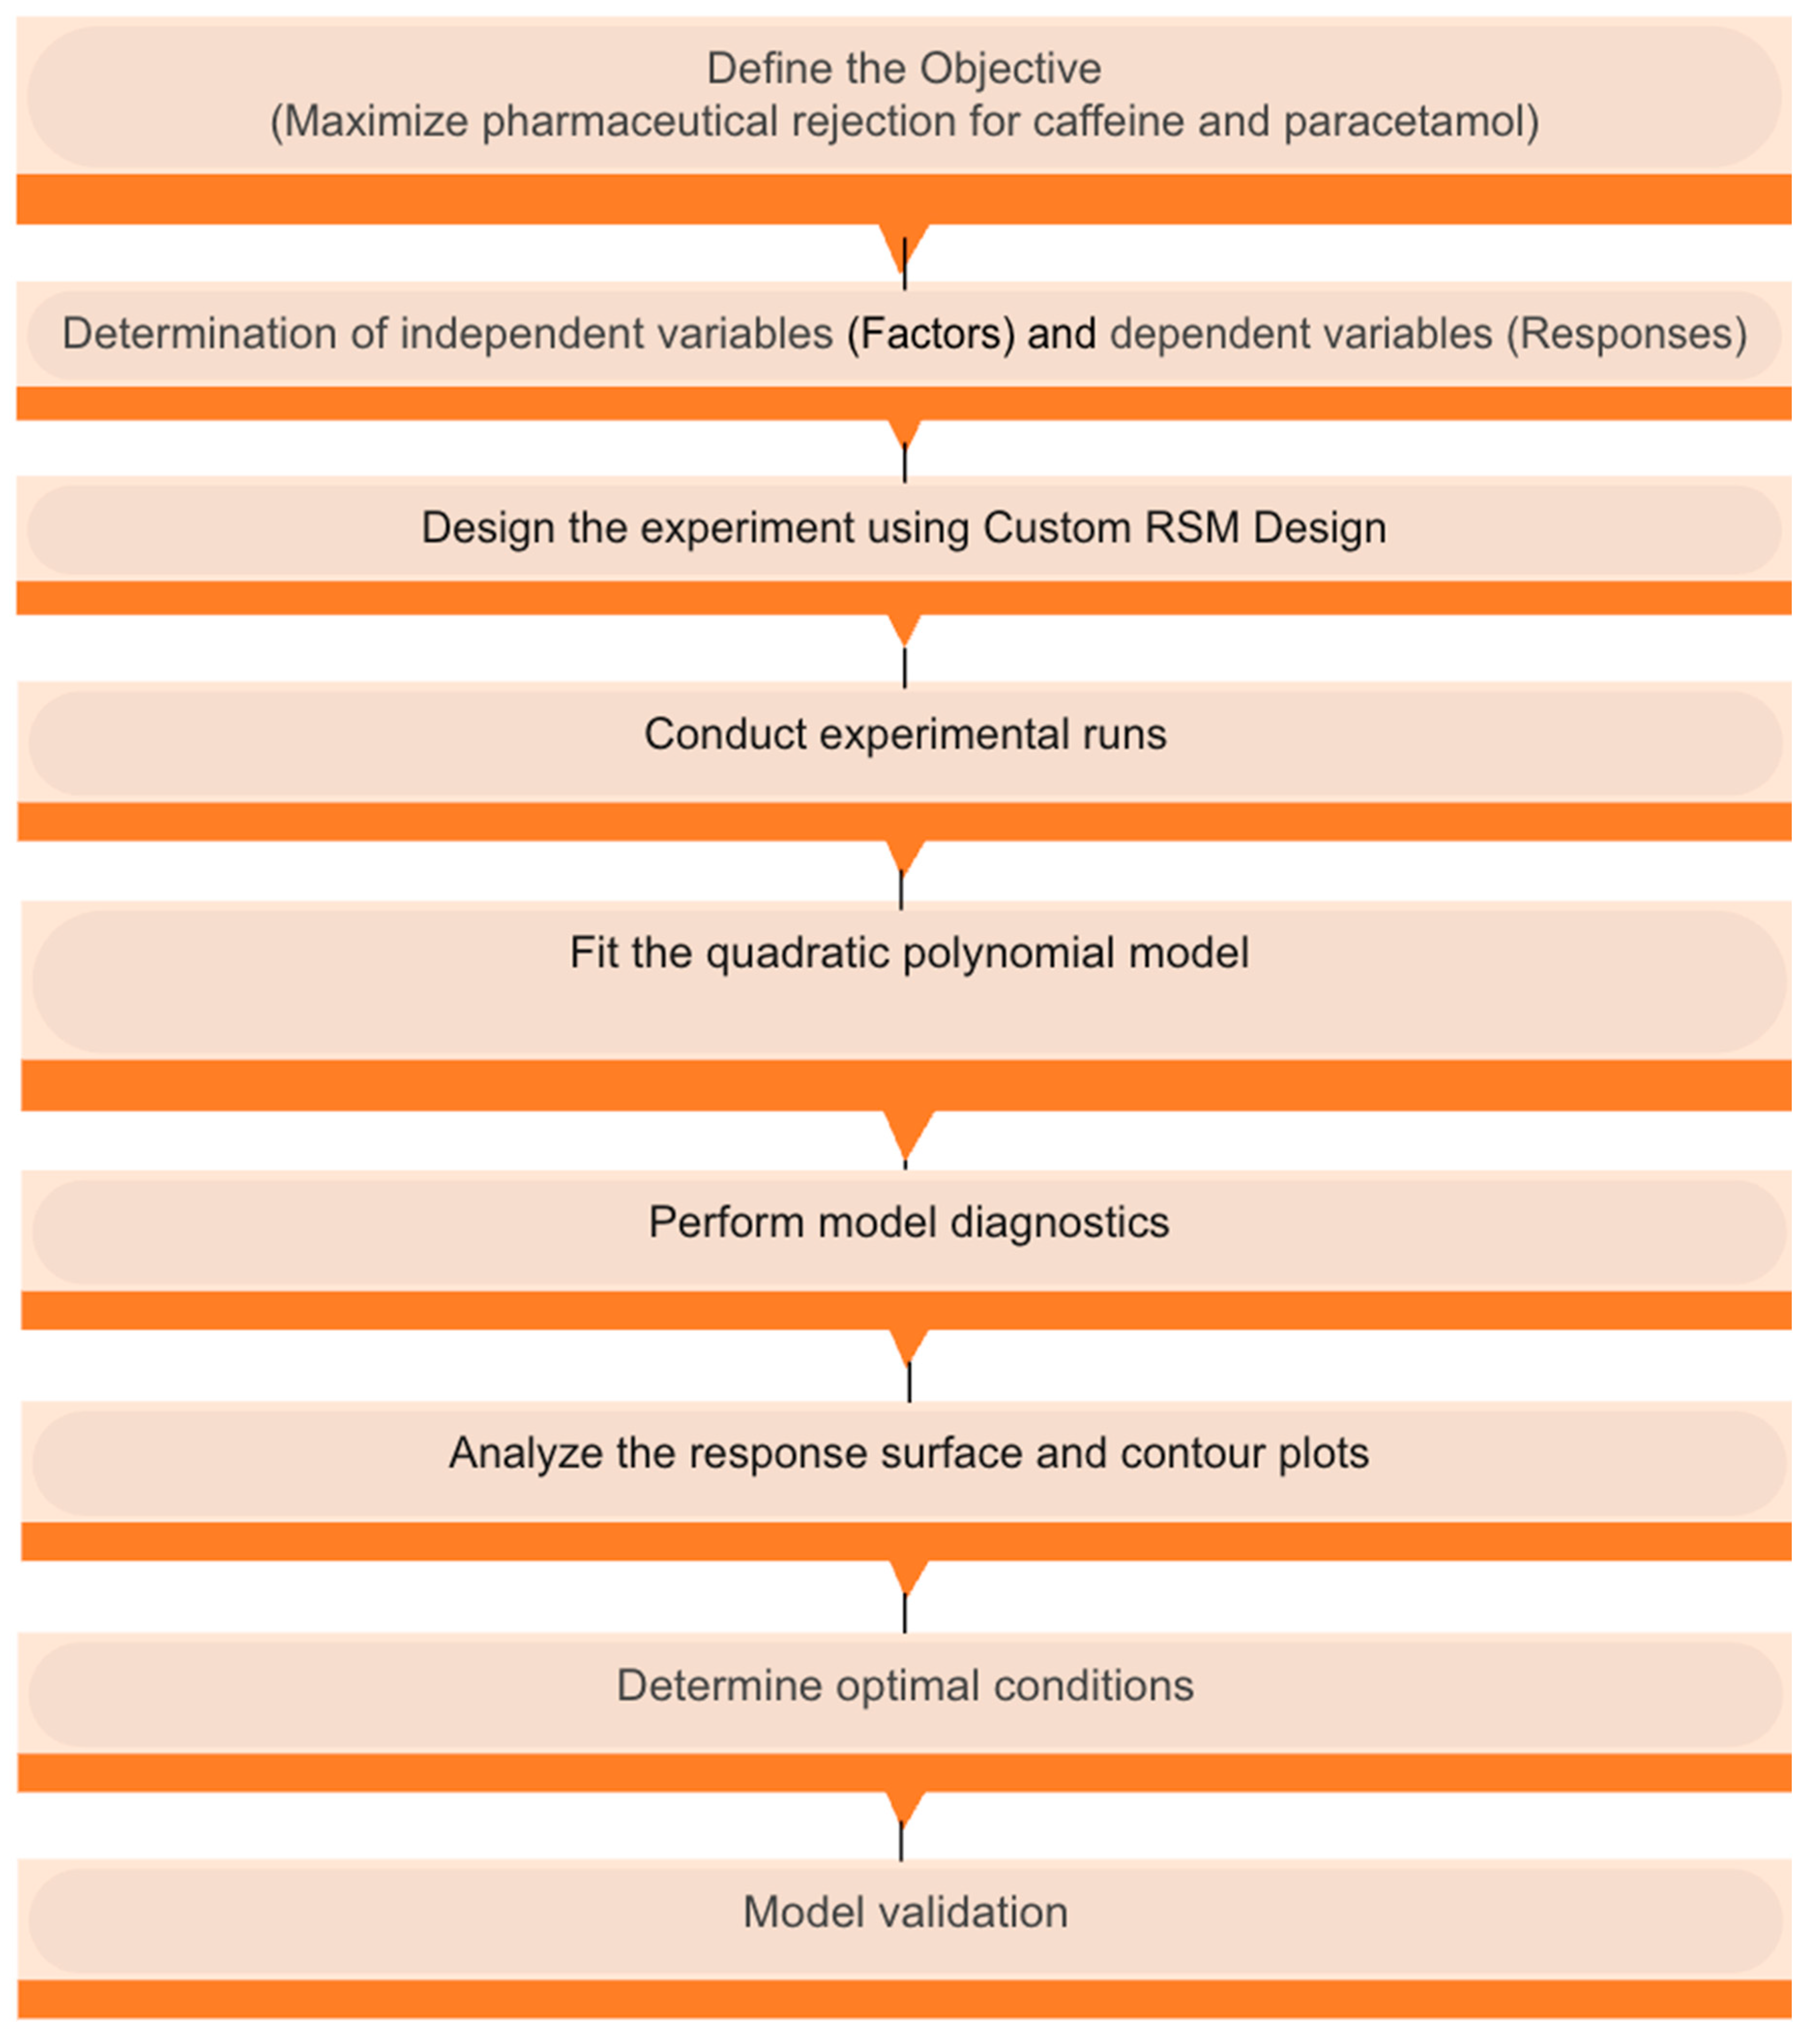
Figure 3.
ANN architecture of the pharmaceutical rejection process.
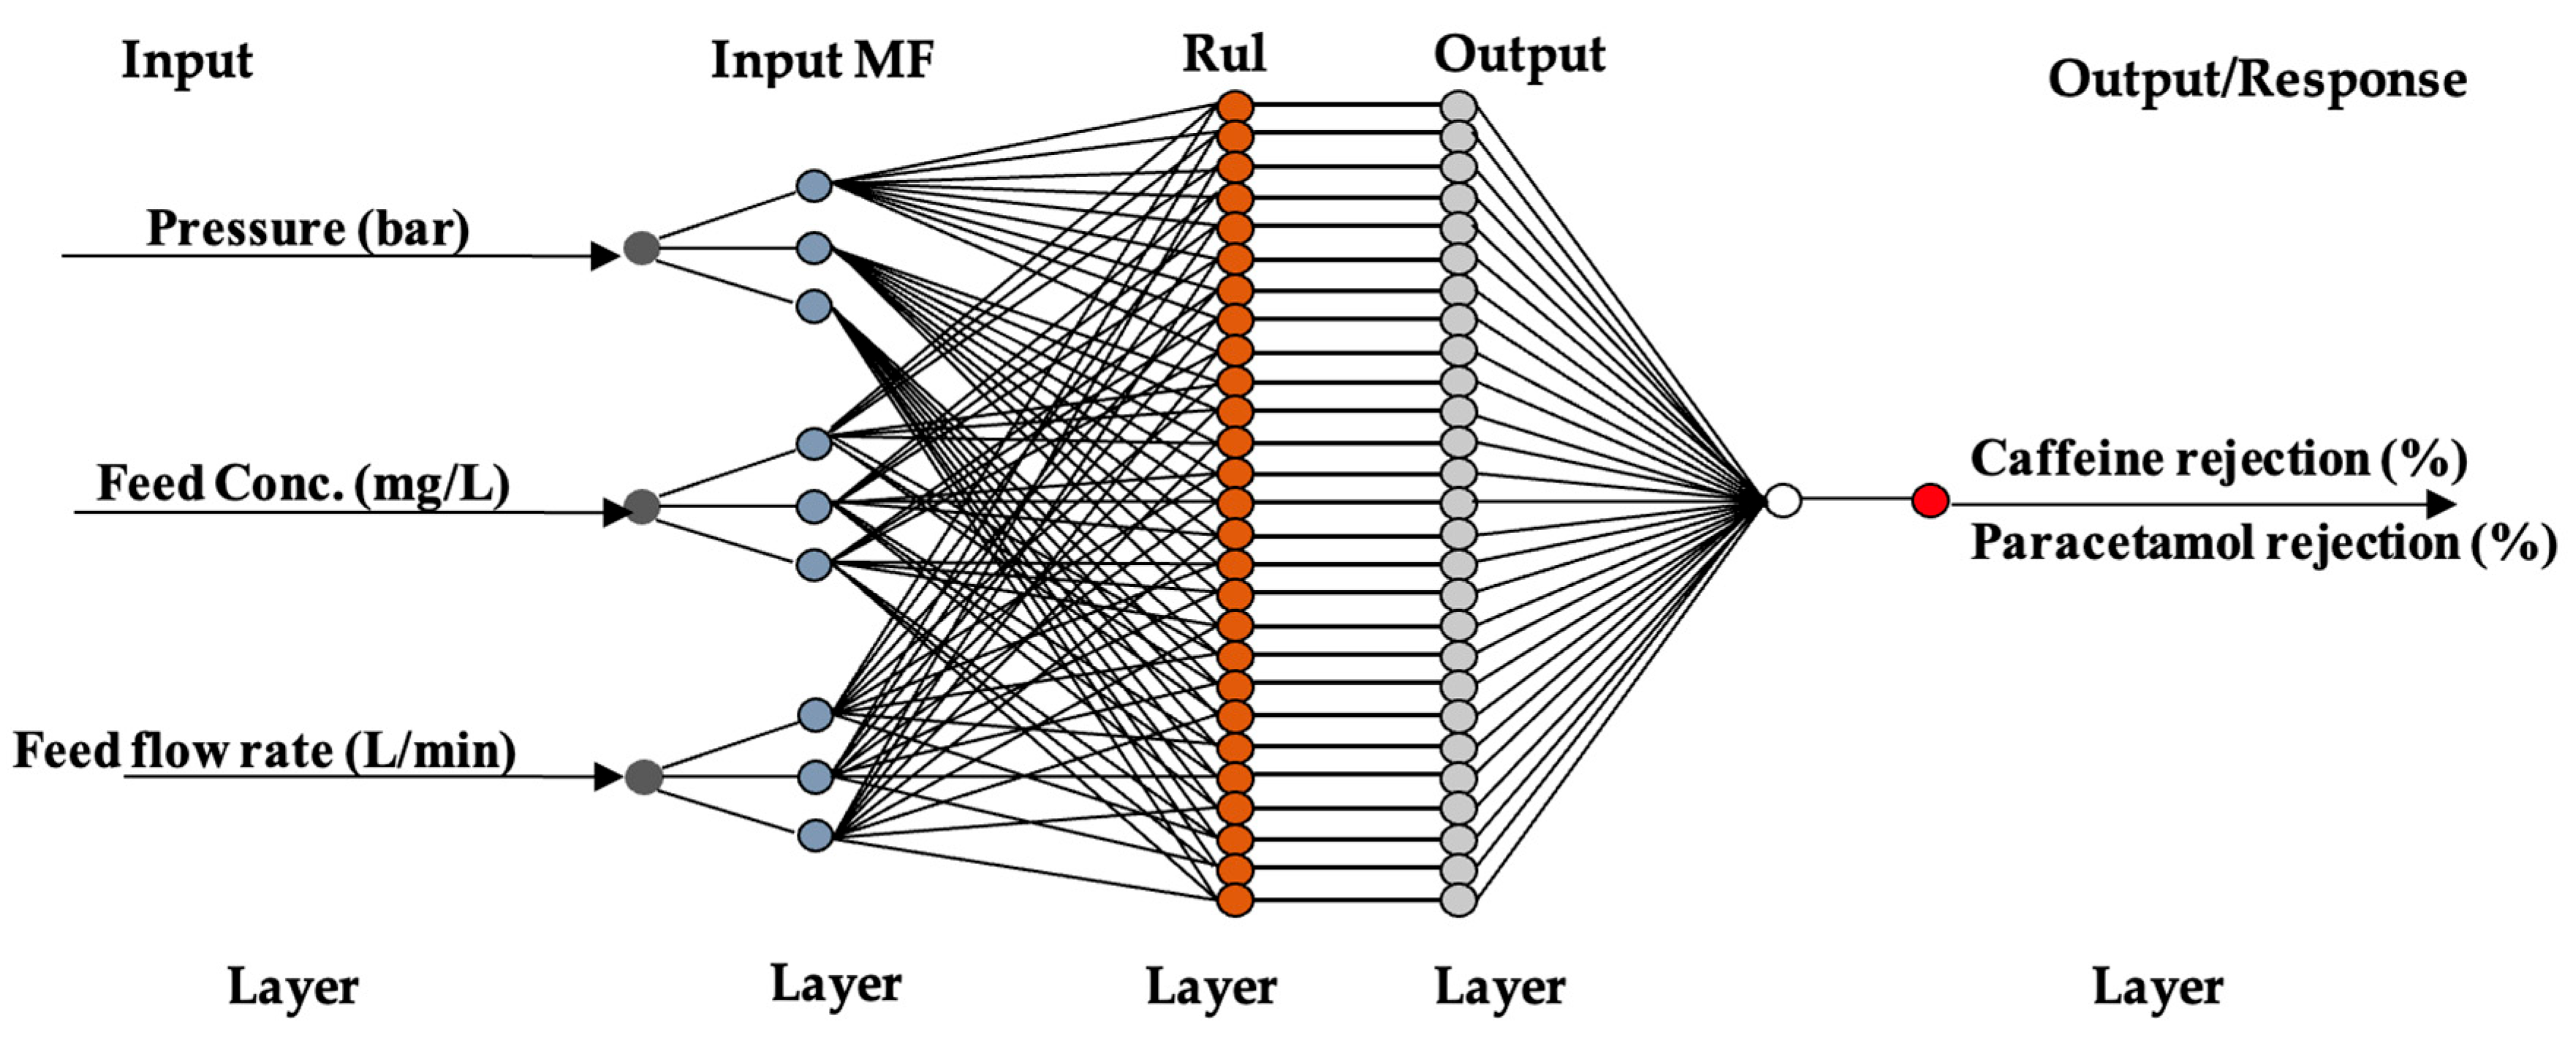
Figure 4.
3D response surface (a) and 2D contour plot (b) for the interaction effect of flow rate and transmembrane pressure on the response for the AFC 40 membrane.
Figure 4.
3D response surface (a) and 2D contour plot (b) for the interaction effect of flow rate and transmembrane pressure on the response for the AFC 40 membrane.
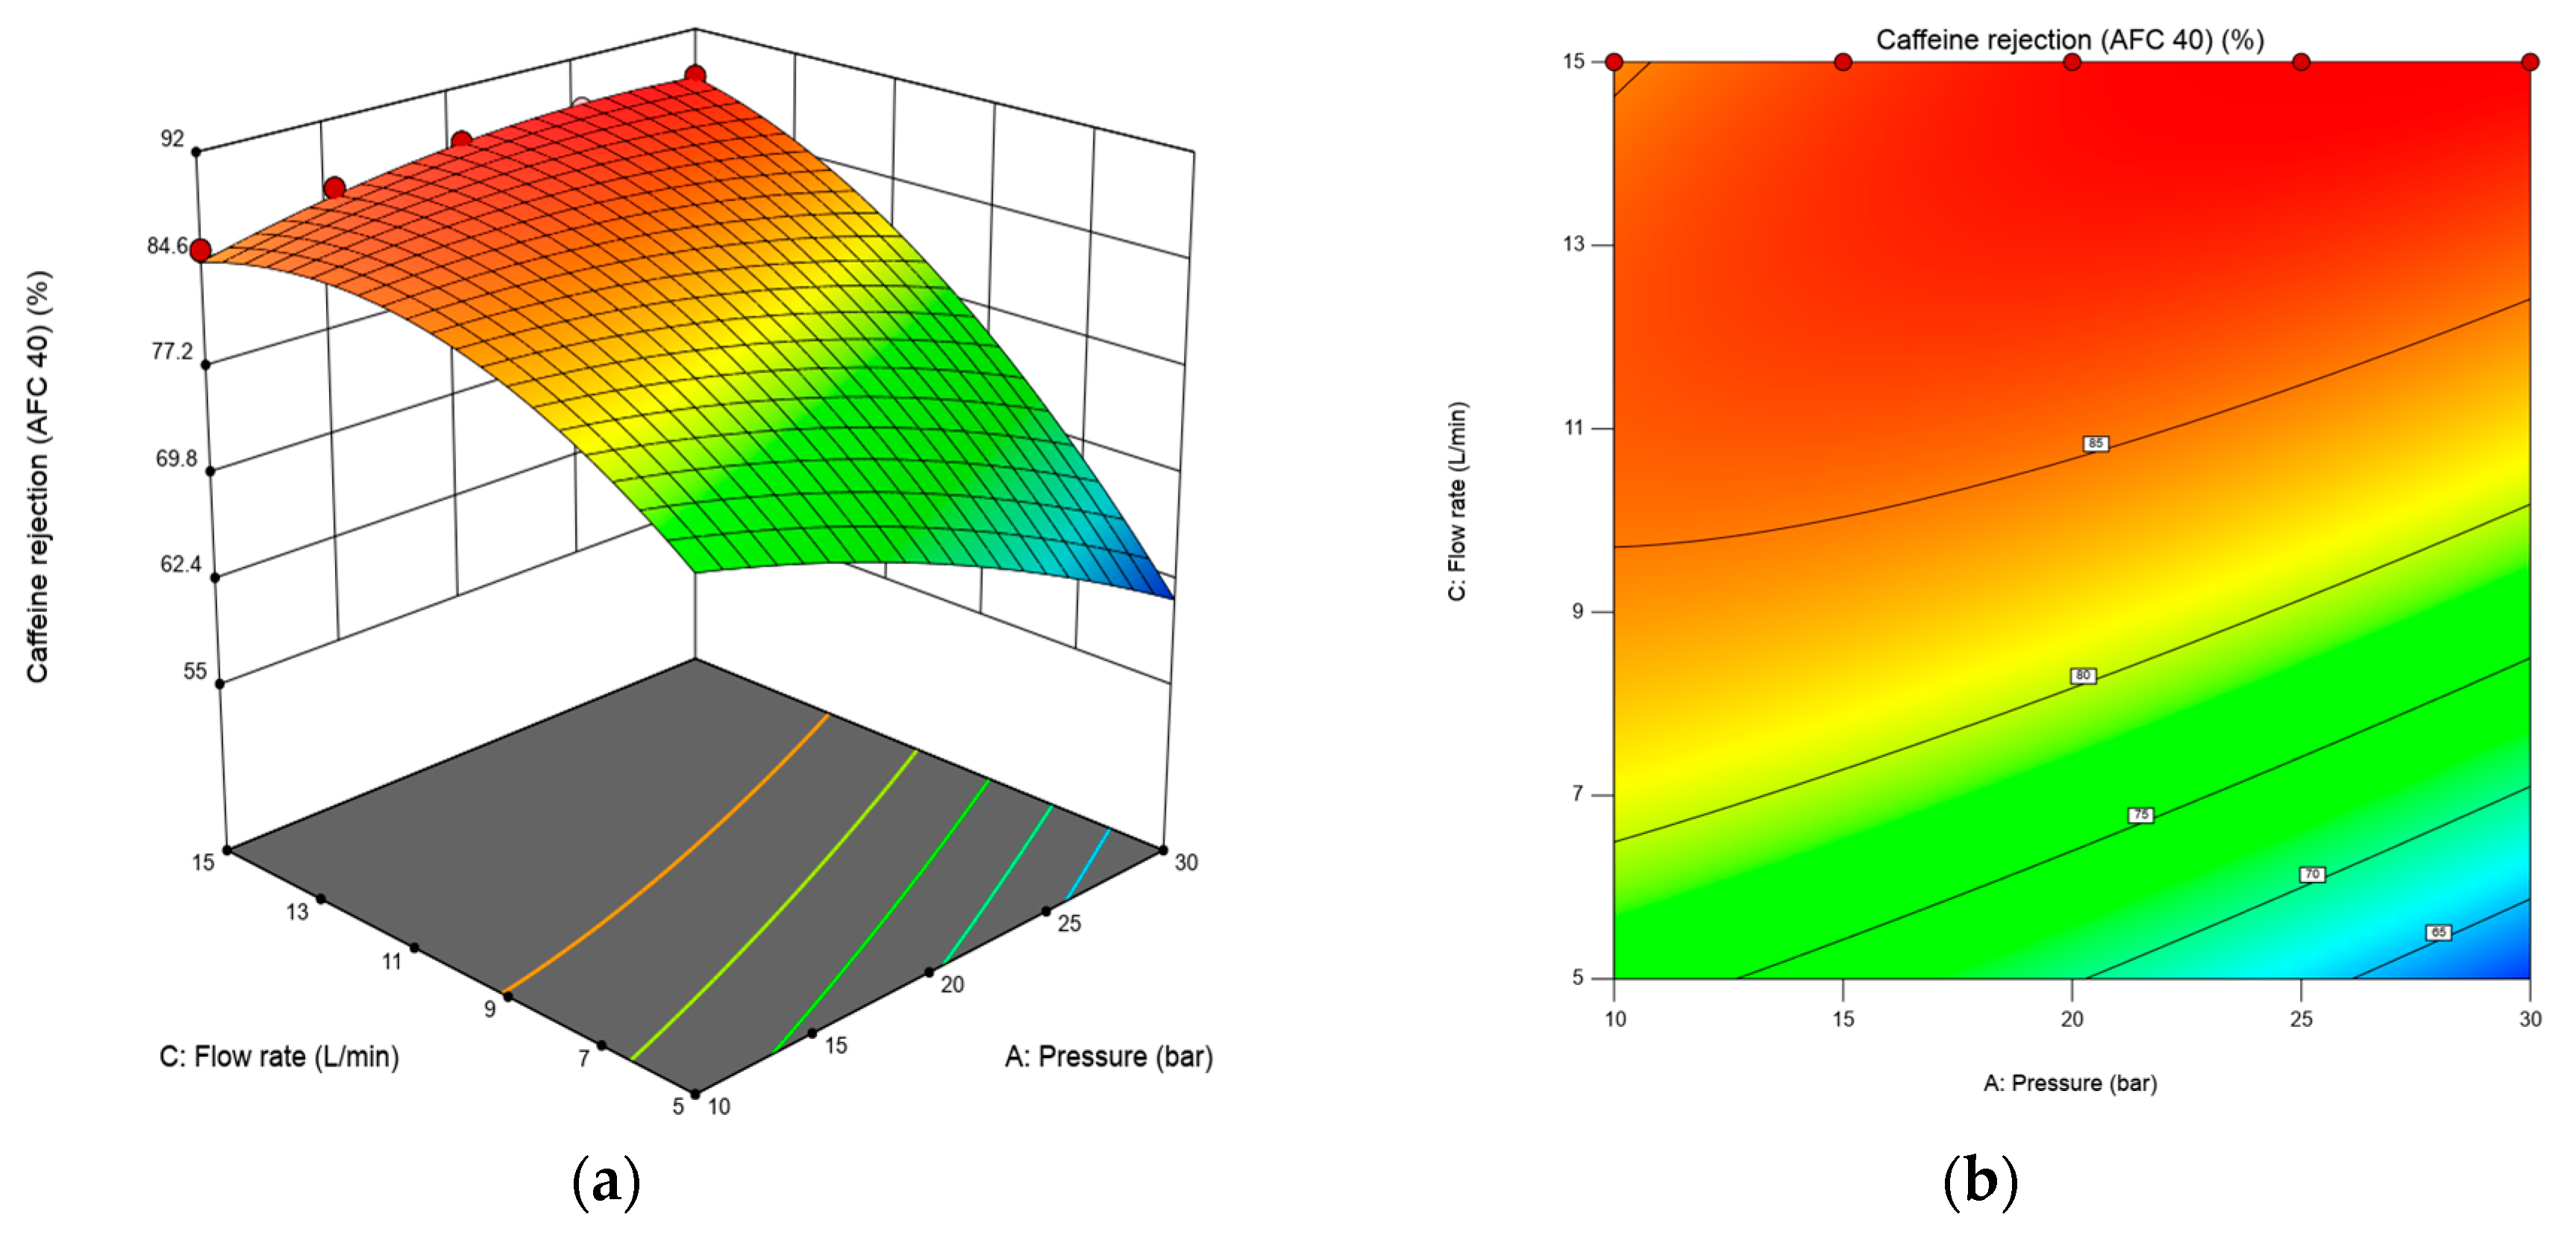
Figure 5.
3D response surface (a) and 2D contour plot (b) for the interaction effect of concentration and transmembrane pressure on the response for the AFC 80 membrane.
Figure 5.
3D response surface (a) and 2D contour plot (b) for the interaction effect of concentration and transmembrane pressure on the response for the AFC 80 membrane.
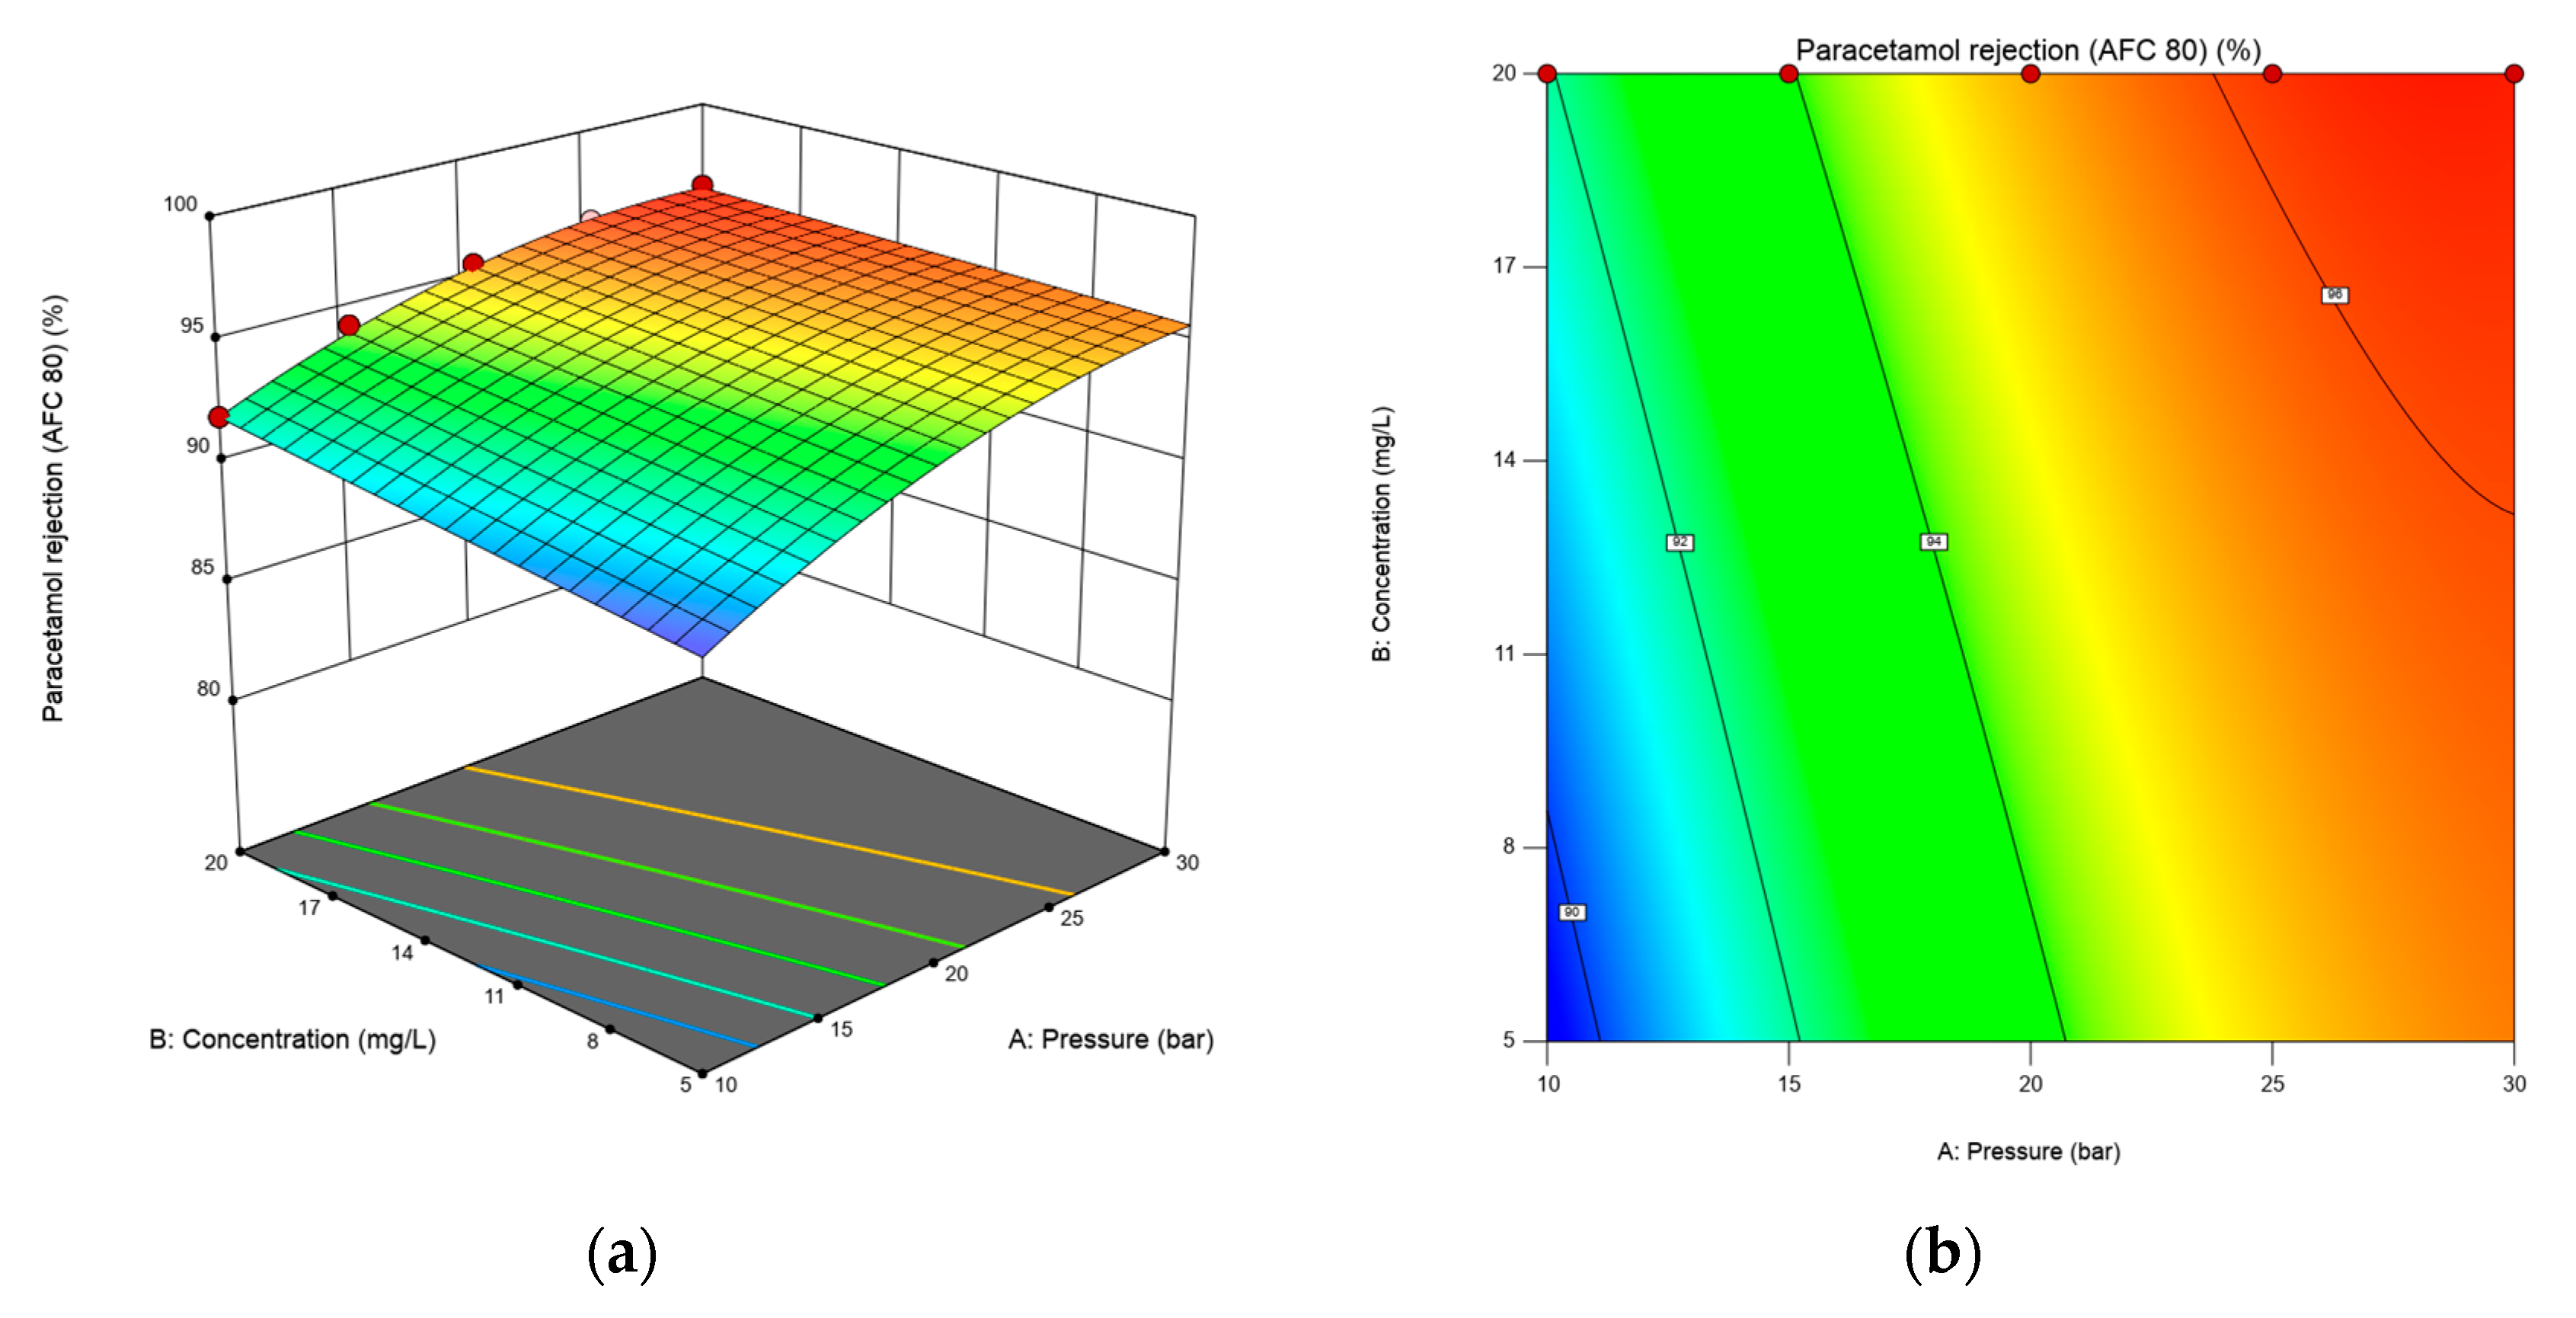
Figure 6.
ANN regression plot for (a) training, (b) validation, (c) testing, and (d) overall datasets of AFC 40.
Figure 6.
ANN regression plot for (a) training, (b) validation, (c) testing, and (d) overall datasets of AFC 40.
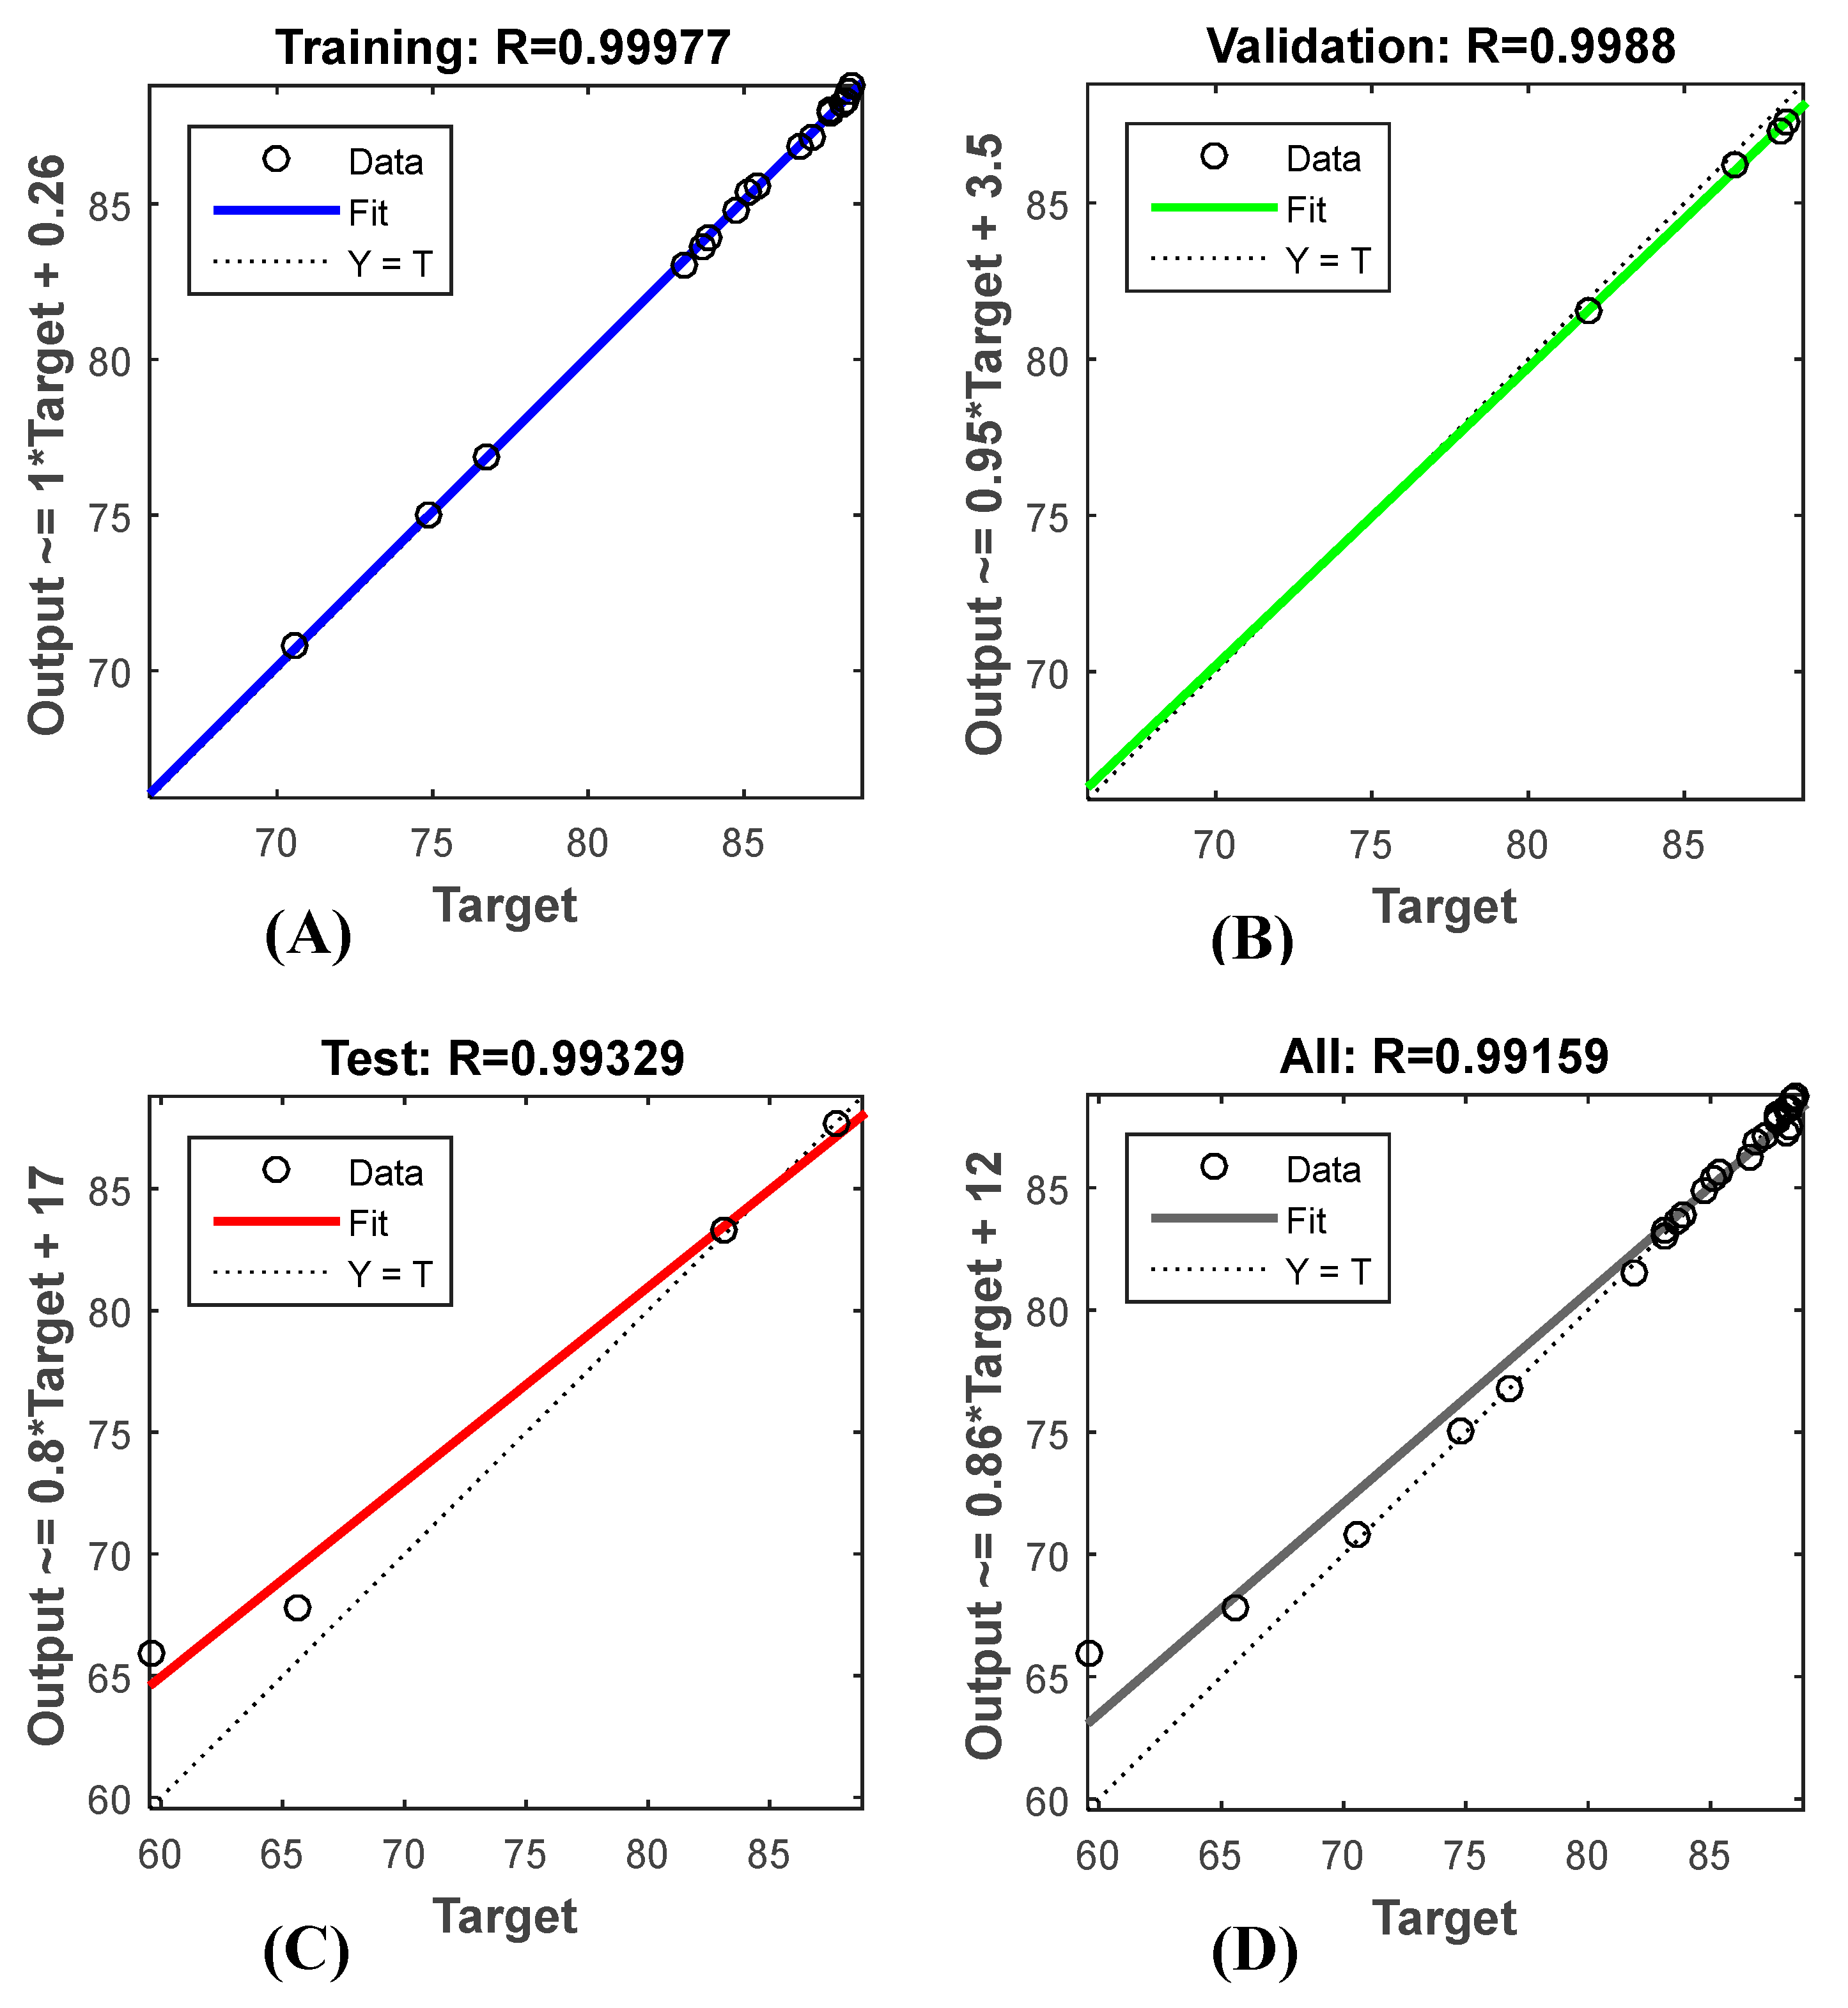
Figure 7.
ANN regression plot for (a) training (b) validation (c) testing and (d) overall datasets of AFC 80.
Figure 7.
ANN regression plot for (a) training (b) validation (c) testing and (d) overall datasets of AFC 80.
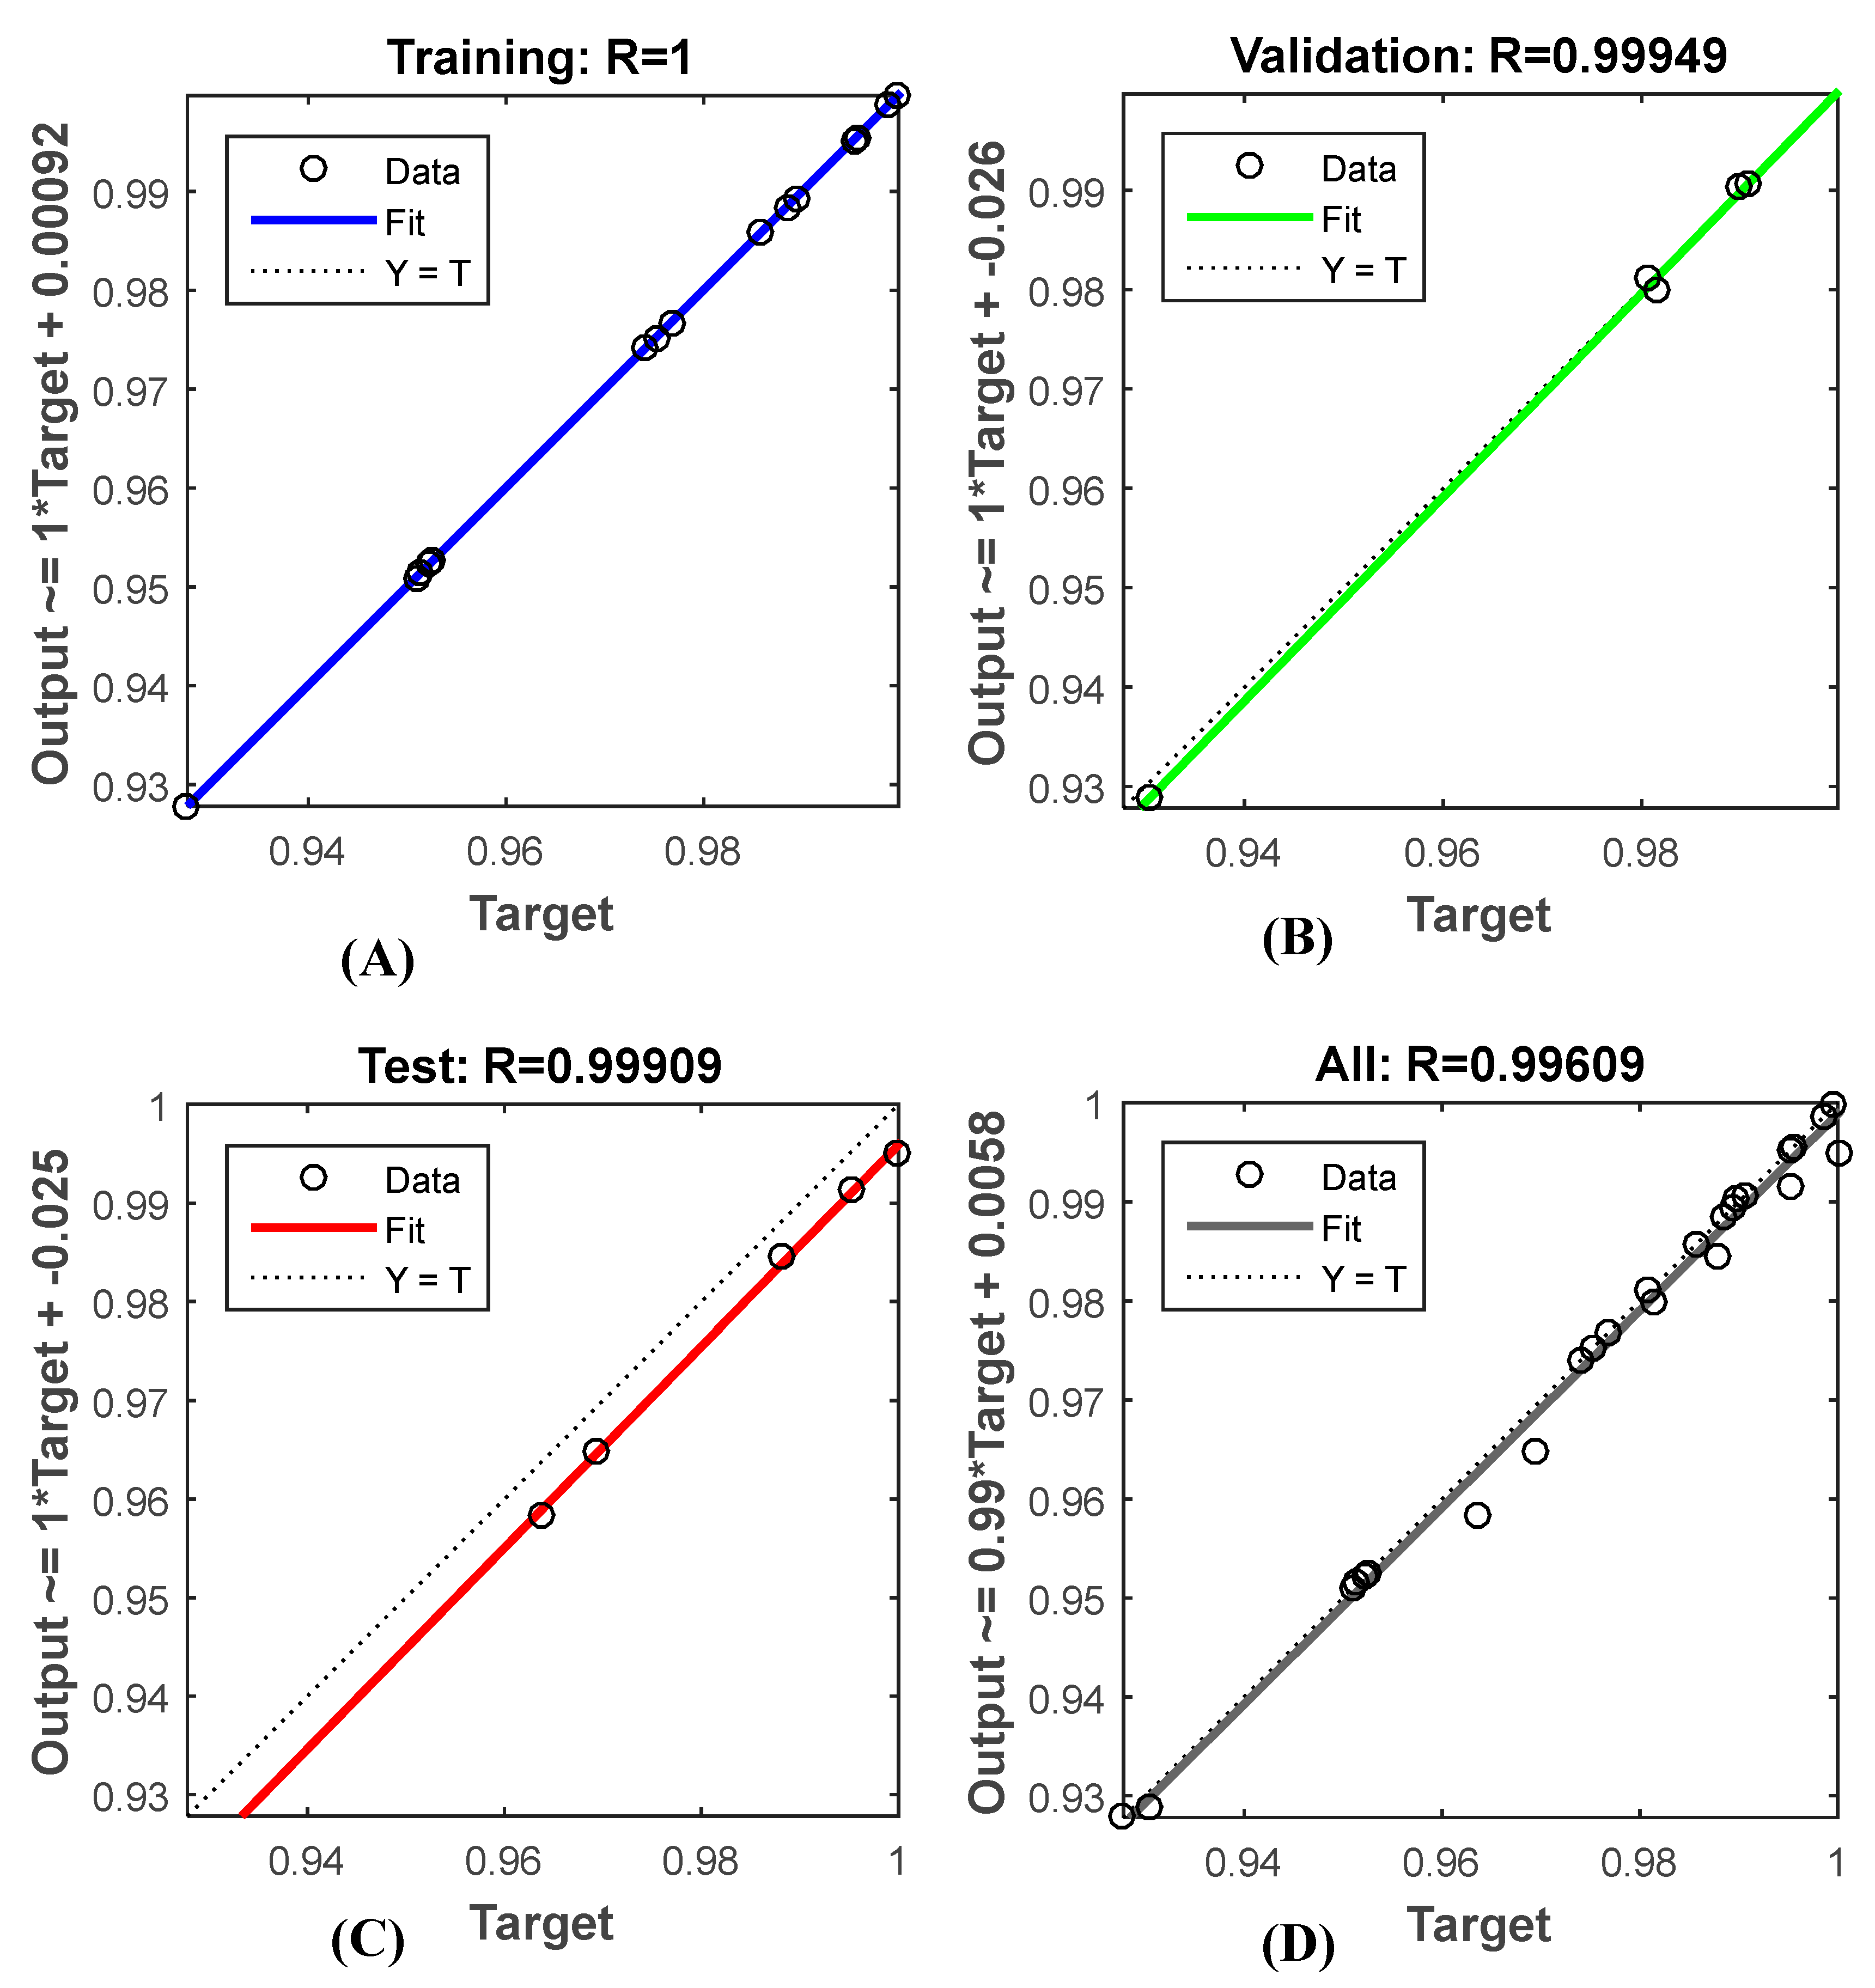
Figure 8.
Comparative plots of experimental data with (a) RSM and ANN for caffeine rejection (b) RSM and ANN for paracetamol rejection.
Figure 8.
Comparative plots of experimental data with (a) RSM and ANN for caffeine rejection (b) RSM and ANN for paracetamol rejection.
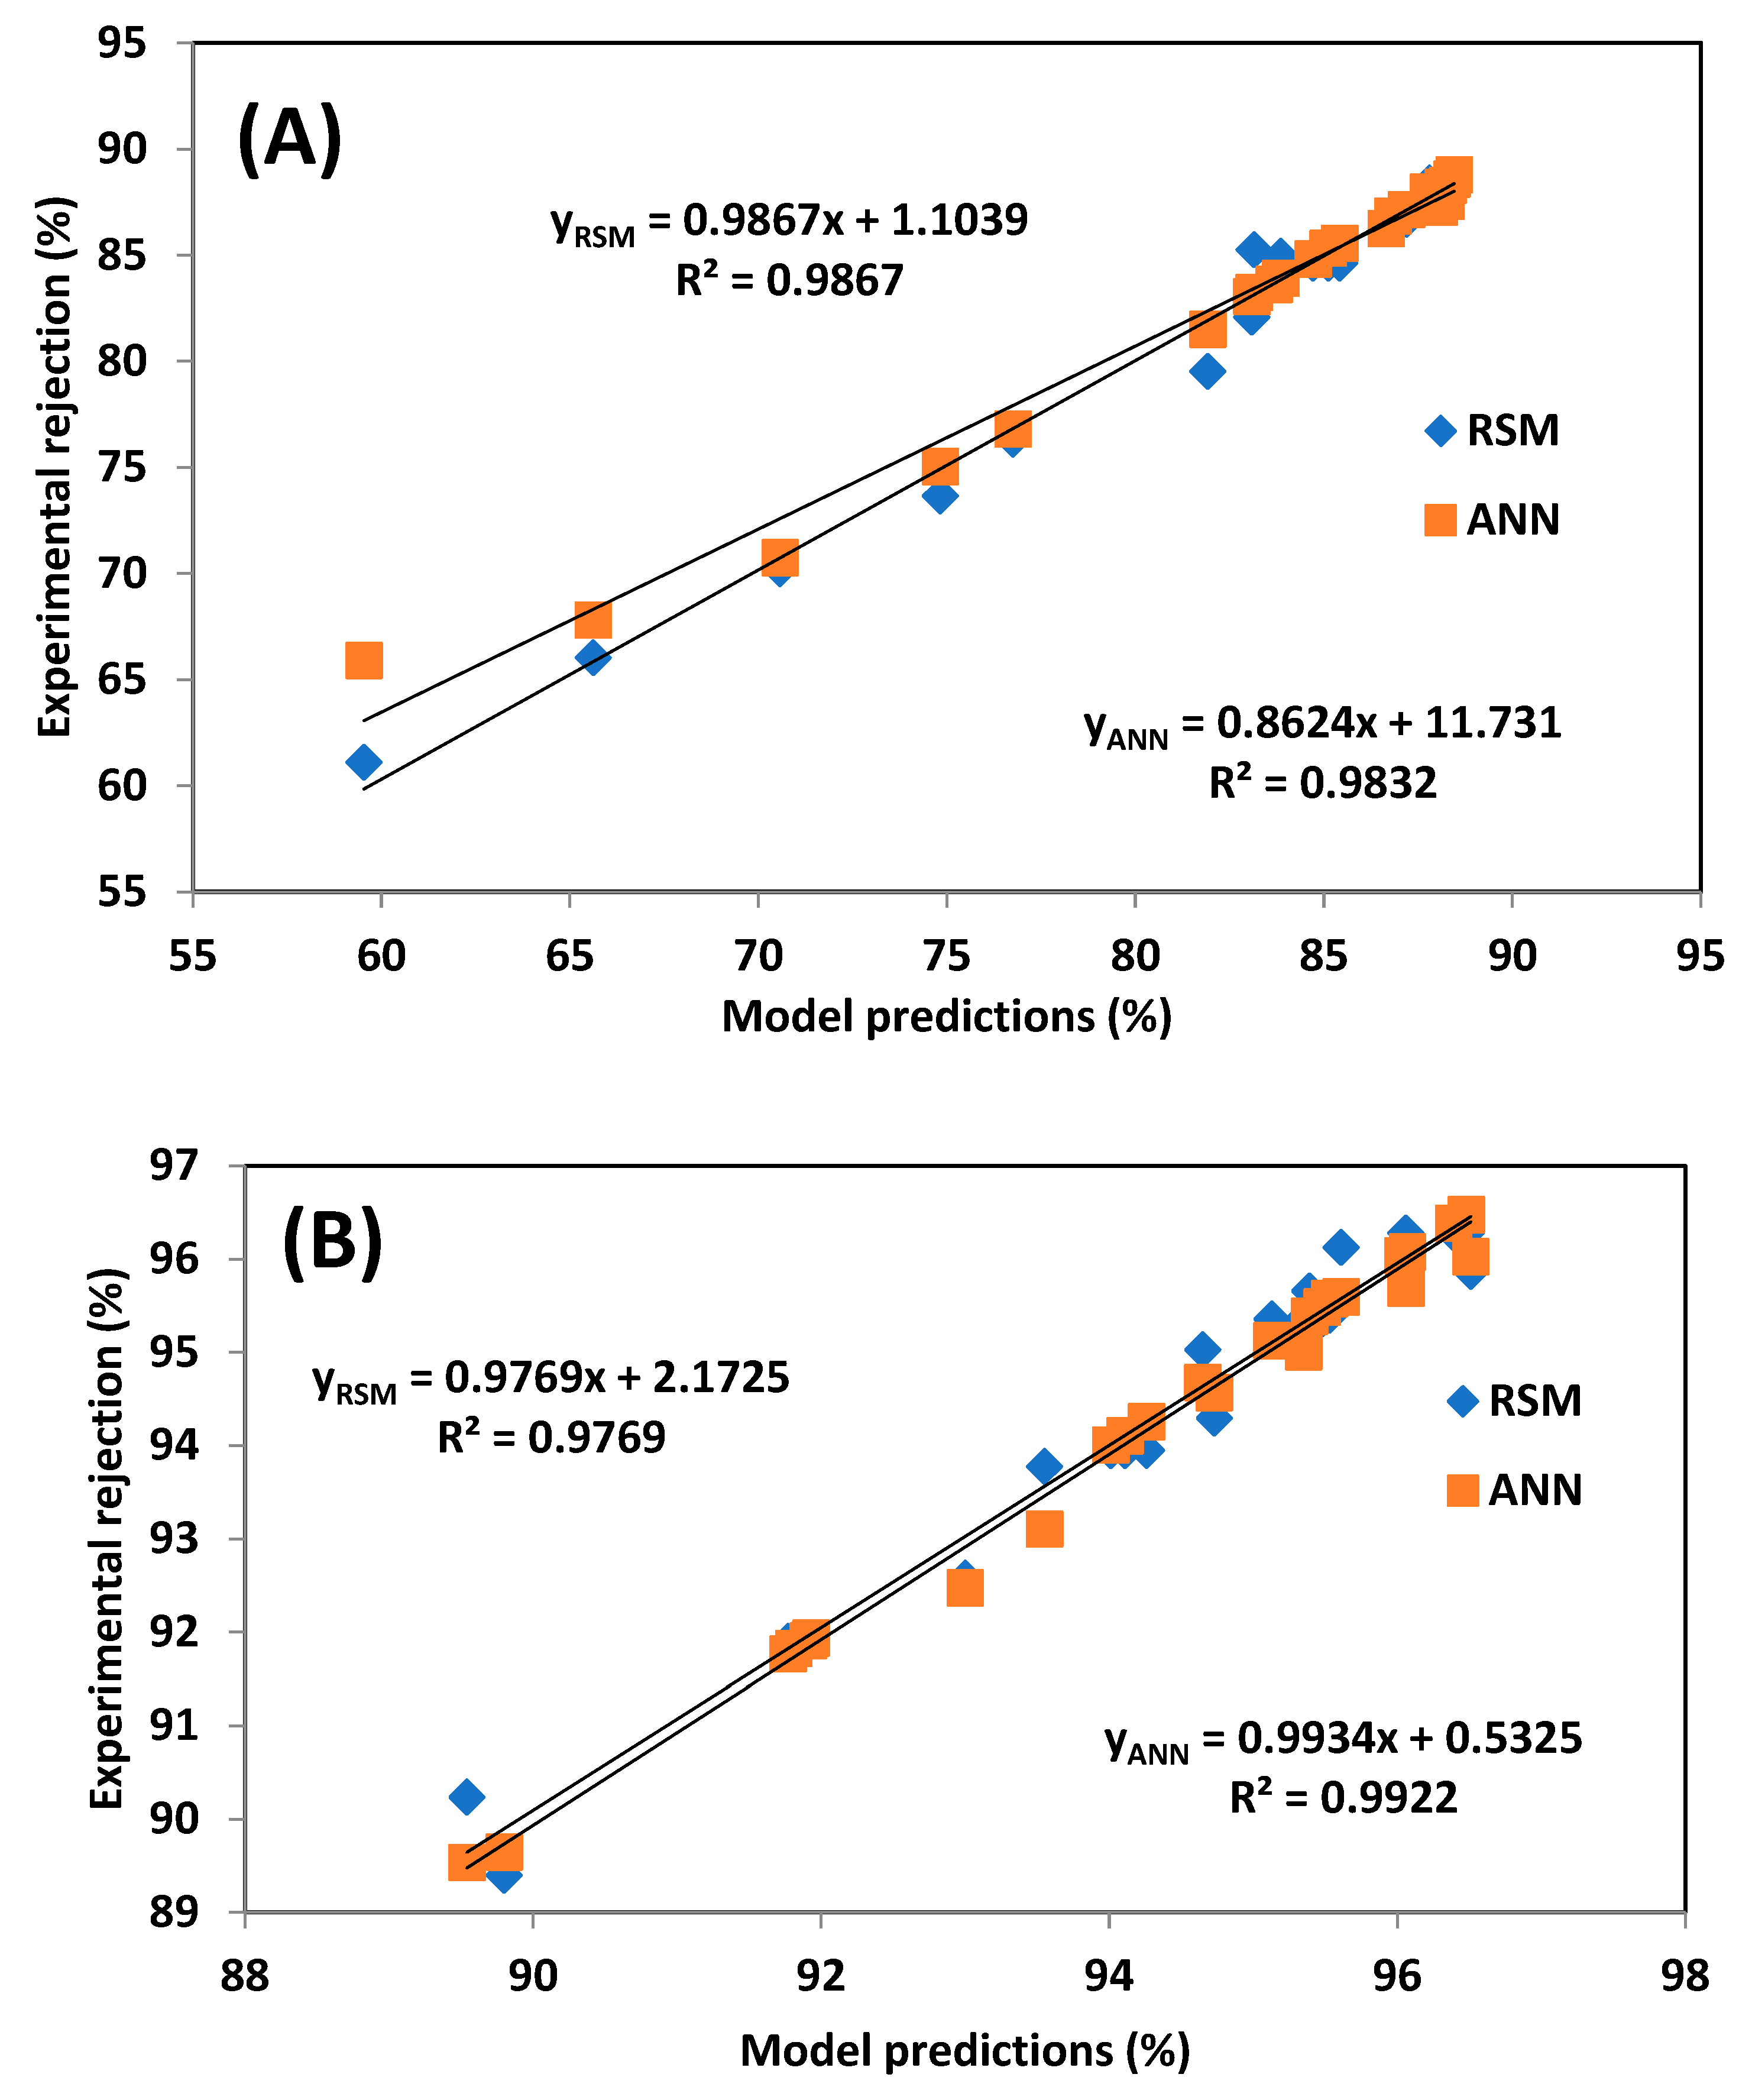

Table 1.
Factors and levels of the custom experimental design for membrane separation.
| Factor or Independent variable | Level 1 | Level 2 | Level 3 | Level 4 | Level 5 |
|---|---|---|---|---|---|
| X1 (Pressure, bar) | 10 | 15 | 20 | 25 | 30 |
| X2 (Feed concentration, mg/L) | 10 | 15 | 20 | - | - |
| X3 (Feed flow rate, L/min) | 5 | 10 | 15 | - | - |
Table 2.
Experimental and predicted responses of operating parameters.
| Run | Independent variables | Caffeine Rejection (AFC 40) |
Paracetamol Rejection (AFC 80) |
Model Residuals | ||||||||||
|---|---|---|---|---|---|---|---|---|---|---|---|---|---|---|
| (AFC 40) | (AFC 80) | |||||||||||||
| X1 [bar] | X2 [mg/L] |
X3 [L/min] | Y Exp. [%] |
YRSM [%] |
YANN [%] |
YExp. [%] |
YRSM [%] |
YANN [%] |
RSM [-] |
ANN [-] |
RSM [-] |
ANN [-] |
||
| 1 | 10 | 20 | 15 | 84.71 | 84.62 | 84.83 | 91.91 | 91.92 | 91.91 | 0.0897 | -0.1195 | -0.0143 | 0.0017 | |
| 2 | 15 | 20 | 15 | 86.65 | 86.69 | 86.26 | 94.01 | 93.95 | 94.01 | -0.0390 | 0.3919 | 0.0576 | -0.0018 | |
| 3 | 20 | 20 | 15 | 87.77 | 88.01 | 87.73 | 95.35 | 95.36 | 95.01 | -0.2369 | 0.0412 | -0.0051 | 0.3413 | |
| 4 | 25 | 20 | 15 | 88.16 | 88.57 | 88.21 | 96.04 | 96.13 | 96.04 | -0.4139 | -0.0512 | -0.0923 | -0.0025 | |
| 5 | 30 | 20 | 15 | 88.29 | 88.39 | 88.29 | 96.48 | 96.28 | 96.48 | -0.1000 | 0.0031 | 0.1958 | -0.0005 | |
| 6 | 10 | 10 | 15 | 85.42 | 84.62 | 85.57 | 89.54 | 90.24 | 89.54 | 0.7997 | -0.1503 | -0.6993 | -0.004 | |
| 7 | 15 | 10 | 15 | 87.19 | 86.69 | 87.15 | 93.00 | 92.58 | 92.48 | 0.5010 | 0.0358 | 0.4154 | 0.5196 | |
| 8 | 20 | 10 | 15 | 88.06 | 88.01 | 87.28 | 94.73 | 94.30 | 94.57 | 0.0531 | 0.7786 | 0.4254 | 0.1625 | |
| 9 | 25 | 10 | 15 | 88.23 | 88.57 | 87.54 | 95.53 | 95.40 | 95.58 | -0.3439 | 0.6924 | 0.1309 | -0.0504 | |
| 10 | 30 | 10 | 15 | 88.45 | 88.39 | 88.80 | 96.51 | 95.87 | 96.03 | 0.0600 | -0.3528 | 0.6418 | 0.4831 | |
| 11 | 10 | 5 | 15 | 85.11 | 84.62 | 85.34 | 89.80 | 89.40 | 89.65 | 0.4897 | -0.2261 | 0.4032 | 0.1533 | |
| 12 | 15 | 5 | 15 | 86.83 | 86.69 | 86.85 | 91.77 | 91.90 | 91.77 | 0.1410 | -0.0179 | -0.1308 | 0.0007 | |
| 13 | 20 | 5 | 15 | 87.77 | 88.01 | 87.98 | 93.55 | 93.78 | 93.11 | -0.2369 | -0.2084 | -0.2293 | 0.4361 | |
| 14 | 25 | 5 | 15 | 88.40 | 88.57 | 88.59 | 94.65 | 95.03 | 94.68 | -0.1739 | -0.185 | -0.3825 | -0.0326 | |
| 15 | 30 | 5 | 15 | 87.80 | 88.39 | 87.91 | 95.39 | 95.66 | 95.39 | -0.5900 | -0.111 | -0.2702 | 0.0018 | |
| 16 | 10 | 20 | 10 | 83.15 | 85.26 | 83.25 | 91.93 | 91.92 | 91.94 | -2.11 | -0.1032 | 0.0057 | -0.0122 | |
| 17 | 15 | 20 | 10 | 83.86 | 84.95 | 83.92 | 94.26 | 93.95 | 94.26 | -1.09 | -0.0642 | 0.3076 | -0.0047 | |
| 18 | 20 | 20 | 10 | 83.68 | 83.89 | 83.63 | 95.48 | 95.36 | 95.49 | -0.2109 | 0.0502 | 0.1249 | -0.0056 | |
| 19 | 25 | 20 | 10 | 83.09 | 82.08 | 83.05 | 96.07 | 96.13 | 96.08 | 1.01 | 0.0375 | -0.0623 | -0.0057 | |
| 20 | 30 | 20 | 10 | 81.92 | 79.52 | 81.51 | 96.39 | 96.28 | 96.39 | 2.40 | 0.4122 | 0.1058 | 0.0003 | |
| 21 | 10 | 20 | 5 | 76.76 | 76.33 | 76.82 | 91.81 | 91.92 | 91.83 | 0.4255 | -0.0613 | -0.1143 | -0.0205 | |
| 22 | 15 | 20 | 5 | 74.83 | 73.65 | 75.05 | 94.11 | 93.95 | 94.11 | 1.18 | -0.2214 | 0.1576 | -0.0002 | |
| 23 | 20 | 20 | 5 | 70.58 | 70.22 | 70.75 | 95.13 | 95.36 | 95.13 | 0.3631 | -0.1731 | -0.2251 | -0.0012 | |
| 24 | 25 | 20 | 5 | 65.62 | 66.03 | 67.81 | 95.61 | 96.13 | 95.60 | -0.4117 | -2.1909 | -0.5223 | 0.0113 | |
| 25 | 30 | 20 | 5 | 59.54 | 61.10 | 65.91 | 96.06 | 96.28 | 95.69 | -1.56 | -6.3702 | -0.2242 | 0.3688 | |
Table 3.
ANOVA regression model (reduced quadratic) for Caffeine rejection (AFC 40).
| Source | Sum of Squares | df | Mean Square | F-value | p-value | |
|---|---|---|---|---|---|---|
| Model | 1389.46 | 5 | 277.89 | 282.59 | < 0.0001 | significant |
| A-Pressure [X₁] | 82.21 | 1 | 82.21 | 83.60 | < 0.0001 | |
| C-Flow rate [X3] | 1186.82 | 1 | 1186.82 | 1206.90 | < 0.0001 | |
| AC | 180.66 | 1 | 180.66 | 183.72 | < 0.0001 | |
| A² | 9.87 | 1 | 9.87 | 10.03 | 0.0051 | |
| C² | 85.65 | 1 | 85.65 | 87.10 | < 0.0001 | |
| Residual | 18.68 | 19 | 0.9834 | < 0.0001 | ||
| Cor Total | 1408.14 | 24 | ||||
| R2 | 0.9867 | |||||
| Adjusted R2 | 0.9832 | |||||
| Predicted R2 | 0.9645 | |||||
| Adequate Precision | 58.5621 |
Table 4.
ANOVA regression model (reduced quadratic) for Paracetamol rejection (AFC 80).
| Source | Sum of Squares | df | Mean Square | F-value | p-value | |
|---|---|---|---|---|---|---|
| Model | 97.84 | 4 | 24.46 | 211.73 | < 0.0001 | significant |
| A-Pressure [X₁] | 76.25 | 1 | 76.25 | 660.04 | < 0.0001 | |
| B-Concentration [X2] | 11.04 | 1 | 11.04 | 95.52 | < 0.0001 | |
| AB | 2.01 | 1 | 2.01 | 17.42 | 0.0005 | |
| A² | 6.85 | 1 | 6.85 | 59.25 | < 0.0001 | |
| Residual | 2.31 | 20 | 0.1155 | |||
| Cor Total | 100.15 | 24 | ||||
| R2 | 0.9769 | |||||
| Adjusted R2 | 0.9723 | |||||
| Predicted R2 | 0.9590 | |||||
| Adequate Precision | 45.3104 |
Table 5.
Statistical comparison of RSM and ANN models.
| Error Function | AFC 40 membrane | AFC 80 membrane | ||
| RSM | ANN | RSM | ANN | |
| R2 | 0.9867 | 0.9832 | 0.9769 | 0.9922 |
| RMSE | 0.8654 | 1.3700 | 0.3041 | 0.1999 |
| MPSED (%) | 0.0125 | 0.0512 | 0.0011 | 0.0004 |
| HYBRID (%) | 1.0893 | 3.5254 | 0.1124 | 0.0480 |
| AAD (%) | 0.7610 | 0.7720 | 0.2534 | 0.1101 |
Disclaimer/Publisher’s Note: The statements, opinions and data contained in all publications are solely those of the individual author(s) and contributor(s) and not of MDPI and/or the editor(s). MDPI and/or the editor(s) disclaim responsibility for any injury to people or property resulting from any ideas, methods, instructions or products referred to in the content. |
© 2025 by the authors. Licensee MDPI, Basel, Switzerland. This article is an open access article distributed under the terms and conditions of the Creative Commons Attribution (CC BY) license (http://creativecommons.org/licenses/by/4.0/).
Copyright: This open access article is published under a Creative Commons CC BY 4.0 license, which permit the free download, distribution, and reuse, provided that the author and preprint are cited in any reuse.


