
Submitted:
27 June 2025
Posted:
30 June 2025
You are already at the latest version
Abstract
The study investigates and compares South-Oriented and East-West photo-voltaic configurations on a 1275 m² rooftop at SRH Berlin University using 3D modeling and simulation tools. The East-West system produces 6% more electricity (3020.220 kWh), provides better space utilization, and had a faster payback period (6.49 years), while the South-Oriented system shows a lower levelized cost of electricity (0.0684 € per kilowatt-hour), a higher internal rate of return (23.09%), and a net present value of 73.804,75 €. The structural analysis through ANSYS confirms minimal deformation, ensuring safety. Compared to traditional setups, these configurations significantly enhance energy production and financial efficiency, highlighting the East-West orientation’s suitability for maximizing self-consumption in institutional environments.
Keywords:
Photovoltaic System Configuration
; Techno-Economical Analysis
; East-West Configuration System
; South-Oriented Layouts
1. Introduction
The global dependence on non-renewable energy sources such as coal, oil, and natural gas has led to numerous environmental and health concerns, with these sources still accounting for over 80% of the global primary energy demand. The increase in consumption, especially in developing nations, has accelerated the depletion of fossil fuel reserves, highlighting the urgency for sustainable alternatives. The evolution of photovoltaic (PV) technology, particularly the efficiency gains in single-crystal silicon solar cells and declining system costs, has reinforced solar energy's practical viability. In recent years, the development of Photovoltaic (PV) technology has significantly decreased the cost of solar systems while increasing their efficiency. For example, single-crystal silicon solar cells have achieved around 25% efficiency under laboratory conditions (Ali et al., 2021).
While renewables constitute nearly 24% of the global electricity, coal remains dominant at about 42%, necessary for continued innovation in solar PV to enhance cost-efficiency and integration. This gradual change emphasizes the importance of continuing innovation in renewable energy technologies, especially solar PV, which can increase efficiency and further reduce costs (Lahnaoui et al., 2017). South-oriented systems, for instance, offer high midday yields but are less effective during early and late hours. In contrast, East-West configurations generate energy more consistently throughout the day, particularly benefiting flat rooftop installations and limited-space environments such as university campuses. This study aims to compare the techno-economical efficiency of South-Oriented and East-West PV configurations using SRH Berlin University of Applied Sciences as a case study. The research investigates energy yield, installation and maintenance costs, financial viability, and structural impact. Through modeling, simulation, and structural analysis, the study seeks to determine the optimal configuration for institutional rooftop applications and contribute practical insights for similar projects in the renewable energy domain. The data shown below is the list of chapters where my research is focused on such as Site Selection, System Design Parameters, Structural Analysis using ANSYS, Simulation Software, Findings, Discussion of Findings, and Conclusion.
2. Site Selection
The site selected is the rooftop of SRH Berlin University of Applied Sciences, located at Sonnenallee 221, 12059 Berlin, with approximate coordinates 52°28'30"N, 13°27'27"E. The area of the rooftop is approximately 1275 square meters (measured as 38.236 m × 33.35 m). This location was chosen due to its accessibility, representative nature for institutional buildings, and practical relevance for evaluating solar PV installations in educational institutions.
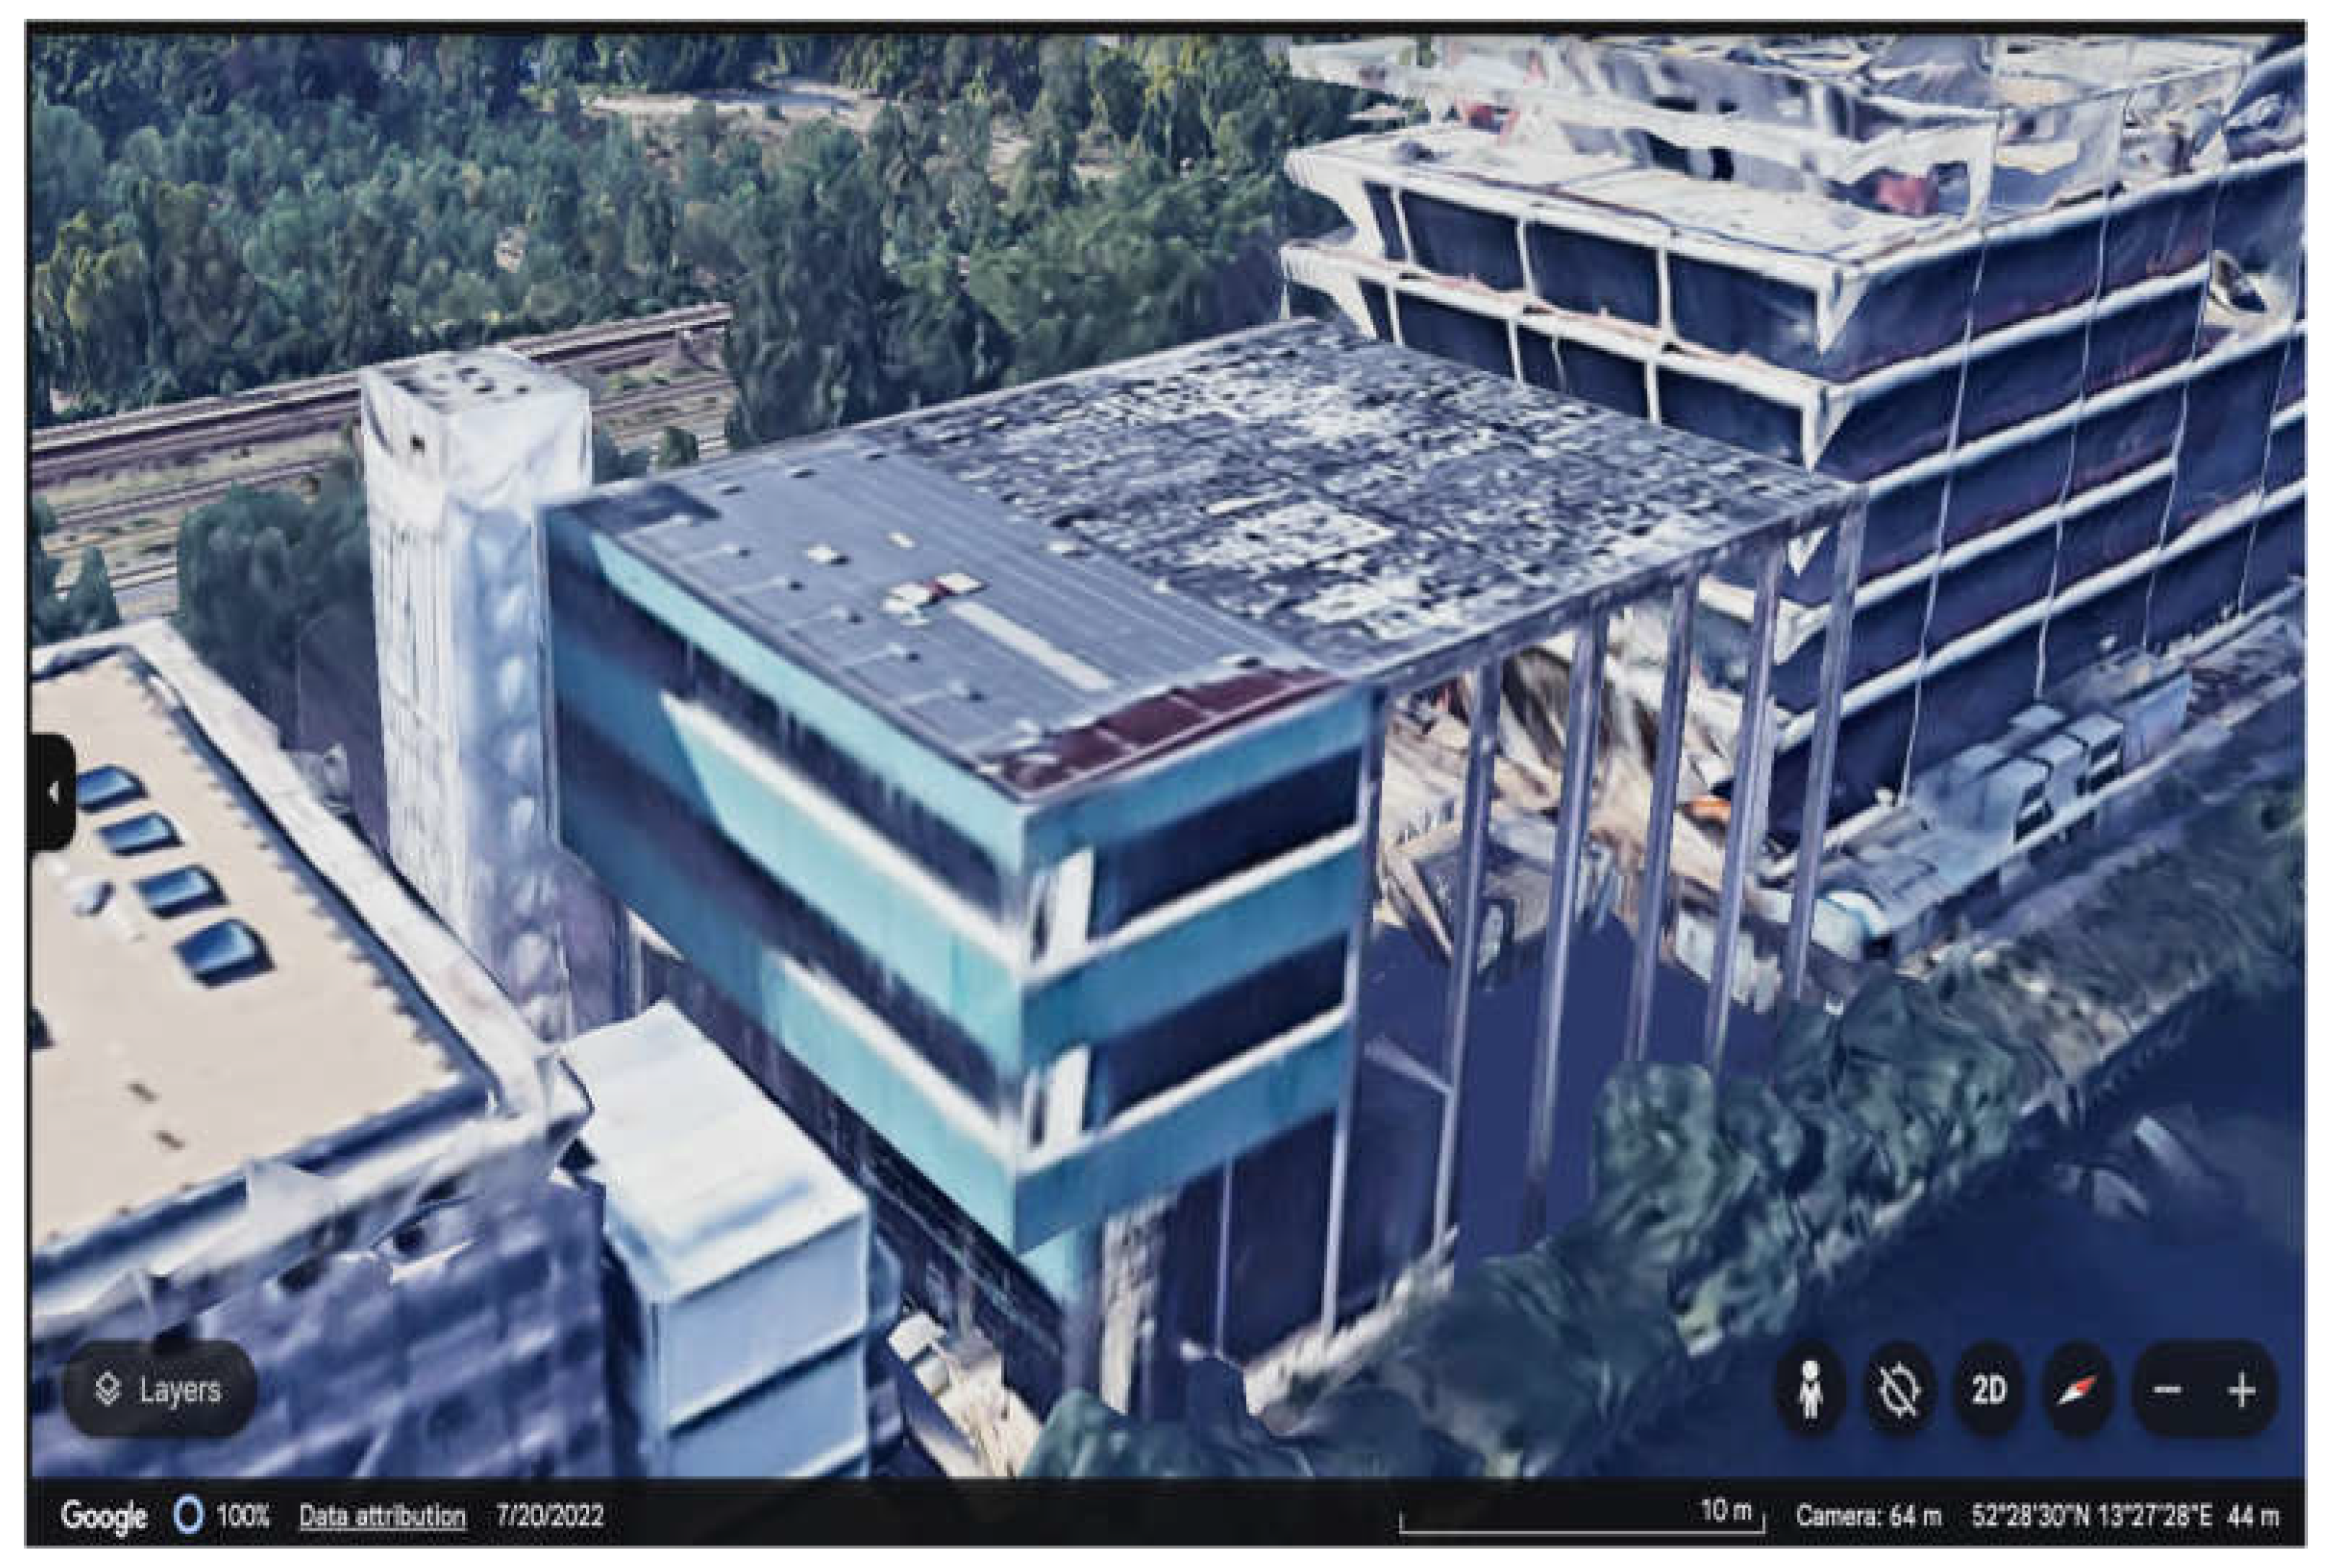
To model the building and surrounding environment accurately, Google Earth was used to obtain a satellite view and topographical details of the building. This data was then imported into SketchUp, a 3D modeling tool, to create a scaled digital model of the rooftop and nearby structures. A scale reference of 10 meters is taken into consideration for accurate measurement. This model is essential for understanding shading effects, rooftop geometry, and potential installation constraints. Solar irradiance data were sourced from PVGIS-SARAH3 for the years 2018 to 2023, covering seasonal variations and long-term trends. This dataset allowed for an accurate assessment of the site’s solar potential throughout the year. Additionally, temperature data was analyzed because solar panel performance tends to decrease at higher temperatures. The environmental analysis helped determine realistic system performance expectations and informed decisions about orientation, tilt, and module type.
Figure 1.
Building Design using SketchUp and Google Earth.
3. System Design Parameters
The system design process is a crucial step in evaluating the technical and economic feasibility of various PV configurations. This study considers two PV system types: a South-Oriented System and an East-West Configuration System, both installed on the flat rooftop of SRH Berlin University of Applied Sciences. Each system was carefully designed by selecting appropriate modules, inverters, structural support systems, and layout parameters to ensure optimal performance, safety, and financial return.
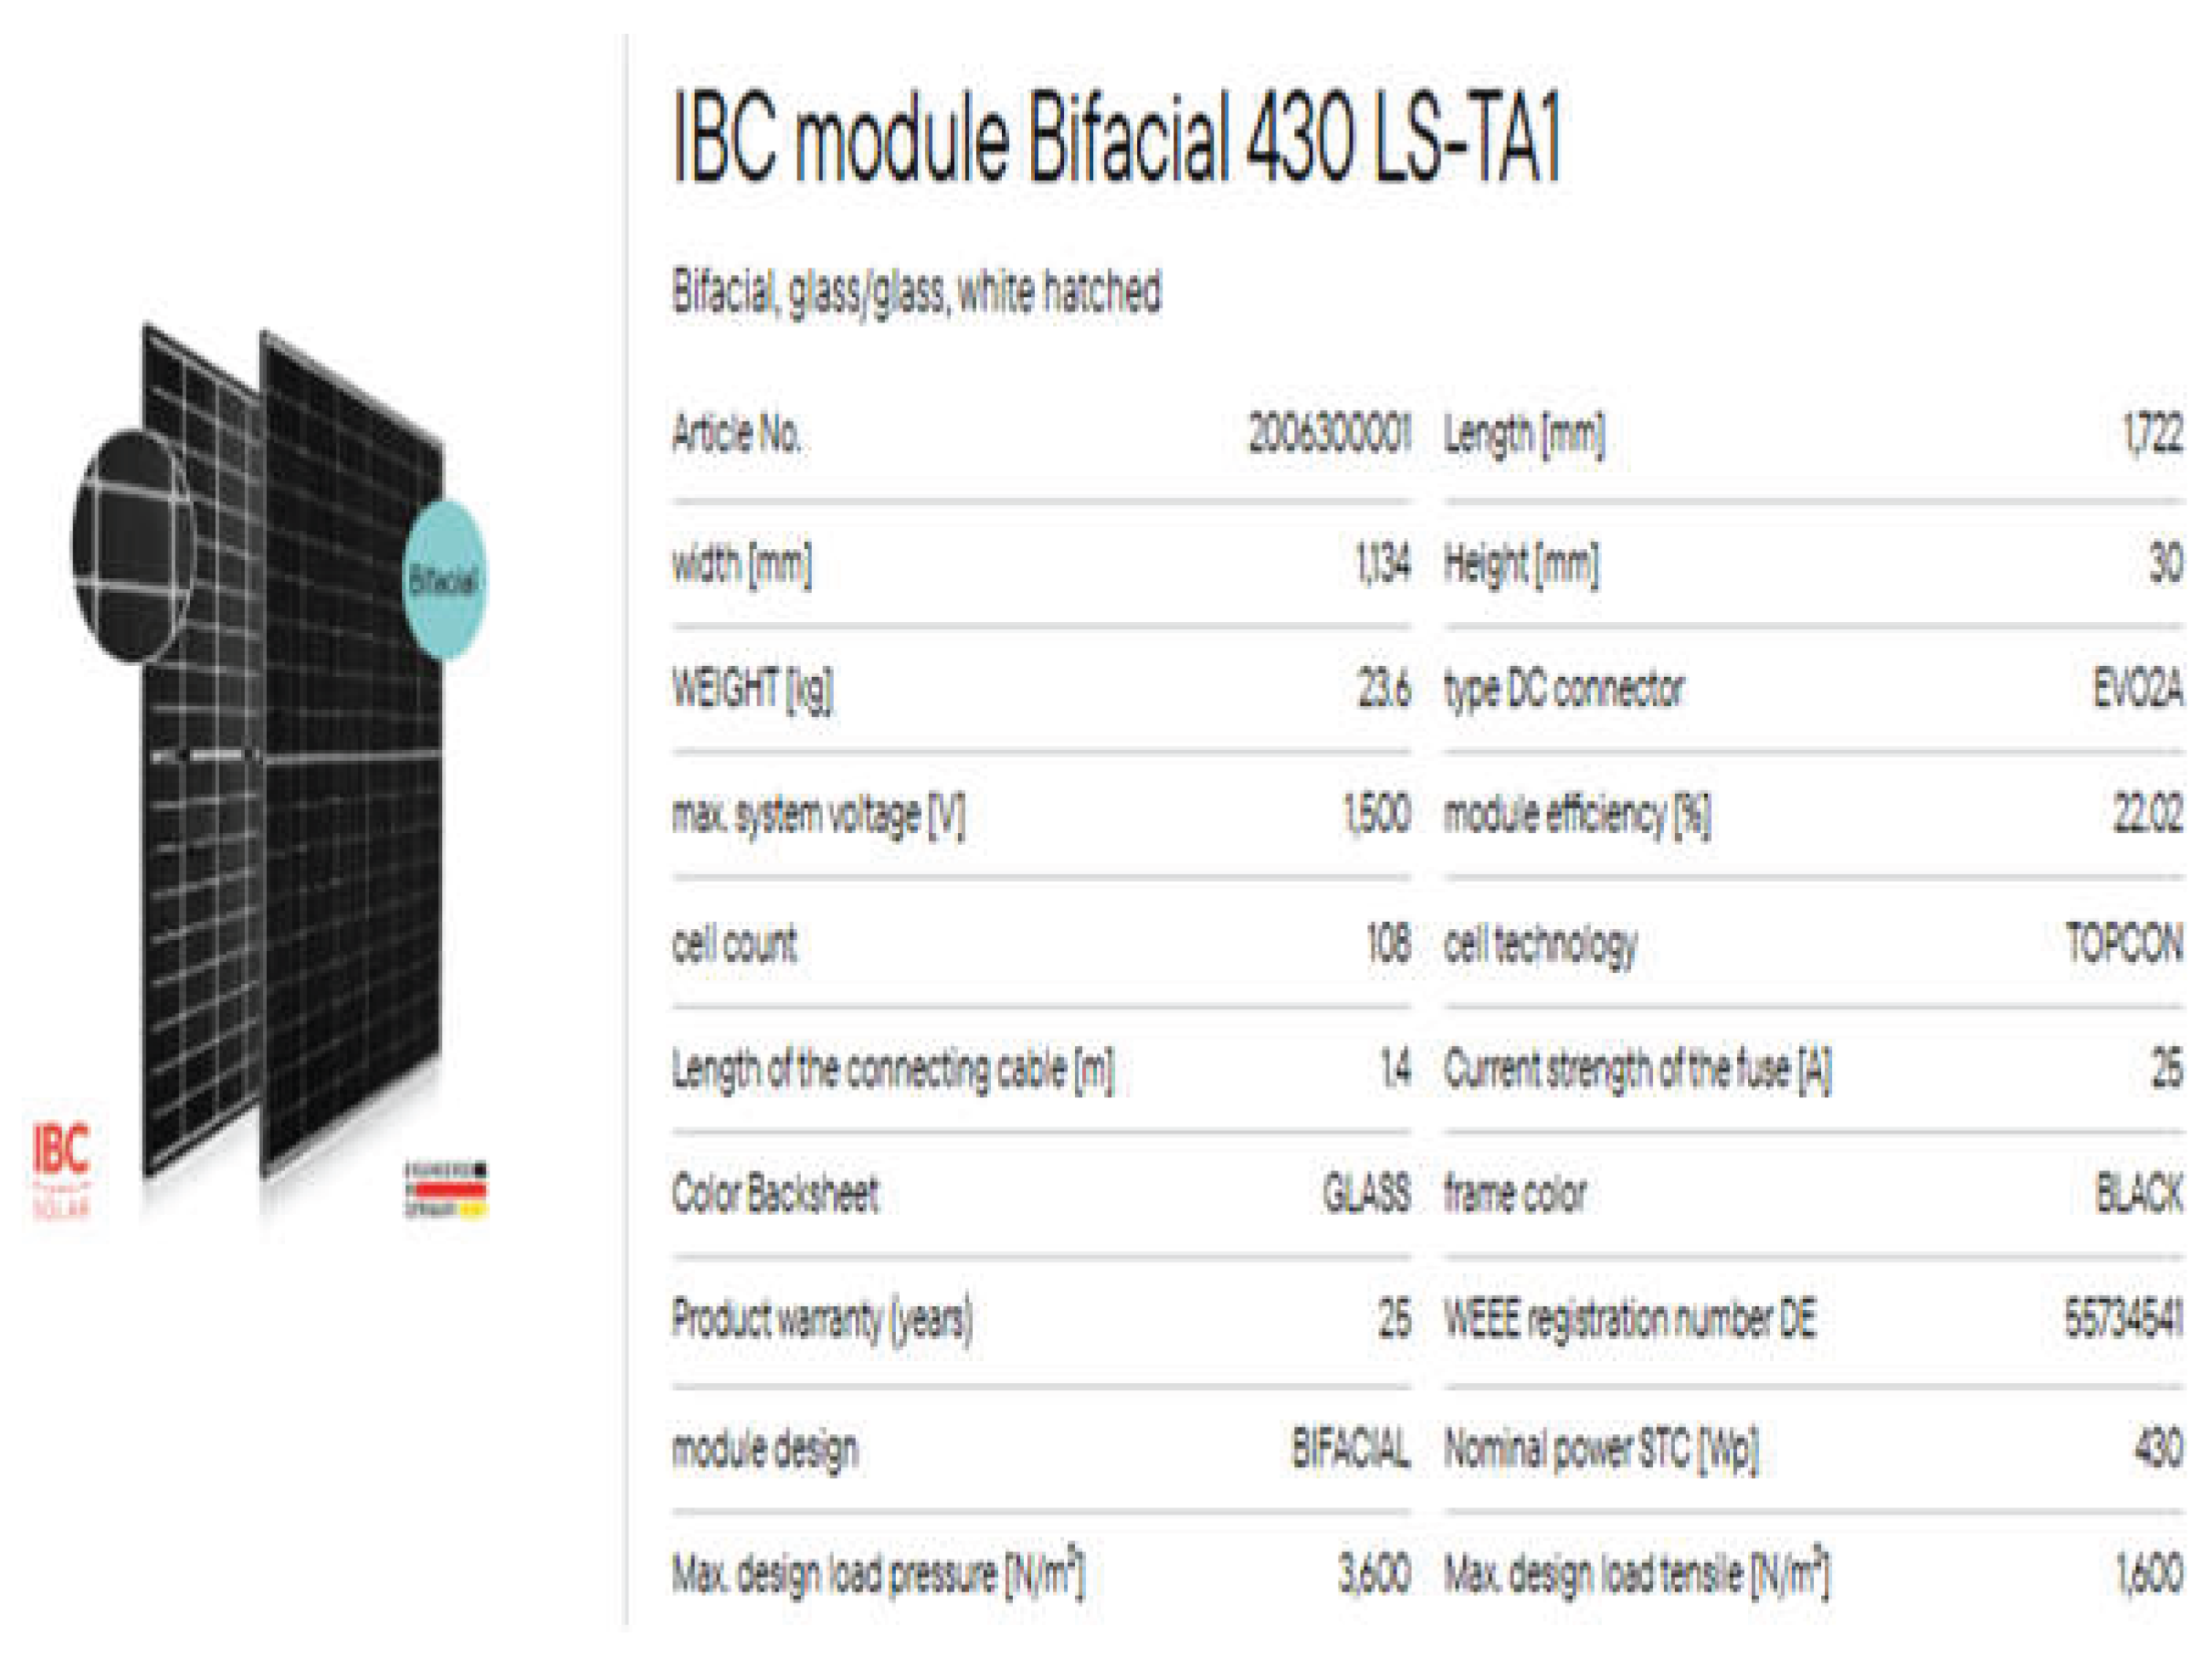
Both systems utilize IBC Bifacial 430 LS-TA1 solar modules, known for their high efficiency and long-term durability. These modules are bifacial, meaning they can capture sunlight from both the front and rear sides, leading to improved energy yield, especially on reflective surfaces like flat rooftops. Key features of the selected module include:
- PV Module Selection
The weight of the PV module is 23.6 kg per module per the standards from IBS Solar module and is efficient around 21% under standard test conditions with 1.13 m x 1.73 m dimensions. The rated power output (Pmax) is 430 Wp. The same module is used in both configurations to maintain consistency in performance metrics and simplify comparative analysis.
- Module Count and System Capacity
To maximize space utilization and meet varying energy demands, the number of modules was optimized based on rooftop space availability and configuration layout:
| Sr. No | Cases | South-Oriented System | East–West System |
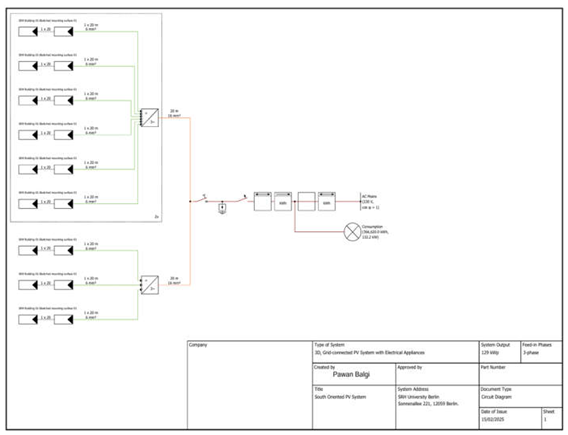
| 1 | Total Modules | 300 | 360 |
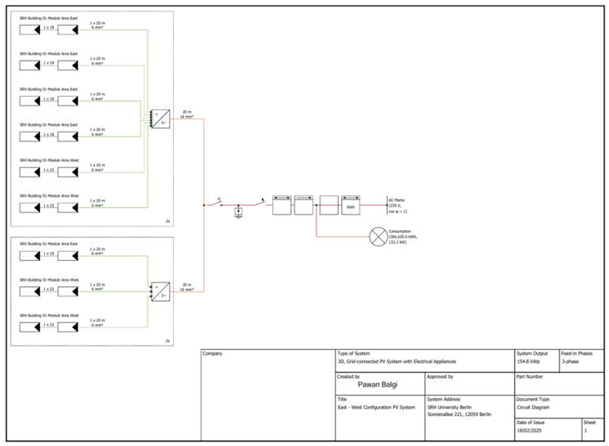
| 2 | Installed Capacity | 129.0 kWp | 154.8 kWp |
| 3 | Orientation | South (180°) | East (91°) / West (269°) |
| 4 | Tilt angle | 15° | 10° |
| 5 | Rooftop Area Used | 585.8 m² | 703.0 m² |
The East-West configuration allows a higher panel density by reducing row spacing, which is made possible due to the lower tilt angle. This layout is more efficient for flat roofs and institutions with limited rooftop space.
Mounting and Racking System
The structural mounting system is designed using specifications from Aero Compact, a manufacturer of aerodynamic, ballasted mounting systems suitable for flat roofs. The choice of racking system varies based on tilt angles and wind load considerations:
- South-Oriented System: Uses racks with higher tilt for maximum solar exposure during midday hours.
- East-West System: Utilizes a dual-tilt structure that supports both east and west-facing panels back-to-back with a low profile to reduce wind loads and enable closer spacing.
Both systems are designed to withstand local wind, and snow loads as per German building codes. Ballasted mounting was preferred to avoid roof penetration.
4. Structural Analysis with ANSYS
Since solar panels add additional loads to the building, it is crucial to evaluate whether the structure can support these loads without significant deformation or failure. The load calculations are shown below in detail under the calculation section. The structural analysis was done over the selected location using ANSYS Workbench 2024 R2 Software following these key steps:
Structural Model Set Up:
Geometry Import: The building structure was designed on Solid Edge Software and then was modeled and imported into ANSYS using the STEP file format and providing possible simulations. ANSYS ensures an accurate simulation of mechanical behavior, helping to optimize module structures for better stability.
Material Properties: The roof material was assigned to concrete, with properties:
Density: 2.3 × 10⁻⁶ kg/mm³
Young’s Modulus: 30,000 MPa
Poisson’s Ratio: 0.18

Table 1.
Load Cases Considered.
| Cases | Total Force (N) | Load Description |
| Self-Weight Only | 8.653 x 10⁶ | Normal structure without the load of panels. |
| South-Oriented System | 8.723 x 10⁶ | Weight added over the roof due to South-oriented PV modules. |
| East-West System | 8.736 x 10⁶ | Weight added over the roof due to East-West PV modules. |
5. Simulation Software
- Sketch-Up Design:
Method: The design and analysis of the photovoltaic (PV) system are done by using SketchUp and PV Sol software. A 3D model of the site is created using SketchUp Software and Google Earth for location purposes, and then Google Earth builds specifications into SketchUp Software for design purposes, with accurate scale consideration and enabling an accurate depiction of the topography and structure orientation.
- b.
- PV SOL Software Design: In PV SOL, the simulation of the performance of the PV system is done by evaluating financial metrics, energy production, and configurations. This set of software tools promises a thorough method for enhancing the solar energy system's efficiency and design. Defining System Inputs: Important parameters of the building are entered into the software, such as the geographical location of the building (Sonnenallee 221, 12059 Berlin). The necessary specifications details of East-West and South-Oriented PV Systems, and which modules need to be considered, were done with the help of Aero Compact Software. This ensures that the simulations are based on accurate and localized data. IBC Solar company PV modules are taken into consideration in this case, and the design of the PV System.
Simulating Energy Production: The simulation will run for at least a year, and the daily and monthly energy output of both the PV systems will be provided in detail. This temporal analysis provides insights into each system's performance variability across different seasons, increasing the robustness of the comparative study. The simulated energy output data will be examined to determine the techno-economic efficiency of each configuration.
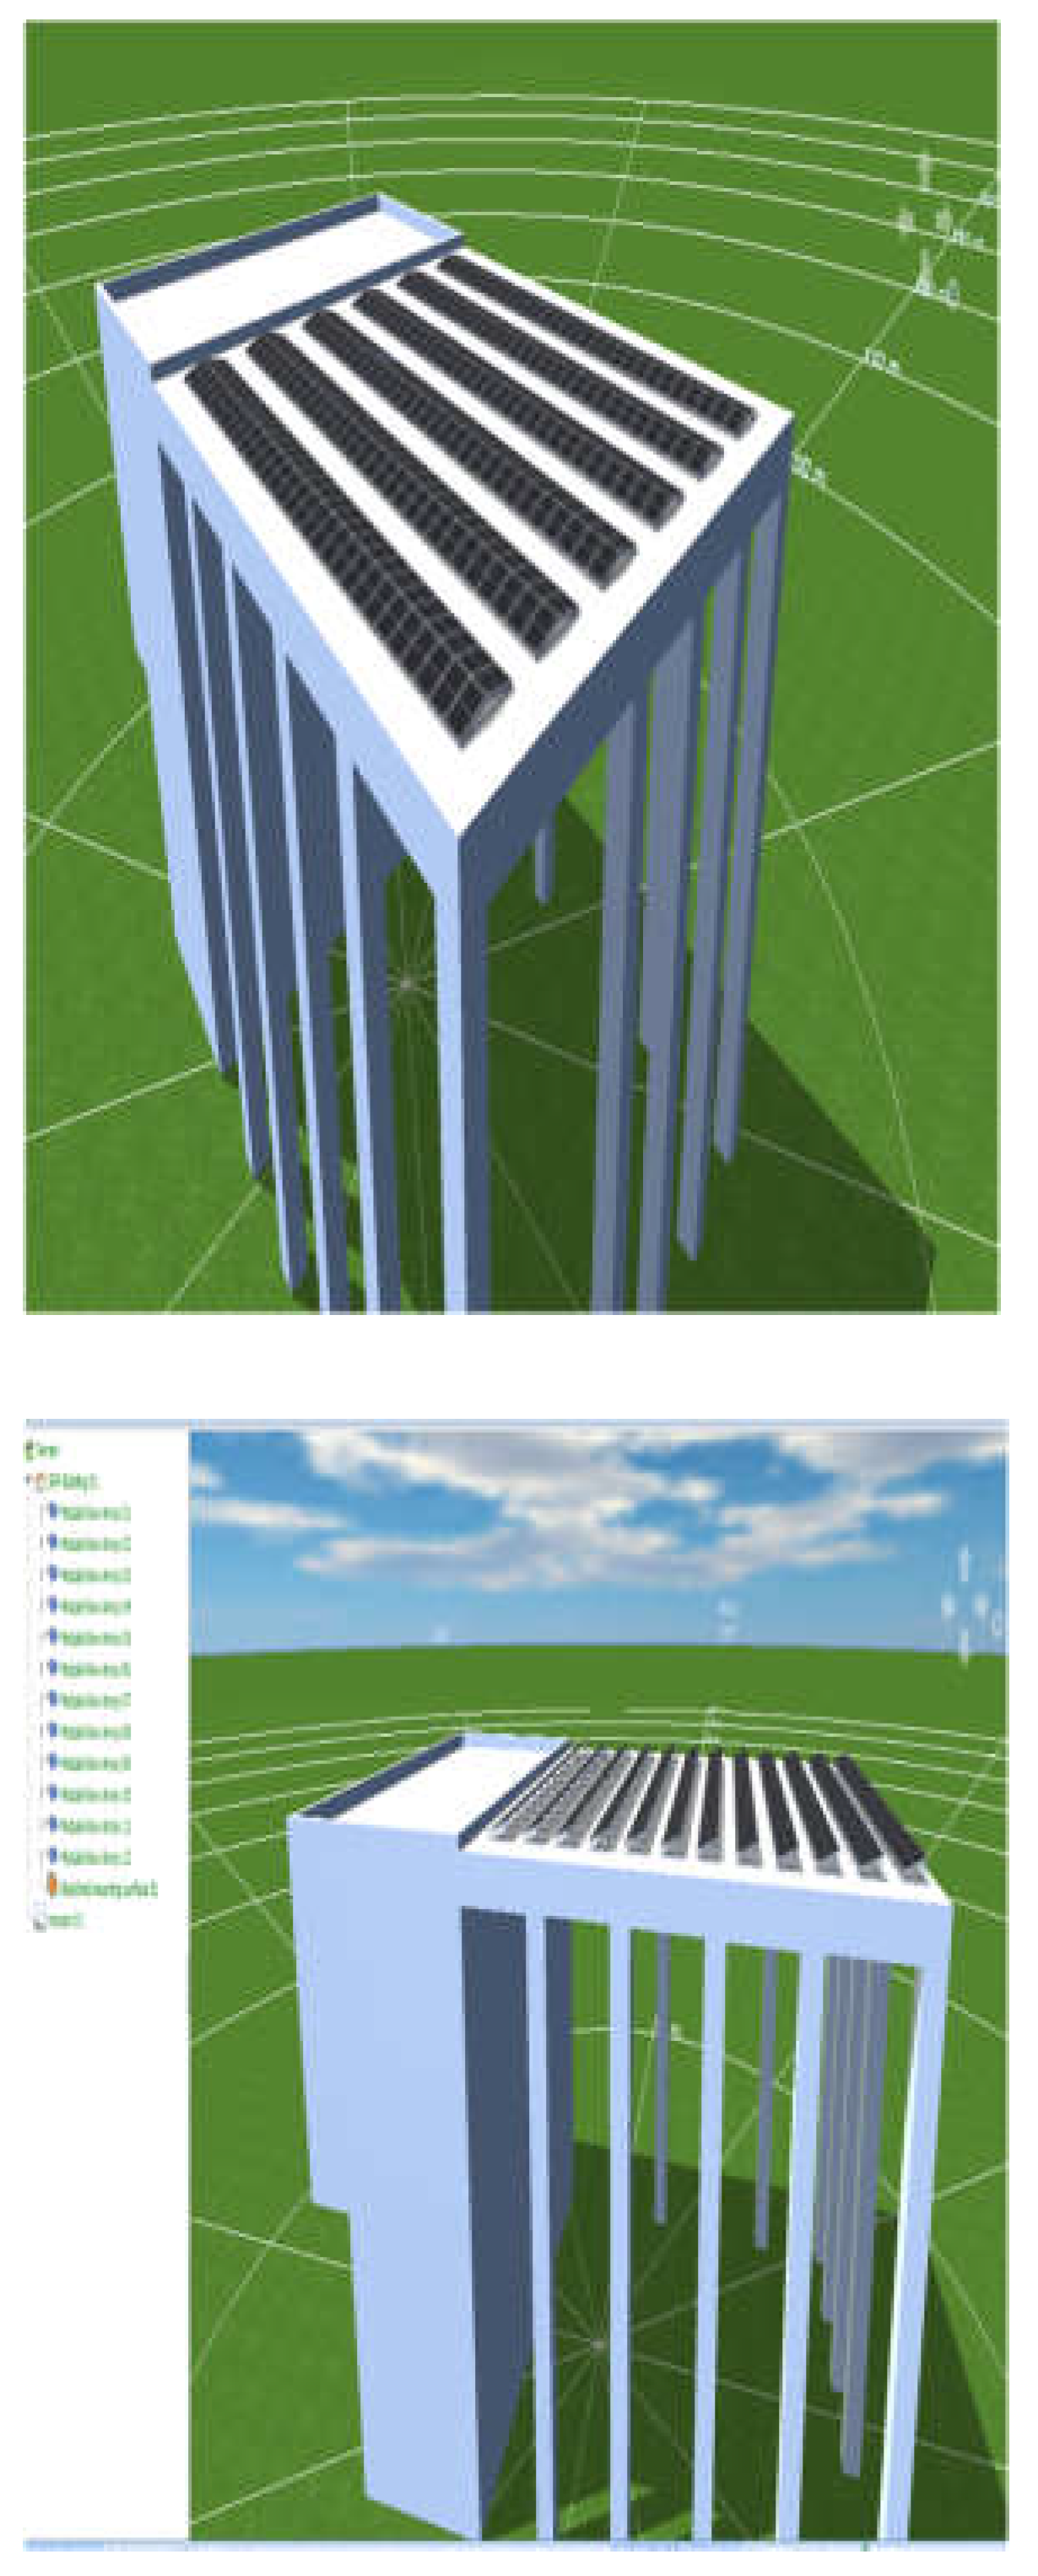
Figure 2.
Sketch Up Software Building Design for SRH University Berlin.
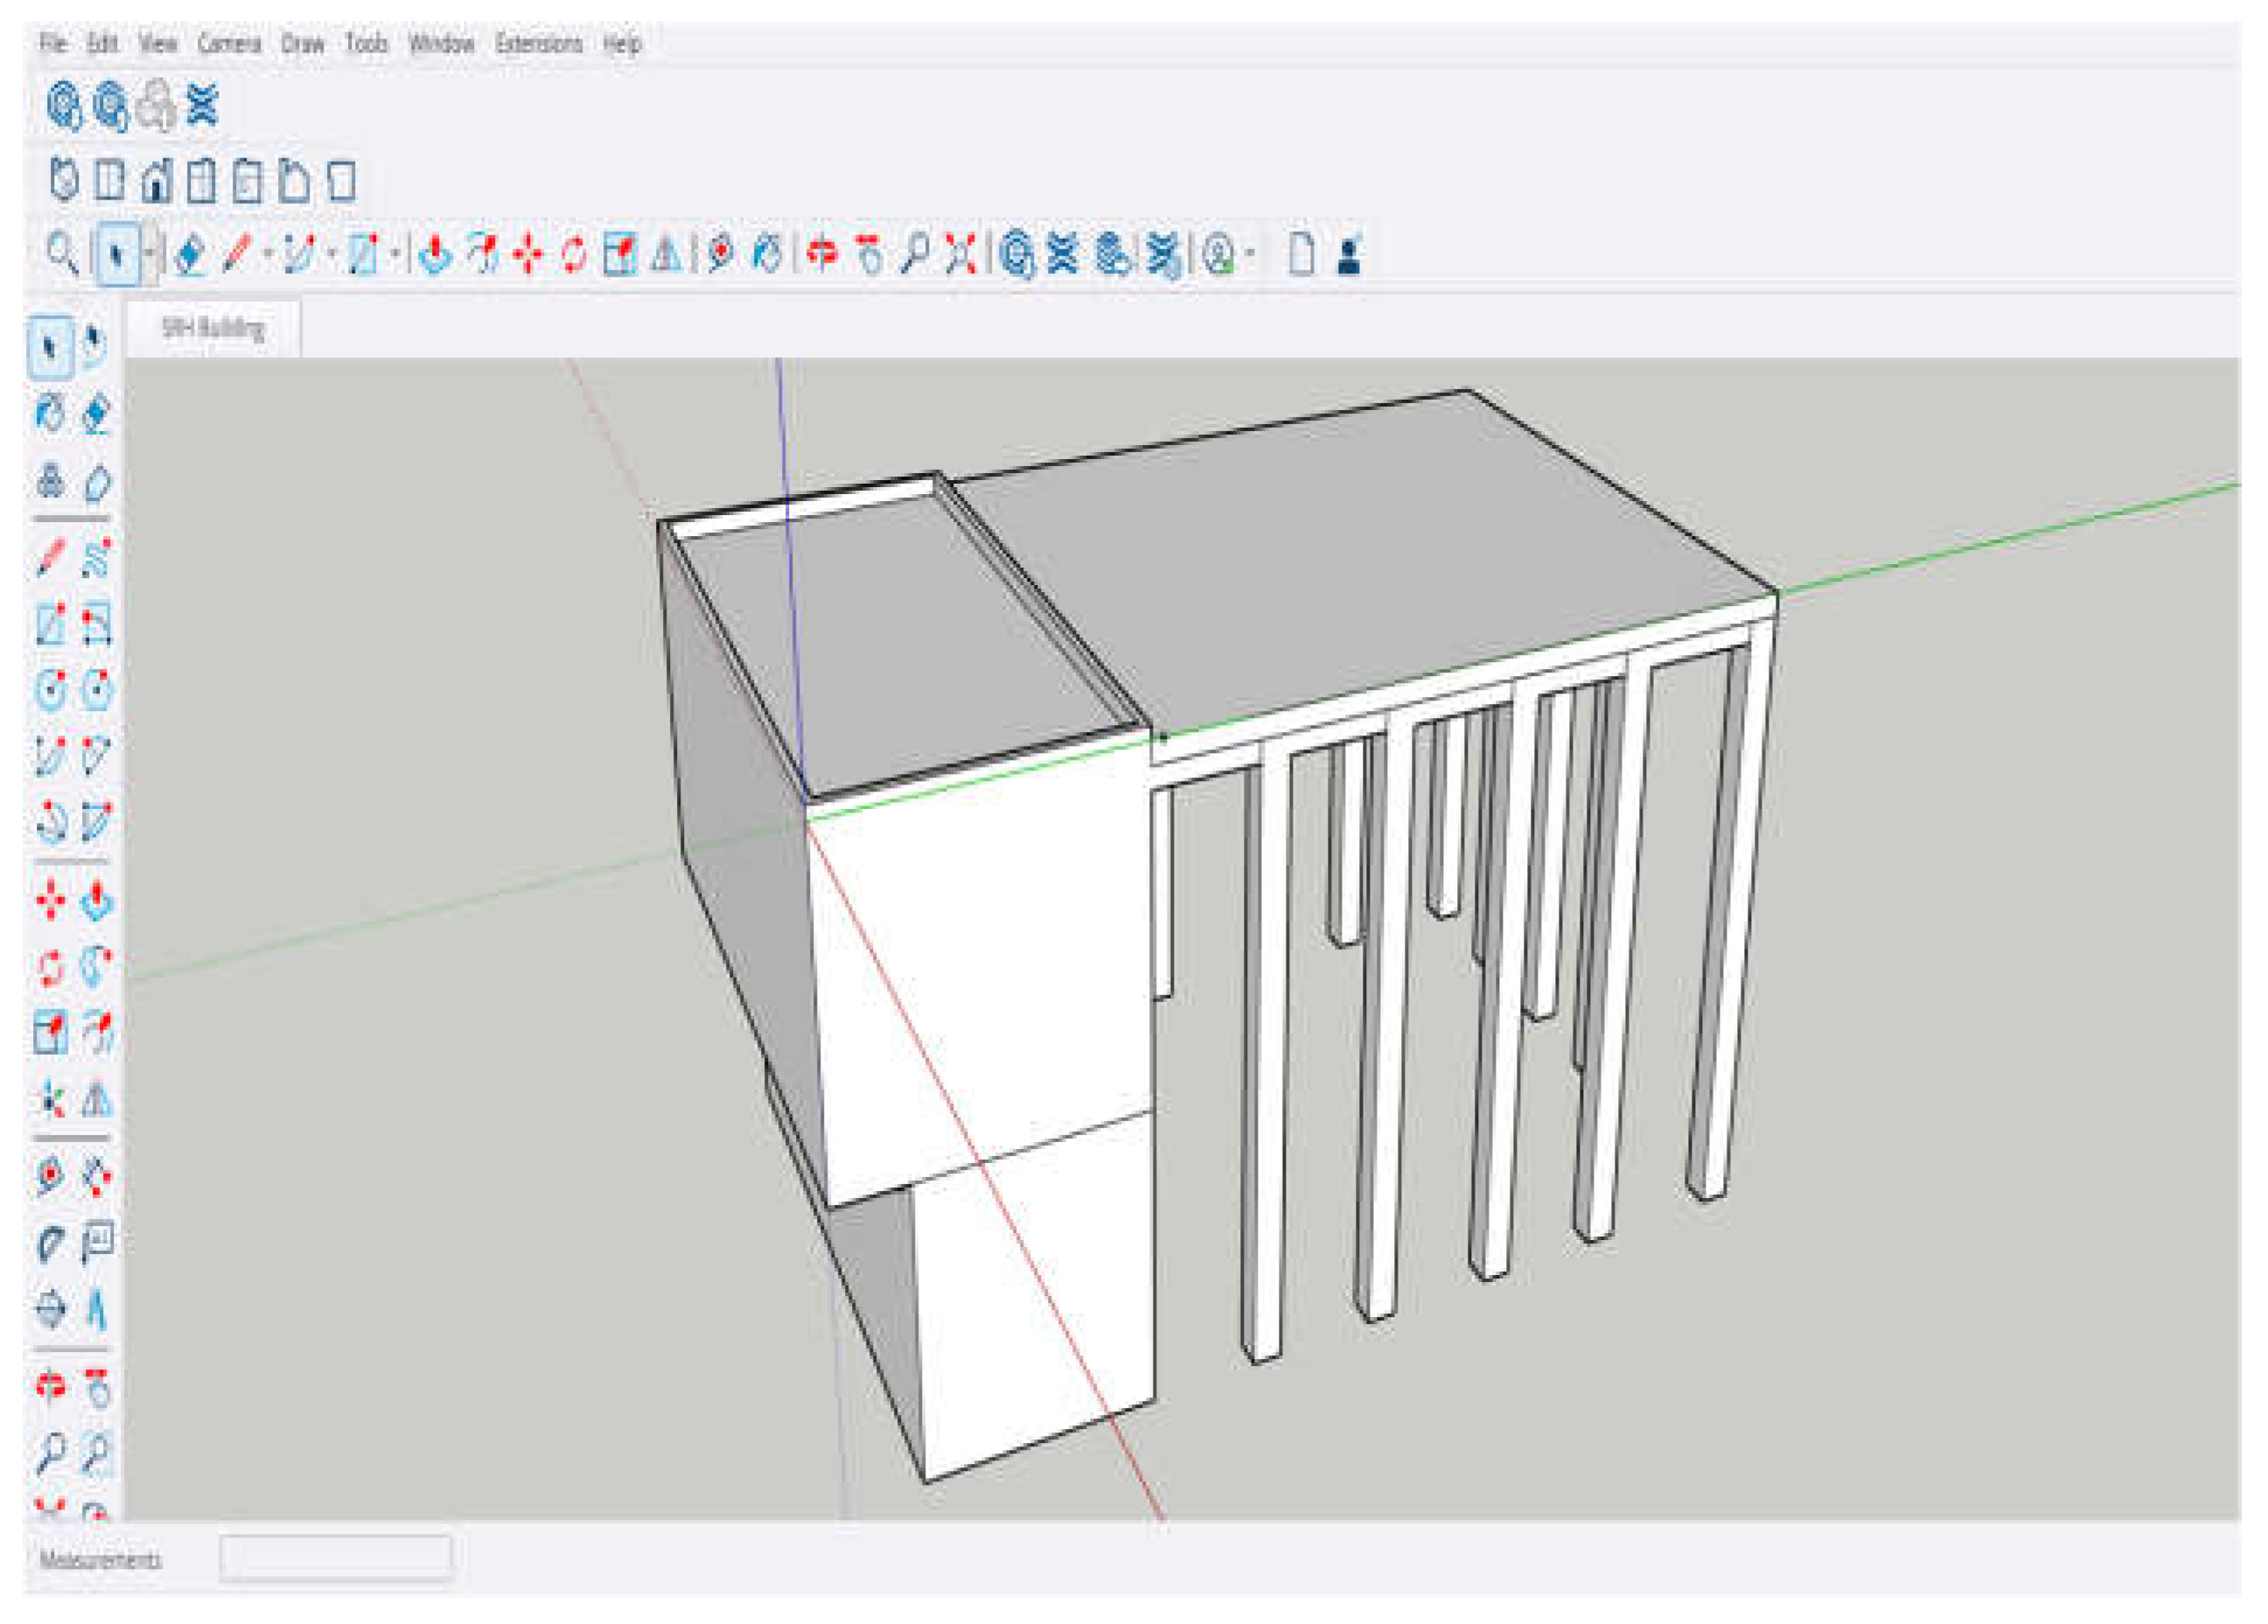
Figure 3.
Installation of East-West & South Oriented PV Panels using PV SOL Software.
6. Findings
a. Energy Production Patterns
The East-West system and South Oriented System differ in different parameters like efficiency and energy yield. The East-West system has a PV generating capacity of 154.8 kWp as compared to 129.0 kWp for the South-Oriented system. The East-West System has a higher export grid of 20,952 kWh as compared to the South Oriented System, which exports 17,729 kWh annually. The difference is explained by the South-Oriented system's titled module placement, which makes it more vulnerable to obstacles and shadows from surrounding structures.
Table 2.
Energy Production and Efficiency Comparison.
| Parameter | East–West PV System | South PV System |
|
PV Generator Output |
154.8 kWp |
129 kWp |
|
AnnualYield (kWh/kWp) |
974.96 kWh/kWp |
1096.50 kWh/kWp |
|
Total Energy Production (AC Grid) |
151.011 kWh/year |
141.514 kWh/year |
| Performance Ratio (PR) | 91.03% | 89.06% |
|
Shading Losses |
0.7% |
2.6% |
|
Own Power Consumption |
86.1% |
87.5% |
|
Grid Export |
20.952 kWh/year |
17.729 kWh/year |
b. Spatial Utilization
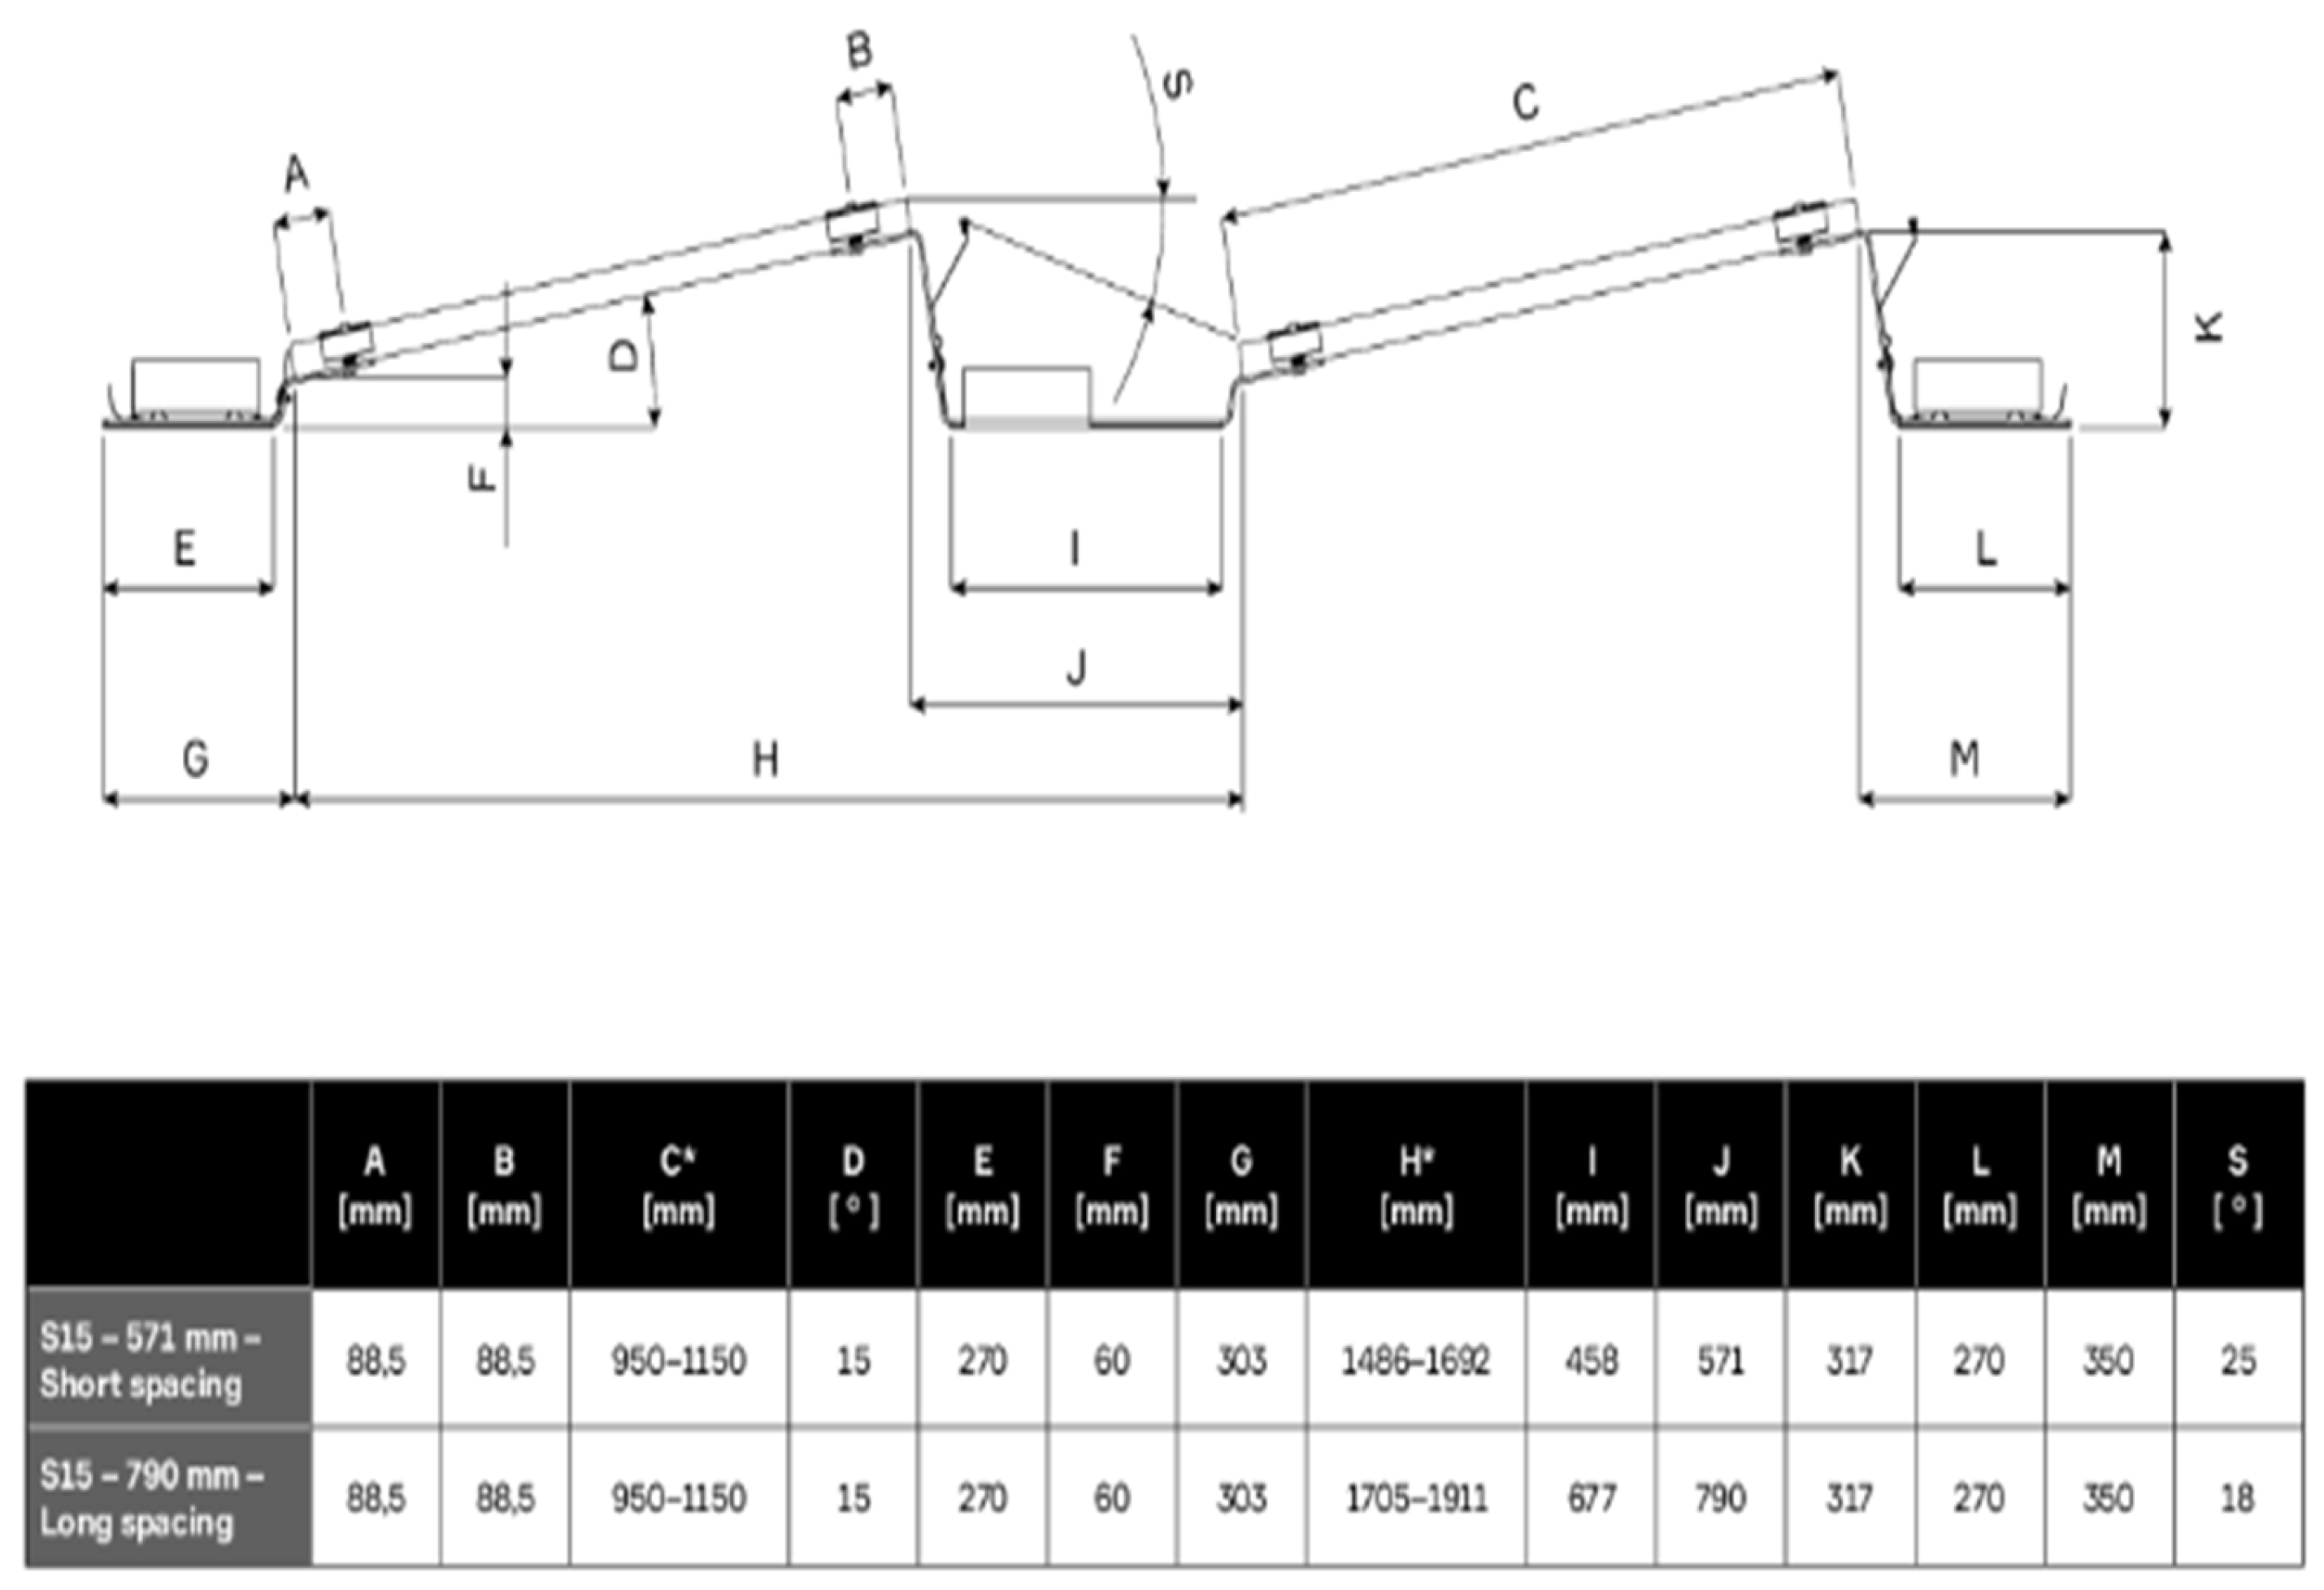
The East-West system can occupy a larger surface area of 703 m² for PV installation, while the South-Oriented System uses a rooftop area of 585.8 m² due to less space available and the tilt angle issue for the South System. The South-Oriented system aligns all modules toward the south at a steeper inclination angle of 15° to maximize the sunlight during midday. The East-West System has a lower inclination of 10° with an equal number of modules facing in East and West directions.
Figure 4.
Structural Layout and Dimensional Specifications of East-West PV System.
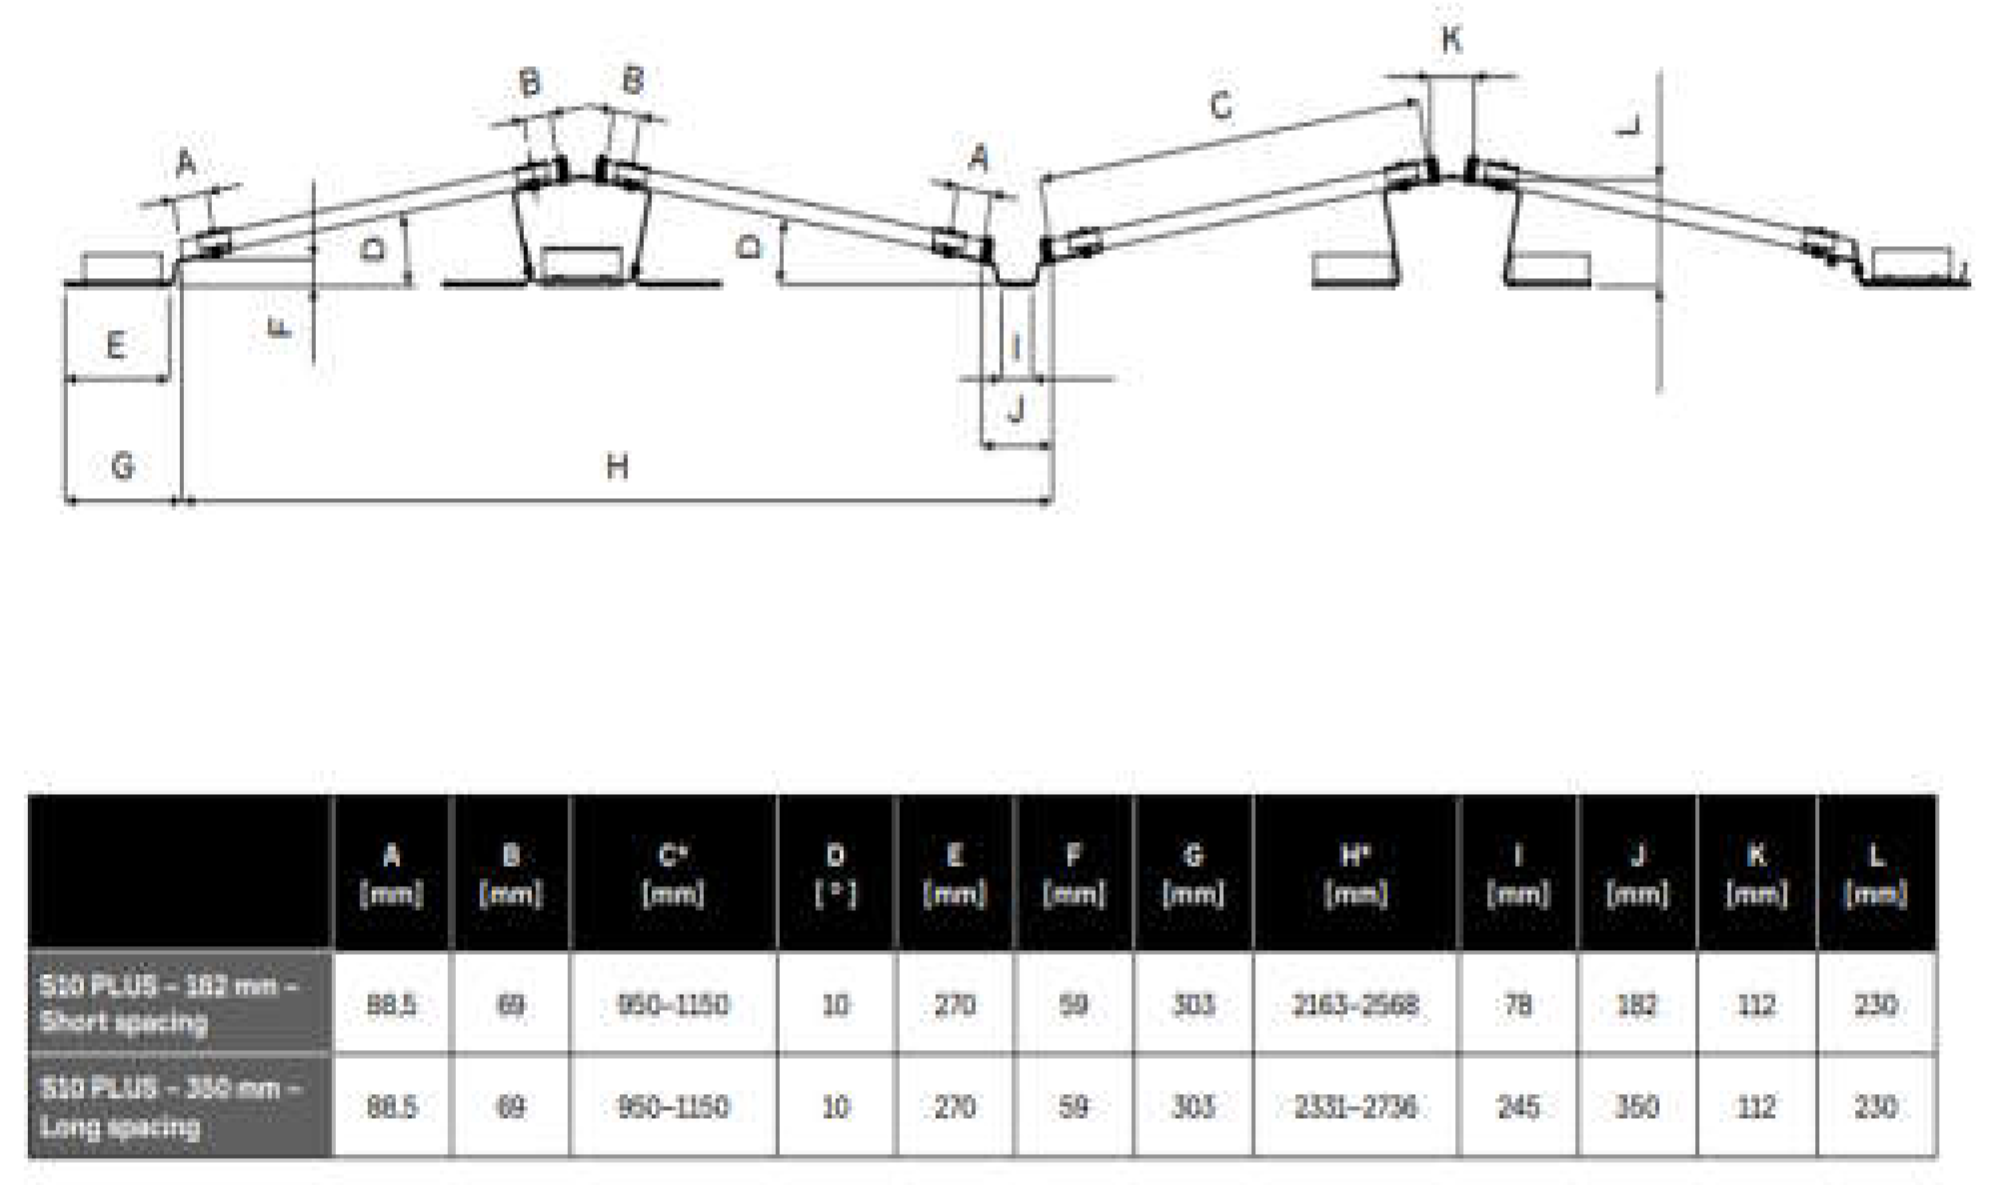
Figure 5.
Structural Layout and Dimensional Specifications of South-Oriented PV System.
c. Financial Metrics
Table 3.
Financial Metrics.
| Metric | East-West System | South–Oriented System | Remarks |
|---|---|---|---|
|
Initial Investment (€) |
232.200 |
193.500 |
The South-oriented system has a lower investment cost due to fewer modules being installed. |
|
Net Present Value (NPV) (€) |
33.150,96 |
73.804,75 |
The Net Present Value for the South System is higher than the East-West System due to lower investment cost. |
| Internal Rate of Return (IRR) |
19.89% |
23.09% |
South-Oriented System has a higher Internal Rate of Return. |
|
Accrued Cash Flow (€) |
484.593,68 |
472.273,63 |
The East-West system has higher cash flow as compared to the South System. |
|
Annual Utility Payment (€) |
6.141,93 |
6.908,83 |
Slightly higher annual payments for the South system due to its midday peak generation. |
|
Levelized Cost of Energy (LCOE) |
0.0923 €/kWh |
0.0684 €/kWh |
The South-Oriented System has a lower LCOE as compared to the East-West System. |
|
Minimum Amortization Period |
6.8 years |
7 years |
The South-Oriented System has a slightly higher amortization period. |
Detailed Calculations for Ansys and PV SOL:
Calculation of the force acting on the roof of the building for 3 different cases:
a. Force exerted due to the Self-Weight of the Flat Roof
Material: Concrete, Density = 2300 kg/m³
Dimensions of the roof: length(l) = 38.23 m, breadth(b) = 33.35 m, width(w) = 0.3 m
Volume of the roof = lxbxh = 38.32 * 33.35 * 0.3 = 383.4 m³
Mass(m) =Volume of the flat roof(V) × Density of the material(ρ)
m = 383.4 m³ × 2300 kg/m³ = 881900 kg
Calculating the Force exerted due to the self-weight of the flat roof:
where F is the Force exerted due to self–weight
F = m x g
m is the mass of the roof
g is the acceleration due to gravity
Force (Fsw)= 881,900kg × 9.81 m/s2
Force (Fsw) = 8653439 N (8.653 x 10⁶ N)
Figure 6.
IBC Module Bifacial 430 LS-TA1 Specification.
b. Force exerted due to the East-West System
Force exerted due to the Panel:
Weight of Panel = 23.6 kg
For East-West, total panels = 360 modules
Total weight of the panels = 23.6 x 360 = 8496 kg
Force exerted due to panels (F1)
Force (F1) = 8496 * 9.81 = 83345.76 N (83.345 x 10³ N)
F = F1 + Fsw
F1 is the force exerted due to the panels
Fsw is the force due to the self-weight of the flat roof
Total Force = 83345.76 N + 8653439 N
Total Force (F) = 8736784.76 N (8.736 x 10⁶ N)
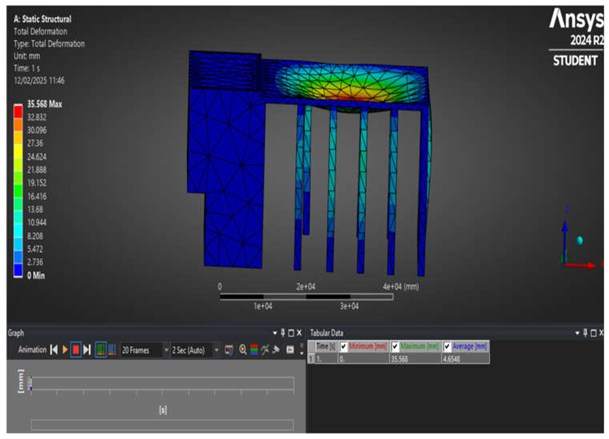
Deformation acting over the roof: (from Ansys Data)
Maximum Deformation due to Self-weight of the roof = 35.49 mm
Max. Deformation due to Self-Weight + East-West Panel = 35.568 mm
The total deformation increased from 35.49 mm (Self-Weight Only) to 35.568 mm (East-West System).
So, the Percentage increase in deformation due to the East-West System:
c. Force exerted due to the South-Oriented System
Force exerted due to the Panel
Weight of the Panel (m) = 23.6 kg
For the South System, total panels = 300 modules
Total weight = 23.6 x 300 = 7080 kg
Force(F) = m*g
Force (F) = 7080 * 9.81 = 69454.8 N (69.454 x 10³ N)
Total Force = Force due to Panels + Self-Weight of the Flat Roof
Total Force = 69454.8 N + 8653439 N
Total Force = 8722893.8 N (8.723 x 10⁶ N)
Deformation acting:
Maximum Deformation due to Self-weight of the roof = 35.49 mm
Maximum Deformation due to Self-Weight + South Oriented System = 35.555 mm
The total deformation increased from 35.49 mm (Self-Weight Only) to 35.555 mm (South System).
So, the Percentage increase in deformation due to the South-oriented System
Deformation and Stress Analysis using ANSYS:
Table 4.
Comparison of Maximum and Average Deformation of the Building.
| Case | Maximum Deformation (mm) | Average Deformation (mm) |
|---|---|---|
| Self-Weight Only | 35.49 | 4.6452 |
| South-Oriented System | 35.555 | 4.6532 |
| East-West System | 35.568 | 4.6548 |
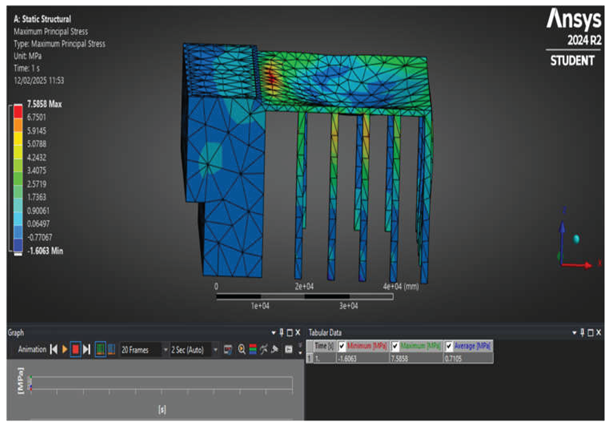
Factor of Safety (FOS) Considerations:
For East-West System:
Considering the compressive strength of concrete of 41 MPa, and the maximum principal recorded stress is 7.5858 MPa for the East-West System and South Oriented System, the safety factor:
FOS
Since an FOS > 2.0 is generally acceptable for building structures, this confirms that the structure is highly safe against failure.
PV SOL Calculations:
a. Net Present Value (NPV)
- = Net Cash Flow in year t
- r = discount rate
EAST-WEST Configuration System
Table 5.
Discount Factor and Present Value Calculation Table for East-West System.
| Year | Cash Flow (€) | Discount Factor (1.04)t | Present value (€) |
| 1 | -84.239,30 | 1.04 | −80.999,33 |
| 2 | 31.915,99 | 1.0816 | 29.498,88 |
| 3 | -5.275,53 | 1.1249 | −4.690,22 |
| 4 | -3.845,04 | 1.1699 | −3.288,51 |
| 5 | -2.441,06 | 1.2167 | −2.006,96 |
| 6 | 34.983.65 | 1.2654 | 27.651,30 |
| 7 | 34.895,56 | 1.3161 | 26.520,10 |
| 8 | 34.806,64 | 1.3688 | 25.429,10 |
| 9 | 34.716,77 | 1.4233 | 24.376,72 |
| 10 | 34.625,86 | 1.4800 | 23.361,42 |
| 11 | 34.533,75 | 1.5382 | 22.381,58 |
| 12 | 34.440,34 | 1.5997 | 21.435,90 |
| 13 | 34.345,46 | 1.6637 | 20.523,94 |
| 14 | 34.249,01 | 1.7303 | 19.644,24 |
| 15 | 34.150,85 | 1.7995 | 18.795,42 |
| 16 | 34.050,85 | 1.8715 | 17.976,16 |
| 17 | 33.948,86 | 1.9464 | 17.185,15 |
| 18 | 33.844,74 | 2.0242 | 16.421,30 |
| 19 | 33.738,38 | 2.1042 | 15.683,37 |
| 20 | 33.629,61 | 2.1873 | 14.970,36 |
| 21 | 33.518,28 | 2.2728 | 14.281,04 |
Summing up all the Present Values (PV),
∑PV = −80.999,33 + 29.498,88 + (−4.690,22) + (−3.288,51) + (−2.006,96) + 27.651,30 + 26.520,10 + 25.429,10 + 24.376,72 + 23.361,42 + 22.381,58 + 21.435,90 + 20.523,94 + 19.644,24 + 18.795,42 + 17.976,16 + 17.185,15 + 16.421,30 + 15.683,37 + 14.970,36 + 14.281,04 = 265.150,96 €
Net Present Value for East-West System:
NPV = ∑ PV – Co
NPV= 265.150,96 – 232.200
NPV = 33.150,96 €
South-Oriented PV System
Table 6.
Discount Factor and Present Value Calculation Table for South Oriented System.
| Year | Cash Flow (€) | Discount Factor (1.04)t |
Present value (€) |
| 1 | -71.773,75 | 1.04 | -68.058,41 |
| 2 | 25.452,61 | 1.0816 | 23.527,14 |
| 3 | 14.265,27 | 1.1249 | 12.685,64 |
| 4 | 15.223,64 | 1.1699 | 13.012,69 |
| 5 | 16.176,10 | 1.2167 | 13.293,42 |
| 6 | 17.122,84 | 1.2654 | 13.538,64 |
| 7 | 18.064,09 | 1.3161 | 13.751,57 |
| 8 | 19.000,02 | 1.3688 | 13.935,16 |
| 9 | 19.930,86 | 1.4233 | 14.091,48 |
| 10 | 20.856,82 | 1.4800 | 14.222,75 |
| 11 | 32.455,41 | 1.5382 | 21.100,95 |
| 12 | 32.837,20 | 1.5997 | 20.529,50 |
| 13 | 33.224,24 | 1.6637 | 19.979,09 |
| 14 | 33.616,63 | 1.7303 | 19.448,66 |
| 15 | 34.014,42 | 1.7995 | 18.937,90 |
| 16 | 34.417,67 | 1.8715 | 18.445,56 |
| 17 | 34.826,45 | 1.9464 | 17.971,60 |
| 18 | 35.240,83 | 2.0242 | 17.514,79 |
| 19 | 35.660,90 | 2.1042 | 17,074.90 |
| 20 | 36.086,69 | 2.1873 | 16.651,83 |
| 21 | 35.574,68 | 2.2728 | 15.649,89 |
∑PV = 267.304,75 €
NPV = ∑ PV – Co
NPV= 267.304,75 − 193,500
NPV = 73.804,75 €
b. Levelized Cost of Electricity
LCOE is calculated using the following formula:
- Total Investment Cost: Given in the financial analysis of each system
- Operating Costs: Summed over 20 years.
- Energy Produced: Sum of annual production over 20 years.
For East-West Configuration System:
- Investment Cost = 232.200 €
- Operating Cost = 2.322 €/year
- Lifetime = 20 years
- Total Operating Cost = 2.322€ × 20 = 46.440 €
- Energy Production = 151.011 kWh/year
- Total Energy Production = 151.011 × 20 = 3020.220 kWh
- No subsidies are mentioned.
LCOE = = 0.0923 €/kWh
For South-Oriented PV System:
- Investment Cost = 193.500 €
- Operating Cost = € 0/year (Operating Cost not considered in PV Sol Software)
- Lifetime = 20 years
- Total Operating Cost = € 0
- Energy Production = 141.514 kWh/year
- Total Energy Production = 141.514 × 20 = 2830.280 kWh
- No subsidies are mentioned.
LCOE = 0.0684 €/kWh
Table 7.
Levelized Cost of Electricity Comparison between East-West and South Systems.
| PV Systems | LCOE (€/kWh) |
| East-West | 0.0923 |
| South-Oriented | 0.0684 |
- c.
- Return on Investment (ROI)
ROI Formula
- Total Net Profit = Total Savings + Total Feed-in Revenue - Operating Costs
- Total Savings = Annual Electricity Savings × Lifetime (20 years)
- Total Feed-in Revenue = Annual Feed-in Revenue × Lifetime (20 years)
- Operating Costs = Annual Operating Cost × 20 years
- Initial Investment Cost = Given in the reports
Return on Investment (ROI) Calculation for East-West PV System
- Investment Cost = 232.200 €
- Annual Electricity Savings = 28.677,90 €
- Annual Feed-in Revenue = 9.414,47 €
- Operating Costs (Annual) = 2.322 €
- Lifetime = 20 years
Total Net Profit Calculation
-
Total Electricity Savings Over 20 Years = 28,677.90 × 20 = 573.558 €
-
Total Feed-in Revenue Over 20 Years = 9,414.47 × 20 = 188.289,40 €
-
Total Operating Cost Over 20 Years = 2,322 × 20 = 46.440 €
-
Total Net Profit = 573.558 € + 188.289,40 € – 46.440 € = 715.407,40 €
ROI = = 308.09%
Return on Investment (ROI) Calculation for South Oriented System
- Investment Cost = 193.500 €
- Annual Electricity Savings = 27.441,17 €
- Annual Feed-in Revenue = 1.761,88 €
- Operating Costs (Annual) = 0
- Lifetime = 20 years
Total Net Profit Calculation
-
Total Electricity Savings Over 20 Years = 27.441,17 × 20 = 548.823,40 €
-
Total Feed-in Revenue Over 20 Years = 1.761,88 × 20 = 35.237,60 €
-
Total Net Profit = 548.823,40 €+ 35.237,60 € = 584.061,00 €
ROI = * 100 = 301.8%
- d.
- Simple Payback Period
SPP for East-West Configuration System
- Initial Investment Cost = 232.200 €
- Annual Electricity Savings = 28.677,90 €
- Annual Feed-in Revenue = 9.414,47 €
- Annual Operating Cost = 2.322 €
Annual Net Savings = 28.677,90 + 9.414,47 – 2.322 = 35.770,37 €
SPP = = 6.49 years
SPP for South-Oriented System
- Initial Investment Cost = 193.500 €
- Annual Electricity Savings = 27.441,17 €
- Annual Feed-in Revenue = 1.761,88 €
Annual Net Savings = 27.441,17 + 1.761,88 = 29.203,05 €
SPP = = 6.63 years
7. Discussion of Findings
The comparison between East-West Configuration PV Systems and South Oriented PV Systems is done using various parameters, like financial and technical performance parameters from PV SOL Premium Software reports. The main parameters calculated include the Net Present Value (NPV), Internal Rate of Return (IRR), Return on Investment (ROI), Performance Ratio (PR), Payback Period, Levelized Cost of Electricity (LCOE), and others.
The main objective of this analysis is to determine which system is more profitable in terms of energy production, financial returns, and efficiency of all possible calculations and considering all parameters, making it evident that the East-West Configuration PV System is better than the South-Oriented System.
- Financial Performance Comparison:
- The investment cost for the East-West PV System is 232.000 €, while the investment cost for the South-Oriented PV System is 193.500 € due to fewer modules in the South-Oriented System.
- While the South-Oriented System appears more cost-effective initially, the higher electricity production of the East-West System compensates for the additional investment over time.
- The higher generation from the East-West System balances additional expenses, assuming that the maintenance and service cost exists for both systems.
- b.
- System Performance Comparison
- The East-West PV System produces a total energy production of 3020.220 kWh while the South Oriented System produces a total energy production of 2830.280 kWh over 20 years.
- This is a 6% increase in energy generation, which translates to higher revenue from electricity savings and feed-in tariffs.
- The Performance Ratio (PR) for East-West System is 91.03% and for the South- Oriented System is 89.06%.
- A higher performance ratio means that the system converts more available sunlight into usable electricity, improving efficiency. The higher performance ratio indicates that the system converts more sunlight into usable electricity, thus improving efficiency.
- The East-West System has a total of 360 modules, while the South-Oriented System has a total of 300 modules.
- The PV output would reduce from 154.8 kWp to approximately 129 kWp if modules for the East-West System and South System were the same.
8. Conclusions
The East-West System is a good installation option as it gives better results in financial and performance analysis. The South-Oriented PV System has a lower upfront investment cost and a slightly lower Levelized Cost of Electricity (LCOE), but these benefits are outweighed by the higher total electricity production, better efficiency, and greater long-term financial returns provided by the East-West System.
Reasons for Consideration of the East-West System:
- Higher Electricity Production: 3020.220 kWh for 20 years (6% more than the South Oriented System).
- Better Efficiency: The Performance Ratio (PR) of the East-West System is 91.03%, which ensures better usage of available solar energy.
- Faster Payback Period: The investment recovered in 6.49 years (SPP) for the East-West system, which is faster than the South-Oriented System.
- The East-West System has a better Return on Investment (ROI) as compared to the South System.
- Greater Carbon Reduction: East-West reduces 70,934 kg of CO₂ per year (more than the South System's 66,481 kg CO₂/year).
- Power Output: The number of modules for the East-West System is 360, which is more than the South System and can produce high power output.
If the modules for the East-West System had been reduced:
- If the East-West System were also limited to 300 modules (same as the South Oriented System), it would lose its energy production advantage, making it less competitive.
- The installed capacity would drop from 154.8 kWp to approximately 129 kWp if the number of modules were reduced to 300.
- Total electricity production would decrease significantly, reducing revenue and financial returns.
- The East-West System maximizes available rooftop space, ensuring long-term financial and operational benefits.
Appendix A
EAST-WEST Configuration System
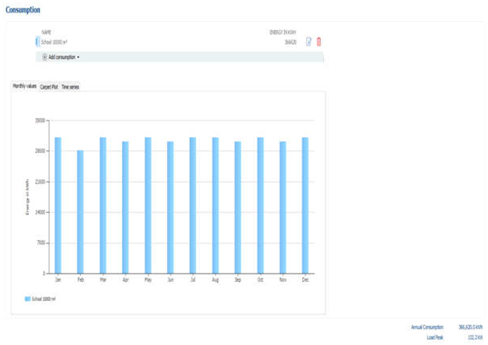
Annual Consumption Data for East-West Configuration System
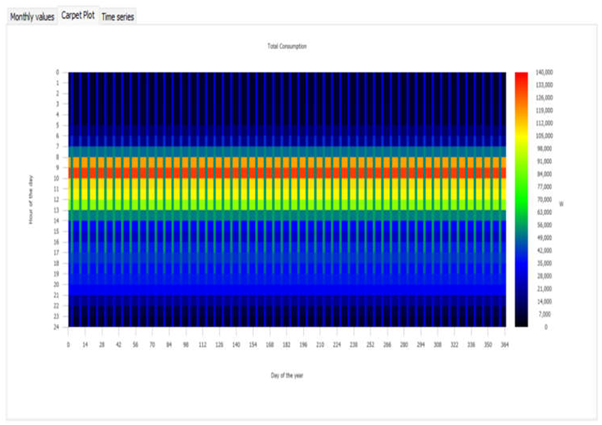
Carpet Plot for East-West Configuration System
Circuit Diagram for East-West Configuration PV System
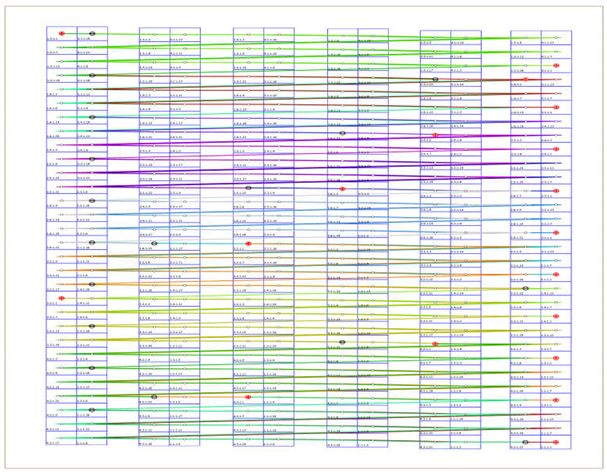
String Diagram for East-West Configuration PV System
Appendix B
South-Oriented System
Circuit Diagram for South-Oriented System
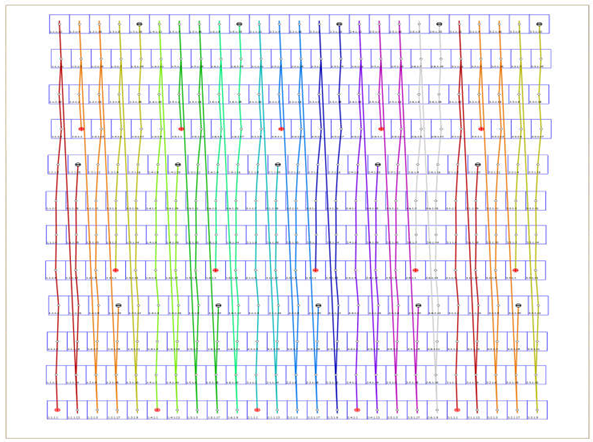
String Diagram for South Oriented System
Deformation due to the force exerted by self-weight and the East-West System Load
Maximum Principal Stress due to force exerted by Self-Weight and East-West System
References
- Abba Muhammad Adua, Bashar, Y., Sanda, Sadiq, A., & Musa, J. (2023). COMPARISONS OF EAST/WEST AND SOUTH ORIENTED PHOTOVOLTAIC (PV) SYSTEMS IN TERMS OF PERFORMANCE AND LAND UTILIZATION WITH THE BEST OPTIMUM TILT ANGLES. International Research Journal of Modernization in Engineering Technology and Science, 5(8), 2582–5208. https://www.researchgate.net/publication/373833906_COMPARISONS_OF_EASTWEST_AND_SOUTH_ORIENTED_PHOTOVOLTAIC_PV_SYSTEMS_IN_TERMS_OF_PERFORMANCE_AND_LAND_UTILIZATION_WITH_THE_BEST_OPTIMUM_TILT_ANGLES.
- Elmelegi, A., & AHMED, E. M. (2015, December). Study of Different PV Systems Configurations Case Study: Aswan Utility Company. https://www.researchgate.net/publication/287285879_Study_of_Different_PV_Systems_Configurations_Case_Study_Aswan_Utility_Company.
- Solar panel orientation: How using East-West structures improves the performance of your project — RatedPower. (n.d.). Ratedpower.com. https://ratedpower.com/blog/solar-panel-orientation/.
- East-West Vs North Facing Structures - Lumax Energy. (2024, June 14). Lumax Energy. https://lumaxenergy.com/carports/east-west-vs-north-facing-structures/.
- Amir Asgharzadeh, Deline, C., Stein, J., & Toor, F. (2018). A comparison study of the performance of south/north-facing vs east/west-facing bifacial modules under shading conditions. 1730–1734. [CrossRef]
- Fronius.com.(2016)https://www.fronius.com/~/downloads/Solar%20Energy/Whitepaper/SE_WP_Advantages_of_east-west_systems_EN.pdf.
- Karthikeyan, V., Rajasekar, S., Das, V., Karuppanan, P., & Singh, A. K. (2017). Grid-Connected and Off-Grid Solar Photovoltaic System. Smart Energy Grid Design for Island Countries, 125–157. [CrossRef]
- Difference Between On-Grid and Hybrid Solar System - Uni Solar. (2024, February 9). Uni Solar. https://unisolar.pk/difference-between-on-grid-and-hybrid-solar-system/.
- Squatrito, R., Sgroi, F., Tudisca, S., Trapani, A., & Testa, R. (2014). Post feed-in scheme Photovoltaic system feasibility evaluation in Italy: Sicilian case studies. Energies, 7(11), 7147–7165. [CrossRef]
- Google.com. (2025). https://earth.google.com/web/search/Sonnenallee+221.
- Download Ansys Student | Workbench-based Simulation Tools. www.ansys.com. https://www.ansys.com/academic/students/ansys-student.
- Downloading SketchUp | SketchUp Help. (2017). Sketchup.com. https://help.sketchup.com/en/downloading-sketchup.
- PV*SOL | Photovoltaic design and simulation. (2020, March 16). https://valentin-software.com/en/products/pvsol/.
- AEROCOMPACT Group – Intelligent solar racking. (2025, February 19). Aerocompact.com. https://www.aerocompact.com/en/.
- Bifacial 430-435 LS-TA1. (2024). Enfsolar.com. https://www.enfsolar.com/pv/panel-datasheet/crystalline/63333.
- Post, H. (2024, October 10). What Is Factor of Safety? Definition, Importance, and Formula. TRADESAFE. https://trdsf.com/blogs/news/what-is-factor-of-safety.
- Fernando, J. (2024, August 14). Net Present Value (NPV): What It Means and Steps to Calculate It. Investopedia. https://www.investopedia.com/terms/n/npv.asp.
- European Commission, Joint Research Centre. (n.d.). Photovoltaic Geographical Information System (PVGIS). Retrieved October 9, 2024. https://re.jrc.ec.europa.eu/pvg_tools/en/#MR.
- Cucchiella, F., Rotilio, M., Capannolo, L., De Berardinis, P., & The Authors. (2023). Technical, economic, and environmental assessment towards the sustainable goals of photovoltaic systems. In Renewable and Sustainable Energy Reviews (Vol. 188, p. 113879). [CrossRef]
- Laporte, J. P., & Cansino, J. M. (2024). Energy consumption in Higher education Institutions: A bibliometric analysis focused on scientific trends. In MDPI, Buildings (Vol. 14, p. 323). [CrossRef]
- Ramp. How to calculate operating income and maximize profits. https://ramp.com/blog/operating-income-formula.
- Mubarak, R., Luiz, E. W., & Seckmeyer, G. (2019). Why PV modules should preferably no longer be oriented to the south in the near future. Energies, 12(23), 4528. [CrossRef]
- P An, L. N., P Tran, T. M., & Faculty of Electrical Engineering, The University of Danang - University of Science and Technology, Danang City, Vietnam. (2020). Design of a grid connected PV system via PV*SOL software. IJISET - International Journal of Innovative Science, Engineering & Technology, Vol. 7(Issue 6), 121–123. https://www.ijiset.com.
- Tao, J. Y., & Finenko, A. (2016). Moving beyond LCOE: impact of various financing methods on PV profitability for SIDS. Energy Policy, 98, 749–758. [CrossRef]
- Wang, S., Wilkie, O., Lam, J., Steeman, R., Zhang, W., Khoo, K. S., Siong, S. C., & Rostan, H. (2015). Bifacial Photovoltaic Systems energy yield modelling. Energy Procedia, 77, 428–433. [CrossRef]
- Zengwei, Z., Zhen, Z., Yongfeng, J., Haolin, L., & Shengcheng, Z. (2019). Performance analysis on bifacial PV panels with inclined and horizontal East-West Sun trackers. IEEE Journal of Photovoltaics, 9(3), 636–642. [CrossRef]
- Fronius Efficient East-West Orientated PV Systems with One MPP Tracker. (2025). Pure-Electric.com.au.https://pure-electric.com.au/resources/fronius-efficient-east-west-orientated-pv-systems-one-mpp-tracker.
- Pereira, L. D., Raimondo, D., Corgnati, S. P., Gameiro Da Silva, M., TEBE Research Group, Department of Mechanical Engineering, University of Coimbra and ADAI – LAETA, & Department of Energy, Politecnico di Torino. (2014). Energy consumption in schools – A review paper. In Renewable and Sustainable Energy Reviews (Vols. 40–40, pp. 911–922) [Journal-article]. [CrossRef]
- Ayadi, O., Shadid, R., Bani-Abdullah, A., Alrbai, M., Abu-Mualla, M., & Balah, N. (2022). Experimental comparison between Monocrystalline, Polycrystalline, and Thin-film solar systems under sunny climatic conditions. Energy Reports, 8, 218–230. [CrossRef]
- Beattie, A. (2024, August 22). ROI: Return on Investment meaning and calculation Formulas. Investopedia. https://www.investopedia.com/articles/basics/10/guide-to-calculating-roi.asp.
Disclaimer/Publisher’s Note: The statements, opinions and data contained in all publications are solely those of the individual author(s) and contributor(s) and not of MDPI and/or the editor(s). MDPI and/or the editor(s) disclaim responsibility for any injury to people or property resulting from any ideas, methods, instructions or products referred to in the content. |
© 2025 by the authors. Licensee MDPI, Basel, Switzerland. This article is an open access article distributed under the terms and conditions of the Creative Commons Attribution (CC BY) license (http://creativecommons.org/licenses/by/4.0/).
Copyright: This open access article is published under a Creative Commons CC BY 4.0 license, which permit the free download, distribution, and reuse, provided that the author and preprint are cited in any reuse.


