
Submitted:
20 June 2025
Posted:
27 June 2025
You are already at the latest version
Abstract
Attention on residual stress development, magnitude, and distribution on abrasive wear materials, such as high chromium iron alloys, has been minimal, even though these materials are prone to tearing or inferior mechanical properties because of distortion during manufacturing processes, such as casting and heat treatment, leading to premature failure of cast components. Identification of the source and succeeding management of residual stress provides an opportune possibility to enhance product quality. In the current study, the as-cast hypoeutectic irons of ASTM A532, Type A, Class III, 25% Cr, i.e., sample A and sample B, were cast at 1384 and 1390 degrees Celsius and allowed to solidify and cool for approximately 1645 and 1295 minutes, respectively. Thus, the shakeout temperatures of sample A and sample B products were established to be approximately 60 and 180°C, respectively. Resultant residual stress and macrohardness were determined at ambient temperatures using the hole-drilling method and Brinell hardness tester machines, respectively. Higher hardness values of 600 BHN were established on sample B compared to 526 BHN for sample A. In addition, casting shakeout at higher temperatures, i.e., 180°C on sample B, yielded higher magnitudes of residual stress distribution compared to 60°C shakeout for sample A.
Keywords:
high chromium alloys
; hypoeutectic iron
; residual stresses
; casting shakeout temperature
; hole-drilling method
1. Introduction
1.1. Background
High chromium (Cr) alloys are known as high chromium white cast iron(HCWCI) alloys, which are extensively used as abrasion wear materials (AWMs) in the comminution processes, such as crushing, grinding, and milling industries, as well as in the handling of abrasive materials, such as mineral ores in both dry and wet environments. Because of its exceptional resistance to wear, HCWCI is a form of white cast iron (WCI) that can be used in a variety of applications where components are subjected to abrasive conditions. Grinding balls are commonly used during ore comminution. However, comminution itself is a critical process used during mineral processing, power plants, cement production, and pharmaceutical industries [1,2,3]. In addition, HCWCIs are widely used in shot-blasting equipment, slurry pumps, brick moulds, coal grinding mills, and hard-rock mining, quarrying, and milling parts due to their remarkable abrasion resistance. In certain applications, they must also be able to withstand significant impact loads [4]. Thus, high-performance materials are in high demand in harsh situations where corrosion and wear are common. Although their performance is frequently still insufficient, HCWCIs exhibit superior performance compared to many materials because they are sufficiently hard for wear protection and can be modified in chemical composition to enhance fracture toughness, hardness, and corrosion resistance [2].
Cast irons with a content of ≥ 1.8 wt. % carbon (C) and ≥ 10 wt. %Cr are known as HCWCIs. For a variety of reasons, alloying elements may also be added and include carbide formers and/or hardening alloying elements [1,2]. HCWCI alloys are due to substantial Cr additions added as one of the general carbide formers to cast irons. Thus, creating numerous types of carbides, such as M3C, M7C3, and M23C6 [1,2,3,4,5,6,7] based on various Cr-levels added into the liquid iron to improve fracture toughness, hardness, corrosion, and establishing MnCm-type of carbides and abrasive wear resistance (AWR) [2,3,8]. Since elevated Cr-levels improve hardness, corrosion resistance and alter carbide morphology. Thus, the impact energy, i.e., fracture toughness of the iron, depends on many various aspects, such as resultant retained austenite (γ-Fe) and C content in the γ-Fe or martensite (α-Fe) phase and destabilisation heat treatment temperatures, etc. [1,2,3,5,6,7,8,9,10,11]. The mechanical properties of the high Cr-irons are governed by both the ferrous matrix structure and eutectic carbides, i.e., M7C3-type known as Cr-rich carbides [1,2,5,8,9,10,11]. Furthermore, during hypoeutectic and hypereutectic iron solidification and cooling of high Cr-irons, γ-Fe and M7C3, respectively, are the primary phases to nucleate, followed by subsequent simultaneous nucleation of eutectic constituents as shown in Equation 1 (Eq. 1) below, consisting of both γ-Fe and Cr-rich carbides. In eutectic irons, both γ-Fe and M7C3 nucleate simultaneously during solidification and cooling [1,5,6,7,9,10,11].
Where γFe = γ-Fe
Nonetheless, for casting components normally hypereutectic irons are avoided due to the nucleation of primary carbides, such as M7C3-type and a higher volume fraction of carbides, i.e., a carbide volume fraction (CVF), leading to a higher rejection or scrap rate due to fine cracks usually observed after the casting shakeout or knockout process. Hypoeutectic and eutectic irons of HCWCI are generally cast for engineering components as AWMs [1,5,8,9,10,11,12]. Due to the lessening of both C and Cr contents from the ferrous matrix, i.e., γ-Fe in hypoeutectic irons, liquid iron is enriched in both C and Cr, reaching a eutectic reaction as shown in Eq. 1, and the eutectic constituents nucleate simultaneously. The martensite start (Ms)-temperature of the iron is increased above ambient temperatures, i.e., ≤ 25 degree Celsius (°C). Thus, α-Fe at the periphery of eutectic M7C3 type of carbides is established with a minimum volume fraction as compared to the primary phase, i.e., primary γ-Fe in hypoeutectic irons [1,5,8,11,12]. While in hypereutectic, liquid iron is getting deprived of both C and Cr-content due to the primary nucleation of M7C3-type carbides leading to a eutectic reaction taking place, resulting in the formation of eutectic constituents as shown in Eq. 1 [1,5,6,7,8,9,10,11,12,13]. Eutectic constituent precipitation stops before reaching minimum eutectic temperatures, i.e., the end of the eutectic reaction [12].
Hutchings and Shipway (2017), cited by Tupaj et al. [14], noted that resistance to abrasive wear is normally the main fundamental criterion for material selection for engineering parts and/or components. The exceptional resistance to abrasive wear is due to a higher volume fraction, i.e., CVF of hard Cr-rich carbides, which is estimated from Eq. 2 below. On the other hand, the metallic matrix (M), i.e., retained γ-Fe plus α-Fe of the iron, contributes to the material’s toughness [12,13,14,15], which can be estimated from Eq. 3 below [13,14,15].
High nominal concentrations of Cr-additions lead to higher Cr/C ratios, i.e., ≥ 6.5 [14] in cast irons, and aid to avoid and suppress graphite and pearlitic nucleation while stabilising higher volumes of γ-Fe and hard Cr-rich carbides. In addition, hardening-alloying elements, such as copper (Cu), manganese (Mn), nickel (Ni), and molybdenum (Mo), are typically added to overcome the formation of pearlite during solidification and cooling processes [2,3,4,6,7,8,9,10,11,15]. While carbide forming elements are added to increase AWR through precipitation of their own carbides and microstructural refinement to improve fracture toughness of the iron [9,10]. Islak et al. [5] cited that the impact properties of HCWCI alloys are supported upon microstructural balance among the γ-Fe ferrous matrix, i.e., the volume fraction that will be altered to the α-Fe ferrous matrix and carbides. It should be noted that increasing both C and Cr contents of the high Cr-irons increases CVF while reducing interdendritic structure. However, reducing both C and Cr-contents of the alloy increases the ferrous matrix volume fraction, thus increasing the interdendritic structure, which promotes carbide precipitation [1,2,3,5,6,7,8,9,10,11,12,13,14,15].
Recent studies have examined the incorporation of high entropy alloy (HEA) principles into HCWCI to manufacture high-entropy white cast iron (HEWCI). HEWCI alloy links the benefits of HCWCI with the high entropy effect to offer finer microstructures and advanced wear characteristics. An additional investigation has exhibited that HCWCIs can be modified utilising HEA principles to produce hybrid HEWCI [4]. While the goal of numerous studies has been to enhance the HCWCI alloy’s mechanical characteristics through heat treatment processes and alloying additions. Hardness is the primary mechanical property that determines AWR. As a result, the HCWCI is usually heat treated to change its microstructure and enhance its wear and tribological characteristics. In addition, González et al. [16] invistigated the influence of shot peening treatment in erosion wear behavior of HCWCI alloys. The data analysis suggests that shot peening could be a beneficial treatment to optimise the erosion wear behaviour of HCWCI components while lowering the production times and energy costs associated with drawn-out tempering processes. According to Xia et al. [17], numerous studies have been conducted to date on the in-depth examination of casting component failure brought on by primary carbides in the casting subsurface.
Given that HCWCIs are employed in wear applications, it could be worthwhile increasing our understanding of how casting shakeout temperatures affect casting components and connect them to residual stress (RS) development to lessen hot tearing and distortion. Consequently, during material applications, the casting components’ lifespan is extended, and production outputs are enhanced. The purpose of this study is to submit an American Society for Testing and Materials (ASTM) A532, Type A, Class III, 25%Cr alloy—one of the most widely used alloys for wear parts in the mining, cement, slurry transportation, and minerals industries—to RS measurements. Measuring RS development on casting components at different shakeout temperatures is the goal. In this instance, casting components were manufactured in their gross casting weight (GCW) and casting shakeout carried out at various temperatures due to various shakeout durations. The GCW of the casting component’s RS development will be contrasted with the net casting weight (NCW) of the casting. Using the hole-drilling method (HDM), the impact of this RS development on GCW at different shakeout temperatures is contrasted with the RS change on NCW.
1.2. Development of Residual Stress Within Cast Irons
Residual stresses are largely predictable during casting processes due to uneven cooling rates, phase transformation, expansion, and contraction restriction of casting parts, especially complex shapes due to cores and sand mould restrictions [18,19,20,21]. According to Weisz-Patrault (2015) referenced in Wu et al. [22], and Abdelkhalek, 2011 & 2015, the increasing use of high temperature applications has raised concerns about flatness problems and the resulting cutting distortion. The main reason for these problems is essentially an uneven distribution of RS within the metal components. Furthermore, concerns over flatness flaws or later cutting deformation of the metal components have been highlighted by the growing use of high temperature applications. Actually, the unequal distribution of RS inside the metal component is the primary cause of these flatness problems and resulting ditortions, leading to fracture [19,22]. When materials fracture, atomic bonds are broken, causing cracks to spread. Cracks in materials can be caused by a variety of causes, leading to significant concentrations of RS. The joining of microcracks that started at sub-boundaries can be explained by either dislocation activity or the transfer of many vacancies from nearby boundaries, such as a reaction to high stress fields. The local stress, fracture length and depth, and material fragmentation all increase with the number of strikes. The local RS field is the main determinant of material fracture. Phase mixtures make up most useful materials, some have ductile interfaces between phases or between grains of the same phase, while others have brittle interfaces [11].
In addition, RSs can also exist in the absence of any thermal gradients and/or external forces [19,23,24,25]. Thus, RSs can be described as stresses that remain in the interior of a body of a component and/or casting that are due to non-uniform temperatures, i.e., temperature gradients, and other interior cultivators that result from the manufacturing processes of cast components, especially metal components [15,26,27,28,29]. As a result, the origins of RSs can be categorised as chemical, thermal, or mechanical [30,31,32,33,34]. Since HCWCI alloys, are manufactured through casting processes, this study only covers both mechanically and thermally induced RSs on macroscopic and microscopic levels. Thus, mechanically induced RSs, which relate to manufacturing processes, result in uneven plastic deformation [19,35,36,37]. Thermally induced RSs relate to non-homogeneous heating and/or solidification and cooling on an infinitesimal level as a result of diverse coefficients of thermal expansion (CTE) amongst various constituents and microstructural phases [19,38,39,40,41,42].
Mohamed et al. [38] reported that several factors are well known for causing RSs, and these stresses are due to the establishment of distortion gradients in various casting parts as a result of variances in loading and/or solidification rates, phase changes, or modifications in the CTE of the phase presence in the iron. During casting processes, casting components are normally exposed to internal and external manacles and/or constraints when solidifying and cooling, respectively. Thus, leading to irregular distribution of strains and subsequently RSs. Interior restrictions depend on variances in cooling rate through various casting components, resulting in irregular contractions. Cooling after solidifying and solid-state transformation causes variances in shrinkage [43,44,45]. However, external constraints result from casting profiles and the amount of the material that contracts and restructures, whereas solidification and cooling relate to the sand mould properties [19,46,47,48,49].
Furthermore, Kainer (2003), cited by Lundberg & Elmquist [50], noted that entire thermal contractions are generally related to lessening temperatures and altering conditions of the iron’s microstructural constituent through thermal stress experienced during casting processes. While the thermal stresses encompass various significances, i.e., distortion, cracking, and RS [19,50,51,52,53,54,55,56]. Thus, RSs from casting operations significantly impact on the fatigue life of cast components, potentially reducing their service life. Residual stress should be researched and reduced to improve the performance of cast components in practical applications, such as fatigue life, corrosion resistance, and component distortion. Therefore, to improve the quality of cast components, it is crucial to anticipate and manage RSs brought on by casting procedures.
1.3. Hole-Drilling Measurement
One of the most popular experimental methods for RS analysis in the industrial sector is HDM because of its affordability and simplicity of usage [57]. Oettel [58] cited that HDM is well known for mechanical technique for measuring RS which is regarded as non-destructive for large structures. According to Yang [27], the hole drilling technique is a widely used semi-destructive measurement method that saves time and yields results that are dependable for high precision in industries. When determining RSs in components composed of coarse-grained alloys, HDM is the recommended technique. There is a dearth of information about HDM measurement uncertainty in literature. There is no information available, particularly regarding the case’s uncertainty [59]. The assessment of RS measurement accuracy is limited by the lack of ideal reference standards for RS measurements [60]. Schajer and Whitehead (2013), referenced in Olson et al. [60], provides a helpful background of the drilling theory, and ASTM E837 standardises the procedure. The HDM’s practical application is standardised by ASTM E837 for both uniform and non-uniform through thickness stress distributions. Thus, the ASTM E837 standardises its use for both uniform and non-uniform RS distributions with through-thickness. The examination of uniform stress, which is the subject of this work, generally yields results with a maximum bias of roughly 10% in compliance with ASTM restrictions [57].
After bonding the strain gauge (SG) to the surface of the component, a hole is bored in the middle. Throughout drilling, strains are continuously measured. Due to the narrow distance between SGs and the hole, considerable plastic deformation and heating must be avoided throughout the drilling process. For air abrasive particles, high-speed drilling machines with a rotational speed of approximately 300 000 revolutions per minute (rpm) are thus employed. The technique is limited to homogenous and isotropic materials in theory. However, several papers demonstrate that the impact of the material’s roughness can be disregarded. Therefore, strains from inherent RSs are not entirely released by the HDM. The measured strains cannot be used to compute the stresses directly. Adjustment coefficients are required, and they are frequently found through experimentation or computation [58].
The quantitative in-depth RS measuring techniques often accept the incremental hole-drilling (IHD) methodology. In essence, the HDM measures the surface strain relaxation brought on by the test material’s surface having a tiny hole machine into it [61]. The theory of elasticity is used to establish a correlation between the strain relaxation and the RSs that were present before hole drilling. To measure in-depth, non-uniform RSs, incremental drilling is required. This study used an integral method, which was established by ASTM E837 and is currently regarded as the most effective technique for assessing complex RS states as indicated by IHD [62]. To reduce the uncertainties related to the inverse problem that arises when solving the system of equations of the integral technique, the so-called Tikhonov regularisation methodology is used for all calculations in this work [63].
We will not go into detail about all the technique’s drawbacks here. However, a significant disadvantage might be the thermo-mechanical effects caused by the actual cutting process [64]. Flaman [65] proposed using a compressed air turbine system and ultra-high-speed drilling, such as 400 000 rpm to get around these effects and apply hole-drilling technology to metals and their alloys without causing stress. Nowadays, all commercial equipment for the hole-drilling process uses Flaman’s drilling approach.
2. Material and Methods
2.1. Melting and Casting Processes
AWR foundry returns, such as charge material of HCWCI alloy, i.e., hypoeutectic compositions from ASTM A532, Type A, Class III, 25%Cr, were melted and cast using 4 tonnes (t) industrial induction furnace and ladle equipment, respectively. Thus, Table 1 below shows casting limits, i.e., casting parameters during sample preparation, such as casting, solidification, and cooling processes as well as the shakeout periods. Furthermore, Figure 1 below shows the stress lattice casting in GCW conditions of the experimental and special casting components. The stress lattice casting component was designed for complete and sound stressed casting of the HCWCI alloy for RS measurement purposes.
Special casting design presents asymmetrical shapes, and the cooling of special stress lattice castings are irregular. The determination of the design stress lattice shape is that of contraction of the interior and external sections of the cast component, which are highly restricted due to various core sizes and sand mould through cooling processes. Additionally, irregular cooling of the stressed lattice casting leads to various temperature gradients due to various casting section thicknesses. Whereas cores and moulds are further imposing a higher degree of restraint towards the casting during solidification and cooling, thus casting components are released, i.e., the casting shakeout process from the mould with RS distribution. Thus, a better RS prediction and understanding from GCW to NCW conditions can lead to more accurate life assessments, better manufacturing process designs, and improved component reliability [66].
In addition, Figure 2 below illustrates experimental castings, such as S/A and S/B stress lattice casting components during solidification and cooling processes. The simulation process was performed to calculate the casting process time and the solidification and cooling processes of experimental casting as shown in Figure 1. Magma 5.4.2 was used to model the temperature changes of stress lattice castings during the casting process over time. The simulation includes the feeding and gating system and vents through simulating the solidification process before removing junk material. The stress lattice casting temperature profiles presented in Figure 2 are presented in three variations, such minimum, mean, and maximum temperatures. S/A stress lattice casting temperatures profiles for minimum, mean, and maximum are presented as yellow, turquoise, and green in colour, respectively. While S/B stress lattice casting component’s temperature profiles are presented as dark blue, purple, and red in colour for minimum, mean, and maximum temperatures, respectively.
It is observed in Figure 2 that S/B temperature profile is at minimum solidification and cooling rates as compared to S/A. Thus, Figure 2 reveals that the temperature gradient under GCW on S/B are lower than temperature gradients of S/Astress lattice casting. However, during initial stages of solidification and cooling, S/B stress lattice temperature gradients are much higher than S/A stress lattice casting component. While after initial stages, S/B stress lattice casting component temperature gradients become lower than S/A stress lattice casting component in the GCW conditions. It is further observed in Figure 2 that after initial stages of solidification and cooling processes, temperature gradients of both stress lattice casting components are almost similar with slight variations.
2.2. Experiential Procedures
2.2.1. Chemical Evaluation
The chemical composition of the liquid iron during the melting process before casting was accomplished by means of chill-cast moulds, such as permanent mould. During the melting process, a sample from the liquid iron from the induction furnace was taken out and cast into a chill-cast mould resulting in cast sample ingots, i.e., casting coupons. The sample preparation was performed through the general standard procedure for grinding casting coupons flat using 60 grit paper. The optical emission spectrometer (OES), such as Specromaxx-type of spectrometer, was used to perform the chemical analysis. Before the actual chemical analysis of the casting coupons was analysed, the OES was calibrated through running known HCWCIs standard samples. Thus, chemical analysis of the liquid iron was validated through performing chemical analysis of the casting components after casting shakeout and knockout, respectively. Thus, more than three tests were performed, and an average was recorded.
2.2.2. Microstructural Evaluation
The removal of the HCWCI coupons from the experimental casting components shown in Figure 1 for microstructural examination was performed. The as-cast casting components were sectioned using an electric discharge machine (EDM), sometimes referred to as a wire cut machine, for metallographic examination with an optical light microscope (OLM). To expose different metal phases in HCWCI alloys at two magnifications, such as X10 and X20, respectively. Thus, two casting coupons were etched using Le Para and Murakami etchants for revealing ferrous matrix and coloring of eutectic carbides, such as M7C3-type, and then were rinsed with alcohol. The casting coupons were cold mounted with catalysts and resin before etching. The coupons were then polished and ground before being etched at room temperature.
2.2.3. Hardness Evaluation
Macrohardness, i.e., the bulk hardness measurement of the casting, was performed at ambient temperatures through a Brinell hardness tester machine. Random casting areas were selected for grinding before the hardness test measurement. A load of 750 kg was used and a Brinell hardness tester with a dwell time of 30 seconds (secs), whereas the average of the five indentation measurements made on each sample is shown in this study.
2.2.4. Residual Stress Measurements Evaluation
The HDM, i.e., the SINT Technology RESTAN MTS-3000 RS measuring device, was used to measure RS in the hole-drilling strain-gauge (HDSG) technique of the stress reduction technique. The HDM uses ASTM standard E837, which depends on stress comparison when a hole is drilled at the midpoint of a rosette SG. Additionally, iron’s properties and RS measurement procedure relate to strain relaxation measured at two dissimilar surfaces, i.e., P1 and P2, as shown in Figure 3 below. While the elastic properties of HCWCIs used for RS calculation were approximately 216 GPa and 0.291 for Young’s modulus and Poisson’s coefficient, respectively. Thus, the HDM measures the direction and the magnitude of the principal stresses, whereas the measurement was performed at ambient temperatures. The HDM procedure is simple and is summarised into seven uncomplicated steps. For more information and understanding on the HDM preparation, the following publications are recommended [15,67,68,69,70,71,72,73]. RS measurement was computed by means of strain data and formulas cited in ASTM E837-08.
HDM is another name for the IHD process. The procedure consists of two primary steps: sample preparation, which includes installing an SG rosette, and drilling to release stresses for measurement. Furthermore, recovery is very likely after the removal of a modest amount of debris. As a result, the harm to the components that are being evaluated is typically well tolerated. The sign, value, and direction of RSs at P1 and P2 are provided along the drilling depth in this assessment technology. The direction results are only on a 2D plane that is parallel to the glued SG rosette, even though RS is a spatial specification. 0°, 45°, and 90° angles were employed in a standard SG rosette. The biaxial, or σxx, σyy, and τxy RS status, which denotes radial, hoop, and shear stresses, is guaranteed to be displayed due to the precise location and orientation of three linear SGs. The drilling tool’s diameter largely determines the maximum depth that is practical.
This project involved drilling a hole with a diameter of approximately 1.8 mm and reaching a depth of approximately 1.0 mm, with an incremental of 0.02 mm. Three procedures were needed to apply the SG rosette: surface preparation, SG bonding, and circuit connection. To eliminate any oxides and oils, surface preparation often entails reducing the surface at and around the measurement location, i.e., P1 and P2 as shown in Figure 3 below, using a chlorinated hydrocarbon solvent. After that, an ammonia-based solution was used to neutralise the surface. Additionally, to provide more precise results, the casting surface skin at P1 and P2 was slightly polished.
A smooth surface guarantees appressed contact to the SG, allowing for precise surface deformation detection even while mechanical polishing results in some prerelease of locked-in stresses. However, to retain as much stress as possible, it is always preferable to reduce the quantity of material polished away. For example, a plate-like sample is considered acceptable if its polished thickness is up to one tenth. Furthermore, Figure 3 offered experimental stress lattice castings in GCW [Figure 3(A)] and NCW [Figure 3(B)], respectively, in as-cast condition. Four RS measurements were performed on experimental irons, two RS measurements at P1 and P2 under GCW conditions and another two RS measurements at P1 and P2 under NCW conditions in as-cast conditions as shown in Figure 3. GCW denotes comprehensive casting before removal of junk materials, i.e., pouring cup, sprue, risers/feeders, ingates, and vents to yield the NCW.
While the NCW is the saleable or actual casting component after the removal of junk materials from GCW conditions. Drill bit cutters coated at the tip and/or end mill with tungsten carbide material at a speed of approximately 300 000 rpm through an air turbine were used to avoid generating any RS because of the drilling technique introduced to the iron. Thus, awareness of the extent and distribution of RSs is principally important to ensure the safety of the operation during material application. While the drawback of IHD is that it necessitates a reasonably level and horizontal three-legged standing drilling configuration, good surface smoothness, and a maximum one-dimensional curvature for SG installation at the point, i.e., P1 and P2, to be evaluated.
3. Results and Discussion
3.1. Chemical Analysis
Prepared experimental alloys of high Cr-iron coupons of hypoeutectic composition were analysed in cross-sectional area(s) for chemical composition using OES, and the chemical composition is presented and summarised in Table 2 below. It is observed that the actual chemical composition of the experimental alloys agrees with ASTM A532, Type A, Class III, 25%Cr. Phosphorus (P) in the S/B casting component is slightly out of specification, i.e., 0.004 wt. %P than the recommended concentration in the ASTM A532, Type A, Class III material standard. However, 0.004 wt. %P is a small amount and can be disregarded, since P is a trace element; thus, there will not be any effect due to this excess amount. Trace elements are normally those elements or elementary impurities that are detected within alloys but are not having any impact or effect on the iron. Thus, the chemical composition of S/A and S/B substantiates that they are those of the hypoeutectic composition of the HCWCI alloy. As estimated from Eq. 2, the computed CVF of the experimental castings, i.e., S/A and S/B cast products components, are approximately 28.87 and 32.19%CVF, respectively, of eutectic carbide type, i.e., M7C3 plus secondary carbides, i.e., M23C6 carbide type [8,10,11,15,18].
Furthermore, the volume fraction of the ferrous matrix, i.e., γ-Fe plus α-Fe, is computed using Eq. 3 and is approximately 71.13 and 67.81% in S/A and S/B cast products, respectively. It should be noted that Cr/C ratios of S/A and S/B cast products are computed as 9.6 and 9.5, respectively. According to Tupaj et al. [14], pearlite transformation is not possible since Cr/C ratios of experimental alloys are greater than 6.5. Thus, the resultant metallic matrix constitutes the maximum and minimum volume fractions of γ-Fe and α-Fe, respectively [74,75].
3.2. Microstructural Analysis
Etched samples of high Cr-irons of S/A and S/B are presented in Figure 4 and Figure 5, respectively, below. The casting coupons were etched with a Le Para and Murakami etchants. Both Figure 4 and Figure 5 illustrate fully austenitic matrix at X10 magnification as shown in Figure 4(a) and Figure 5(a), while eutectic carbide, such as M7C3-type, are outlined [8,12,15,25]. In addition, the martensitic matrix is revealed as dark and brownish areas within the austenitic matrix. The martensitic matrix is situated within the eutectic carbide periphery. Hence, the martensitic matrix is revealed as an austenitic-martensitic matrix [8,10,13,15]. While eutectic carbides are revealed in Figure 4(b and c) and Figure 5(b and c) at X10 and X20 magnifications, respectively. According to Li et al. [66], phase transition kinetics models, such as Jung’s critical transformation, have been improved in recent years by researchers, increasing the precision of microstructure field estimates. Thus, gradient RS fields are usually produced within the components by the combination of heat gradients and high volumetric expansion brought on by martensitic transformation.
Martensitic matrix is established due to the eutectic precipitation of eutectic constituent and precipitation of eutectic carbides that are lessening the C-content of the ferrous matrix. The lessening of C-content within ferrous matrix leads to Ms-temperature moving above room temperature resulting in transformation of γ-Fe to α-Fe during solidification and cooling conditions [9,10,13,15]. Thus, the resultant microstructural evaluation results in established proeutectic γ-Fe, and eutectic constituents, such as γ-Fe + M7C3, including transformed α-Fe in as-cast conditions as illustrated in Figures and 5.
3.3. Hardness Analysis
Hardness measurements of S/A and S/B cast products were established to be approximately 526 and 600 BHN, respectively, compared to 450 BHN for ASTM A532, Type A, Class III material standard, i.e., 25%Cr [15]. The hardness values obtained are higher than the hardness values presented in ASTM A532, i.e., hardness requirements. Thus, established higher hardness estimates are due to 60 and 180°C casting shakeout temperatures on S/A and S/B cast product components, respectively, coupled with higher values of %CVF. Furthermore, an increase in hardness values from S/A to S/B castings is noticed from an increase in C content from 2.5 to 2.7 wt. %, 24.09 to 25.65 wt. %Cr, and 28.87 to 32.19%CVF. Seidu et al. [76] in their studies established that prolonging casting shakeout times, i.e., knock-off times, lessens hardness, thus raising the carbide grain size. Ferrous matrix is reduced from 71.13 to 67.81%, as C and Cr-content are increased from 2.5 to 2.7 wt. % and 24.09 to 25.65 wt. %Cr on S/A and S/B cast products, respectively.
This has led to the enhancement of hardness, which is influenced by higher CVF, i.e., 28.87 to 32.19% of the total Cr-rich carbides, i.e., M7C3/ (Cr, Fe)7C3 type of carbides within the iron structural composition [11,77,78]. Additionally, higher casting shakeout temperatures (CST), i.e., 60 and 180°C (as summarised in Table 1), with reduced metallic matrix content have contributed to higher hardness values. During the casting process, i.e., pouring, solidification, and cooling processes, various casting parameters, such as fracture toughness, hardness, RSs, etc., are influencing the final casting quality. An improved understanding of the casting process is normally beneficial to analyse for process improvement. Thus, the mechanical aspects of the RS in the casting components are driven by thermal gradients, which are due to heat transfer from the part to the sand mould, chills, i.e., supporting steel bars, and surroundings.
3.4. Residual Stress Analysis
The entire manufacturing process and removal of external loads, i.e., removal of junk material from the NCW conditions, introduces and alters RSs in cast components. Thus, RS evaluation and determination have been studied through laboratory work. Whereas in-depth research performed to calculate their extent and distribution in cast components is limited, especially in the as-cast conditions of HCWCI alloys, which involved solidification and cooling as part of the casting process. After casting processes, such as pouring, solidification and cooling, shakeout, and knockout processes, respectively, have been performed, RS measurements were performed in as-cast state in two different manufacturing paths, viz., GCW and NCW states. It is well known that RSs are introduced because of the geometrical complexity of the cast part/component. However, a limited number of works by scholars and researchers have dealt with the RS’s establishment on HCWCI alloys through casting processes, such as casting shakeout at different casting temperatures. Although these RSs are minimum in size, they can still initiate crack establishment. Thus, subsequent failure in later stages of the component during material application and/or service.
Additionally, different stress regions, i.e., P1 and P2 on experimental castings as shown in Figure 3 illustrating GCW (Figure 3(A)) and NCW (Figure 3(B)) conditions, respectively, in as-cast conditions were measured for RS extent and distribution. Thus, Figure 6 to Figure 17 demonstrate RS measurements computed from the HDM-RS measurements. Thus, Figure (A) illustrates principal stresses, i.e., minimum (σmin.) and maximum (σmax.), which are shown as green and red in colour, respectively. While Figure (B) illustrates Tresca and Von Mises RSs, which are shown as solid and dashed lines, respectively. Responses of surface strains, thus RS in longitudinal and lateral directions corresponding to σmin. and σmax. principal stresses, were first evaluated to substantiate the viability of the in-situ establishment. Definite relations of principal stresses as a function of casting surface depth (CSD), i.e., z (mm), are illustrated in Figures (A) and (B).
3.4.1. Sample-A (S/A Alloy)
3.4.1.1. Residual Stresses at P1 Under GCW and NCW Conditions in S/A
Figure 6 below presents the RS extent and distribution measured on S/A casting at P1 under GCW and NCW conditions, respectively. RS measurements were performed up to a CSD of approximately 0.8 mm. It is noticed in Figure 6 that compressive and tensile RS states are experienced under GCW and NCW conditions. It is noted in Figure 6(A) that RS measurements under NCW and GCW conditions only managed to reach a CSD of approximately 0.275 and 0.875 mm, respectively. The σmin. and σmax. principal stresses under GCW and NCW states near the surface, were measured and found to be approximately -313 and -147 MPa, -30 and 150MPa, respectively, at a CSD of approximately 0.04 mm. In addition, RSs on NCW state increase linearly in tensile state, reaching maximum magnitudes of approximately 241 and 203 MPa for σmin. and σmax. principal stresses, respectively, at CSD of approximately 0.125 mm. The GCW states compressive stress decreases under a compression state, reaching maximum magnitudes of σmin. and σmax. principal stresses of approximately 0.4 and 51 MPa, respectively, at a CSD of approximately 0.24 mm. While both GCW and NCW RS distributions after reaching maximum magnitudes at 0.24 and 0.15 mm CSD, respectively, show a sharp and slight drop in magnitudes reaching a completely compressive state at approximately 0.875 and 0.275 mm, respectively. NCW and GCW RS states at maximum CSD, i.e., 0.275 and 0.800 mm were calculated at approximately -474 and -113 MPa, -150 and -100 MPa, respectively, for σmin. and σmax. principal stresses. The existing RS state and distribution as shown in Figure 6(A) are revealing that there is RS relaxation through casting springing back to its original stress state under NCW conditions after removal of junk material. Thus, it alters the stress state and distribution to a different stress state and distribution under NCW conditions.
Removal of junk material from GCW reveals a completely different RS state and distribution under NCW conditions as shown in Figure 6(A). Residual stresses were established under GCW conditions due to casting processes, such as solidification and cooling, and casting shakeout at approximately 60°C. Therefore, the RS state and distribution are completely relieved and changed to a different stress state and distribution under NCW conditions compared to the RS stress state and distribution under GCW conditions, as presented in Figure 6(A). Figure 6(A) shows that S/A casting component shakeout at 60°C reveals a noticeable consequence under GCW and NCW conditions on the mode the casting component distorts while cooling to ambient temperatures and after removal of junk material from the NCW conditions. This is due to the large temperature gradient that exists at the beginning of the cooling process. However, large temperature gradients gradually lessen as the thermal equilibrium is recognised [26], encouraging tensile stresses on the surface and compressive stresses in the core. Thus, tensile RS increases linearly with increasing CSD as observed in Figure 6(A).
Furthermore, it is observed in Figure 6(B) that RS magnitudes are higher near casting surfaces, such as at approximately 0.025 mm under GCW conditions with Von Mises and Tresca RS magnitudes of approximately 271 and 313 MPa, respectively. While NCW Von Mises and Tresca RSs were measured at approximately 167 and 180 MPa, respectively. It is noted that as the CSD increases linearly, there is a linear increase of equivalent stress on both NCW and GCW conditions. Equivalent Von Mises and Tresca RSs under GCW conditions shown in Figure 6(B) are reducing linearly, reaching minimum levels of approximately 29 and 33 MPa at CSD of 0.175mm. While 224 and 241 MPa at CSD of approximately 0.125 mm under NCW casting components, of equivalent Von Mises and Tresca RSs, respectively, were measured. Equivalent Von Mises and Tresca RSs are to an extent levelling and rising, reaching maximum magnitudes of approximately 125 and 141 MPa, respectively, at CSD of approximately 0.875 mm. Finally, 195 and 226 MPa at CSD of approximately 0.175 mm, there is an insignificant rise to maximum magnitudes of approximately 429 and 474 MPa at CSD of 0.275 mm of equivalent Von Mises and Tresca RSs, respectively.
It is noticed in Figure 6(B) that equivalent Von Mises and Tresca RSs obtained have higher magnitudes near casting surfaces under GCW conditions and at casting interiors under NCW conditions. While Ammar & Shirinzadeh [31] cited that at maximum temperatures, casting components yield effortlessly, such that thermal strains lead to plastic deformation. Nevertheless, during the cooling casting component, the casting no longer yields; thus, thermal strains result in appearing as elastic RSs. It can be concluded that in as-cast conditions, the casting RSs are kept or deposited on the casting component due to solidification and cooling processes, coupled with a temperature gradient, plus a casting shakeout process performed at approximately 60°C. A substantial large amount of RS magnitude within the casting component in as-cast conditions is stored once the casting component has cooled sufficiently. Any minimum applied stress in magnitude as compared to attained flow stresses establishes an elastic strain, and the plastic strains are not calmed by plastic deformation when the junk materials are removed, leading to the casting component springing back to its original stress state [28,79]. Thus, it is noticed that RSs are inhomogeneous, as noticed in Figure 6 [8,10,28,80]. Additionally, the distribution of RSs with cross-sectional area is inhomogeneous, as illustrated in Figure 6 [8,10,79,81],]. It should be noted that a sharp decrease in RS as the CSD increases is due to change in microstructural sizes, where fine grain structures are established within the casting surface as compared to coarse grain structure established away from the casting surfaces. Thus, higher stresses are established near the casting surfaces as compared to inner parts of the casting surfaces.
3.4.1.2. Residual Stresses at P2 Under GCW and NCW Conditions in S/A
A comparison of NCW and GCW conditions stress states is shown in Figure 7 below at P2 in as-cast conditions. Figure 7(A) shows that under GCW and NCW conditions, σmin. and σmax. principal stresses near the surface are approximately 133 and 407 MPa, 427 and 538 MPa at CSD of approximately 0.025 and 0.012 mm, respectively. Thus, the magnitudes of RSs under NCW conditions near the surface are higher than those under GCW conditions at P2. It is observed in Figure 7(A) that as the surface depth increases under NCW conditions, the RS σmin. and σmax. principal stresses, rises to maximum magnitudes of approximately 624 and 958 MPa at the CSD of 0.062 and 0.087 mm, respectively.
The GCW condition increases in compression stresses, attaining completely compressive stresses of approximately -180 and -158 MPa at the CSD of approximately 0.125 mm. It is noted that the drilling process only managed to drill up to a surface depth of approximately 0.125 mm under NCW conditions as compared to GCW conditions with a surface depth of 0.875 mm. The GCW RS after attaining completely compressive stresses, it increases slightly in tensile stresses and stays stable with RS magnitudes of approximately 100 MPa until it reaches a maximum CSD of approximately 0.875 mm. Thus, NCW RS are higher than GCW RS. Figure 7(B) evaluates NCW and GCW RSs on equivalent and computed Von Mises and Tresca RSs. Figure 7(B) reveals that Von Mises and Tresca RSs under NCW conditions are at maximum magnitude as compared to GCW conditions. Equivalent and computed Von Mises and Tresca RSs are at maximum near the casting surface and in inner layers, with computed Von Mises and Tresca RSs reaching 492 and 538 MPa at CSD of approximately 0.012 mm under NCW conditions. Whereas computed RSs of equivalent Von Mises and Tresca are approximately 359 and 407 MPa at CSD of approximately 0.025 mm, respectively.
Besides, NCW and GCW RSs are lessening linearly with the rise of CSD reaching fully compressive and tensile stresses, respectively, as noticed in Figure 7(B). It is noticed that there is an increase in equivalent computed stresses, i.e., Von Mises and Tresca, as the CSD increases, reaching approximately 1563 and 1790 MPa at 0.138 mm under NCW conditions. While under GCW conditions, measured and computed equivalent stresses of Von Mises and Tresca RSs, respectively, are approximately 170 and 180 MPa at CSD of approximately 0.125 mm. Finally, equivalent RSs on GCW remain and endure to an extent of levelling up to a maximum CSD reaching equivalent RSs of ≤ 200 MPa. Thus, loading and unloading of junk material effects are observed and found near the casting surface within the casting’s various section thicknesses and/or areas, such as at P1 and P2, where RSs are established due to the solidification and cooling process coupled with shakeout at lower casting temperatures, i.e., 60°C in an as-cast condition under GCW conditions.
3.4.1.3. Residual Stresses Under GCW Conditions at P1 and P2 in S/A
It is critical to note the differences in the stress strain versus temperature relationship, which is fundamentally important to the establishment of casting RSs [8,26]. During casting processes, solidification, and cooling rate variations, i.e., temperature gradients, are the principal foundation of RSs within casting components, which are due to variations in casting section thickness as highlighted and presented in Figure 3. Thus, Figure 8 below presents the relationship at P1 and P2 under GCW RS measurements. As shown in Figure 8(A), higher RS magnitudes, i.e., principal stresses, such as σmin. and σmax., are observed at P2 as compared to P1. Near the surface, i.e., 0.025 mm CSD at P2, σmin. and σmax. principal stresses are observed to be approximately 133 and 407 MPa, whereas at P1, RSs were measured to be approximately -313 and -147 MPa. Thus, near the surface, RSs are in a tension state at P2 as compared to P1, which is in a compression state under GCW conditions.
Figure 8(A) reveals that as the CSD increases, P1 and P2 RSs under GCW conditions are completely different near the casting surface, whereas in the surface they are still completely different since they are showing fluctuations between tensile and compressive states as observed in Figure 8(A). Since P1 RSs are in a compression state near the casting surface, tensile stresses are increasing as the CSD increases, attaining σmin. and σmax. principal stresses of approximately 74 and 121 MPa at a CSD of approximately 0.575 mm. Whereas at P2 RSs, increases in compressive stresses as the CSD, i.e., 0.125 mm, increase, attaining a completely compressed state of approximately -180 and -158 MPa of σmin. and σmax. principal stresses, respectively. It is noticed in Figure 8(A) that at P1 and P2, RSs change as the surface depth increases, reaching fully compressive and tension states, respectively. Principal stresses at P1 were measured to be approximately -141 and -98MPa for σmin. and σmax. principal stresses, respectively at CSD of approximately 0.875mm, which are fully compressive, whereas at P2 the measured RSs were approximately 61 and 130MPa for σmin. and σmax. principal stresses, respectively. Since P1 is in tensile stresses near the casting surface, P2 is completely in a compression state.
It can be concluded that P1 has thicker section thickness as shown Figure 3, and it is closer to the feeder/riser, thus experiencing higher magnitudes of tensile stresses as shown in Figure 8(A) near the casting surface. Thus, Torres et al. [28] established that thick casting section members normally encourage high tensile stress, hence bending leading to distortions to develop. Corresponding Von Mises and Tresca RSs are illustrated in Figure 8(B) and are noticed to be optimum near casting surfaces at P2 and are computed at approximately 359 and 407 MPa, whereas at P1 they are computed at approximately 271 and 313 MPa at CSD of approximately 0.025 mm, respectively. Additionally, at a CSD of approximately 0.075mm, corresponding Von Mises and Tresca RSs are lessening as the CSD rises, reaching 201 and 232 MPa, 103 and 117 MPa at P1 and P2, respectively. While computed Von Mises and Tresca RSs at P1 remain to decline linearly, reaching approximately 29 and 33 MPa at CSD of approximately 0.175 mm, respectively.
Furthermore, at P2, Von Mises and Tresca RSs are reduced significantly and show levels of variation, thus reaching computed Von Mises and Tresca RSs of approximately 39 MPa at approximately CSD of 0.325mm for both RSs and 112 and 130 MPa at CSD of approximately 0.875 mm. Computed RSs of Von Mises and Tresca at P1 rise linearly with increasing CSD, reaching 50 and 51 MPa at approximately 0.275 mm CSD. Moreover, Von Mises and Tresca RSs are lessening to some extent, reaching approximately 28 and 30 MPa, respectively, at approximately 0.525 mm CSD. Whereas corresponding RSs rise with an increasing CSD, reaching approximately 0.875 mm, and Von Mises and Tresca RSs of approximately 125 and 141 MPa, respectively. Thus, RSs attained agreement with earlier studies achieved by other scholars and/or researchers. Throughout the casting processes of special casting design, i.e., complex shapes, the cooling rates of some casting sections are normally constrained by some regions that may have cooled initially and are much stronger, thus leading to weaker casting sections to plastic deformation. During the casting of exceptional designs and/or stress lattice casting, such as complex shapes, the cooling of some regions are often constrained by some casting regions that have cooled earlier and thus are stronger, causing the weaker casting regions to plastic deform [8,28,82]. The phenomena lead to casting components experiencing various stress conditions and/or states as presented in Figure 8(A). Thus, the phenomena result in a casting component experiencing different stress states at different casting regions, as shown in Figure 8(A).
Akhtar [26] and Zhang et al. [78] established that stressed castings are under-cooled from a solidification state; the variations due to cooling rates lead to the establishment of a tensile RS state within inner regions and a compressive RS state in the external areas. In addition, casting components of complex geometry, the external surface, i.e., the casting surface, will show variations and not only have an impact on thermal RSs but also on the microstructural features developed within the final casting component [8,83]. Thus, it can be concluded from the evaluation of RSs obtained in Figure 8 that RS magnitudes of a given casting component can experience RS magnitudes relying on the degree of limitation executed by some casting regions and/or sections through fast cooling of earlier casting sections than others and the degree of constraints experienced through sand mould walls [8,82].
3.4.1.4. Residual Stresses Under NCW Conditions at P1 and P2 in S/A
Since it was noticed that there is deflection and the material is springing back when junk materials are removed from NCW conditions, RSs were compared under NCW conditions at P1 and P2. It is observed in Figure 9(A) below that at P1 and P2 σmax. principal stresses are presented in the tensile region. Whereas both compressive and tensile regions on σmin. principal stresses were noticed on both P1 and P2 as the surface depth increases. These findings are not in agreement with some scholars’ findings. Thus, there is an increase in RS as the CSD increases, as observed in Figure 9(A). Near the casting surface, it is noticed that RSs are in slightly compressive and tensile states at P1 with a measured RS of approximately -30 and 150 MPa at the CSD of approximately 0.025 mm on σmin. and σmax. principal stresses, respectively. Whereas at P2, σmin. and σmax. principal stresses were measured at a magnitude of approximately 427 and 538 MPa at the CSD of approximately 0.120 mm, respectively. Additionally, P1 and P2 RS increases linearly as the CSD increases, reaching approximately 203 and 241 MPa maximum tensile stress states at the surface depth of approximately 0.125 mm, respectively, at P1. At a surface depth of approximately 0.037 mm, σmin. and σmax. principal stresses were measured as 665 and 958 MPa, respectively, at P2. It is noticed in Figure 9(A) that RSs at P1 are lessening linearly as the CSD increases, reaching a completely compressive stress state of approximately -474 and -113 MPa at the CSD of approximately 0.275 mm, whereas at P2 RSs are both in compressive and tension stress states of approximately -1085 and 705 MPa on σmin. and σmax. principal stresses, respectively.
Corresponding computed Von Mises and Tresca RSs at P1 and P2 are revealed in Figure 9(B). It is revealed that computed Von Mises and Tresca RSs magnitude at P2 are optimum as compared to P1. Thus, it is observed that computed Von Mises and Tresca RSs near the casting surface reach approximately 167 and 180 MPa at CSD of approximately 0.025 mm at P1, whereas at P2 they are computed at approximately 492 and 538 MPa at CSD of approximately 0.012 mm. It is noticed that as the CSD rises, computed RSs, such as Von Mises and Tresca at P2, are rising linearly, reaching 1562 and 1790 MPa at a CSD of approximately 0.138 mm. Whereas RSs at P1, computed Von Mises and Tresca RSs are to some extent rises reaching 204 and 234 MPa at CSD of approximately 0.225 mm, thus attaining optimum RSs of approximately 429 and 474 MPa at CSD of approximately 0.275 mm, respectively. As shown in Figure 8, established RSs reveal optimum magnitudes within GCW conditions at P2 as compared to P1. Whereas Figure 9 corresponds and/or matches RSs established in Figure 8 and P2 RSs under NCW conditions are revealing optimum magnitudes as compared to P1. Uneven cooling leads to distortions of cast components/parts due to casting variation section thickness cooling differently, i.e., variation in cooling rates. Thus, relying on the volume-to-surface ratio, i.e., casting modulus and thermal conductivity of the sand mould in contact with the casting component. The design of the cooling lines within the sand mould, which affects the path heat is extracted from the cast component, i.e., iron, and the presence of the core/s [82]. Therefore, all these parameters and/or factors establish and can be used to determine the RSs magnitudes and/or RSs are more difficult to project, as can be observed in Figure 9.
3.4.2. Sample-B (S/B Alloy)
3.4.2.1. Residual Stresses at P1 Under GCW and NCW Conditions in S/B
RSs under GCW and NCW conditions at P1 are compared as presented in Figure 10 below. Extremely higher tensile stress states are noticed under GCW conditions, especially within the inner layers, i.e., at approximately between CSD of approximately 0.2 and 0.6 mm as observed in Figure 10(A). Whereas near casting surfaces under GCW conditions, RS to some extent are highly in a compressive stress state. In addition, a compressive steady RS state under NCW conditions is noticed as compared to GCW conditions. It is noticed that the compressive steady stress state is through the casting surface, i.e., from casting surfaces through the inner layers of the casting component.
It is concluded that RSs under NCW conditions are completely relieved after removal of junk material from the NCW conditions. This is due to the extremely high tensile RS state observed under GCW conditions as compared to the RS on the NCW casting component observed in Figure 10(A). RS states within NCW conditions are altered, i.e., tensile stress to compressive stress state due to the removal of junk material from the NCW conditions, leading to a completely different RS state and distribution. Since RSs has been induced due to a large temperature gradient, which is from the casting surface, such as external layer to the inner layers , such as centre depending on the casting dimensions, i.e., the sections thickness of the casting, RSs could be related to the comprehensive rate of cooling. Thus, attainment of substantial proportions under rapid cooling will lead to RSs, which is due to casting shakeout at approximately 180oC.
Furthermore, structural and compositional heterogeneity will add to the cause of RSs development. Mould hindrance and phase transformations contribute appreciable quantities of RSs when higher magnitudes of temperature gradient exist among casting sections of the casting during cooling [8,26,84]. The action of contraction of the casting causes a build-up of RSs at the latter stages of cooling. Thus, considering that the material will not develop RSs while in the liquid state, i.e., in te interior of the casting, but RSs will arise as the solidification progresses beyond the eutectic reaction, i.e., for an alloy. Figure 10(A) shows that near the casting surface under GCW conditions, σmin. and σmax. principal stresses, respectively, are in a completely compressive stress state, whereas under NCW conditions they are between a slightly tensile and a completely compressive steady stress state. It is noticed in Figure 10(A) that σmin. and σmax. principal stresses are measured near the casting surface at approximately -103 and0 -48 MPa at approximately 0.04 mm, respectively, under GCW conditions. Whereas σmin. and σmax. principal stress under NCW conditions are approximately -215 and 163 MPa at approximately 0.025 mm, respectively.
Furthermore, steady compressive RSs are noticed under NCW conditions to have been established with measured RSs within maximum magnitudes of approximately -250 MPa till CSD is at maximum, with an extent of approximately -20 and 53 MPa at approximately 0.875 mm measured for tensile and compressive stresses, respectively. It is noticed that GCW RSs are lessening linearly as the CSD rises and reaches RSs of approximately -490 and -241 MPa at CSD of approximately 0.68 mm, while to some extent it lessens slightly within compressive RSs reaching approximately -214 and -86 MPa at CSD of approximately 0.875 mm, respectively.
However, Figure 10(B) reveals that near CSD of up to a maximum of approximately 0.2mm under NCW conditions, Von Mises and Tresca RSs are at optimum as compared to GCW conditions. Whereas at CSDs of approximately 0.025 and 0.04 mm, Von Mises and Tresca RSs within NCW and GCW conditions are measured at approximately 328 and 378 MPa, 89 and 103 MPa, respectively. The corresponding RSs shown in Figure 10(B) illustrate that within NCW conditions, computed RSs of Von Mises and Tresca are lessening and are approximately measured below 200 MPa until they reach a CSD of approximately 0.875 mm. Whereas under GCW conditions, computed RSs of Von Mises and Tresca are computed at approximately 1101 and 1122 MPa at CSD of approximately 0.44 mm, respectively. Computed RSs as shown in Figure 10(B), GCW conditions are lessening with rising CSD reaching 199 and 212 MPa at approximately 0.60 mm, and rises reaching 426 and 490 MPa at approximately 0.68 mm CSD within computed Von Mises and Tresca RSs, respectively. Finally, computed RSs within GCW conditions, Von Mises, and Tresca RSs are lessening and measured at approximately 61 and 64 MPa at CSD of approximately 0.92 mm, respectively. Shakeout processes at higher casting temperatures are noticed to establish optimum magnitudes of tensile stresses within the cores of the casting at P1 under GCW conditions. While tensile stresses under GCW conditions are relieved and are within fully steady-state and are compressive RSs of lower magnitude, and are established within NCW conditions, as shown in Figure 10(B).
3.4.2.2. Residual Stresses at P2 Under GCW and NCW Conditions in S/B
Since junk material has been removed from NWC conditions, Figure 11 below illustrates RSs under GCW and NCW conditions at P2 in as-cast conditions. Highly compressive stress can be observed under GCW conditions as compared to NCW conditions. Whereas NCW conditions show that RSs in a compressive state are lessening due to the removal of junk material from the NCW conditions, as observed in Figure 11(A). It is noticed that the RSs observed under NCW conditions are steady with slight fluctuations. Thus, elastic relaxation is due to junk material removed from the GCW conditions, which proves that after removal of the gating system, i.e., runners from GCW conditions, the material springs back to its original state. Figure 11(A) shows that GCW σmin. and σmax. principal stresses are to some extent in a compression and tension state of approximately -20 and 130 MPa, respectively, at a CSD of approximately 0.01 mm. Whereas NCW σmin. and σmax. principal stresses are 2 and 30 MPa, respectively, at a CSD of approximately 0.013mm and increase in compression state linearly as the casting depth increases, achieving a determined compressive stress state of approximately -611 and -241 MPa of CSD a of approximately 0.33 mm under GCW conditions, as observed in Figure 11(A).
Points of fluctuations start to show under GCW conditions as the CSD increases, reaching principal stresses flanked at CSD between 0.59 and 0.87 mm, observing RSs magnitudes of approximately 6 and 23 MPa, 6 and 23 MPa, respectively, on σmax. principal stresses. Whereas -22 and -95 MPa at CSD of approximately 0.87 mm on σmin. principal stresses. Thus, the increase in RSs is linear in a compressive state and continued to be steady at compressive regions below measured RS values of approximately -180MPa. Corresponding Von Mises and Tresca RSs shown in Figure 11(B) are noticed to be optimum near the casting surface under GCW conditions with computed RSs measured at approximately 140 and 149 MPa, respectively, at a CSD of approximately 0.01 mm. Whereas under NCW conditions, corresponding RSs of Von Mises and Tresca are approximately 29 and 30 MPa, respectively, at a CSD of approximately 0.013 mm. Furthermore, the corresponding RSs of Von Mises and Tresca are rising linearly as the CSD increases and computed at approximately 536 and 611 MPa, respectively, at a CSD of approximately 0.31 mm under GCW conditions. Whereas at NCW conditions, the corresponding Von Mises and Tresca RSs are to some extent established to rise slightly and are computed at approximately 159 and 180 MPa, respectively, at a CSD of approximately 0.167 mm.
It is further noticed that corresponding RSs under GCW conditions are lessening linearly with increasing casting surface, and Von Mises and Tresca are measured at approximately 170 and 190 MPa at approximately 0.4 mm CSD. Whereas under NCW conditions, the corresponding Von Mises and Tresca RSs show variations and start to be stable beneath 69 MPa. Finally, GCW conditions both corresponding Von Mises and Tresca RSs rise and lessen as the casting surface increases, reaching 61 MPa at approximately 0.45 mm CSD. Corresponding Von Mises and Tresca RSs rise and lessen to some extent as the casting surface increases, reaching 25 and 30 MPa, 132 and 151 MPa at CSD of approximately 0.87 mm, respectively. Therefore, corresponding Von Mises and Tresca RSs are fully relieved during the removal of junk material from the NCW conditions, as revealed in Figure 11(B) within P1 and P2, respectively. While it is established that RS magnitudes established within the S/B casting component present a series of experiments that are greater and stable, respectively.
3.4.2.3. Residual Stresses Under GCW Conditions at P1 and P2 in S/B
It is observed that Figure 12 below illustrates RS measurements at P1 and P2 under GCW conditions in as-cast conditions. While it is noted that during solidification and cooling processes, temperature gradients are established due to various casting section thicknesses, thus leading to variances in the rate of contraction on various casting sections within casting components while consequential RSs are generated within casting components, especially under GCW conditions. Usually, temperature variances are due to dissimilarities in casting size within cross-sectional areas and due to the distance of the liquid metal from the heads and gates [8,15]. During solidification and cooling processes, there exist temperature differences and are the chief source of RS formation on casting components.
Thus, an attempt to lessen the temperature differences within casting during solidification and cooling will lead to lessening of RS [8,15,28]. When casting components are separated and removed from sand moulds, such as casting shakeout processes, casting strains rise due to high Cr-iron having imperfect and/or limited yield points and limited ductility. However, minor plastic strains at all stress levels are experienced on casting components. Thus, the strains signify plastic and elastic deformation [8,15]. The RSs shown in Figure 12(A) are illustrations of RSs and distributions that are noticed to be optimum near casting surfaces at P2 compared to P1. In addition, tensile stresses are noticed to be within P1, while P2 illustrates minimal compressive RSs. Therefore, at a CSD of approximately 0.6mm until optimum CSD, RSs are noticed to be in a tensile state at P2, while at P1 they are in a compressive stress state.
Furthermore, Figure 12(B) reveals computed RSs of Von Mises and Tresca, which reveal optimum magnitudes near casting surfaces, i.e., 0.29 mm within P2, while P1 reveals optimum RSs after 0.29 mm till it reaches optimum CSD. Computed RSs of Von Mises and Tresca as presented in Figure 12(B) are approximately 140 and 149 MPa at CSD of 0.01 mm, while both computed RSs rise linearly, reaching 1102 and 1122 MPa at P1 and at CSD of approximately 0.44 mm, respectively. It is noticed that P2 computed Von Mises and Tresca RSs reaches 511 and 577 MPa, respectively, at a CSD of 0.29 mm. In addition, computed Von Mises and Tresca stresses are lessening linearly with rising CSD, reaching 199 and 212 MPa at CSD of approximately 0.60 mm within P1, while within P2 reaches similar RS distribution of approximately 61 MPa at CSD of approximately 0.45 mm.
Computed Von Mises and Tresca RSs rise as the CSD increases, reaching 426 and 490 MPa at a CSD of approximately 0.68 mm, and lessening, reaching minimal magnitudes at a CSD of approximately 0.92 mm with computed magnitudes of approximately 61 and 64 MPa within P1. While P2 rises to some extent and lessens reaching minimal magnitudes of approximately 25 and 28 MPa of computed RSs of Von Mises and Tresca, respectively, at CSD of approximately 087mm. Since it is noticed that near-casting surface RSs are optimum within P1, while within inner casting surfaces at P2 are optimum. Therefore, it is concluded that the obtained results during casting shakeout processes of high Cr-irons at optimum temperatures establish optimum magnitudes of tensile stresses within P1 as compared to P2 with compressive stress states. Akhtar [26] cited that air cooling introduces extensive added RS, while [85] cited that casting modules show a significant part in RS matter and that RS rises as ductility lessens.
3.4.2.4. Residual Stresses Under NCW Conditions at P1 and P2 in S/B
Alipooramirabad et al. [29] in their studies cited that the transformation among casting section thicknesses, i.e., P1 and P2 RS state and distribution curves, is established from variations in size and weight of various casting sections, which have an impact on the solidification and cooling rates, thus variations in thermal gradients. Thus, Figure 13 below reveals equivalent principal stresses computed, leading to Von Mises and Tresca RSs magnitudes between P1 and P2 under NCW conditions in as-cast conditions. Whereas Figure 13(A) illustrates σmin. and σmax. principal stresses at P1 measured at approximately 215 and 163 MPa at CSD of approximately 0.025 mm and at P2 RSs measured at approximately 2 and 3 MPa at CSD approximately 0.013 mm, respectively. Additionally, σmin. and σmax. principal stresses lessen linearly with rising CSD, reaching an optimum of approximately -152 and -134 MPa at CSD of approximately 0.225mm at P1. Additionally, σmin. and σmax. principal stresses at P2 RSs attain an optimum RS of approximately -180 MPa (0.116 mm) and -114 MPa (0.167 mm). While P1 and P2 principal stresses start to reveal elevated levels of instability with an increasing CSD. At CSD of 0.2 to 0.887 mm at P1, σmin. and σmax. principal stresses start to show variations of RSs of approximately -175 and -7 MPa, respectively.
Principal stresses, such as σmin. and σmax. at P2, show levels of variation between -169 and 42 MPa. Thus, it can be concluded that NCW RSs are relieved, since computed stresses reveal stability in the compressive region as shown in Figure 13(A). It is noticed near the casting surface, i.e., at CSD of approximately 0.025 and 0.013 mm as shown in Figure 13(B), that computed RSs of Von Mises and Tresca are approximately 328 and 378 MPa at P1, while at P2 they are computed at 29 and 30 MPa, respectively. In addition, at P1, computed Von Mises and Tresca RSs are lessening linearly with increasing CSD, reaching RSs of approximately 199 and 229 MPa at approximately 0.175 mm, respectively. While at P2, computed Von Mises and Tresca RSs rise as the CSD rises, reaching 159 and 180 MPa at approximately 0.167 mm, respectively. Figure 13(B) reveals that corresponding Von Mises and Tresca RSs are lessening linearly and start to show variations with increasing CSD at P1, whereas at P2 to some extent reveals slight variations and become stable and lessening and rise slightly.
Thus, it can be concluded that at P1, computed RSs attain optimum magnitudes up to CSD of approximately 0.32 mm as compared to P2. In addition, at P1, corresponding Von Mises and Tresca RSs are computed to some extent greater and computed between 80 and 172 MPa, whereas at P2 they are computed at 111 and 123 MPa, respectively. Thus, the degree of RS relaxation and/or relief is neither tough to envisage, and the remaining course of action is to adopt that easing takes place after removal of junk material from NCW conditions. While greater magnitudes of RSs are established at P1 as compared to P2 within NCW conditions in as-cast conditions.
3.4.3. Residual Stresses on S/A and S/B
The distribution of RS in hypoeutectic alloys of HCWCI disturbs mechanical and fatigue properties, respectively. Whereas solidification and cooling conditions, such as time and manufacturing parameters, such as casting shake-out temperature and knockout time, affect the state of RS and can be of great understanding, particularly in a manufacturing environment, i.e., the foundry industry, and for product quality. In addition, during casting processes, sand moulds plus cores are additionally a restriction to the deformation and thermal contraction overall. Thus, leading to stress and/or relaxation of the casting component [8,29,86]. During the casting process in the current study, RS are established due to solidification and cooling processes, whereas the knockout of junk material from NCW conditions on GCW conditions adjust the stress state and RS distribution. Furthermore, casting shakeout at dissimilar temperatures leads to higher RS quantities on hypoeutectic alloys of HCWCI alloys.
3.4.3.1. Residual Stresses at P1 of GCW Conditions on S/A and S/B
S/A and S/B cast component’s RS state and distributions attained during RS measurement using incremental HDM on casting components shakeout at lower and higher temperatures, i.e., 60 and 180°C, respectively, are shown in Figure 14 below. Figure 14(A) shows that S/A and S/B cast component’s RS states are to some extent in tensile and compressive stress states of approximately -313 and 30 MPa, -103 and -48 MPa at CSD of approximately 0.025 and 0.04 mm, respectively, on σmin. and σmax. principal stresses. Thus, the S/A and S/B cast component’s RS state deviates linearly as the CSD increases towards the casting inner layers. In addition, S/A and S/B cast components σmin. and σmax. principal stresses are showing higher magnitudes of approximately -141 and -65 MPa, 43 and 63 MPa, respectively, at approximately casting depths between 0.36 and 0.44 mm at inner layers. Whereas from a CSD of approximately 0.6 mm to maximum surface depth on S/A and S/B cast components, RS states are completely in a compressive state. Thus, the S/A casting component RS shows lower magnitudes as compared to the S/B casting component RS state. The higher magnitude of RS is established on the S/B casting component as compared to the S/A casting component due to higher casting shakeout temperatures, i.e., 180oC which are accompanied by fast cooling rates from casting temperatures of approximately 180°C as compared to 60°C. Higher casting shakeout temperatures, such as 180°C can be compared to the quenching process, which normally leads to higher RSs, especially tensile stress on the casting surfaces. Hence, higher casting shakeout temperatures are leading to higher temperature gradients from the surface to the core of the casting, coupled with solid contraction. These higher temperature gradients experienced by the casting component lead to higher tensile RSs within the surface and increase as the CSD increases and are lessening as the surface approaches the core of the casting component, thus transforming to a different stress state, i.e., compressive stresses when approaching the centre of the casting component, as can be observed in Figure 14(A).
The magnitude of tensile stresses, which were established at earlier stages of fast cooling, remains within the casting component even at room temperature, thus leading to higher magnitudes of tensile stresses within the surface and steady RS within the core of the casting. Whereas casting shakeout temperatures at lower temperatures, such as 60oC and/or at ambient temperatures, are developing a steady state of RSs, which is due to controlled cooling, i.e., reduced cooling rates.
While, reducing the temperature gradient in the final stages of cooling, since the casting cools within a sand mould as compared to normal air cooling, i.e., slower cooling rates, which is similar to full annealing thermal processes. Thus, relieving or reducing the higher RS magnitude of the casting component. S/A and S/B cast products component plastic flow behaviour is observed within computed RSs of Von Mises and Tresca distributions as shown in Figure 14(B). Figure 14(B) illustrates that computed RSs near casting surfaces within S/A cast products are optimum compared to S/B casting components, which are only showing optimum magnitudes within inner surfaces and at optimum CSD. The S/A casting component is noticed to reveal optimum RSs compared to the S/B casting component due to relieved RSs magnitudes, which is a result of the slow cooling process in the sand mould compared to fast cooling. In addition, optimum plastic flow has inadequate elastic performance, while minimal plastic performance is accompanied by optimum elastic performance due to the casting component being restrained as a result of the removal of junk material under GCW being relieved. It is noticed that the corresponding Von Mises and Tresca at the S/A casting component are computed at approximately 271 and 313 MPa at approximately 0.025 mm near casting surfaces, whereas within the S/B casting component, it is computed at approximately 89 and 103 MPa at a CSD of approximately 0.04 mm, respectively.
Moreover, it is noticed that as the CSD rises, computed RSs of Von Mises and Tresca deviate linearly within S/A and S/B cast products, i.e., cast components with computed stresses of Von Mises and Tresca lessening, thus reaching 29 and 33 MPa at CSD of approximately 0.175 mm, respectively. Whereas Von Mises and Tresca RSS within the S/B casting component rise and lessen to some extent, reaching 109 and 125 MPa at a CSD of approximately 0.2 mm, respectively. However, S/A casting component computed Von Mises and Tresca RSs continue to be in a stable state at CSD of approximately 0.875 mm between 30 and 33 MPa, 125 and 141 MPa, respectively. Whereas computed Von Mises and Tresca RSs within the S/B casting component rise linearly with rising CSD, reaching optimum RSs of approximately 1101 and 1058 MPa at approximately 0.36 to 0.44 mm, respectively. Furthermore, computed Von Mises and Tresca RSs within the S/B casting component lessened linearly with rising CSD, reaching minimal RSs of approximately 199 and 212 MPa at CSDs of approximately 0.60 mm, respectively. Finally, S/B casting component Von Mises and Tresca RSs are lessening with rising CSD, reaching minimal RSs of approximately 61 and 64 MPa at CSD of approximately 0.90 mm, respectively.
From the casting and casting shakeout processes, respectively, it is concluded that casting shakeout at optimum temperatures, creep is noticed. Since cooling periods are shortened owing to normal cooling, such as air cooling. Additionally, casting shakeout at approximately 180°C temperatures; time effects lessens owing to rapid cooling rates, thus establishing tensile stress at optimal levels within inner parts within the S/B casting component. Whereas casting shakeout at minimum temperatures, undeviating cooling rates are noticed owing to sand mould cooling leading to RSs relaxation and/or relief within the S/A casting component as shown in Figure 14. Akhtar [27] and Torres et al. [28] cited in their studies that owing to established temperature gradients prevailing from casting surfaces to inner surfaces of the casting component due to casting, solidification, and cooling processes, respectively. Ngqase et al. [8] cited that RSs occurring owing to casting, solidification, and cooling processes, respectively, led to reaching appreciable magnitudes. Therefore, it is concluded that maximum casting shakeout temperature established optimum magnitudes of RS within S/A and S/B cast products components with compressive and tensile RSs within GCW conditions.
3.4.3.2. Residual Stresses at P1 of NCW Conditions on S/A and S/B
Comparison of RSs amongst S/A and S/B cast product components at P1 are illustrated in Figure 15 below. It is noticed in Figure 15(A) that RSs in the S/A casting component are completely in a tensile stress state, whereas S/B casting components are completely in a compression stress state, and the evaluation is up to a CSD of approximately 0.275 mm. Figure 15(A) shows that near the casting surface, σmax. principal stresses amongst S/A and S/B cast product components are totally in a tensile state, while σmin. principal stresses are totally in a compressive state. Near the casting surface, σmin. and σmax. principal stresses magnitude, are restrained on S/A at approximately -30 and 150 MPa at CSD of approximately 0.025 mm, whereas S/B principal stresses on the casting component are evaluated at approximately -215 and 163MPa, respectively, as noticed in Figure 15(A).
Furthermore, it is noticed that as the casting depth rises, S/A and S/B cast product component RSs are rising linearly, whereas S/A principal stresses are evaluated at approximately 203 and 241 MPa at CSD of approximately 0.125 mm, and S/B casting component RSs are evaluated reaching maximum magnitudes of approximately -218 and -134 MPa on the casting surface of approximately 0.125 mm. Thus, σmin. and σmax. principal stresses are totally in tension and compressive stress states on both S/A and S/B cast product components, respectively. As well as the CSD rises, S/A and S/B RSs are lessening linearly in tensile and in compressive states, respectively. Whereas it is observed and noticed in S/A RSs lessening linearly in tensile stress state, reaching compressive stress state of approximately -474 and -113 MPa at CSD of approximately 0.275 mm and S/B RSs reaching to some extent compressive stress state of -135 and -21 MPa on σmin. and σmax., principal stresses, respectively. Finally, S/B RS on the casting component remains in a compressive stress state until it attains maximum CSD.
Additionally, Figure 15(B) reveals corresponding Von Mises and Tresca RSs on S/A and S/B cast product components within NCW conditions at P1. It is illustrated that S/B casting component computed Von Mises and Tresca RSs are optimum near casting surfaces with measured magnitudes of approximately 328 and 378 MPa and S/A casting component RSs measured at 164 and 180 MPa at CSD of approximately 0.025 mm, respectively. S/A and S/B cast product components computed RSs of Von Mises and Tresca rises and lessen, respectively, reaching RSs that are comparable in RS magnitudes at CSD of 0.075 and 0.175 mm. Finally, computed RSs of Von Mises and Tresca rise to some extent linearly, reaching 429 and 474 MPa at CSD of 0.275mm. Whereas S/B casting component computed Von Mises and Tresca RSs are lessening and revealing levels of variations of approximately 125 and 135 MPa at CSD of approximately 0.275 mm, respectively. Thus, it is noticed in Figure 15(B) that at a CSD of approximately 0.275 mm, computed RSs of Von Mises and Tresca within the S/B casting component are retained to some extent, lessening linearly as the CSD rises. Whereas S/A casting component Von Mises and Tresca RSs are retained and rise as the CSD rises till it reaches optimum depth. It can be concluded that from Figure 15(B), that RSs are relieved within the S/B casting component as compared to the S/A casting component at P1 under NCW conditions.
3.4.3.3. Residual Stresses at P2 of GCW Conditions on S/A and S/B
Measured RSs at P2 under GCW conditions are compared between S/A and S/B casting components as presented in Figure 16 below in as-cast state. It is noticed in Figure 16(A) that RS state and distribution on both alloys, i.e., S/A and S/B alloys, respectively, are parallel. However, a noticeable variation is noticed in the RS magnitudes, especially near the casting surface and within the inner casting surface, as observed in Figure 16(A). Whereas near the casting surface, tensile stress states are noticed on both S/A and S/B casting components, with S/A cast products showing higher magnitudes. Furthermore, it is noticed in Figure 16(A) that the RS state is completely in a compressive stress state within the casting surfaces, whereas it is completely in a tension stress state near the casting surfaces and completely between a tension and compressive stress state at the maximum surface depth on both S/A and S/B cast components, respectively. Thus, RS on S/A and S/B cast products are increasing compressive stress state as the casting surface increases and reaching a completely compressive stress state within the inner layers.
S/A and S/B casting components near the casting surface, RS were measured at approximately 0.0255 and 0.01 mm CSD with RS magnitudes of approximately 133 and 407 MPa, -20 and 130 MPa on σmin. and σmax. principal stresses, respectively. It is noticed on S/A and S/B cast products that there is an increase in compressive stress as the casting depth increases, attaining -180 and -158 MPa (0.125 mm), -611 and -241 MPa (0.31 mm) on σmin. and σmax. principal stresses, respectively. In addition, S/A cast product RS state and distribution are noticed to some extent flattening and in steady tensile stress state up to CSD of approximately 0.875 mm, thus attaining RSs of approximately 61 and 130 MPa on σmin. and σmax. principal stresses, respectively.
Whereas the S/B casting component RS state is displaying levels to some extent of fluctuations amongst CSD of approximately 0.59 and 0.69 mm with RS measurements with magnitudes of approximately 70 and 23 MPa, 51, and – 86 MPa on σmin. and σmax. principal stresses, respectively. Lastly, S/B cast product RS stress states to some extents are flattening till the CSD of approximately 0.870 mm with measured RS of approximately -22 and 6 MPa on σmin. and σmax. principal stresses, respectively. Von Mises and Tresca RSs shown in Figure 16(B) reveal that S/A casting component RSs are maximum as compared to S/B casting component near casting surfaces, thus reaching 140 and 149 MPa, 359 and 407 MPa, respectively, at approximately 0.025 mm CSD. Whereas as the CSD rises, corresponding RSs reach 103 and 118 MPa at approximately 0.075 mm on Von Mises and Tresca RSs within the S/A casting component as compared to the S/B casting component reaching 82 and 90 MPa at approximately 0.05 mm CSD.
It is noticed in Figure 16(B) that RSs escalate to some extent as the CSD rises within the S/A casting component, reaching 170 and 180 MPa at a CSD of approximately 0.125 mm, afterwards lessening as the CSD rises, and revealing to some extent instabilities till the optimum CSD of approximately 0.875 mm is reached with RS measurement measuring at approximately 112 and 130 MPa on Von Mises and Tresca RSs, respectively. In addition, computed RSs within the S/B casting component, Von Mises and Tresca RSs, rise linearly with rising CSD, reaching extremely optimum RSs of approximately 536 and 611 MPa at a CSD of approximately 0.31 mm, afterwards lessening with rising CSD reaching at least RSs of approximately 61 MPa with Von Mises and Tresca RSs. Whereas computed Von Mises and Tresca RSs within the S/B casting components rise to some extent, reaching 132 and 151 MPa at CSD of approximately 0.49 mm, afterwards to some extent start to level till it reaches an optimum CSD of approximately 0.870 mm with Von Mises and Tresca RSs reaching 23 and 28 MPa, respectively. Thus, the established RSs at P2 on NCW conditions reveal that RSs on hypoeutectic irons are comparable and only reveal variations in magnitudes. Whereas it can be concluded that the S/A casting component RS produces significantly minimum magnitudes of RSs as compared to the S/B casting component, which produces greater magnitudes of RSs distribution of compression state after casting shakeout at approximately 60 and 180°C, respectively.
3.4.3.4. Residual Stresses at P2 of NCW Conditions on S/A and S/B
Figure 17 below presents variations at P2 between S/A and S/B experimental casting, i.e., alloys under NCW conditions. The S/A casting component presents higher magnitudes of RS as compared to the S/B casting component. However, S/A and S/B cast components were measured up to a surface depth of approximately 0.138 and 0.870 mm, respectively. Near the surface, the RS measured were tensile stresses with approximately 427 and 534 MPa at a surface depth of approximately 0.012 mm of σmin. and σmax. principal stresses, respectively. S/A cast product RS increases in tensile stresses, thus reaching maximum magnitudes of approximately 665 and 958 MPa at the surface depth of approximately 0.037 mm. In addition, Figure 17(A) displays that as the surface depth increases on the S/A cast product, tensile stresses continue to increase in magnitude, thus reaching maximum magnitudes of approximately 705 MPa of σmax. principal stresses at the surface of approximately 0.138 mm, whereas compressive stresses were noticed to be approximately -105 MPa of σmin. principal stresses. Different degrees of plastic deformation on the metal surface can result in variations in RS and microstructure properties [87].
Furthermore, RS on S/B cast products as compared to S/A cast products was noticed in Figure 17(A) to be in a compressive steady state from the surface up to approximately 0.870 mm. Whereas the minimum and maximum magnitude of fluctuation are measured at approximately -180 and 2 MPa of σmin. and σmax. principal stresses, respectively, on the S/B cast product as shown in Figure 17(A). Thus, RS is higher in magnitudes on the S/A cast product as compared to the S/B cast product. Figure 17(B) reveals that Von Mises and Tresca RSs are maximum on S/A casting components as compared to S/B casting components. Whereas S/A Von Mises and Tresca RSs are rising linearly as the CSD increases, reaching optimum RSs between 492 – 1970 MPa.
Furthermore, S/B casting component RSs, Von Mises, and Tresca are noticed to be stable and minimum, i.e., 150 MPa within the inner CSD. Thus, it is concluded that in-cast state, RSs under NCW and GCW conditions are established to relay on cooling rate during solidification and cooling stages and shakeout casting temperatures. While casting temperature during the shakeout process, rely on the cooling rate established during solidification and cooling periods, which are established to be significantly reliant on the casting shakeout period and/or time, respectively. Additionally, throughout the casting process of casting components, liquid iron starts to be solid over a temperature range due to hypoeutectic high-Cr irons. In addition, the liquid iron is freezing and transforming to solid iron, RSs starting to be established due to denser and crystalline regularity existing as atomic prearrangement that is held by strong interatomic binding forces as compared to the liquid iron state [84].
Figure 17.
Comparison of S/A and S/B casting components in stress lattice cast products under NCW conditions at P2.
Figure 17.
Comparison of S/A and S/B casting components in stress lattice cast products under NCW conditions at P2.
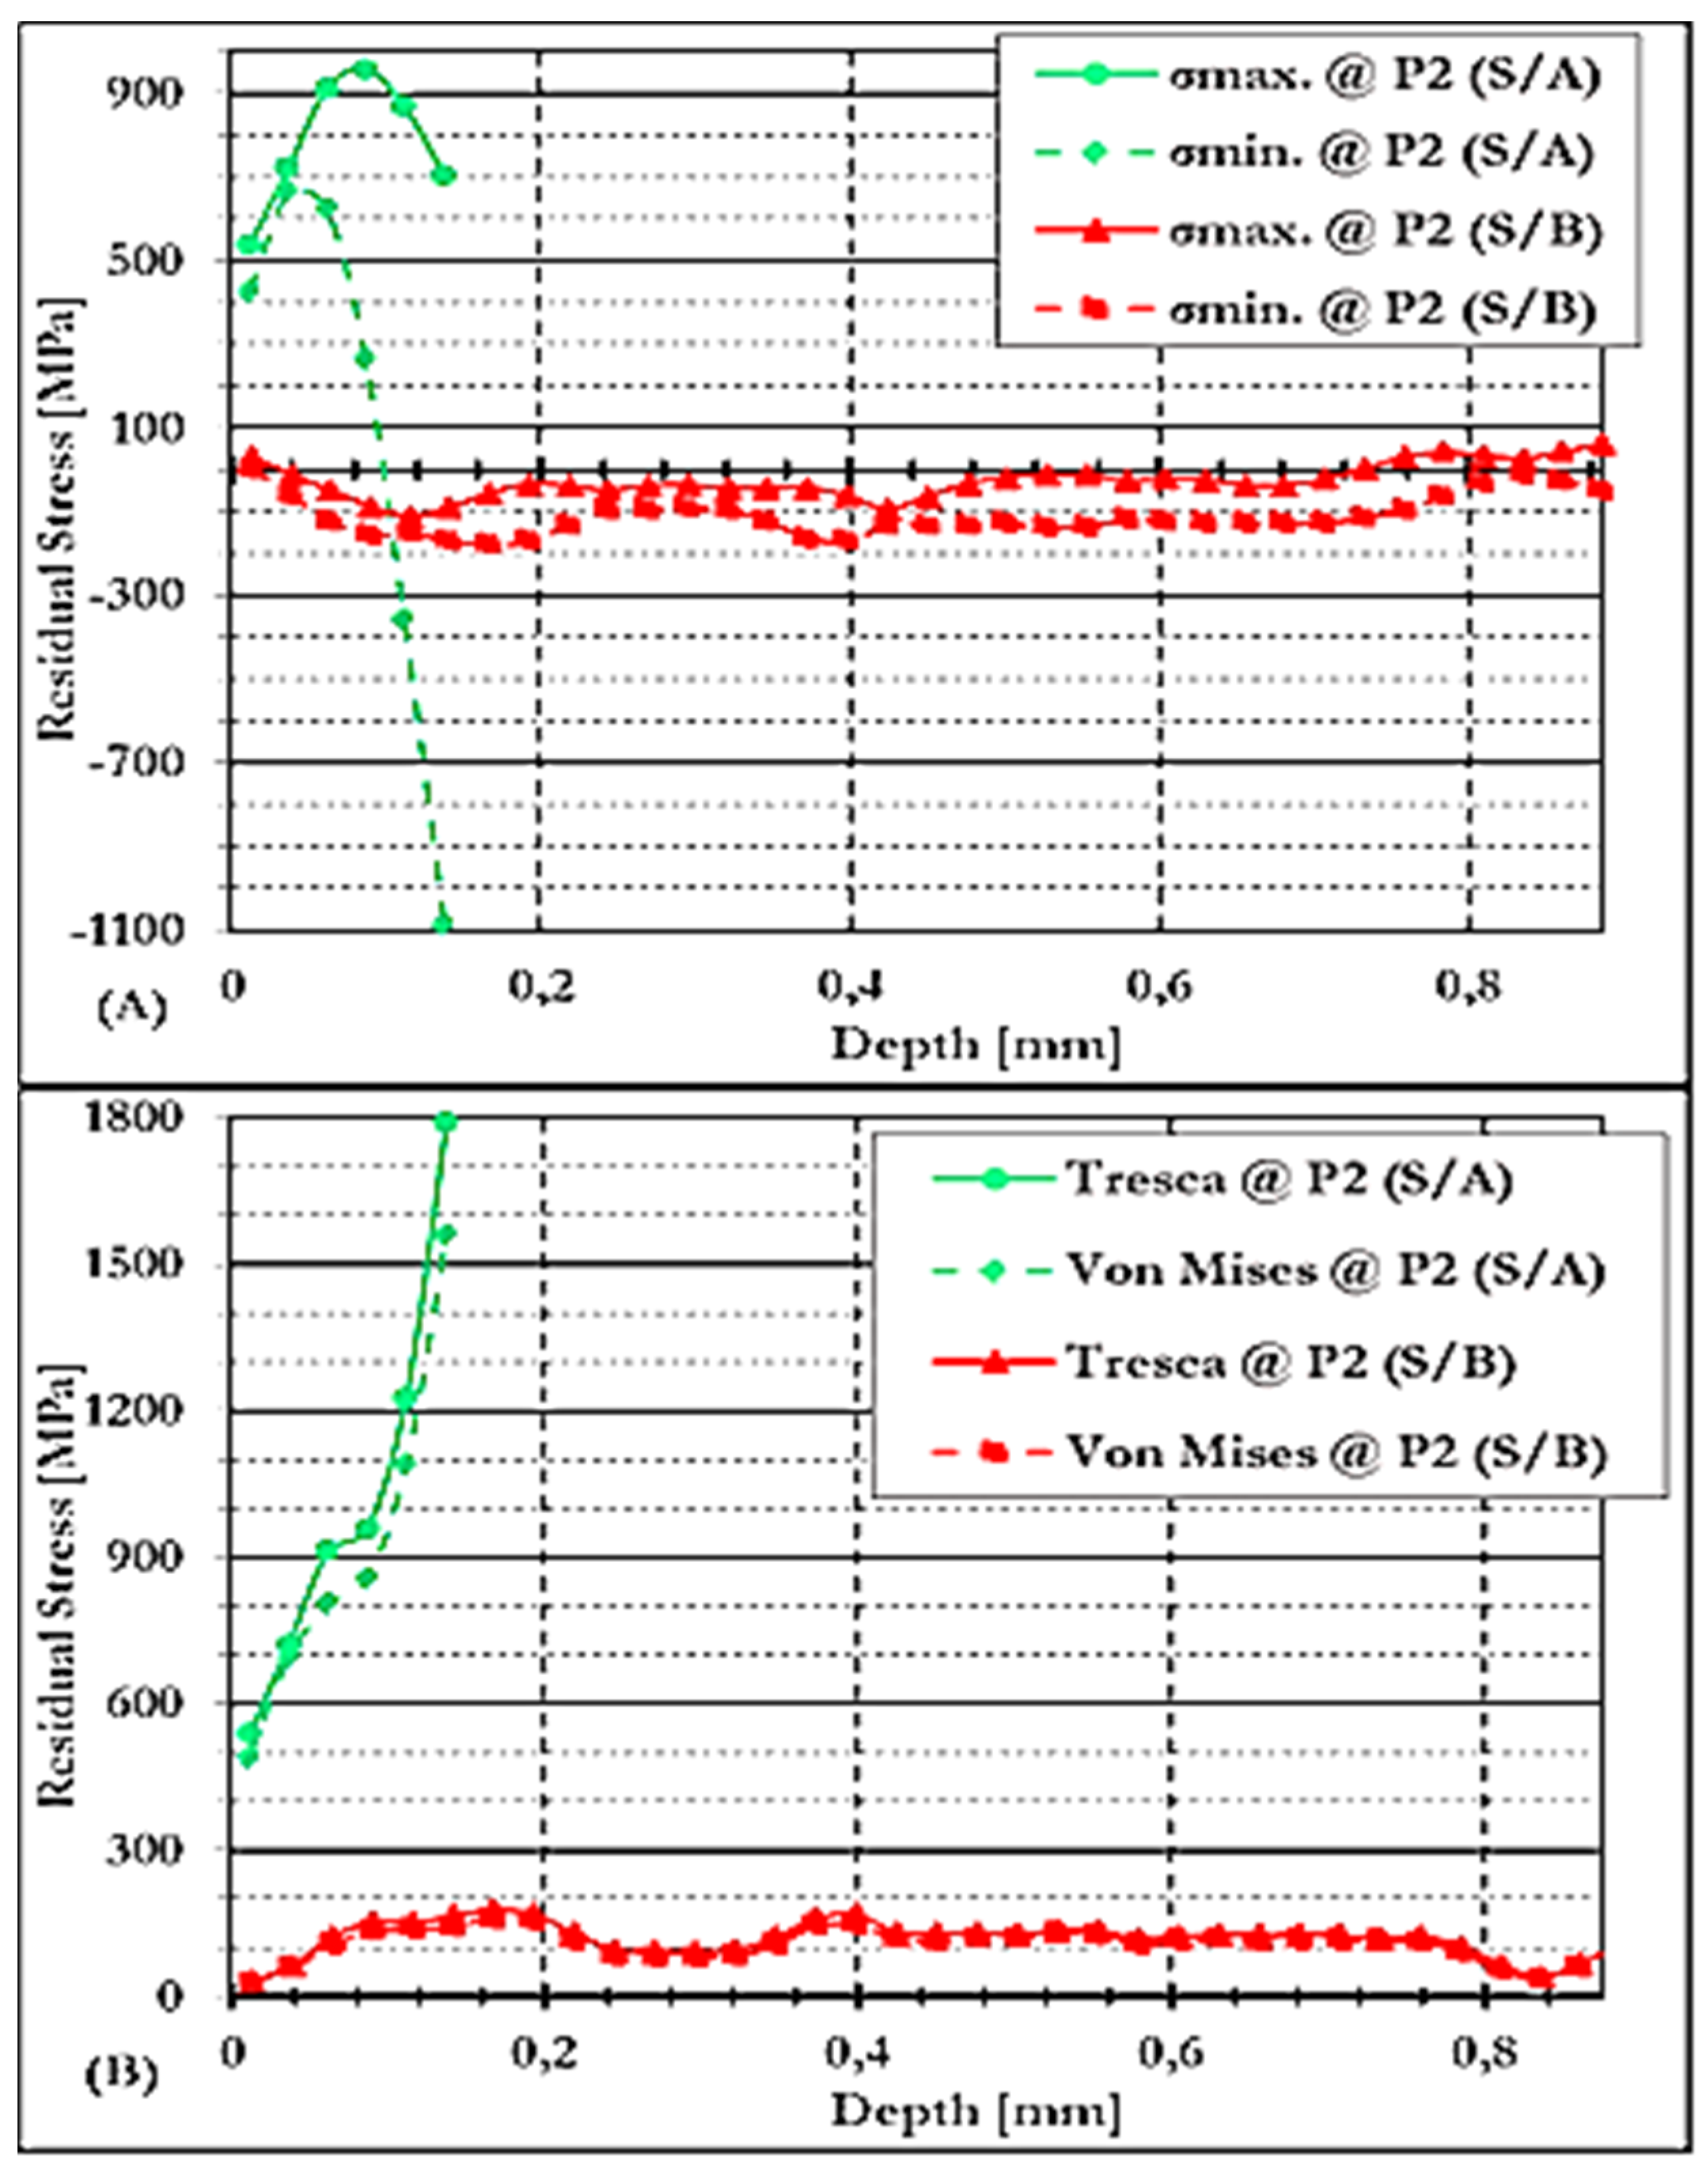
4. Conclusions
It was observed on the experimental castings shown above in Figure 1 and Figure 3, respectively, such as S/A and S/B stress lattice cast products, that tensile stresses were detected near the casting surface in as-cast conditions whereas in the internal layers, compressive stresses were detected as presented from Figure 6 to Figure 17. This is due to outer layers solidifying at faster cooling rates, thus establishing a casting skin within the interface between the sand mould and the mushy metal at the core, thus leading to a fully tension state in the external layers and a compression state in the core. Cores are normally solidifying last during solidification and cooling. Whereas the casting is still solidifying and cooling for a determined period. The feeder is feeding the casting component during solidification, the mushy metal when solidifying, pulls away from the sand mould. In addition, during solidification of the casting core, inner and outer layers experience contraction and pulling, respectively. For many years, experimental and numerical models for analysing mechanical components, i.e., casting/s on performance and design, have been widely used in industry. Thus, the results will lead to an improved design through the offering of beneficial understandings into critical areas of the casting during use and an enhancement of product quality. Removal of junk material from the NCW conditions led to the introduction and alteration of RSs on the casting component, whereas GCW RSs were introduced through solidification and cooling processes, leading to variations in thermal gradients. Thus, RSs were detected under GCW conditions after shakeout at different temperatures, i.e., 60 and 180°C, respectively.
There is no direct correlation between time and direct influence within the mechanical model, only indirect loading via thermal gradient. On the mechanical model, time has no direct impact, only indirect impact on the loading through thermal gradients. Time only starts to have impact and plays a significant part directly when cooling is slow or fast. Cooling fast led to conditions equivalent to the quenching process, whereas the cast product response is delicate to the strain degree, i.e., the response becomes viscoplastic as an alternative to plastic. Whereas cooling sluggishness led to circumstances observed in general heavy casting components, where thermal gradients are minimum and cooling period is more than enough for lessening of RSs to take place. Thus, time dependency is defined through creeps, whereas inelastic strain degree is correlated to RS stages [86]. Elevated varieties of material properties are observed after casting processes. In addition, stress lattice temperature profiles as shown in Figure 2 provides evidence that temperature gradients are more critical in the initial stages of solidification and cooling, while during latter stages, casting shakeout temperatures are more critical in the manufacturing of casting components. Hence, higher RS is obtained in the S/B stress lattice as compared to S/A stress lattice casting component.
Dimensional stability of the metallic component is influenced by major factors during casting processes. These are the steadiness of the micrographs and the regulators of the RS during cast products heat treatment processes [78]. Furthermore, hardness measurements established are higher than estimated hardness values from the ASTM A532 standard. This increase, such as 526 and 600 BHN in hardness values as per ASTM A532, i.e., 450 BHN [15], can be encouraged by casting shakeout temperatures, i.e., 60 and 180°C compared to normal as-cast ambient temperatures. Through shakeout processes, RS have a noticeable significance on the methods; the cast product distorts through solidification and cooling, respectively, to room temperatures. The contact fatigue life is significantly impacted by the manufacturing process path, which includes casting and heat treatment procedures, among other things. According to Xia et al. [17], the initiation of microcracks is caused by the microstress strength at the carbide contact. Additionally, Xia et al. [17] found that the macroscopic stress shift prior to and following martensitic transition is dominated by thermal strain and phase transformation strain. Significant thermal stress and microstructural alterations are brought on by cycles of differential heating and cooling. These modifications could affect the casting component’s overall strength, hardness, and ductility [88]. Thus, the following are conclusions that are based on the study findings, viz.:
- (1)
- Higher casting shakeout temperatures encourage optimum hardness values.
- (2)
- Non-uniform RS distribution is normally detected.
- (3)
- Thinner casting section thickness led to minimum magnitudes of RSs as compared to thicker section thickness, which introduced optimum RS magnitudes.
- (4)
- Separating and/or removing junk material from NCW led to a modification of RS state.
- (5)
- RSs within NCW are forever in the opposite direction of the GCW RS distribution.
- (6)
- Castings shakeout at elevated temperatures led to advanced tensile RSs.
- (7)
- Shakeout at elevated temperatures led to steady compressive RSs on NCW.
5. Future Work
To progress the consideration of RSs on casting components of HCWCI alloys, i.e., hypoeutectic and eutectic irons before and after removal of junk material after casting knock-off processes, the investigation studies can be sustained to validate through measuring more than ten casting components for validation purposes. While modelling of RSs before and after removal of junk material can be investigated further. Lastly, various RS measurements on HCWCI alloys can be investigated further to improve manufacturing process design and reduce scrap rate, which is related to RS and distortion casting defects. Since the present research study only focused on both gross and net casting components as compared to heat-treated and machined casting processes. While focusing on before and after heat treatment and machining processing RS measurement during casting design. Based on the initial results, the ultra-high-speed drilling method—which makes use of a compressed air turbine system and is commonly used in regular applications of the IHD techniques seem to be a good drilling method for HCWCI casting alloys. The depth distribution of the RSs in the HCWI casting sample was successfully determined. Additional experiments should be conducted to statistically corroborate the repeatability of the experimental results and the expected measurement errors.
Acknowledgments
The study was performed in South Africa (SA) at the University of Johannesburg (UJ) in the Department (Dep.) of Engineering Metallurgy. The author requests to show gratitude to the succeeding organisations and institutions that made it possible for this study: South African government organisations, such as the National Research Foundation (NRF), the Department of Trade and Industry (DTI), the National Foundry Technology Network (NFTN), the Department of Science and Technology (DST), and Mintek. Whereas private sector contributions that are acknowledged are Mitak Foundries (Pty) Ltd, Ametex (Pty) Ltd, and Scaw Metals SA for the research funding. In addition, Ametex (Pty) Ltd, Mintek, and Mitak Foundries (Pty) Ltd. are extremely cherished for allowing the use of their facility and equipment. Whereas for RS measurements, Wits University School of Mechanical, Industrial, and Aeronautical Engineering is highly treasured for allowing use of their facilities, i.e., the laboratory.
References
- Oh, J.-S., Song, Y.-G., Choi, B.-G., Bhamornsut, C., Nakkuntod, R., Jo, C.-Y. & Lee, J.-H., 2021. Effect of Dendrite Fraction on the M23C6 Precipitation Behavior and the Mechanical Properties of High Cr White Irons. Multidisciplinary Digital Publishing Institute (MDPI), Metals, 11(10), 3 October, 11(1576), p. 19. [CrossRef]
- Fashu, S. & Trabadelo, V., 2023. Development and Performance of High Chromium White Cast Irons (HCWCIs) for Wear-Corrosive Environments: A Critical Review. Metals, 13(1831), pp. 1 - 26. [CrossRef]
- Zhang, Y., Shimizu, k., Yaer, X., Kusumoto K. & Efremenko, V. G., 2017. Erosive Wear Performance of Heat Treated Multi-Component Cast Iron Containing Cr, V, Mn and Ni Eroded by Alumina Spheres at Elevated Temperatures. Wear, 390, pp. 1 - 20. [CrossRef]
- Pasini, W. M., Polkowski, W., Dudziak, T., dos Santos, C. A., & de Barcellos, V. K., 2025. Microstructure Formation and Dry Reciprocating Sliding Wear Response of High-Entropy Hypereutectic White Cast Irons. Metals, 15(4), pp. 1 - 10. [CrossRef]
- Islak, S., Ozorak, C., Kir, D., Kucuk, O., Akkas, M. & Sezgin, C. T., 2015. The Effect of Different Carbon Content on the Microstructural Characterization of High Chromium White Cast Irons. Karabuk, Turkey, s.n., p. 4.
- Li, H., Zhuang, M., Li, C., Wu, S. & Rong, S., 2018. Effect of Carbon Element Change on Microstructure and Properties of Fe-Cr-C Surfacing Alloy. Earth and Environmental Science, 186, p. 6.
- Tian, Y., Ju, J., Fu, H., Shengqiang M. S., Lin, J. & Lei, Y., 2019. Effect of Chromium Content on Microstructure, Hardness, and Wear Resistance of As-Cast Fe-Cr-B Alloy. Journal of Materials Engineering and Performance, 28, p. 11.
- Ngqase, M. Nheta, W., Madzivhandila, T., Phasha, M. & Pan, X., 2024. Exploring Residual Stress Analysis in the Machining of Hypoeutectic High Chromium White Cast Iron Alloys Through the Hole-Drilling Method. Engineering Research Express, 6(045414), pp. 1 - 19.
- Mabeba, A. D., 2021. Development of High Vanadium Grinding Media Materials for the Comminution of Gold Ore, Thesis, Pretoria, Republic of South Africa: University of Pretoria.
- Moema, J. S., 2018. The Role of Retained Austenite on the Performance of High Chromium White Cast Iron and Carbidic Austempered Nodular Iron for Grinding Ball Applications, Thesis, Pretoria, Republic of South Africa: University of Pretoria.
- Ngoc, Q. H. T., Diem, N. T. V., Hoang, V. N., Hong, H. N., Thu, H. L. & Duong, N. N., 2022. Effect of Residual Stress Distribution on the Formation, Growth and Coalescence of Voids of 27Cr White Cast Iron Under Impact. Materials Transactions, 63(2), pp. 170 - 175. [CrossRef]
- Motsumi, V. M., 2021. Investigation of the Micro- and Macroscopic Wear Properties of Cemented Tungsten Carbide for the Wear Lining Material Selection of Chutes, Thesis, Johanneburg: s.n.
- Ngqase, M. & Pan, X., 2019. Microstructural Investigation on Heat Treatment of Hypoeutectic High. s.l., Journal of Physics, IOP Publishing, p. 12.
- Tupaj, M., Orłowicz, A. W., Trytek, A., Mróz, M., Wnuk, G. & Dolata, A. J., 2020. The Effect of Cooling Conditions on Martensite Transformation Temperature and hardness of 15%Cr Chromium Cast Irons. Materials, 13(2760), p. 13. [CrossRef]
- Ngqase, M., 2018. Validation of Physical Properties of HCWCI Alloys Towards Comprehensive Process Simulation Capabilities, Doorfontein, Johannesburg, South Africa: Thesis, University of Johannesburg.
- González, J., Peral, L. B., Zafra, A. & Fernández-Pariente, I., 2019. Influence of Shot Peening Treatment in Erosion Wear Behavior of High Chromium White Cast Iron. Metals, 9(933), pp. 1 - 12. [CrossRef]
- Xia, T., Cui, P., Song, T., Liu, X., Liu, Y., & Zhu, J., 2025. An Investigation of Heat Treatment Residual Stress of Type I, II, III for 8Cr4Mo4V Steel Bearing Ring Using FEA-CPFEM-GPA Method. Metals, 15(548), pp. 1 - 20. [CrossRef]
- Baghani, A., Davami, P., Varahram, N. & Shabani, M. O., 2014. Investigation on the Effect of Mold Constraints and Cooling Rate on Residual Stress During the Sand-Casting Process of 1086 Steel by Employing a Thermomechanical Model. Metallurgical and Materials Transactions B, 45, p. 13. [CrossRef]
- Elmquist, L., Brehmer, A., Schmidt, P. & Israelsson, B., 2018. Residual Stresses in Cast Iron Components – Simulated Results Verified by Experimental Measurements. Material Science Forum, 925, pp. 326 - 333. [CrossRef]
- Chaudry, U. M., Tekumalla, S., Gupta, M., Jun, T. -S. & Hamad, K., 2022. Designing Highly Ductile Magnesium Alloys: Current Status and Future Challenges. Critical Reviews in Solid State and Materials Sciences, 47(2), pp. 194 - 281.
- Egan, P. F., 2023. Design for Additive Manufacturing: Recent Innovations and Future Directions. Design, 7(83), p. 32. [CrossRef]
- Wu, H., Sun, J., Peng, W., Yue, C., & Zhang, 2025. Coupled Analytical Model for Temperature-Phase Transition and Residual Stress in Hot-Rolled Coil Cooling Process. International Journal of Heat and Mass Transfer, 242(126864), pp. 1 - 27. [CrossRef]
- Samuel, E., Samuel, A. M., Songmene, V. & Samuel, F. H., 2023. A Review on the Analysis of Thermal and Thermodynamic Aspects of Grain Refinement of Aluminum-Silicon-Based Alloys. Materials, 16(5639), p. 29. [CrossRef]
- Nemyrovskyi, Y., Shepelenko, I. & Storchak, M., 2023. Plasticity Resource of Cast Iron at Deforming Broaching. Metals, 13(551), p. 19. [CrossRef]
- Gong, L., Fu, H. & Zhi, X., 2023. Corrosion Wear of Hypereutectic High Chromium Cast Iron: A Review. Metals, 13(308), p. 21. [CrossRef]
- Akhtar, R. A., 2017. A Study of Residual Stresses in Low Alloy Steel Theta Ring Casting, Sheffield, South Yorkshire, England: ProQuest.
- Yang, Y., 2020. Development of a Method to Measure Residual Stresses in Cast Components with Complex Geometries, Stockholm, Sweden: KTH.
- Torres, I. N., Gilles, G., Tchuindjang, J. T., Lecomte-Beckers, J., Sinnaeve, M. & Habraken, A. M., 2014. Study of Residual Stresses in Bimetallic Work Rolls. Advanced Materials Research,996, pp. 580 - 585. [CrossRef]
- Alipooramirabad, H., Kianfar, S., Paradowska, A. & Ghomashchi, R., 2024. Residual Stress Measurement in Engine Block - An Overview. The International Journal of Advanced Manufacturing Technology, 131, pp. 1 - 27.
- Tabatabaeian, A., Ghasem, H. R., Shokrieh, M. M., Marzbanrad, B., Baraheni, M. & Fotouhi, M., 2022. Residual Stress in Engineering Materials: A Review. Advanced Engineering Materials, 24(2100786), p. 28. [CrossRef]
- Akhtar, W., Lazoglu, I. & Liang, S. Y., 2022. Prediction and Control of Residual Stress-Based Distortions in the Machining of Aerospace Parts: A Review. Journal of Manufacturing Processes, 76, pp. 106 - 122. [CrossRef]
- Qutaba, S., Asmelash, M., Saptaji, K. & Azhari, A., 2022. A Review on Peening Processes and its Effect on Surfaces. The International Journal of Advanced Manufacturing Technology, 120, pp. 4233 - 4270.
- Franceschi, A., Stahl, J., Kock, C., Selbmann, R., Ortmann-Ishkina, S., Jobst, A., Merklein, M., Kuhfuß, B., Bergmann, M., Behrens, B. -A., Volk, W. & Groche, P., 2021. Strategies for Residual Stress Adjustment in Bulk Metal Forming. Archive of Applied Mechanics, 91, pp. 3557 - 3577.
- Hayama, M., Kikuchi, S., Tsukahara, M. & Misaka, Y., 2024. Estimation of Residual Stress Relaxation in Low Alloy Steel with Different Hardness during Fatigue by in Situ X-Ray Measurement. International Journal of Fatigue, 178, pp. 1 - 11. [CrossRef]
- Bastola, N., Jahan, M. P., Rangasamy, N. & Rakurty, C. S., 2023. A Review of the Residual Stress Generation in Metal Additive Manufacturing: Analysis of Cause, Measurement, Effects, and Prevention. Micromachines, 14(7), 1480, pp. 1 - 30. [CrossRef]
- Ammar, M. M. A. & Shirinzadeh, B., 2022. Evaluation of Robotic Fiber Placement Effect on Process-Induced Residual Stresses Using Incremental Hole-Drilling Method. Polymer Composites, 43, pp. 4417 - 4436. [CrossRef]
- Yesudhas, S., Levitas, V. I., Lin, F., Pandey, K. K., & Smith, J. S., 2024. Unusual Plastic Strain-Induced Phase Transformation Phenomena in Silicon. Nature Communications, 15(7054), p. 13. [CrossRef]
- Mohamed, S. S., Samuel, A. M. & Samuel, F. H., 2018. Development of Residual Stresses in Al–Si Engine Blocks Subjected to Different Metallurgical Parameters. International Journal of Metal Casting, p. 13. [CrossRef]
- Nenchev, B., 2020. Modeling and Analysis of Solidification Shrinkage and Defect Prediction in Metals, Leicester, England: s.n.
- Soar, P., Kao, A., Djambazov, G., Shevchenko, N., Eckert, S. & Pericleous, K., 2020. The Integration of Structural Mechanics into Microstructure Solidification Modelling. Materials Science and Engineering, 861, p. 9.
- Wang, G.-H. & Li, Y.-X., 2020. Thermal conductivity of cast iron - A Review. Special Review, 17(2), pp. 85 - 95. [CrossRef]
- Fang, Q., Zhao, P., Li, J., Wu, H., & Peng, J., 2025. Unveiling Temperature Distribution and Residual Stress Evolution of Additively Manufactured Ti6Al4V Alloy: A Thermomechanical Finite Element Simulation. Metals, 15(83), pp. 1 - 18. [CrossRef]
- Malik, I., Sani, A. A. & Medi, A., 2020. Study on using Casting Simulation Software for Design and Analysis of Riser Shapes in a Solidifying Casting Component. Journal of Physics: Conference Series, 1500, pp. 1 - 7.
- Pant, G., Reddy, M. S. S., Praveen, Parashar, A. K., Kareem, S. A. & Nijhawan, G., 2023. Advanced Casting Techniques for Complex-Shaped Components: Design, Simulation and Process Control. ICMPC, 430, pp. 1 - 10.
- Donghong, W., Yu, J., Yang, C., Hao, X., Zhang, L. & Peng, Y., 2022. Dimensional Control of Ring-to-Ring Casting with a Data-Driven Approach During Investment Casting. The International Journal of Advanced Manufacturing Technology, 119, pp. 691 - 704. [CrossRef]
- Prikhod’ko, O. G., Deev, V. B., Prusov, E. S. & Kutsenko, A. I., 2020. Influence of Thermophysical Characteristics of Alloy and Mold Material on Casting Solidification Rate. Steel in Translation, 50(5), pp. 296 - 302. [CrossRef]
- Xu, J., Kang, J., Shangguan, H., Deng, C., Hu, Y., Yi, J. & Mao, W., 2022. Chimney Structure of Hollow Sand Mold for Casting Solidification. Metals, 12(415), p. 17. [CrossRef]
- Gurusamy, P., Bhattacharjee, B., Dutta, H. & Bhowmik, A., 2024. Study of Microstructural, Machining and Tribological Behaviour of AA-6061/SiC MMC Fabricated Through the Squeeze Casting Method and Optimized the Machining Parameters by Using Standard Deviation-PROMETHEE Technique. Silicon, 16, pp. 675 - 686.
- Zhiguo, Z., Chengkai, Y., Peng, Z. & Wei, L., 2014. Microstructure and Wear Resistance of High Chromium Cast Iron Containing Niobium. Reaserch & Development, May, 11(3), pp. 179 - 184.
- Lundberg, M. & Elmquist, L., 2018. Hole Drilling Residual Stress Evaluations in Cast Iron. Jönköping, Sweden, ECRS-10, pp. 89 - 94.
- Venu, B. & Ramachandra, R., 2017. Simulation of Residual Stresses in Castings. International Journal of Scientific Research in Science and Technology, 3(8), pp. 875 - 890.
- Demirer, E., Pourasiabi, H. & Gates, J. D., 2022. Effects of Particle Impingement and Coarse Particle Abrasion on Wear Performance of White Cast Irons in Sliding Bed Applications. Society of Tribologists and Lubrication Engineers, 65(4), pp. 1 - 16. [CrossRef]
- Duflou, J. R., Wegener, K., Tekkaya, A. E., Hauschild, M., Bleicher, F., Yan, J. & Hendrickx, B., 2024. Efficiently Preserving Material Resources in Manufacturing: Industrial Symbiosis Revisited. CIRP Annals- Manufacturing Technology,73, pp. 695 - 721. [CrossRef]
- Alsaihati, A. & Elkatatny, S., 2023. A New Method for Drill Cuttings Size Estimation Based on Machine Learning Technique. Arabian Journal for Science and Engineering, 28, pp. 16739 - 16751. [CrossRef]
- Sivan, S. S. S., Mrinal, B. D. J., Natarajan, S. & Chauhan, N., 2018. Analysis of Residual Stresses, Thermal Stresses, Cutting Forces and other Output Responses of Face Milling Operations on ZE41 Magnesium Alloy. International Journal of Modern Manufacturing Technologies, X(1), pp. 92 - 100.
- Schröder, J., Evans, A., Mishurova, T., Ulbricht, A., Sprengel, M., Serrano-Munoz, I., Fritsch, T., Kromm, A., Kannengießer, T. & Bruno, G., 2021. Diffraction-Based Residual Stress Characterization in Laser Additive Manufacturing of Metals. Metals, 11(1830), p. 34. [CrossRef]
- Scafidi, M., Valentini, E., & Zuccarello, B. (2011). Error and Uncertainty Analysis of the Residual Stresses Computed by Using the Hole Drilling Method. Strain - An International Journal for Experimental Mechanics, 47, 301 - 312. [CrossRef]
- Oettel, R., 2000. The Determination of Uncertainties in Residual Stress Measurement (Using the Hole Drilling Technique). Standards Measurement & Testing Project, Dresden, Germany. [CrossRef]
- Richter, R., & Muller, T. (2017). Measurement of Residual Stresses - Determination of Measurement Uncertainty of the Hole-Drilling Method used in Aluminium Alloys. Exp Tech, 41, 79 – 85.
- Olson, M. D., DeWald, A. T., & Hill, M. R. (2021). Precision of Hole-Drilling Residual Stress Depth Profile Measurements and an Updated Uncertainty Estimator. Experimental Mechanics, 61, 549 – 564. [CrossRef]
- Lu, J., 1996. Handbook of Measurement of Residual Stresses.
- ASTM, E., 2013. 837-13a Standard Test Method for Determining Residual Stresses by the Hole-Drilling Strain-Gage Method. ASTM International, West Conshohocken.
- Gore B. and Nobre J.P., 2017. Effects of numerical methods on residual stress evaluation by the incremental hole-drilling technique using the integral method, Materials Research Proceedings, 2, pp. 587–592.
- Nobre, J.P., Guimaraes, R., Batista, A.C., Marques, M.J., Coelho, Nau, A., Scholtes, B., 2014. Evaluation of residual stresses induced by ultra-high-speed drilling in aluminium alloys, Materials Science Forum, 768-769, 128-135. [CrossRef]
- Flaman, M.T., 1982. Investigation of Ultra-High-Speed Drilling for Residual Stress Measurements by the Centre Hole Method, Experimental Mechanics, 22(1), pp. 26 - 30.
- Li, J., Xu, Y., Wang, H., Liu, Y., & Xu, Y., 2025. A Novel Model for Transformation-Induced Plasticity and Its Performance in Predicting Residual Stress in Quenched AISI 4140 Steel Cylinders. Metals, 15(450), pp. 1 - 19. [CrossRef]
- Mohsen, S. & Behrooz, A., 2022. A Review in Machining-Induced Residual Stress. 12(1), pp. 64 - 68.
- Guo, J., Fu, H., Pan, B. & Kang, R., 2021. Recent Progress of Residual Stress Measurement Methods: A Review. Chinese Journal of Aeronautics, 34(2), pp. 54 - 78. [CrossRef]
- Chiu, S. M.; Wu, C. Y.; Chuang, T. L.; Wang, K. K.; Ma, N. Y., 2015. The Microstructure and Residual Stress Analysis of Gray Casting by Ultrasonic Technique. Taipei, Taiwan, s.n., pp. 1 - 5.
- Mehr, F. F., Cockcroft, S. & Maijer, D., 2020. A Fully-Coupled Thermal-Stress Model to Predict the Behavior of the Casting-Chill Interface in an Engine Block Sand Casting Process. International Journal of Heat and Mass Transfer, 152, pp. 1 - 15. [CrossRef]
- Andriollo, T., Hellström, K., Sonne, M. R., Thorborg, J., Tiedje, N. & Hattel, J., 2018. Uncovering the Local Inelastic Interactions during Manufacture of Ductile Cast Iron: How the Substructure of the Graphite Particles can Induce Residual Stress Concentrations in the Matrix. Journal of the Mechanics and Physics of Solids, 111, pp. 333 - 357. [CrossRef]
- Smit, T. C., Nobre, J. P., Reid, R. G., Wu, T., Niendorf, T., Marais, D. & Venter, A. M., 2022. Assessment and Validation of Incremental Hole-Drilling Calculation Methods for Residual Stress Determination in Fiber-Metal Laminates. Advances in Residual Stress Technology, 62, pp. 1289 - 1304. [CrossRef]
- Barile, C., Casavola, C., Pappalettera, G. & Pappalettere, C., 2014. Remarks on Residual Stress Measurement by Hole-Drilling and Electronic Speckle Pattern Interferometry. The Scientific World Journal, 2014, pp. 1 - 7. [CrossRef]
- Ngqase, M. & Pan, X., 2020. An Overview on Types of White Cast Irons and High Chromium White Cast Irons. International Conference on Multifunctional Materials (ICMM-2019) - Journal of Physics: Conference Series, p. 13.
- Ngqase, M. & Pan, X., 2020. XRD Investigation on Heat Treatment of High Chrome White Cast Irons. s.l., Journal of Physics, IO Pushiling, p. 11.
- Seidu, S. O., Oloruntoba, D. T. & Otunniyi, I. O., 2014. Effect of Shakeout Time on Microstructure and Hardness Properties of Grey Cast Iron. Journal of Minerals and Materials Characterization and Engineering, 2, pp. 346 - 350. [CrossRef]
- Borle, S. D., 2014. Microstructural Characterisation of Chromium Carbide Overlays and a Study of Alternative Welding Processes for Industrial Wear Applications, Phd Thesis, Admonton, Alberta: Spring.
- Zhang, Y. B., Andriollo, T., Fæster, S., Liu, W., Hattel, J. & Barabash, R. I., 2016. Three-Dimensional Local Residual Stress and Orientation Gradients Near Graphite Nodules in Ductile Cast Iron. Acta Materialia, 121, pp. 173 - 180. [CrossRef]
- Milenin, A., Kustra, P., Kuziak, R. & Pietrzyk, M., 2014. Model of Residual Stresses in Hot-Rolled Sheets with Taking into Account Relaxation Process and Phase Transformation. Procedia Engineering, 81, pp. 108 - 113. [CrossRef]
- Song, J., Huang, Y., Gan, W. & Hort, N., 2014. Residual Stresses of the As-Cast Mg-xCa Alloys with Hot Sprues by Neutron Diffraction. Advanced Materials Research, 996, pp. 592 - 597. [CrossRef]
- Wang, C., Zheng, R., Liu, X., Li, M., & Chen, D., 2025. Effect of Heat Treatment on Microstructure and Residual Stress of a Nickel-Cobalt-Based Superalloy Produced by Laser Powder Bed Fusion. Metals, 15(405), pp. 1 - 22. [CrossRef]
- Keste, A. A., Gawande, H. S. & Sarkar, C., 2016. Design Optimization of Precision Casting for Residual Stress Reduction. Journal of Computational Design and Engineering, 3, pp. 140 - 150. [CrossRef]
- Feng, Q., Zeng, Y., Li, J., Wang, Y., Tang, G. & Wang, Y., 2024. Effect of Carbides on Thermos-Plastic and Crack Initiation and Expansion of High-Carbon Chromium-Bearing Steel Castings. Metals, 14(335), pp. 1 - 19. [CrossRef]
- Li, X., Liu, J., Wu, H., Miao, K., Wu, H., & Li, R., 2024. Review Article: Research Progress of Residual Stress Measurement Methods. Heliyon,, 10(e28348), pp. 1 - 25.
- Sroka, J., 2021. Residual Stresses in lLarge Sizes Forgings, Sheffield, England: s.n.
- Lundberg, M., 2018. Residual Stresses, Fatigue and Deformation in Cast Iron, s.l.: LiU-Tryck.
- Zha, S., Zhang, H., Yang, J., Zhang, Z., Qi, X., & Zu, Q., 2025. Fatigue Threshold and Microstructure Characteristic of TC4 Titanium Alloy Processed by Laser Shock. Metals, 15(453), pp. 1 - 14. [CrossRef]
- Yelamasetti, B., Sushma, S. P., Mohammed, Z., Altammar, H., Khan, M. F., & Moinuddin, S. Q., 2025. Synergistic Effects of Thermal Cycles and Residual Stress on Microstructural Evolution and Mechanical Properties in Monel 400 and AISI 316L Weld Joints. Metals, 15(469), pp. 1 - 20. [CrossRef]
Figure 1.
Experimental stress lattice casting component after casting shakeout process under GCW conditions.
Figure 1.
Experimental stress lattice casting component after casting shakeout process under GCW conditions.
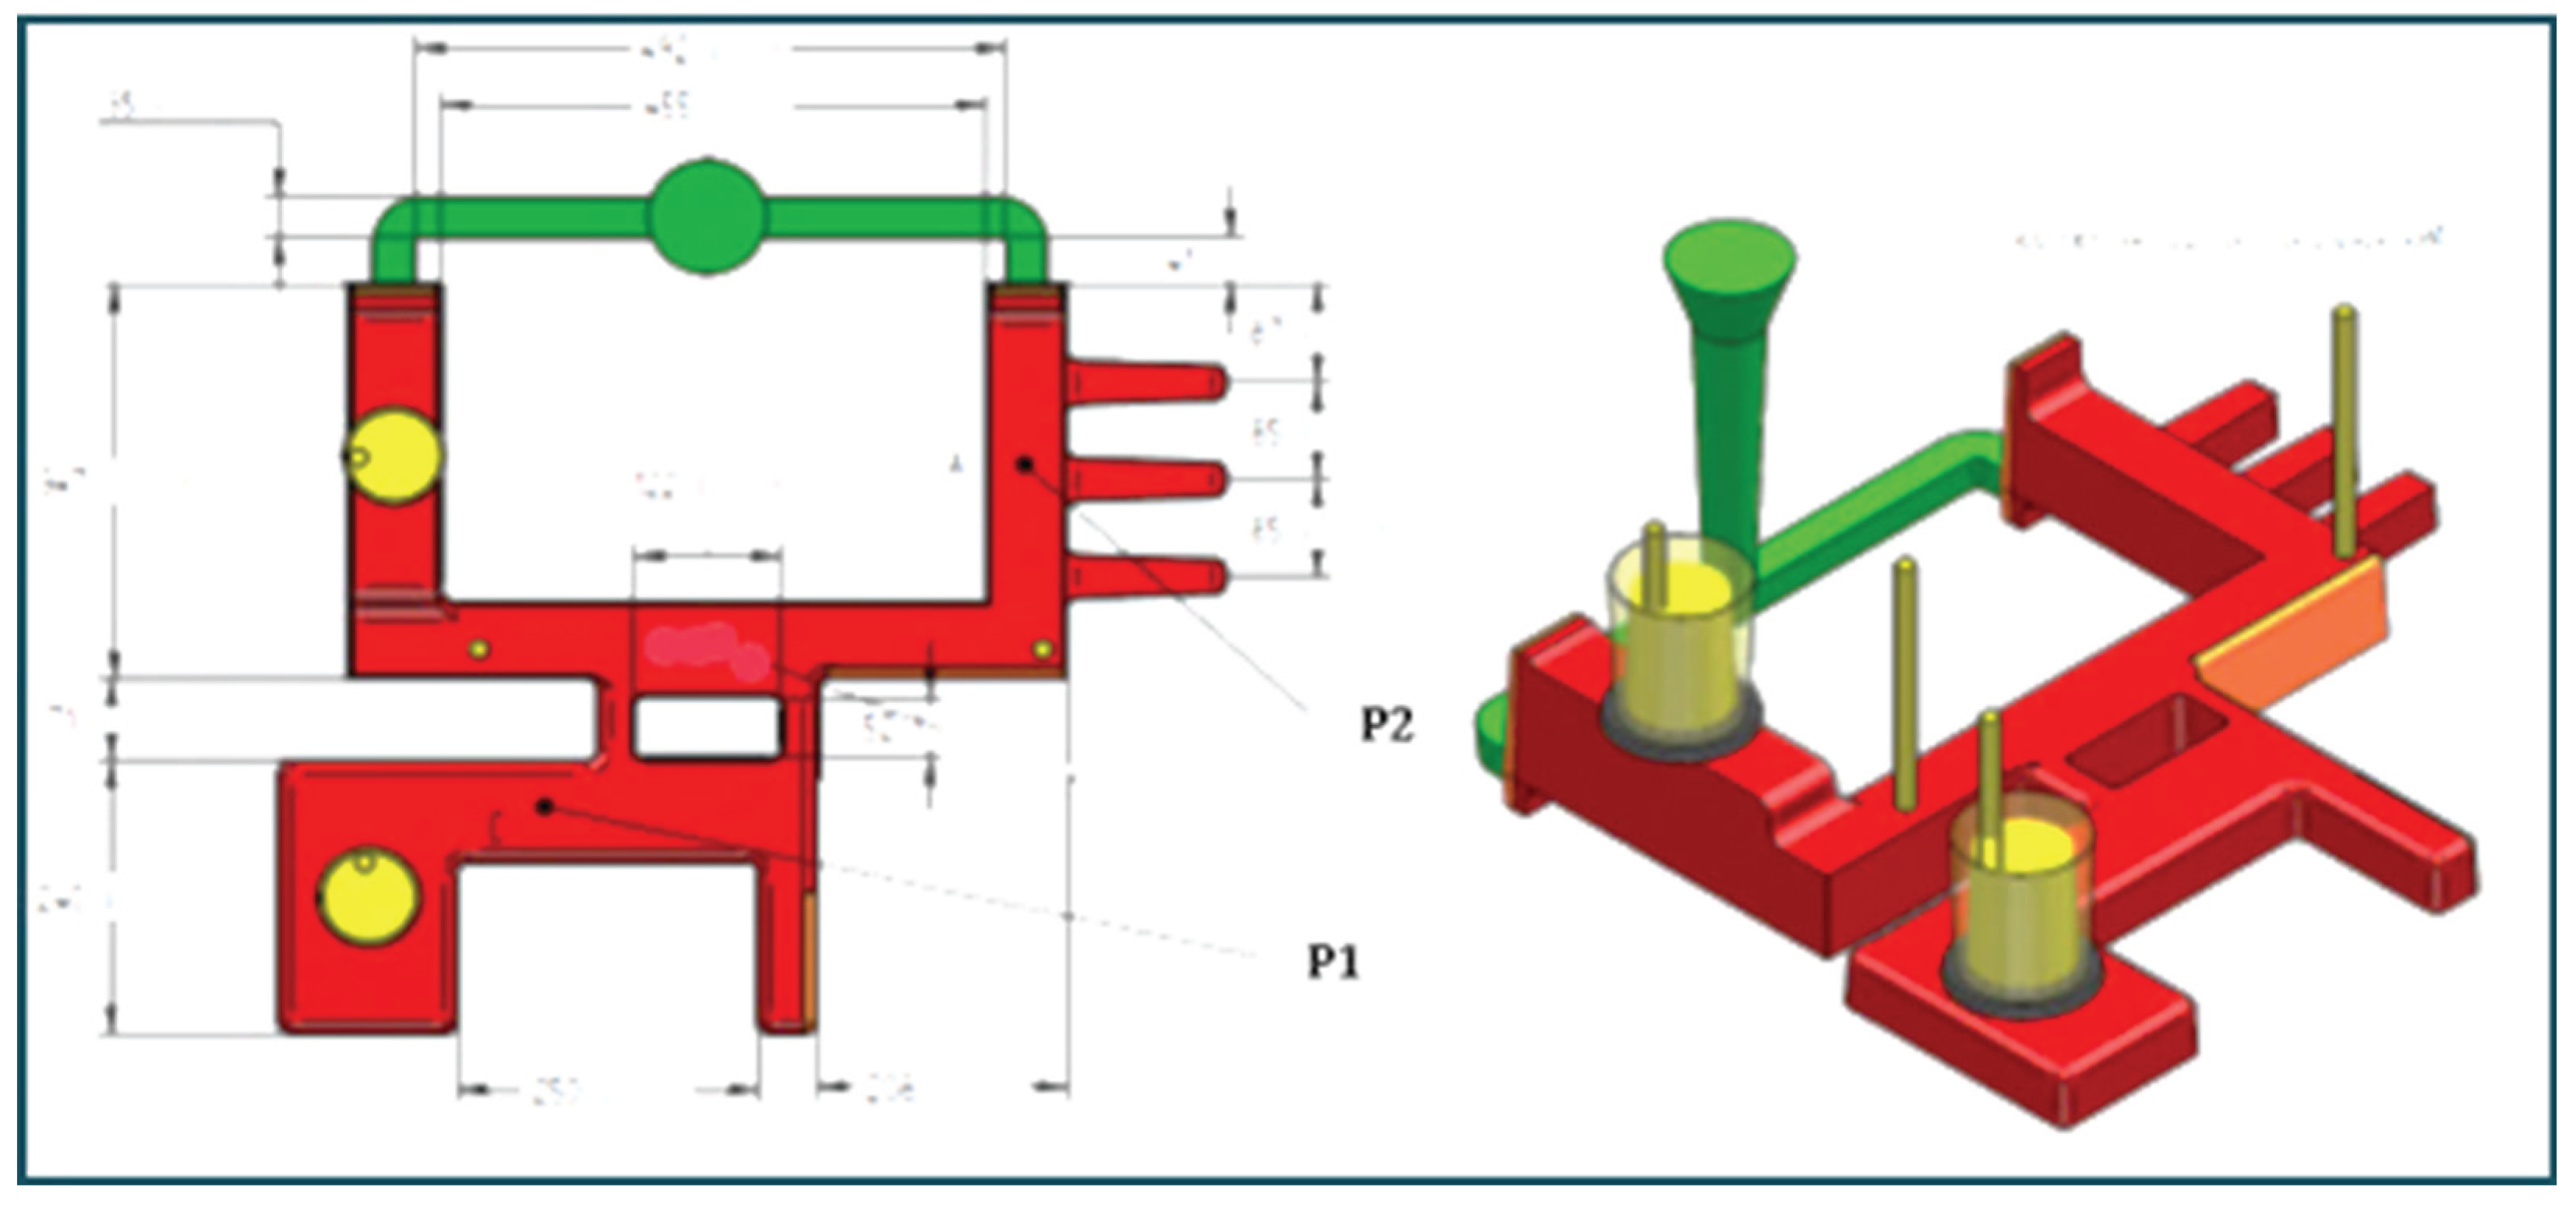
Figure 2.
Simulation analysis of experimental castings, S/A and S/B stress lattice casting’s temperature profile during solidification and cooling processes under GCW conditions.
Figure 2.
Simulation analysis of experimental castings, S/A and S/B stress lattice casting’s temperature profile during solidification and cooling processes under GCW conditions.
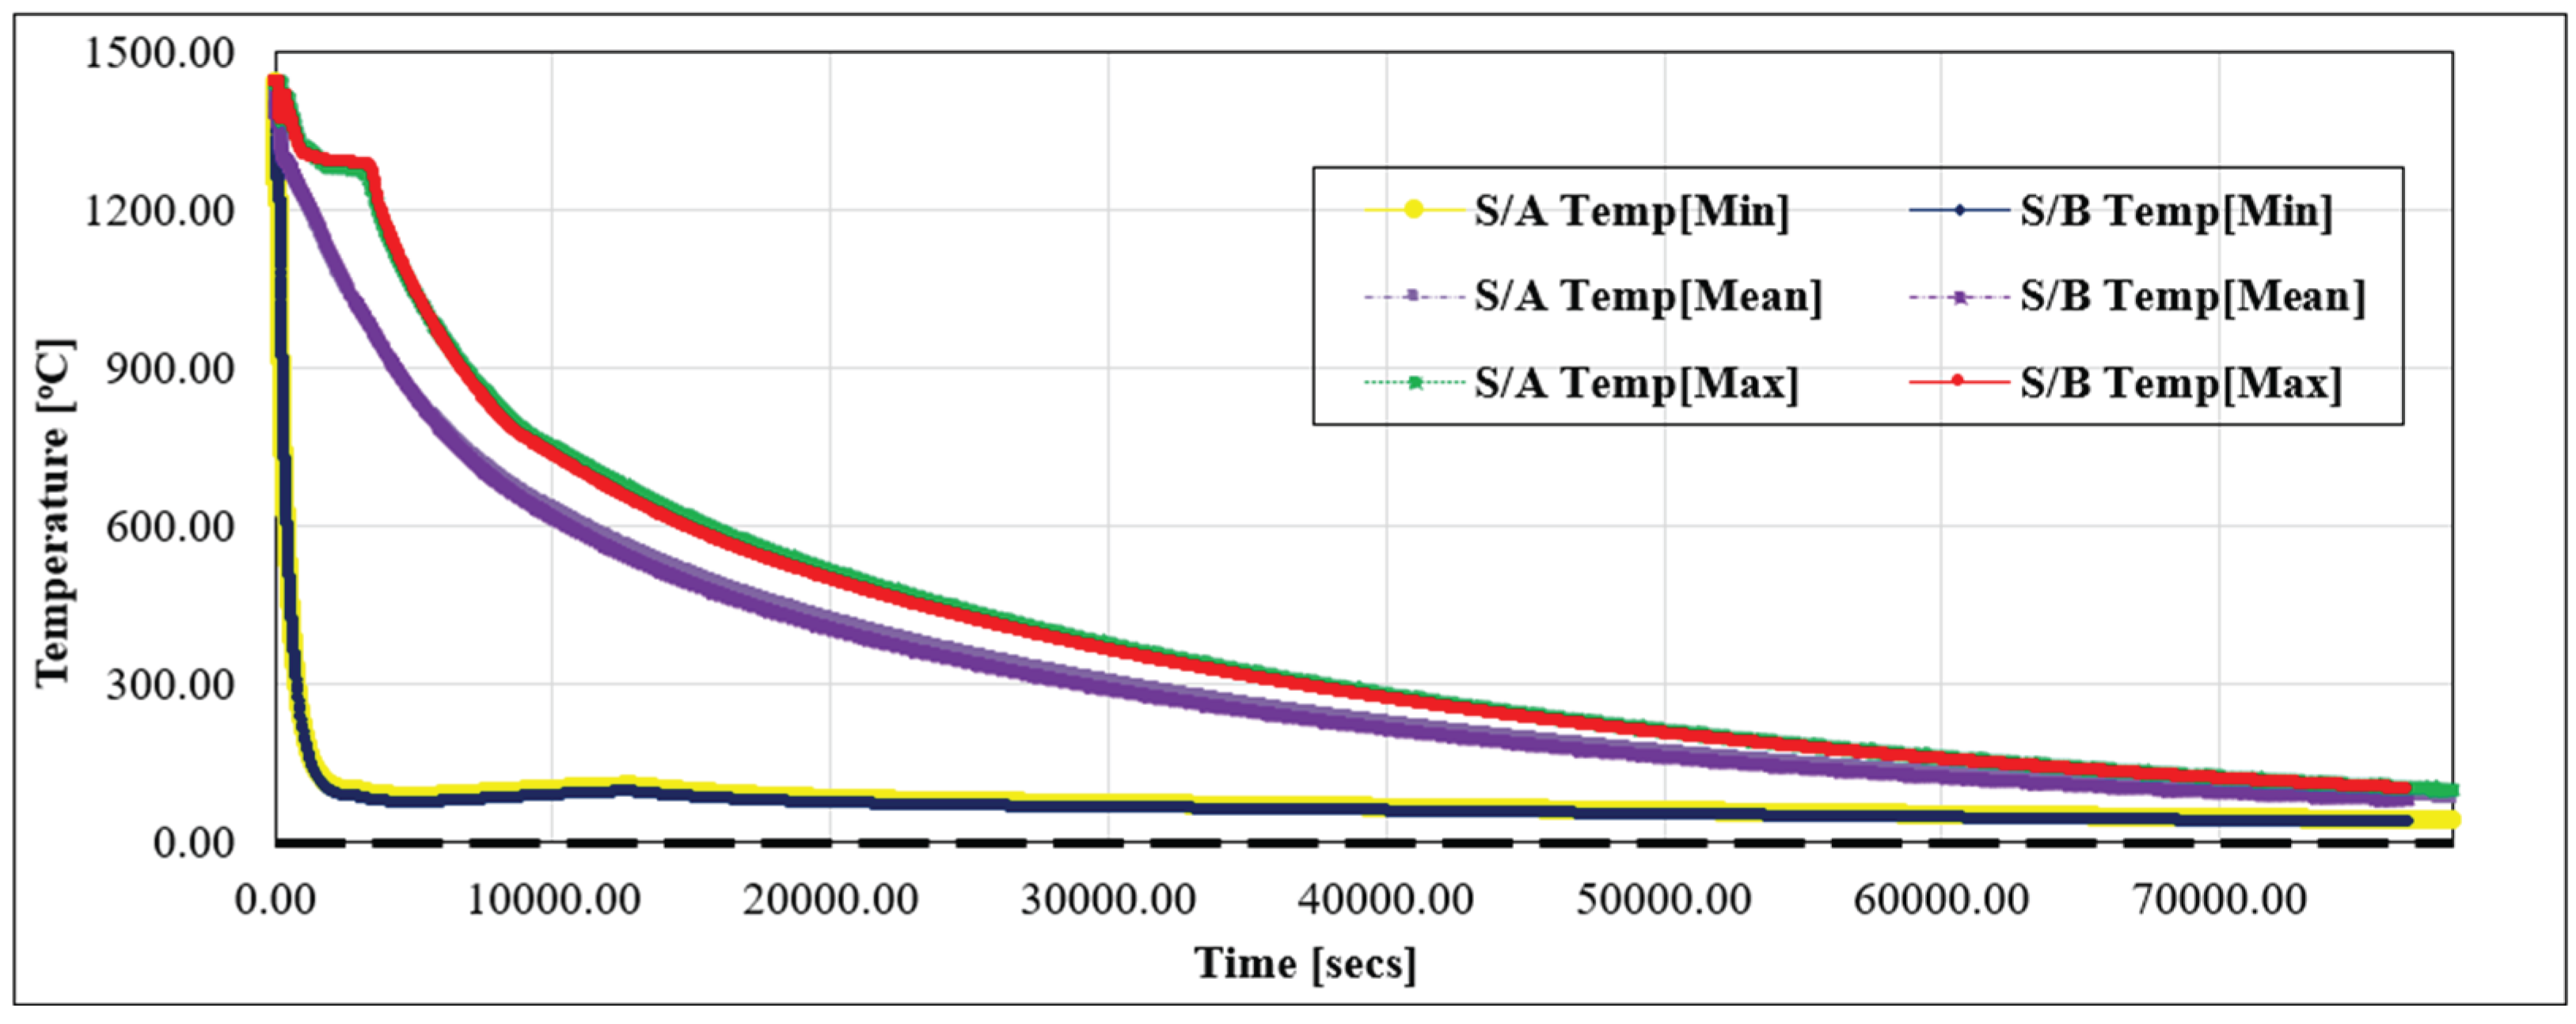
Figure 3.
Experimental stress lattice casting components in both (A) GCW and (B) NCW conditions, respectively.
Figure 3.
Experimental stress lattice casting components in both (A) GCW and (B) NCW conditions, respectively.
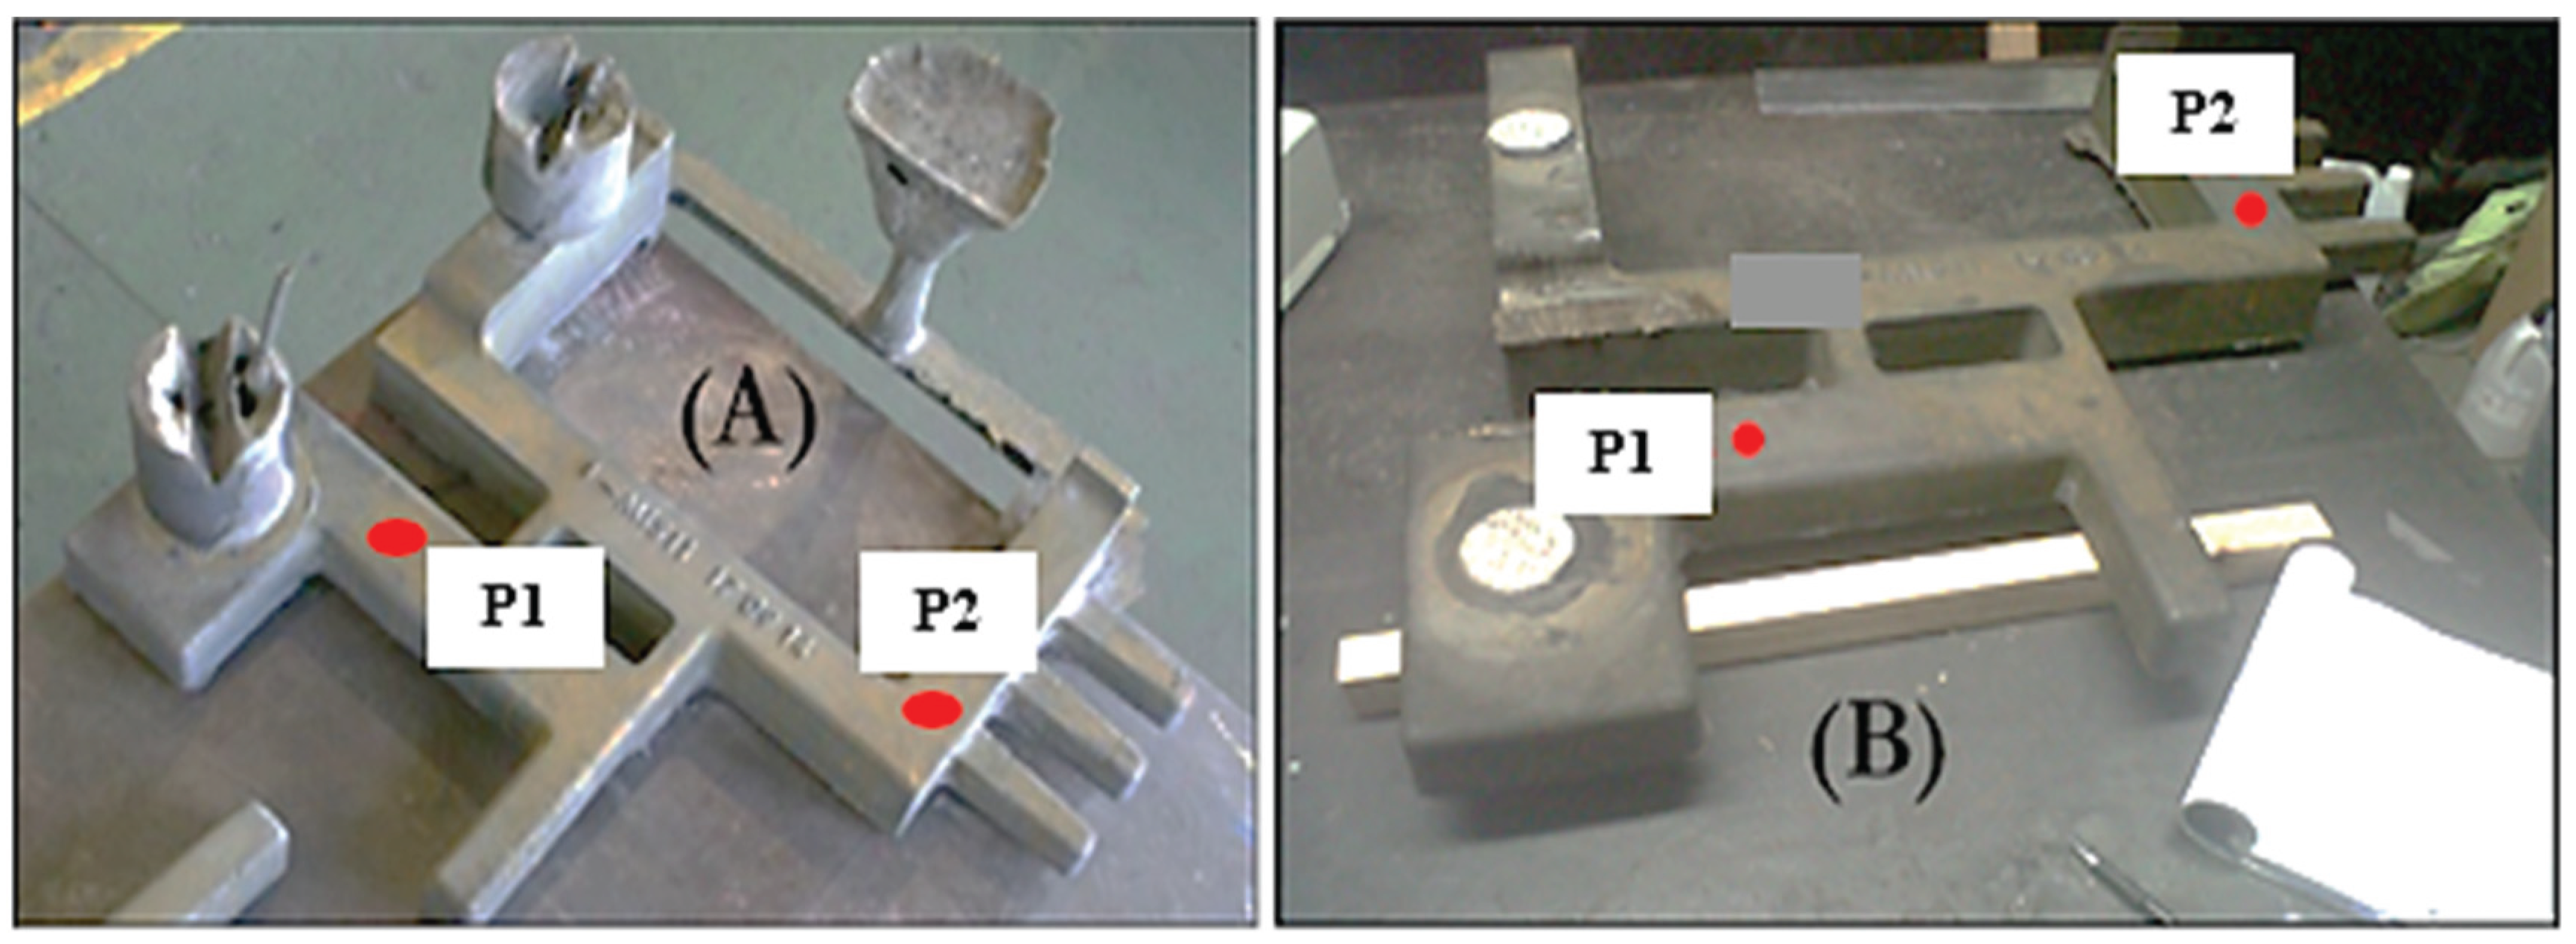
Figure 4.
S/A microstructural analysis of HCWCI microstructural evaluation in as-cast condition at low and higher magnification, such as X10 and X20, respectively.
Figure 4.
S/A microstructural analysis of HCWCI microstructural evaluation in as-cast condition at low and higher magnification, such as X10 and X20, respectively.
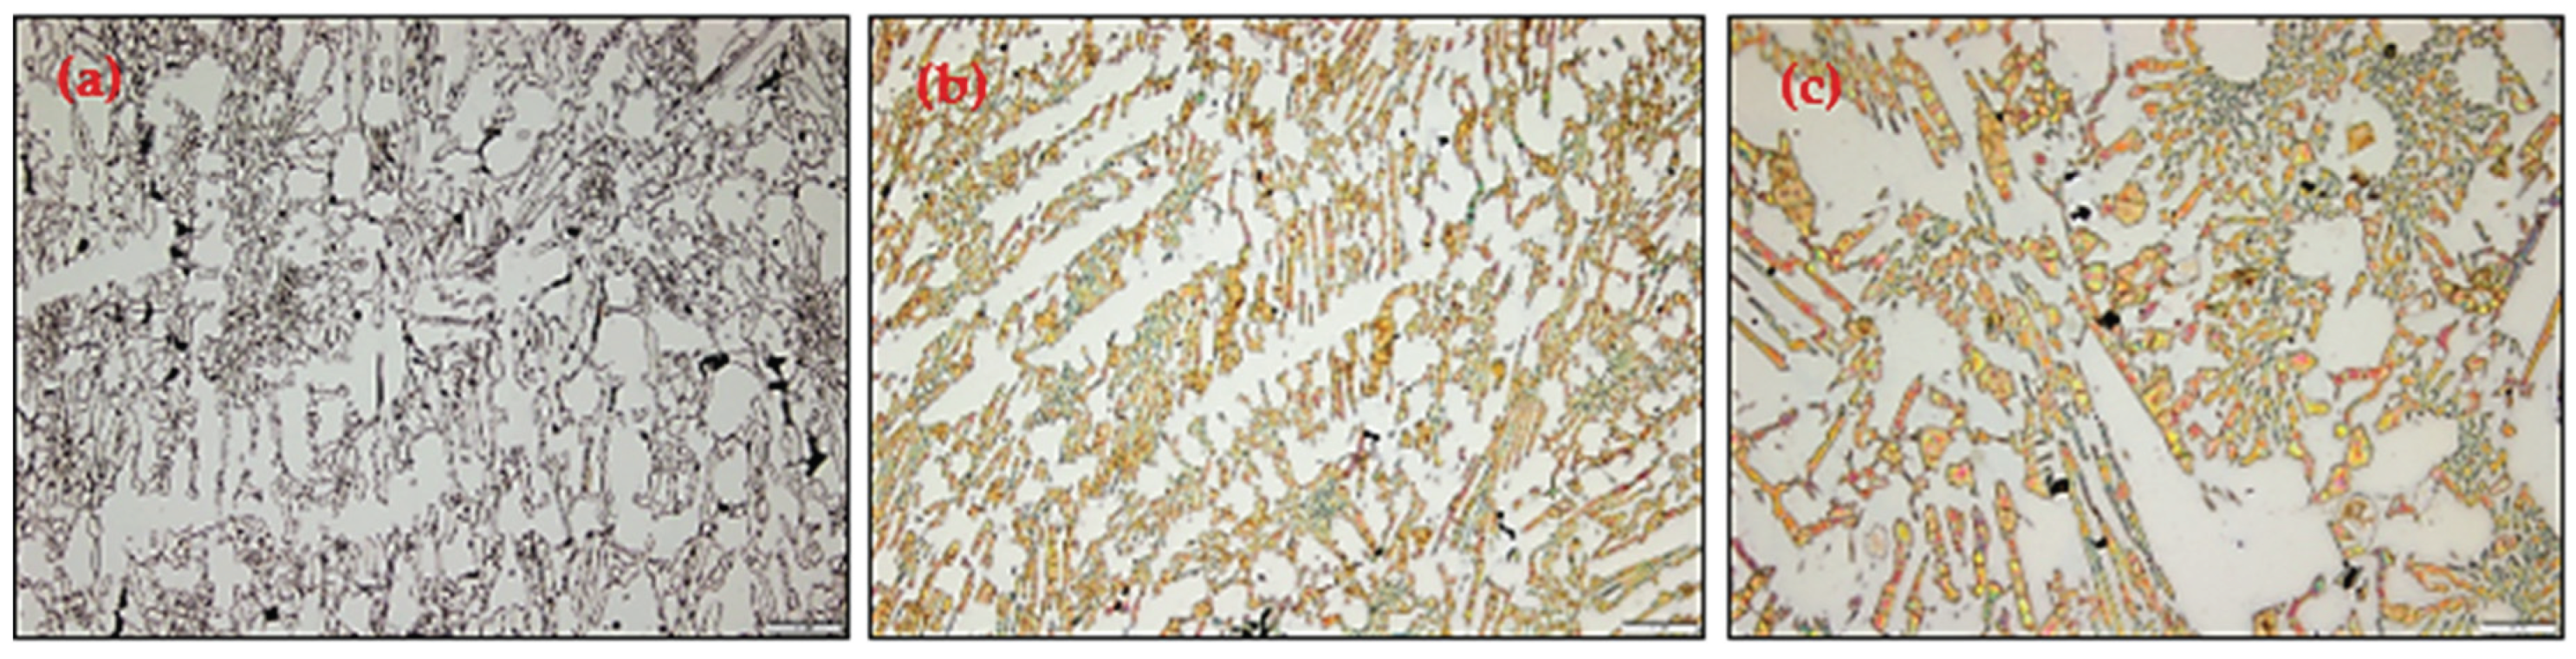
Figure 5.
S/B microstructural analysis of HCWCI microstructural evaluation in as-cast condition at low and higher magnification, such as X10 and X20, respectively.
Figure 5.
S/B microstructural analysis of HCWCI microstructural evaluation in as-cast condition at low and higher magnification, such as X10 and X20, respectively.
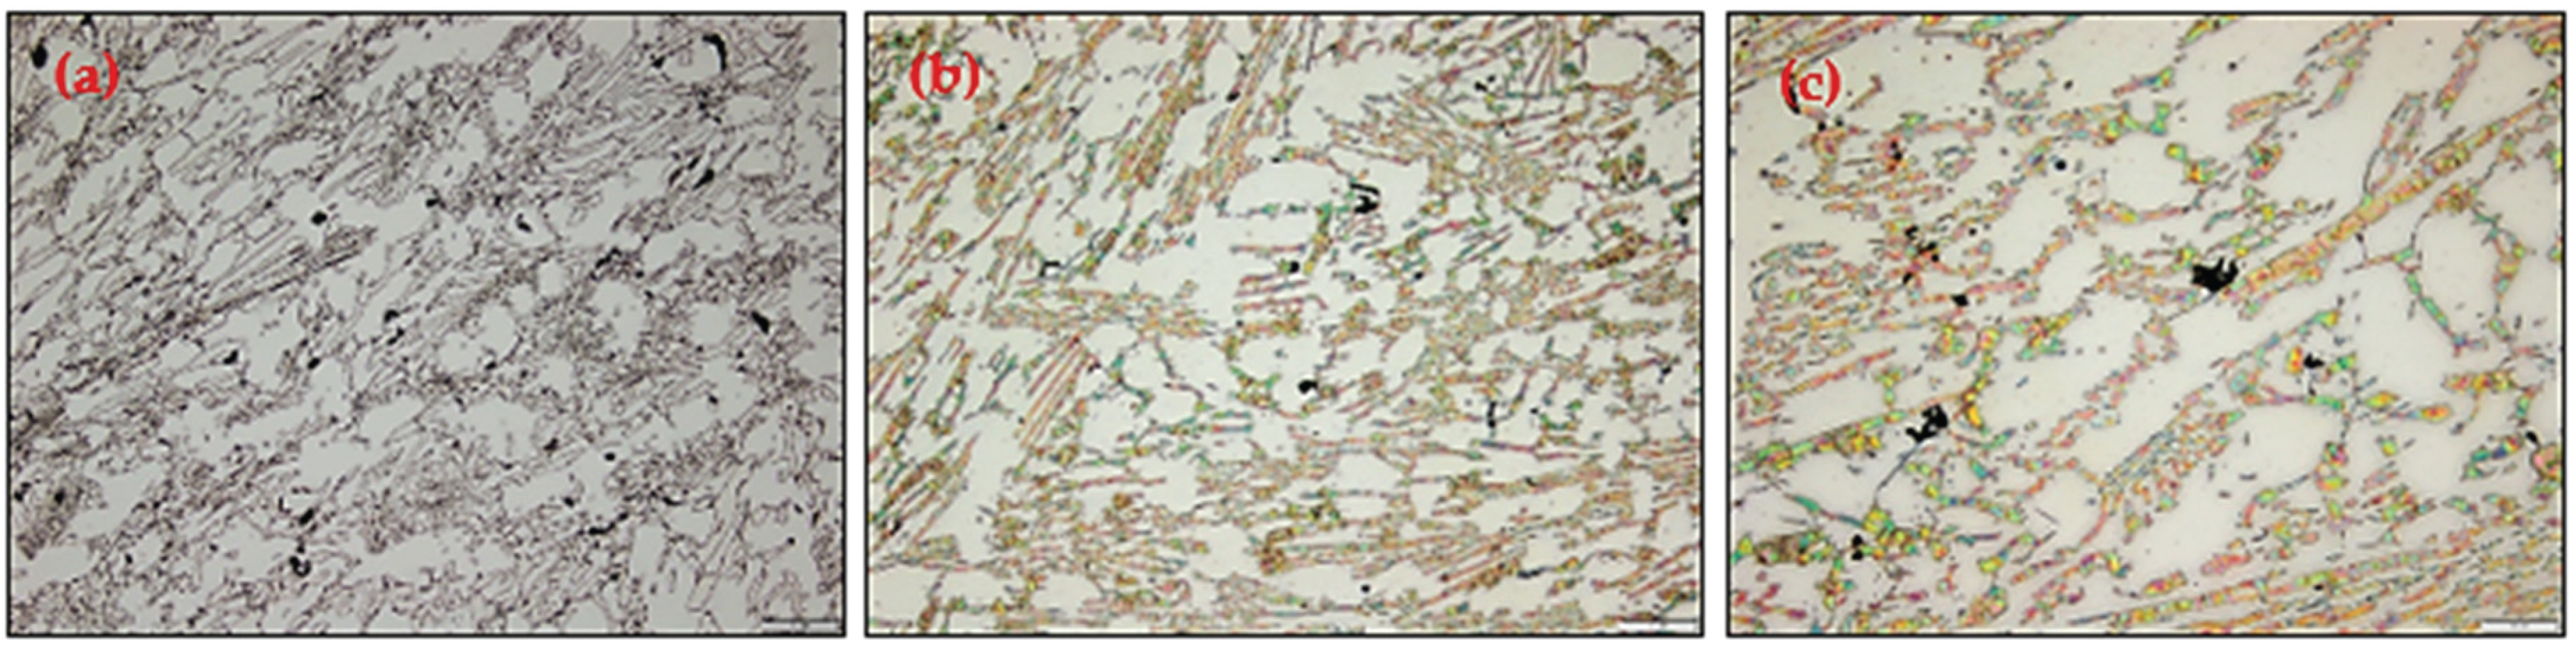
Figure 6.
Equivalent RS on NCW conditions versus (vs) GCW conditions is evaluated in (A) and the related Von Mises vs Tresca stresses at P1 are evaluated in (B).
Figure 6.
Equivalent RS on NCW conditions versus (vs) GCW conditions is evaluated in (A) and the related Von Mises vs Tresca stresses at P1 are evaluated in (B).
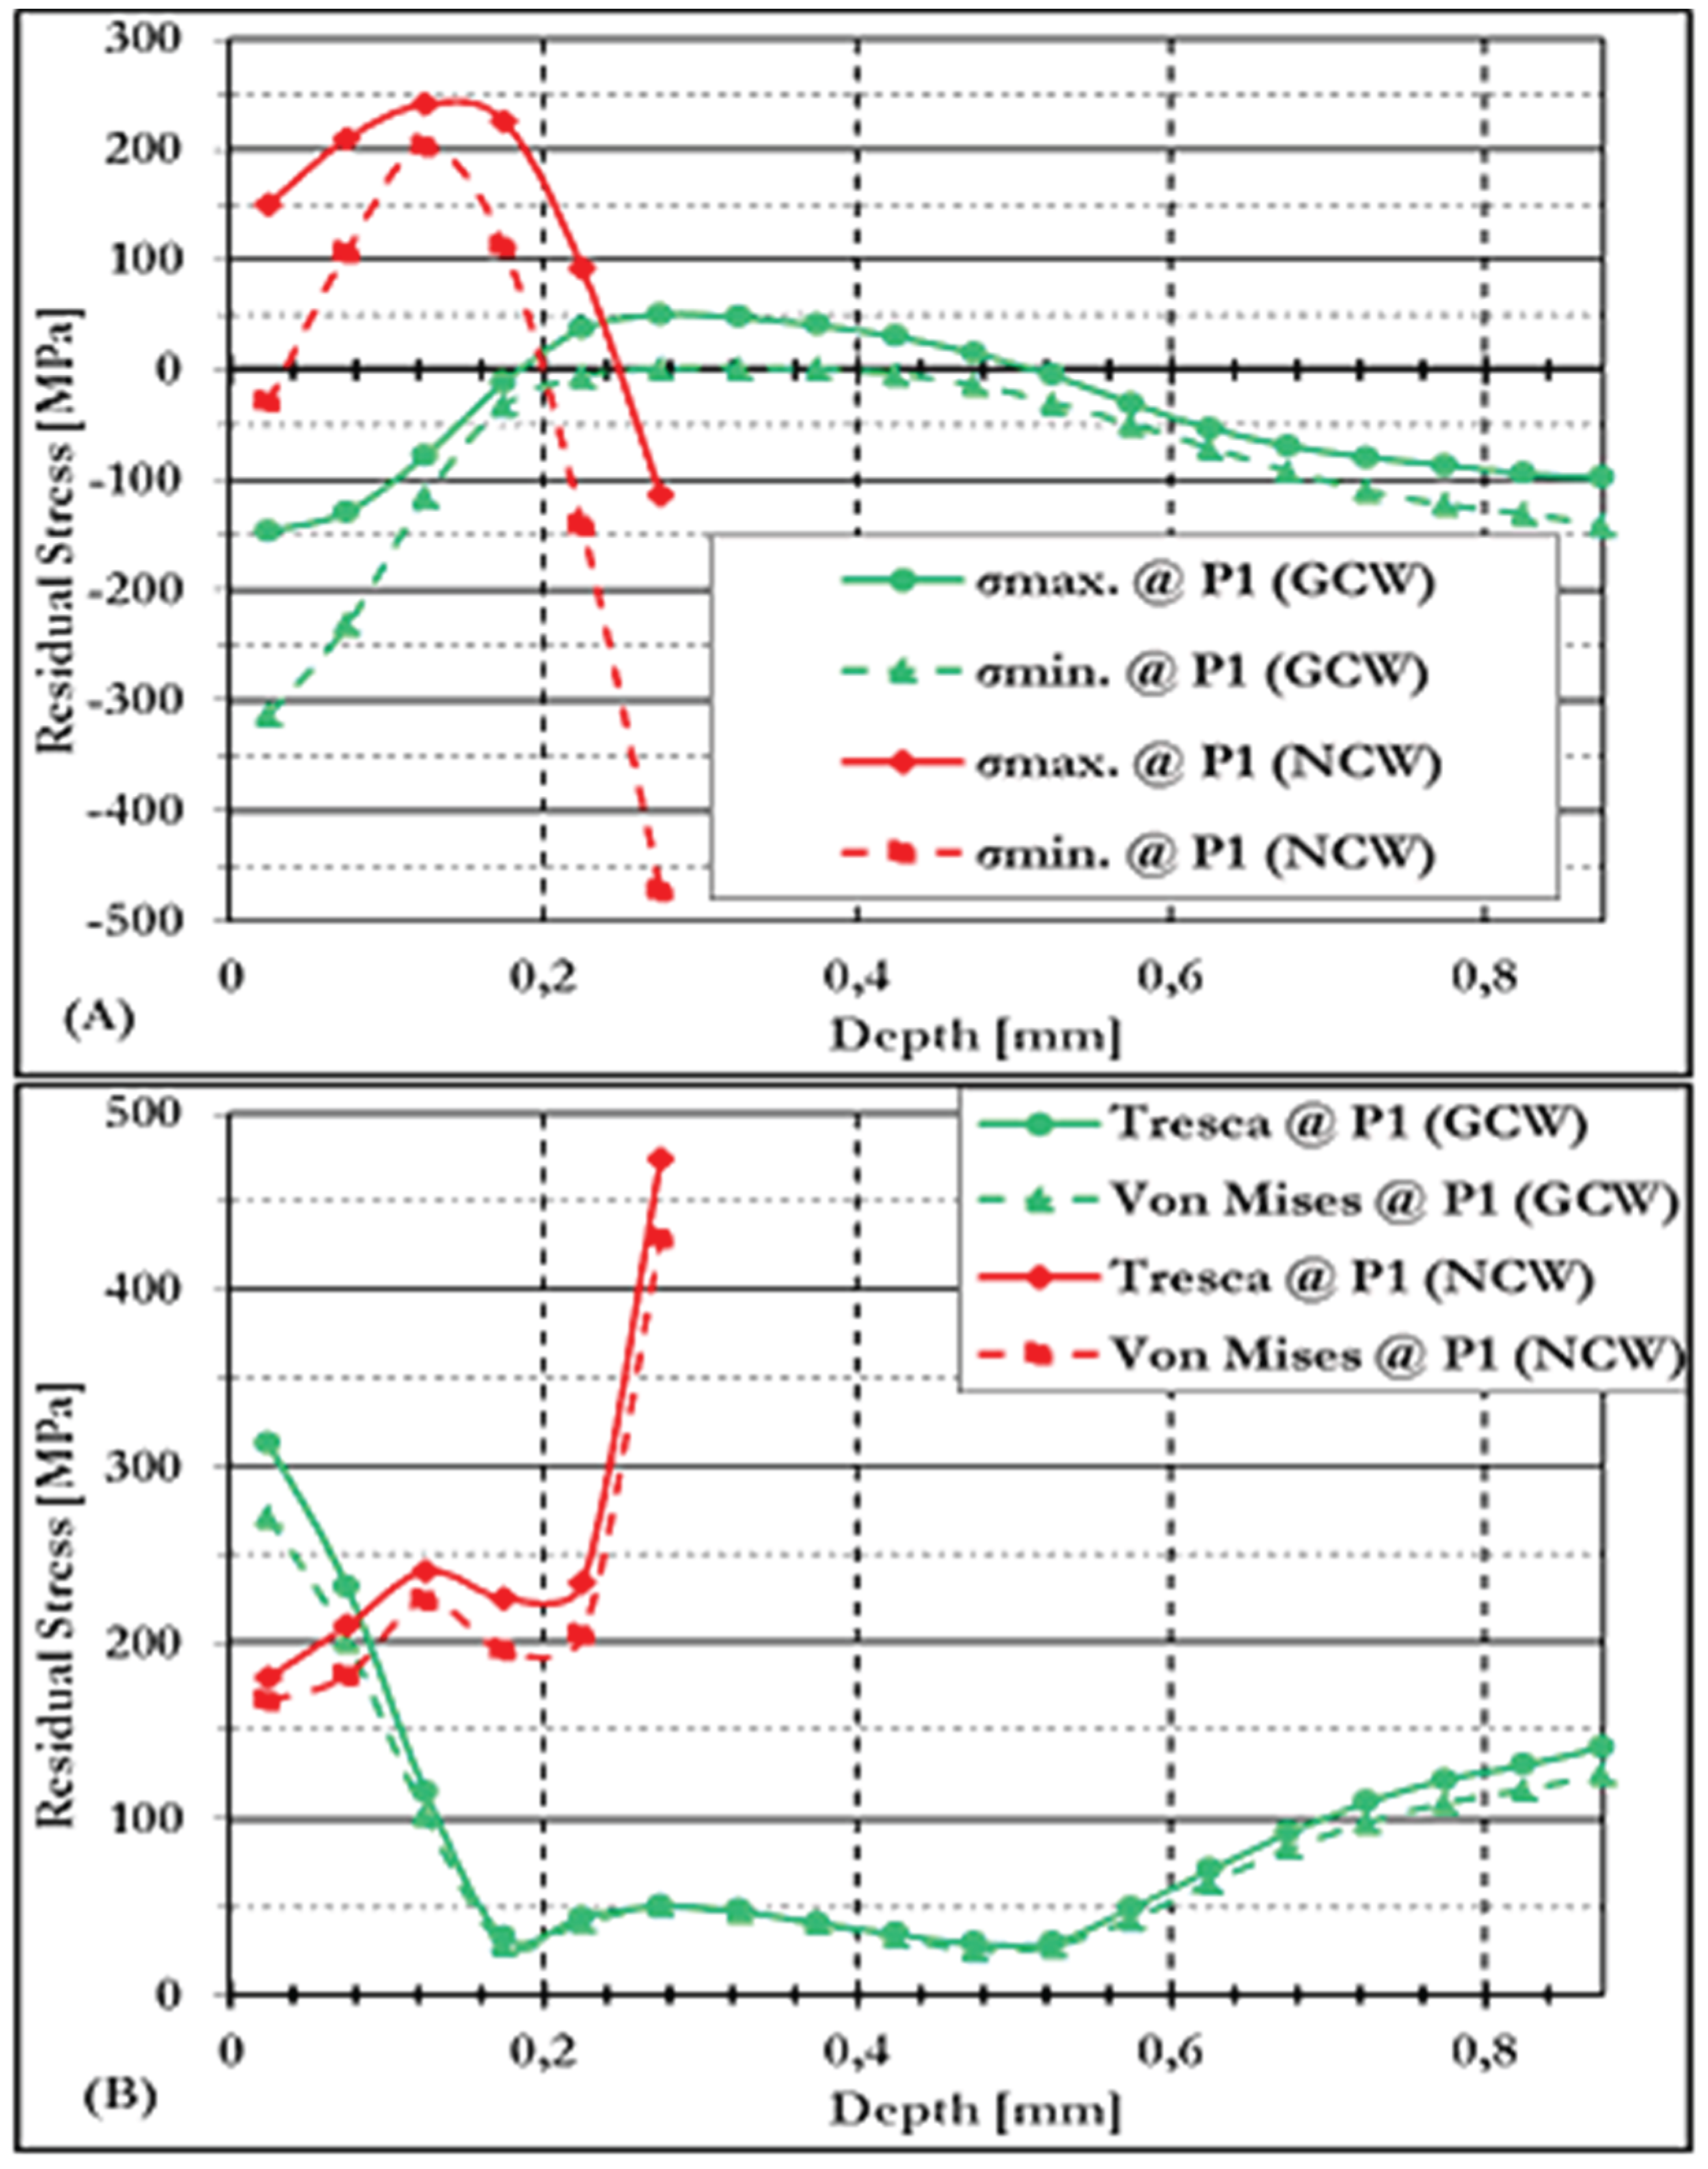
Figure 7.
Equivalent RS on NCW conditions vs GCW conditions is evaluated in (A) and the related Von Mises vs Tresca stresses at P2 are evaluated in (B).
Figure 7.
Equivalent RS on NCW conditions vs GCW conditions is evaluated in (A) and the related Von Mises vs Tresca stresses at P2 are evaluated in (B).
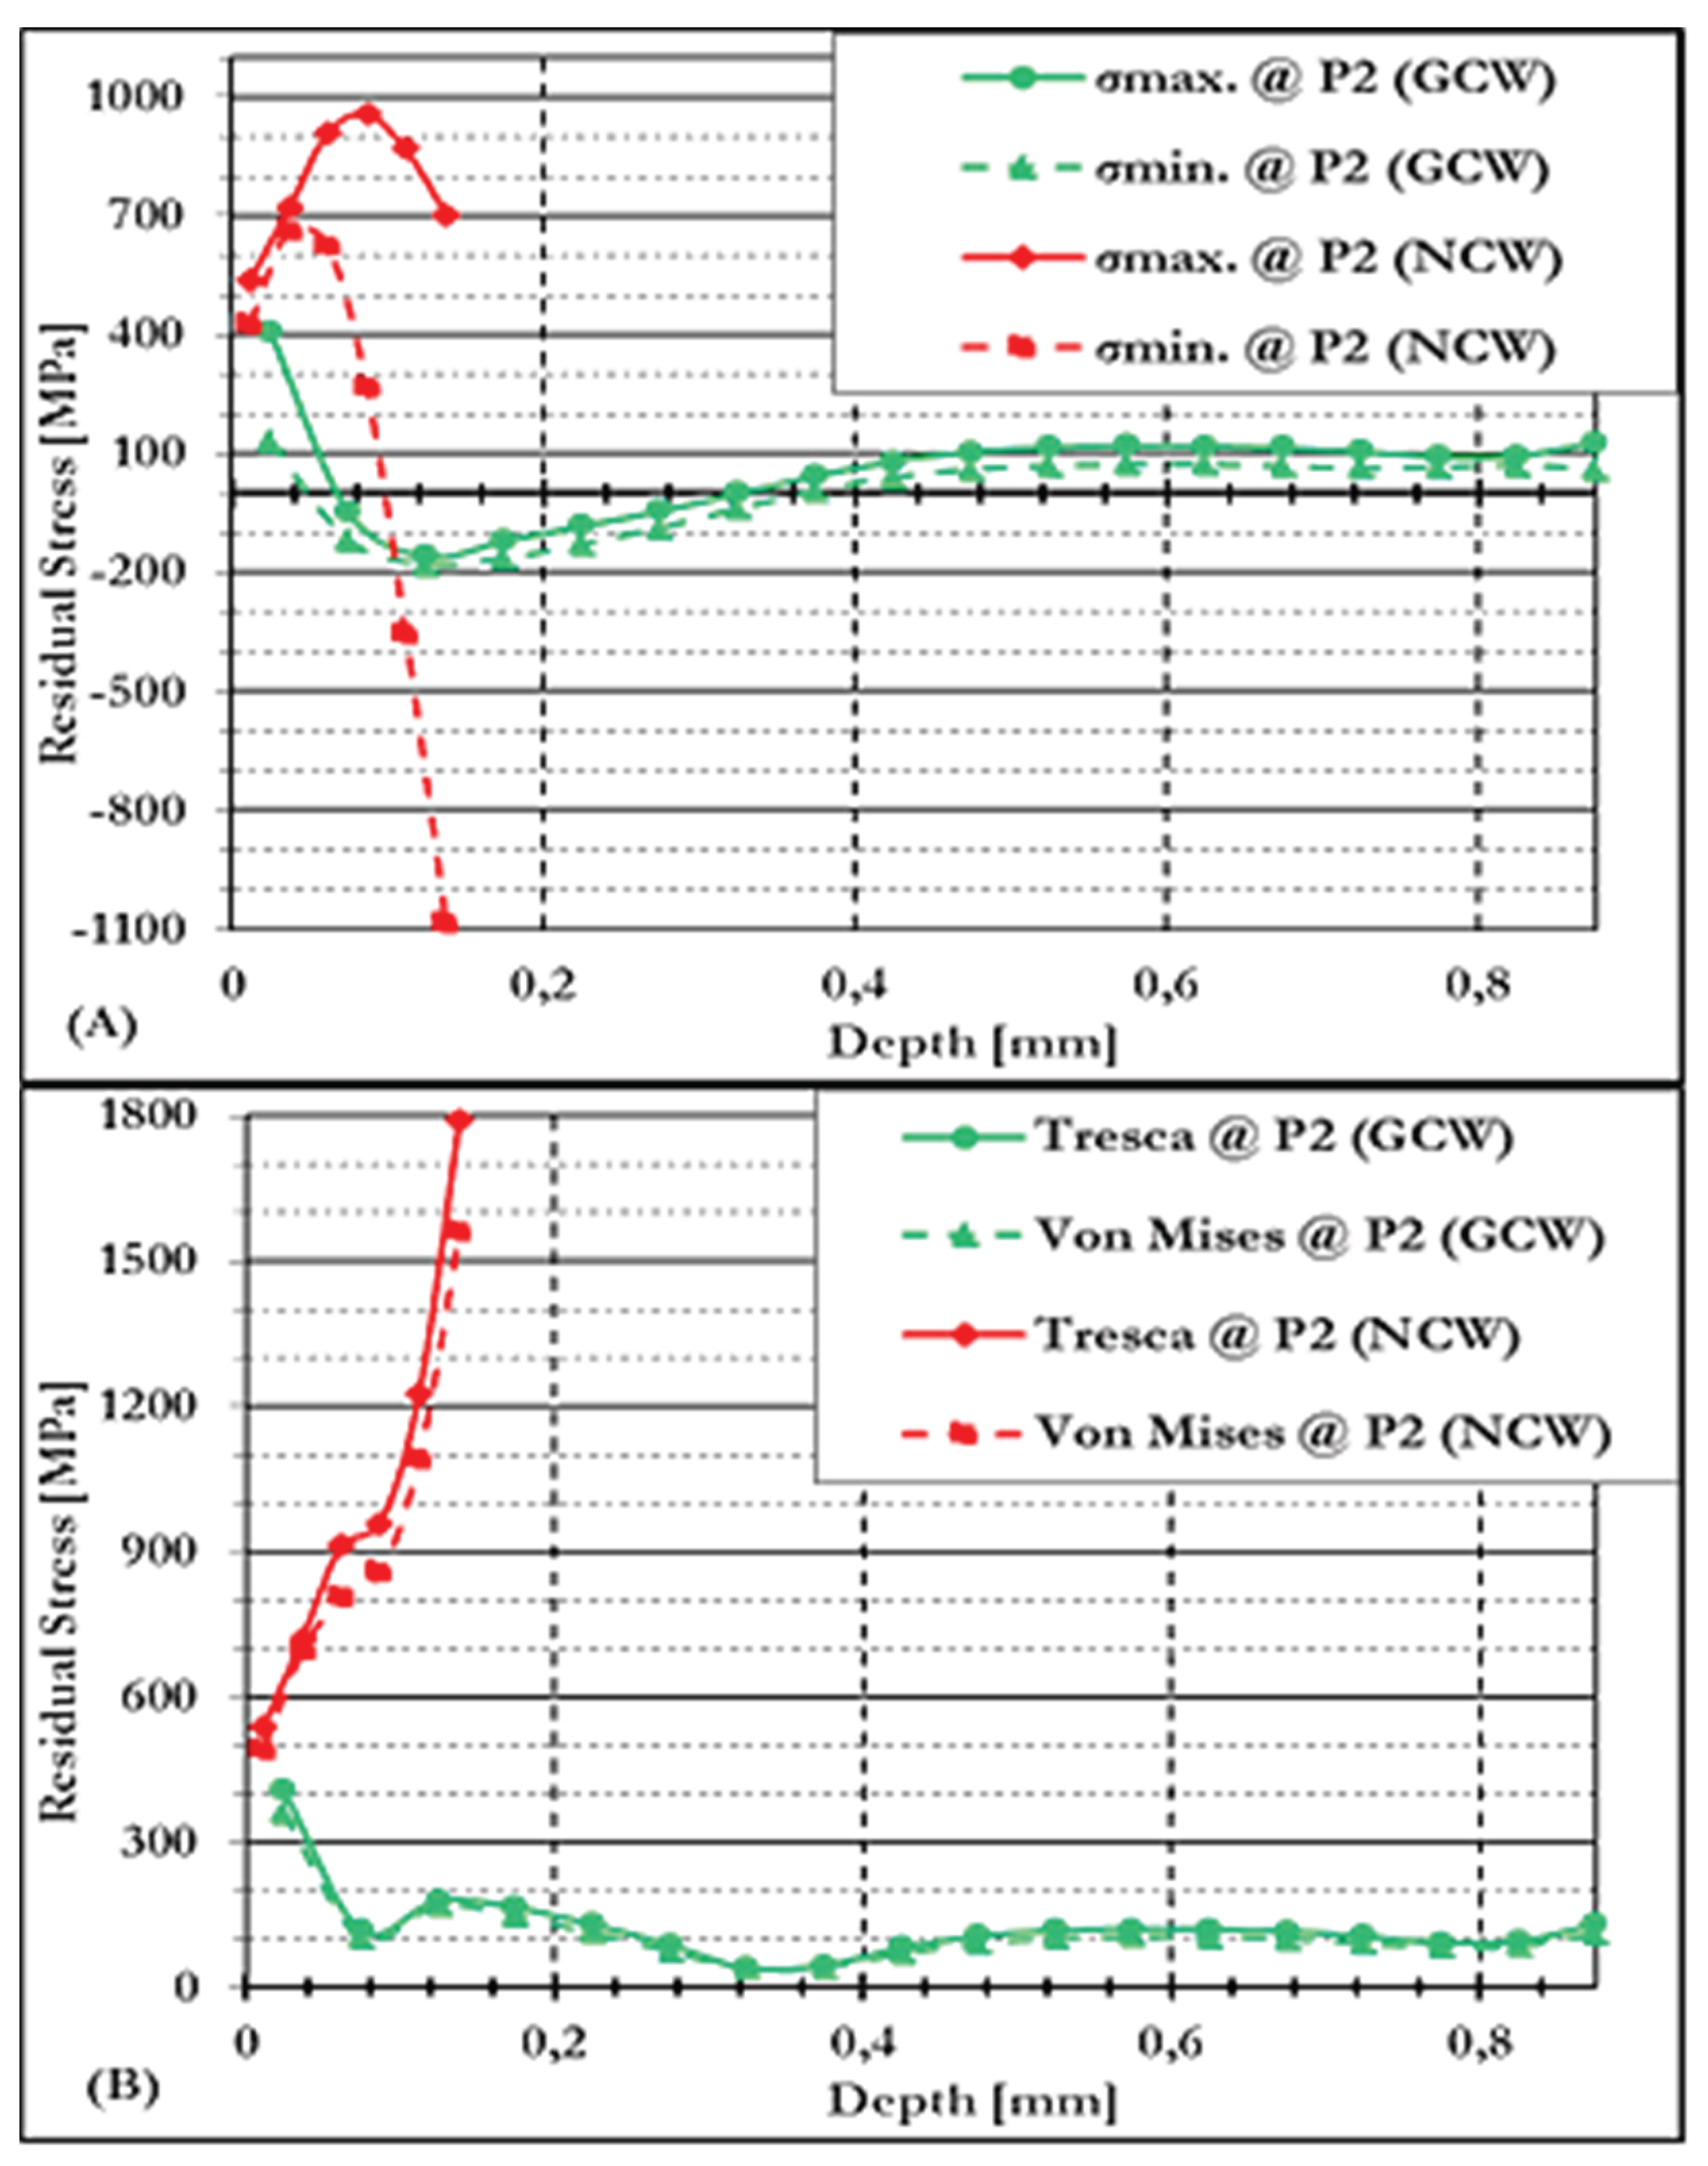
Figure 8.
(A) Evaluation of RS at P1 and P2, and (B) Tresca and Von Mises stresses under GCW conditions.
Figure 8.
(A) Evaluation of RS at P1 and P2, and (B) Tresca and Von Mises stresses under GCW conditions.
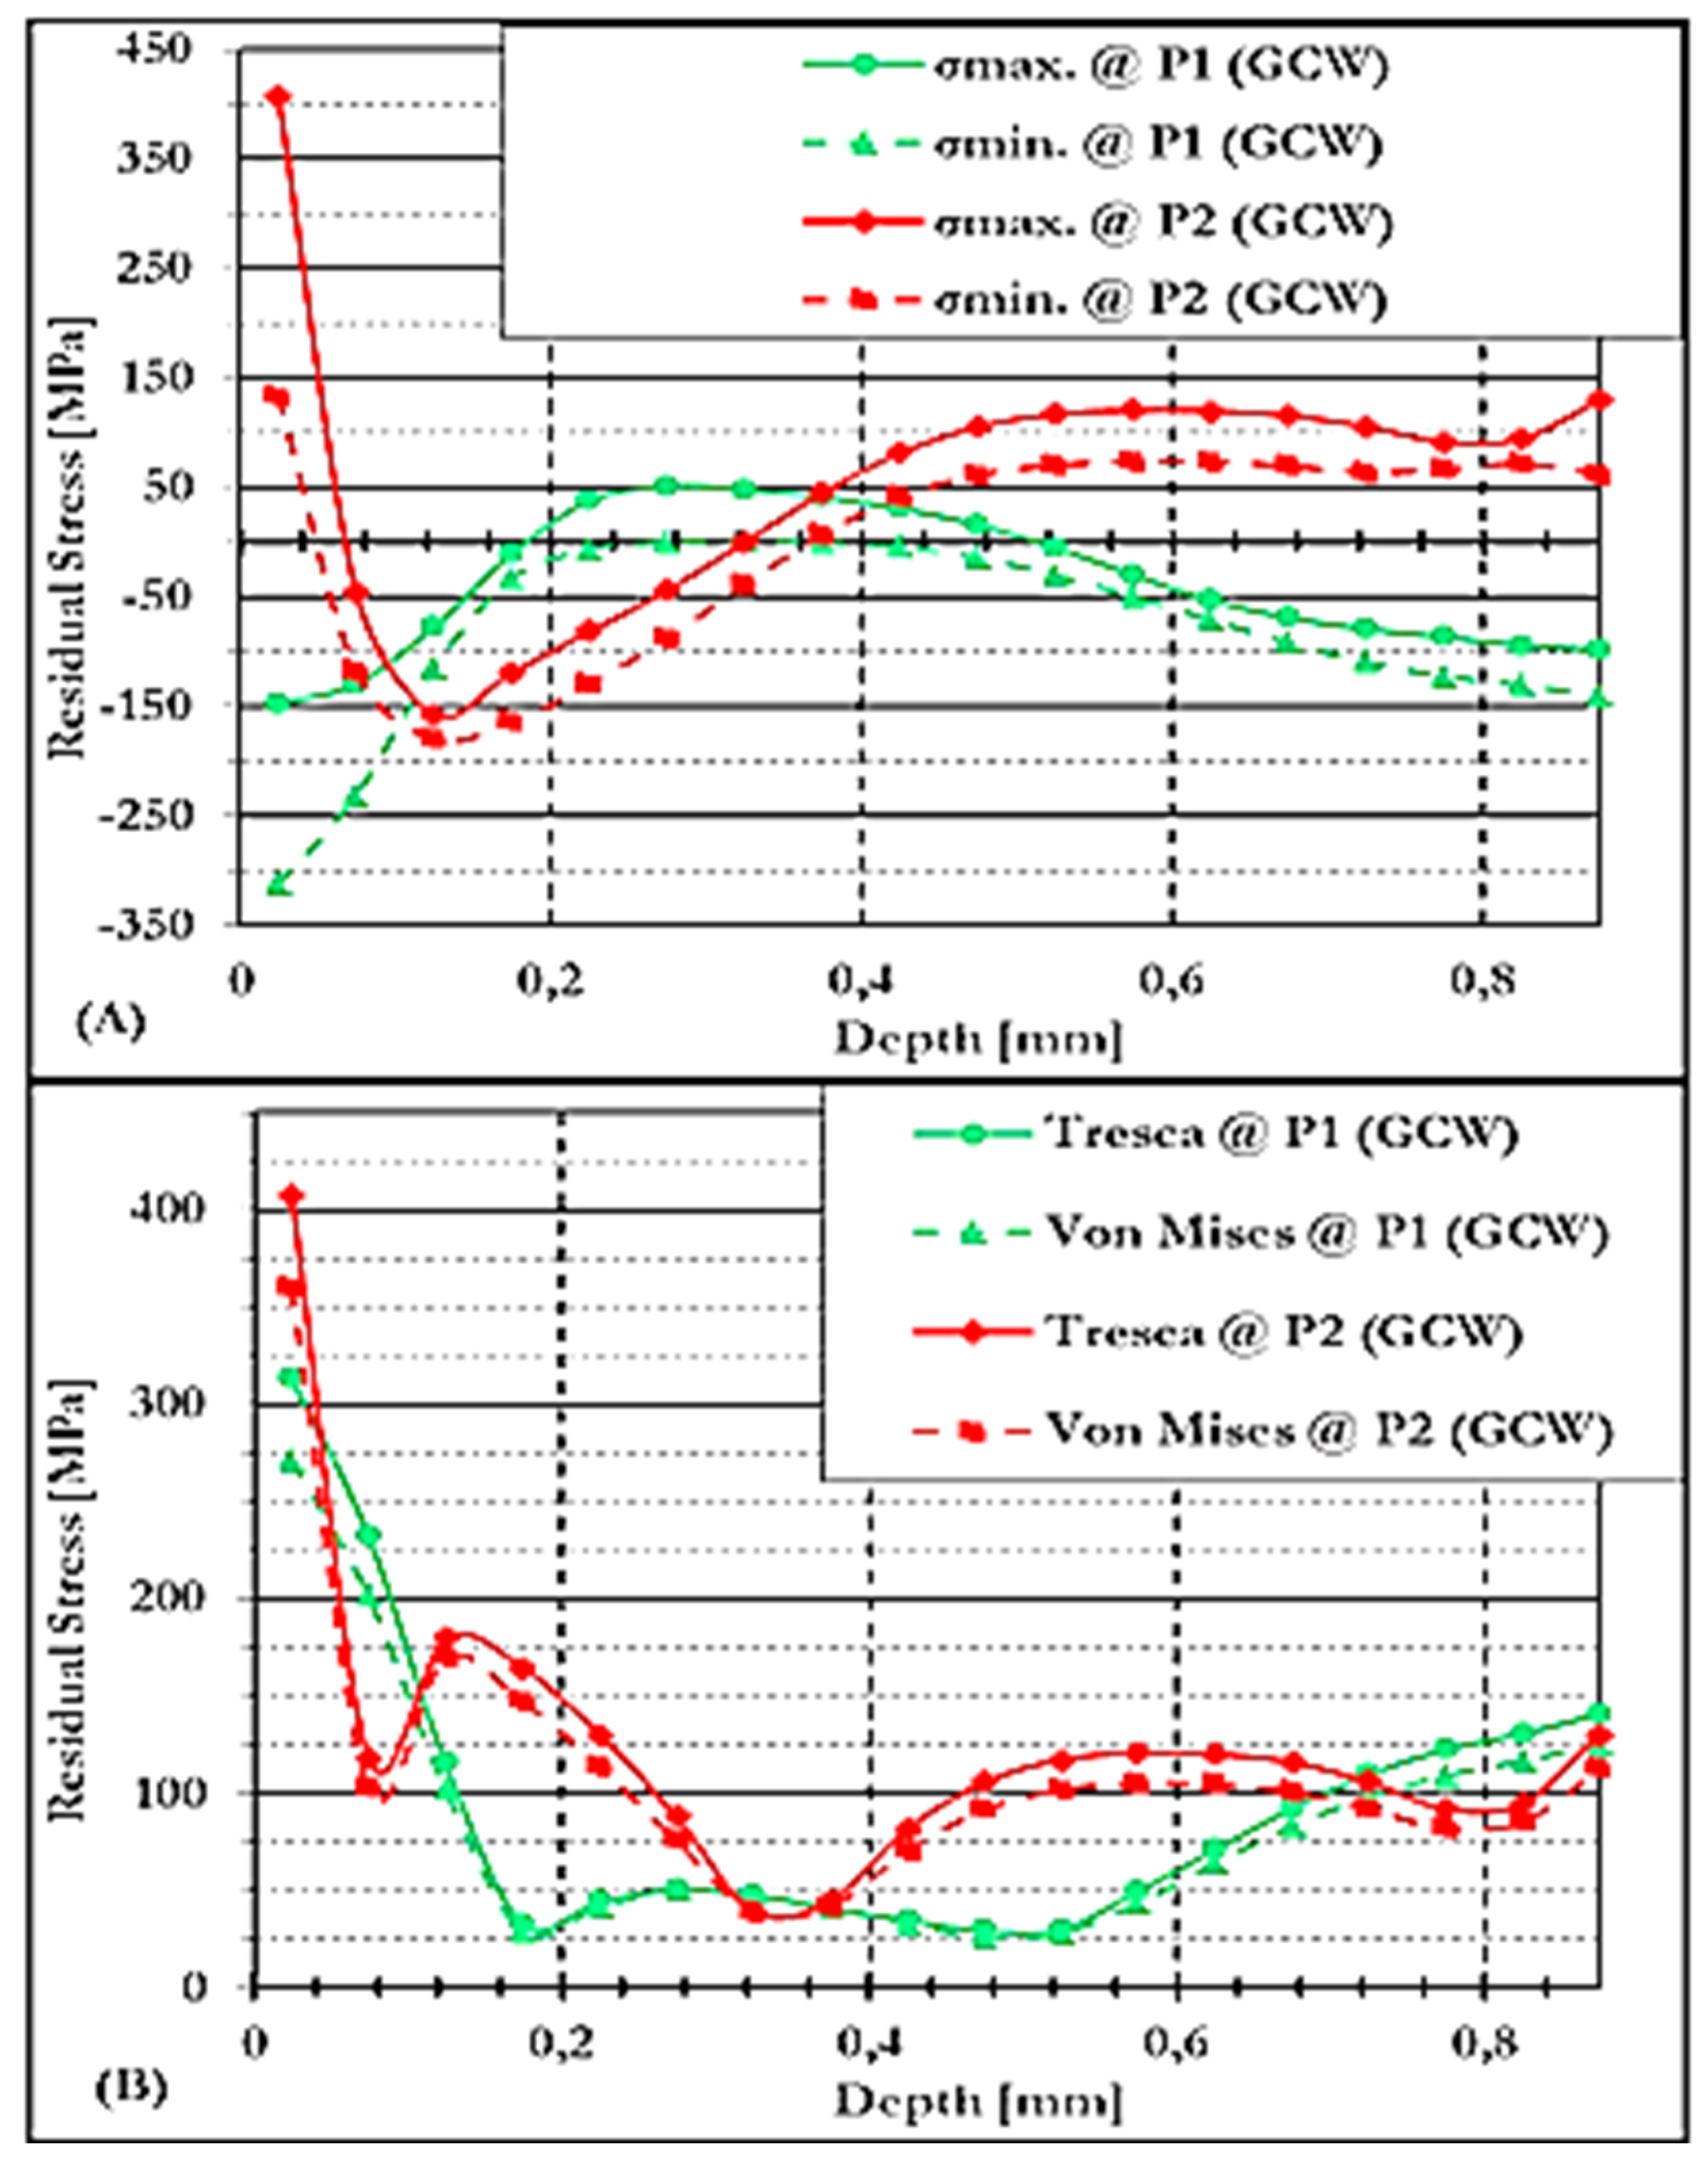
Figure 9.
(A) Evaluation of RS at P1 and P2, and (B) Tresca and Von Mises stresses under NCW conditions.
Figure 9.
(A) Evaluation of RS at P1 and P2, and (B) Tresca and Von Mises stresses under NCW conditions.
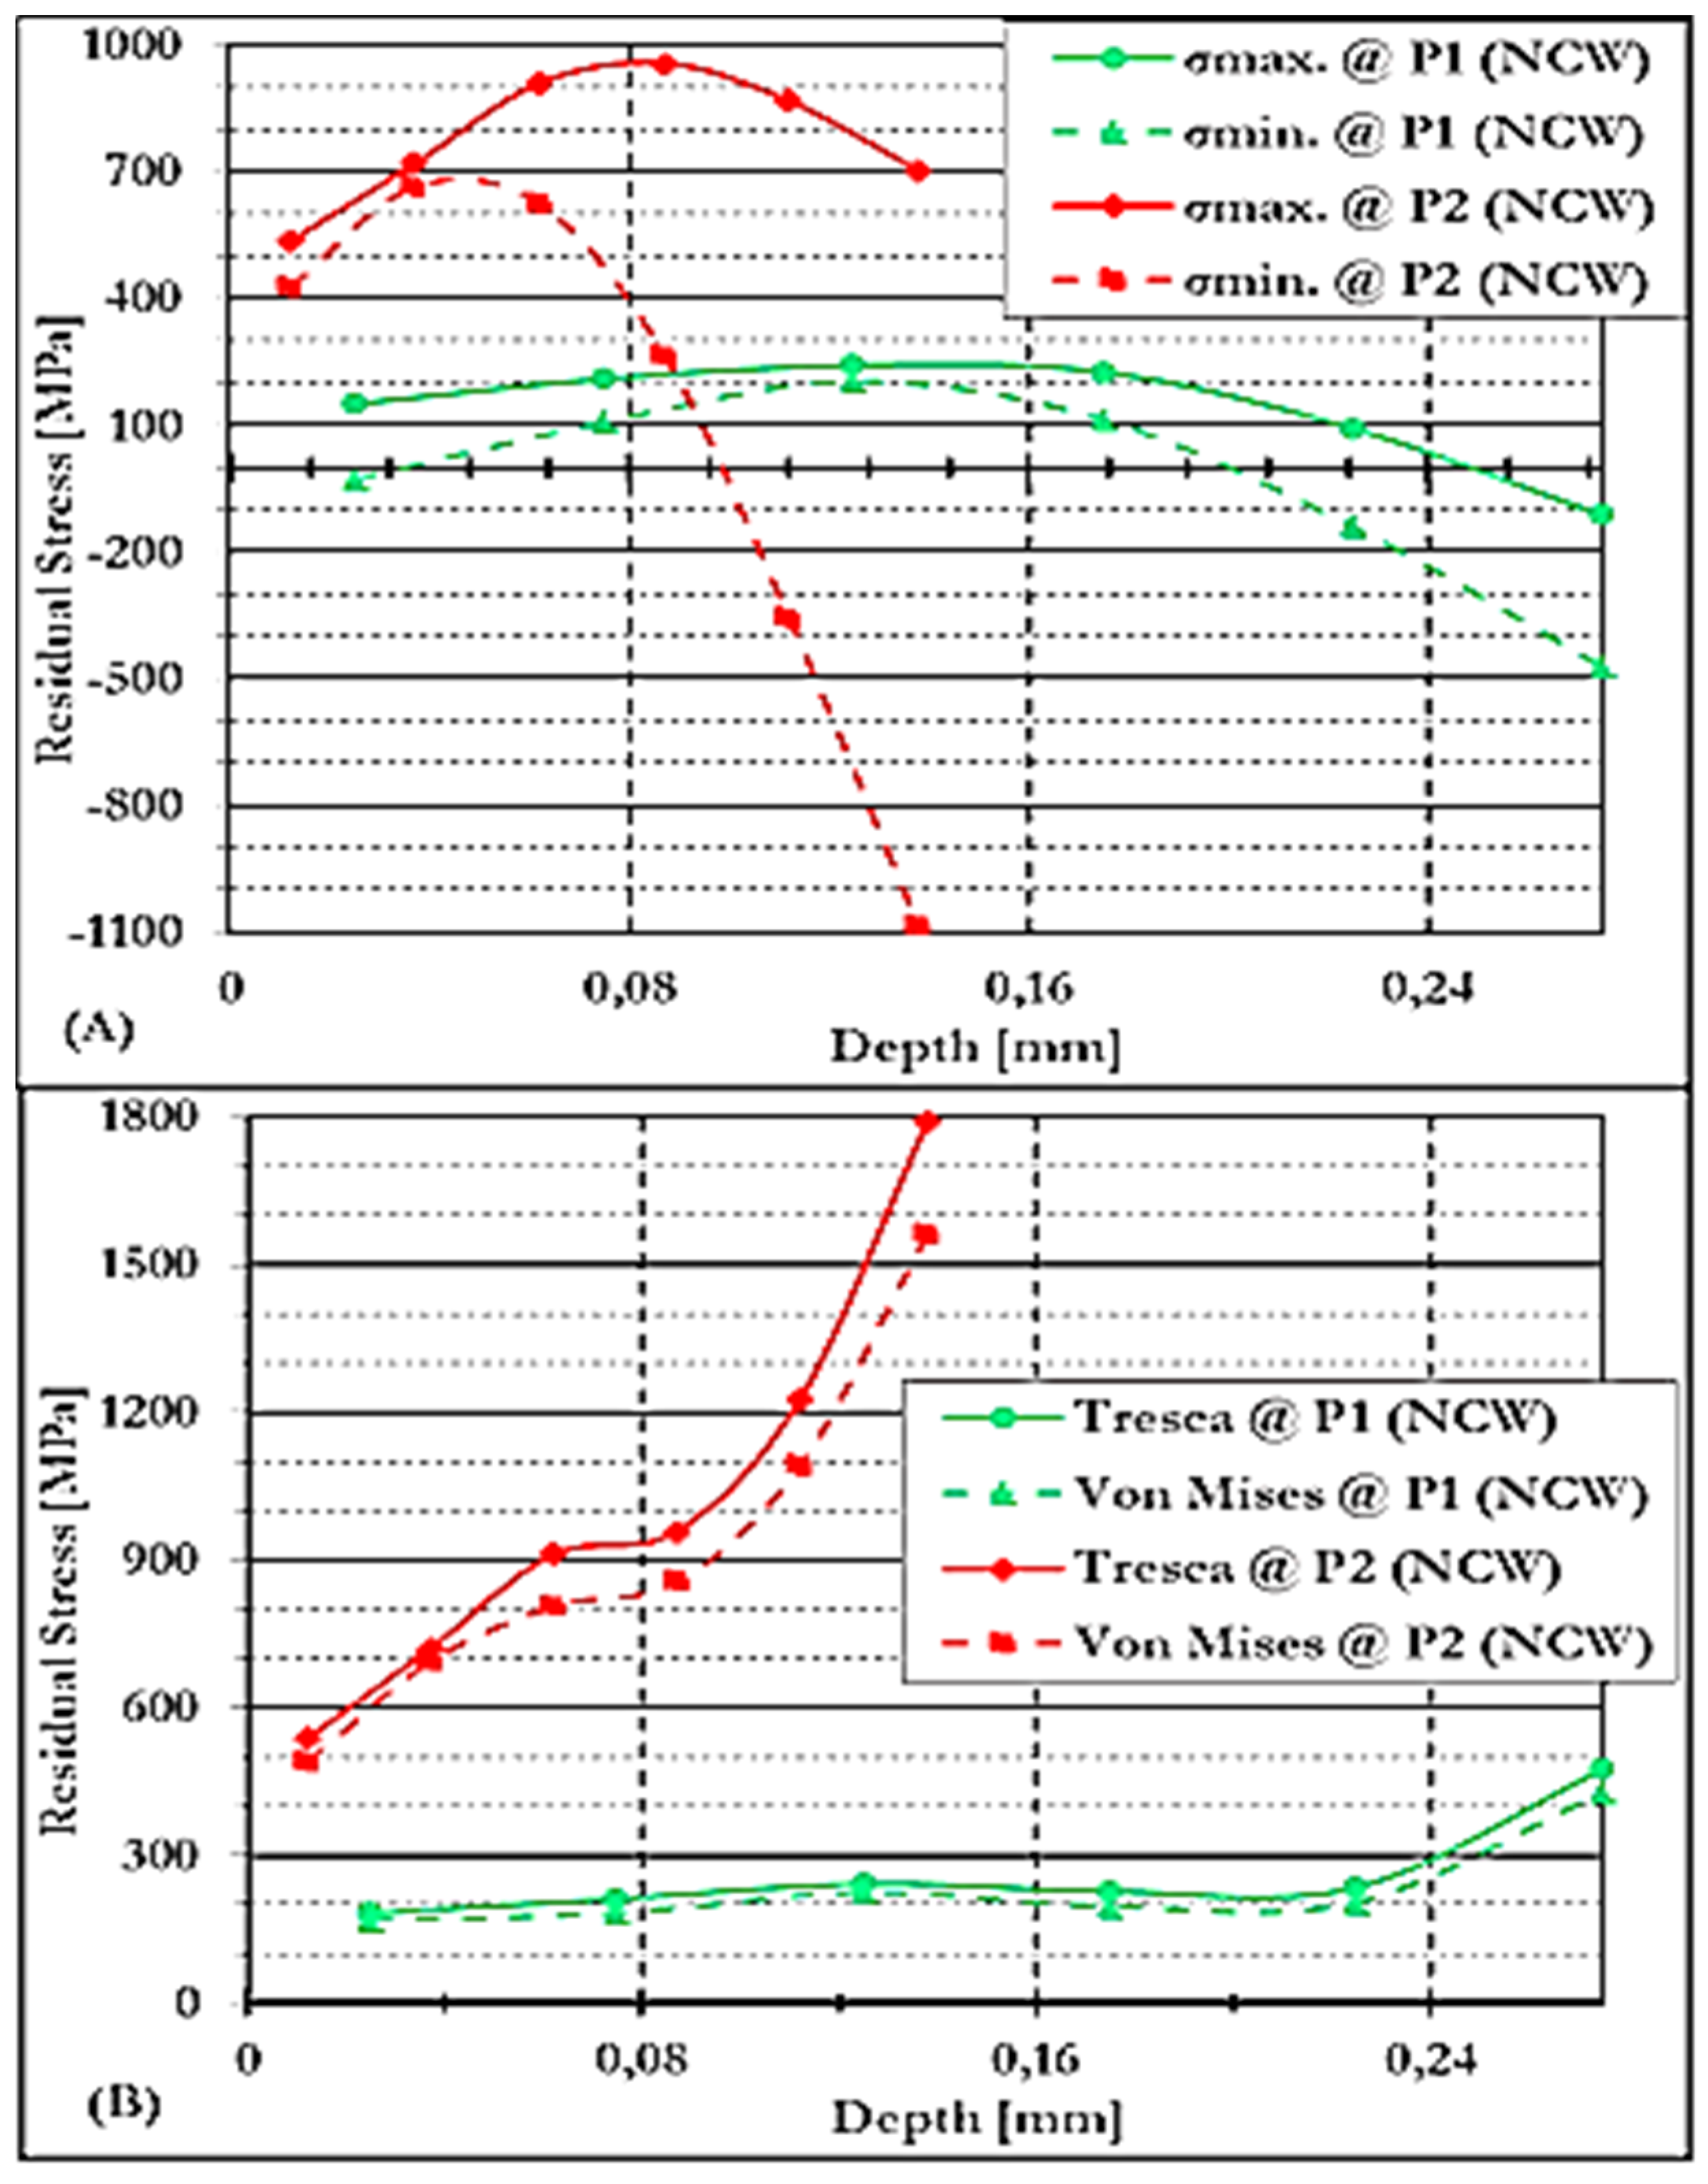
Figure 10.
Equivalent RS on NCW conditions vs GCW conditions is evaluated in (A) and the related Von Mises vs Tresca stresses at P1 are evaluated in (B).
Figure 10.
Equivalent RS on NCW conditions vs GCW conditions is evaluated in (A) and the related Von Mises vs Tresca stresses at P1 are evaluated in (B).
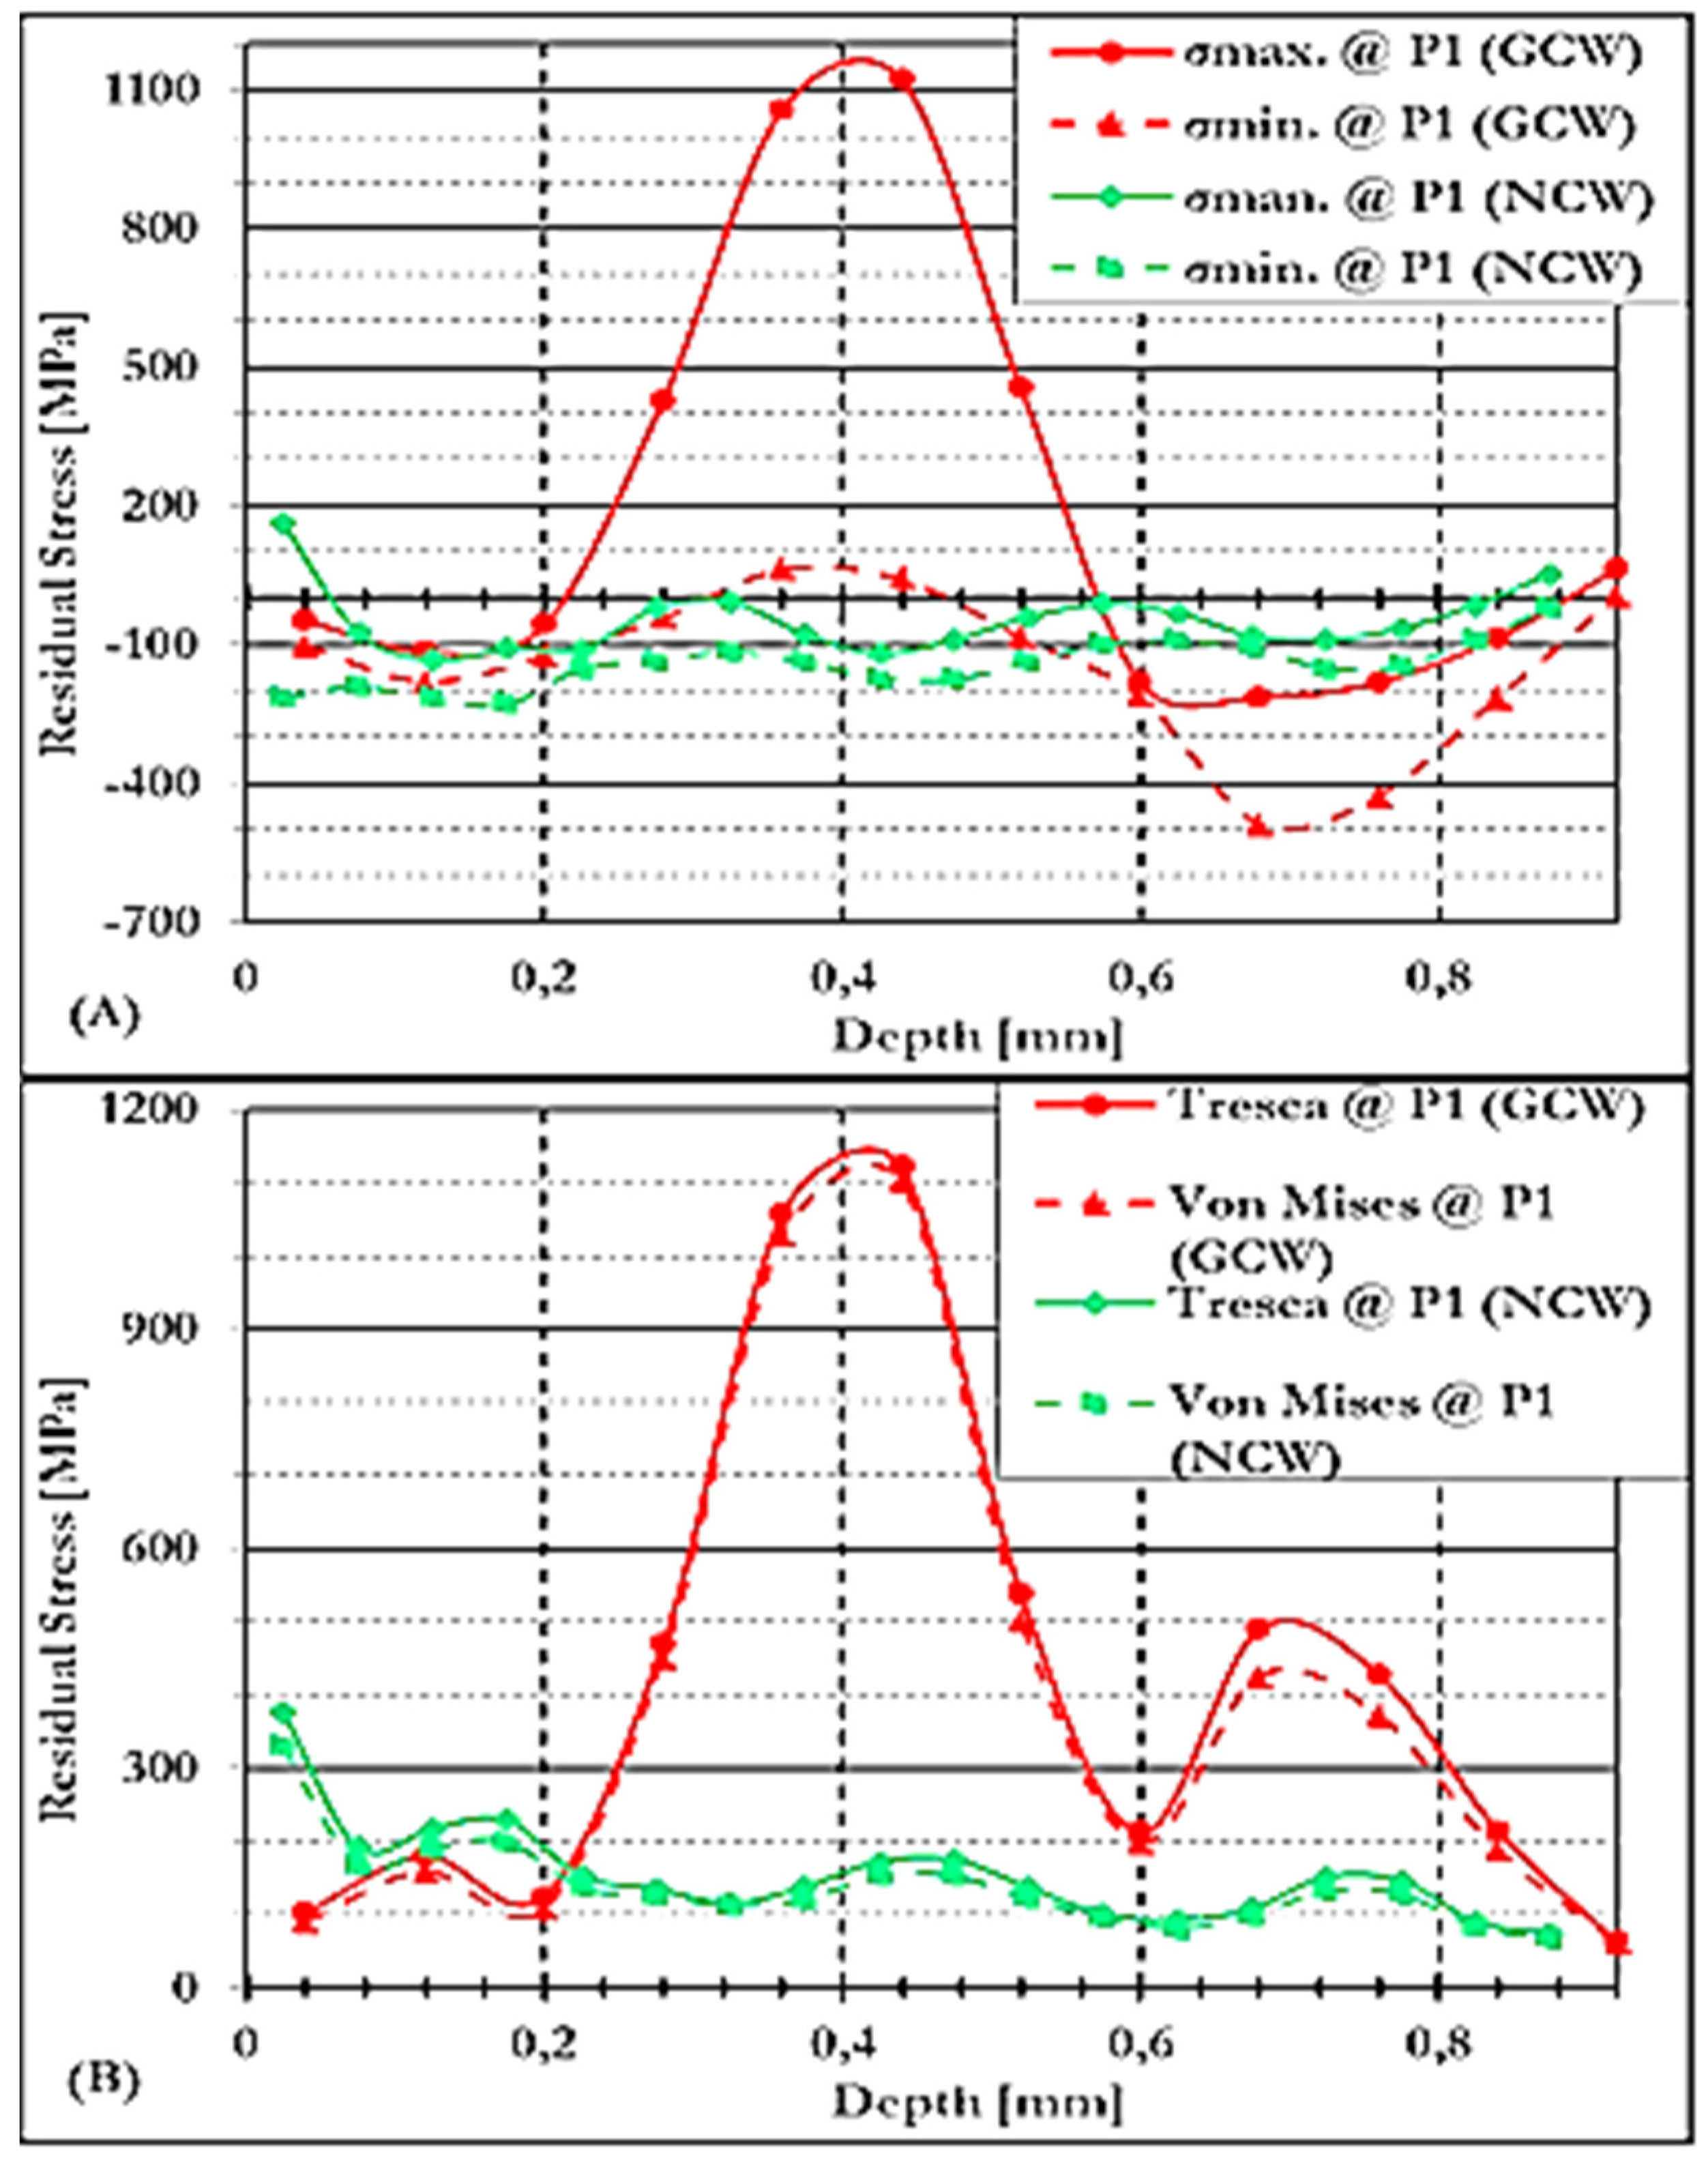
Figure 11.
Equivalent RS on NCW conditions versus (vs) GCW conditions is evaluated in (A) and the related Von Mises vs Tresca stresses at P2 are evaluated in (B).
Figure 11.
Equivalent RS on NCW conditions versus (vs) GCW conditions is evaluated in (A) and the related Von Mises vs Tresca stresses at P2 are evaluated in (B).
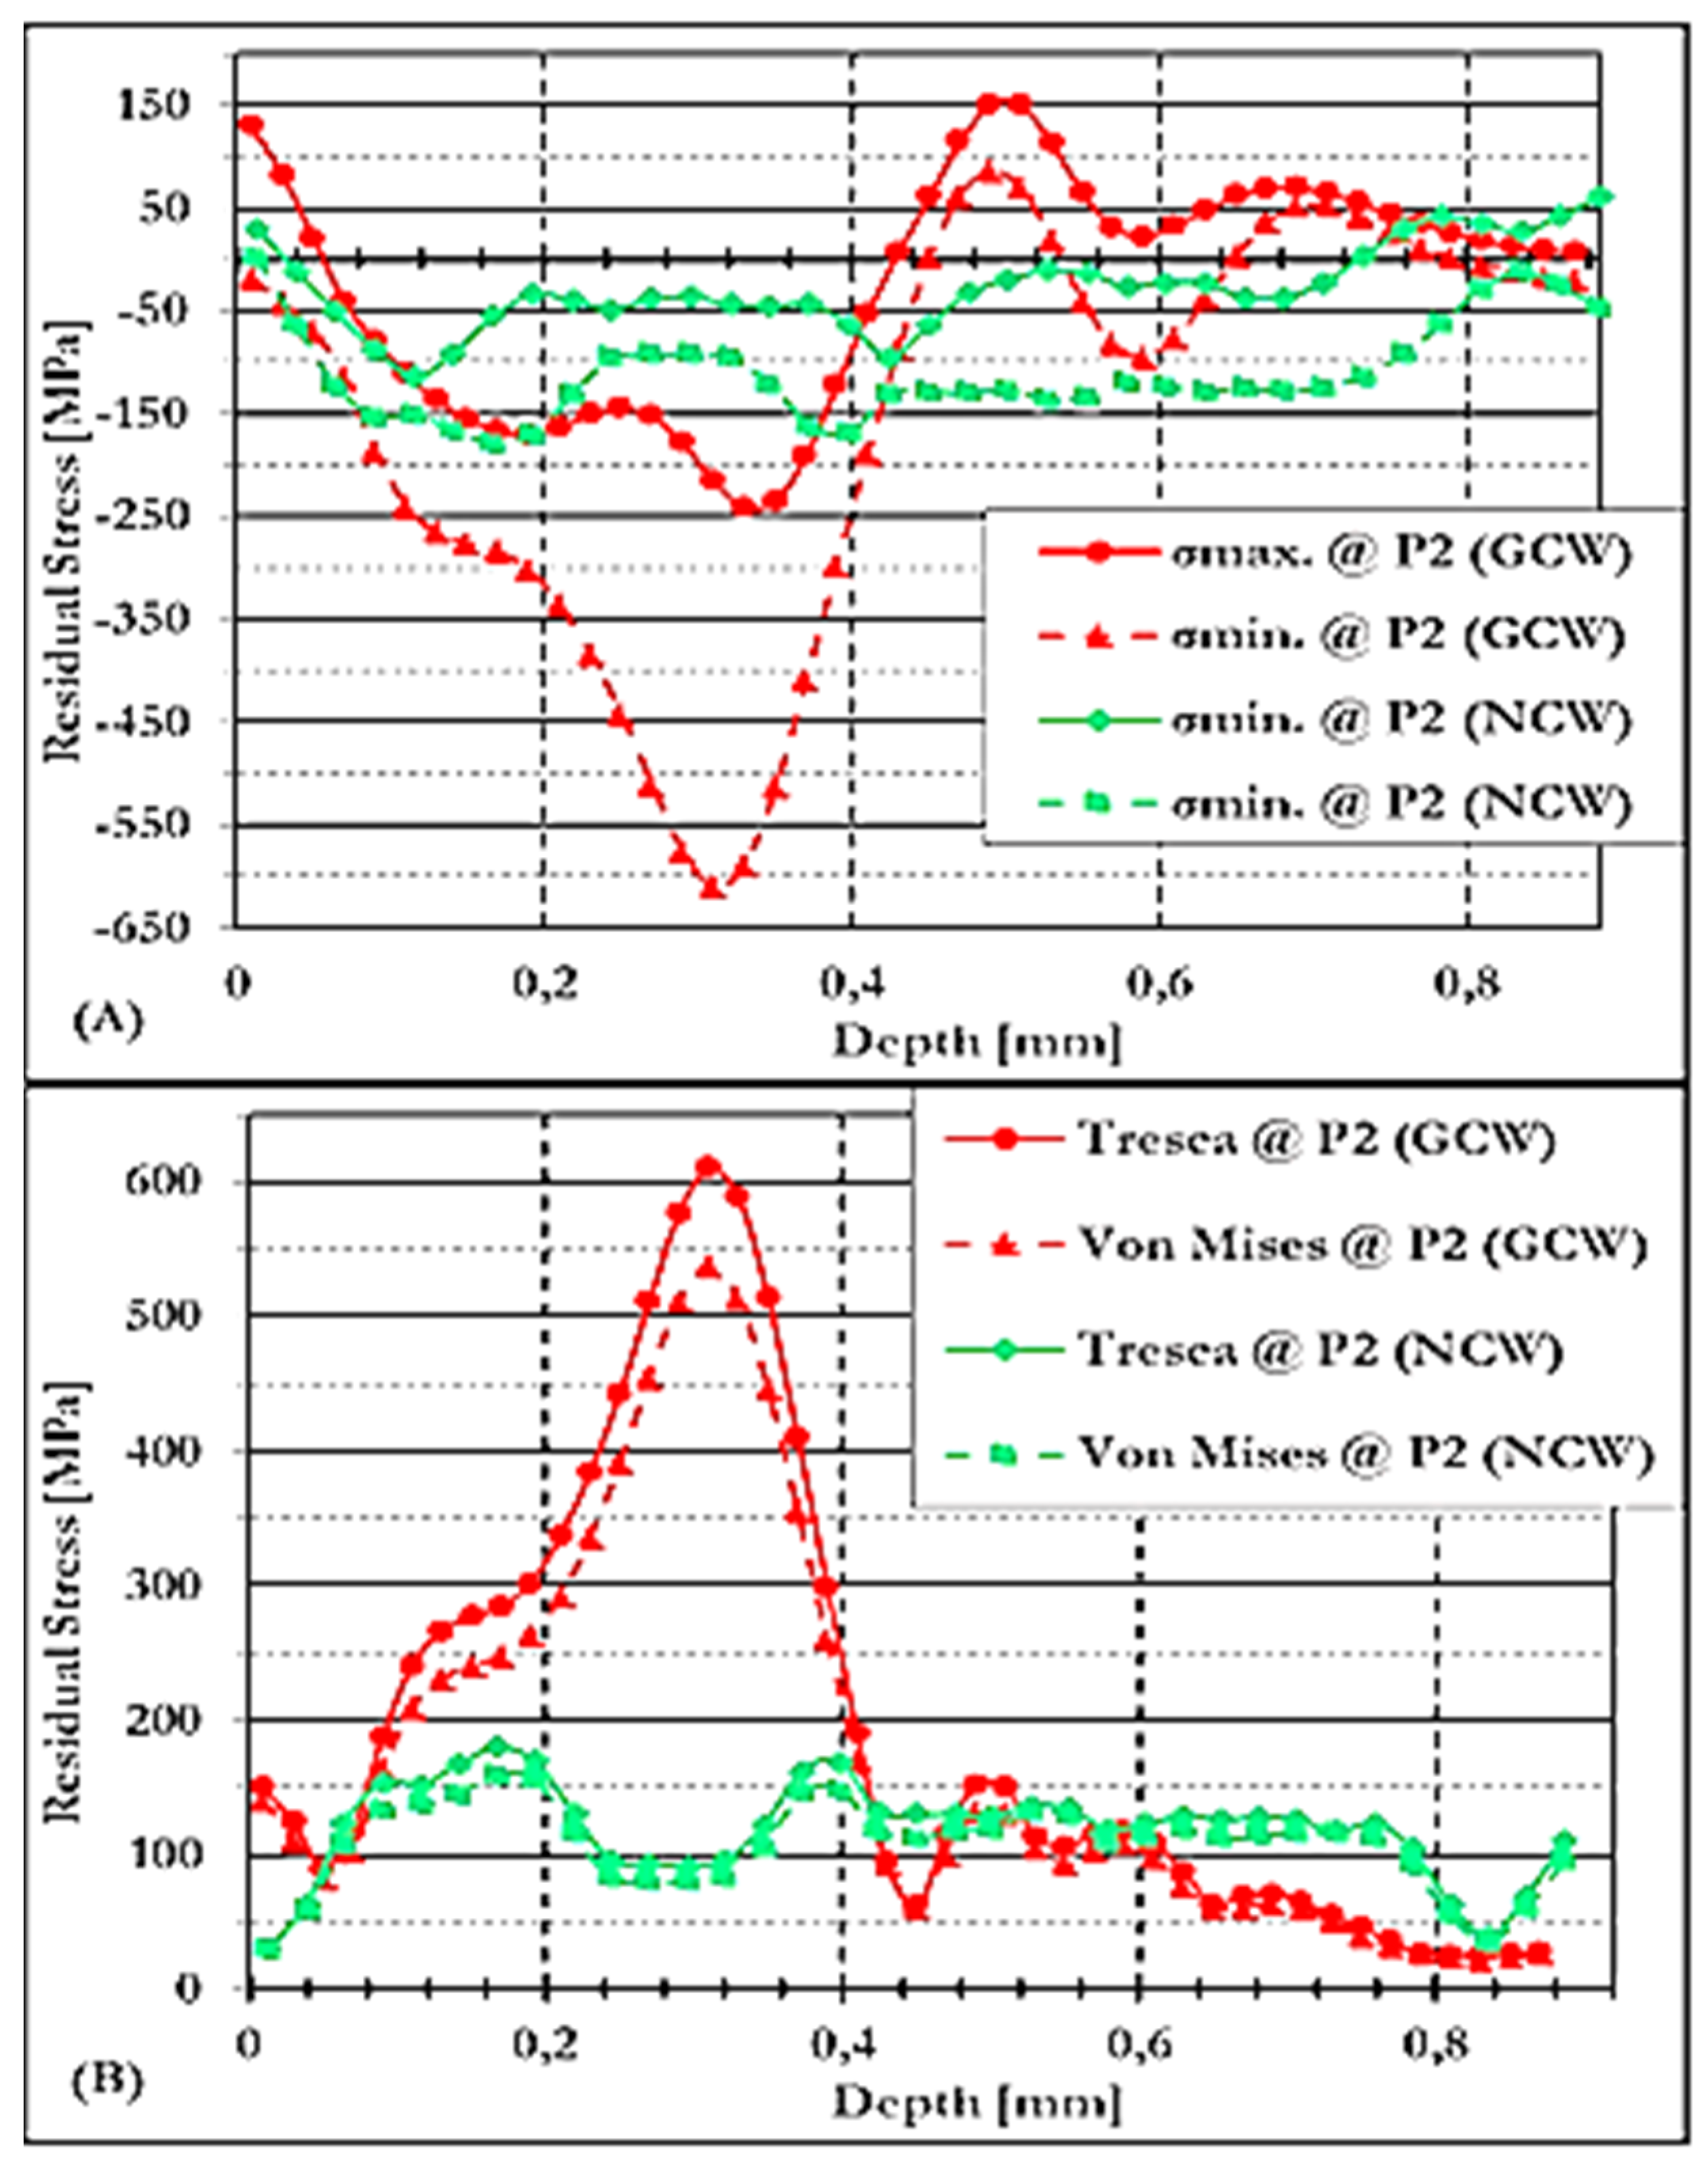
Figure 12.
(A) Evaluation of RS at P1 and P2, and (B) Tresca and Von Mises stresses under GCW conditions.
Figure 12.
(A) Evaluation of RS at P1 and P2, and (B) Tresca and Von Mises stresses under GCW conditions.
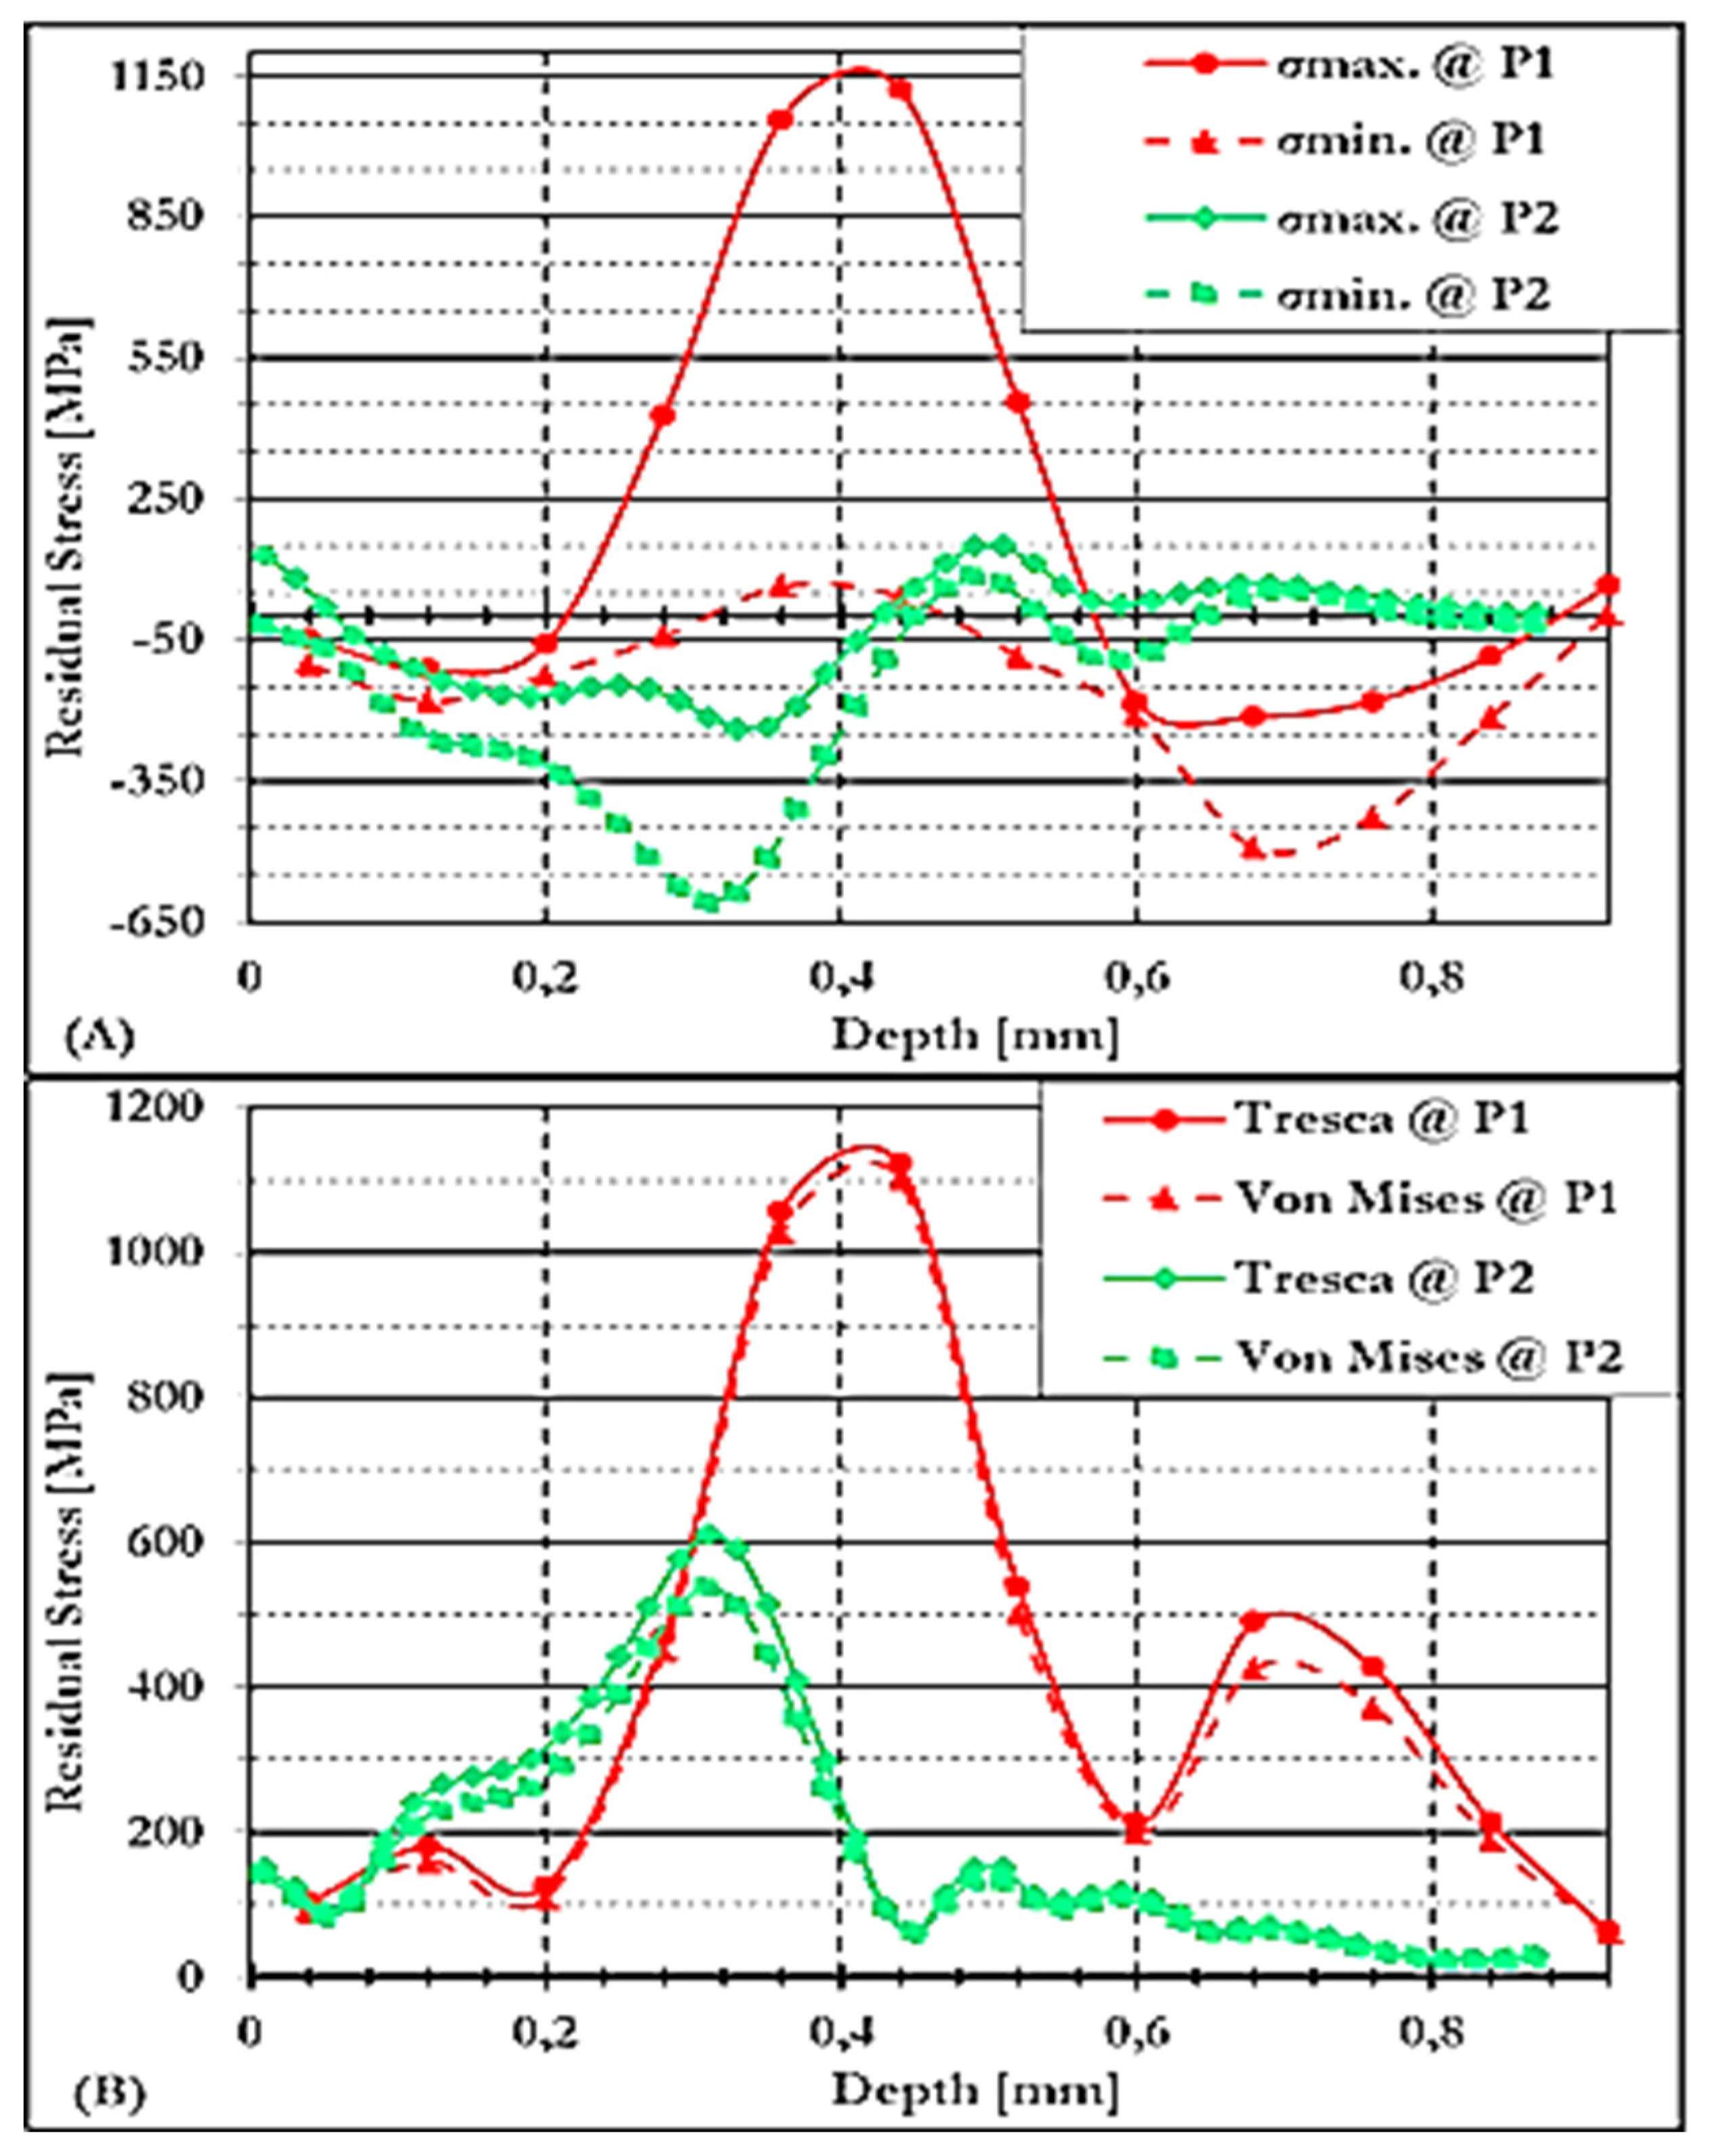
Figure 13.
(A) Evaluation of RS at P1 and P2, and (B) Tresca and Von Mises stresses under NCW conditions.
Figure 13.
(A) Evaluation of RS at P1 and P2, and (B) Tresca and Von Mises stresses under NCW conditions.
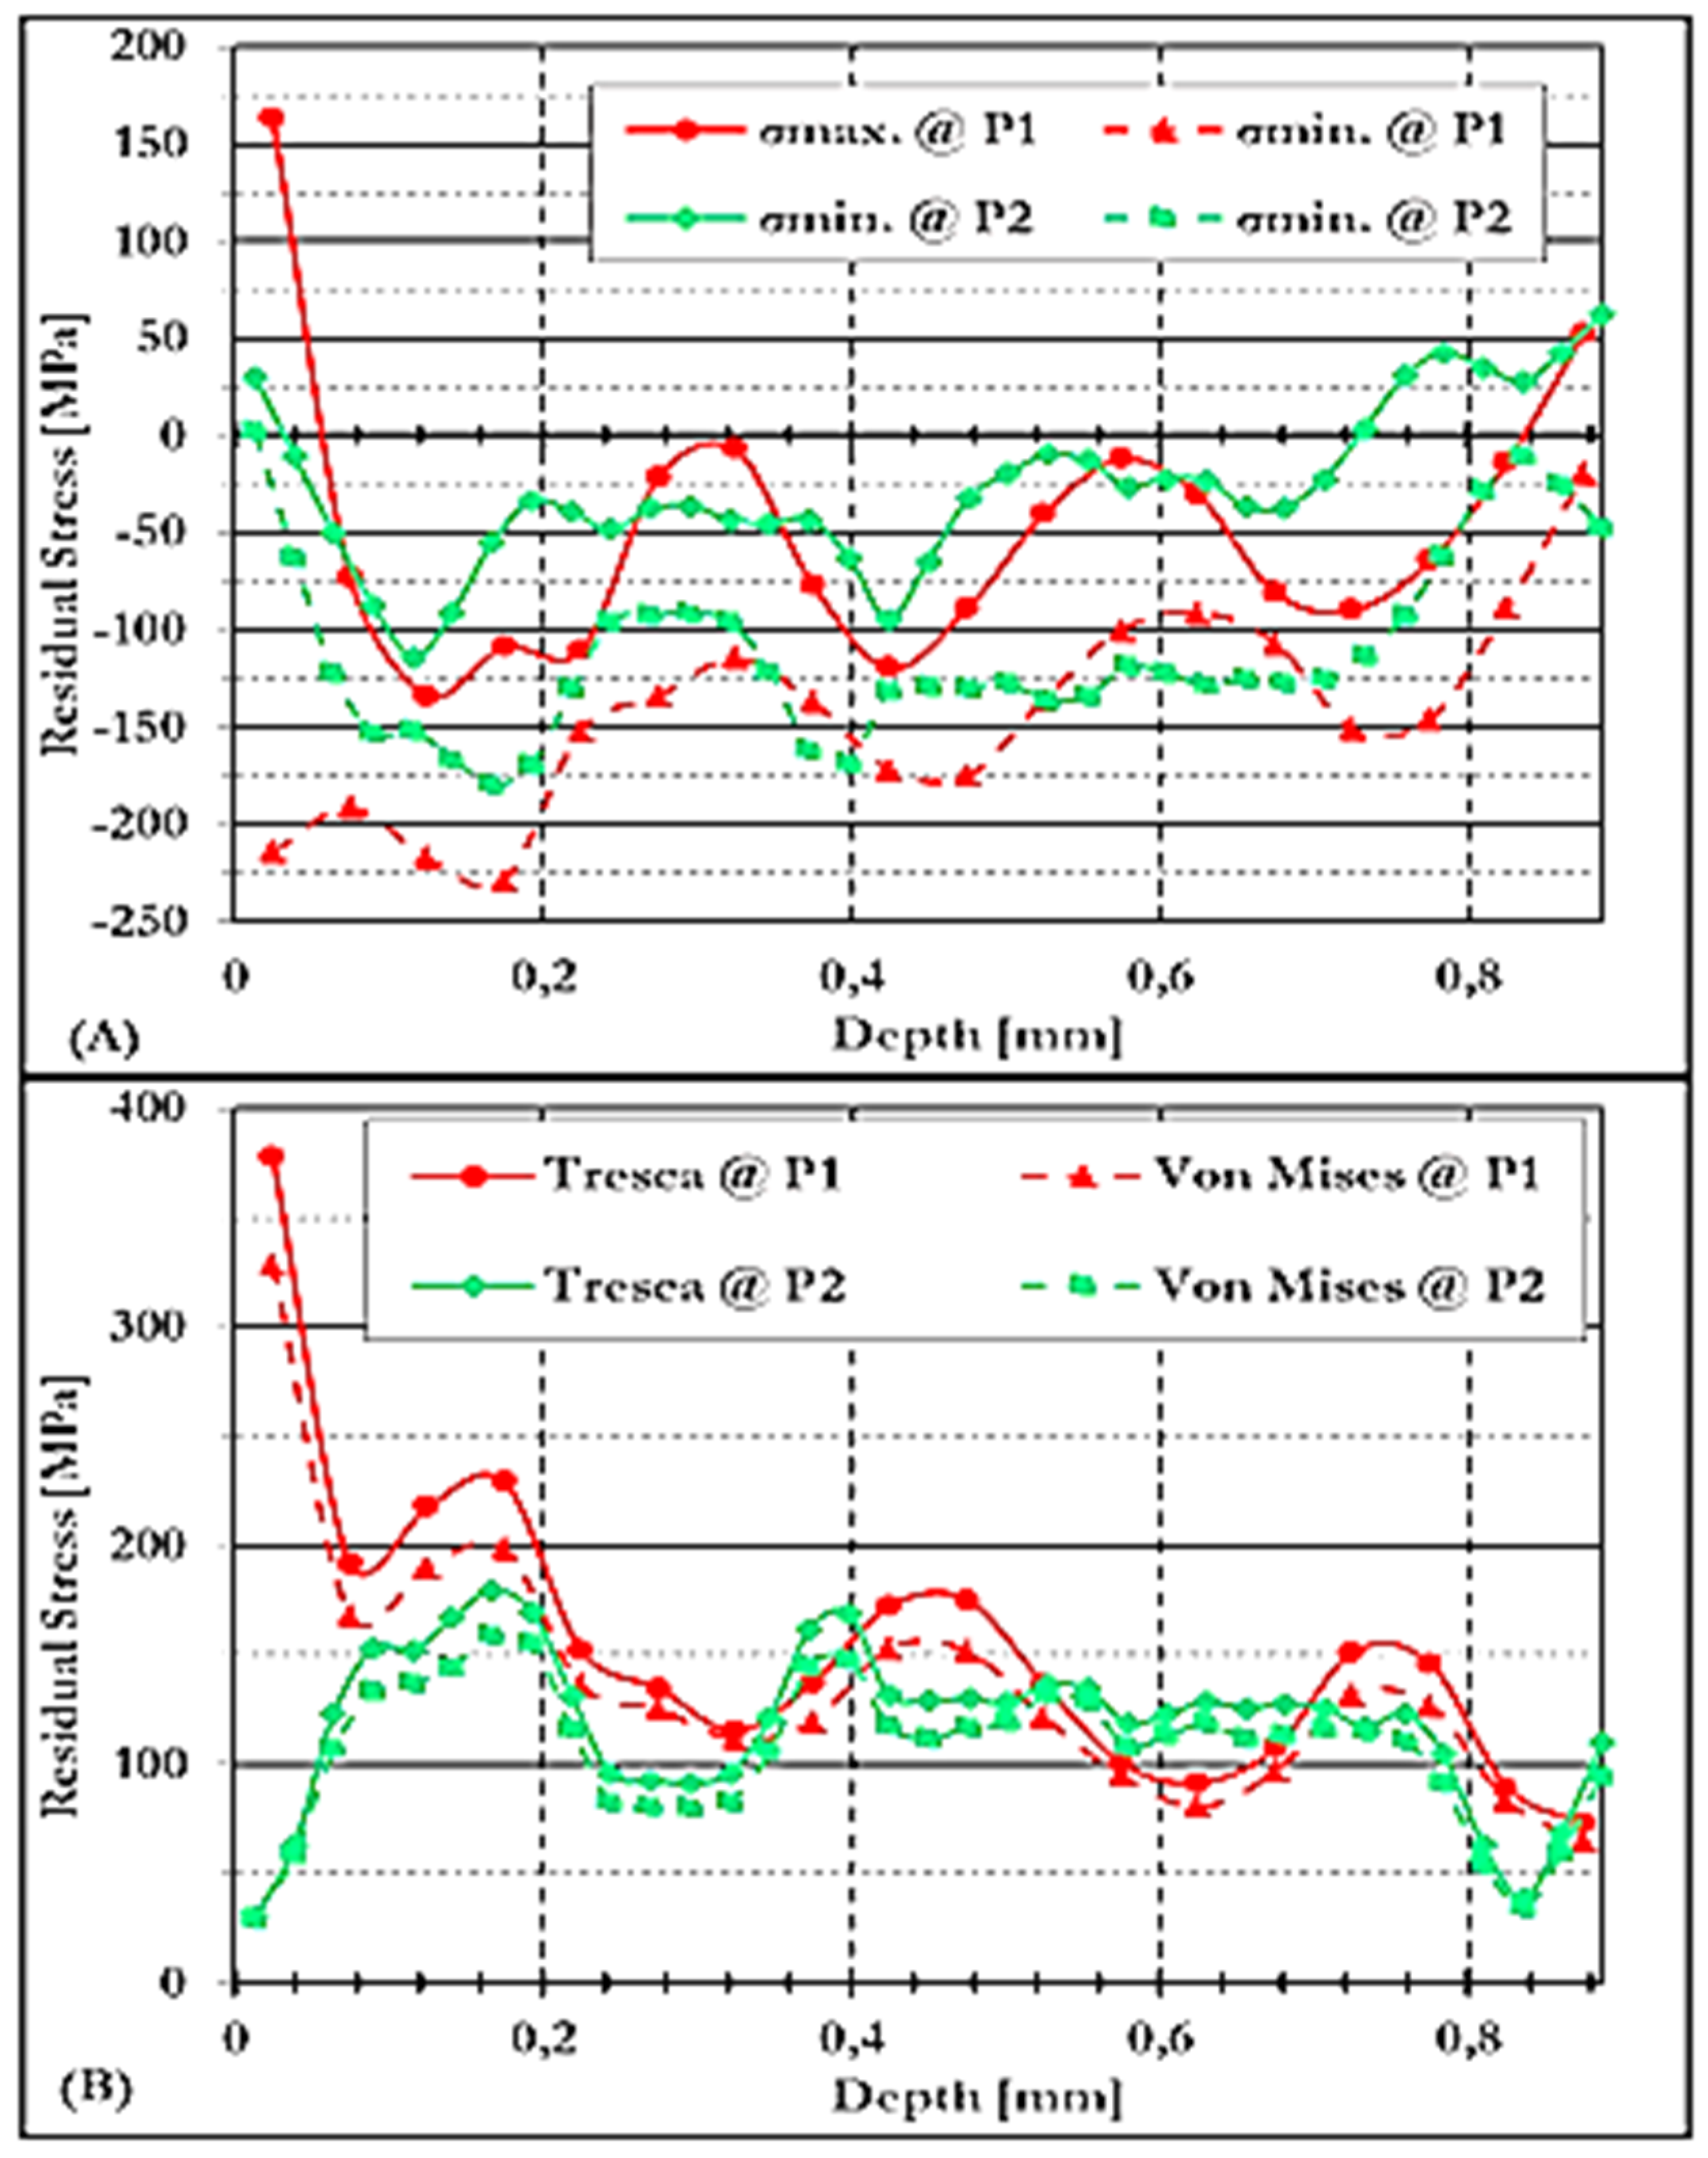
Figure 14.
Comparison of S/A and S/B casting components in stress lattice cast products under GCW conditions at P1.
Figure 14.
Comparison of S/A and S/B casting components in stress lattice cast products under GCW conditions at P1.
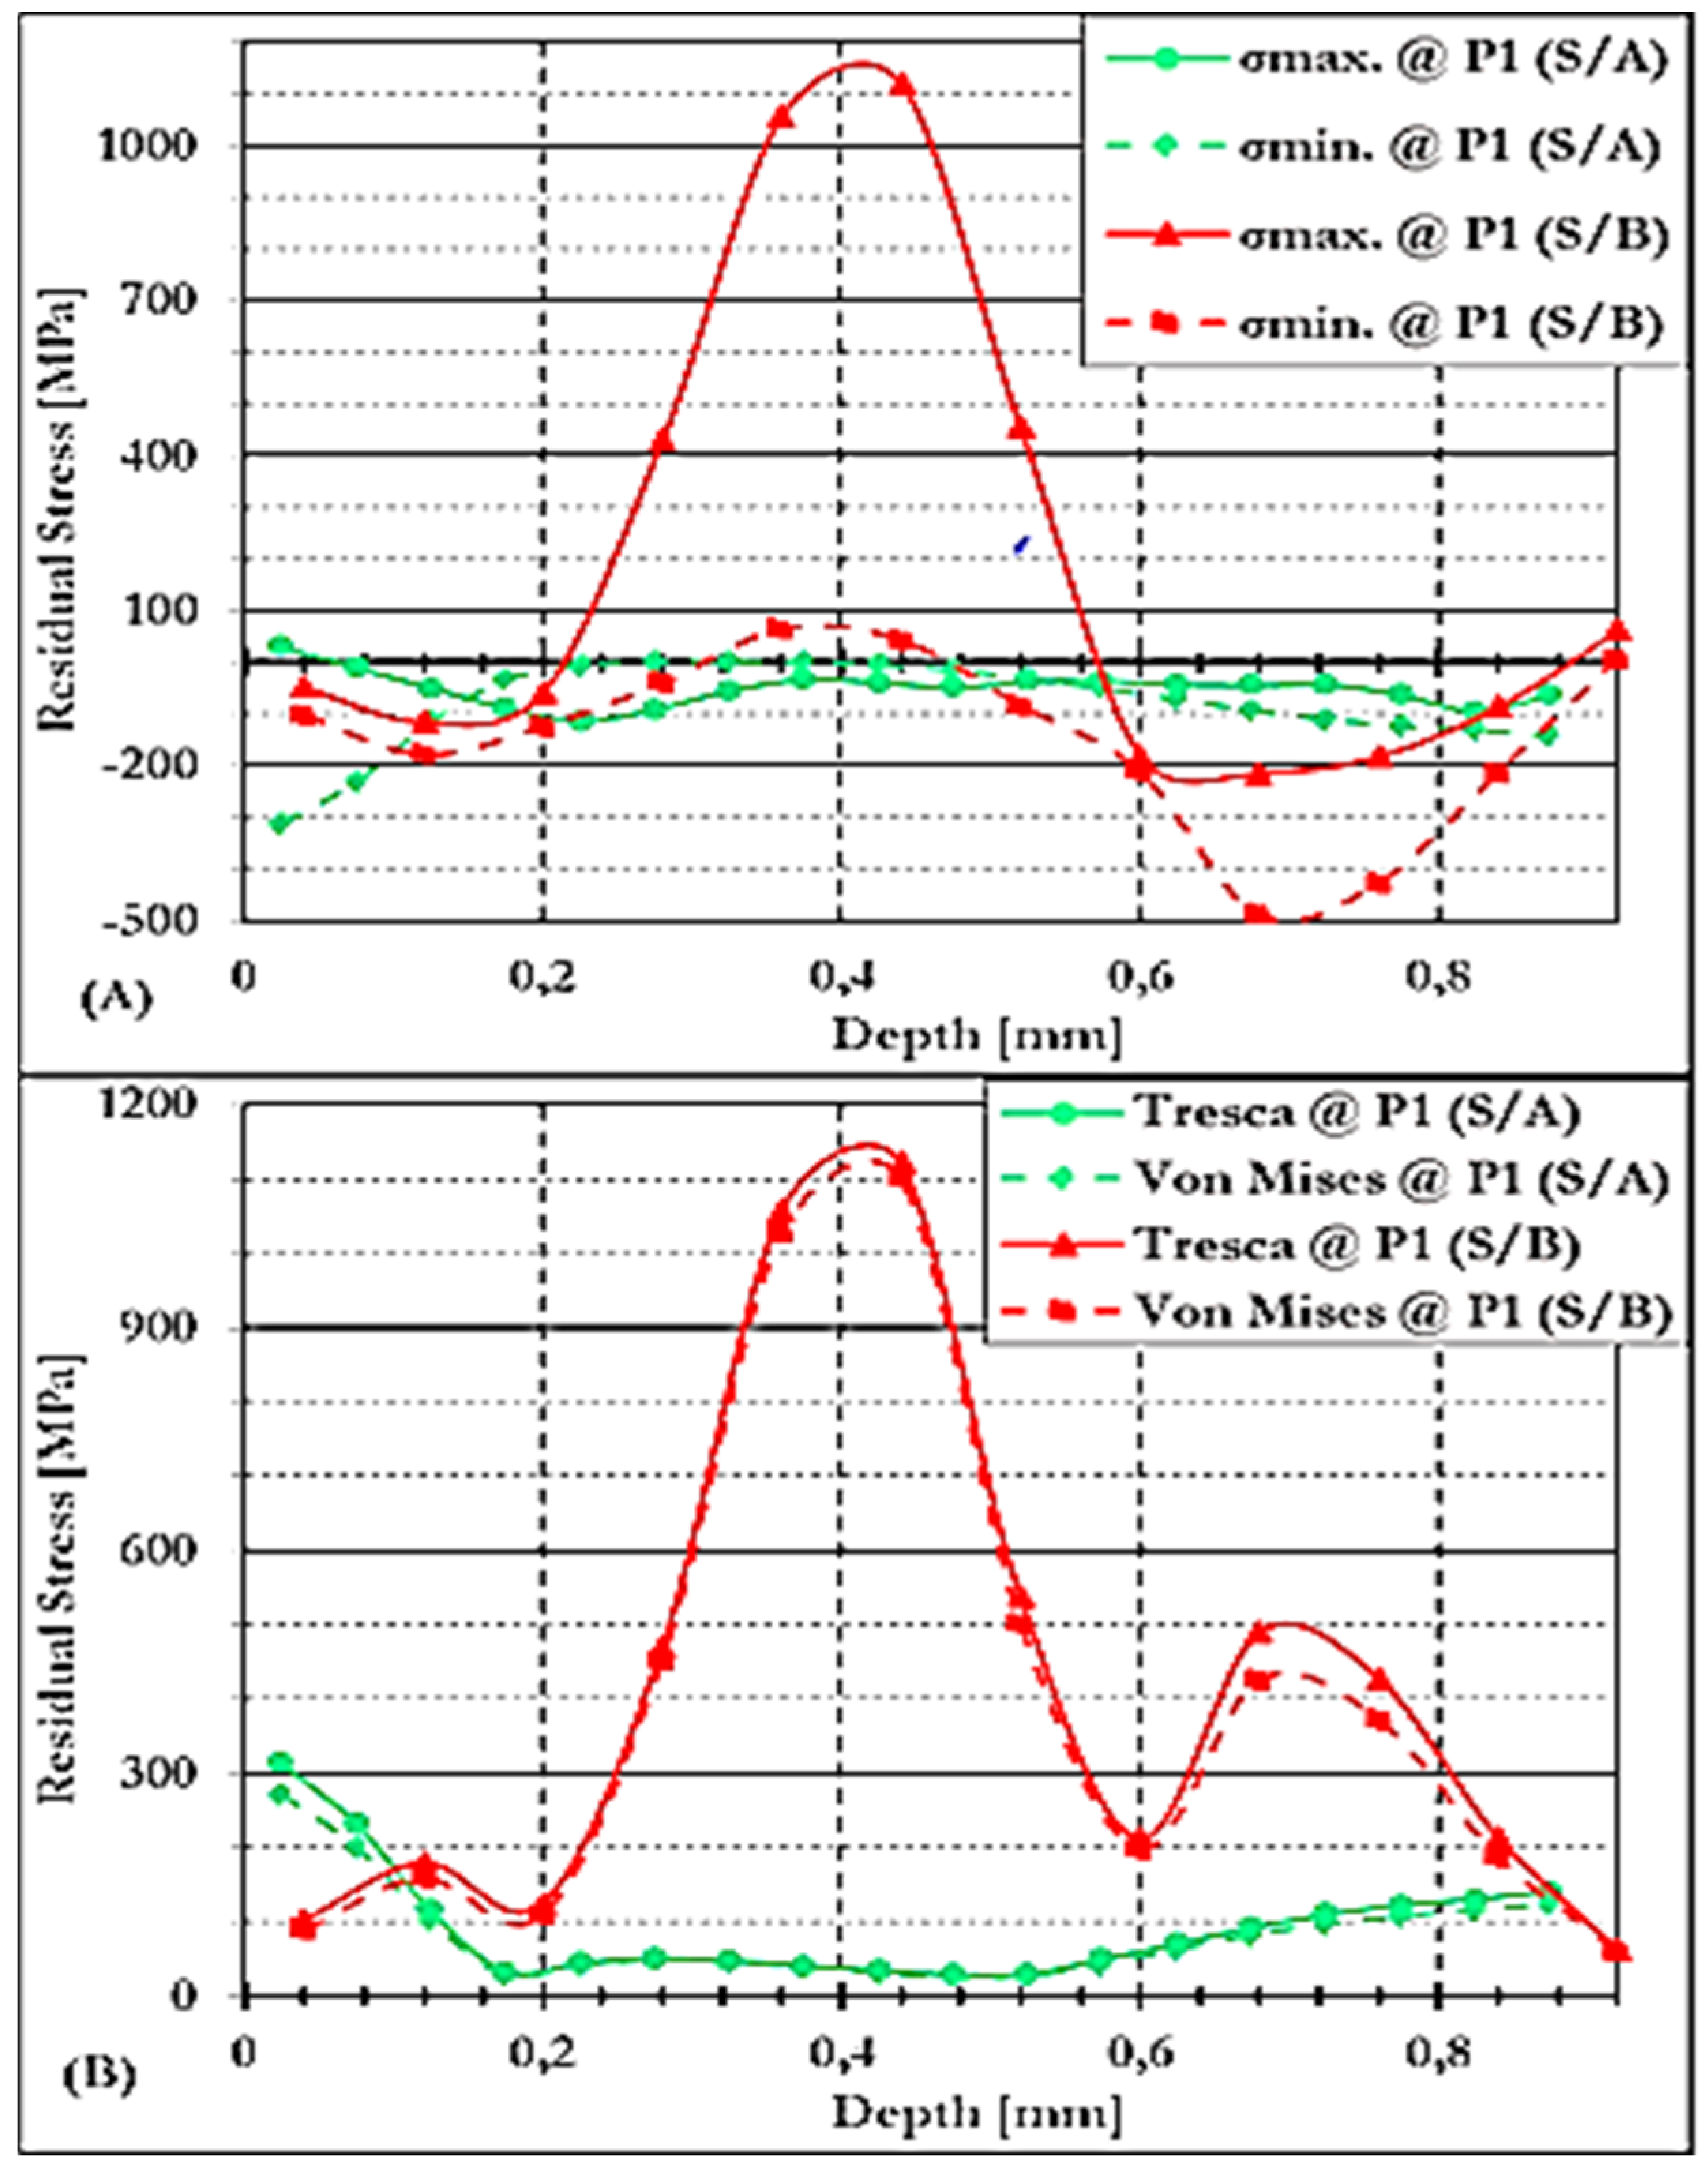
Figure 15.
Comparison of S/A and S/B casting components in stress lattice cast products under NCW conditions at P1.
Figure 15.
Comparison of S/A and S/B casting components in stress lattice cast products under NCW conditions at P1.
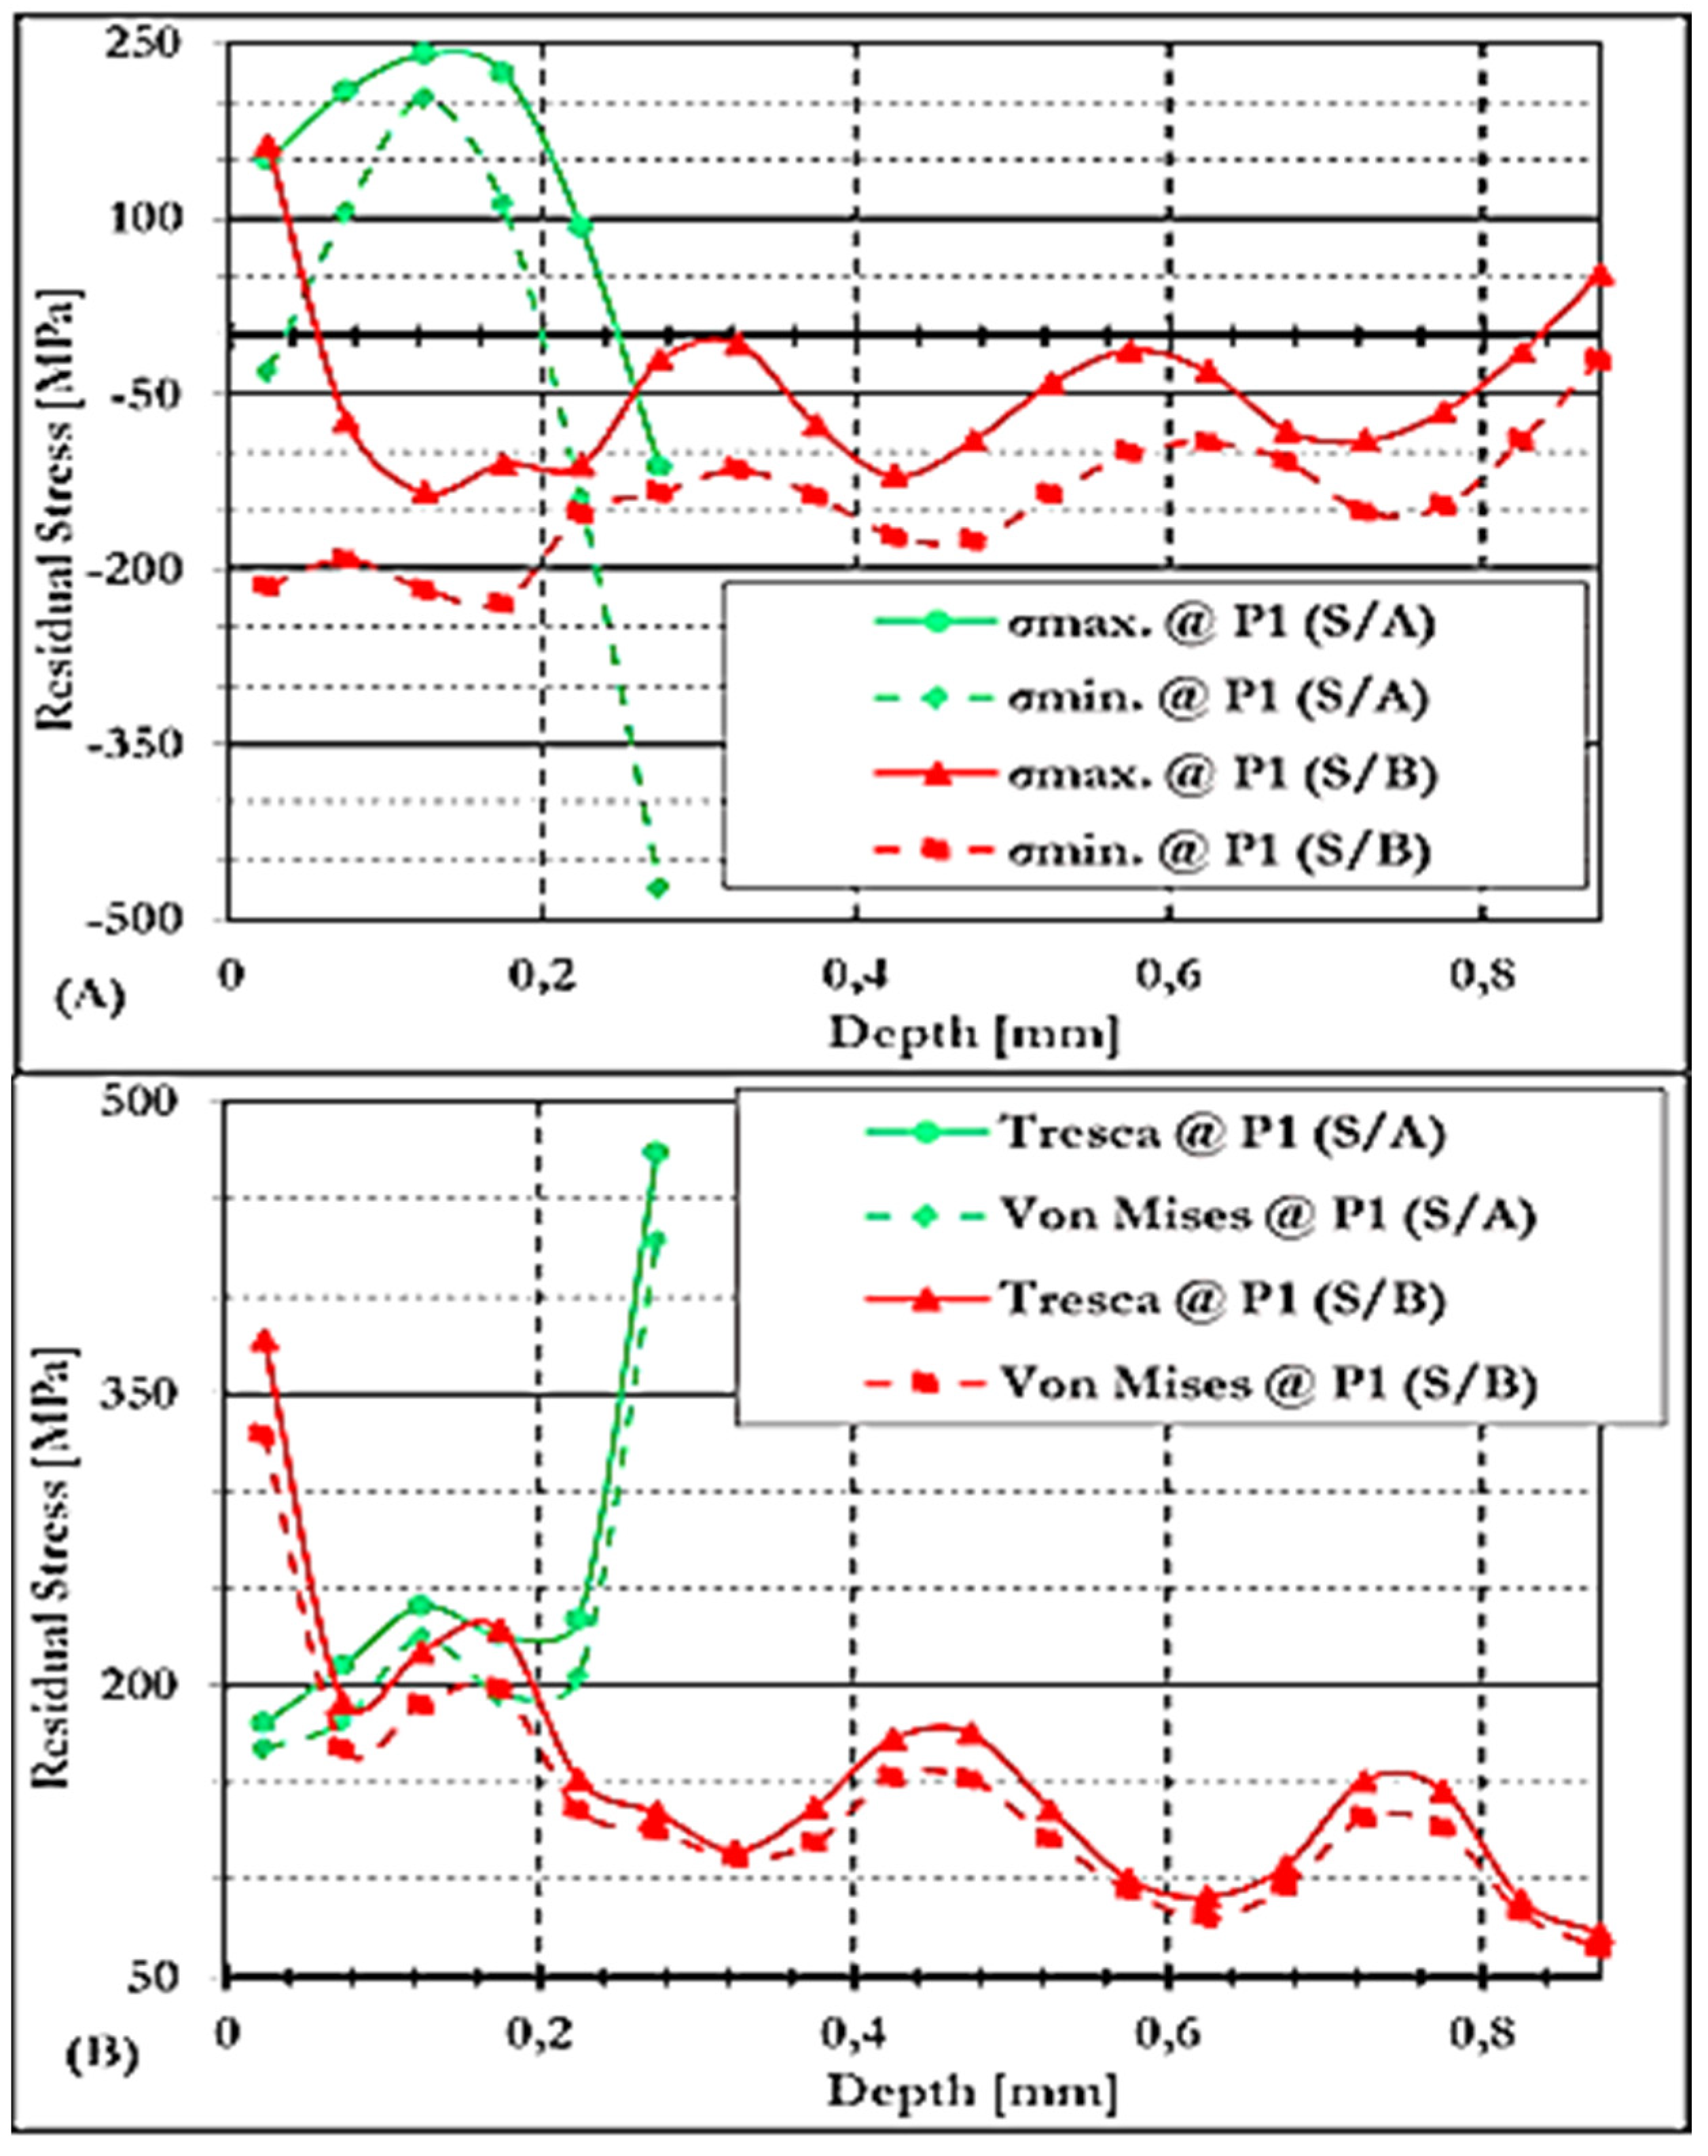
Figure 16.
Comparison of S/A and S/B casting components in stress lattice cast products under GCW conditions at P2.
Figure 16.
Comparison of S/A and S/B casting components in stress lattice cast products under GCW conditions at P2.
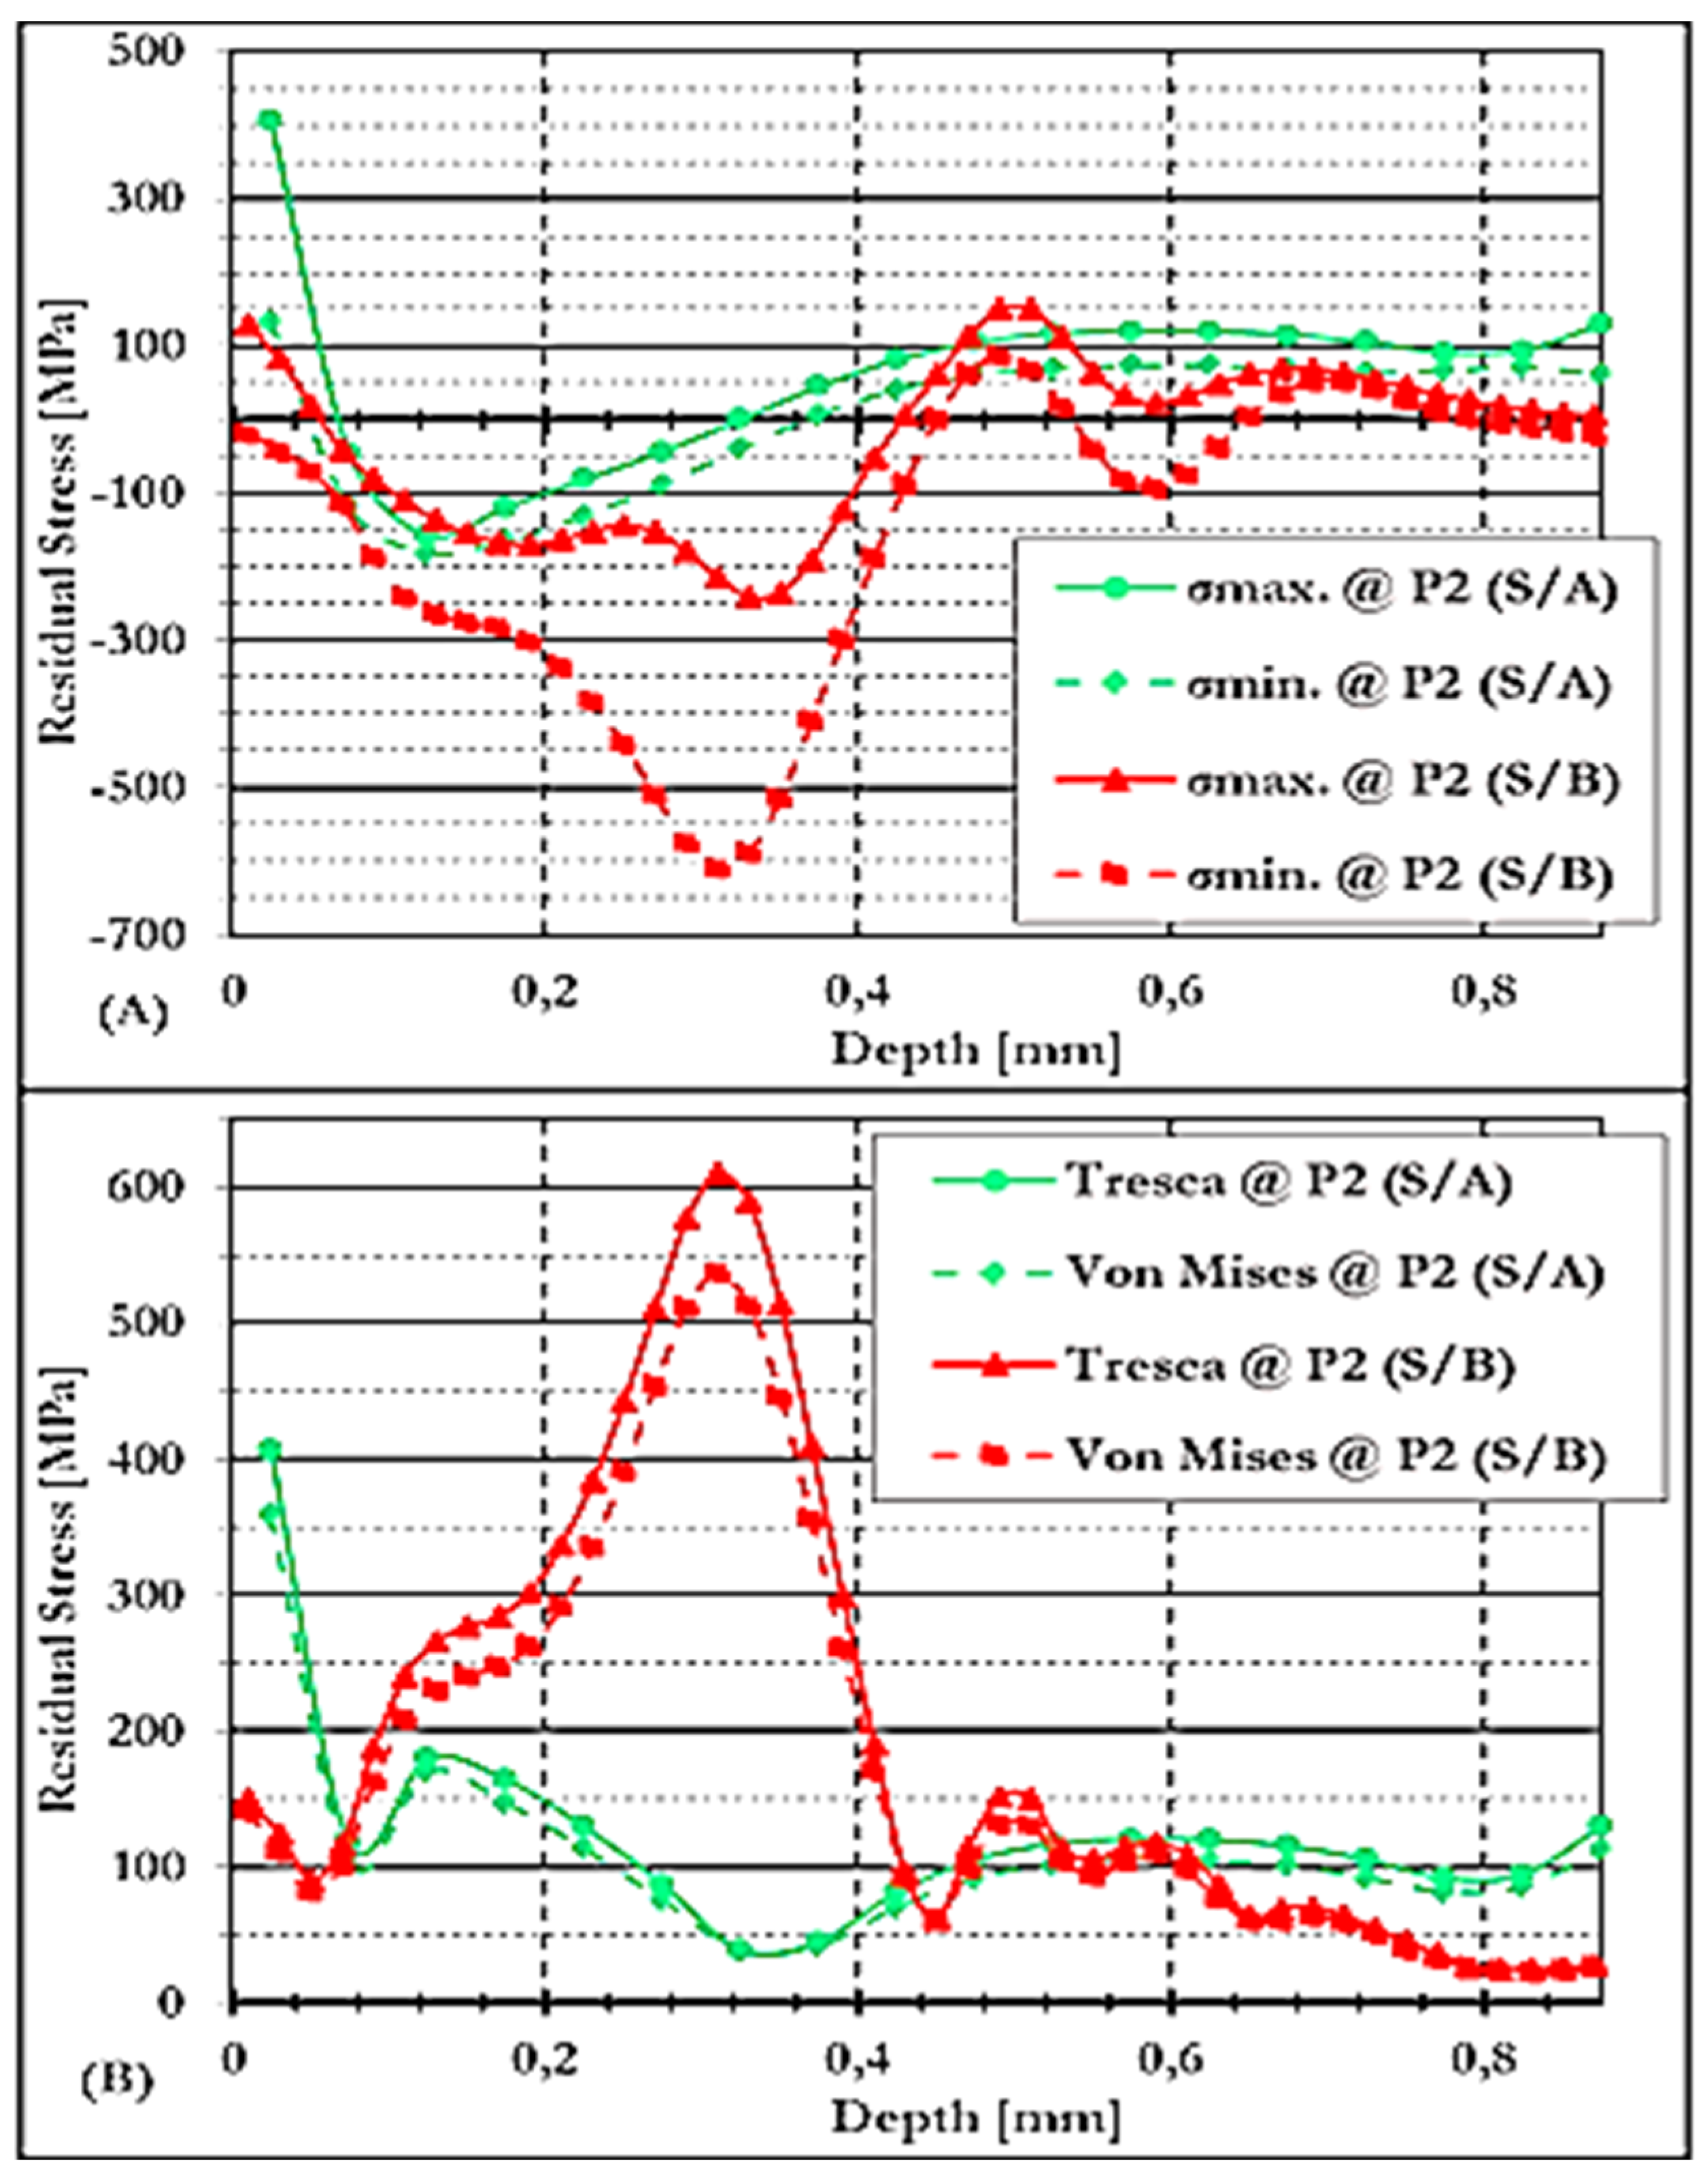

Table 1.
Casting and shakeout process parameters.
| Casting Parameters | Casting Identity Number (CId) | |
|---|---|---|
| S/A | S/B | |
| Melting Temperature (TM) in oC | 1480.00 | 1480.00 |
| Casting Temperature (TC) in oC | 1384.00 | 1390.00 |
| Casting Shakeout Temperature (CST) in oC | 60.00 | 180.00 |
| Knockout Period (CKP) in minutes (mins) | 1645.00 | 1295.00 |
| Pouring Time (PT) in seconds (secs) | 22.00 | 23.00 |
| Gross Casting Weight in Kilograms (kg) | 114.28 | 113.48 |
| Net Casting Weight in Kilograms (kg) | 90.16 | 88.25 |
Table 2.
Cast chemical analysis of experimental heats of ASTM A532, Type A and Class III.
| Element | Composition (wt. %) | Casting Identity Number (CId) | |
|---|---|---|---|
| S/A | S/B | ||
| C | 2.0 – 3.3 | 2.50 | 2.70 |
| Si | ≤ 1.50 | 0.60 | 0.73 |
| Mn | ≤ 2.00 | 0.66 | 0.66 |
| S | ≤ 0.100 | 0.054 | 0.075 |
| P | ≤ 0.060 | 0.026 | 0.070 |
| Cr | 23.0 – 30.0 | 24.09 | 25.65 |
| Mo | ≤ 3.00 | 0.19 | 0.17 |
| Ni | ≤ 2.50 | 0.36 | 0.44 |
| Cu | ≤ 1.20 | 0.20 | 0.12 |
| Fe | bal. | 71.00 | 69.00 |
| CVF (%) | 28.87 | 32.19 | |
| Cr/C Ratio | 9.6 | 9.50 | |
Disclaimer/Publisher’s Note: The statements, opinions and data contained in all publications are solely those of the individual author(s) and contributor(s) and not of MDPI and/or the editor(s). MDPI and/or the editor(s) disclaim responsibility for any injury to people or property resulting from any ideas, methods, instructions or products referred to in the content. |
© 2025 by the authors. Licensee MDPI, Basel, Switzerland. This article is an open access article distributed under the terms and conditions of the Creative Commons Attribution (CC BY) license (http://creativecommons.org/licenses/by/4.0/).
Copyright: This open access article is published under a Creative Commons CC BY 4.0 license, which permit the free download, distribution, and reuse, provided that the author and preprint are cited in any reuse.


