Submitted:
26 June 2025
Posted:
26 June 2025
You are already at the latest version
Abstract
This study investigates the structural and modal behavior of two-piece cardan shafts constructed from conventional and composite materials. Material selection included Steel SM45C, Hardox 400, Stainless Steel, and two composite coatings Carbon Epoxy and E-Glass Polyester applied on a steel core. Finite element analyses in ANSYS Workbench 2021 R2 were conducted to assess the cardan shaft's total deformation, shear stress, maximum principal stress, strain energy, and natural frequency. Under torsional loading of 1250 N·mm at 2000 rpm, Hardox 400 showed the highest total deformation of 0.778 mm, while Steel SM45C had the lowest at 0.398 mm. Maximum principal stresses ranged between 2.4041 MPa (Stainless Steel) and 3.1634 MPa (E-Glass Polyester). Modal analysis revealed that Hardox 400 displayed the lowest fundamental natural frequency at 1191.1 Hz, while Carbon Epoxy exhibited the highest at 952.96 Hz. Across higher-order modes up to Mode 16, Carbon Epoxy and Stainless Steel consistently yielded the highest natural frequencies (~8802.3 Hz), while Hardox 400 showed the most compliant behavior (~5314.5 Hz). These findings highlight that material selection greatly influences dynamic performance, making composite and stainless-steel coatings promising for lightweight, high-speed automotive driveshafts.
Keywords:
Cardan shaft
; SOLIDWORKS
; finite elements analysis
; Ansys
; composite material
; hardox400
1. Introduction
The purpose of the cardan (universal-joint) drive is to transfer torque to separate powertrain components, each of whose axes may move while the engine is operating. Shafts, intermediate support, and universal joints comprise a basic cardan drive as shown in Figure 1 and 2. The angles of inclination of the shafts of cardan drives are the primary determinant of their operating conditions. The cardan drive's service conditions get heavier as these angles increase [1,2,3].
The mechanisms to which the cardan drive transmits torque determine the shaft angle. For instance, the cardan shaft's angle of inclination shouldn't be greater than 3-5° for the transmission, transfer case, or intermediate support [4]. Erection errors in the unit and frame deformations that happen while the car is operating could be the cause of this misalignment. Under the most severe conditions, the cardan drive of the front steerable wheels may function at an angle of up to 40°, with variations in both direction and amplitude [5].
A change in the distance between the units is necessary for the cardan drive to function. Cardan drives must be designed with this in consideration, and moveable splined joints should be utilized. Depending on what these drives are used for, cardan drives have different demands. Every type of cardan drive must meet the general specifications listed below [6].
When the cardan drive is operating, all joins should have have high efficiency and low friction including splined joints. It should ensure consistent rotation of the mechanism's shaft and provide for the absence of resonance phenomena. It also should minimize noise and vibration loads; and it should guarantee dependable torque transmission and long servicing intervals for the transmission [6].
The cardan drive's primary component is the universal joint. The maximum allowable angle of shaft inclination and the drive's kinematic diagram are determined by the type of joints [7].
Variable- and constant-velocity universal joints are the two categories of these joints. When the shafts are slightly inclined to one another, the former (asynchronous) are distinguished by the periodic inequality of the angular velocities of the driven and drive shafts. The angular velocities of the shafts connected by constant-velocity (synchronous) universal joints are same at all angular displacements of these shafts. The drives of steerable driving wheels are mostly where they are employed [8].
The joints' construction can be both flexible and rigid (elastic). Torque is delivered in rigid joints by the hinged joint of the pieces, whereas in flexible joints via the portions with high pliability. Figure 2 shows movable splined joints are used to make up for variations in cardan drive length that occur during operation [9]. The axial force of friction, Fa, manifests when the torque load causes the cardan shaft's splines to shift can be obtained from eq.1.
where, is the torque transmitted by the cardan shaft; is the coefficient of friction; r is the average radius of the spline's lateral working surface [4,9].
1.1. Cardan Shaft Types
- A.
- Cardan shafts without length displacement
- B.
- Cardan shafts with length displacement
For many applications, the universal joint shaft needs to be length corrected. For universal joint shafts, offset and length correction are accomplished through the middle section compared to other drive elements.
Universal joint shafts are available in two length compensation types: the involute profile and the SAE profile, which is a straight flank shape. The length compensation depends on the size and series of universal joint shafts.
- C.
- Cardan with roller bearing-tripod universal joint shafts
Tripod universal joint shafts are made up of standard joints with a unique central piece added. The length correction uses roller bearings in the middle portion to significantly reduce the axial displacement forces as shown in Figure 3. Because of this, axial displacement forces remain extremely low and nearly constant across the torque range [10].
There is a guide shaft and a guide hub in the central part. At one end of the guide shaft there are three bolts that are equipped with roller bearings. There is a 120° offset between the bolts. Three matching grooves on the guide hub are designed to hold the roller bearings. These kinds of universal joint shafts are perfect for drives that need to continuously adjust for large axial movements [11,12].
1.2. Objectives
One component of the cardan (universal-joint) drive is the cardan shaft. The universal joints it is attached to determine its design. The shaft often consists of ends and a middle section. Either a solid or hollow (tubular) core may be present. When driving constant-velocity universal joints, solid shafts are used since they function as axle shafts. Compared to solid shafts, tubular shafts have higher critical rotational speeds and are capable of transmitting sufficient torques due to their reduced bulk. As consequence, the majority of vehicles' transmissions depend on them. Usually, low-carbon cold-or hot-rolled strip with a thickness of 1.85 – 2.50 mm is used to create the central tube portion. Steel 40X is used for the splined ends of moveable joints. Due to the possibility of brinelling in the needle bearings of universal joints, the installation angles of the cardan drive should not be less than 1°; under nominal load in the static state, these angles should not exceed 4-6°. The needle bearing's life reduces four times when y varies between 4 and 16°.
Additionally, the intermediate supports are offered in Figure 4 to increase the cardan shaft's crucial rotating speed. This allows for the use of two shafts as opposed to one. The installation of an intermediate support necessitates the use of more universal joints. The cardan drive in multidrive vehicles is quite intricate. Schematics with separate drives for each driving axle or ones with a drive to both axles at the same time are typically used as in Figure 1.
This study compares the examination of shafts with different materials, which results in weight reduction through the use of modal and static structural analyses to determine the vibrations within the shaft.
1.3. Problem Statement
The major objective of this study is to replace conventional steel drive shafts with hardox 400 materials for short cardan shafts with length displacement. In addition, increased strength and low weight requirements for composite two-piece drive shafts will be studied through comparison with composite material.
Hardox 400 is an all-purpose steel with a nominal hardness of 400 HBW that is resistant to wear and abrasion. Because of its great toughness, bendability, and weldability, it works well for equipment that is subjected to moderate wear. Hardox is a combination of high hardness and toughness, which increases wear resistance and resistance to dents and impacts. The composite materials, which weigh significantly less than hardox, are replacing the steel propeller shaft. In comparison to hardox, composite materials are less expensive. For the composite drive shaft, the materials E-Glass-Epoxy and Carbon-Epoxy are chosen. Due to their strong orthotropy, composites' fractures have not been thoroughly investigated.
The two-piece cardan shaft is used in vehicles made of composite materials. For the examination of structural and free vibration, numerical simulation is applied. It was assumed in the research of the cardan shaft that the shaft rotates at a constant speed (2000 rpm), has a circular cross section, and is balanced. The damping and nonlinear effects were neglected. The beneficial properties of composite materials have drawn scientists from all around the world. It is widely used in the automotive industry. Composite materials can also be used in the manufacturing of the drive shaft.

Table 1.
Dimensional data and load ratings for couplings[12].
Table 1.
Dimensional data and load ratings for couplings[12].
| Size | MdB (Nm) | MdG (Nm) | d1 (mm) | d2 (mm) | d3 (mm) | z x d4 (mm) | b (mm) | t1 (mm) | d5 (mm) | t2 (mm) | d7 (mm) |
| 15 | 200 | 350 | 65 | 52.0 | 35 | 4 x 6 | 4.5 | 2 | 42 | 8 | 60 |
| 30 | 800 | 1100 | 90 | 94.5 | 47 | 4 x 8 | 6.0 | 3 | 62 | 12 | 90 |
| 43 | 1800 | 2400 | 100 | 84.0 | 57 | 6 x 8 | 6.3 | 3 | 50 | 20 | 98 |
| 53 | 3000 | 4200 | 120 | 101.5 | 75 | 8 x 10 | 8.0 | 3 | 70 | 22 | 115 |
| 63 | 4400 | 6200 | 150 | 130.0 | 90 | 8 x 12 | 10.0 | 3 | 95 | 24 | 125 |
| Size | KZ max | B (mm) | e (mm) | LZ min (mm) | LA min (mm) | m min (kg) | J min (kgm²) | C min (kNm/rad) | LZ max (mm) | LA max (mm) | m max (kg) | J max (kgm²) | C max (kNm/rad) |
|---|---|---|---|---|---|---|---|---|---|---|---|---|---|
| 15 | 43 | 25 | 32 | 225 | 20 | 1.6 | 0.0010 | 5.5 | 250 | 25 | 1.8 | 0.00103 | 5.4 |
| 30 | 43 | 40 | 40 | 230 | 15 | 3.3 | 0.0022 | 18.2 | 315 | 60 | 4.1 | 0.0024 | 17.3 |
| 30 | 40 | 40 | 47 | 245 | 15 | 3.5 | 0.0025 | 17.5 | 320 | 60 | 4.3 | 0.0027 | 16.6 |
| 43 | 43 | 40 | 48 | 280 | 25 | 5.5 | 0.0050 | 37.2 | 400 | 60 | 7.4 | 0.0058 | 34.2 |
| 43 | 40 | 58 | 300 | 25 | 5.9 | 0.0062 | 34.0 | 420 | 60 | 7.8 | 0.0062 | 31.3 | |
| 53 | 43 | 50 | 56 | 315 | 30 | 8.0 | 0.0106 | 51.3 | 450 | 80 | 10.3 | 0.0120 | 46.5 |
| 53 | 44 | 75 | 70 | 365 | 35 | 9.3 | 0.0120 | 50.1 | 500 | 85 | 12.2 | 0.0134 | 46.5 |
| 63 | 43 | 62 | 62 | 365 | 35 | 13.5 | 0.0230 | 76.9 | 505 | 110 | 17.5 | 0.0245 | 79.0 |
| 63 | 44 | 35 | 80 | 400 | 35 | 14.6 | 0.0250 | 78.5 | 540 | 110 | 18.6 | 0.0265 | 72.0 |
2. Methodology
The dimensions and design of the shaft and its supports determine the critical rotational speed. Considering a shaft that is freely positioned on rigid hinged supports, the critical rotational speed can be calculated from eq.2. Assume that point O, which has eccentricity e with respect to the axis of rotation, is the concentration of the shaft mass m [9]. The way to express the centrifugal force is
where y eq.3 is the sag of the shaft under the action of the force F. The centrifugal force is balanced by the elastic force.
where the c is lateral stiffness of the shaft
For the shaft with evenly distributed mass and lying on hinged supports
where E is young’s modulus
The moment of inertia of the shaft can be obtained from eq.4
Then at
Hence
For tubular shaft eq.5 can be used
where D and d, are respectively the outer and inner diameters of the shaft, L is length of the shaft, is the density of the material.
Substituting the values of c and m
Then, for the tubular shaft from eq.6
To determine angular frequencies eq.7 can be used
Equation of motion can be obtained from eq. 8 and 9.
The kinetic of potential energy are obtained from eq. 10 and 11.
2.1. Design Model Program
Manufacturing of 3D parts is made possible by SolidWorks, from sketches to parts to the definition of mechanical assemblies. Advanced technologies for mechanical design are provided by the program. It offers resources to finish product definition, such as kinematics definition and functional tolerances. There are several uses for tooling design in SolidWorks, including both general-purpose and specialized tooling. Tooling design has many applications available with SolidWorks. Figure 6 shows 3D model for cardan shaft.
2.2. Analysis and Simulation Sofwer
The finite element method is a numerical procedure that can be applied to obtain solutions to a variety of problems in engineering. Finite element methods can be used to study problems in stress analysis that are steady, transient, linear, or nonlinear [13].
Design engineers now frequently use the general-purpose finite element computer program ANSYS. The new features and capabilities included in ANSYS Workbench 2021 R2 provide a more thorough method for directing and optimizing whole product designs. With cutting-edge functionality and features, unique materials, embedded electronics and the heat problems they cause, and control software for smart devices, products are becoming increasingly complex [13].
2.3. Analysis
Analysis was on short cardan shafts with length displacement and the assumptions the shaft rotates at a constant speed at 2000 rpm. The shaft has two sliding shafts and circular cross section. The shaft is perfectly balanced. Better results are achieved with Hexa Mesh, and 173149 elements are created with tiny mesh sizes. Plotting and comparison of the data were done after the standard FEA technique was followed.
2.4. Geometrical model
Figure 7 represents the geometric model of the shaft coupling assembly as imported into ANSYS Workbench 2021 R2. The graphic presents a comprehensive 3D depiction of the assembly, illustrating the primary shaft, flange connections, and universal joints. Importing this CAD model into the simulation software is a crucial initial step in preparing for finite element analysis. It guarantees the accurate transfer of all geometrical features and specific designs of the components into ANSYS. This integrity is essential for achieving correct simulation outcomes, as the exact geometry and interconnections in the model affect load transmission across the assembly during analysis.
Figure 8 illustrates the configuration of boundary conditions and loads imposed on the model during a static structural analysis. The two fixed supports at the ends of the shaft assembly, indicated by blue symbols, unequivocally restrict all movements at those points. A torque of 1250 N·mm is exerted at one end, denoted by the red marker, signifying the torsional moment that replicates operational circumstances. At the opposite end of the shaft, a rotational velocity is specified, indicated by a yellow symbol, reflecting the rotating motion that the connection undergoes during actual operation [1]. Collectively, these limitations and loads enable the static structural analysis to assess the stress and deformation characteristics of the shaft coupling subjected to torsional loads. This configuration facilitates a precise evaluation of the shaft's strength, stiffness, and mechanical performance, essential for confirming its safety and efficacy in the designated application.
3. FEA Simulation Results and Discussion
In order to assess the stresses, strains, and deformation performance of the cardan shaft, structural analysis was done. Analysis did not take into account dampening effects or inertia. In the form of loading, rotational and moment values were applied [1]. Cardan shaft failure was induced by moment and rotational impacts. For the purposes of structural and modal study, just these two parameters were taken into account. The analysis's outcome assesses the cardan shaft's state of failure.
3.1. Structural analysis
- Structural analysis steel
As a result of analyses, the obtained steel, which is listed in table 3, is used as conventional two-piece cardan shaft material [2]. The structural analysis simulation results are shown in Figure (9, 10, 11 and 12).
Figure 9 shows the total deformation of the shaft coupling under the specified loading and boundary conditions. The maximum deformation reaches approximately 0.00039813 m (0.398 mm) at the most stressed area, shown in red near the end where the torsional load is applied. The blue regions indicate minimal displacement, which corresponds to the fixed end support that restrict movement. This level of deformation is small and indicates that the assembly exhibits adequate stiffness under the imposed loads.
Figure 10 illustrates the shear stress distribution (XY plane) across the coupling. The highest shear stress is approximately 0.4662 MPa, as indicated by the red color around one of the flange connections. Green and blue areas show much lower shear stress levels, approaching -0.3572 MPa at the least-stressed locations. The localized high shear stresses suggest that these flange and joint areas are most critical for potential material yielding under torsional load.
Figure 11 presents the maximum principal stress variation throughout the model. The most highly stressed region reaches a peak of 3.1133 MPa, evident in red, while the lowest value is approximately -1.0694 MPa. These principal stresses highlight areas under tension or compression, especially along the shaft and coupling connection. Evaluating these results is important for ensuring the component stays well within the material’s yield strength and fatigue limits under service loads.
Figure 12 displays the strain energy distribution across the assembly. The maximum strain energy is around 3.5046e-5 J, concentrated in the most highly loaded section of the coupling (shown in red), while most other areas have very low energy absorption. This indicates that the structure effectively distributes and absorbs strain energy without excessive localized stress, implying a stable design under the operating torque and rotational velocity.
- 2.
- Structural analysis coating HS-Carbon Epoxy steel
As a result of analyses, the obtained HS-Carbon Epoxy steel, which is listed in table 3, and has coating layer at 0.5 mm on surface of steel, is used as conventional two-piece cardan shaft material [14]. The structural analysis simulation results are shown in Figure (13, 14, 15 and 16).
Figure 13 presents the total deformation of the shaft coupling assembly under the applied loads and boundary conditions. The maximum deformation is approximately 0.00037233 m (0.372 mm), occurring at the end where the torsional moment is applied. The deformation gradually decreases along the shaft, with the fixed support areas, shown in blue, experiencing virtually no displacement. The small magnitude of this deformation indicates that the coupling exhibits good stiffness under the imposed torsional and rotational loads.
Figure 14 illustrates the shear stress distribution on the XY plane across the assembly. The most highly stressed areas, highlighted in red, exhibit a maximum shear stress of about 0.57184 MPa, concentrated near the flange and universal joint region. Conversely, most other areas, shown in green and blue, experience much lower shear stresses, as low as approximately -0.54894 MPa. These results highlight that the highest shear stresses occur around geometric transitions and connection points, making them critical zones for structural integrity.
Figure 15 depicts the maximum principal stress variation throughout the model. The peak principal stress is approximately 2.4216 MPa, appearing at the interface between the shaft and its flange. Lower stress regions, indicated by blue and green, record values as low as -0.96188 MPa, suggesting that most of the assembly operates well within material capacity. These variations help identify stress concentration points that may require design optimization or material reinforcement to ensure long-term durability.
Figure 16 presents the strain energy distribution across the assembly. The structure absorbs up to 2.4505e-5 J in strain energy, with the most energy stored in the critical loading region shown in red. Other components exhibit much lower energy densities, as indicated by blue tones approaching the minimum value of approximately 2.1788e-16 J. This energy map underscores the areas under higher mechanical work, which correlates with increased stress and deformation, and can inform future enhancements to improve load sharing and optimize material utilization.
- 3.
- Structural analysis coating E-Glass Polyester steel
As a result of analyses, the obtained E-Glass Polyester steel which is listed in table 3 and has a coating layer at 0.5 mm on surface of steel, is used as conventional two-piece cardan shaft material [14,15]. The structural analysis simulation results are shown in Figures (17, 18, 19 and 20).
Figure 17 illustrates the total deformation of the shaft coupling assembly under the specified loading and boundary conditions. The maximum deformation reaches approximately 0.0003807 m (0.381 mm), appearing at the end where the torsional moment and rotational velocity are applied. The color gradient indicates the gradual reduction in displacement moving toward the fixed supports, which exhibit essentially zero deformation. The small magnitude of this deformation confirms that the coupling is sufficiently rigid under the working loads.
Figure 18 depicts the shear stress distribution on the XY plane across the assembly. The most highly stressed region experiences a peak shear stress of about 0.46289 MPa, highlighted in red near the flange and joint areas. In contrast, the blue and green regions show much lower shear stress levels, with the lowest value approximately -0.36188 MPa. This variation suggests that the load transfer is concentrated at the connecting areas, making them critical for evaluating shear capacity and ensuring long-term durability under cyclic torsional loads.
Figure 19 shows the maximum principal stress variation across the shaft coupling assembly. The highest principal stress reaches approximately 3.1634 MPa, appearing near the flange and at locations where geometric transitions cause stress concentrations. The most lightly stressed areas register negative principal stresses as low as -0.97444 MPa, indicating compression. These results highlight the need to ensure the material's yield strength is adequately higher than the peak stresses for safe and reliable operation.
Figure 20 presents the strain energy distribution throughout the assembly, with a peak value of around 3.3195e-5 J concentrated where the most deformation and stress occurs. The remaining components show considerably lower strain energy levels, approaching the minimum value of approximately 5.8925e-17 J in blue, indicating negligible energy absorption. This energy map is important as it reflects the locations most susceptible to material strain under torsional and rotational loads and can help guide any design enhancements to improve performance and fatigue resistance.
- 4.
- Structural analysis Stainless-steel
As a result of analyses, the obtained stainless-steel which is listed in table 3, is used as conventional two-piece cardan shaft material [15,16]. The structural analysis simulation results are shown in figure (21, 22, 23 and 24).
Figure 21 illustrates the total deformation of the two-piece cardan shaft made from stainless steel under the specified loads and supports. The maximum deformation is approximately 0.00038572 m (0.386 mm), observed at the region near the loading end where torsional and rotational loads have the most influence. The deformation gradually decreases toward the fixed supports, reaching essentially zero at the blue-colored regions representing the constrained sections. This small deformation value indicates that the material and geometry provide sufficient stiffness under operating conditions.
Figure 22 depicts the shear stress distribution in the XY plane. The most significant shear stress is concentrated around the flange and universal joint regions, with a peak value of approximately 0.56411 MPa. This is evident from the yellow-green coloration, while most other parts show lower shear stresses approaching a minimum of -0.54127 MPa as indicated by the green and blue colors. These results imply that stress transfer is more pronounced at geometrical transitions and attachment points, making these critical locations for further consideration in design or life estimation.
Figure 23 illustrates the maximum principal stress variation across the shaft coupling. The peak principal stress reaches approximately 2.4041 MPa, appearing mostly around the flange region and at the shaft connections. This value is well distributed across most of the shaft body as lighter blue and green tones, with the lowest value around -0.98078 MPa under compression. This distribution indicates that, under the applied loads, the component remains well within typical material limits for stainless steel, supporting its safe use in practice.
Figure 24 presents the strain of energy distribution across the assembly. The highest strain energy is concentrated at the most loaded sections, especially where the moment is introduced, with a value of 2.4443e-5 J. The blue-shaded areas reflect minimal strain energy approaching 2.135e-16 J, suggesting very little energy absorption in those sections. These findings show that most of the strain energy is localized to the shaft region where deformation is more prominent, further confirming that the design is structurally sound under the specified conditions.
- 5.
- Structural analysis Hardox 400
As a result of analyses, the obtained Hardox 400 which is listed in table 3, is used as conventional two-piece cardan shaft material [16]. The structural analysis simulation results are shown in figure (25, 26, 27 and 28).
Figure 25 illustrates the total deformation of the two-piece cardan shaft constructed using Hardox 400 under the given loading and boundary conditions. The maximum deformation is approximately 0.00077761 m (0.778 mm), which occurs near the center region of the shaft where the torsional and rotational loads are most significant. The color gradient clearly shows that the fixed supports (blue areas) experience negligible displacement, confirming their constraint, while the shaft mid-section displays the highest displacement as indicated by the red areas. This magnitude of deformation is modest, suggesting the material and design provide sufficient stiffness under the specified loading.
Figure 26 presents the shear stress distribution on the XY plane across the shaft assembly. The most significant shear stress, approximately 0.5669 MPa, is concentrated around the flanges and coupling joints. Away from these regions, the shear stress drops considerably, reaching a minimum of approximately -0.5533 MPa, as indicated by green and blue colors across most of the shaft body. The result highlights these transitional areas as critical stress points, which is typical for assemblies where abrupt changes in geometry or load transfer occur.
Figure 27 depicts the maximum principal stress variation across the entire assembly. The highest principal stress reaches approximately 2.8613 MPa, located around the flange connections and the shaft interface — spots where bending and torsion create high tensile and compressive stresses. Other parts of the shaft show relatively lower stress intensities (as low as -1.3108 MPa), indicating uniform load sharing along most of its length. This range of stresses is well within the capacity of Hardox 400, confirming the shaft’s structural adequacy under operating loads.
Figure 28 illustrates the strain energy distribution within the shaft. The maximum strain energy value is approximately 3.3103e-5 J, concentrated near the critical coupling areas subjected to both torsional and rotational loads. Elsewhere, strain energy values drop sharply to 1.609e-16 J or close to zero, indicating minimal energy absorption where deformation and stresses are low. The energy map confirms that most of the strain energy is concentrated where the most deformation and stress occur, making those areas the most significant contributors to the shaft's flexibility under load.
In addition, by comparing the results with each material as shown in table 4, it was shown that the hardox 400 material is characterized by high hardness and resistance to bending and stresses. The material of hardox 400 can also be used in the manufacture of cardan shafts, as its thickness is less than that of steel and offers high performance and efficiency. The results also explain the shear stress distribution on the XY plane, the shear stress distribution, the total deformation, and the strain energy distribution.
Table 4.
Structural analysis results comparison.
| Materials | Results | |||
| Shear Stress (MPa) | Max. principal Stress (MPa) | |||
| Steel | Min. | -0.35725 | -1.0694 | |
| Max. | 0.4662 | 3.1133 | ||
| HS-Carbon Epoxy | Min. | -0.54894 | -0.96188 | |
| Max. | 0.57184 | 2.4216 | ||
| E-Glass Polyester | Min. | -0.36188 | -0.97444 | |
| Max. | 0.46289 | 3.1634 | ||
| Stainless Steel | Min. | -0.54127 | -0.98078 | |
| Max. | 0.56411 | 2.4041 | ||
| Hardox 400 | Min. | -0.53533 | -1.3108 | |
| Max. | 0.5669 | 2.8613 | ||
| Materials | Results | |||
| Total Deformation (mm) | Strain Energy (mJ) | |||
| Steel | Min | 0.0 | 6.6548e-017 | |
| Max | 3.9813e-004 | 3.5046e-005 | ||
| HS-Carbon Epoxy | Min | 0.0 | 2.178e-016 | |
| Max | 3.7233e-004 | 2.4505e-005 | ||
| E-Glass Polyester | Min | 0.0 | 5.8925e-017 | |
| Max | 3.807e-004 | 3.3195e-005 | ||
| Stainless Steel | Min | 0.0 | 2.135e-016 | |
| Max | 3.8572e-004 | 2.4443e-005 | ||
| Hardox 400 | Min | 0.0 | 1.609e-016 | |
| Max | 7.7761e-004 | 3.3103e-005 | ||
| Materials | Results | |||
| Equivalent Elastic Strain(mm/mm) | Maximum Principal Elastic Strain(mm/mm) | |||
| Steel | Min | 6.559e-009 | -2.2875e-007 | |
| Max | 1.248e-005 | 1.1984e-005 | ||
| HS-Carbon Epoxy | Min | 3.263e-009 | -2.2588e-007 | |
| Max | 9.881e-006 | 9.5309e-006 | ||
| E-Glass Polyester | Min | 1.129e-008 | -1.8424e-007 | |
| Max | 9.998e-006 | 1.1347e-005 | ||
| Stainless Steel | Min | 5.086e-009 | -2.2198e-007 | |
| Max | 1.006e-005 | 9.387e-006 | ||
| Hardox 400 | Min | 4.798e-009 | -1.7786e-007 | |
| Max | 1.190e-005 | 1.0494e-005 | ||
3.2. Modal Analysis
In order to determine the natural frequencies and mode shapes, simulation modal analysis was done. A cardan shaft's inherent frequency is determined by its material and geometric characteristics. Torque and speed boundary conditions are constant in modal analysis with varying materials. The cardan shaft transfers torque of 1250 N.mm while rotating at a maximum speed of 2000 rpm. Resonance chances increase with external excitation, therefore determining the natural frequency is essential [17].
- Modal analysis steel
Figure 29 illustrates the first natural frequency mode shape of the cardan shaft made of steel. The natural frequency at this mode is 952.96 Hz, which is the lowest frequency at which the shaft will naturally tend to vibrate under dynamic loading. This mode is characterized by an overall bending deformation where the shaft and joints flex, making it a critical parameter to monitor during operation. Avoiding excitation close to this frequency is important to reduce the risk of resonance at low operating speeds.
Figure 30 depicts the sixth natural mode, corresponding to a frequency of 2618.7 Hz. In this mode shape, the shaft exhibits more complex deformation with multiple nodes along its length, indicating higher-order bending and torsional effects. This behavior can occur when higher-speed variations or harmonic vibrations match this frequency range, necessitating careful control of operating parameters to prevent resonance.
Figure 31 presents the twelfth mode shape of the cardan shaft, with a natural frequency of 7405.3 Hz. This mode exhibits intricate deformation with pronounced localized vibrations around the coupling and flange areas. The shaft segments show significant flexing and twisting along their lengths. Vibrations at this frequency and mode shape would typically not occur during standard operation due to the high frequency range, but they could be significant if the shaft is subjected to broadband excitation or transient shock loads.
Figure 32 illustrates the sixteenth natural mode, corresponding to the highest frequency among these results at 8802.3 Hz. This mode is highly complex with numerous points of inflection, demonstrating intricate torsional and flexural deformations across the entire assembly. The deformation is more concentrated at specific features like the flange and universal joints, which may act as vibration amplifiers. Understanding this mode is especially vital for predicting dynamic responses in extreme cases or during testing to ensure long-term reliability.
- 2.
- Modal analysis coating HS-Carbon Epoxy steel
Figure 33 illustrates the first natural mode shape of the cardan shaft coated with HS-carbon epoxy steel. The natural frequency of this mode is approximately 997.52 Hz, which is close to the fundamental frequency observed in the plain steel shaft. The mode shape demonstrates simple bending behavior with a single curvature across the shaft length. This relatively low frequency indicates that the shaft is most vulnerable to resonance at this fundamental frequency if subjected to periodic excitations near this range during rotation.
Figure 34 presents the sixth natural mode, which corresponds to a frequency of 2598.3 Hz. The deformation in this mode is more complex, with multiple nodes and antinodes distributed along the shaft. The flange and coupling areas show greater flexing and twisting due to localized stiffness variations introduced by the coating. This higher-order mode indicates more intricate vibration shapes under higher-speed operation and emphasizes the influence of material layering on the dynamic stiffness of the shaft.
Figure 35 depicts the twelfth natural mode at a frequency of 7565.7 Hz. This mode shape features even more intricate deformation patterns with multiple sections of the shaft and joints vibrating with different amplitudes. The increased complexity is evident by the numerous inflection points that appear across the shaft, especially around the joints and flange connections. Understanding these higher-order modes is important for identifying potential resonance or stress hotspots under impulsive or broadband dynamic loads.
Figure 36 illustrates the sixteenth mode shape with a natural frequency of 9140.2 Hz. This is the most complex mode displayed, with highly localized flexing around the universal joints and flanges. The shaft experiences substantial torsional-bending coupling behavior at these higher frequencies, which can contribute to wear and potential fatigue if harmonic excitation matches this range. The increased stiffness due to the HS-carbon epoxy coating is evident in the upward shift of these higher-order natural frequencies compared to the plain steel version.
- 3.
- Modal analysis coating E-Glass Polyester steel
Figure 37 depicts the first natural mode shape of the two-piece cardan shaft coated with E-Glass Polyester on a steel core. The corresponding natural frequency is approximately 947.36 Hz, making it the lowest fundamental mode. This mode exhibits a global bending deformation with a single curvature across the shaft length, and the most displacement is concentrated toward the mid-span. The relatively low value of this first mode frequency implies that avoiding resonance in this range is important for ensuring smooth operation during low-speed rotational conditions.
Figure 38 presents the sixth natural mode, with a natural frequency of 2581.7 Hz. This higher-order mode reveals a more complex deformation pattern compared to the fundamental mode, with multiple nodal points distributed along the shaft. The flange and universal joints show localized twisting and flexing due to the material coating and its stiffness contribution. This indicates that, at mid-range operational speeds or harmonic excitation, the cardan shaft can exhibit intricate vibrational behavior that needs careful assessment for long-term fatigue resistance.
Figure 39 illustrates the twelfth mode shape, which occurs at a higher natural frequency of 7416.8 Hz. The mode shape is noticeably more intricate, with several sections vibrating out of phase along the length of the shaft. This higher-order mode reveals substantial deformation concentrated around the coupling and flange connections, where geometry and material layering effects become significant. Vibrations at this frequency are typically unlikely during standard service but could be triggered under transient impacts or high-speed rotational fluctuations.
Figure 40 depicts the sixteenth natural mode shape, corresponding to a natural frequency of 8720.7 Hz. This is the most complex deformation pattern among the presented modes. The shaft exhibits torsional and flexural distortions that are highly localized at the flange and joint areas, suggesting that the coating and substrate stiffness play a critical role at these high frequencies. The occurrence of such complex mode shapes at this high frequency is less likely under normal operating conditions but must be considered for dynamic analyses under extreme service or shock loads.
- 4.
- Modal analysis Stainless-steel
Figure 41 illustrates the first natural mode shape of the stainless-steel two-piece cardan shaft, corresponding to a fundamental frequency of 923.33 Hz. The mode exhibits a primary bending deformation across the length of the shaft, with the mid-span region experiencing the most pronounced displacement. The fixed support at both ends constrain the motion, resulting in minimal deflection near the flanges. This first mode is the most critical for resonance concerns at low-speed operating conditions and must be carefully considered in the shaft design.
Figure 42 depicts the sixth natural mode shape, with a frequency of 2581.9 Hz. This higher-order mode features multiple nodal points along the shaft, producing a more complex deformation pattern involving bending and twisting effects. The color contours highlight significant stress and displacement variations around the couplings and joints, as the structure responds dynamically to increased frequencies. Vibratory behavior at this level would only manifest under higher-speed operations or transient excitation, making it a potential concern for durability under cyclic loads.
Figure 43 displays the twelfth natural mode, at a frequency of 7306.2 Hz. This mode shape reveals further complexity with multiple inflection points distributed along the shaft length. The deformation is highly localized around the coupling areas and the flanges, suggesting that these regions could be most susceptible to high-cycle fatigue if the shaft is excited near this frequency. The magnitude of displacement is much smaller at this stage due to the stiffness of the stainless-steel material, and resonance under this mode is unlikely under typical operating speeds.
Figure 44 illustrates the sixteenth natural mode, reaching a high frequency of 8510.7 Hz. The deformation pattern is extremely intricate, with several distinct nodes across the shaft assembly and significant localized twisting behavior near the couplings. Vibratory motion at this extreme frequency is highly localized, and such behavior would require significant harmonic excitation to occur in practice. These results indicate that the cardan shaft has a broad range of natural frequencies, ensuring a stiff dynamic response across the operating range.
- 5.
- Modal analysis Hardox 400
Figure 45 depicts the first natural mode of the two-piece cardan shaft constructed from Hardox 400 material. The corresponding natural frequency is approximately 1191.1 Hz, making this the fundamental mode. The deformation is predominantly global bending across the shaft's length, with the greatest displacement observed toward the center. The fixed supports at both ends restrict motion, allowing the shaft to flex under dynamic loads. Given the material's strength, this first mode frequency is relatively high compared to other shaft materials, which is advantageous for avoiding resonance at lower operating speeds.
Figure 46 illustrates the sixth natural mode shape at a frequency of 2085.4 Hz. Here, the deformation pattern is more complex, characterized by multiple nodes and a mixture of bending and twisting across the shaft. The coupling and flange areas demonstrate localized stress concentrations and notable flexing. This indicates that at this higher-order mode, dynamic excitation could produce more intricate stress distributions, especially around connections, making it important to ensure these joints can withstand such dynamic effects under prolonged operation.
Figure 47 displays the twelfth natural mode at 3842.9 Hz. In this mode shape, further complexity is introduced, with several points of inflection distributed along the shaft. These inflection points produce localized torsional and bending deformations, especially at the couplings and flanges. The significantly increased frequency implies that this deformation would only occur under very rapid oscillatory excitations and is unlikely to be triggered during typical operating conditions. Nevertheless, recognizing this mode is important for avoiding unforeseen resonances at higher operating speeds or under transient impact loads.
Figure 48 represents the sixteenth natural mode with a frequency of 5314.5 Hz. The mode shape is highly intricate, and displacement patterns show small wavelength distortions across the shaft's length. The most significant dynamic effects at this frequency appear around the flange and joint areas, where multiple inflection points exist. Even though this is a very high-order mode unlikely to be exciting in practice, it provides useful insight into the behavior of the Hardox 400 shaft under extreme dynamic conditions. This highlights the material's rigidity and its capacity to support torsional and flexural vibrations without excessive deflection.
Figure 49 illustrates the natural frequency variation for different materials across the first 16 modes of the cardan shaft. The graph plots the mode number on the x-axis and the corresponding natural frequency (Hz) on the y-axis, allowing a direct comparison between shafts constructed from Steel SM45C, Coating Carbon Epoxy Composite, Coating E-Glass Polyester Resin Composite, Stainless Steel, and Hardox 400.
From the graph, we can observe that for all materials, the natural frequency generally increases as the mode number rises, which is expected because higher-order modes represent more complex shapes and require greater energy to excite [18,19].
A clear trend emerges showing that Hardox 400 (black) consistently yields the lowest natural frequencies across all modes. This is due to its comparatively lower stiffness relative to the other materials or possibly its higher density, which increases inertia and reduces the vibratory frequency.
On the other hand, Coating Carbon Epoxy Composite (red) and Stainless Steel (purple) shafts produce the highest natural frequencies throughout the mode range. This indicates that these materials impart greater stiffness to the shaft assembly and improve its dynamic behavior, making them highly resistant to resonance at typical operating speeds [19].
Steel SM45C (blue) and Coating E-Glass Polyester Resin Composite (pink) follow very similar trends, producing natural frequencies that lie between those of stainless steel and Hardox 400. The proximity of these two curves implies comparable dynamic stiffness and material properties under similar geometrical configurations.
As the mode number increases especially beyond the 10th mode the gaps between materials widen. This implies that material choice becomes even more significant at higher modes, where variations in stiffness and density greatly influence the shaft’s dynamic characteristics.
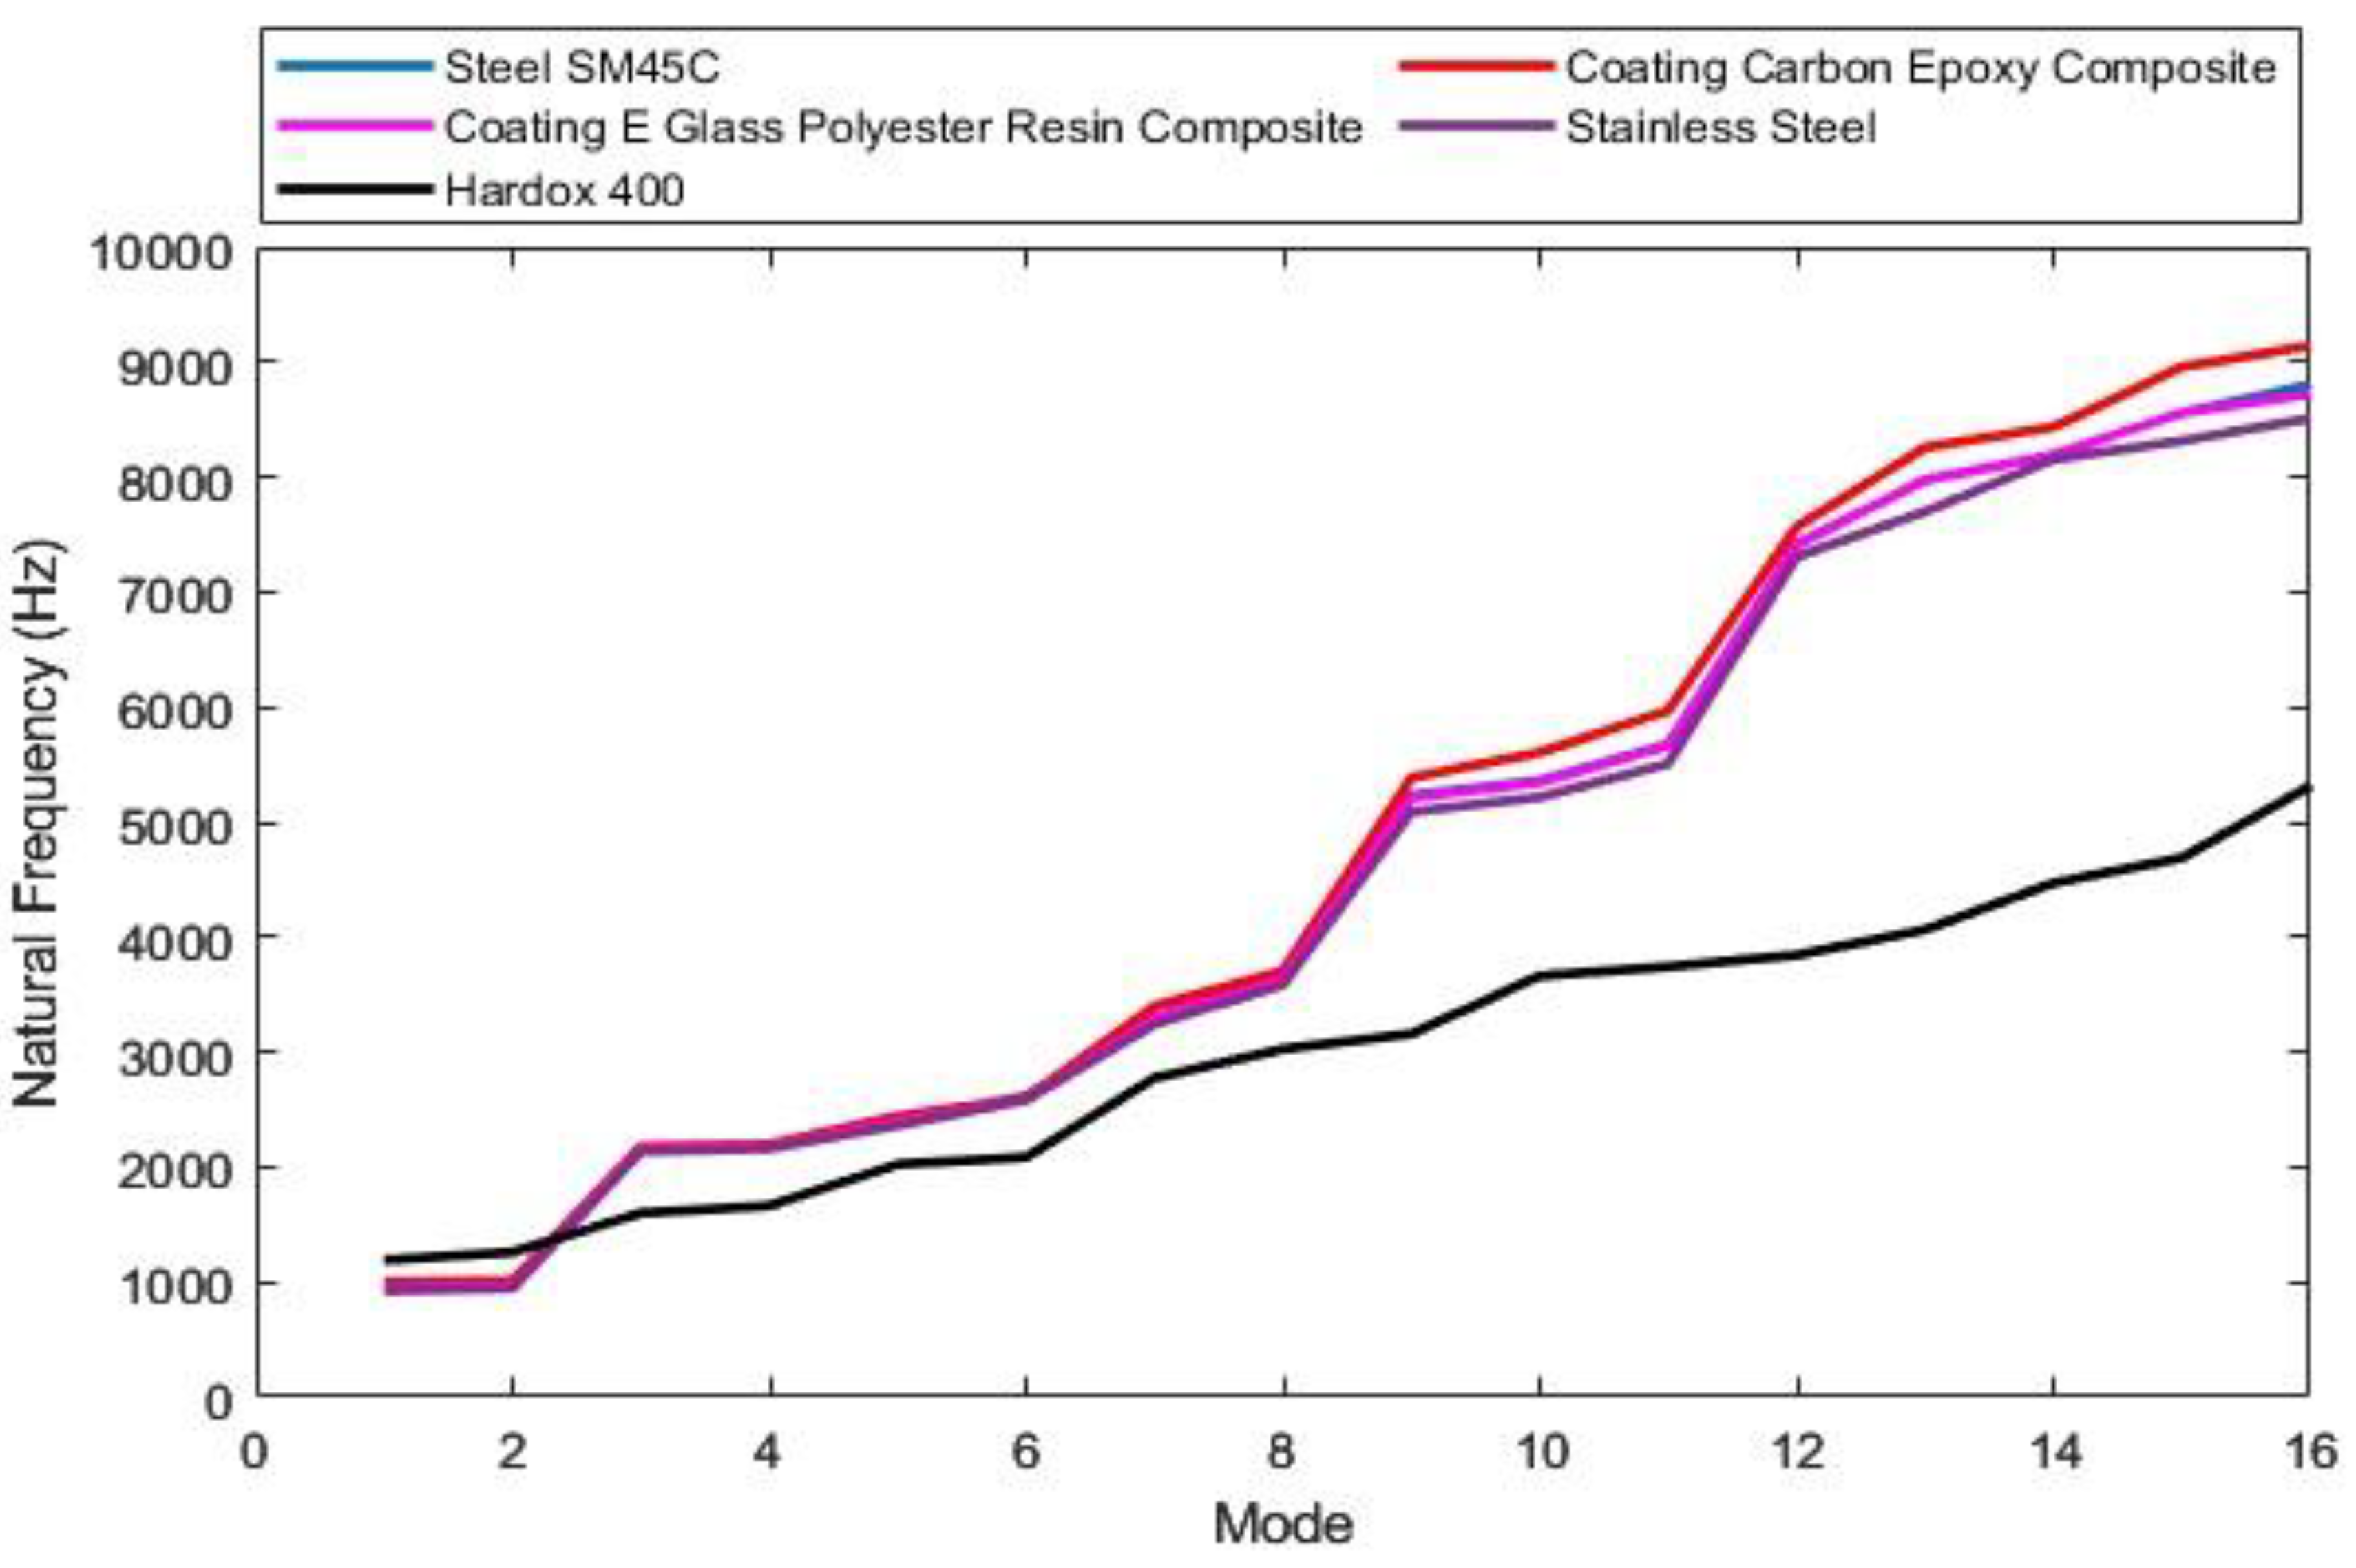
Figure 49.
Natural frequency variation for all materials.
4. Conclusions
The structural and modal analyses of the two-piece cardan shafts highlight significant variations in deformation, stress, strain energy, and vibratory behavior across different materials. Under torsional loading of 1250 N·mm at 2000 rpm, Hardox 400 yielded the highest total deformation of 0.77761 mm approximately 95.2% greater than Steel SM45C (0.39813 mm), indicating its greater flexibility under load. Despite this larger deformation, Hardox 400 experienced a maximum principal stress of 2.8613 MPa, which is ~8% lower than E-Glass Polyester (3.1634 MPa) and comparable to Stainless Steel (2.4041 MPa). Its maximum shear stress of 0.5669 MPa also closely matches that of HS-Carbon Epoxy (0.57184 MPa), proving Hardox 400’s capability to absorb torsional loads without excessive localized stress.
In terms of strain energy, Hardox 400 had the highest capacity at 3.3103e-5 J, approximately 1.7% greater than Steel SM45C (3.5046e-5 J) due to its higher ductility and deformation under torsion. Conversely, Steel SM45C exhibited the lowest total deformation (0.39813 mm), highest principal stress (3.1133 MPa), and lowest shear stress (0.4662 MPa), making it the stiffest option under the same boundary conditions — a crucial factor for precision rotational systems.
Modal analyses showed that material choice strongly influenced vibrational performance. Hardox 400 displayed the lowest fundamental natural frequency at 1191.1 Hz, roughly 24.6% higher than Steel SM45C (952.96 Hz), indicating its more compliant behavior. Its 16th mode natural frequency was 5314.5 Hz — approximately 39.6% lower than the HS-Carbon Epoxy shaft (9140.2 Hz), which exhibited the highest stiffness and dynamic rigidity among all tested options. Stainless Steel and composite-coated shafts showed intermediate values; for example, Stainless Steel's first mode was 923.33 Hz, reaching 8510.7 Hz at its 16th mode.
References
- Sivaram, N., Design and optimization of automotive cardan shafts for industrial applications with enhanced performance and durability. Babylonian Journal of Mechanical Engineering, 2023. 2023: p. 1-11. [CrossRef]
- Ramadan, D.O. Finite element analysis of conventional and composite materials of automobile drive shaft. in AIP Conference Proceedings. 2022. AIP Publishing.
- Golafshan, R., et al. Damage diagnosis of cardan shafts in mobile mining machines using vibration analysis. in IOP Conference Series: Materials Science and Engineering. 2021. IOP Publishing.
- Al-Ghrairi, A., et al., Investigation of Dynamic Behavior and Durability of Double Cardan Drive Shafts with Composite Materials for High-Speed Vehicles. Mathematical Modelling of Engineering Problems, 2024. 11(8). [CrossRef]
- Bisheh, H. Design and analysis of hybrid natural/synthetic fibre-reinforced composite automotive drive shafts. in Structures. 2024. Elsevier. [CrossRef]
- Raushan, R., K. Dhande, and N. Jamadar, Modal analysis of carbon fiber reinforced polyamide66 drive shaft using analytical and finite element approach. International Journal on Interactive Design and Manufacturing (IJIDeM), 2024: p. 1-16. [CrossRef]
- Sutar, S., et al., The effect of a geometry-based breathing crack model on a viscoelastic composite rotor-shaft system. Mechanics of Time-Dependent Materials, 2024. 28(3): p. 1909-1926. [CrossRef]
- Ganvir, K. and N. Pachkawade, A Hypothetical Approach and Preliminary Investigation of Propeller Shaft Under Fatigue Loading Using Different Materials.
- Kalaskar, T.S., K.H. Munde, and A.R. Pawar, Design and analysis of hybrid aluminium-composite driveshaft with crack using experimental modal analysis and FEA. Journal of Analysis & Computation (IJAC, UGC), 2021. 15: p. 27-40.
- Zhang, C., et al., A discrete element model of high-pressure torsion test to assess the effect of particle characteristics in the interface. Journal of Tribology, 2024. 146(8). [CrossRef]
- Zahi, R., et al., Study and analysis of a tapered shaft in composite materials with variable speed of rotation. Structural Engineering and Mechanics, 2023. 87(2): p. 191-200.
- Jazar, R.N. and H. Marzbani, Vehicle vibrations: Linear and nonlinear analysis, optimization, and design2024: Springer Nature.
- Jarrett, W., et al., The opportunities and challenges of hybrid composite driveshafts and their couplings in the aerospace industry: A review. Composite Structures, 2023. 320: p. 117203. [CrossRef]
- Hu, Y., et al., Failure analysis of fractured motor bolts in high-speed train due to cardan shaft misalignment. Engineering Failure Analysis, 2021. 122: p. 105246. [CrossRef]
- Bharti, S.K. and A.K. Samantaray, Resonant capture and Sommerfeld effect due to torsional vibrations in a double Cardan joint driveline. Communications in Nonlinear Science and Numerical Simulation, 2021. 97: p. 105728. [CrossRef]
- Hou, N., et al., Failure modes, mechanisms and causes of shafts in mechanical equipment. Engineering Failure Analysis, 2022. 136: p. 106216. [CrossRef]
- Tchomeni, B.X. and A. Alugongo, Modelling and dynamic analysis of an unbalanced and cracked cardan shaft for vehicle propeller shaft systems. Applied sciences, 2021. 11(17): p. 8132. [CrossRef]
- Tchomeni, B.X. and A. Alugongo, Theoretical and experimental analysis of an unbalanced and cracked cardan shaft in the vicinity of the critical speed. Mathematical Models in Engineering, 2020. 6(1): p. 34-49. [CrossRef]
- Xia, Y., et al., Nonlinear numerical and experimental study on the second-order torsional and lateral vibration of driveline system connected by cardan joint. Journal of Vibration and Control, 2020. 26(7-8): p. 540-551. [CrossRef]
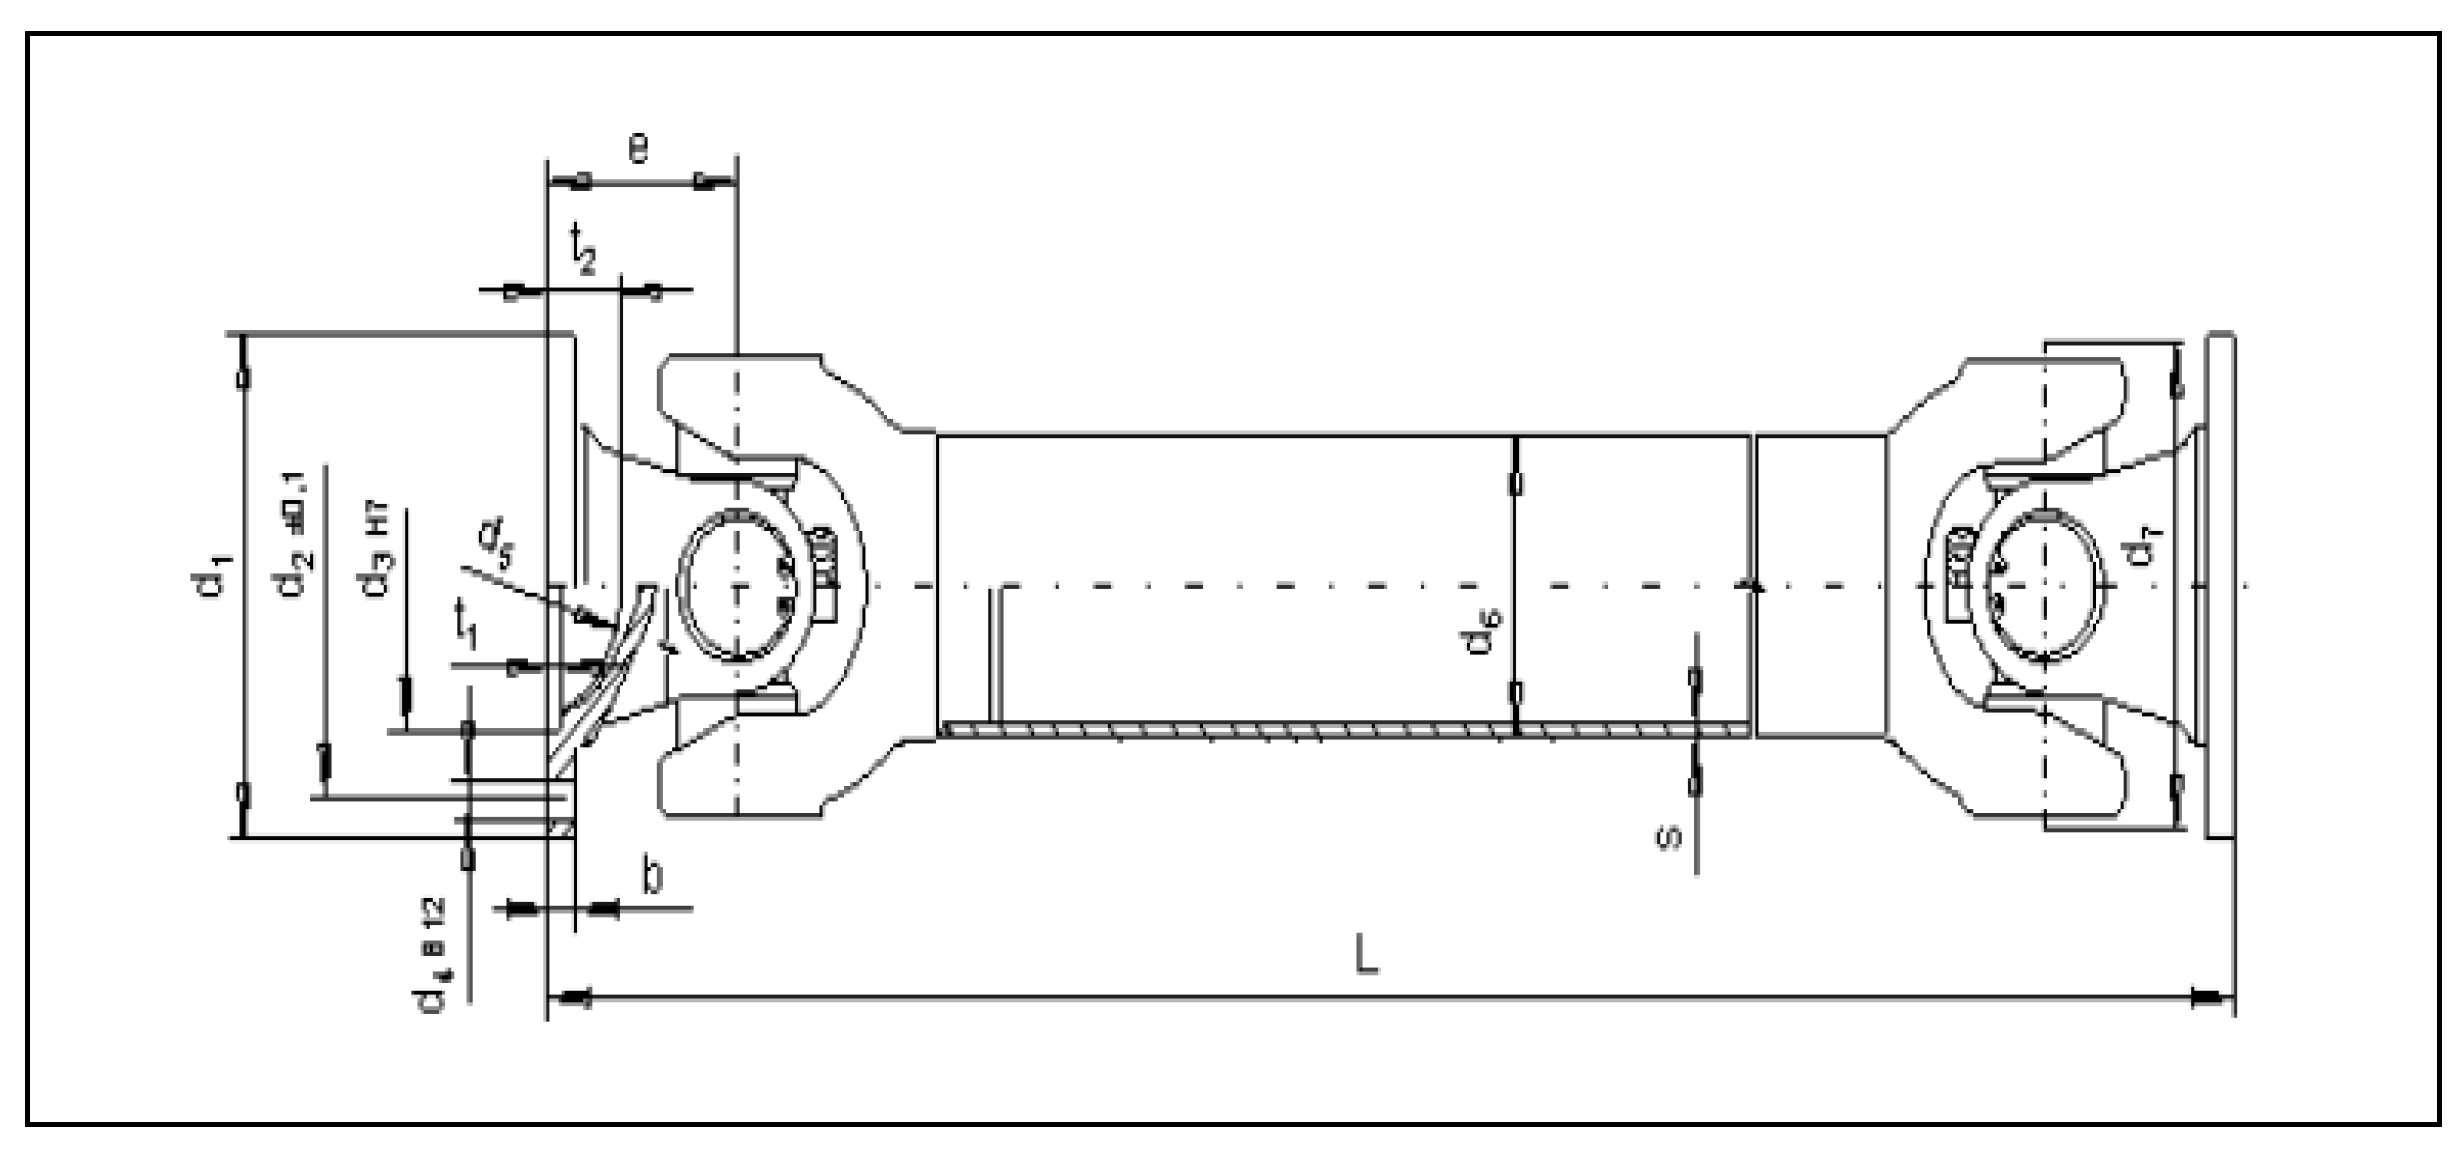
Figure 2.
Cardan shafts with length displacement[10].
Figure 2.
Cardan shafts with length displacement[10].

Figure 3.
Cardan with roller bearing[10].
Figure 3.
Cardan with roller bearing[10].
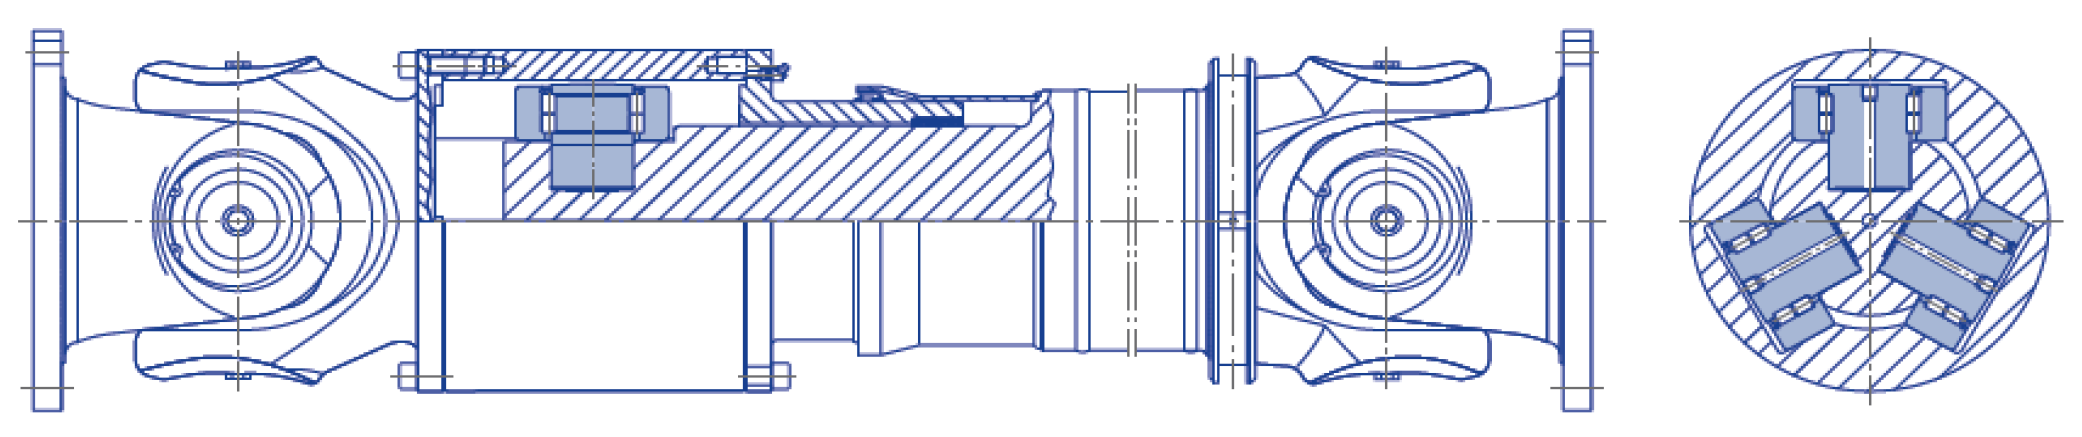
Figure 4.
Intermediate supports [12].
Figure 4.
Intermediate supports [12].
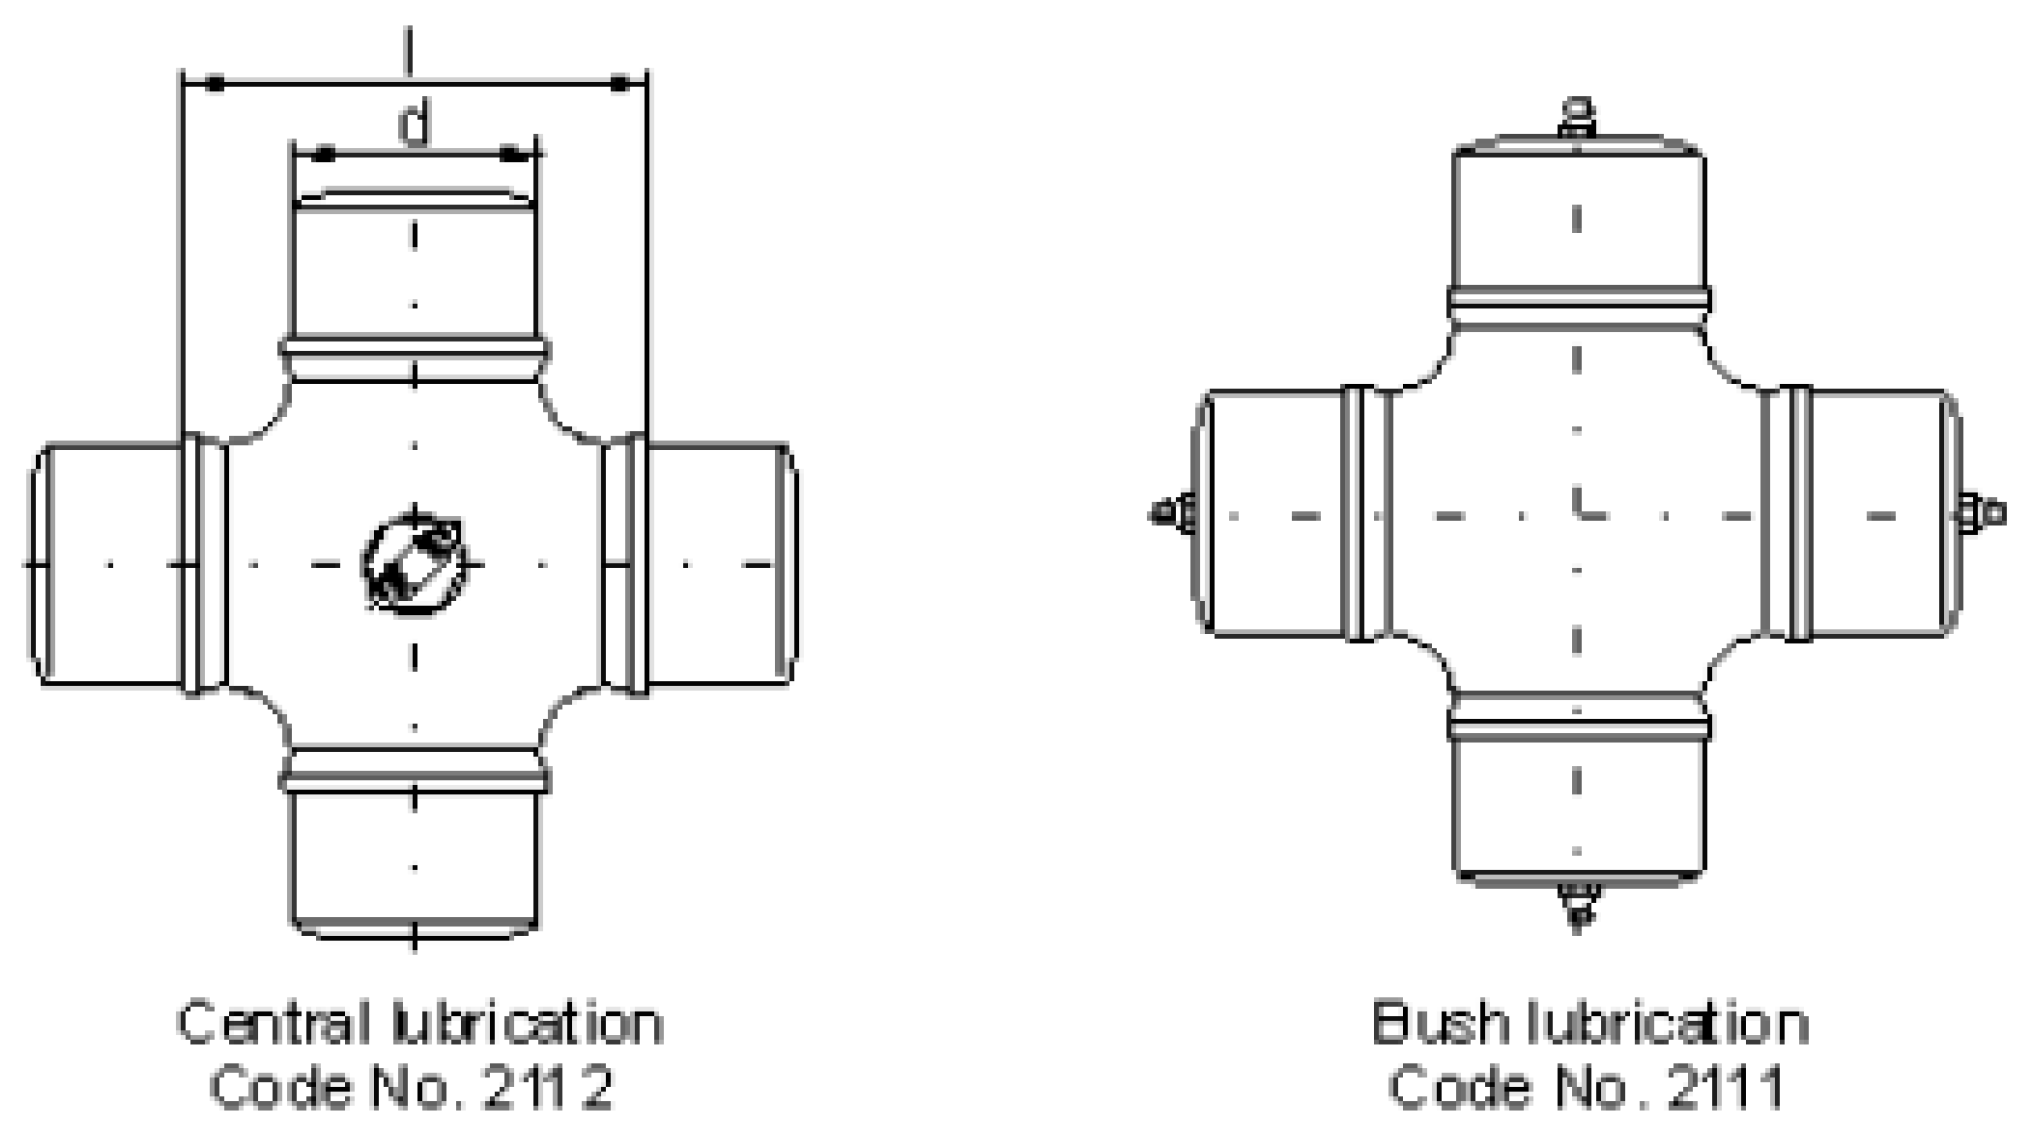
Figure 5.
Schematic of universal joint with key dimensions [12].
Figure 5.
Schematic of universal joint with key dimensions [12].
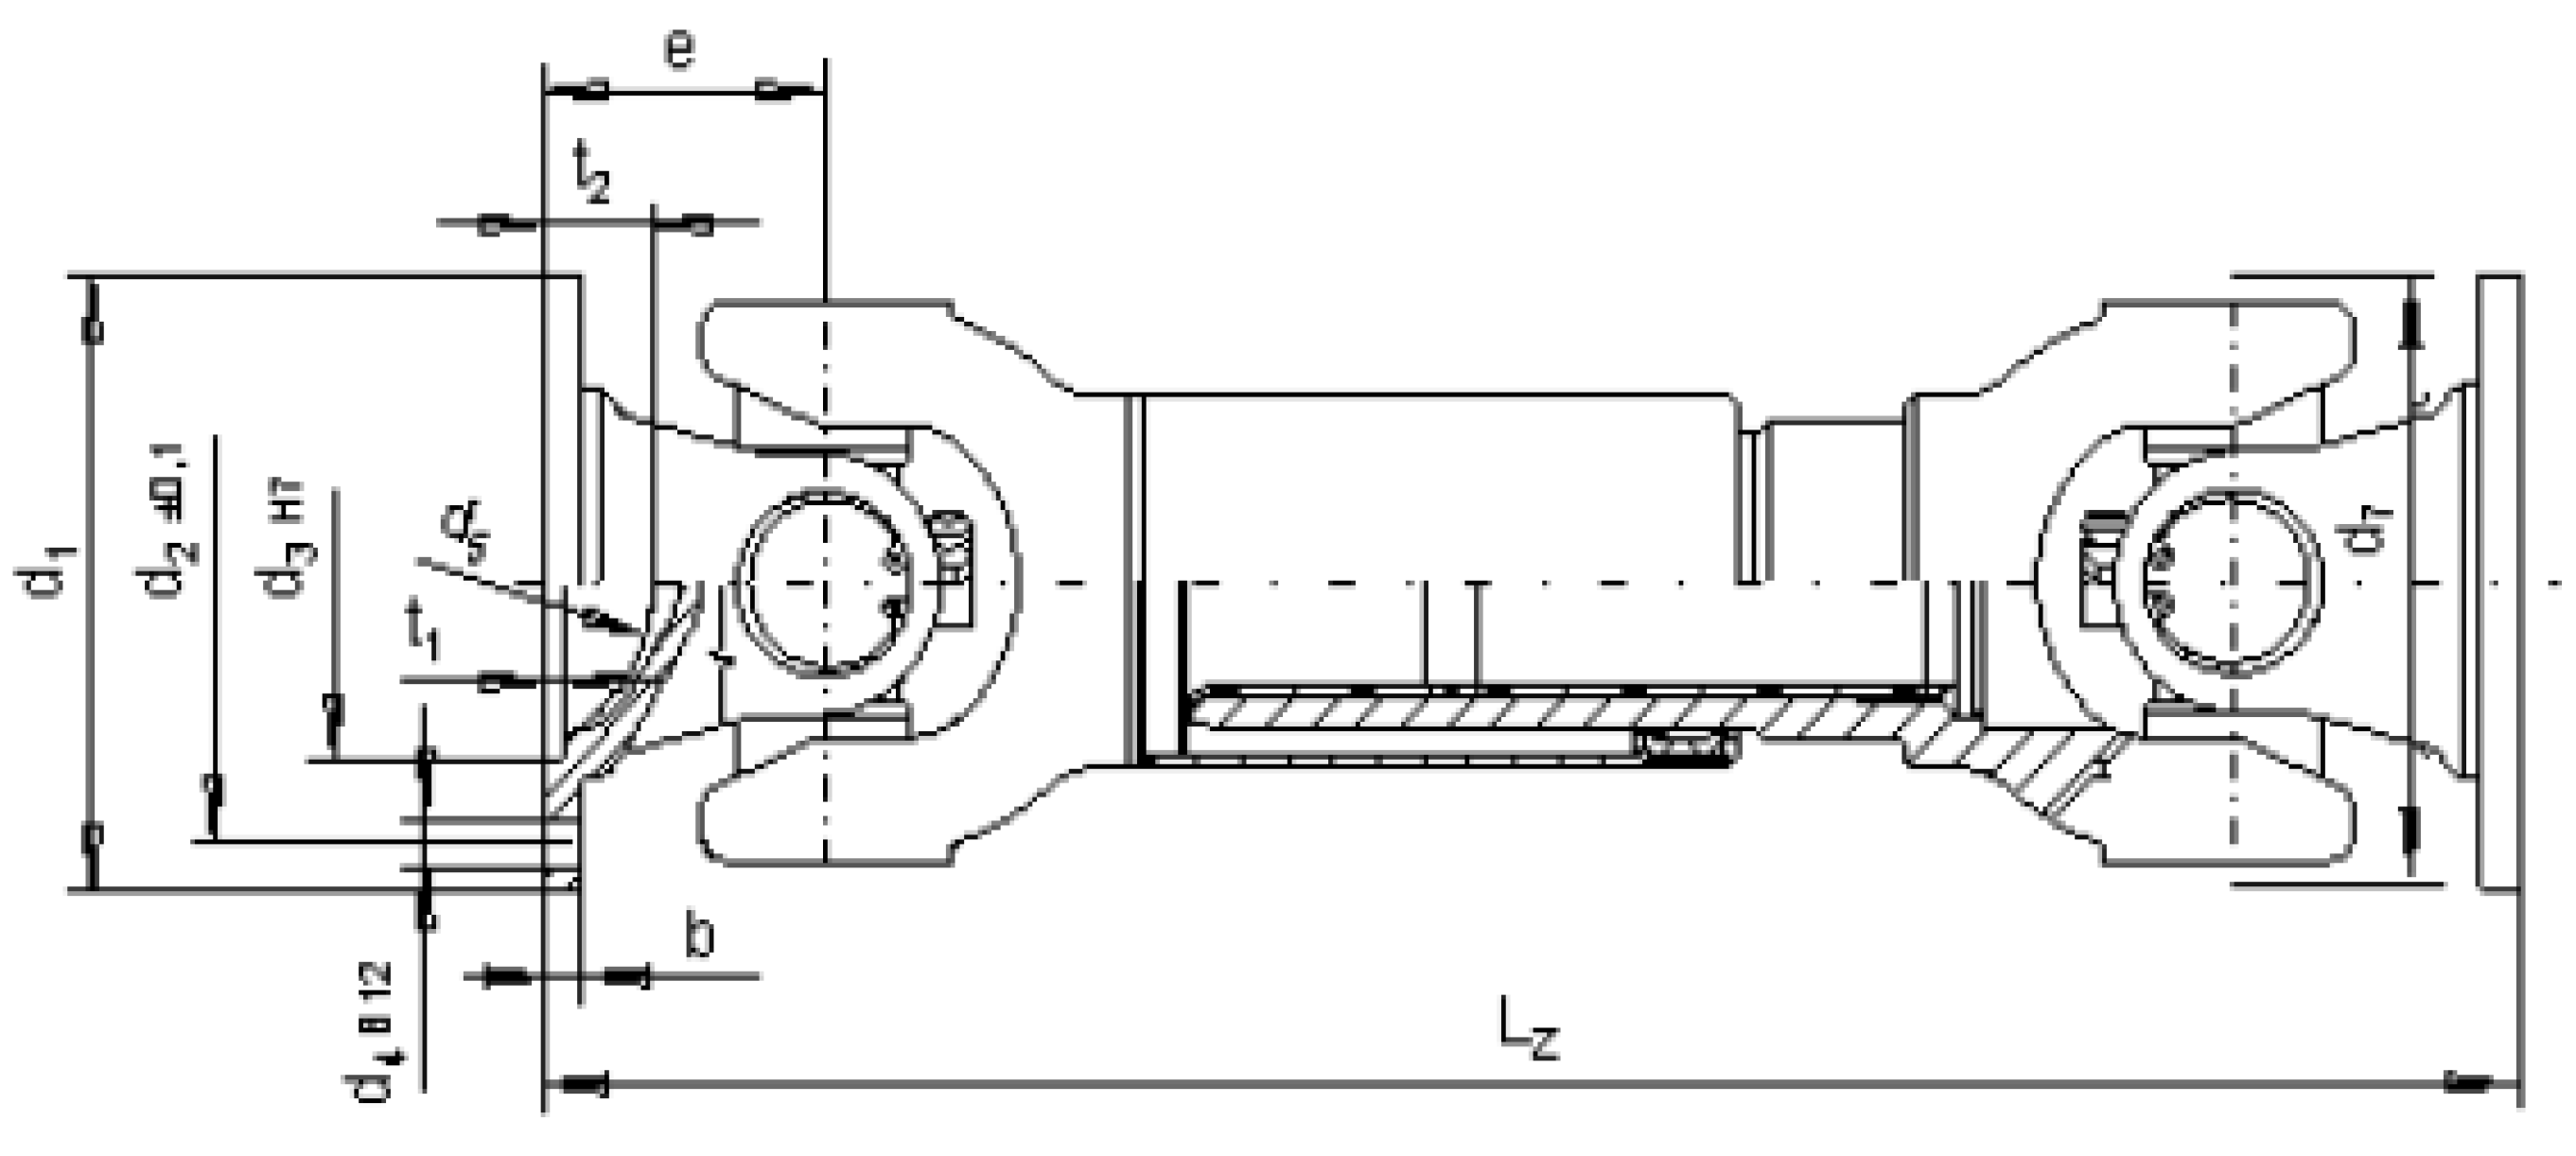
Figure 6.
3D model.
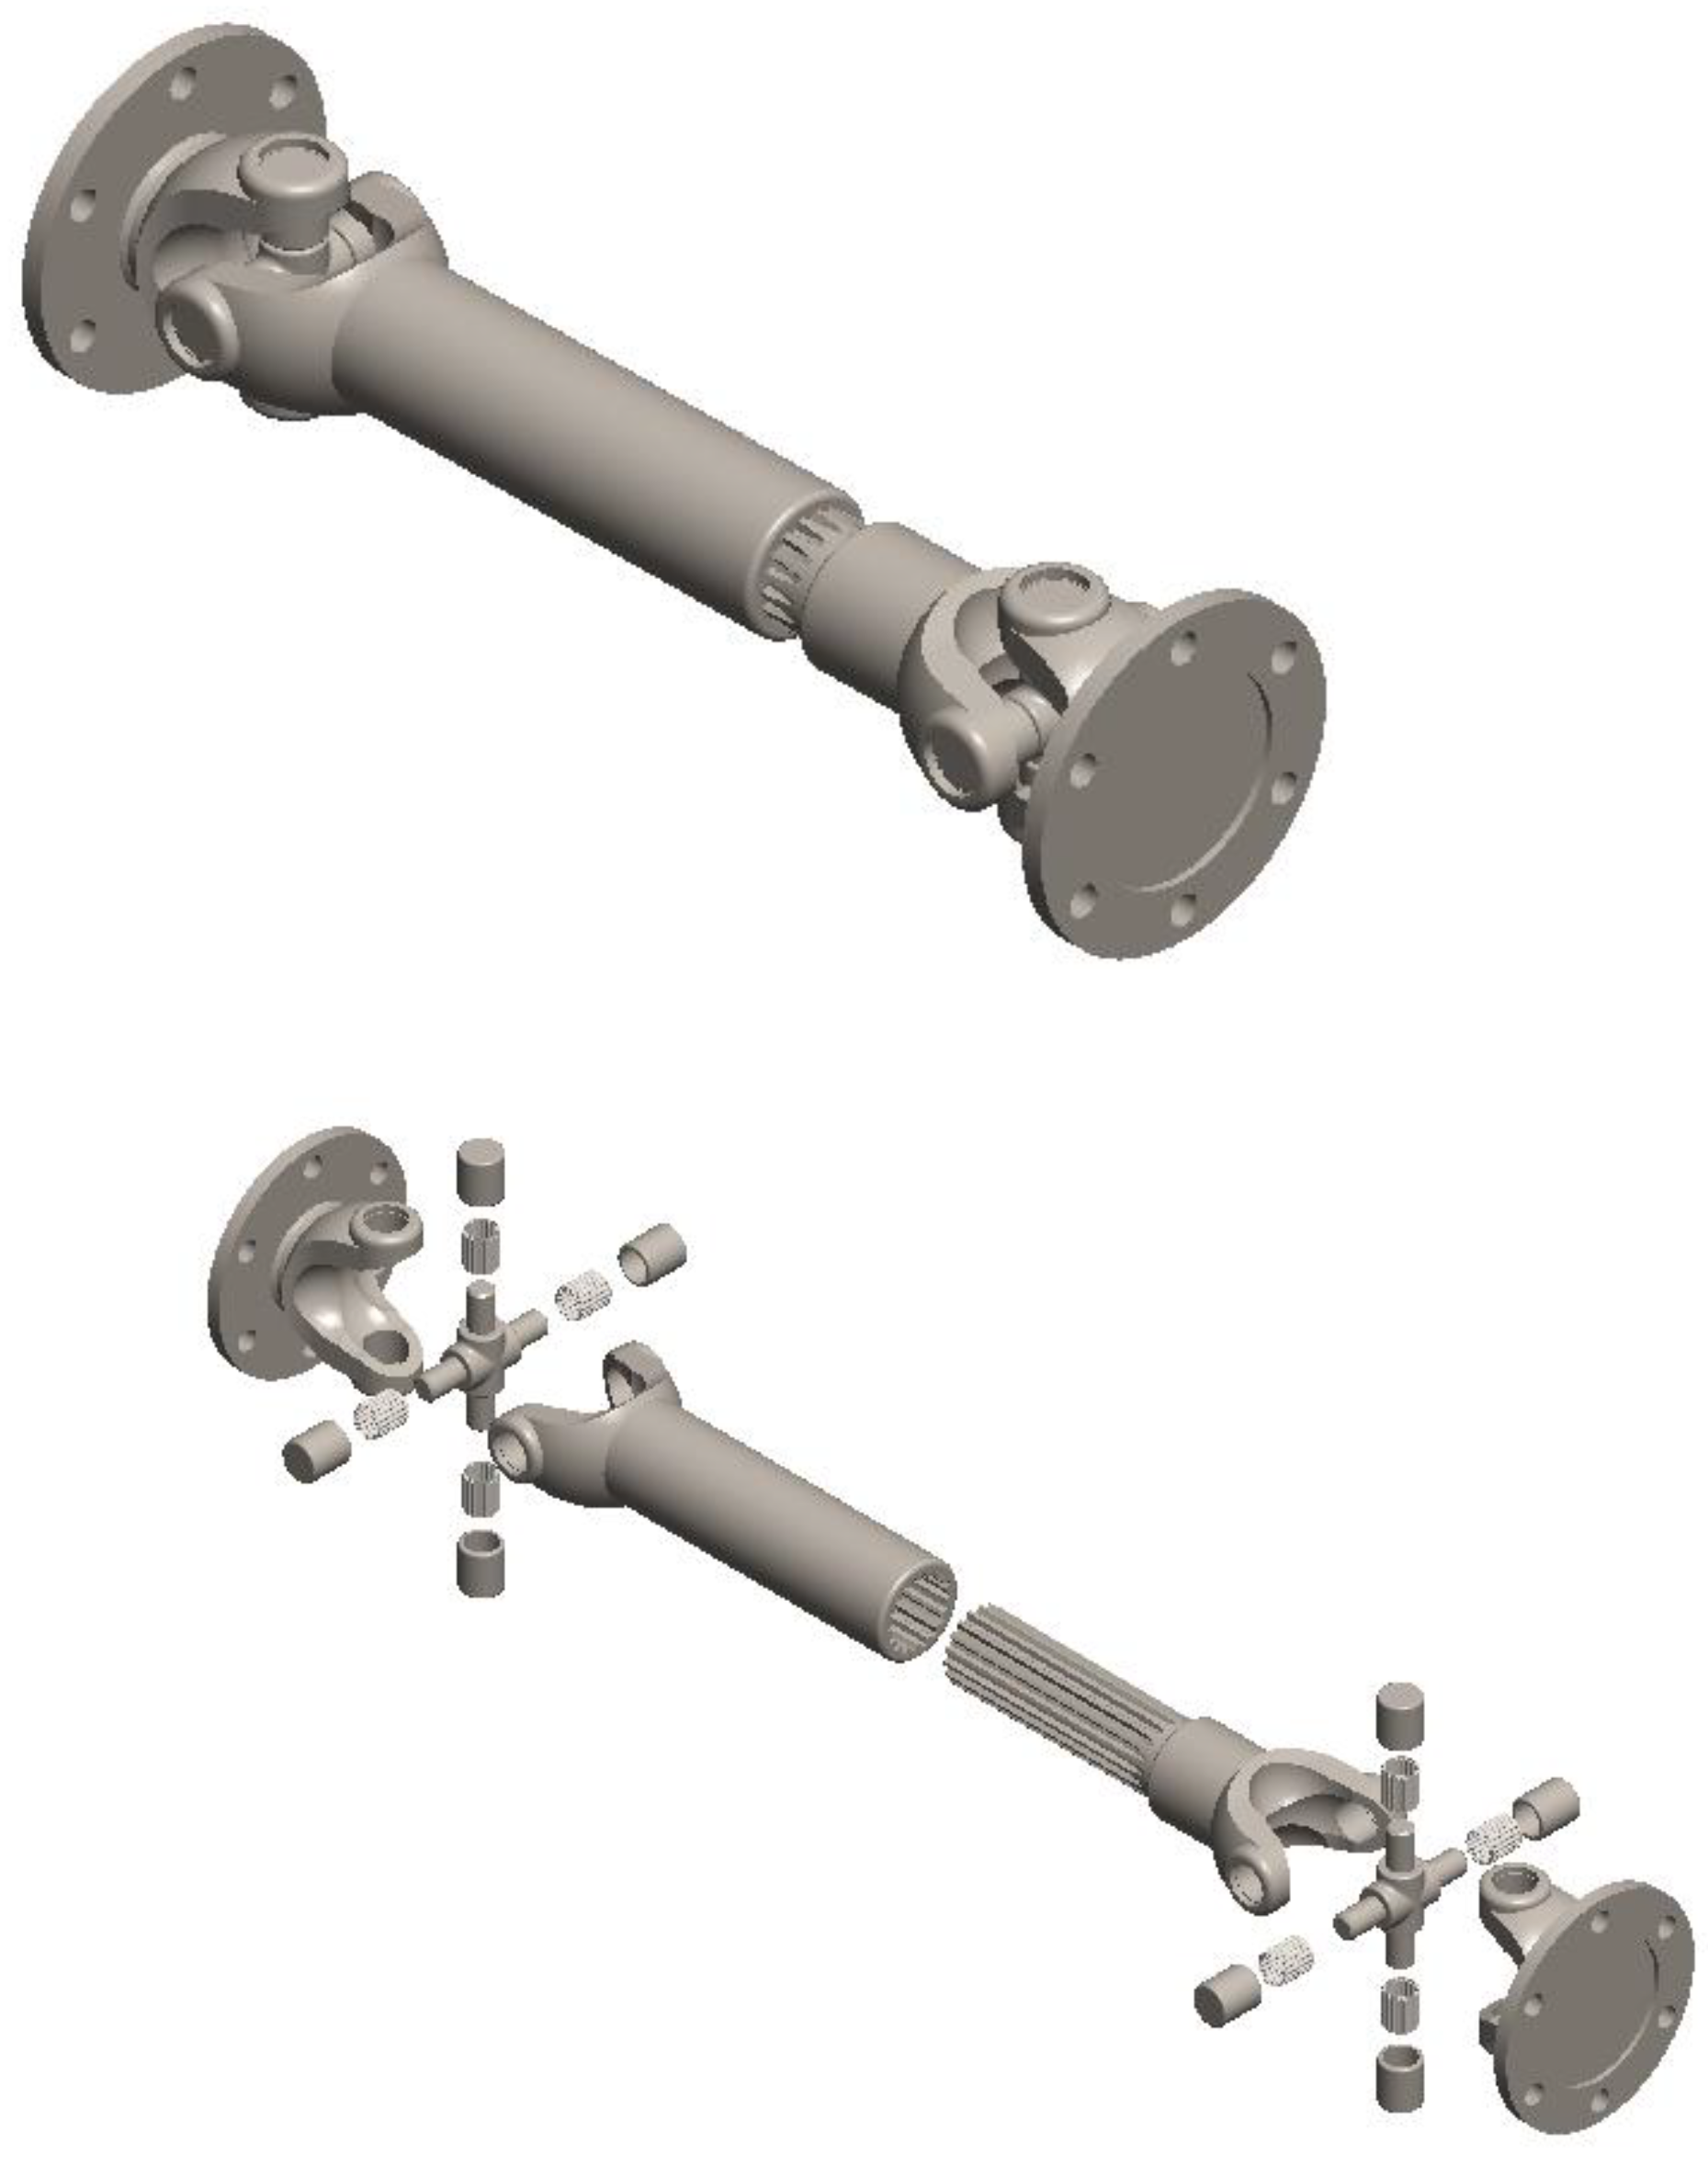
Figure 7.
Import 3D model in ANSYS.
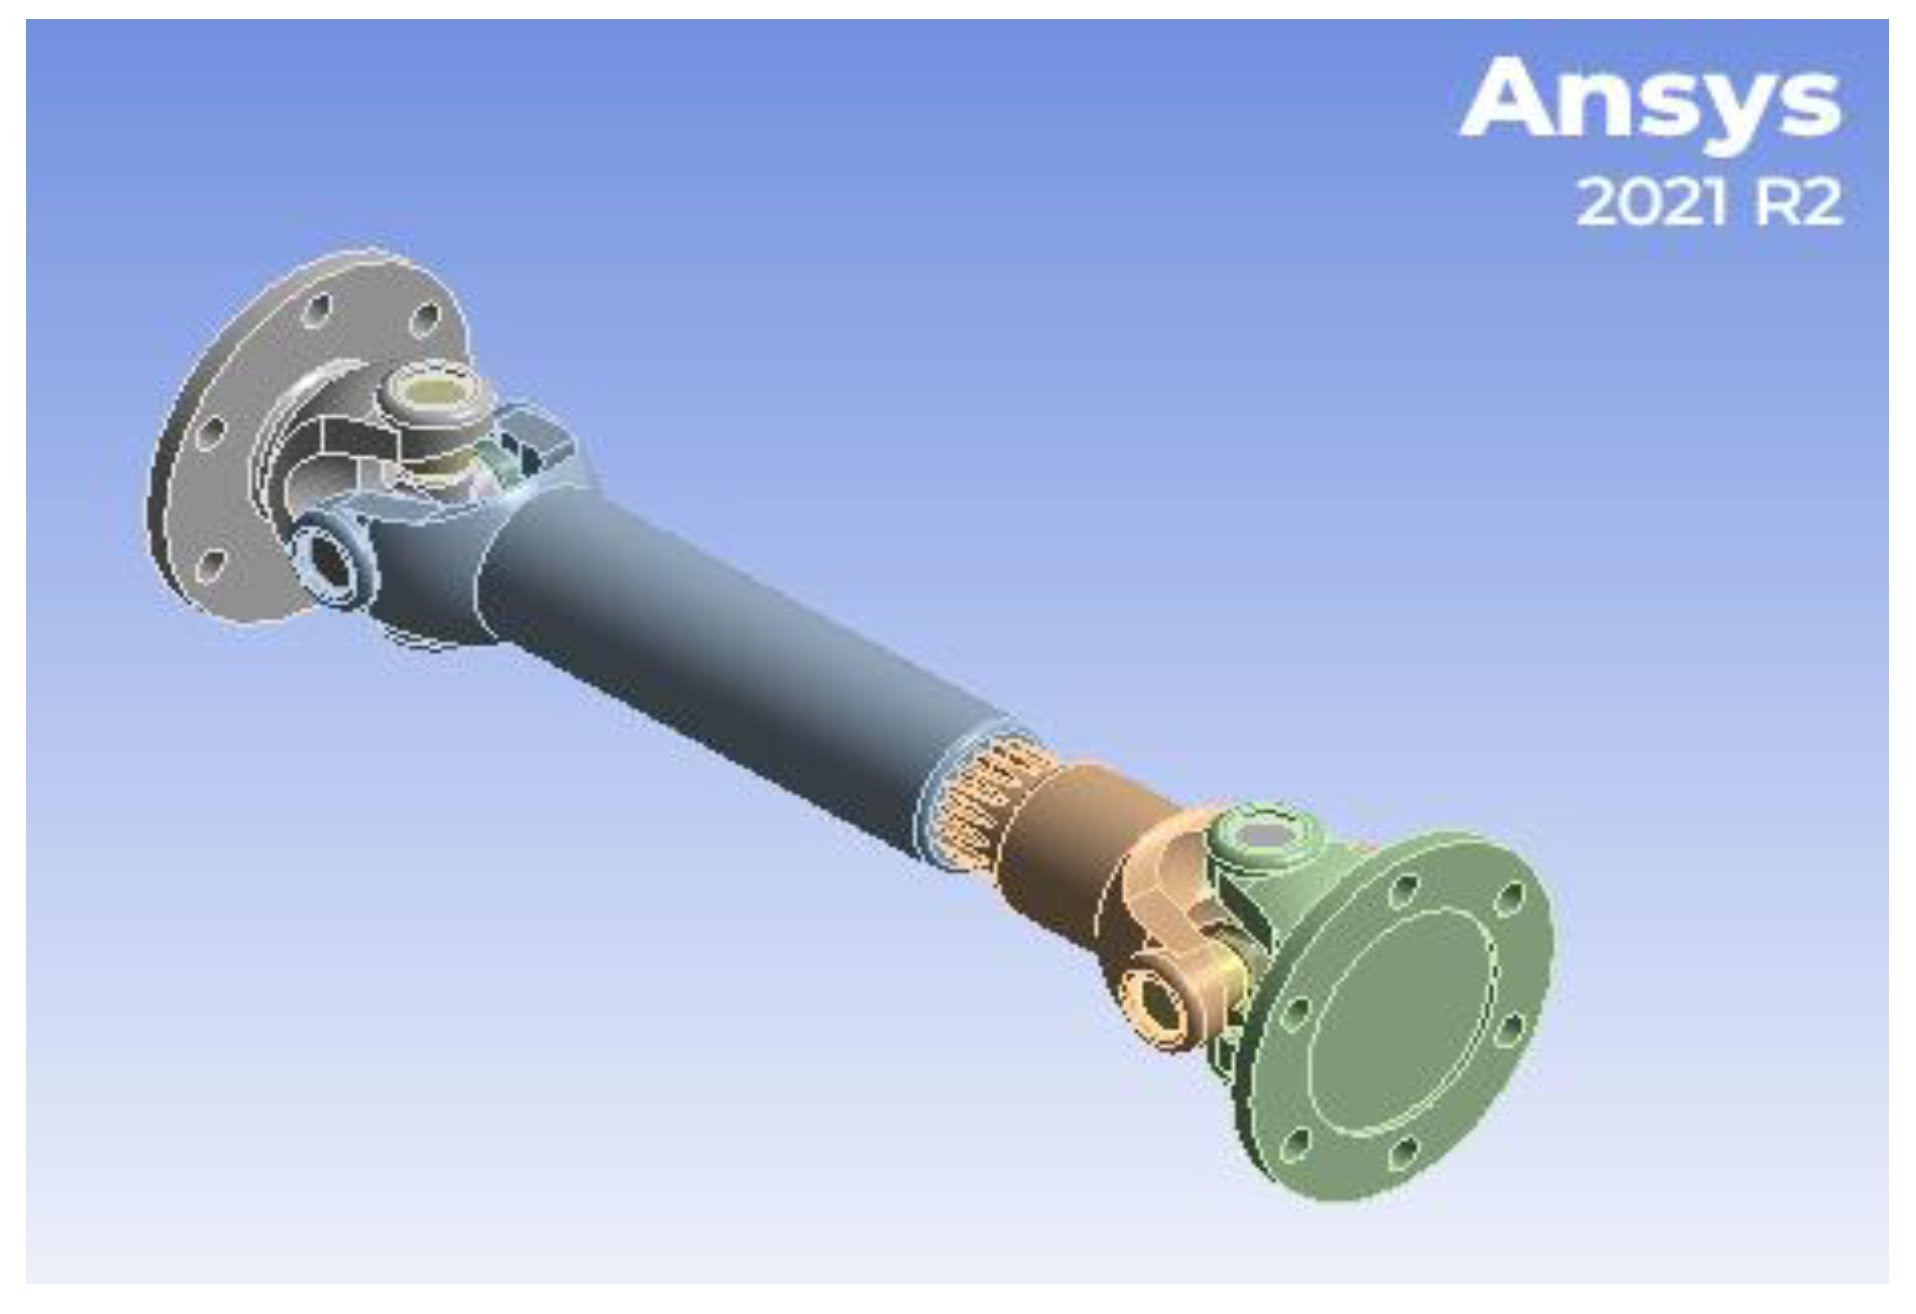
Figure 8.
Moment and Rotational velocity in static structural analysis.
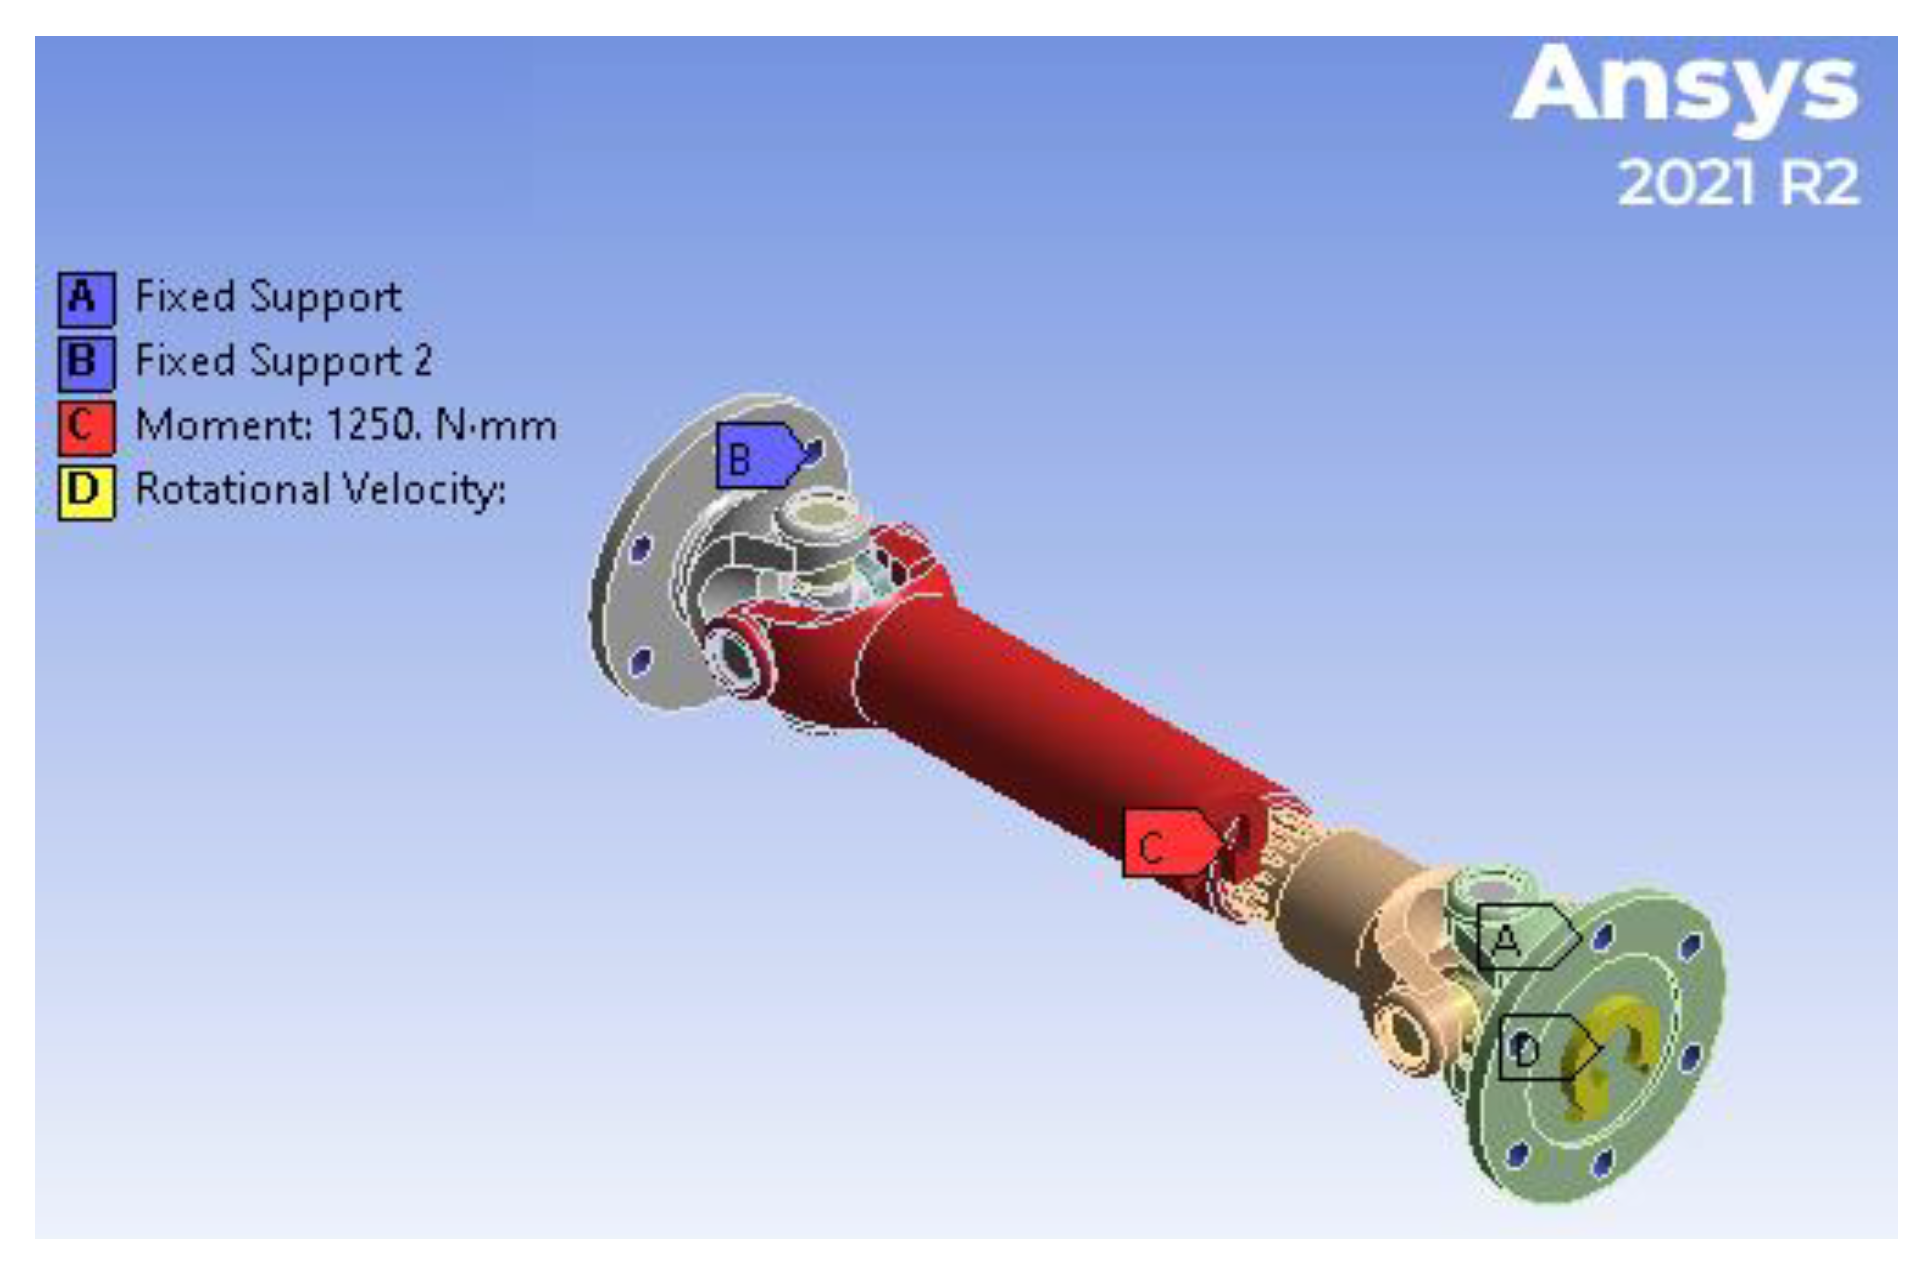
Figure 9.
Total deformation.
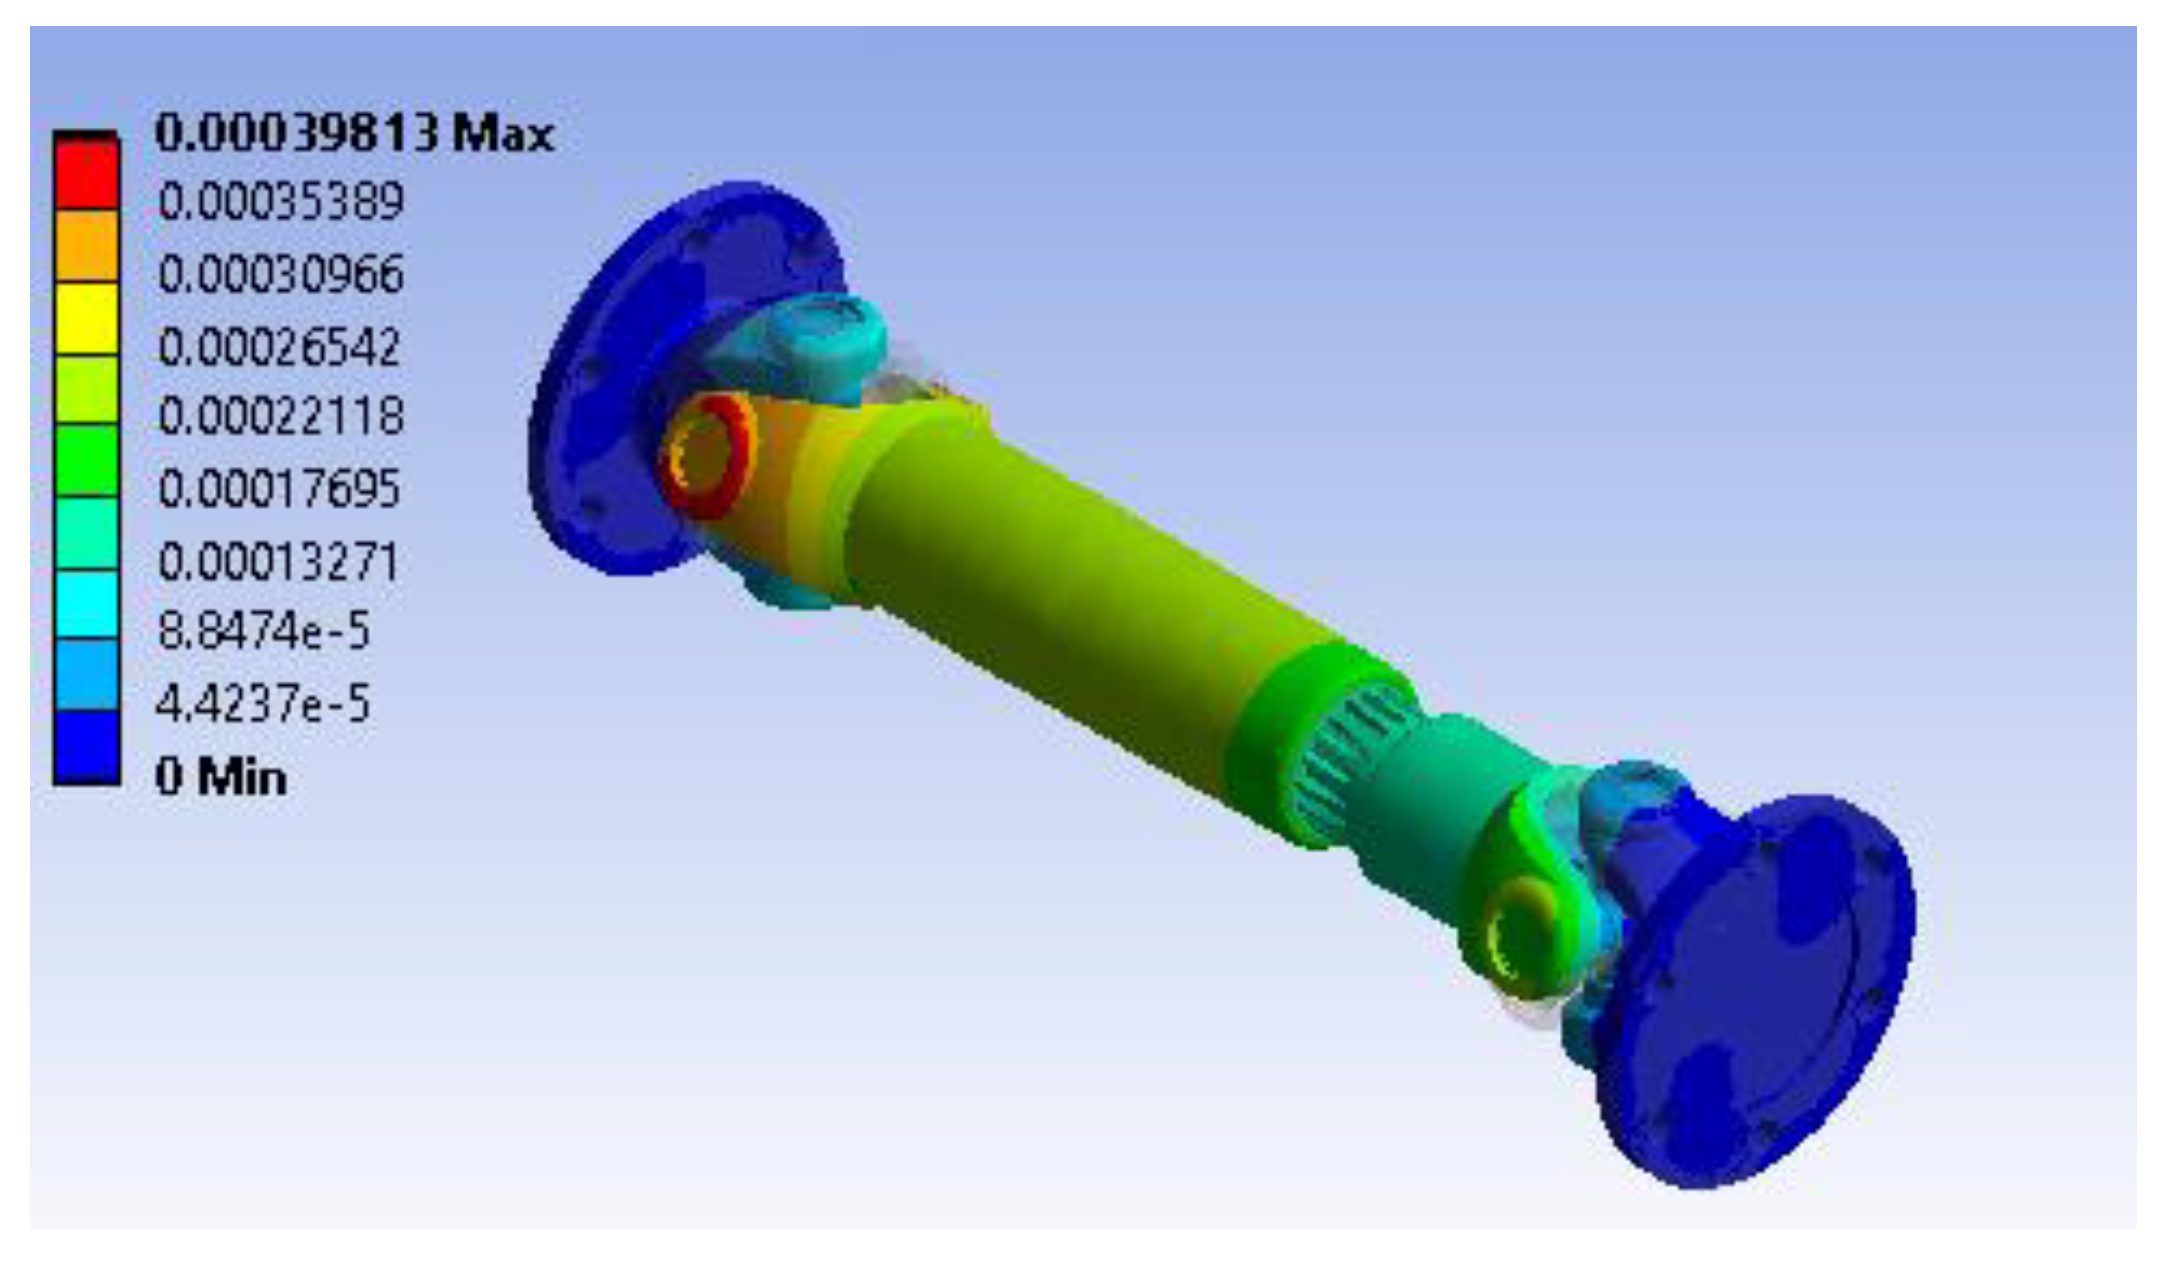
Figure 10.
Shear stress distribution (XY plane).
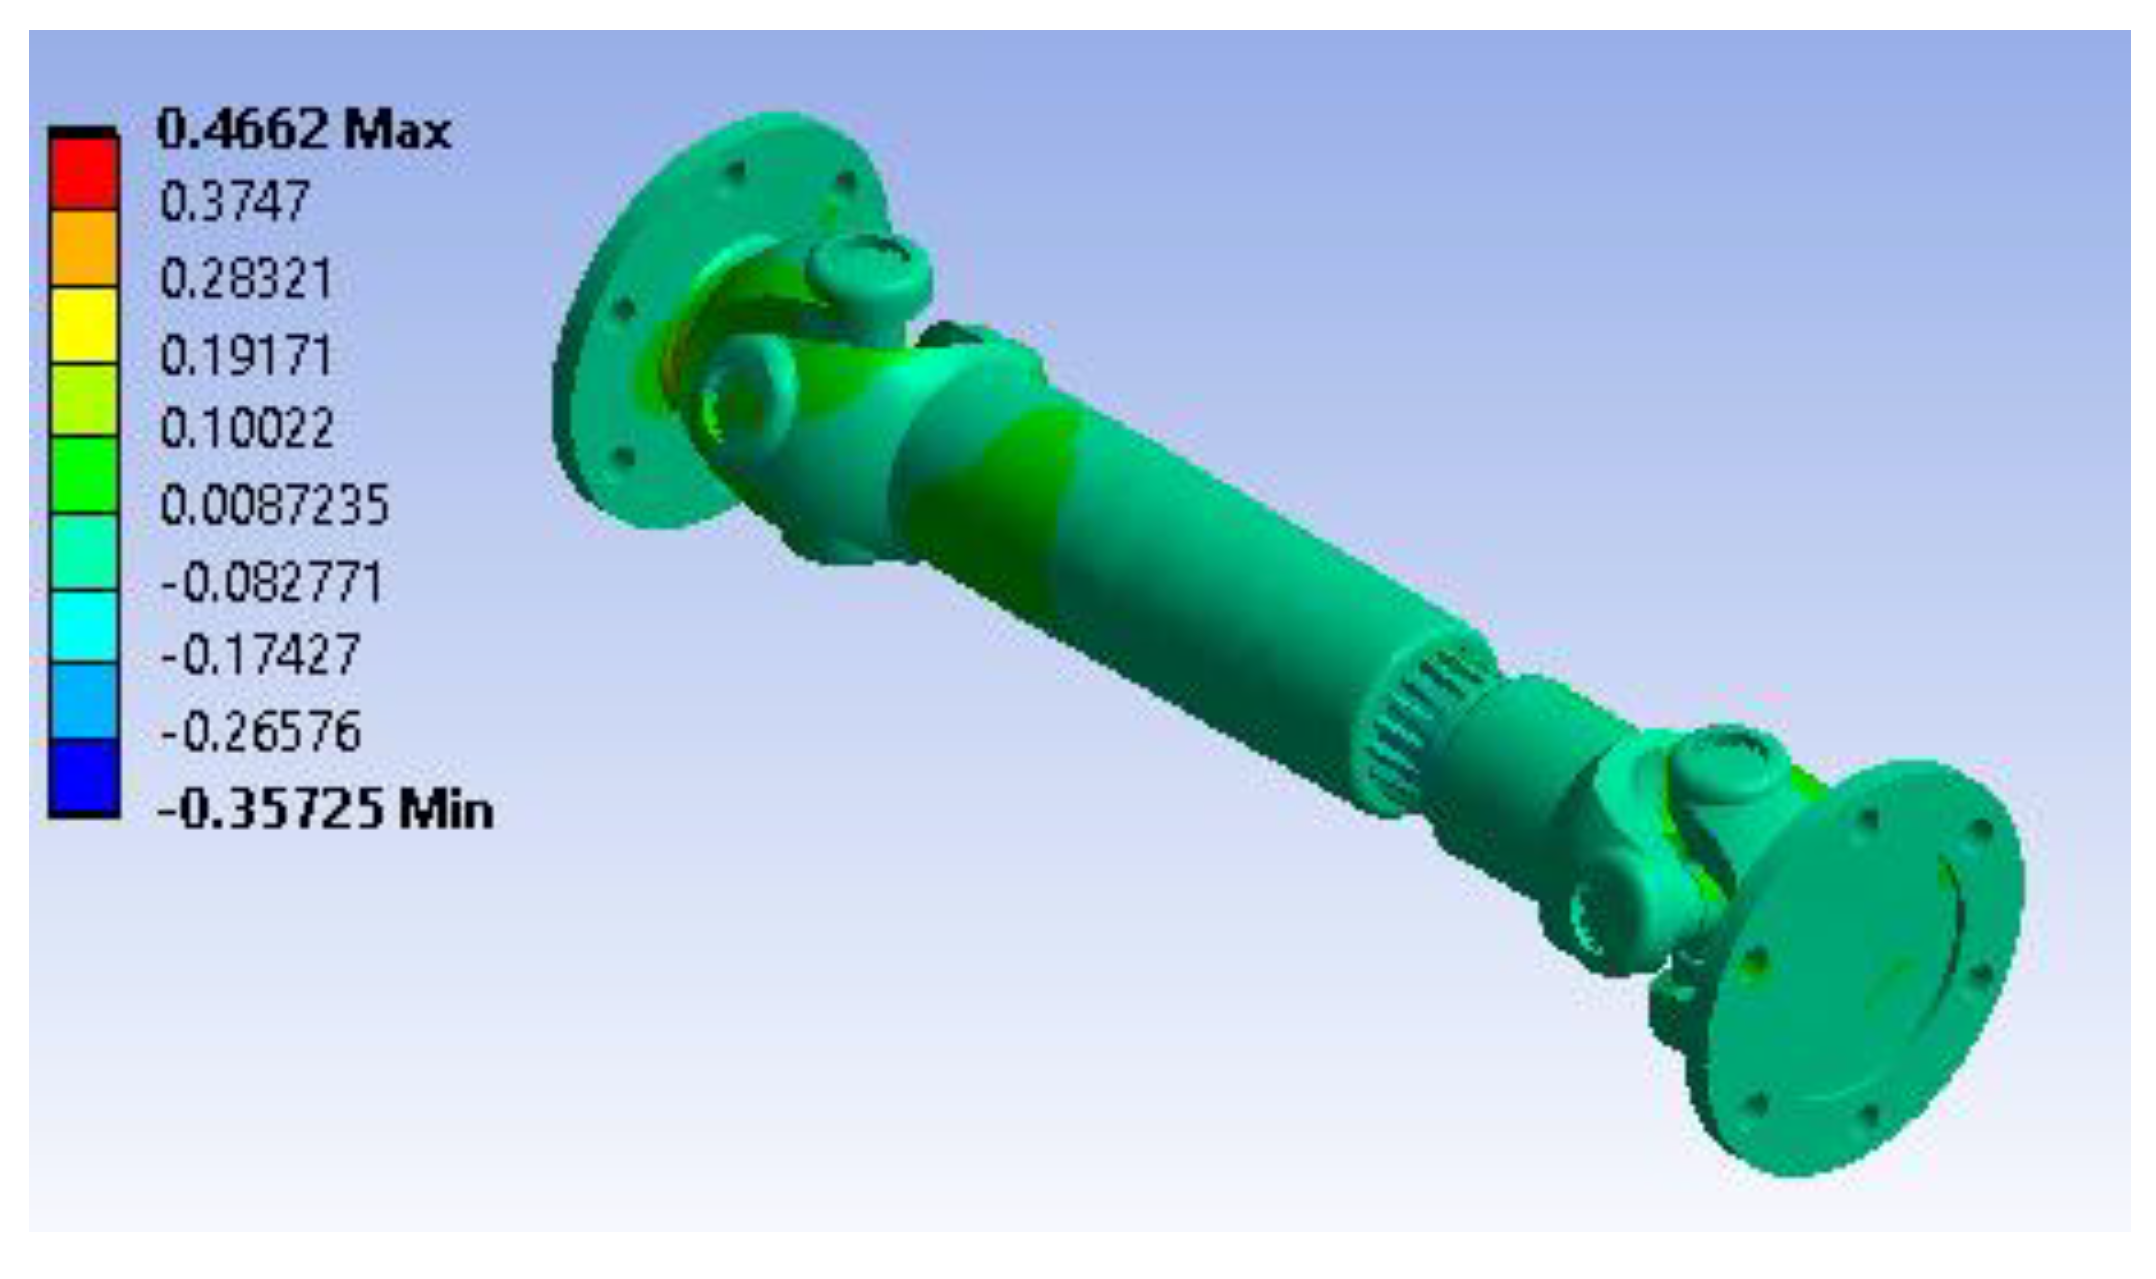
Figure 11.
Maximum principal stress variation.
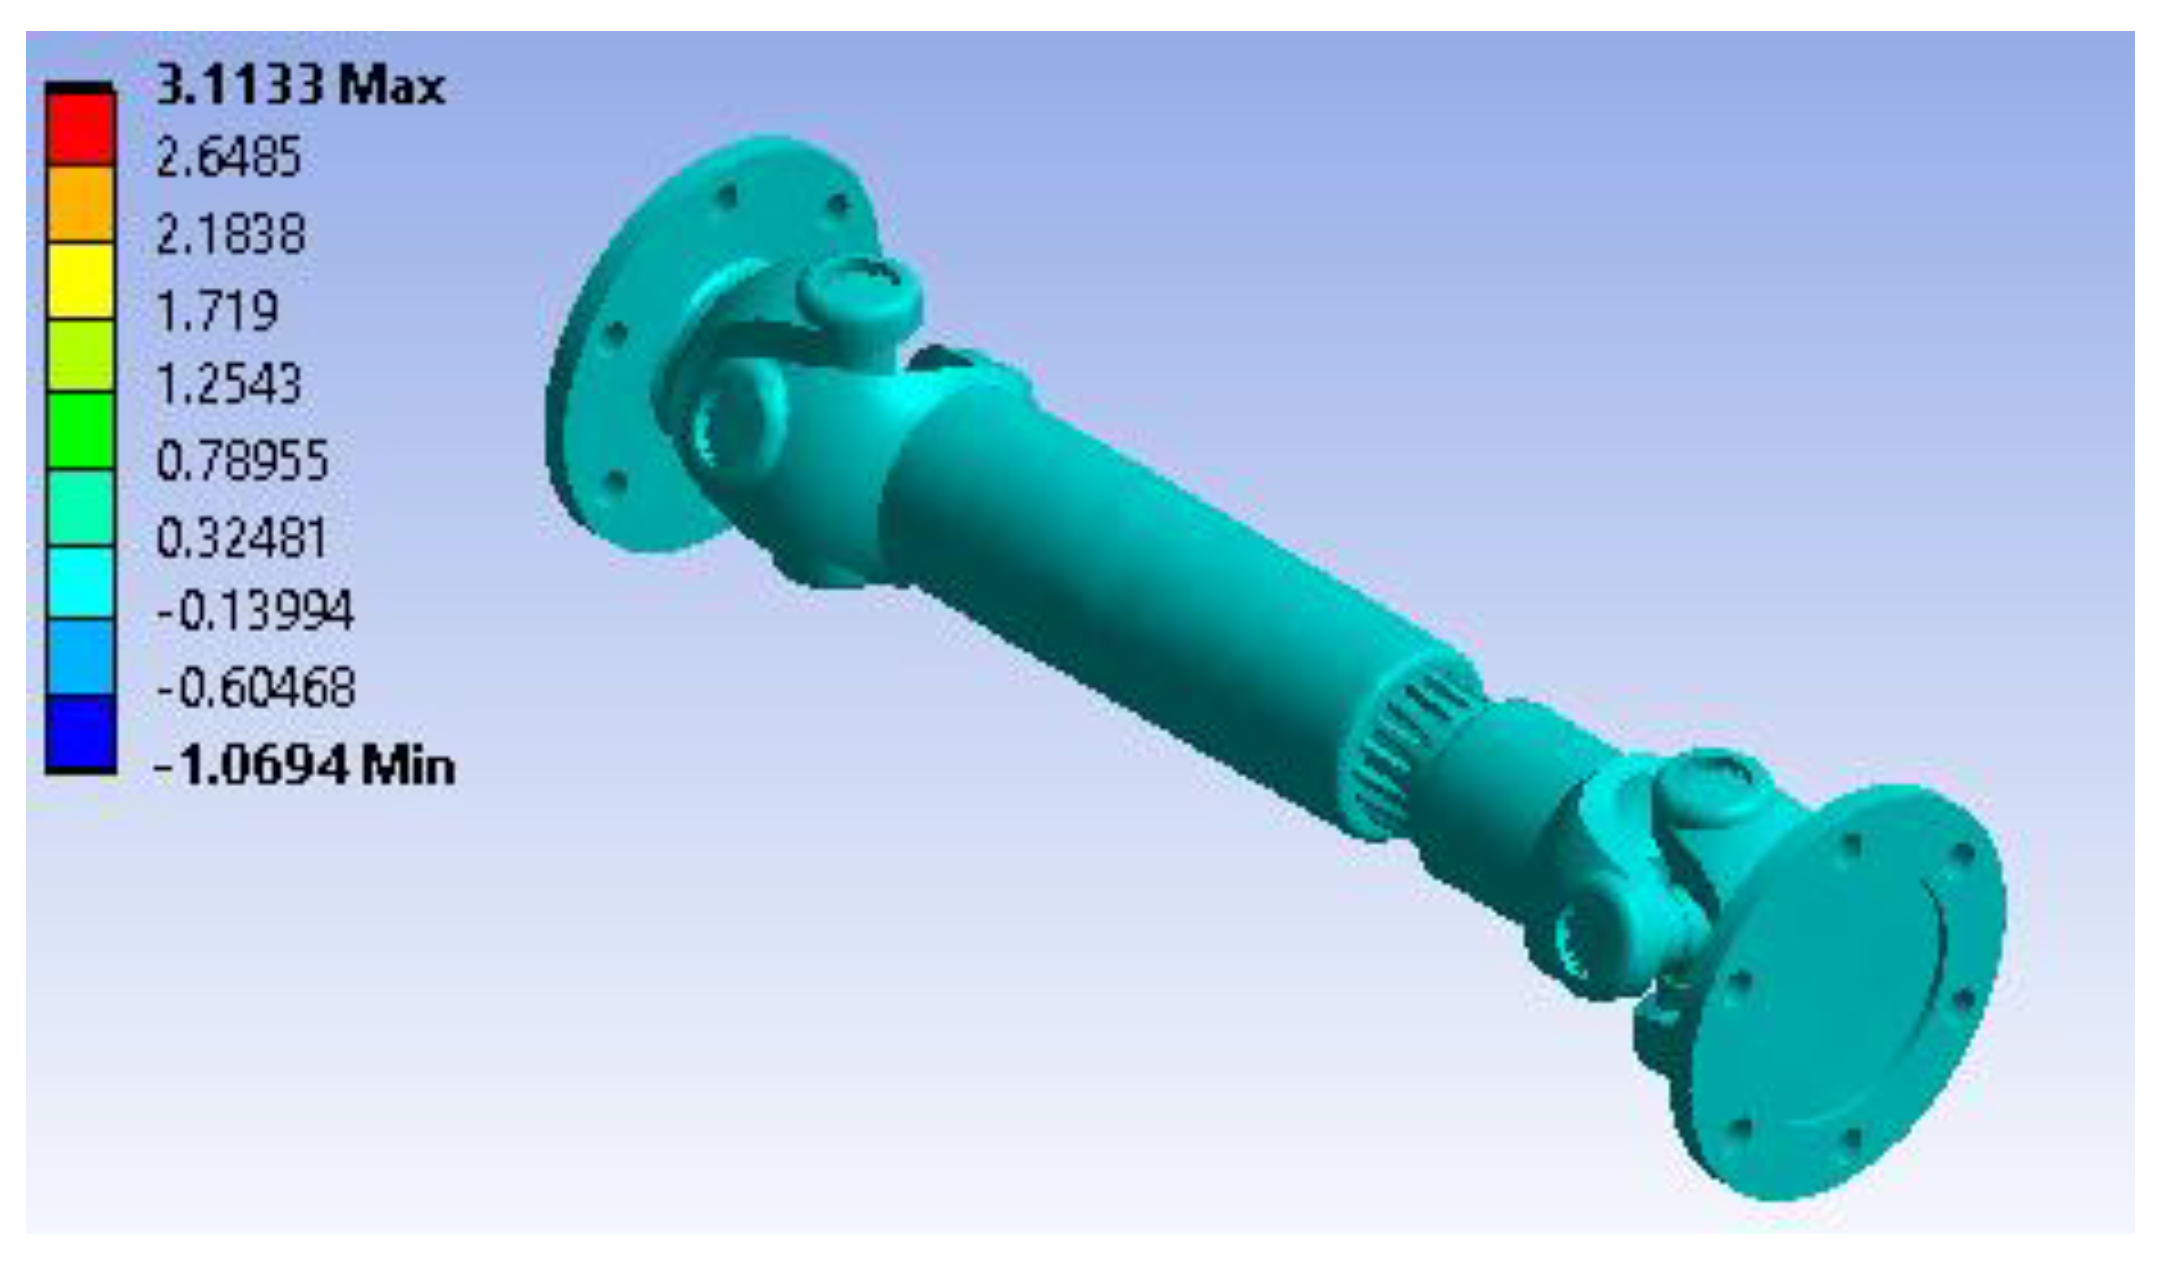
Figure 12.
Strain energy distribution.
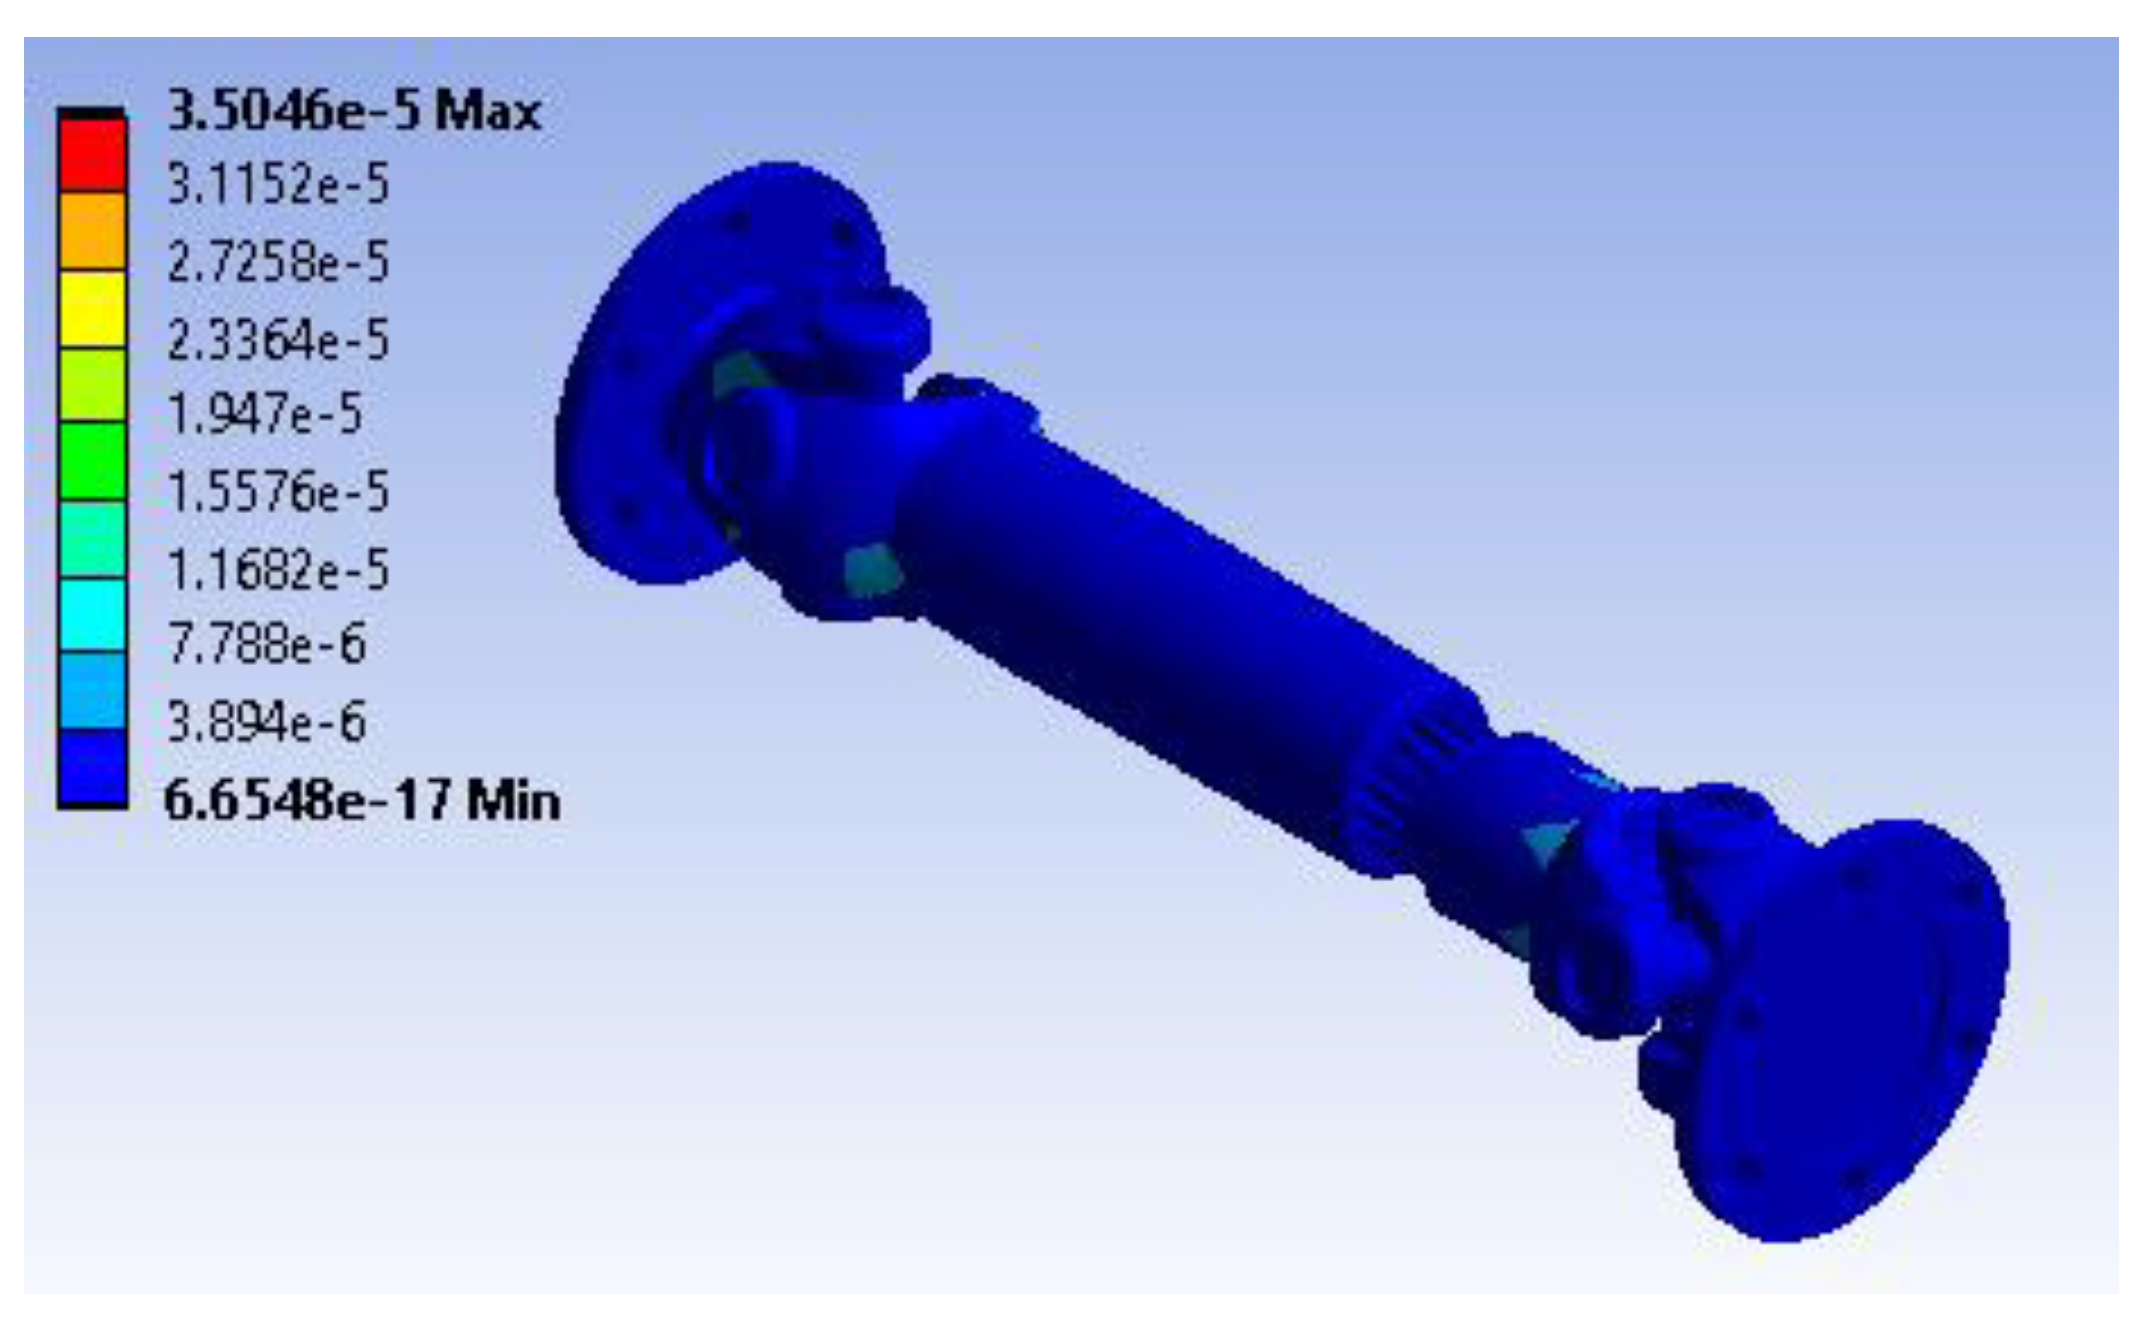
Figure 13.
Total deformation.
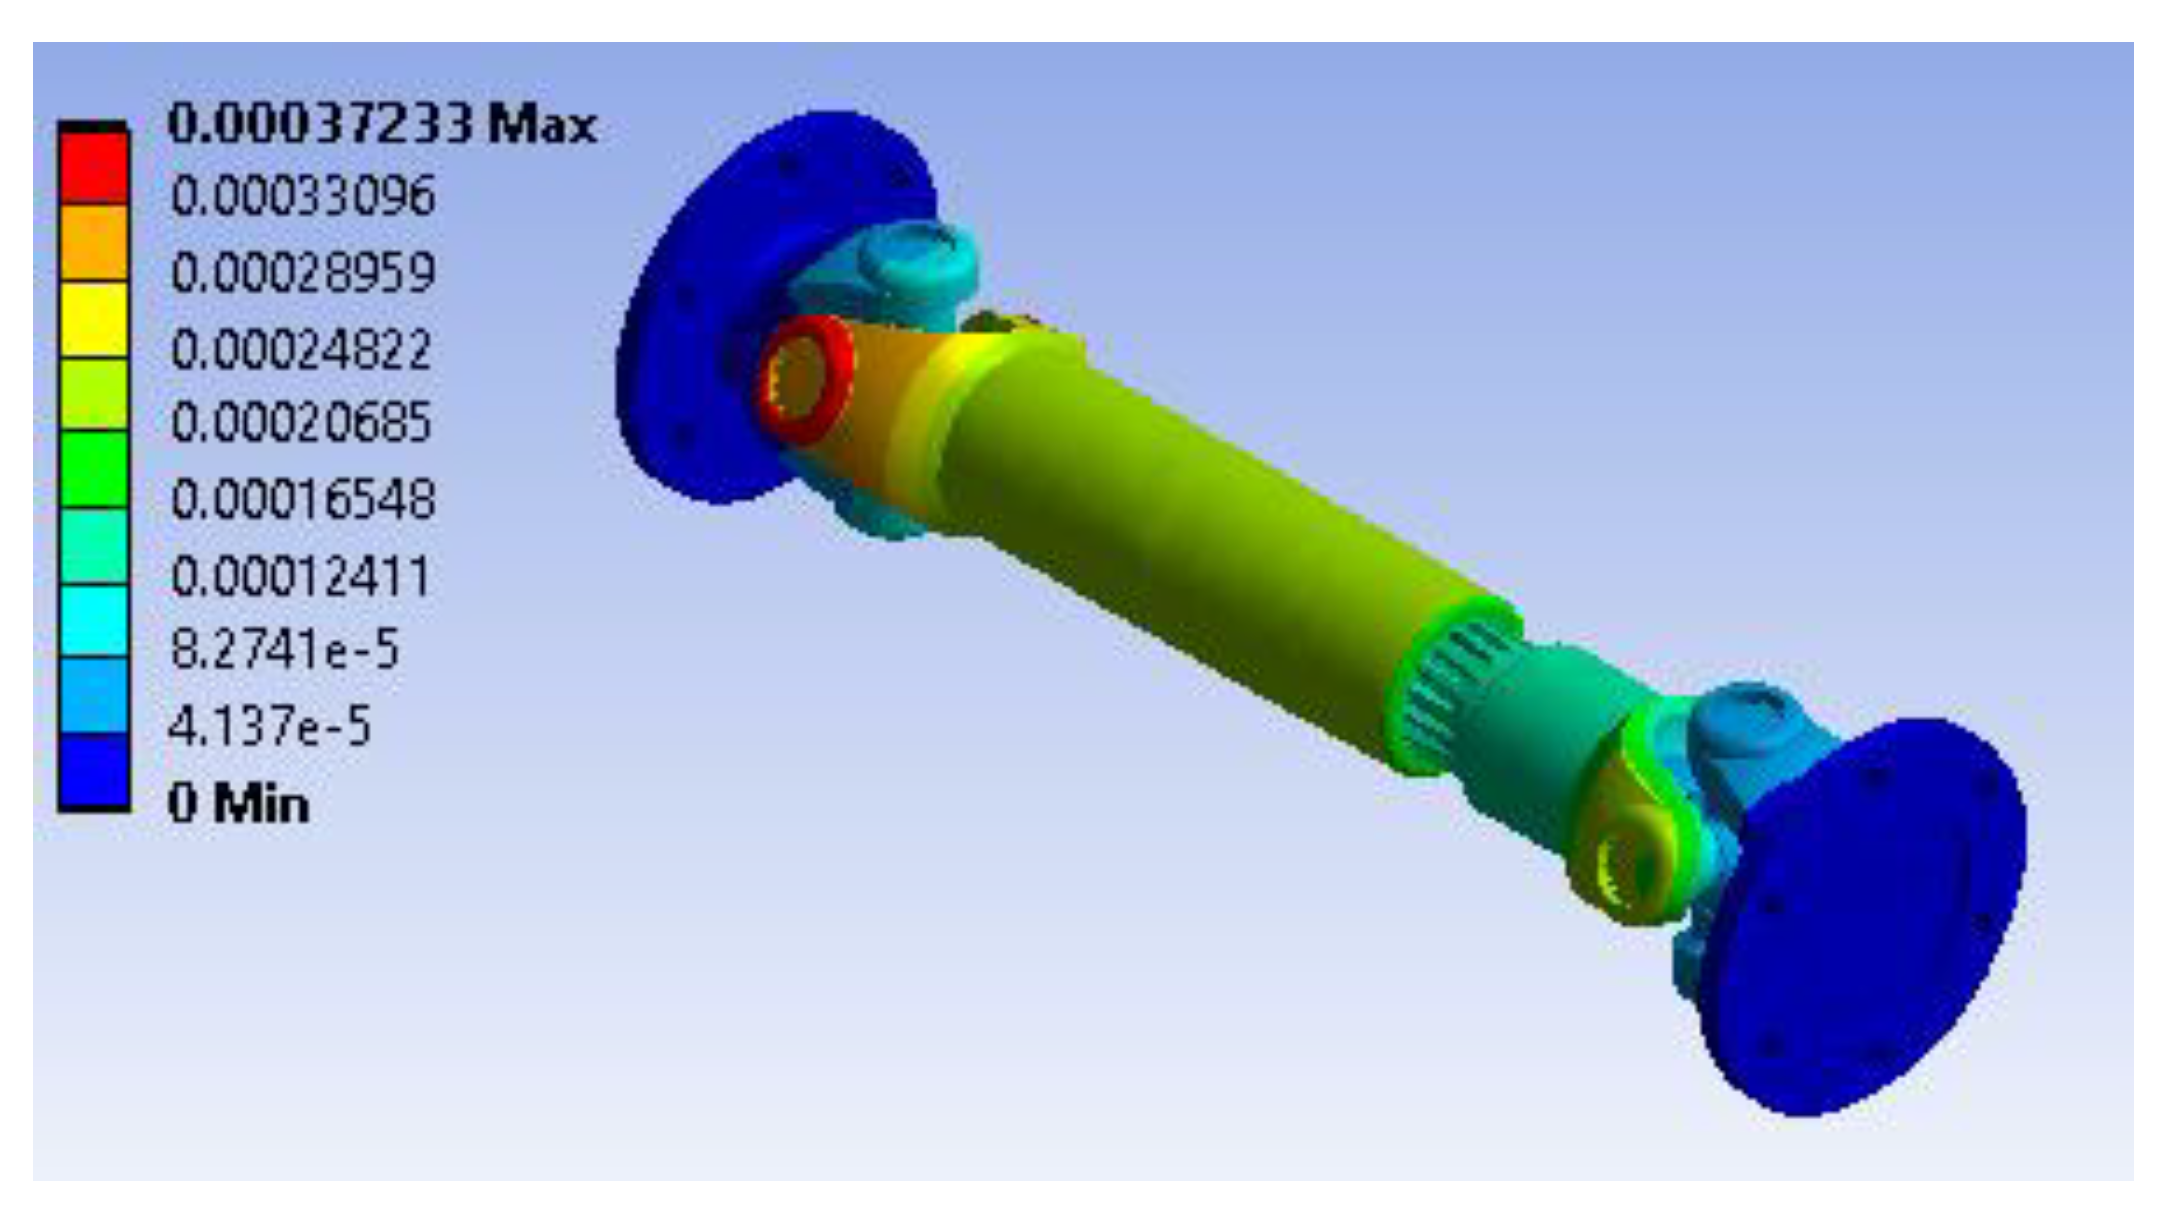
Figure 14.
Shear stress distribution (XY plane).
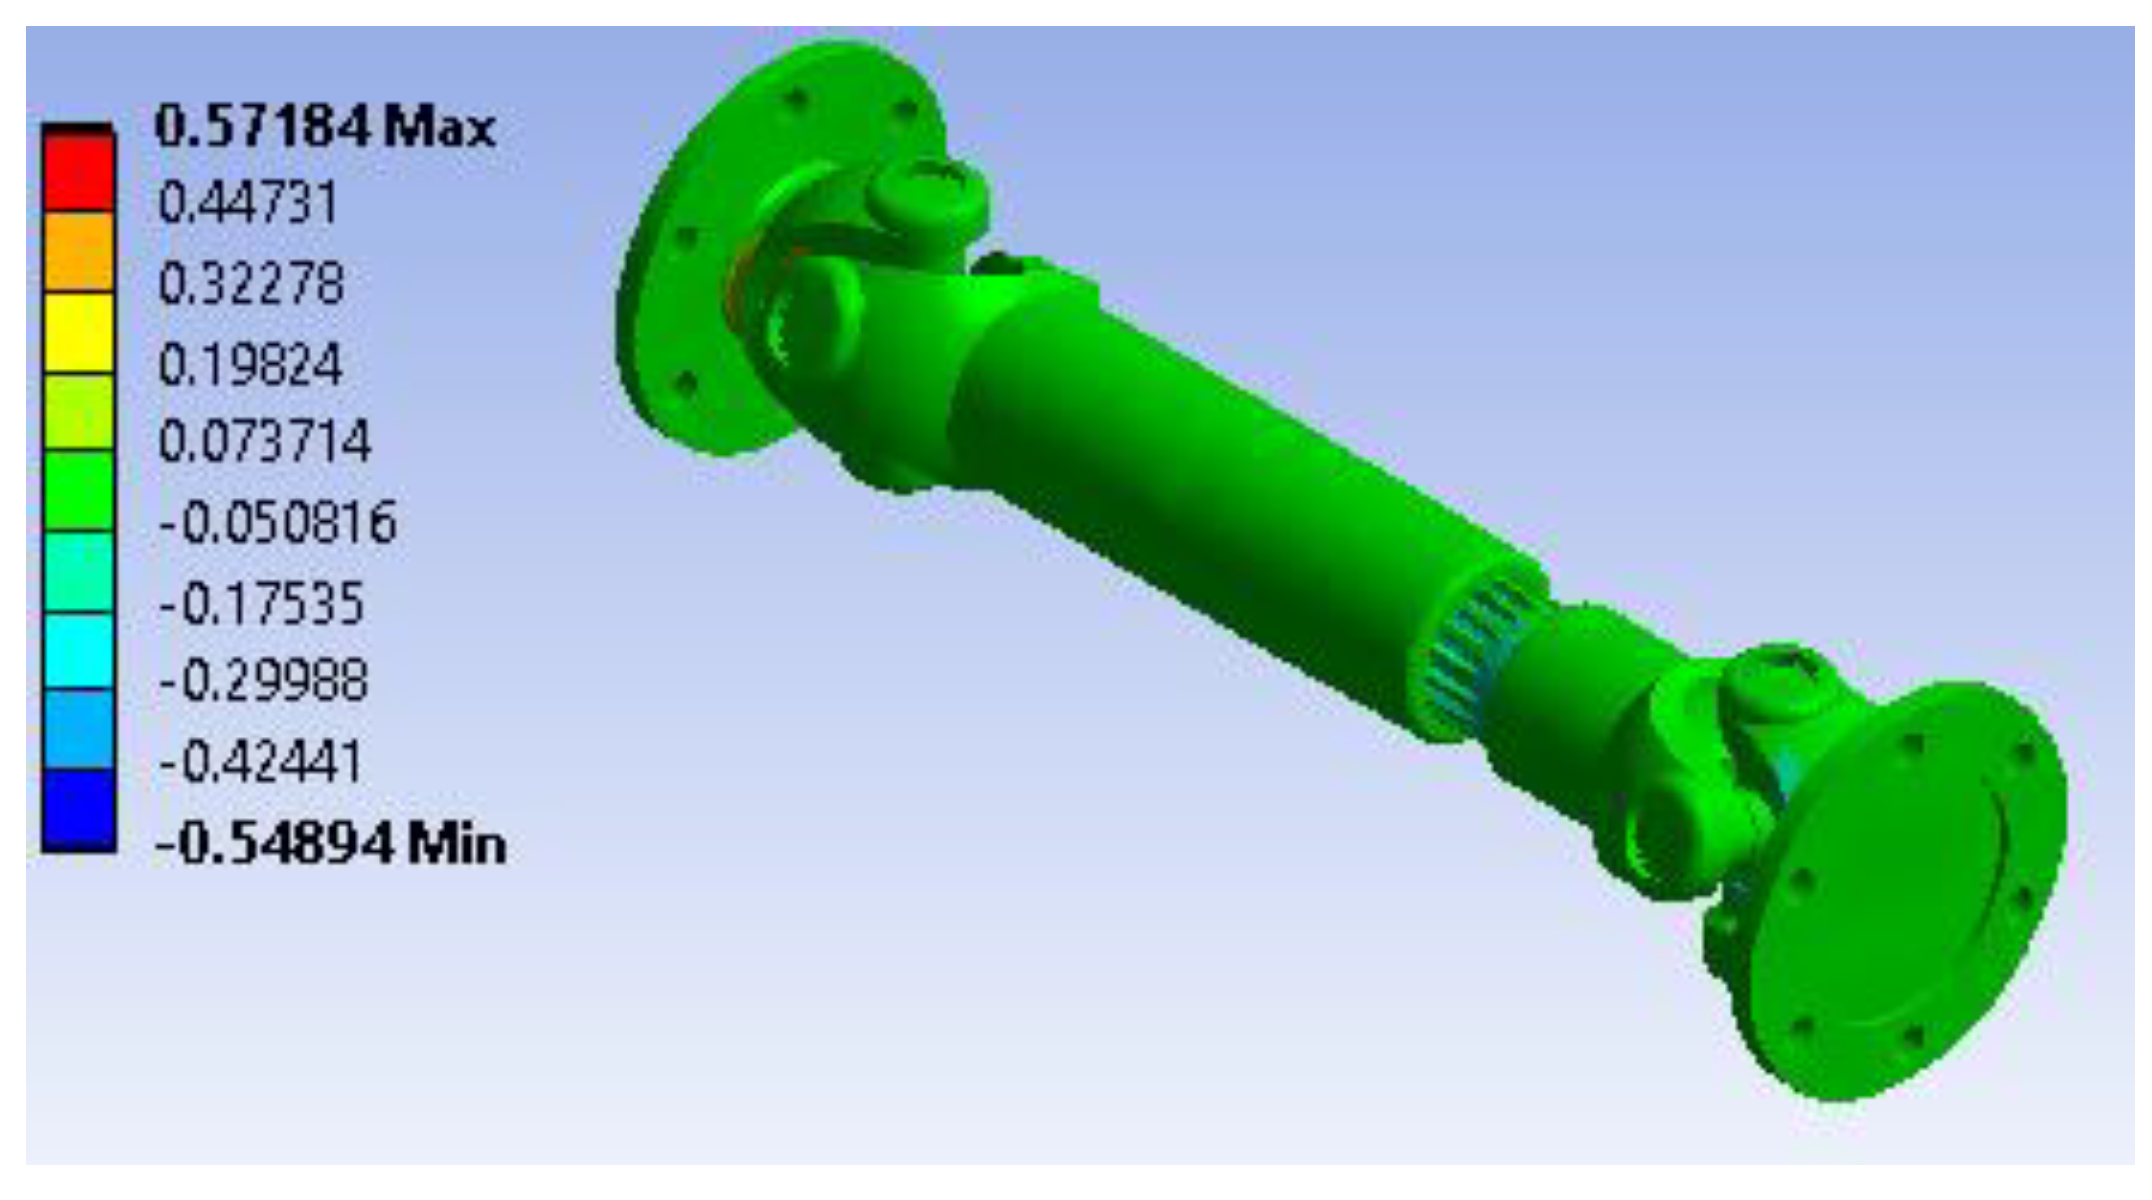
Figure 15.
Maximum principal stress variation.
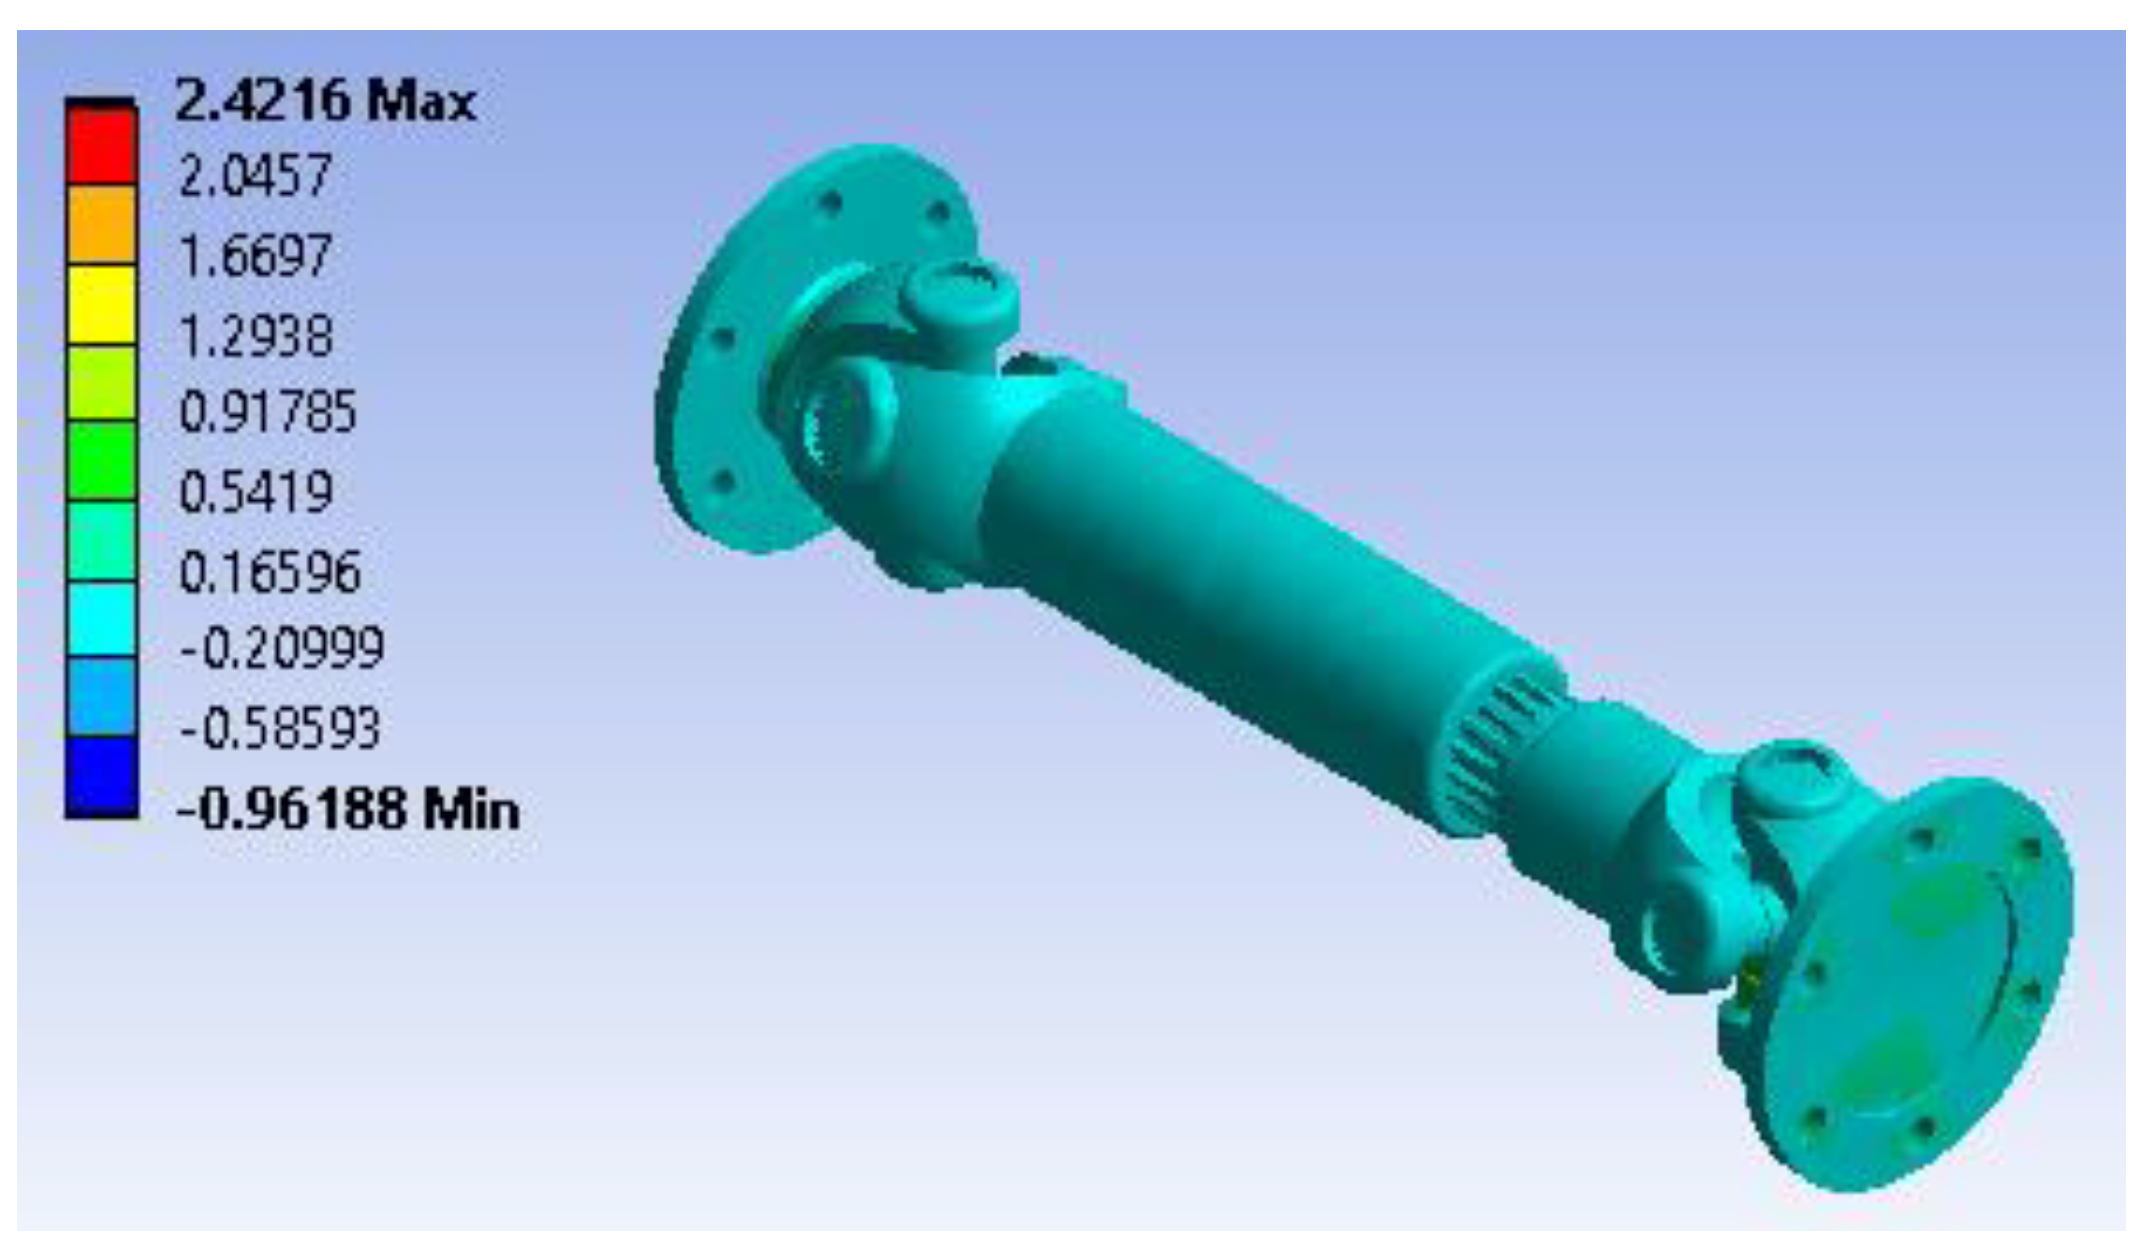
Figure 16.
Strain energy distribution.
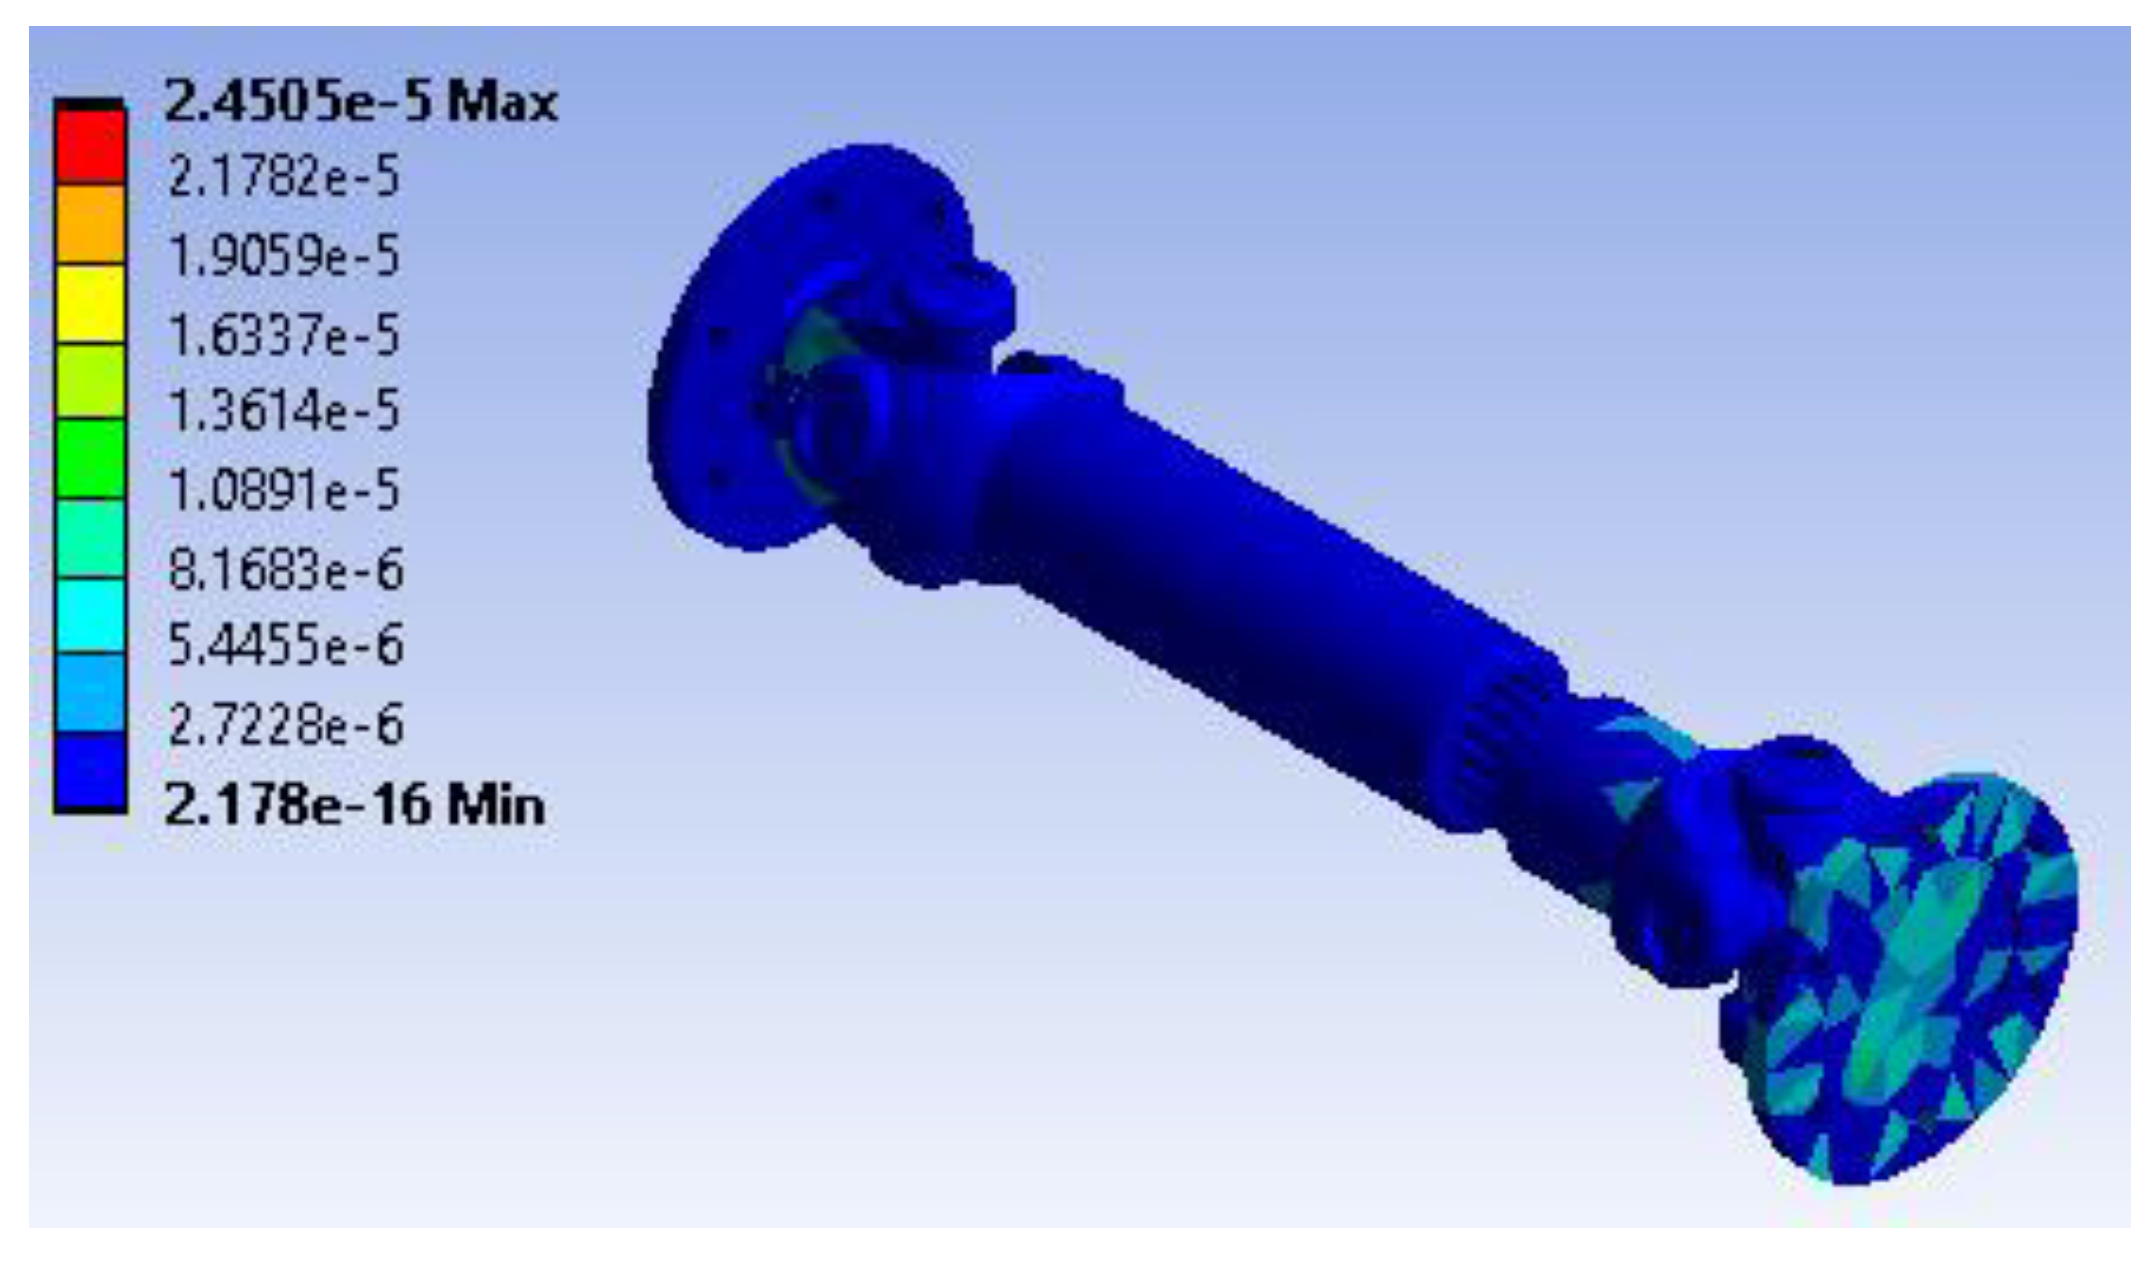
Figure 17.
Total deformation.
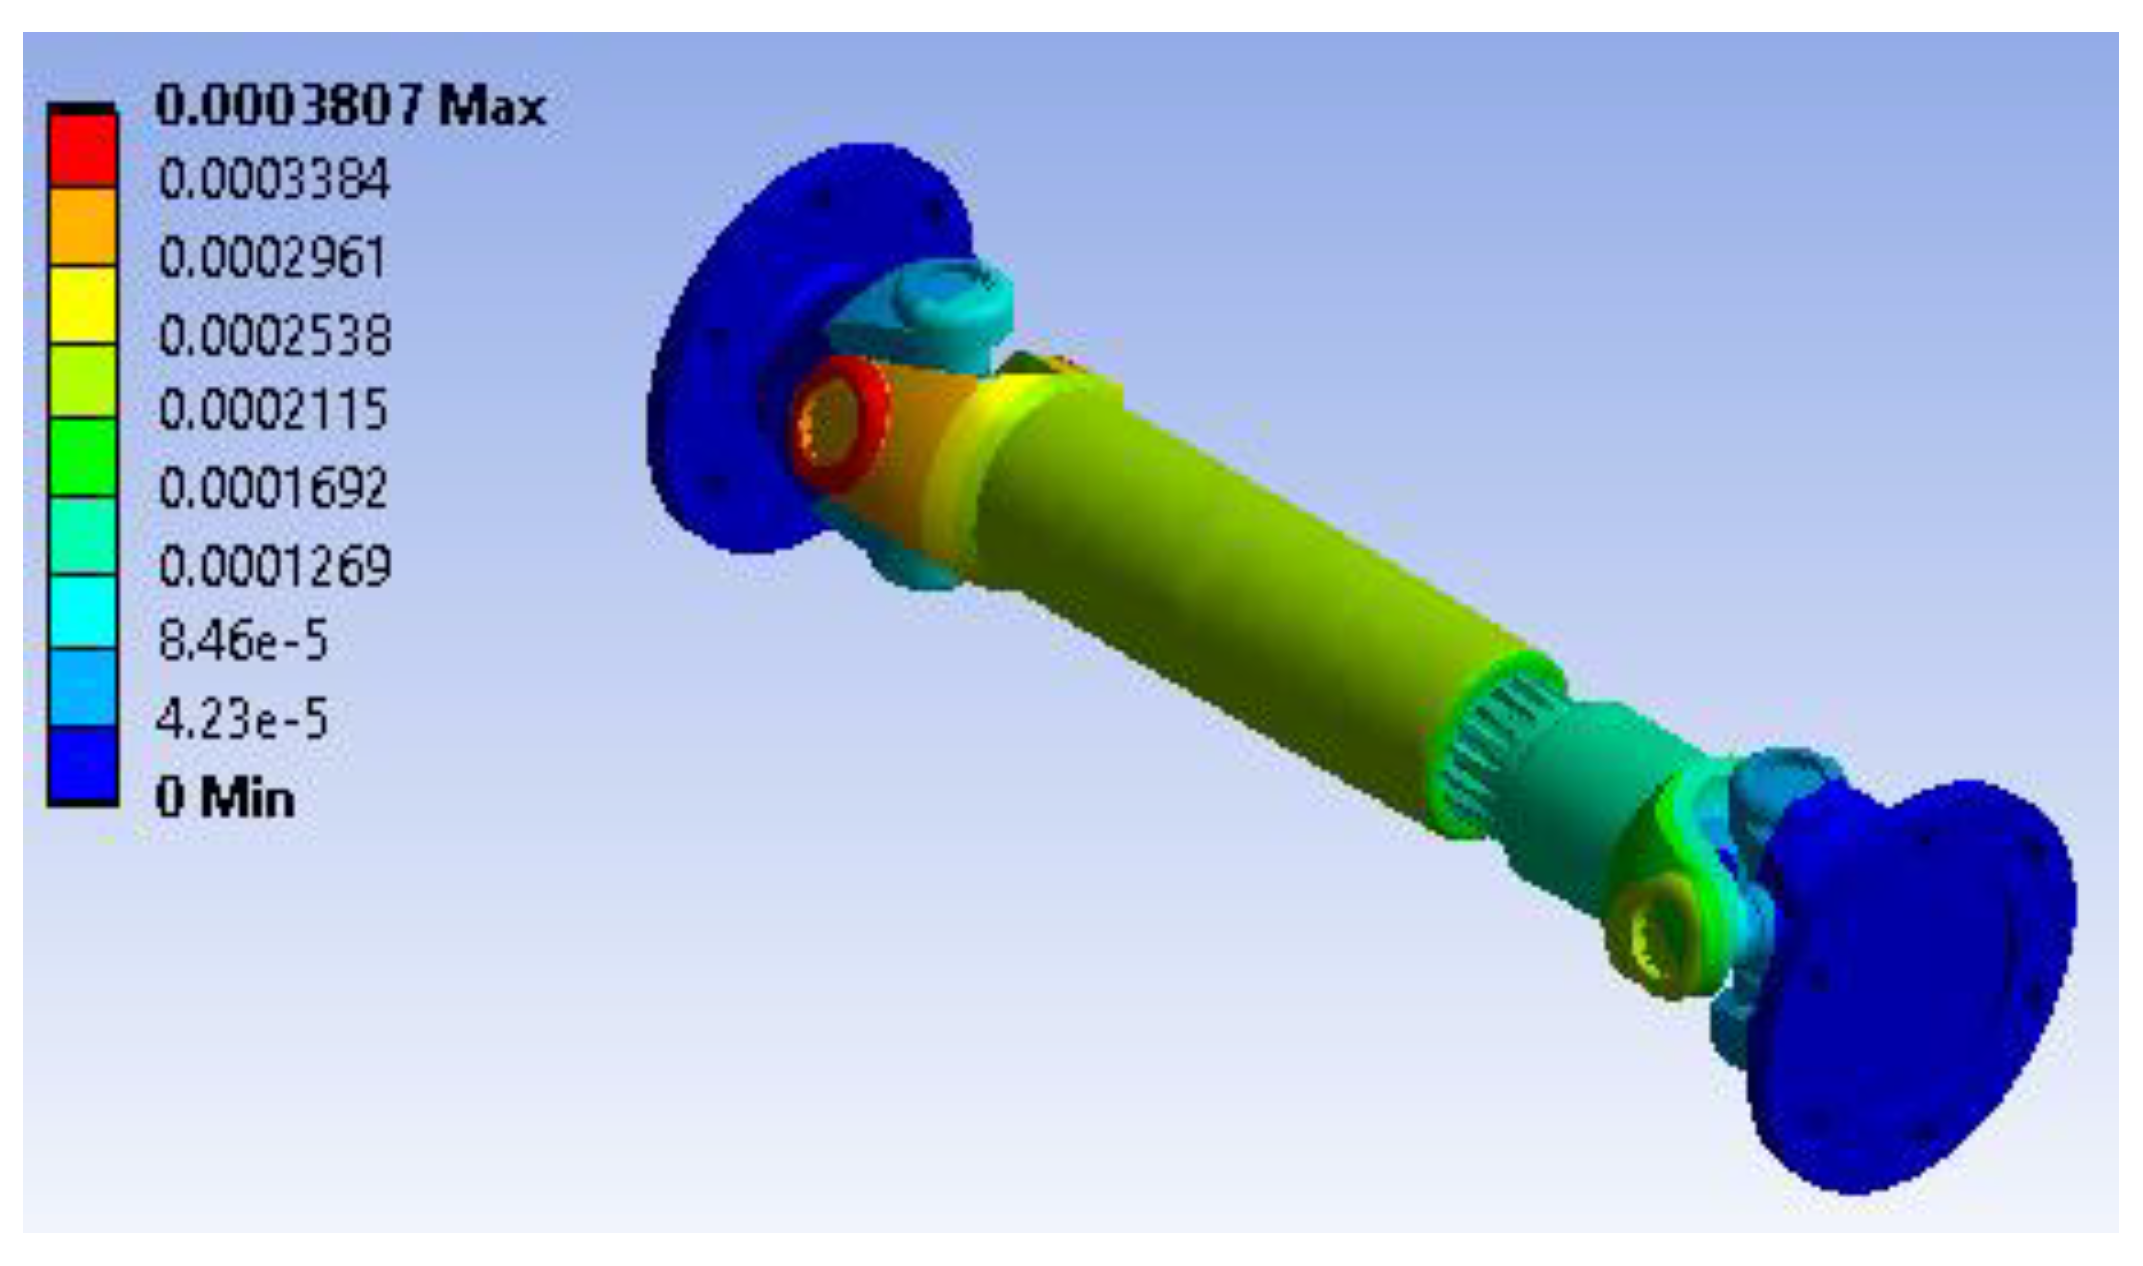
Figure 18.
Shear stress distribution (XY plane).
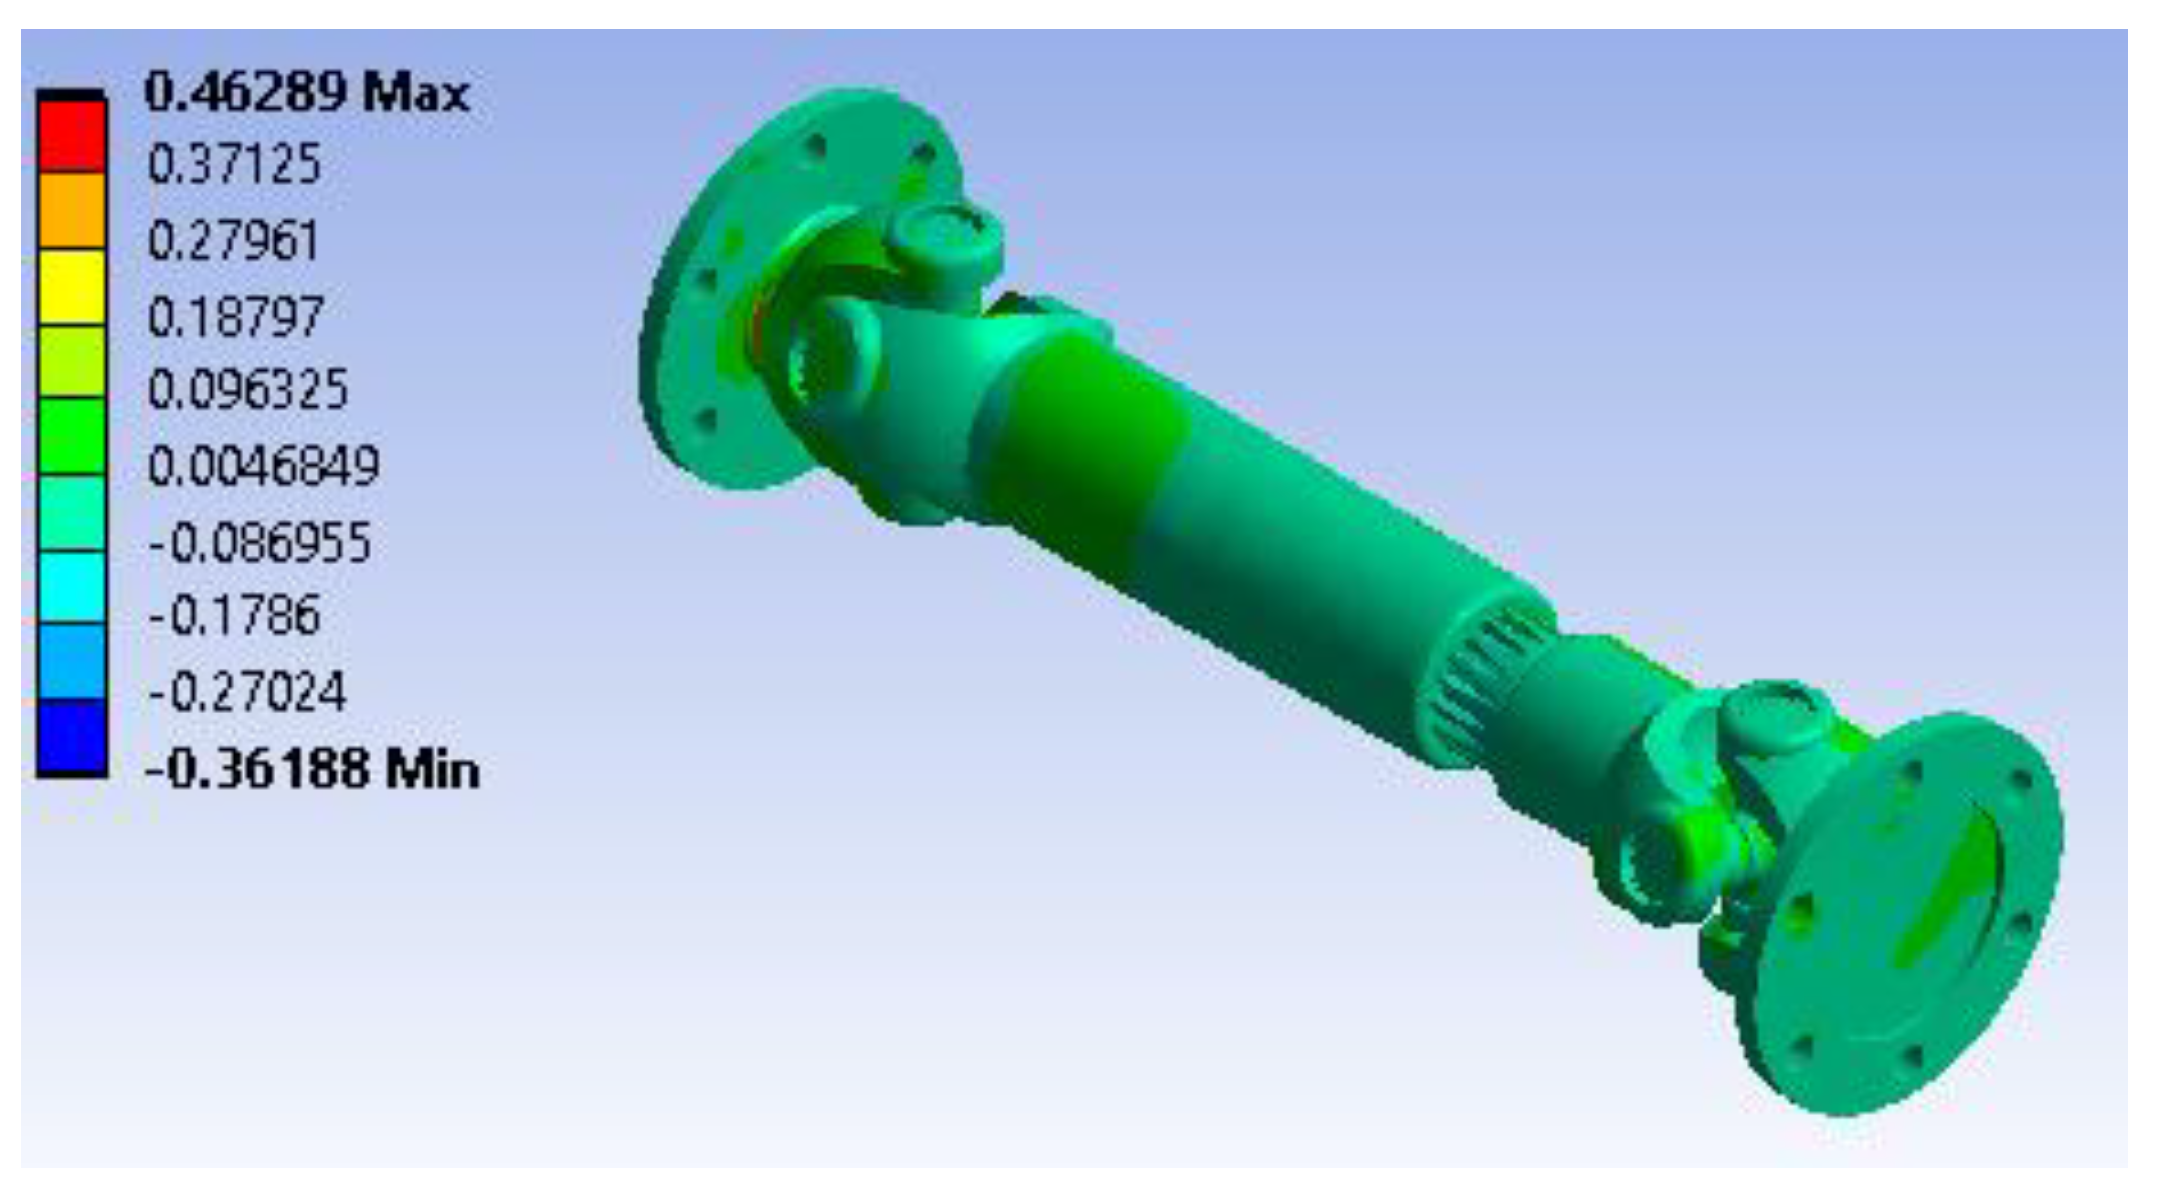
Figure 19.
Maximum principal stress variation.
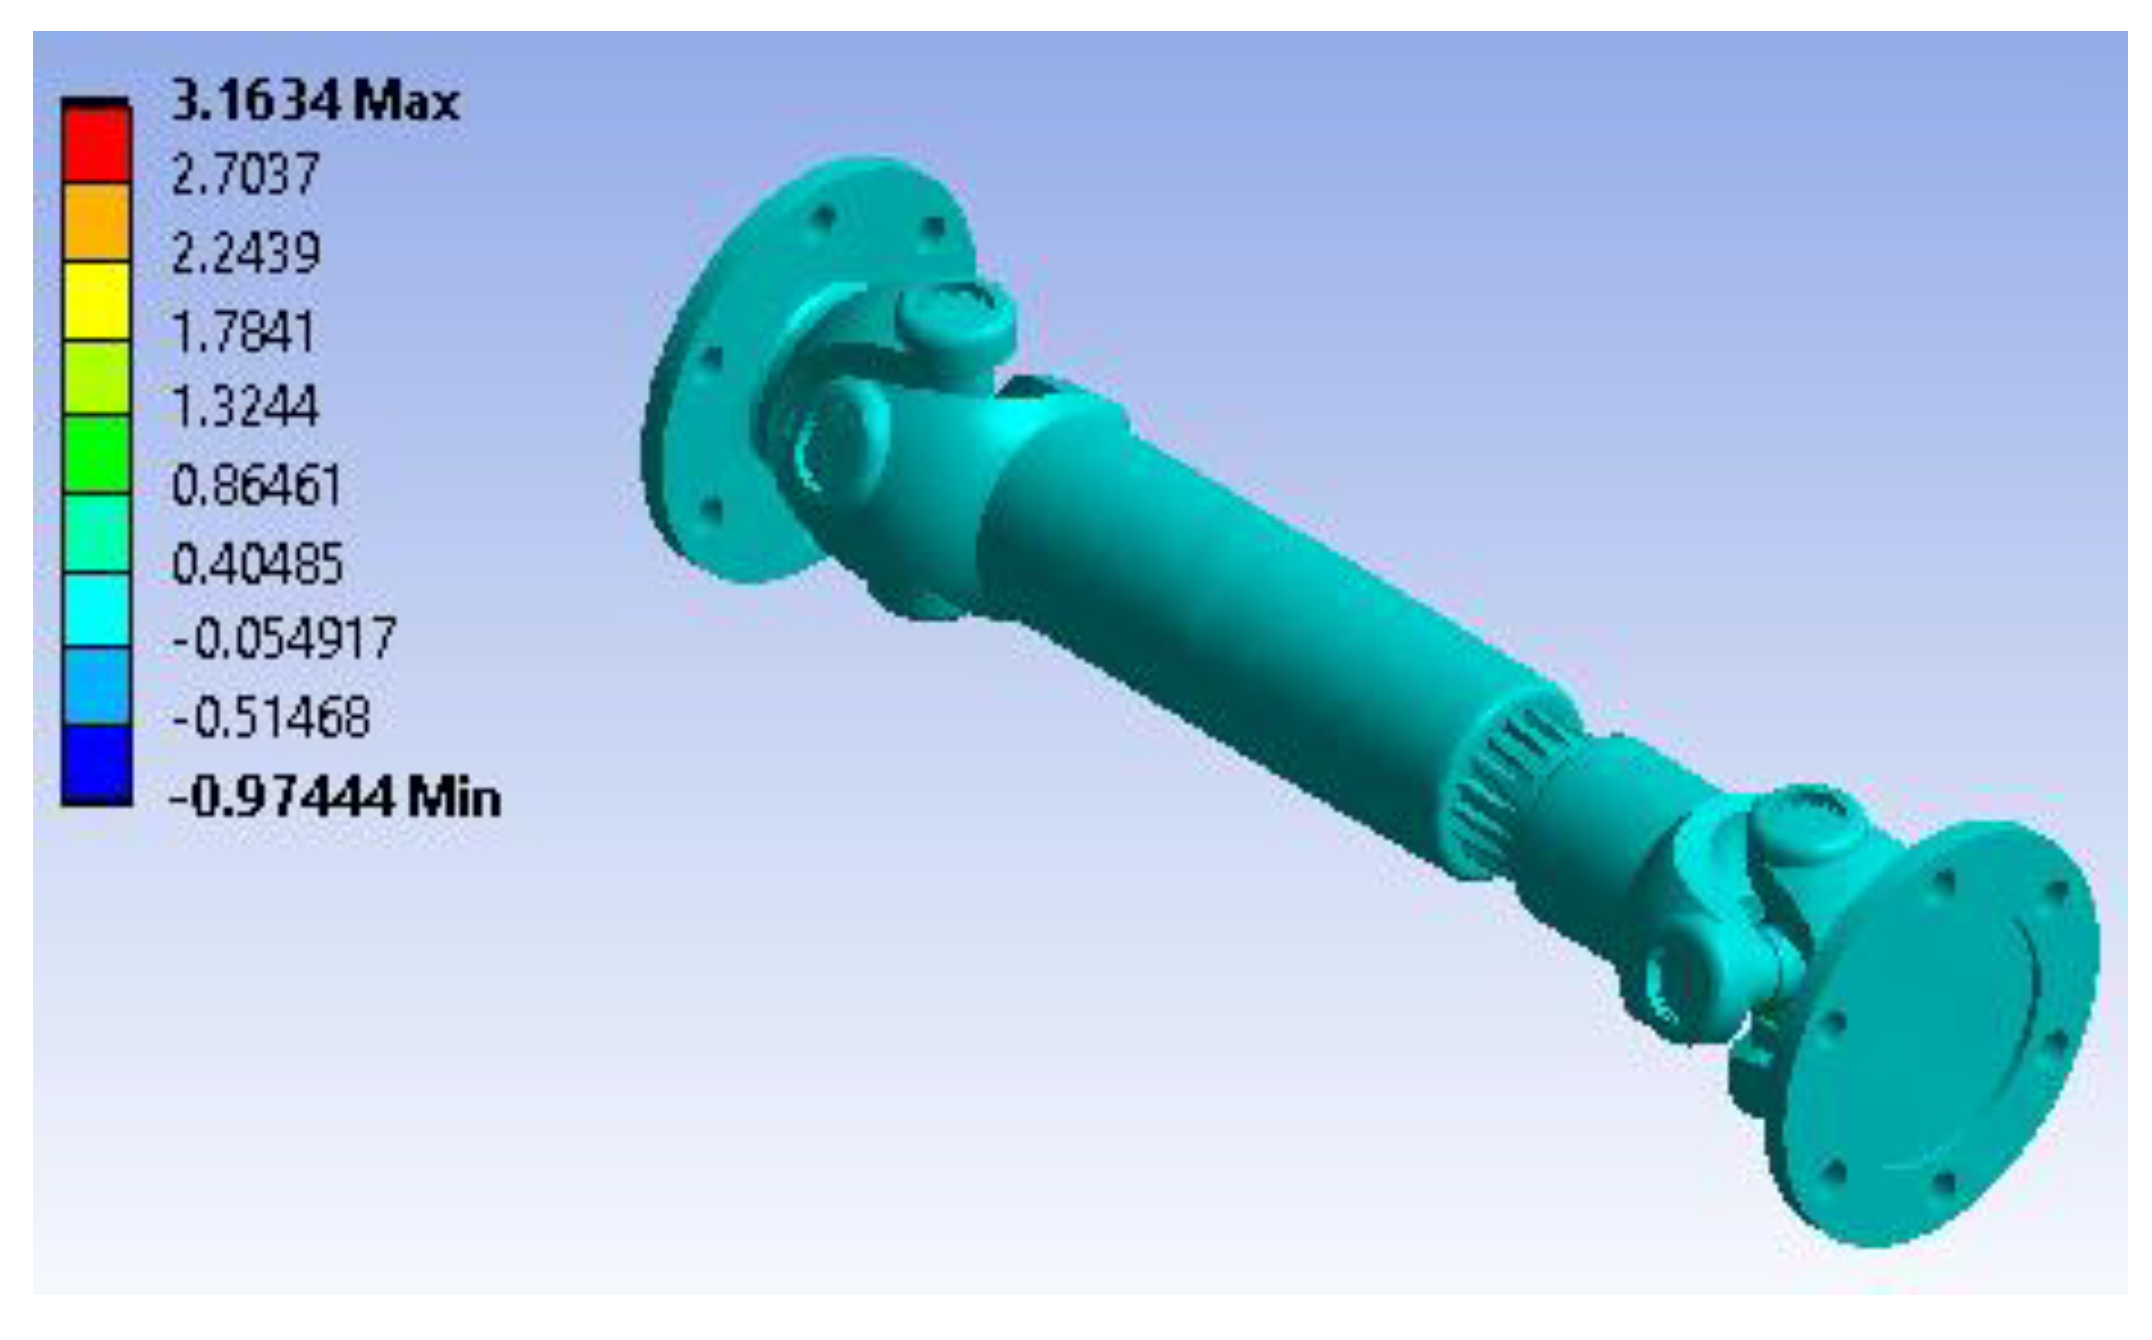
Figure 20.
Strain energy distribution.
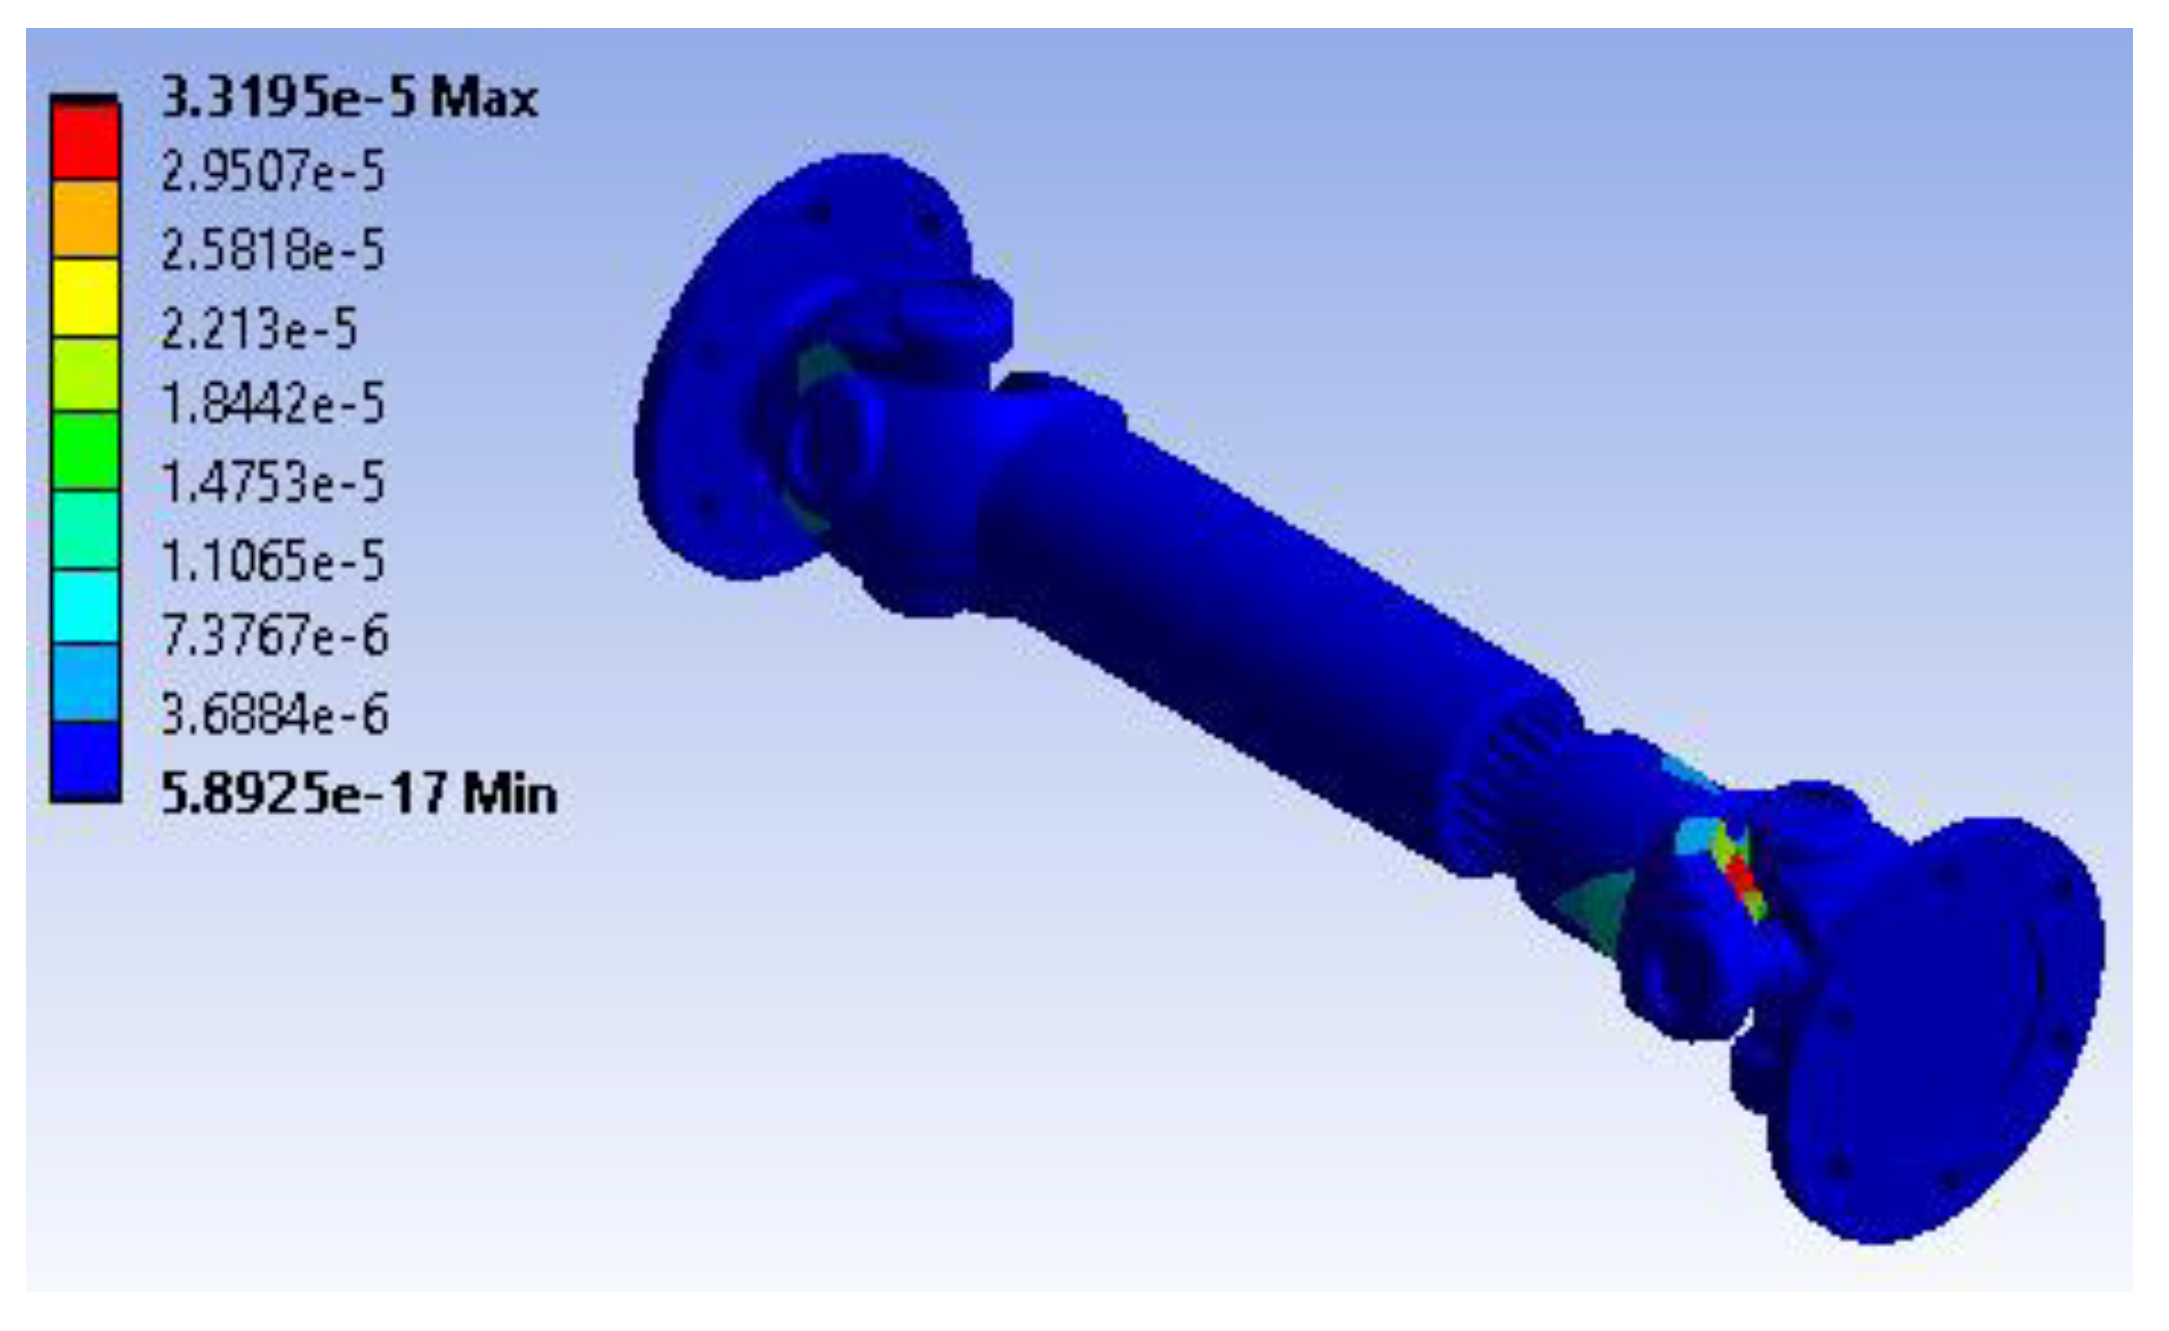
Figure 21.
Total deformation.
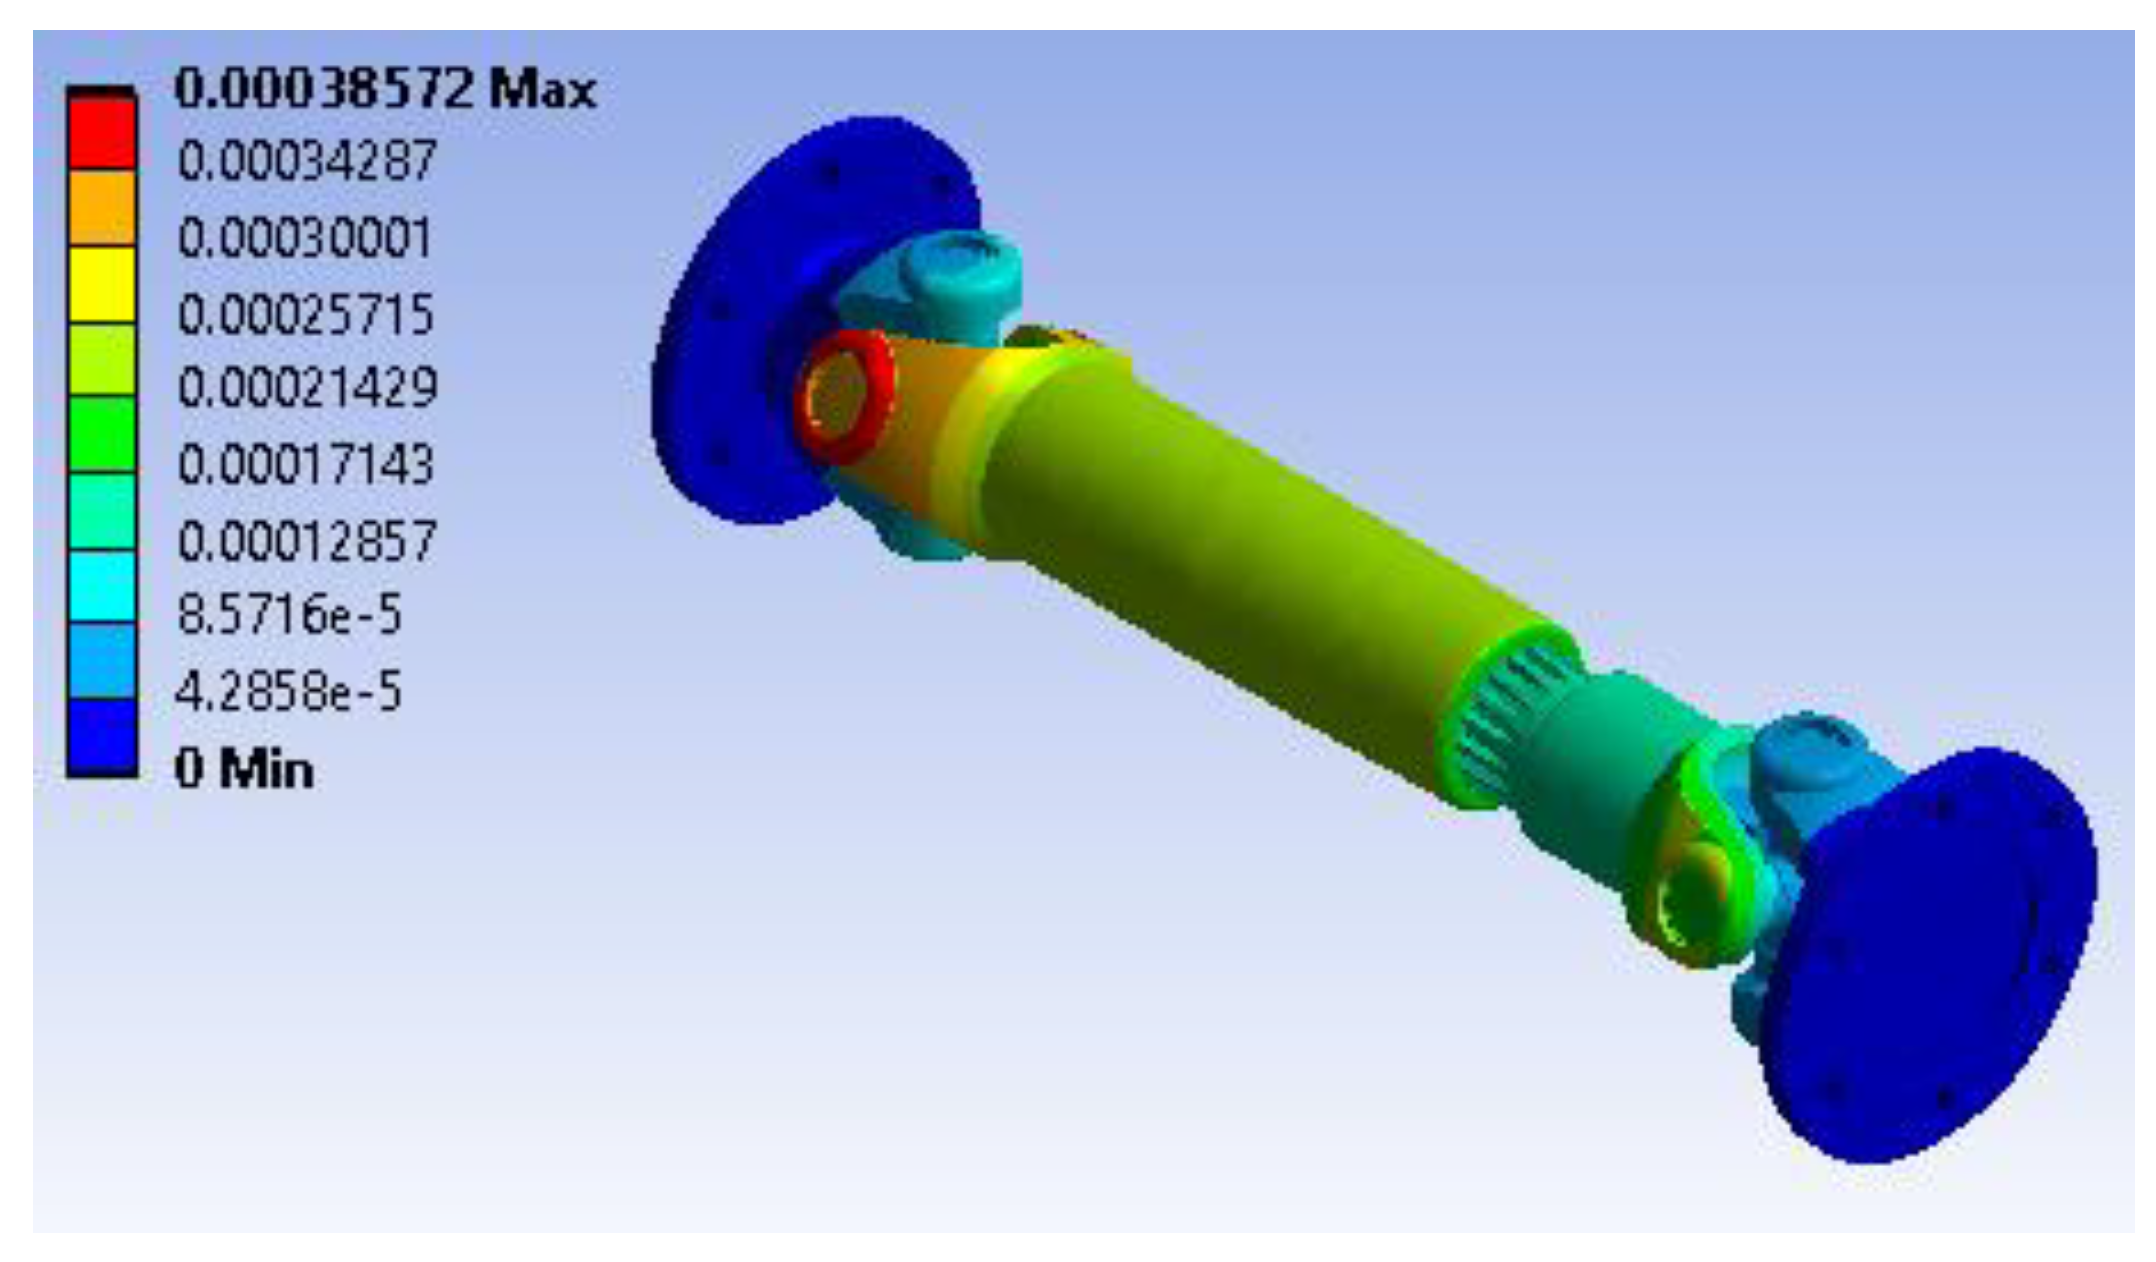
Figure 22.
Shear stress distribution (XY plane).
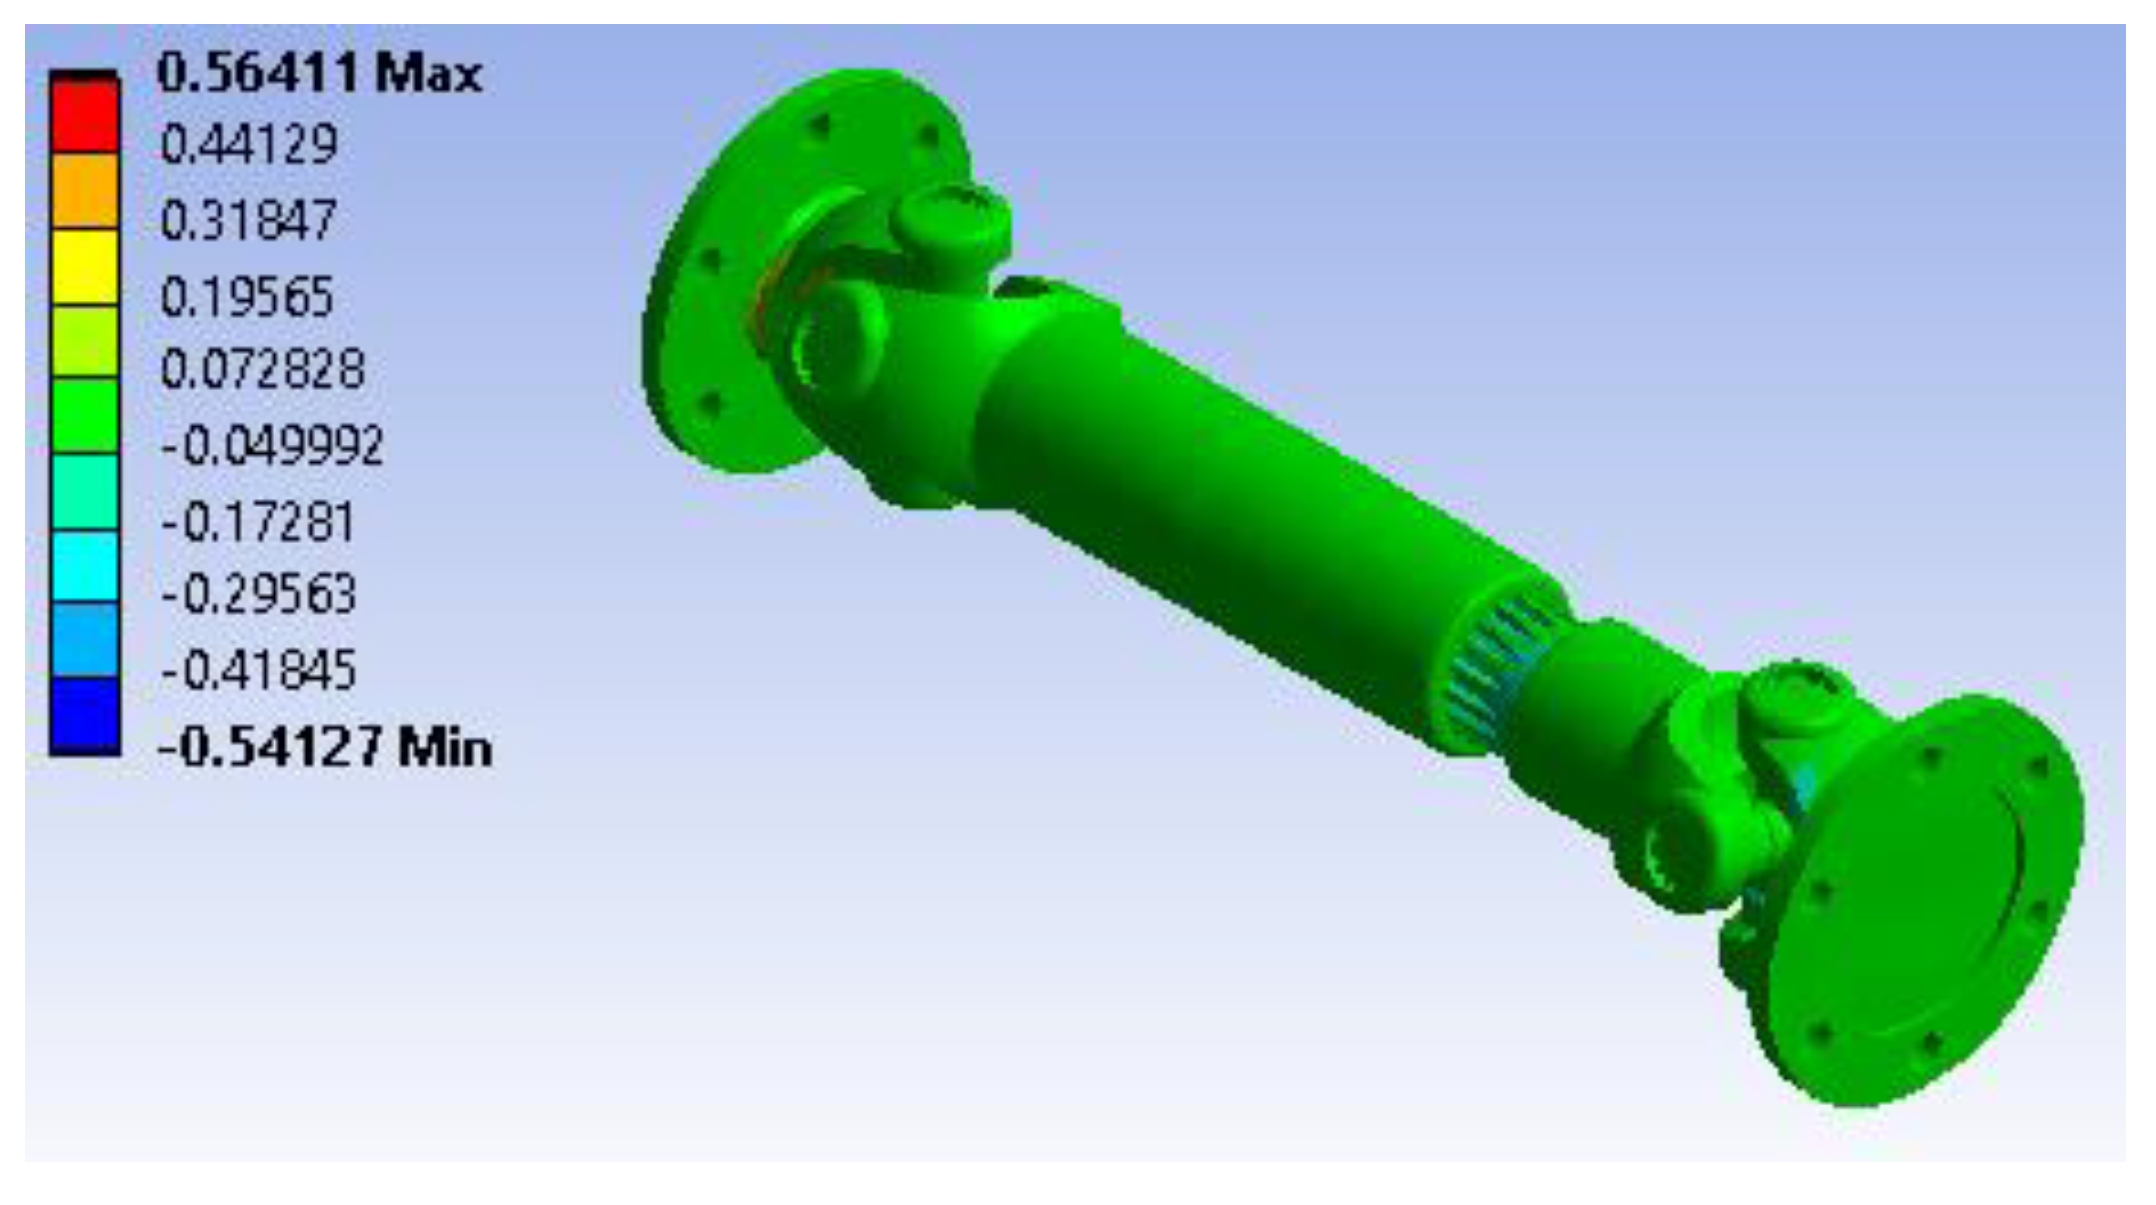
Figure 23.
Maximum principal stress variation.

Figure 24.
Strain energy distribution.
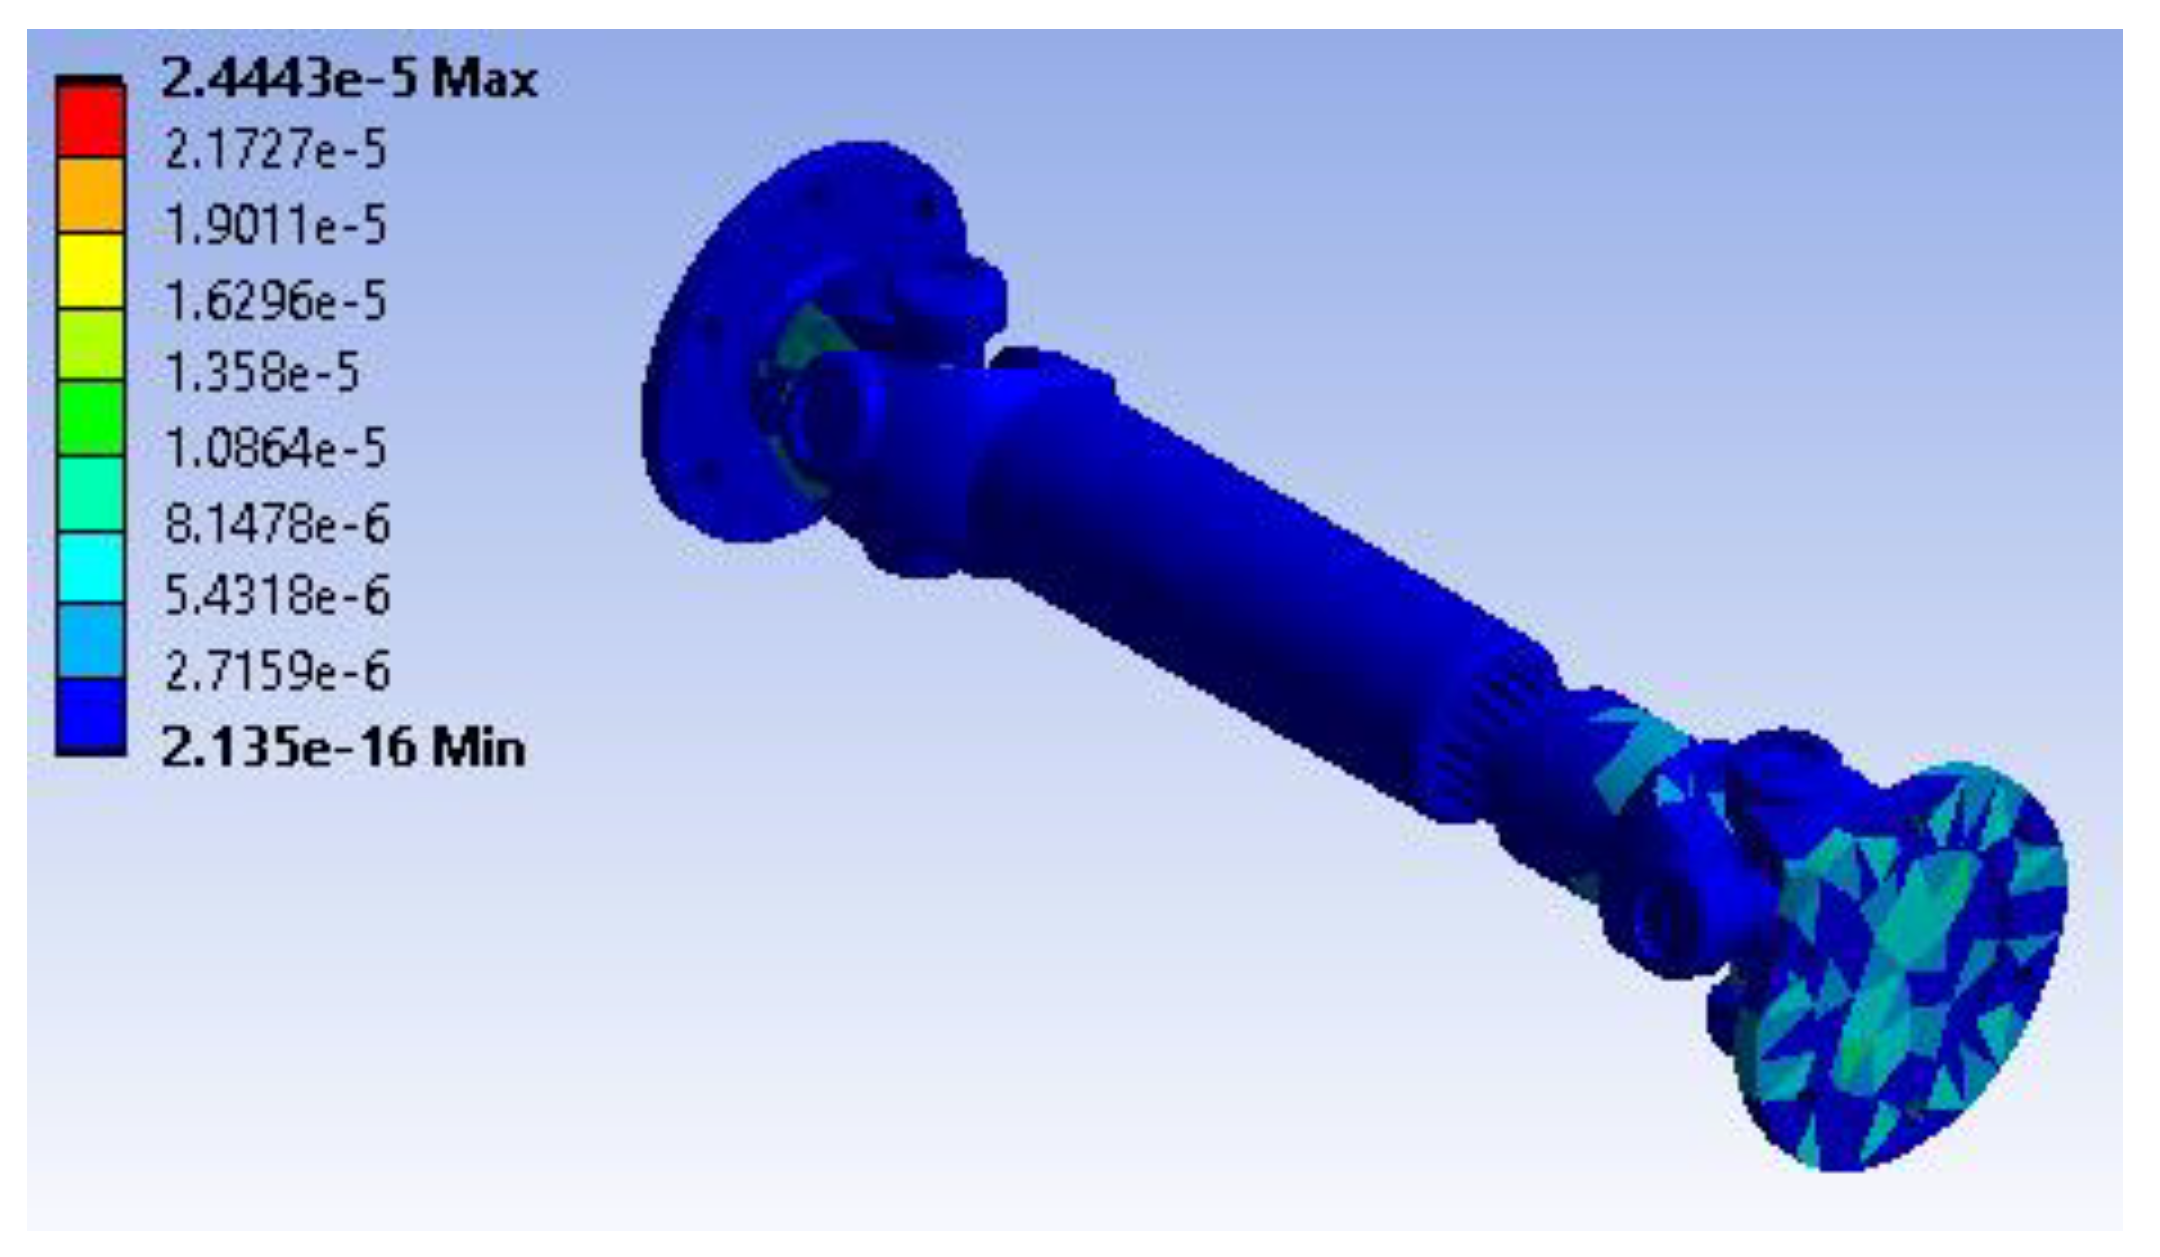
Figure 25.
Total deformation.
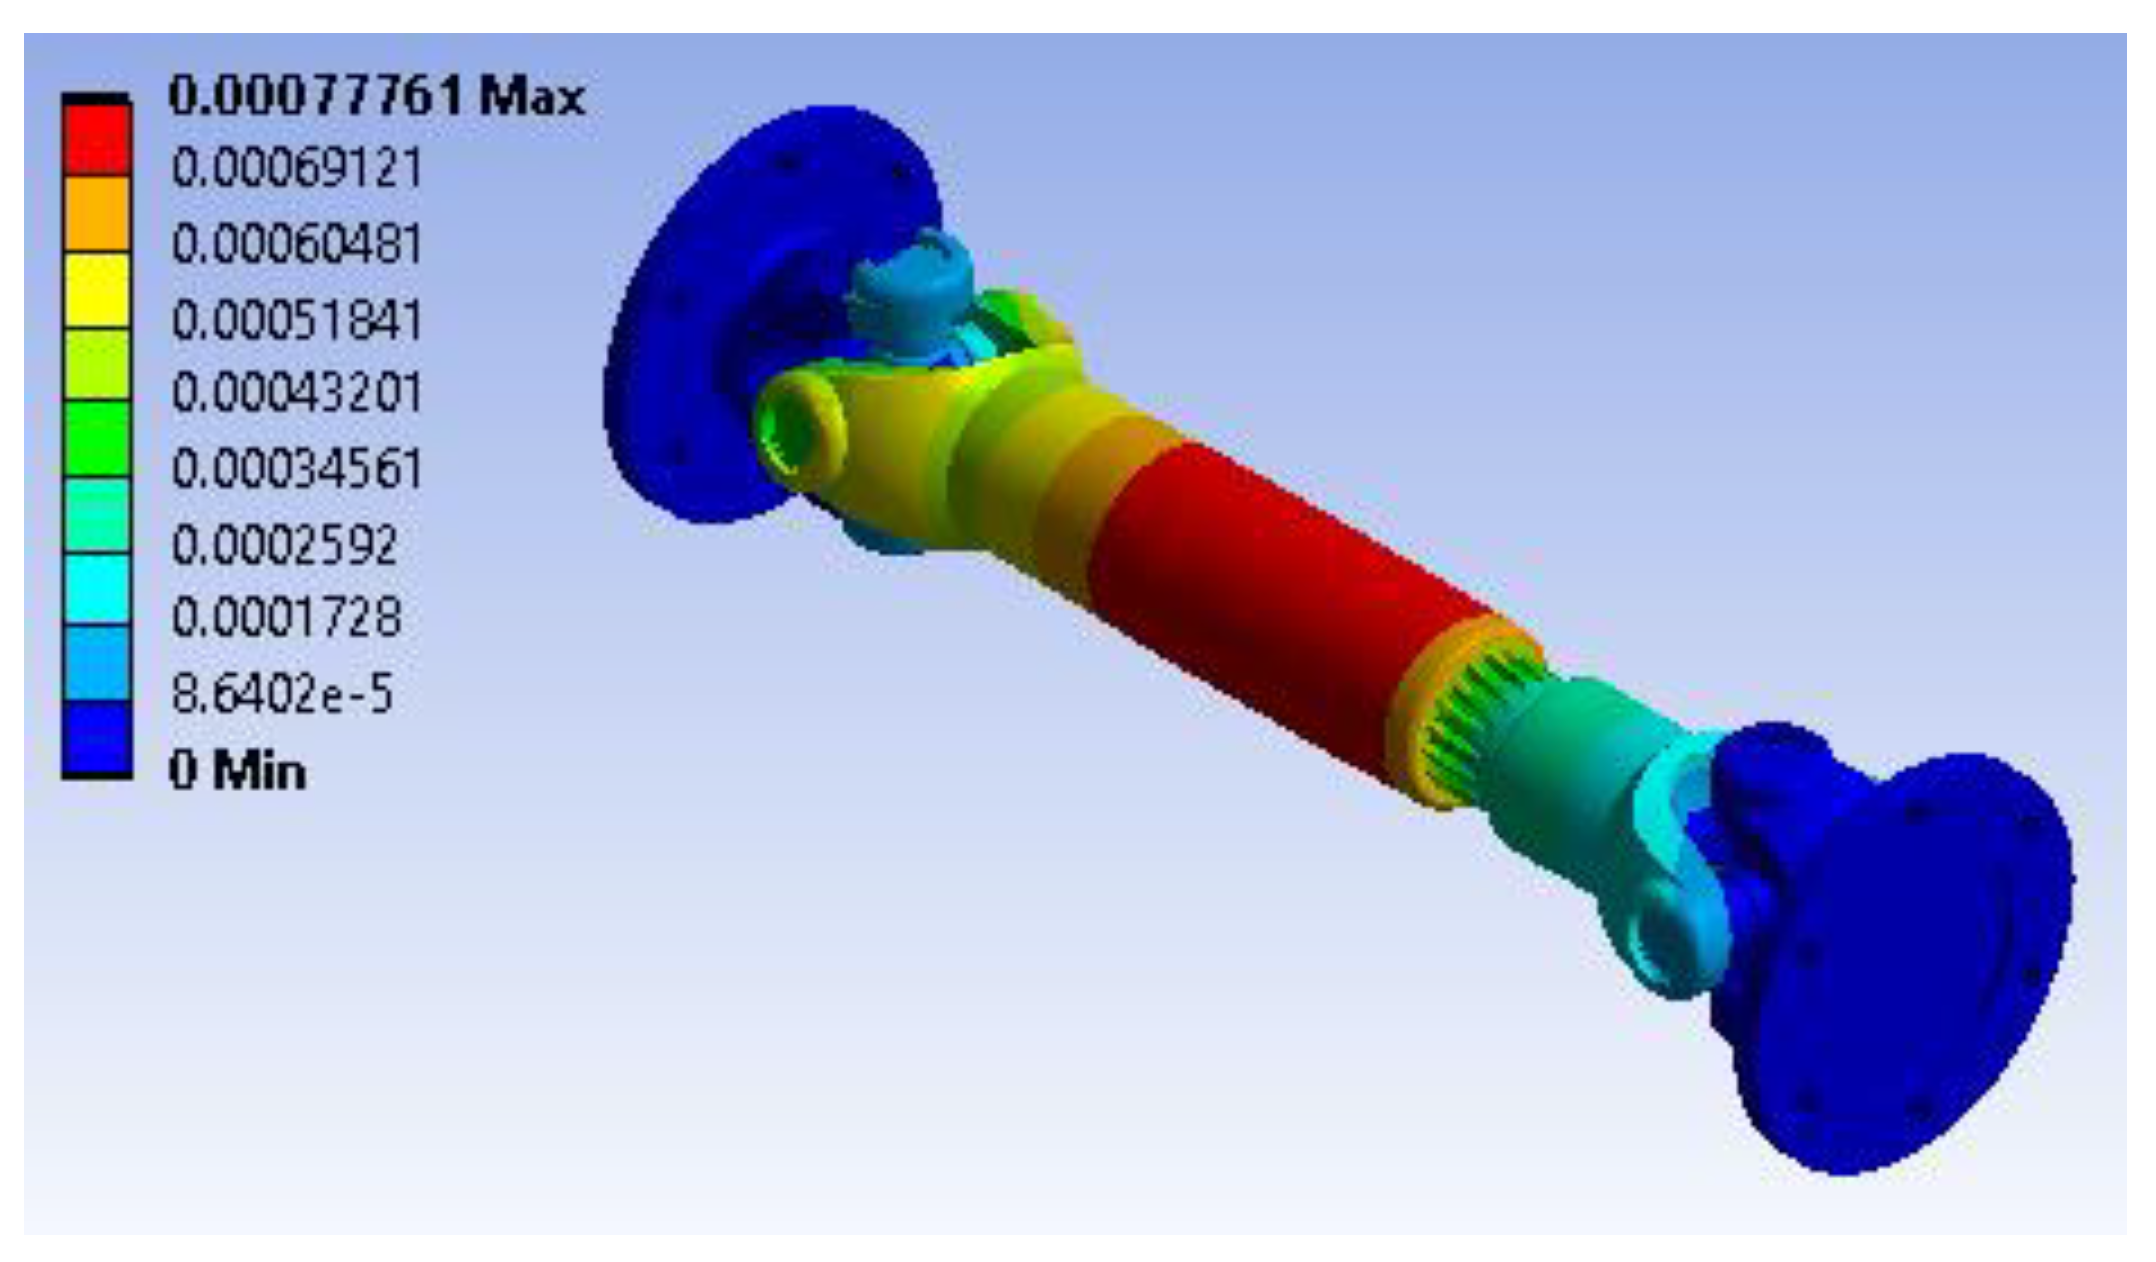
Figure 26.
Shear stress distribution (XY plane).
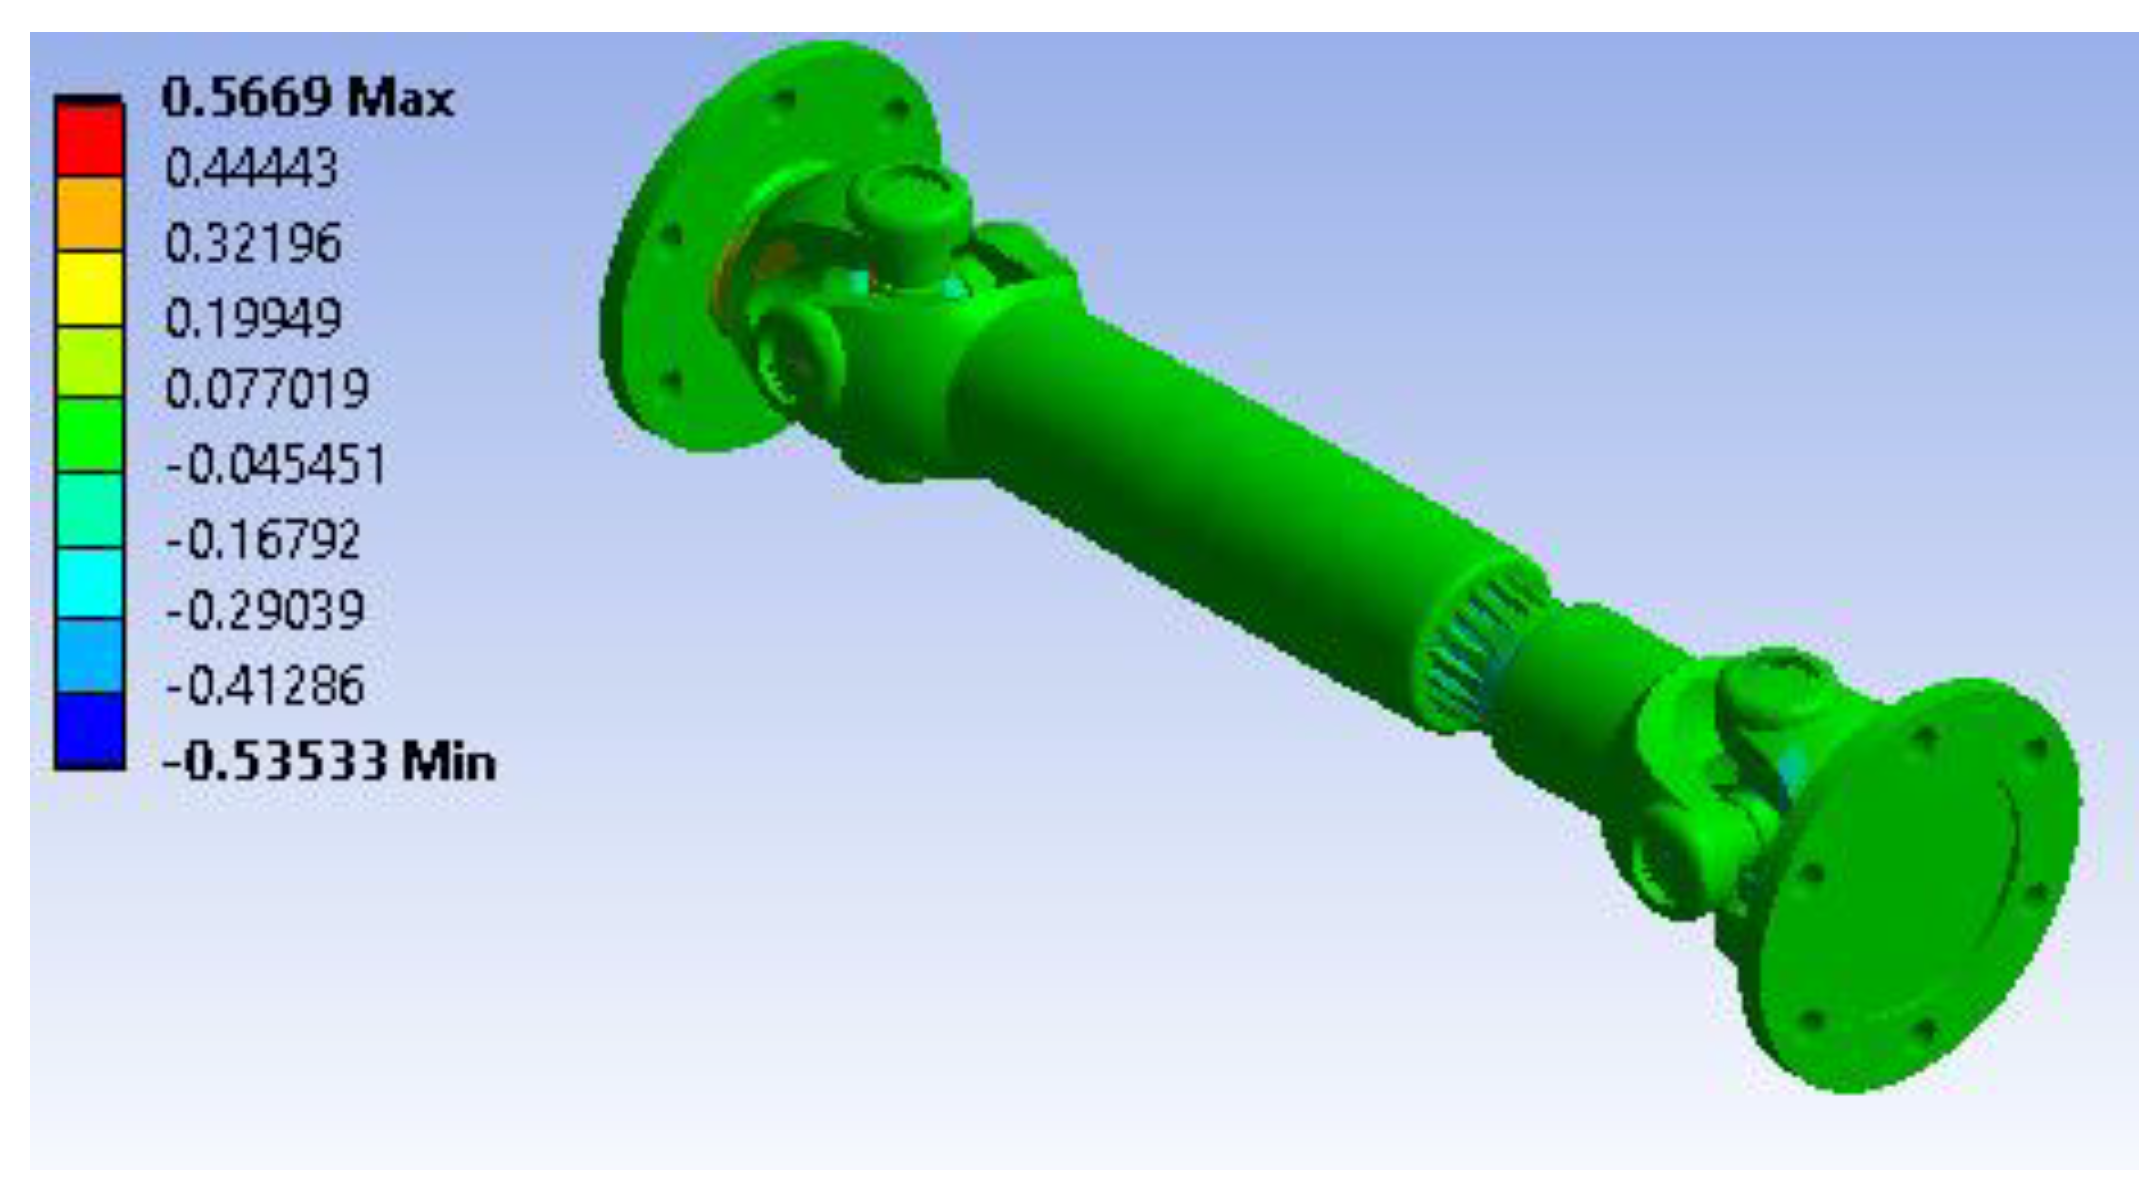
Figure 27.
Maximum principal stress variation.
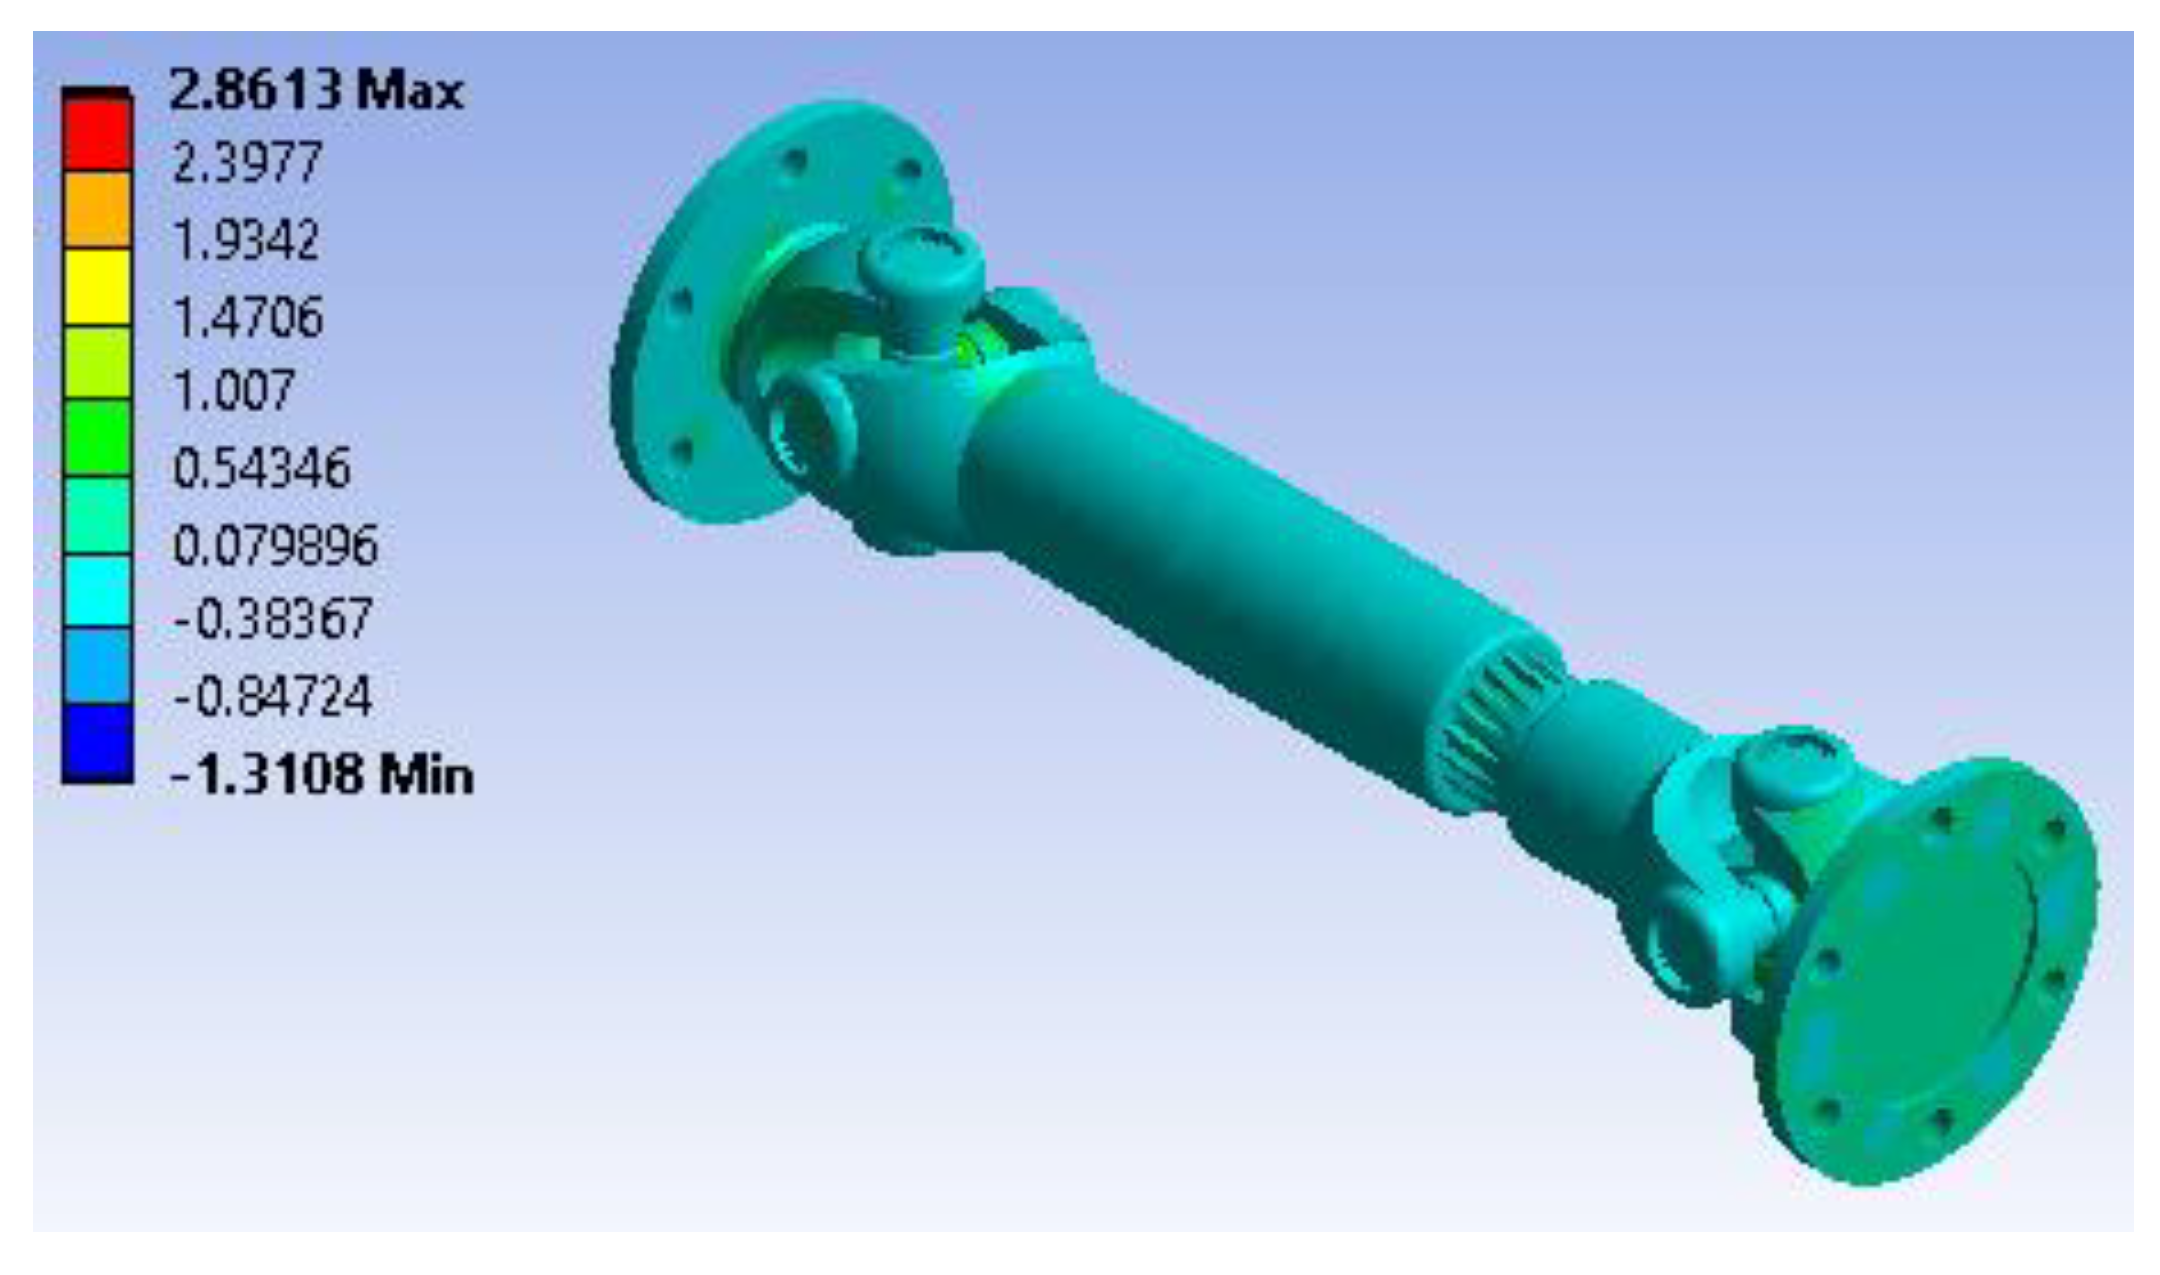
Figure 28.
Strain energy distribution.
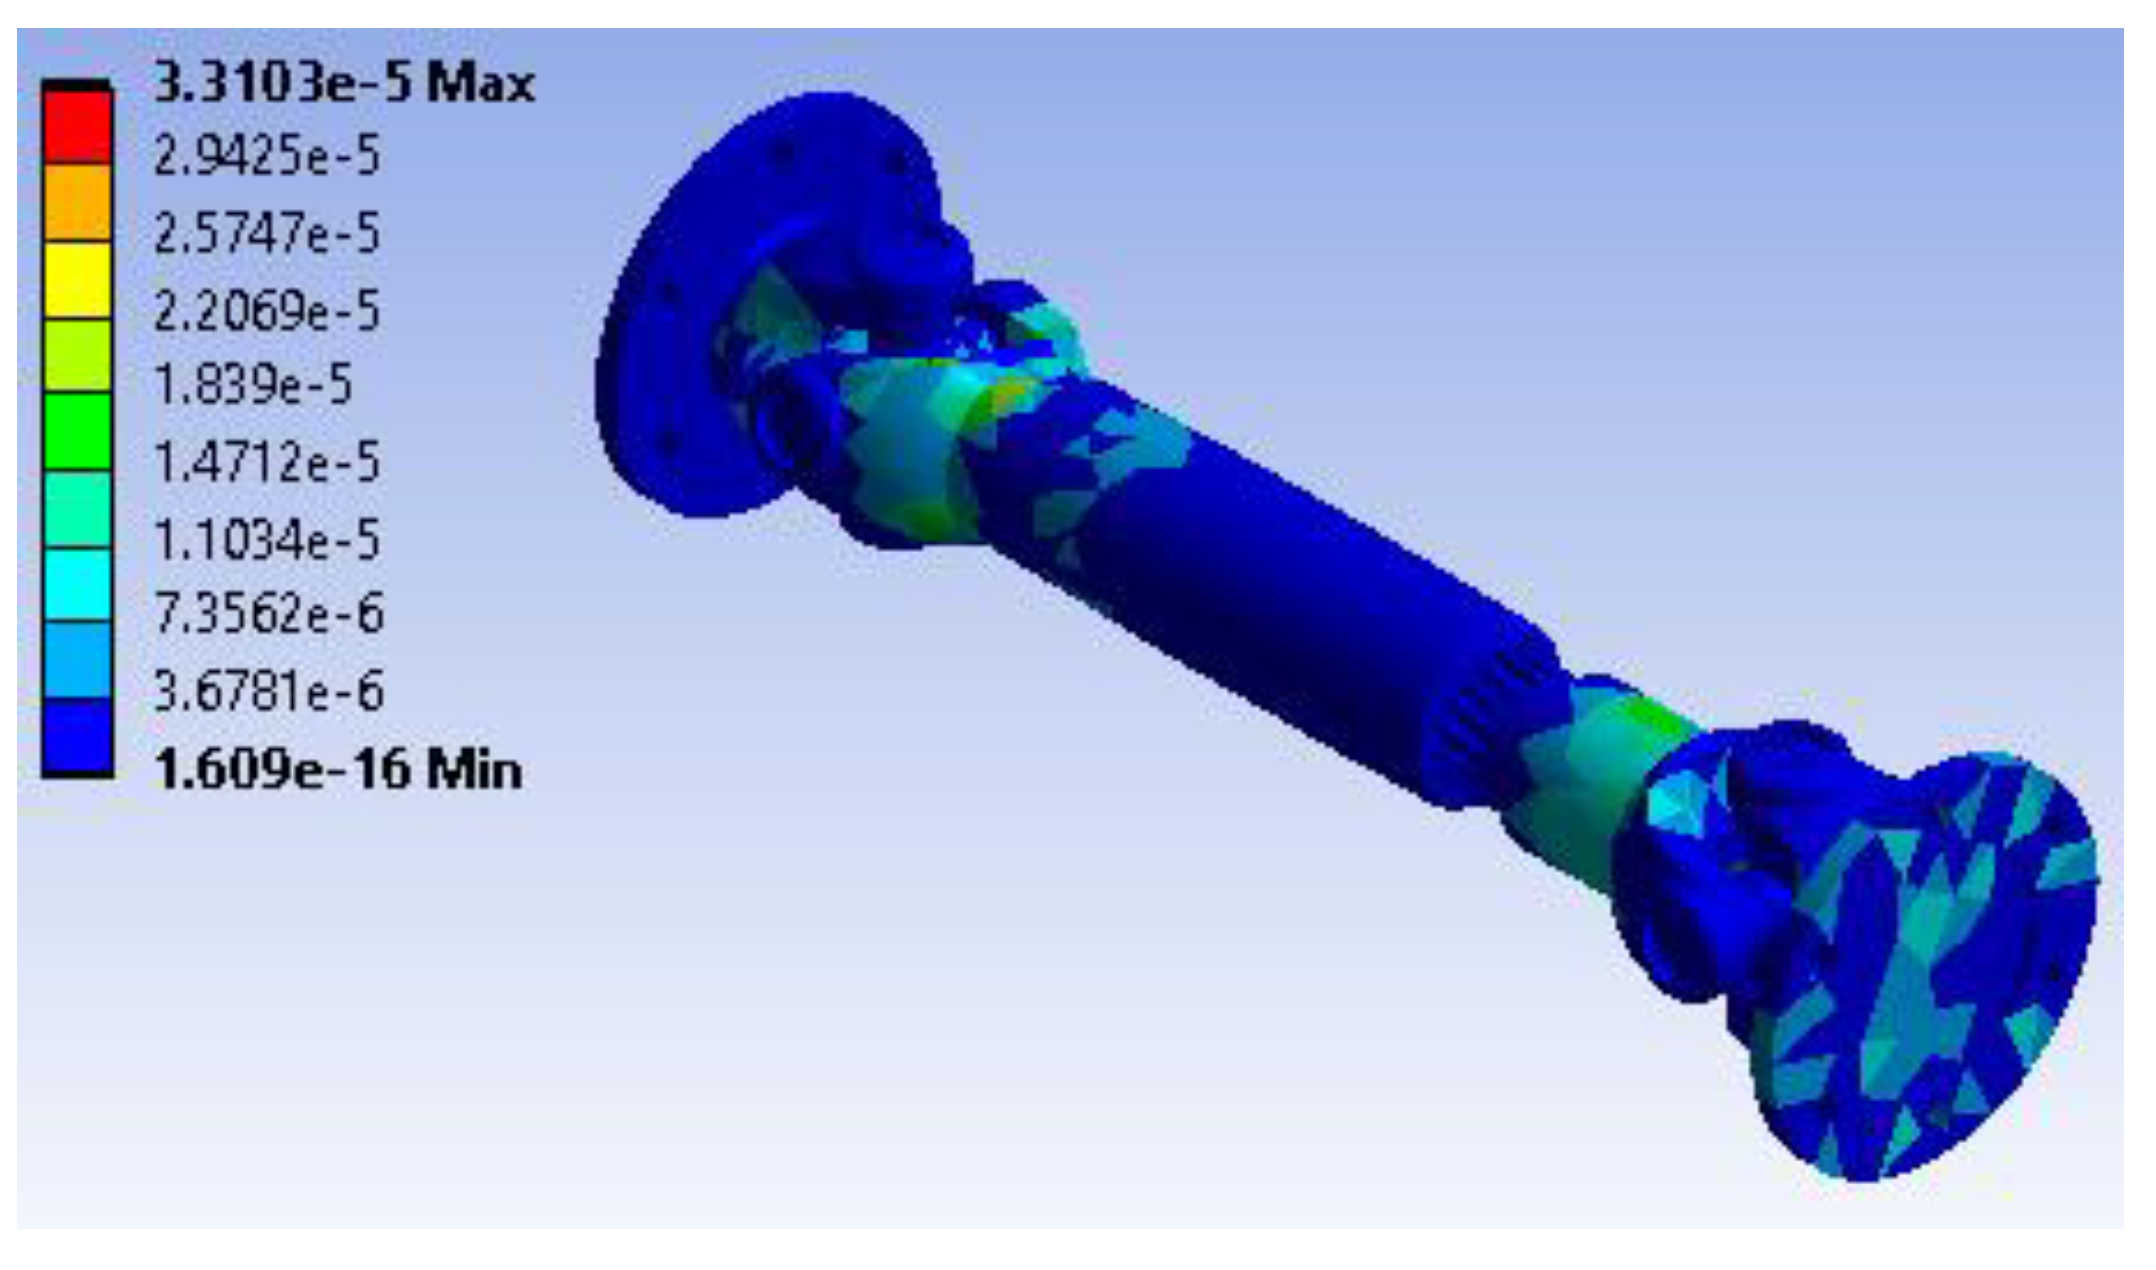
Figure 29.
Mode 1, F1 = 952.96 Hz.
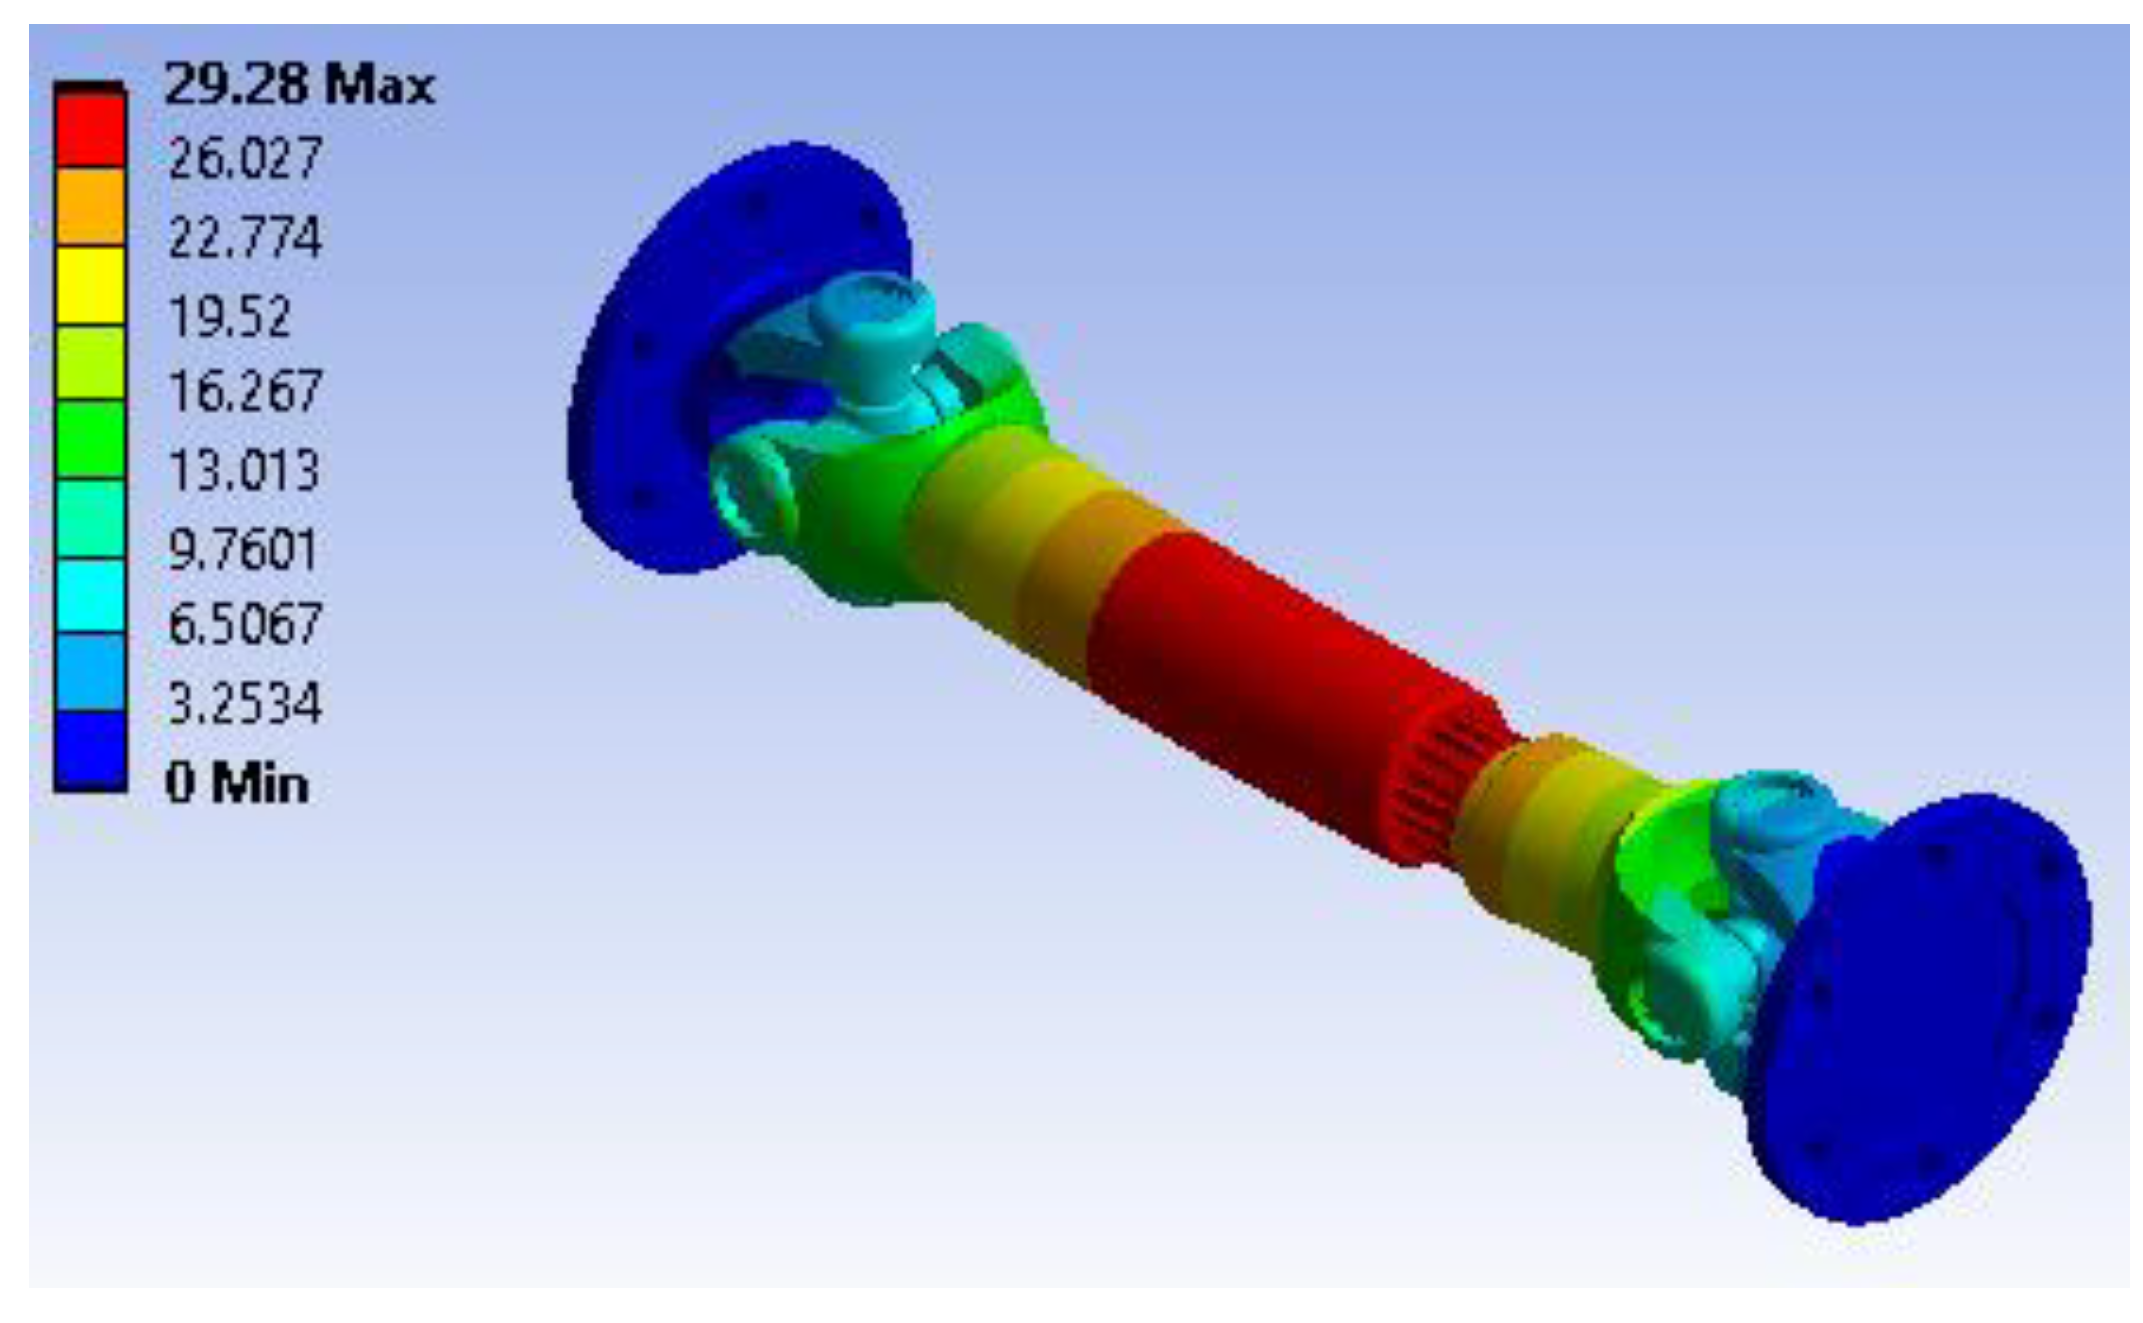
Figure 30.
Mode 6, F6 = 2618.7 Hz.
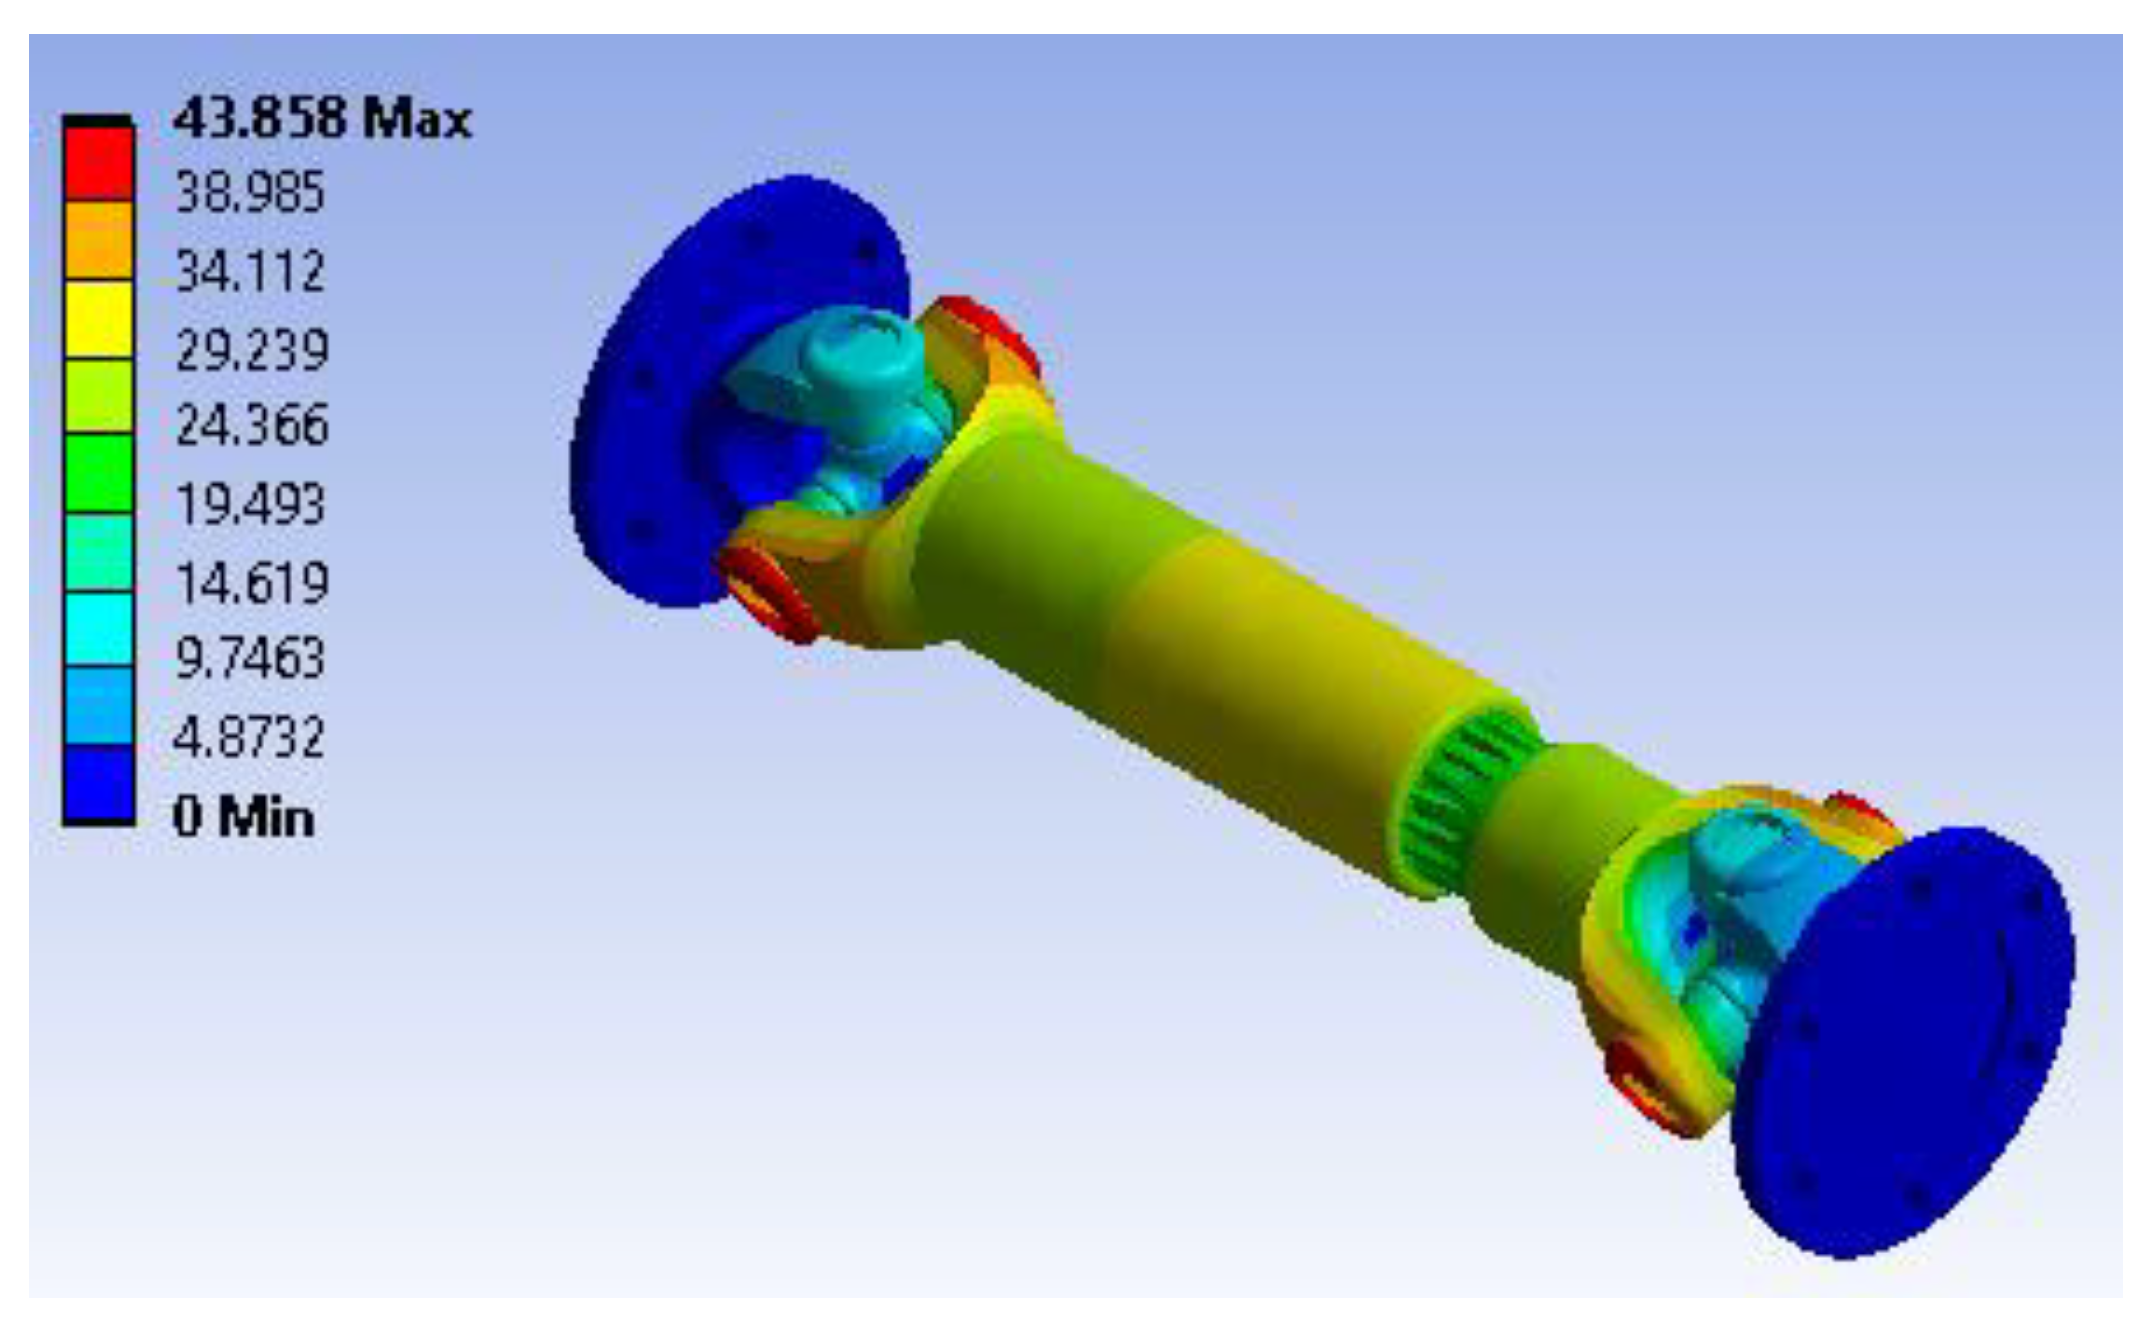
Figure 31.
Mode 12, F12 = 7405.3 Hz.
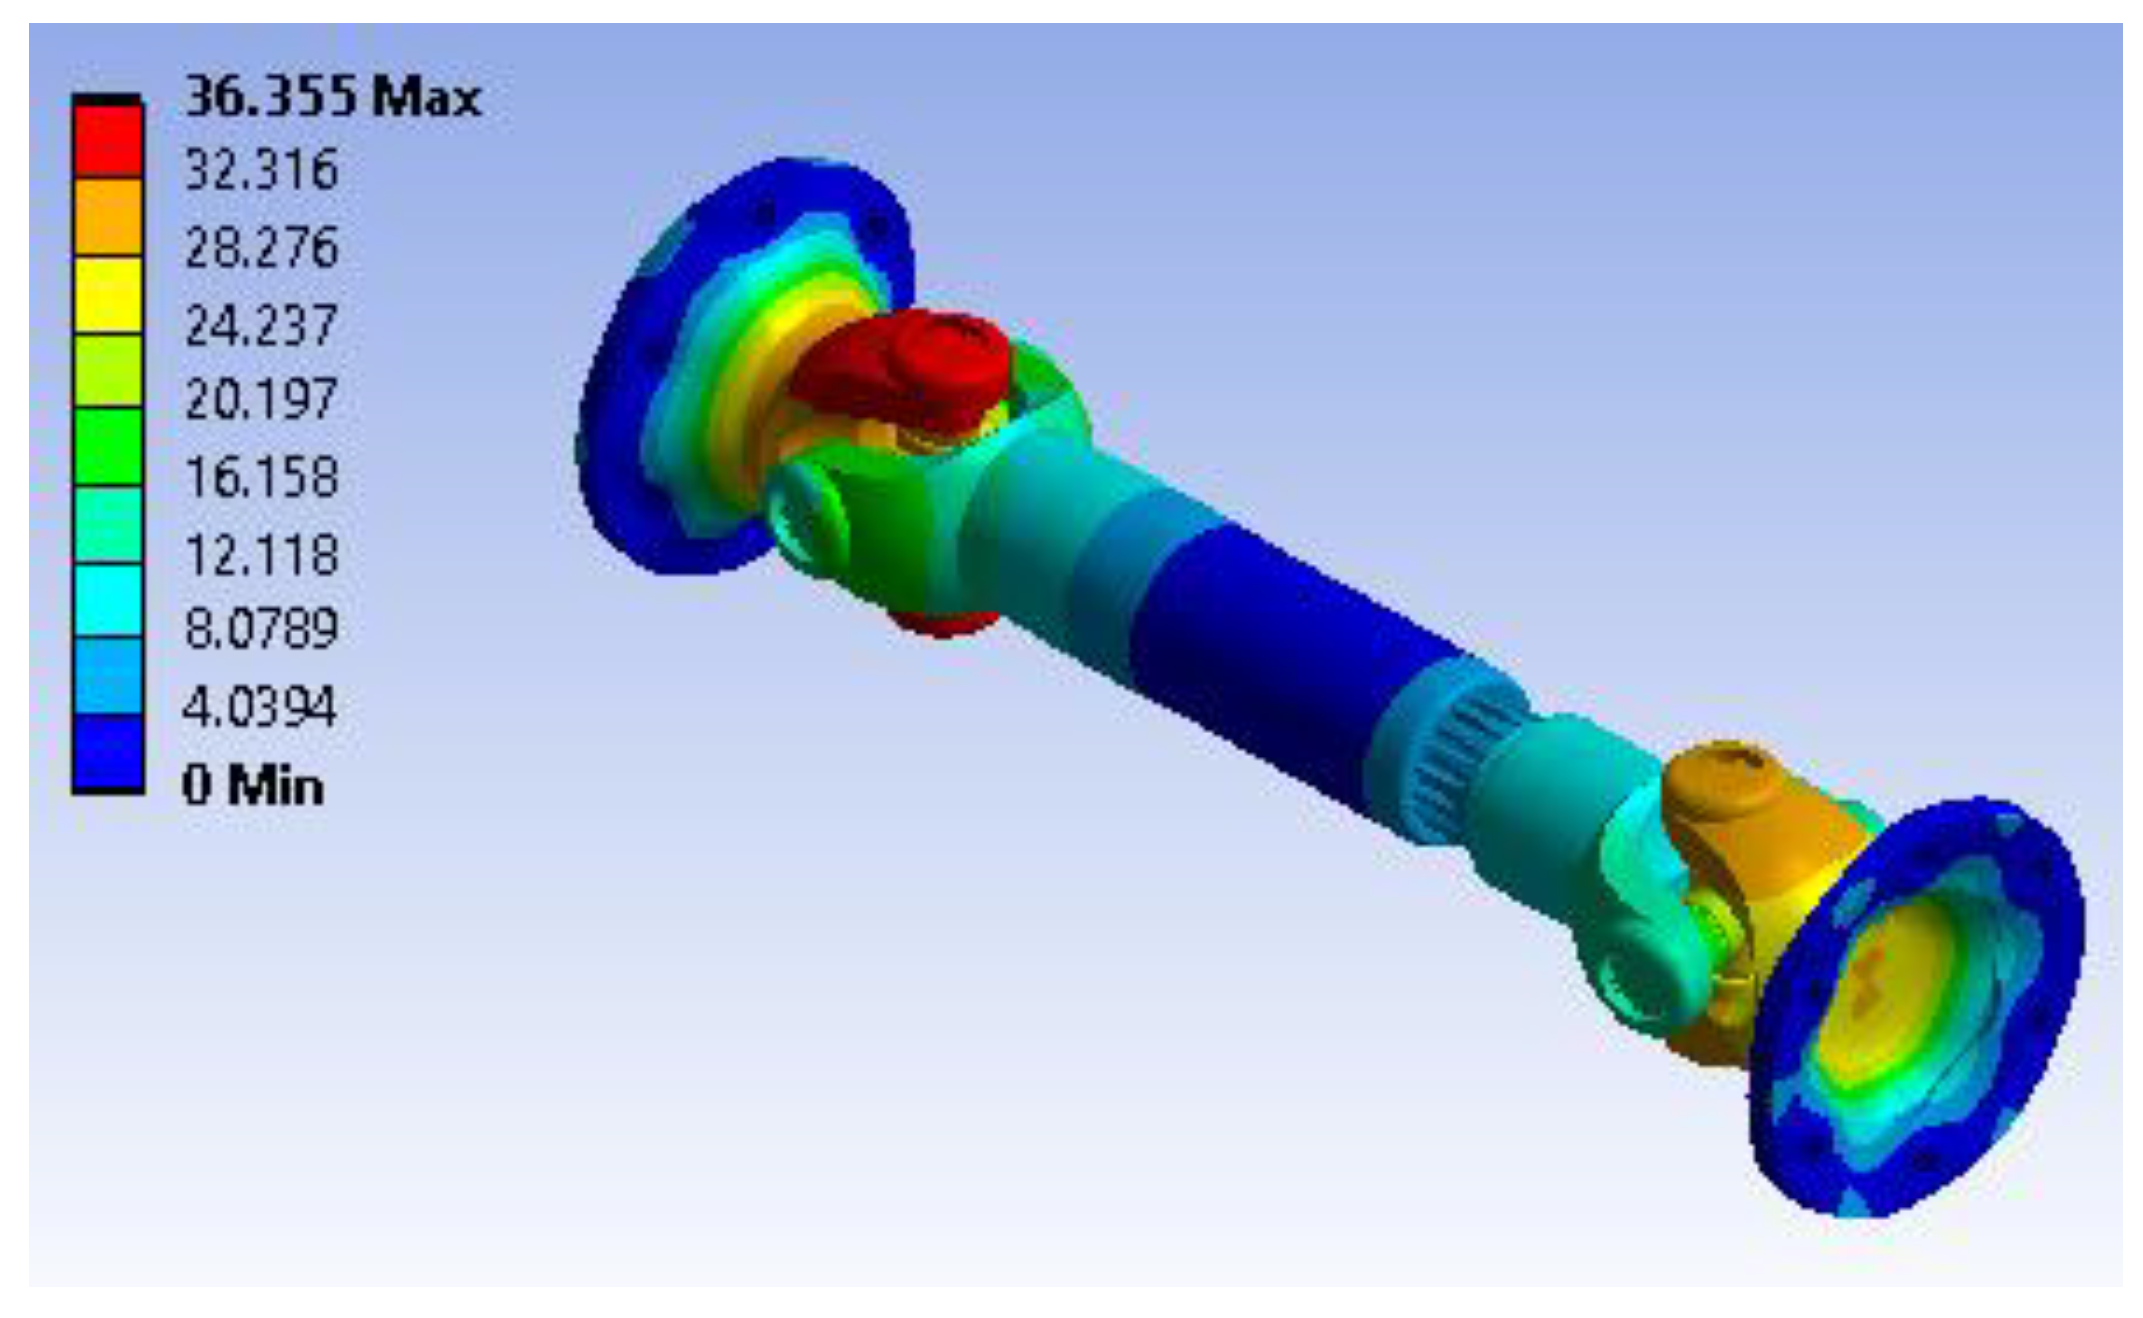
Figure 32.
Mode 16, F16 = 8802.3 Hz.
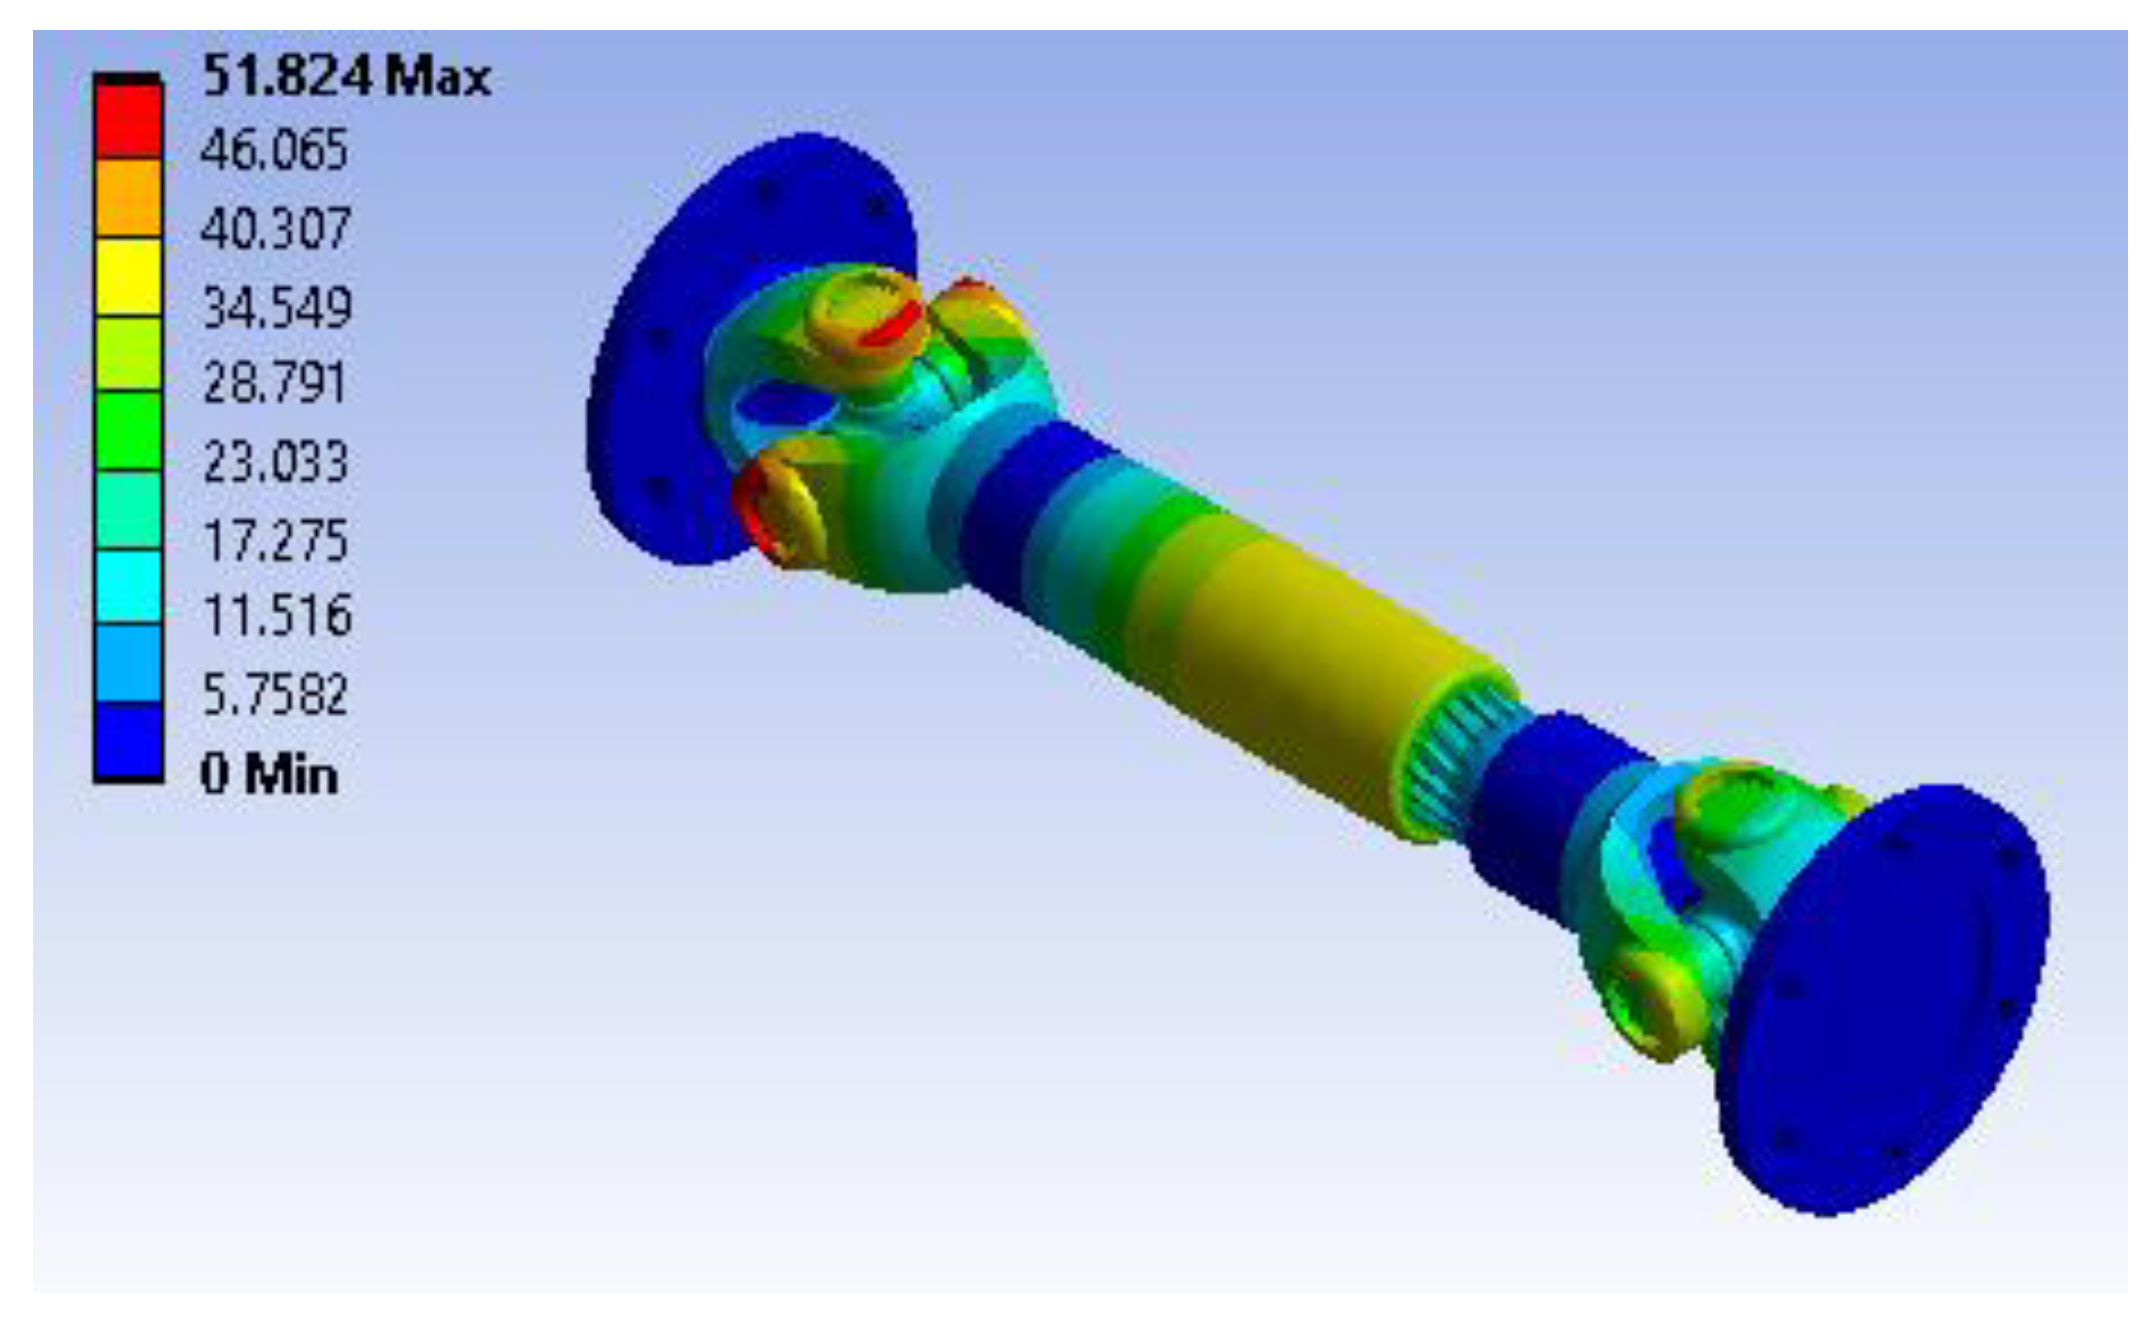
Figure 33.
Mode 1, F1 = 997.52 Hz.
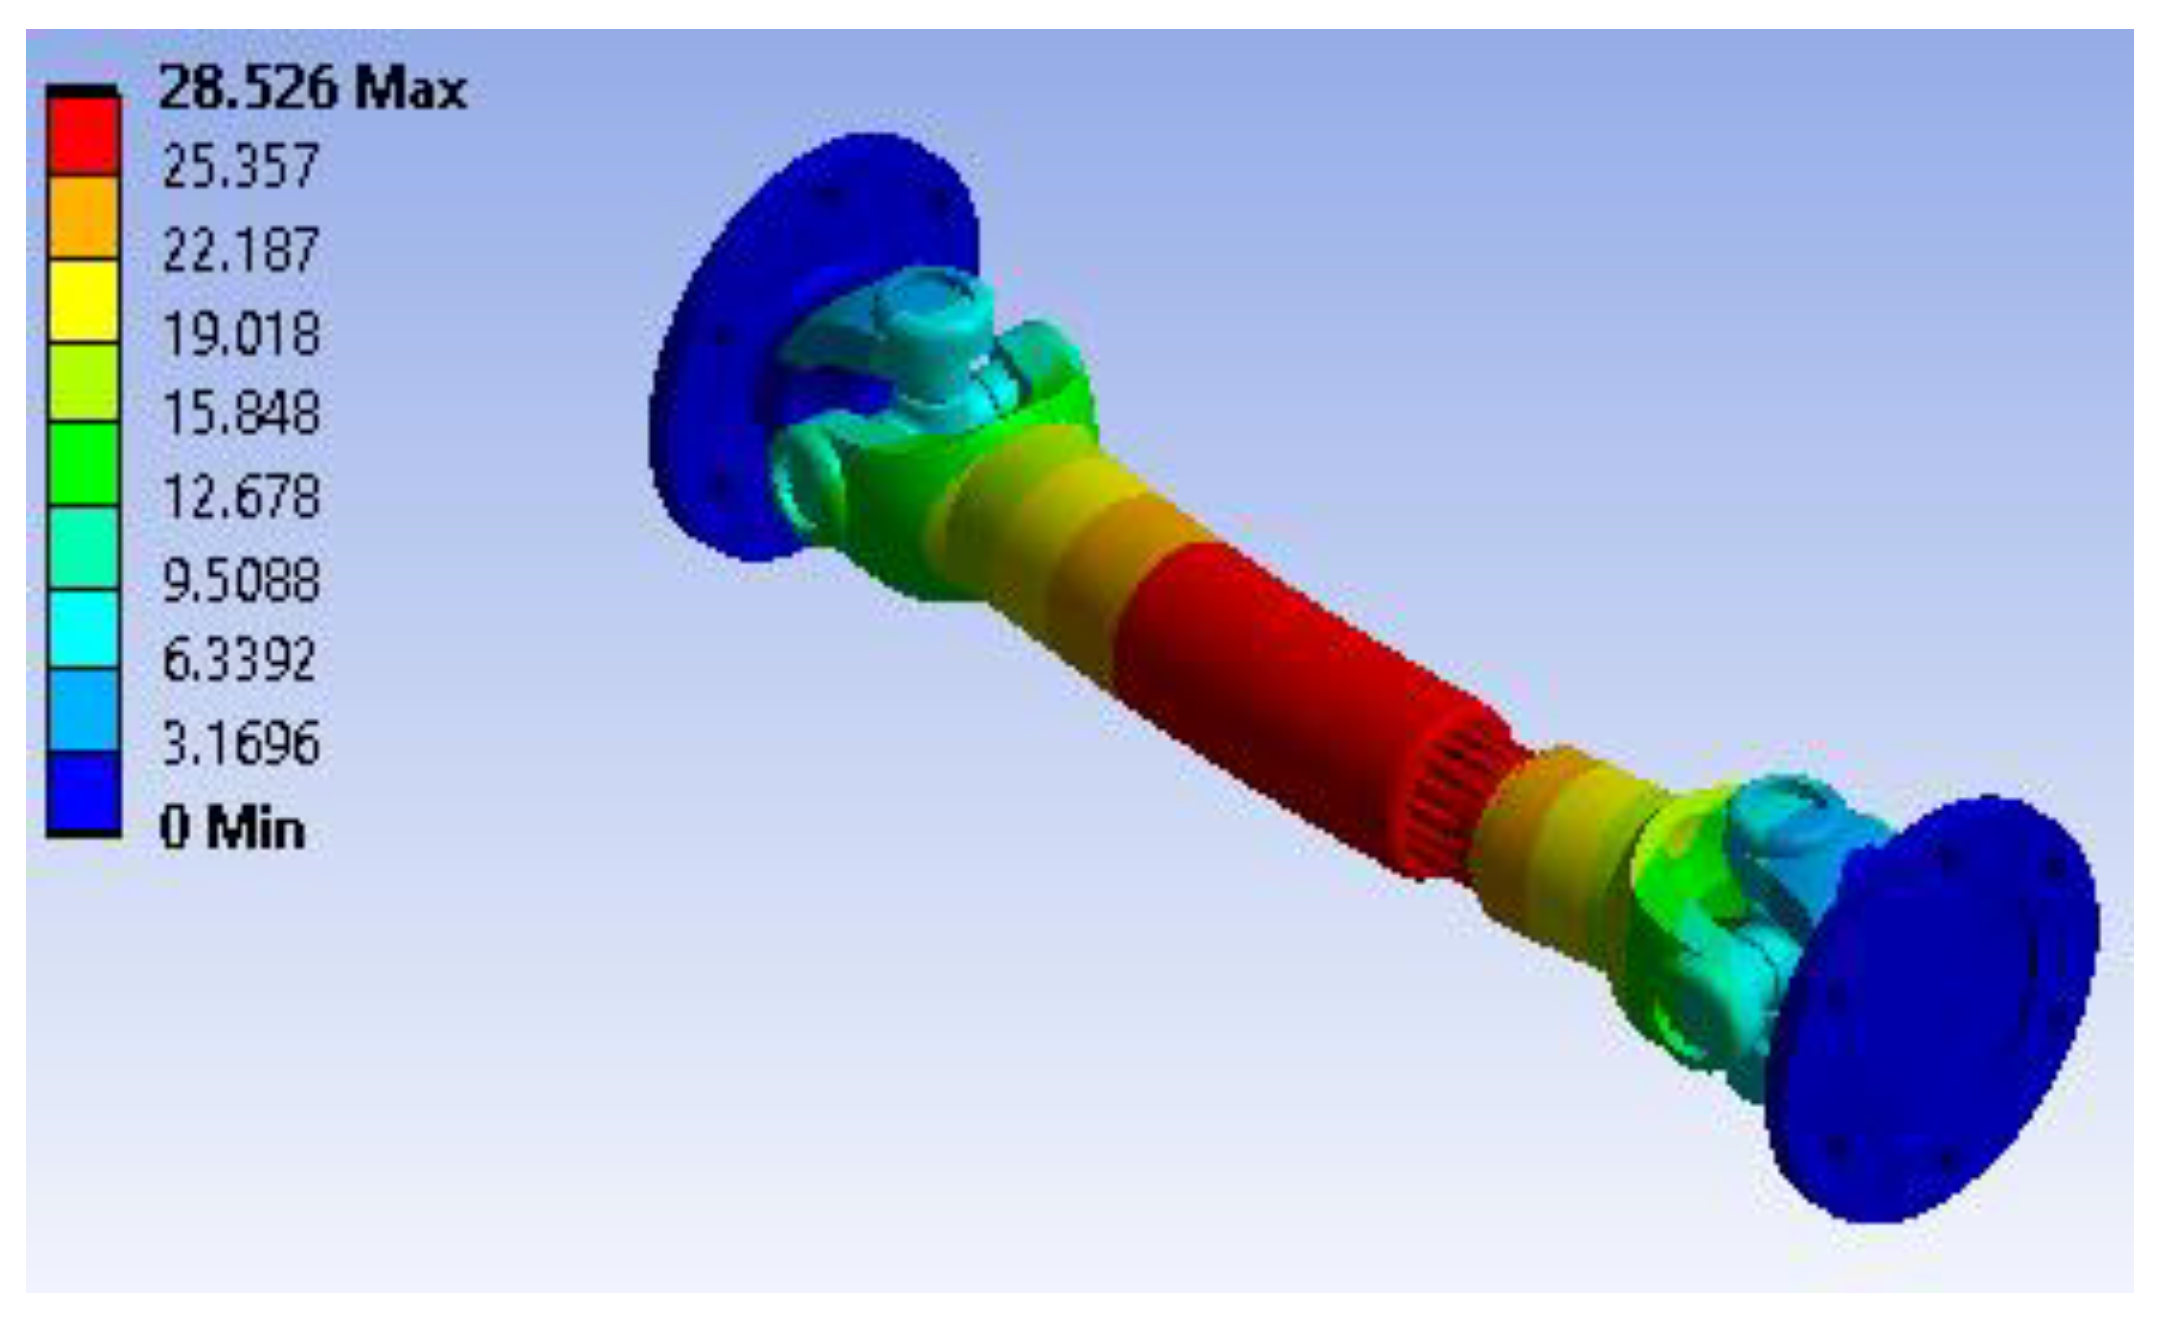
Figure 34.
Mode 6, F6 = 2598.3 Hz.
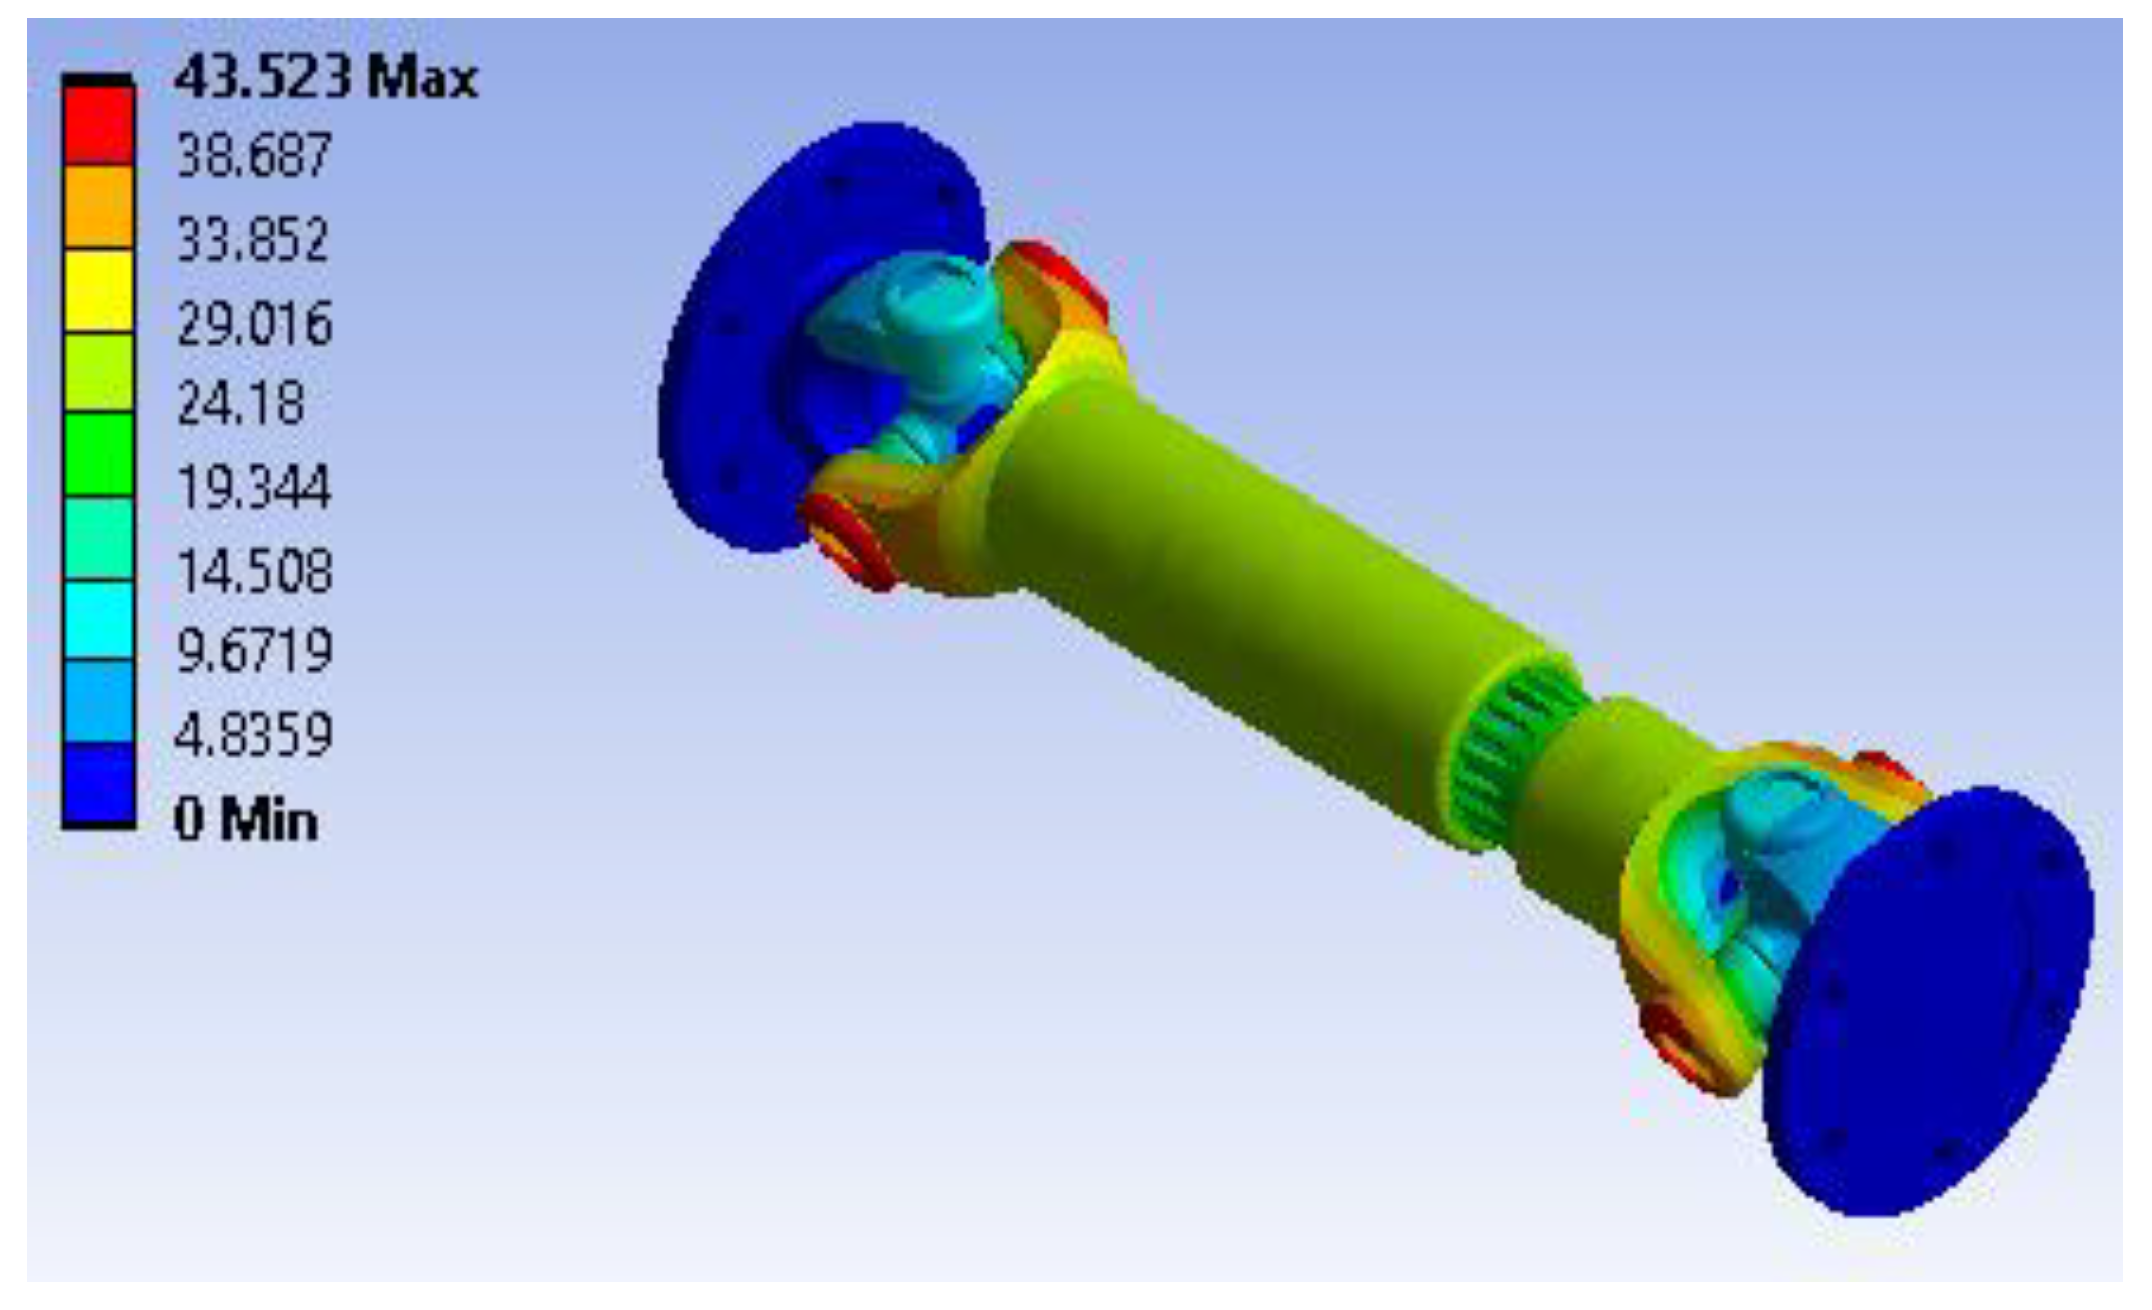
Figure 35.
Mode 12, F12 = 7565.7 Hz.
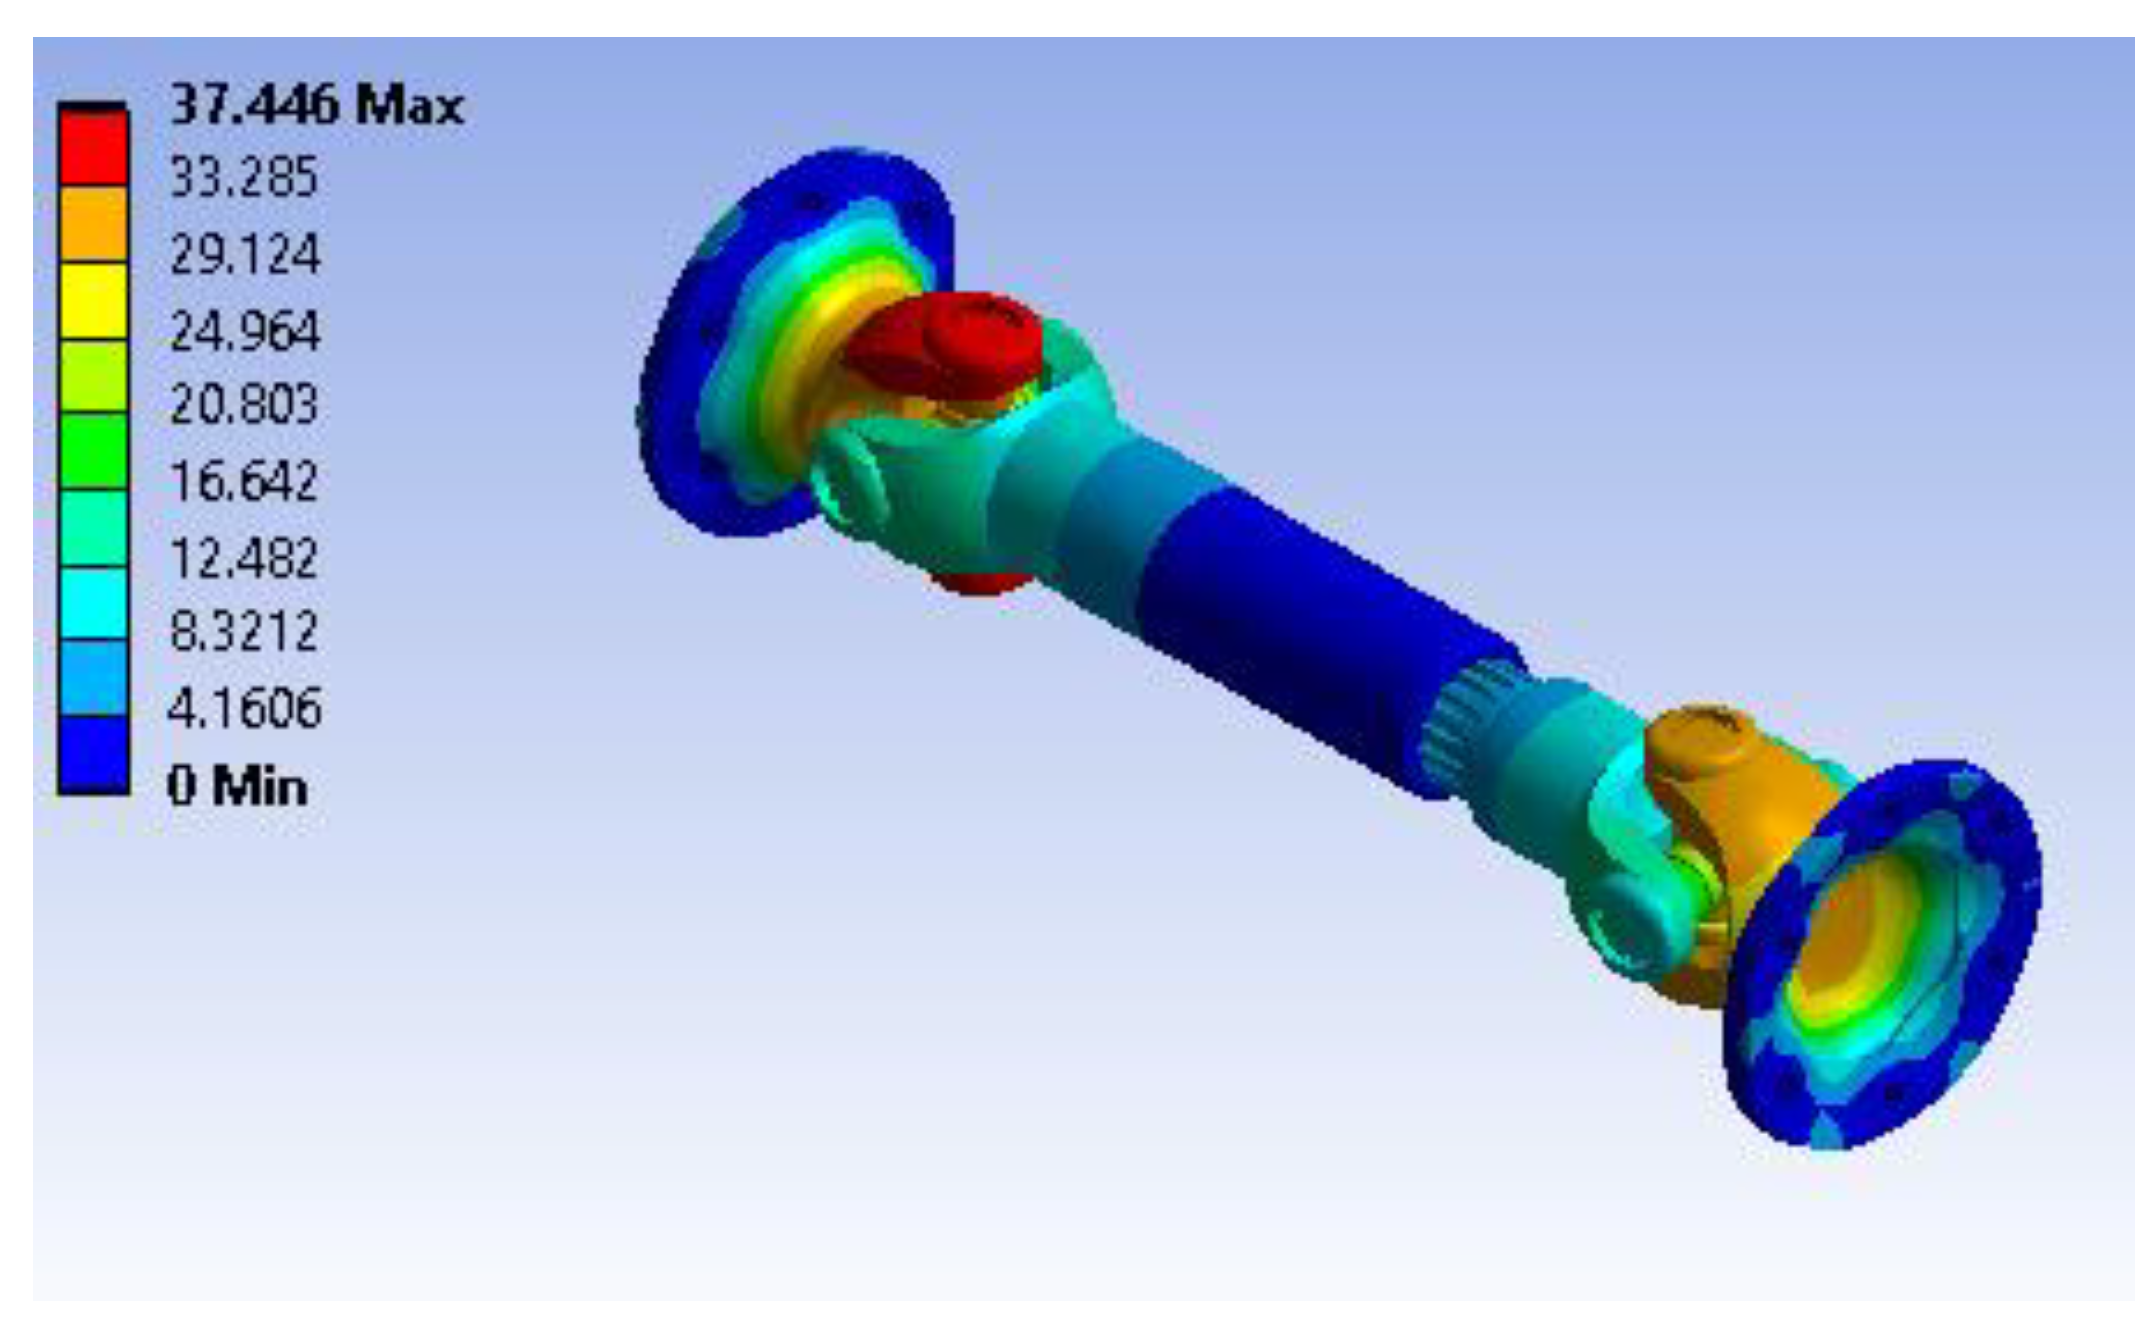
Figure 36.
Mode 16, F16 = 9140.2 Hz.
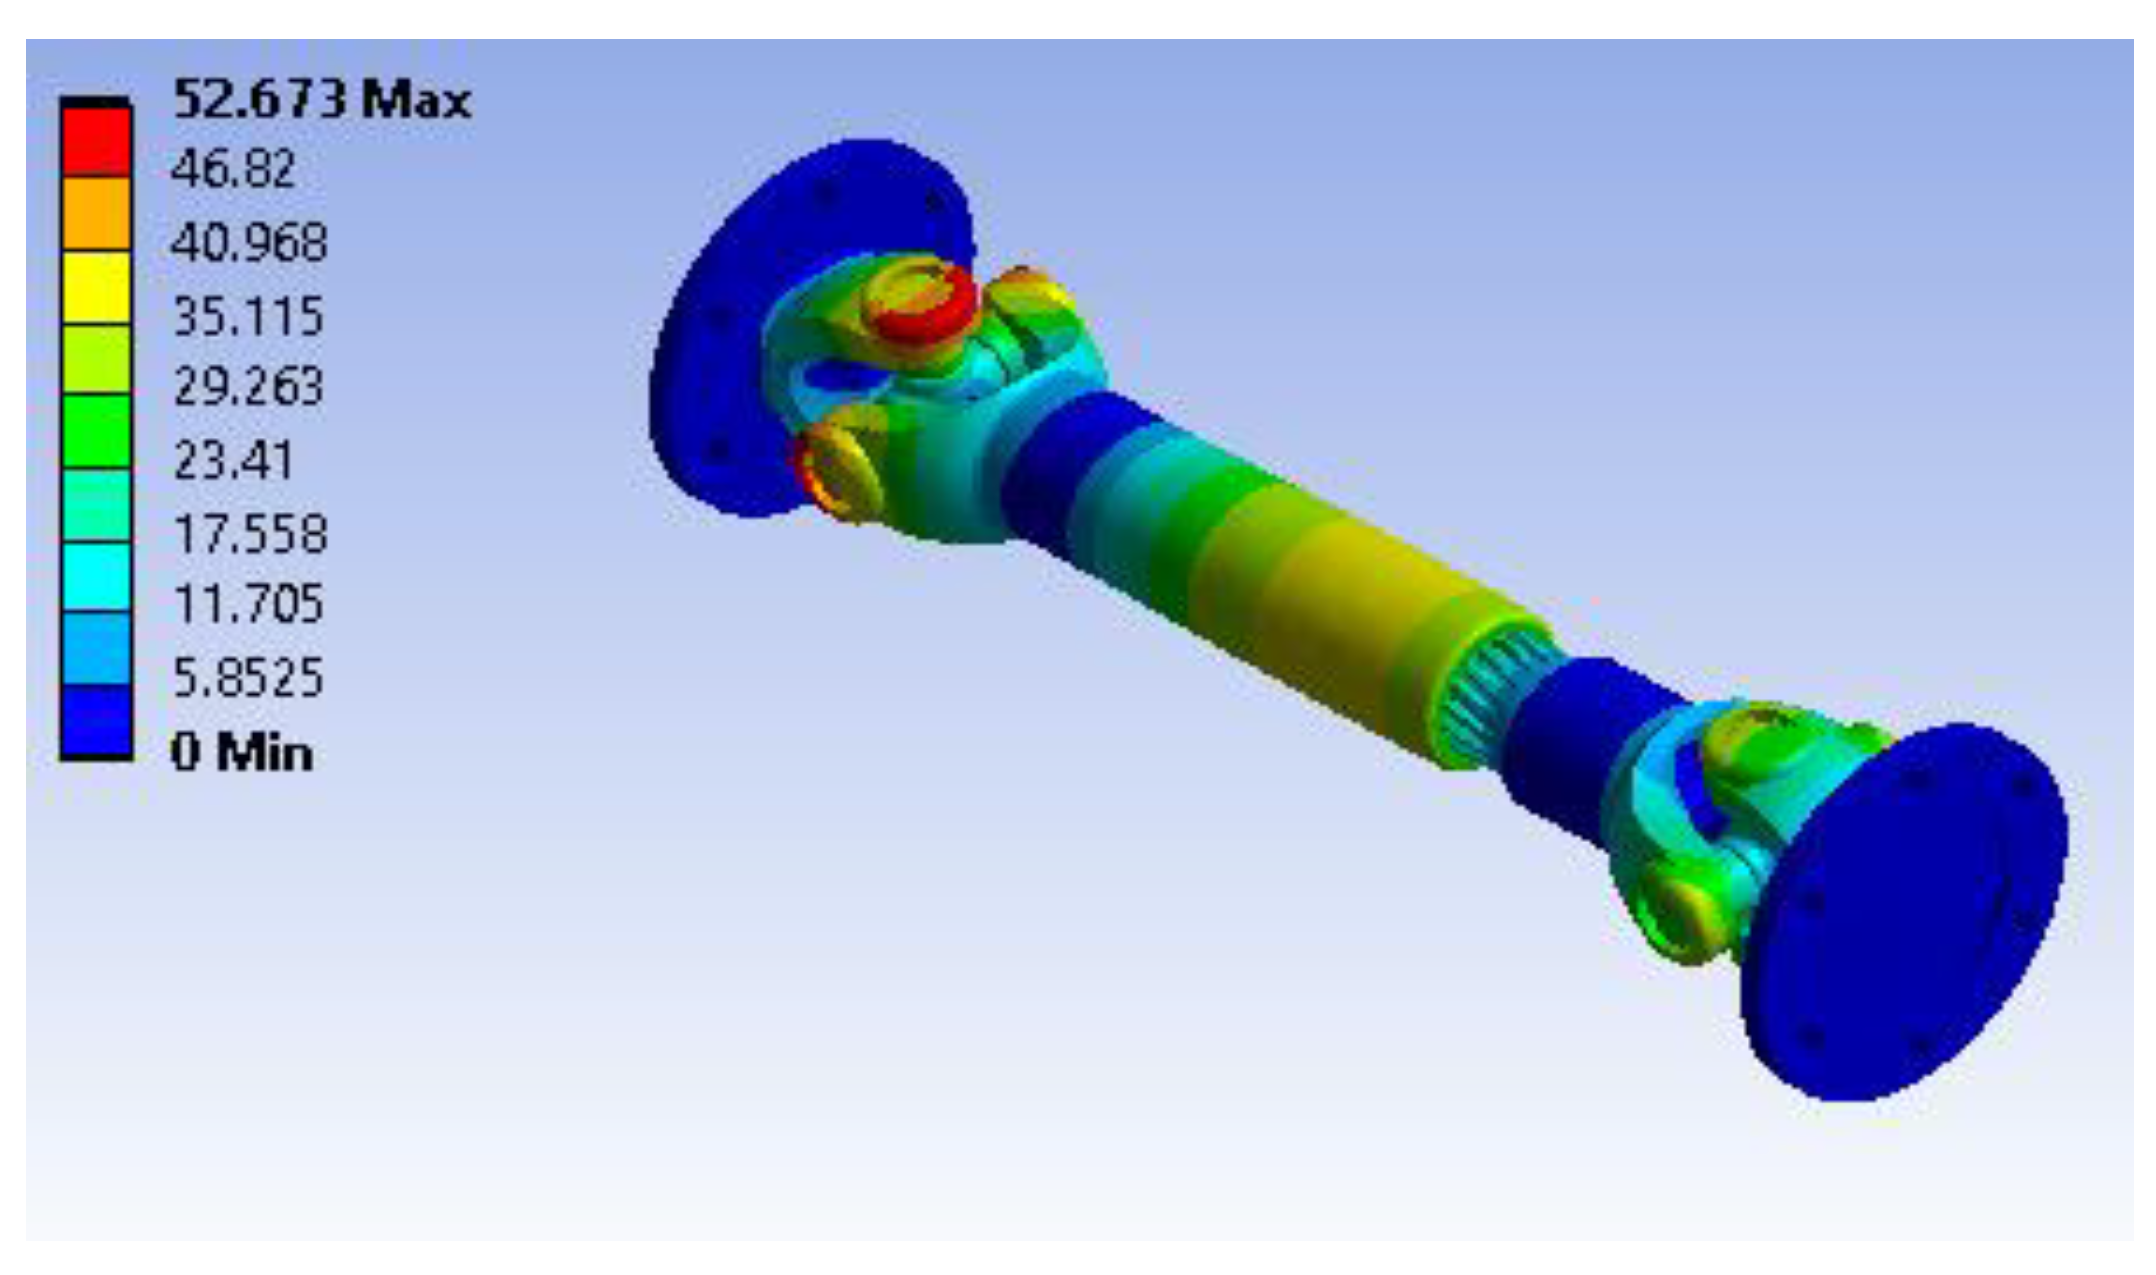
Figure 37.
Mode 1, F1 = 947.36 Hz.
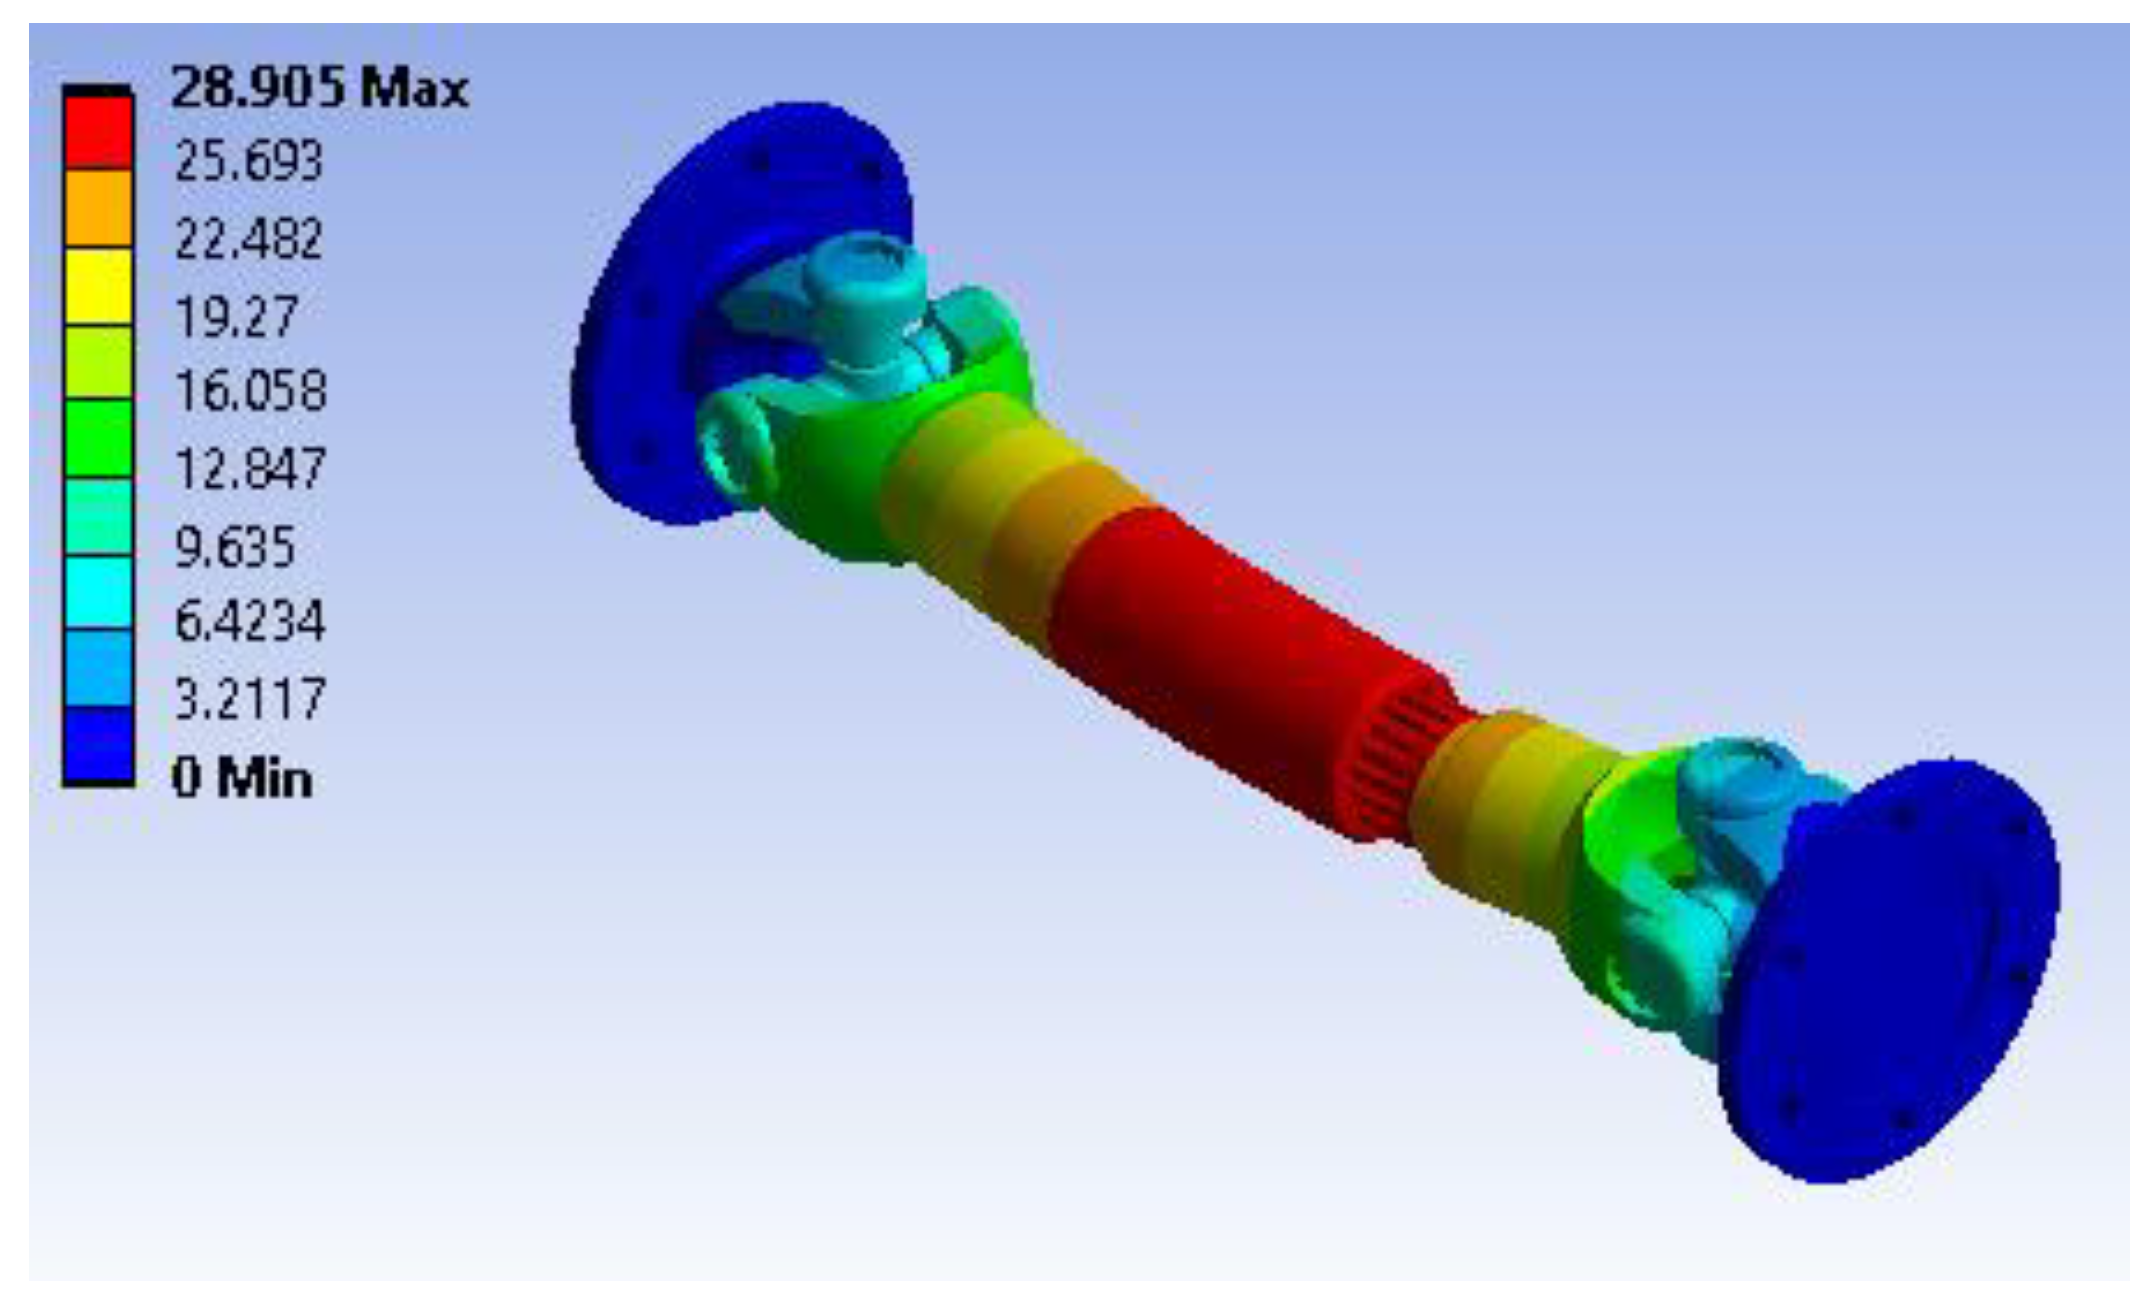
Figure 38.
Mode 6, F6 = 2581.7 Hz.
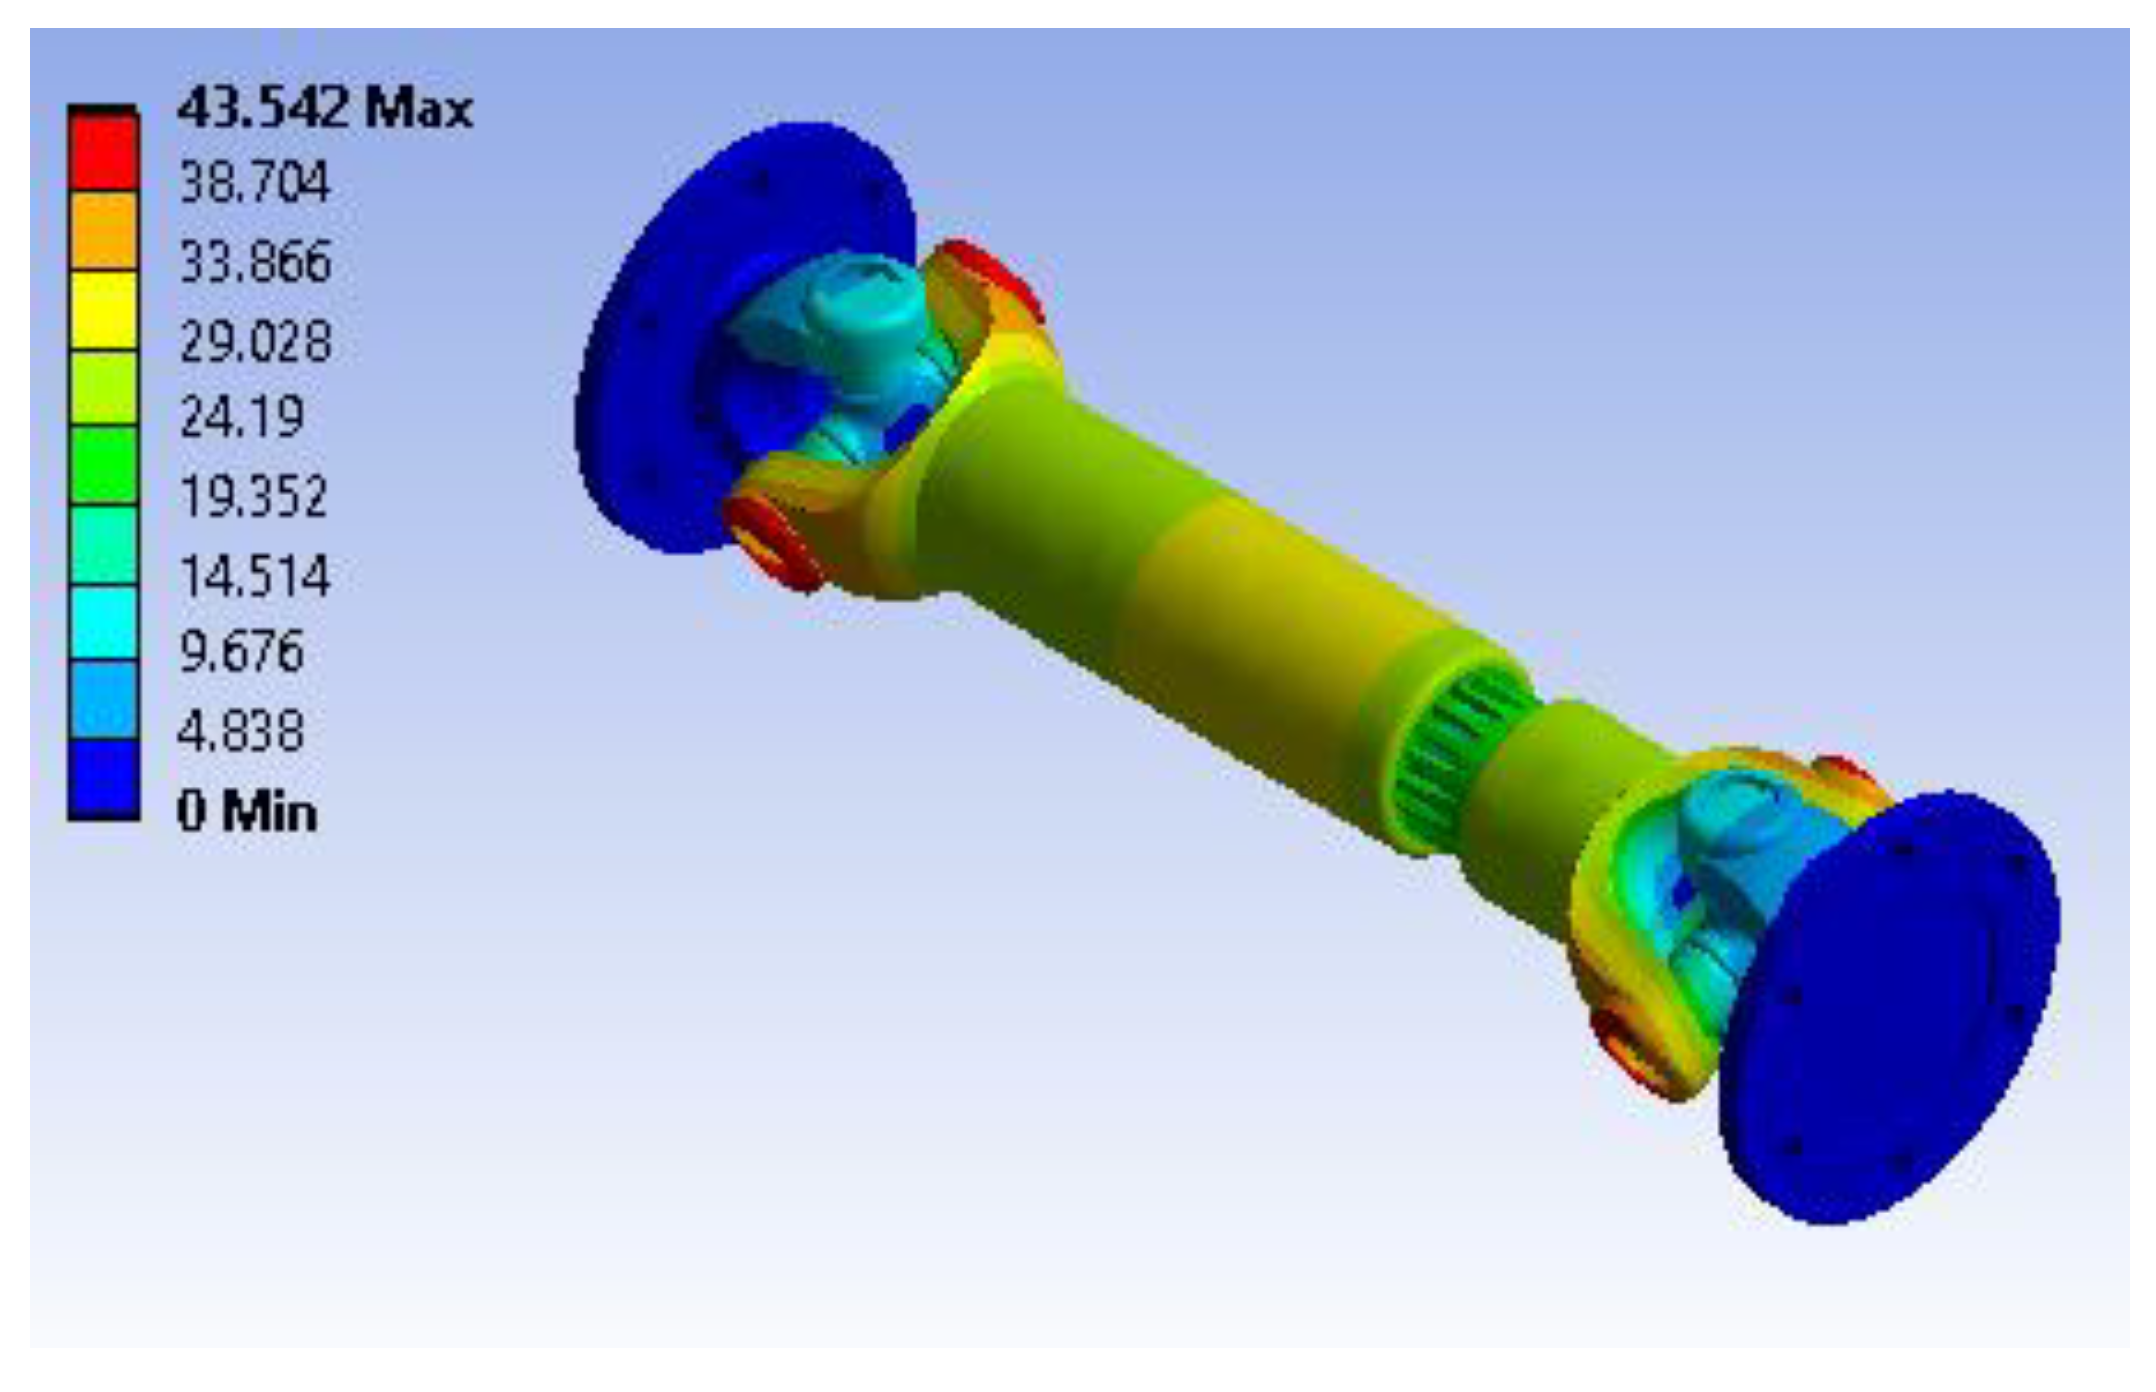
Figure 39.
Mode 12, F12 = 7416.8 Hz.
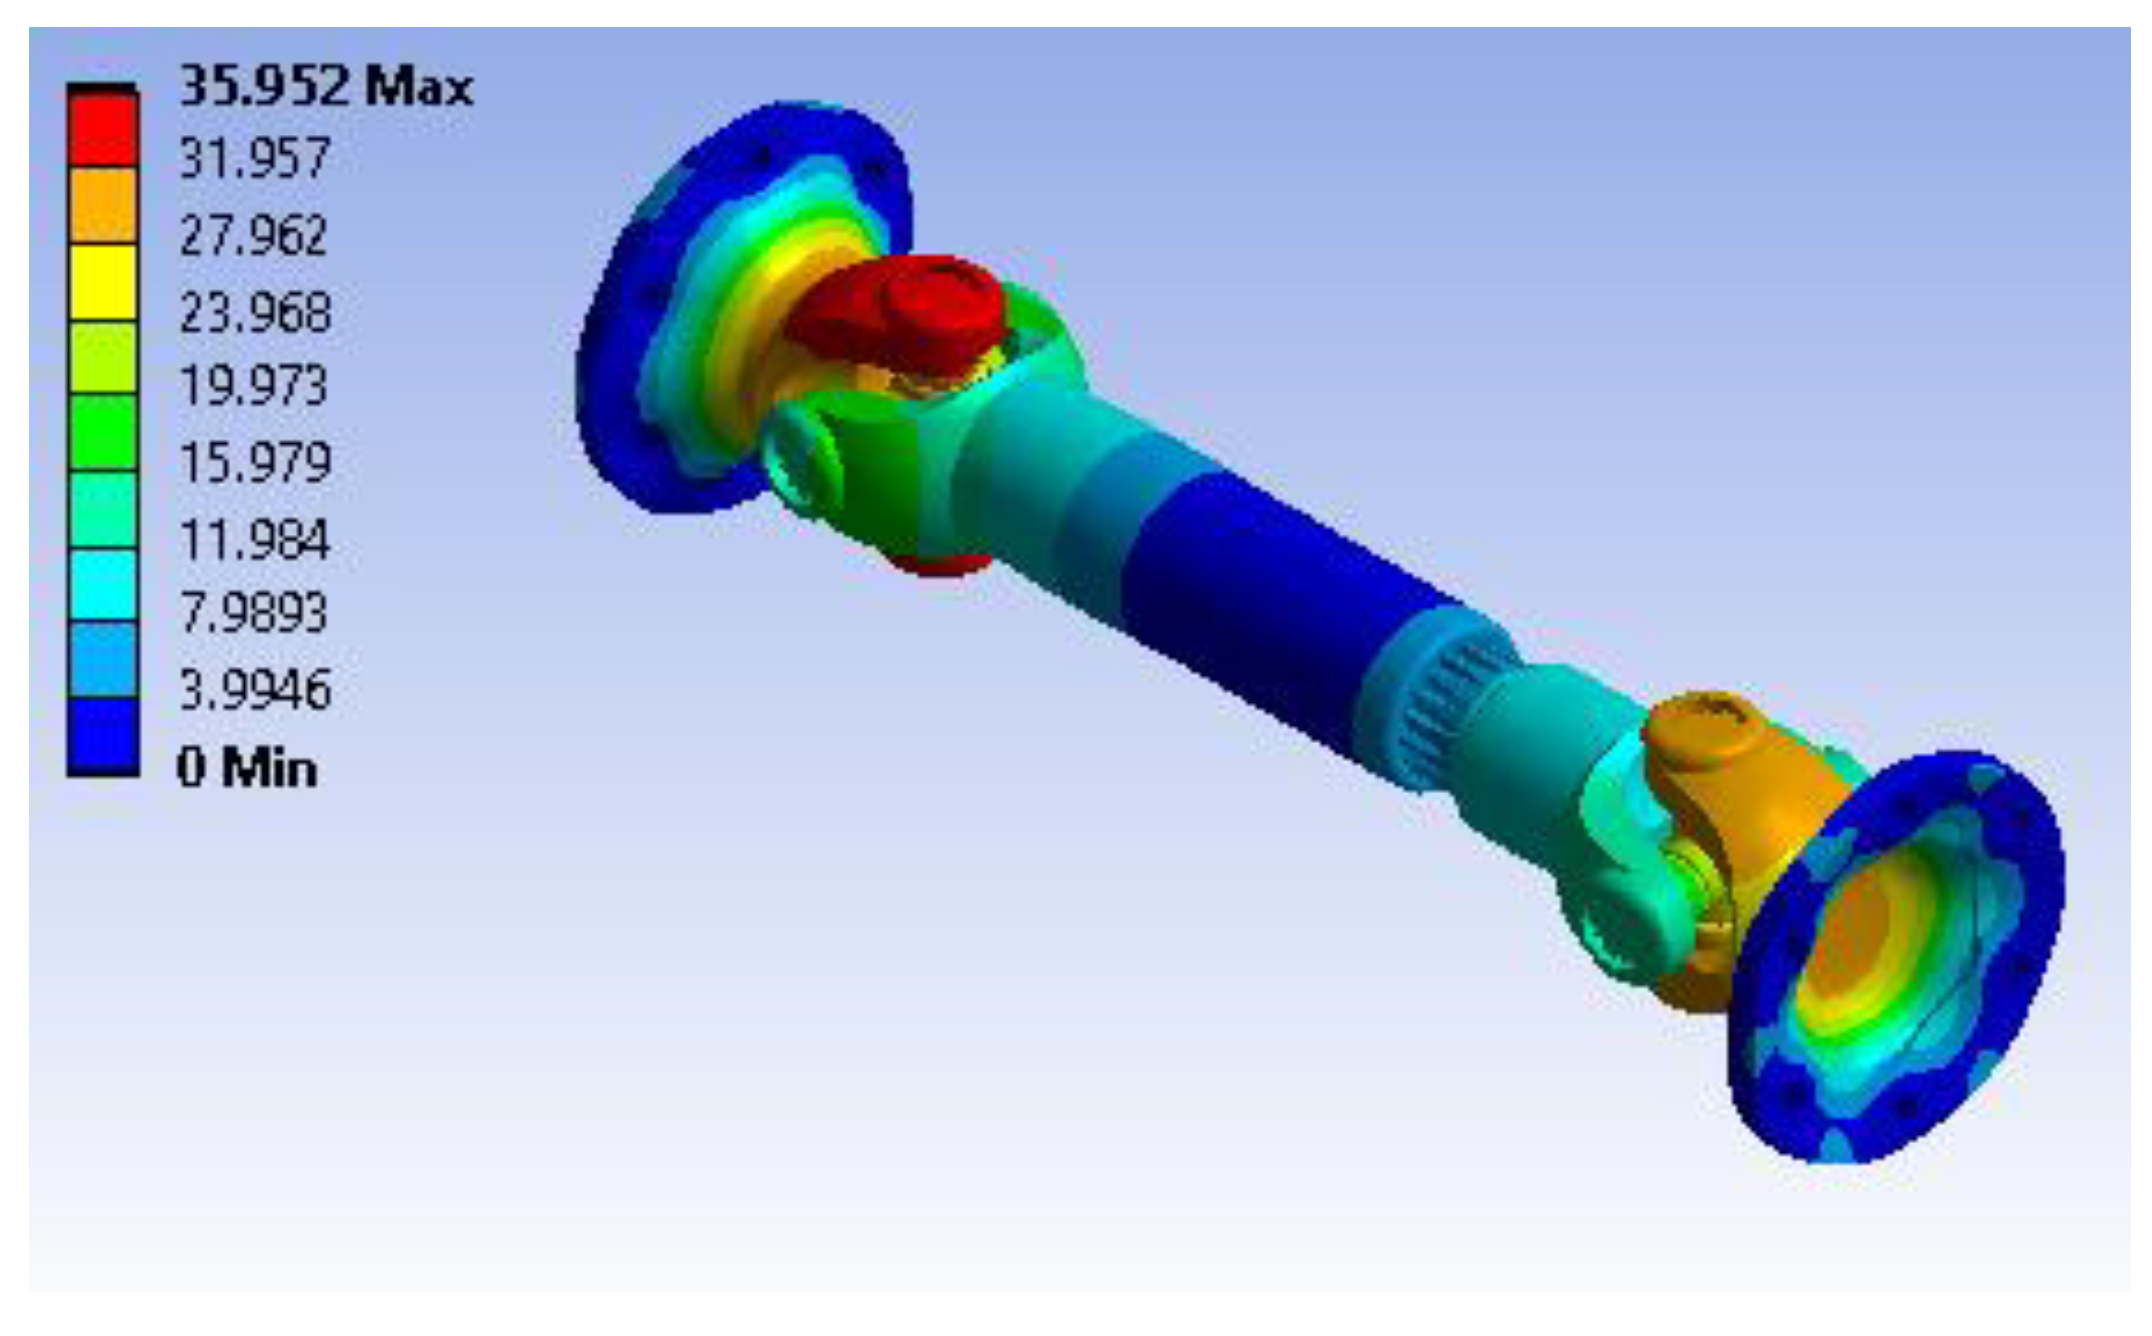
Figure 40.
Mode 16, F16 = 8720.7 Hz.
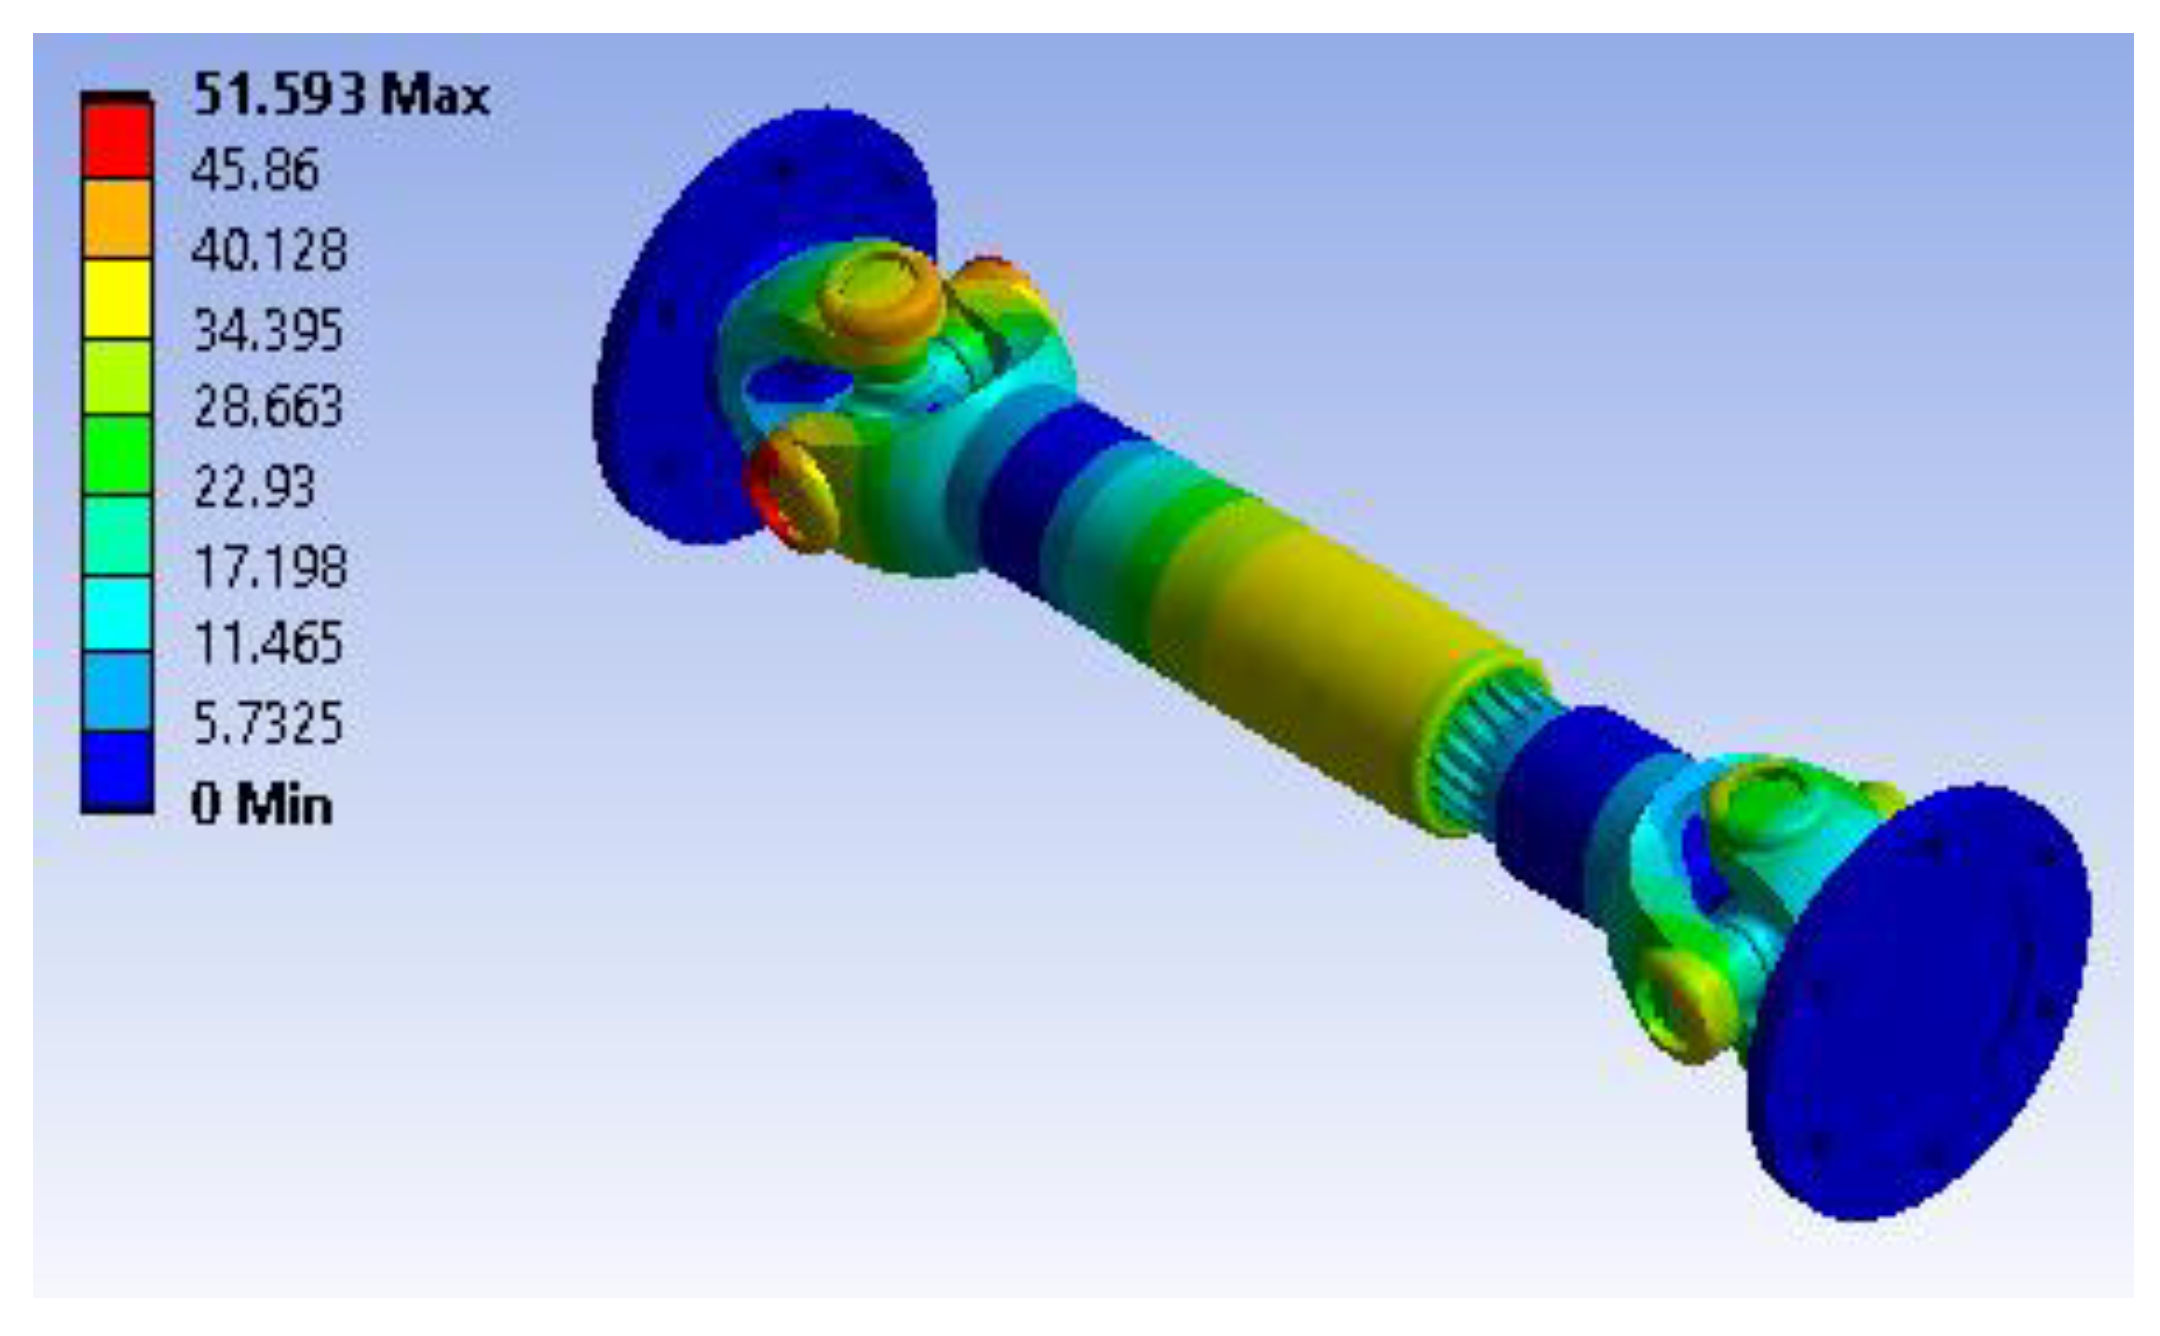
Figure 41.
Mode 1, F1 = 923.33 Hz.
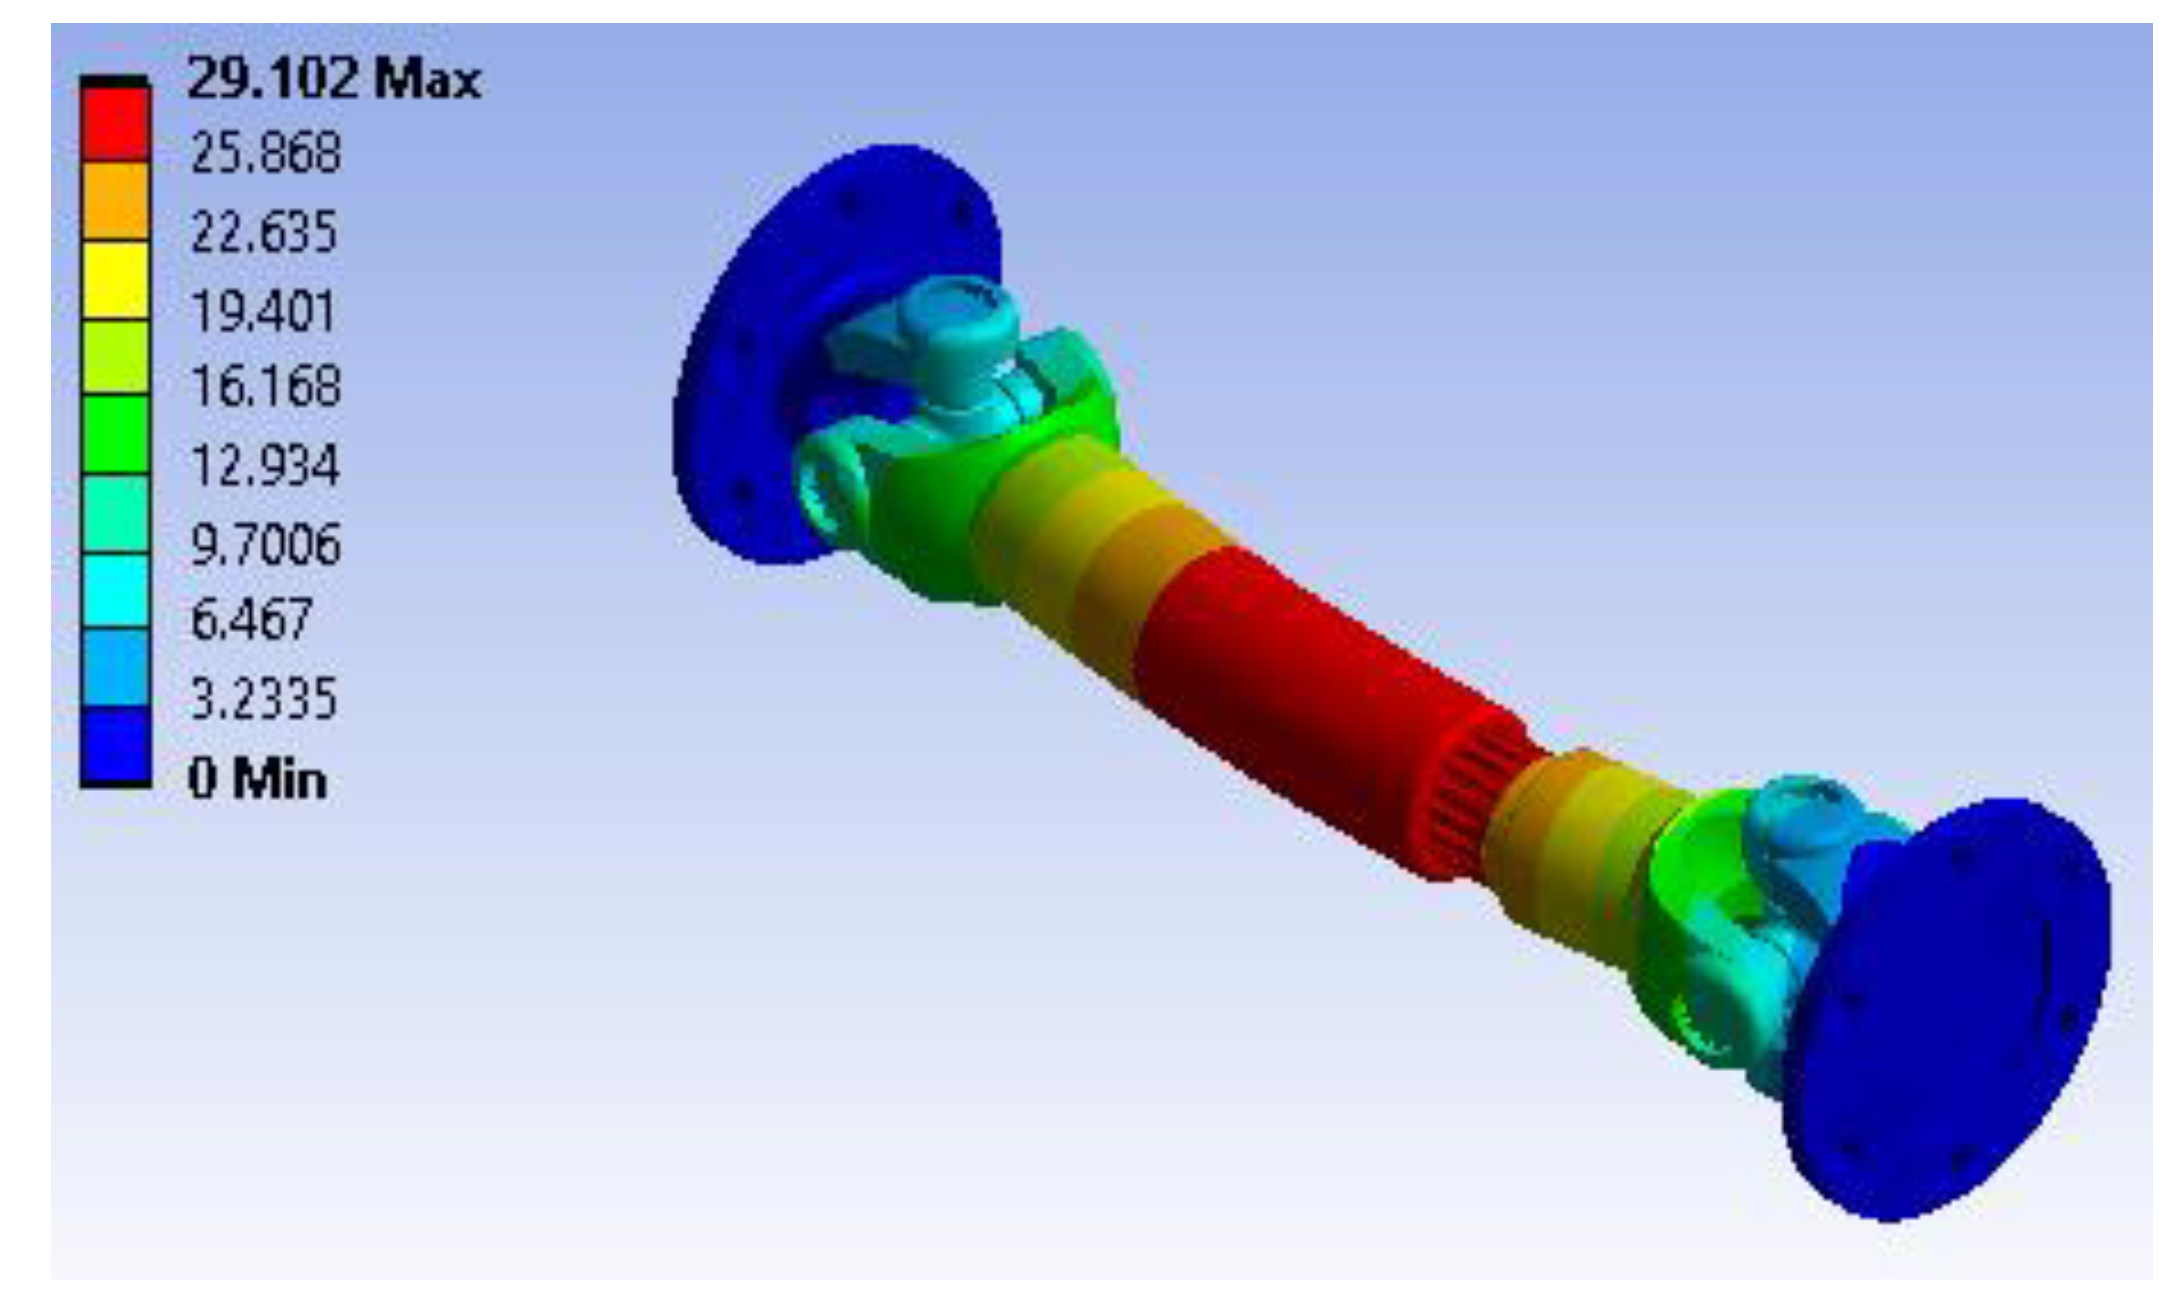
Figure 42.
Mode 6, F6 = 2581.9 Hz.
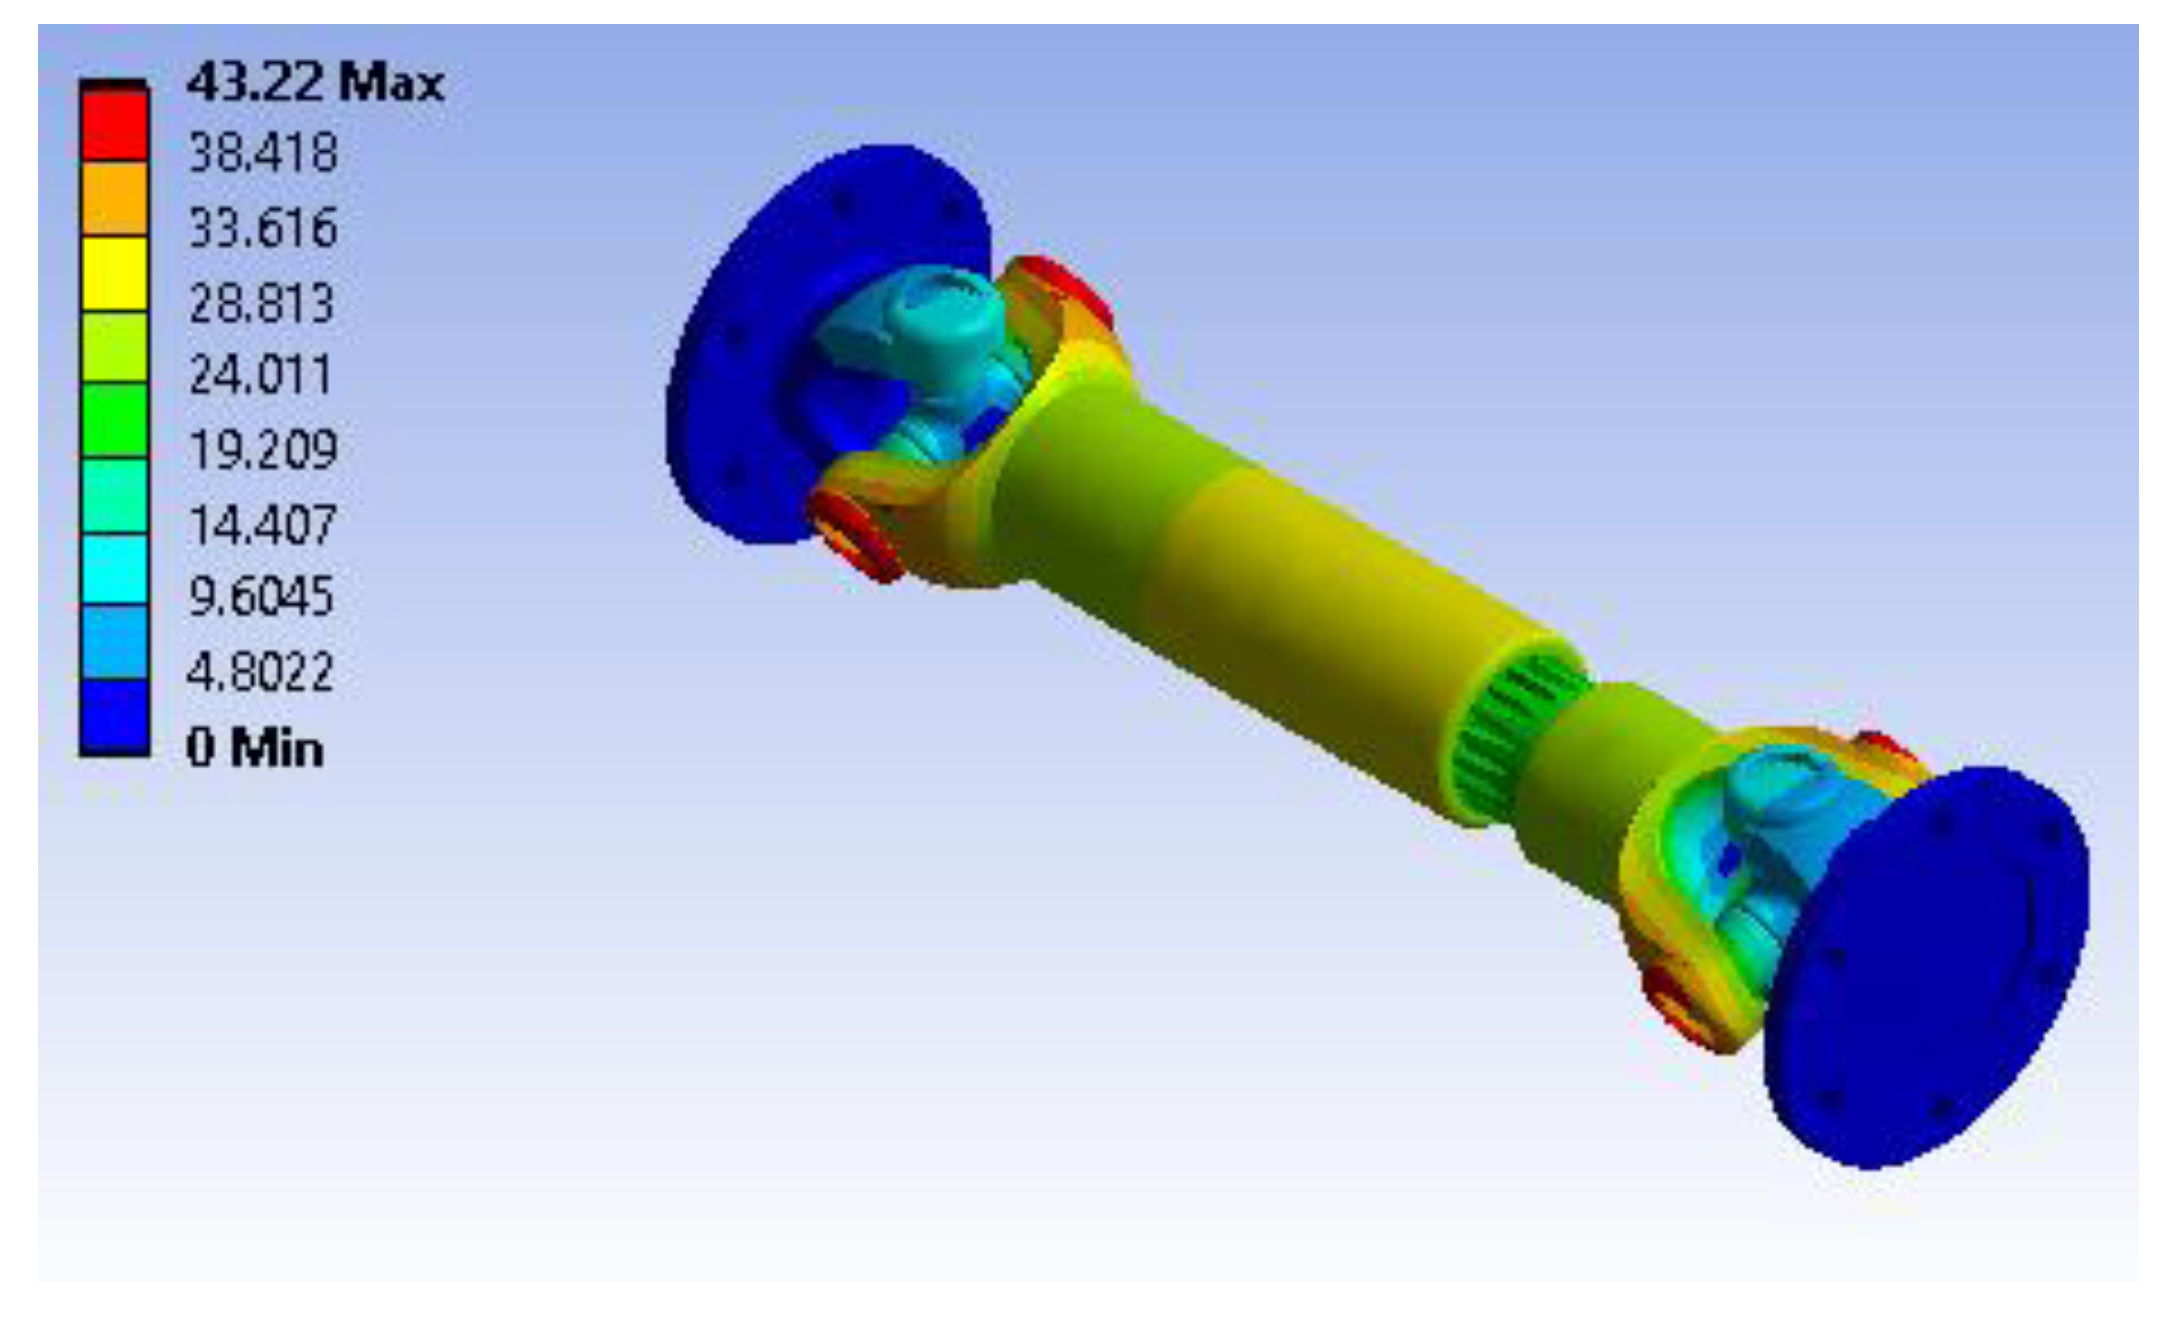
Figure 43.
Mode 12, F12 = 7306.2 Hz.
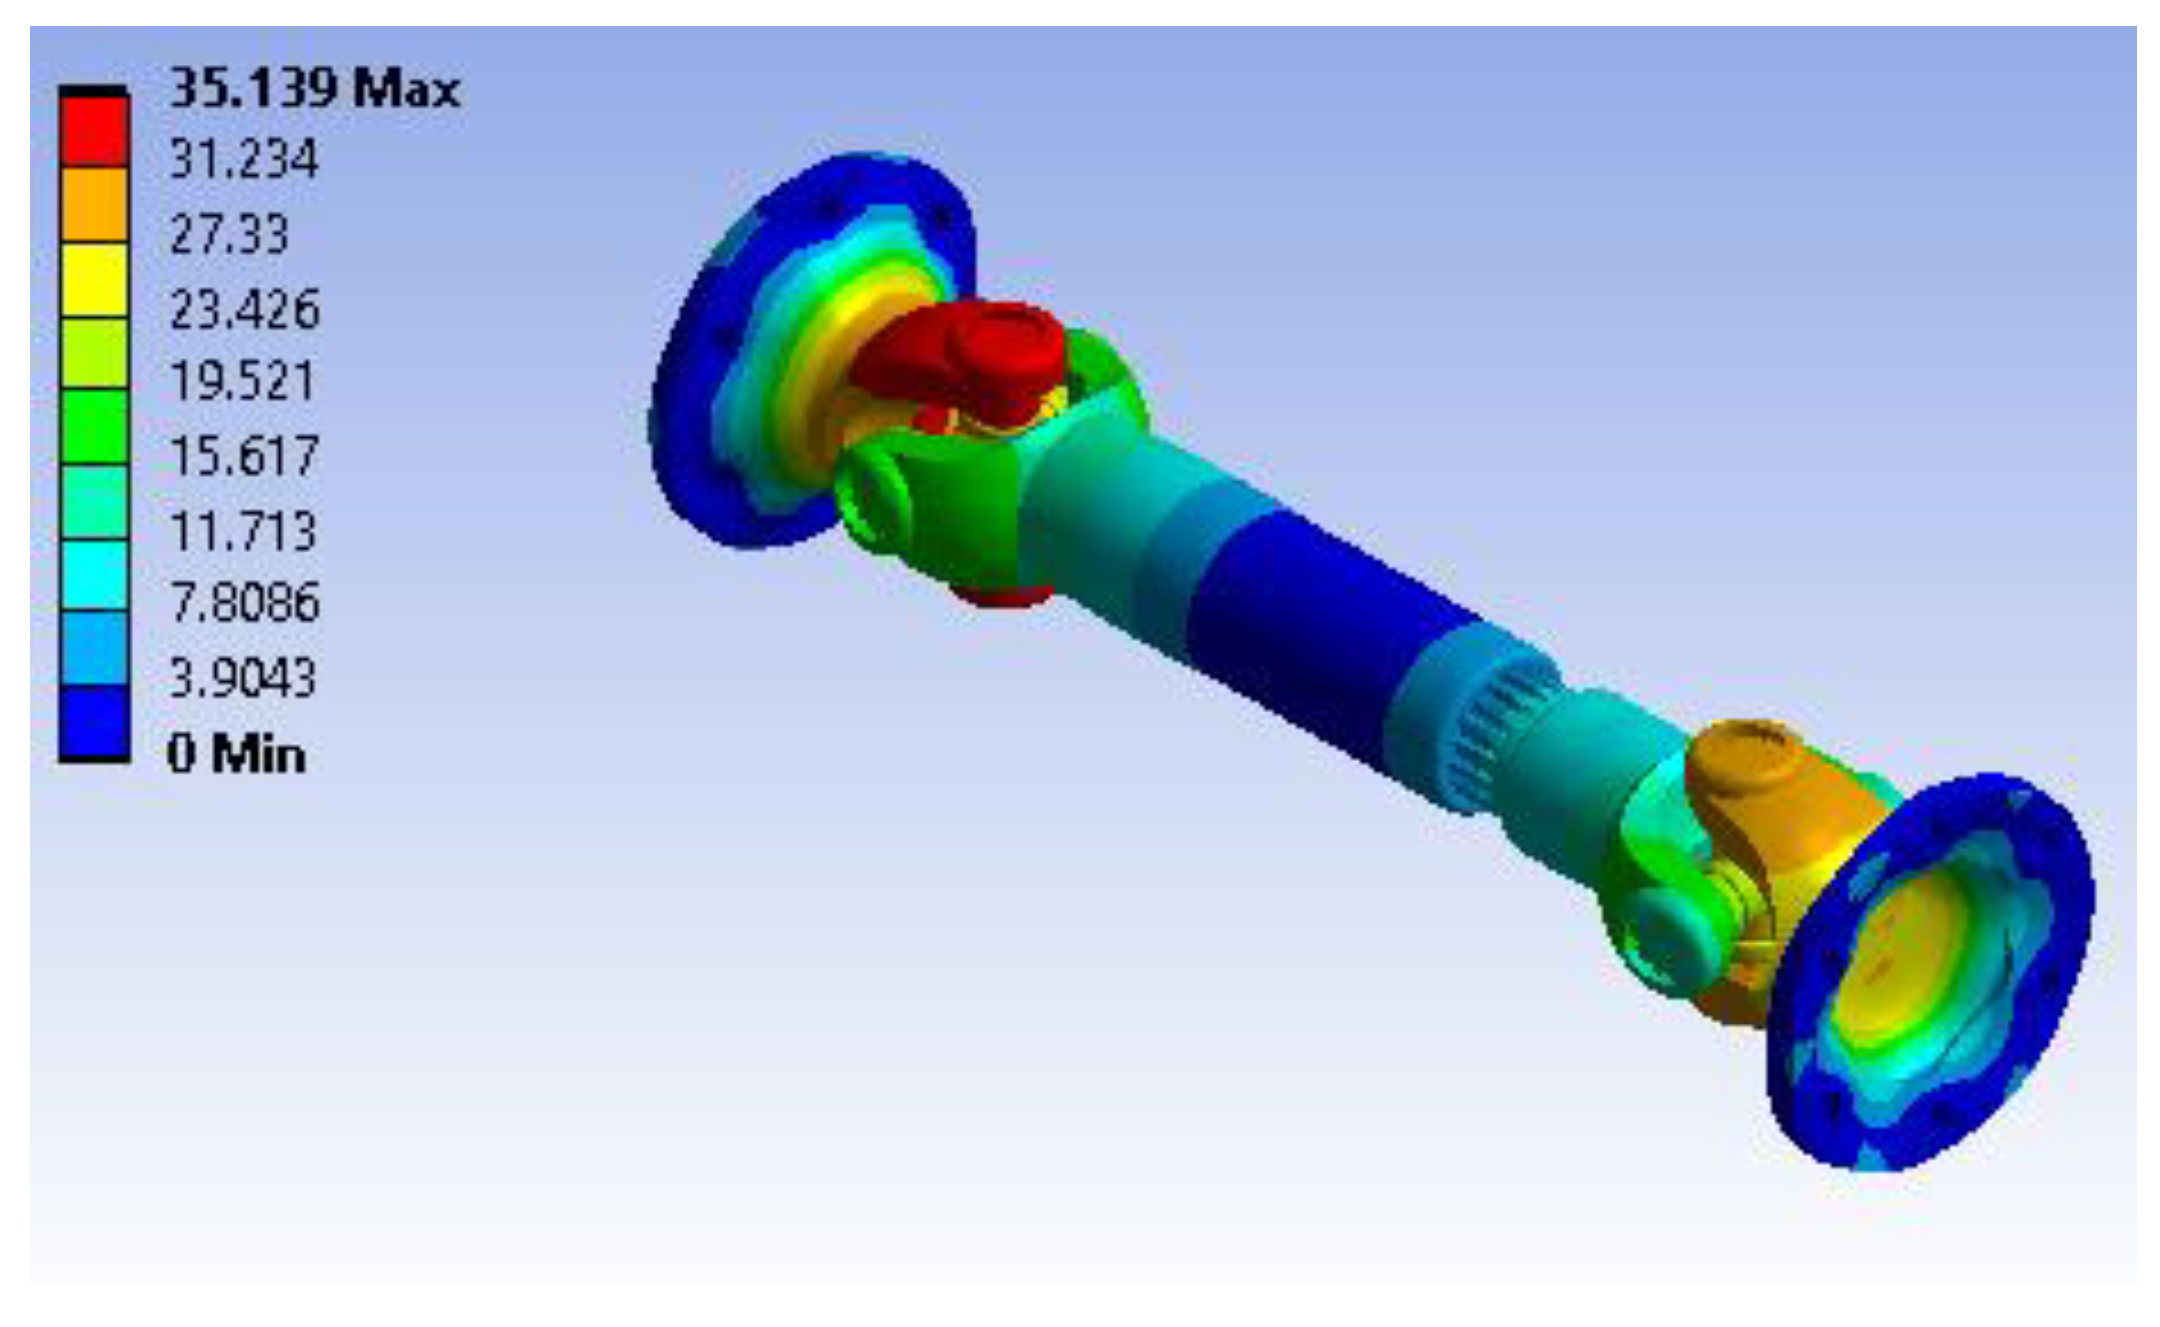
Figure 44.
Mode 16, F16 = 8510.7 Hz.
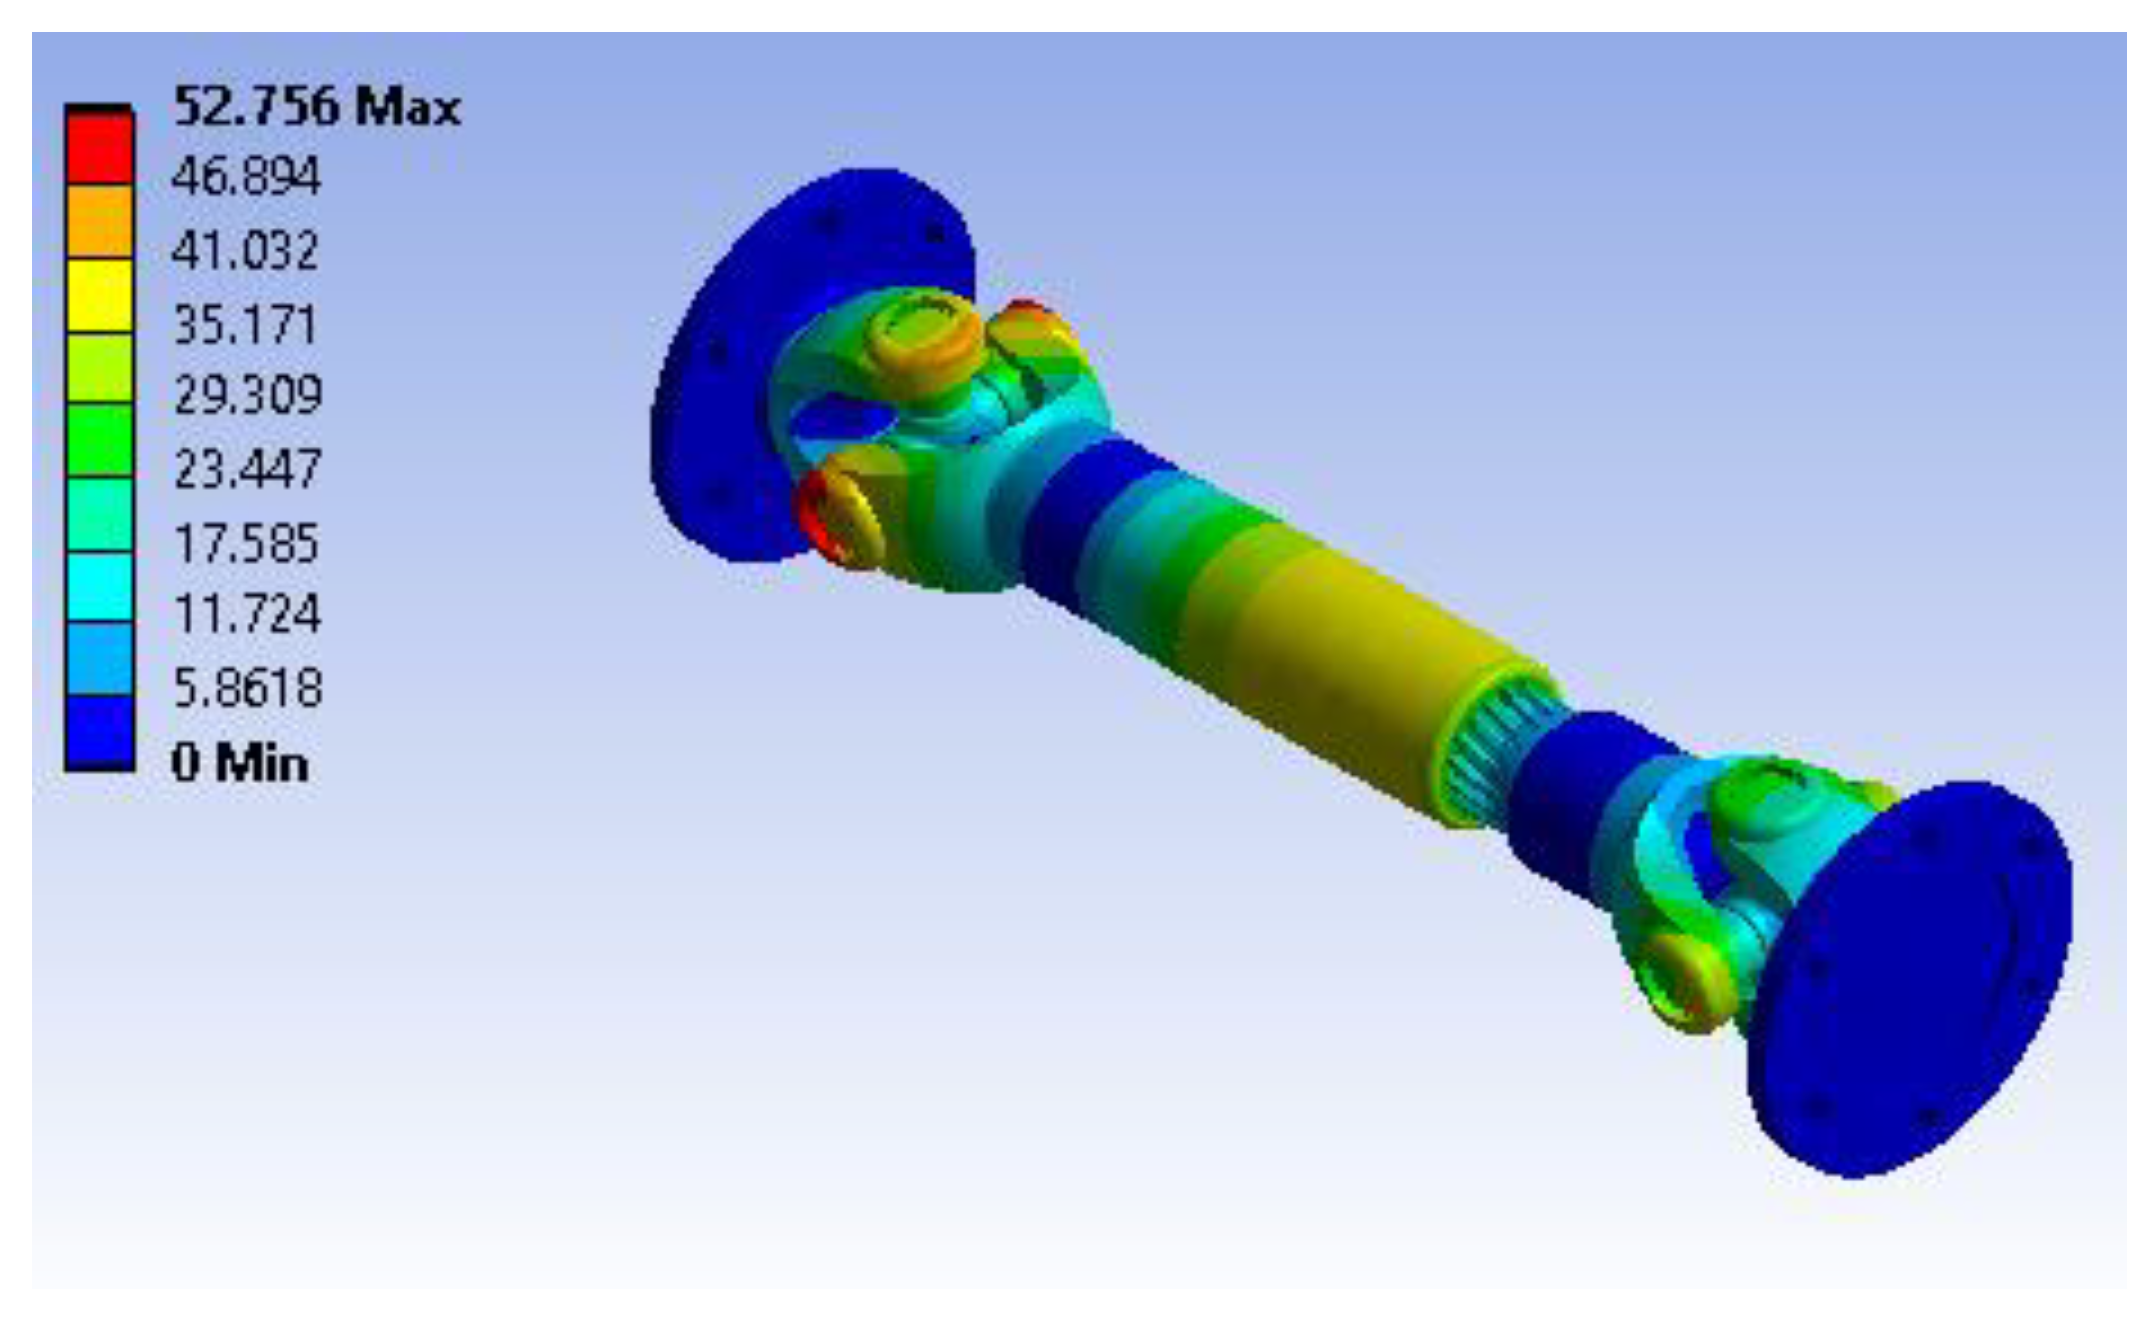
Figure 45.
Mode 1, F1 = 1191.1 Hz.
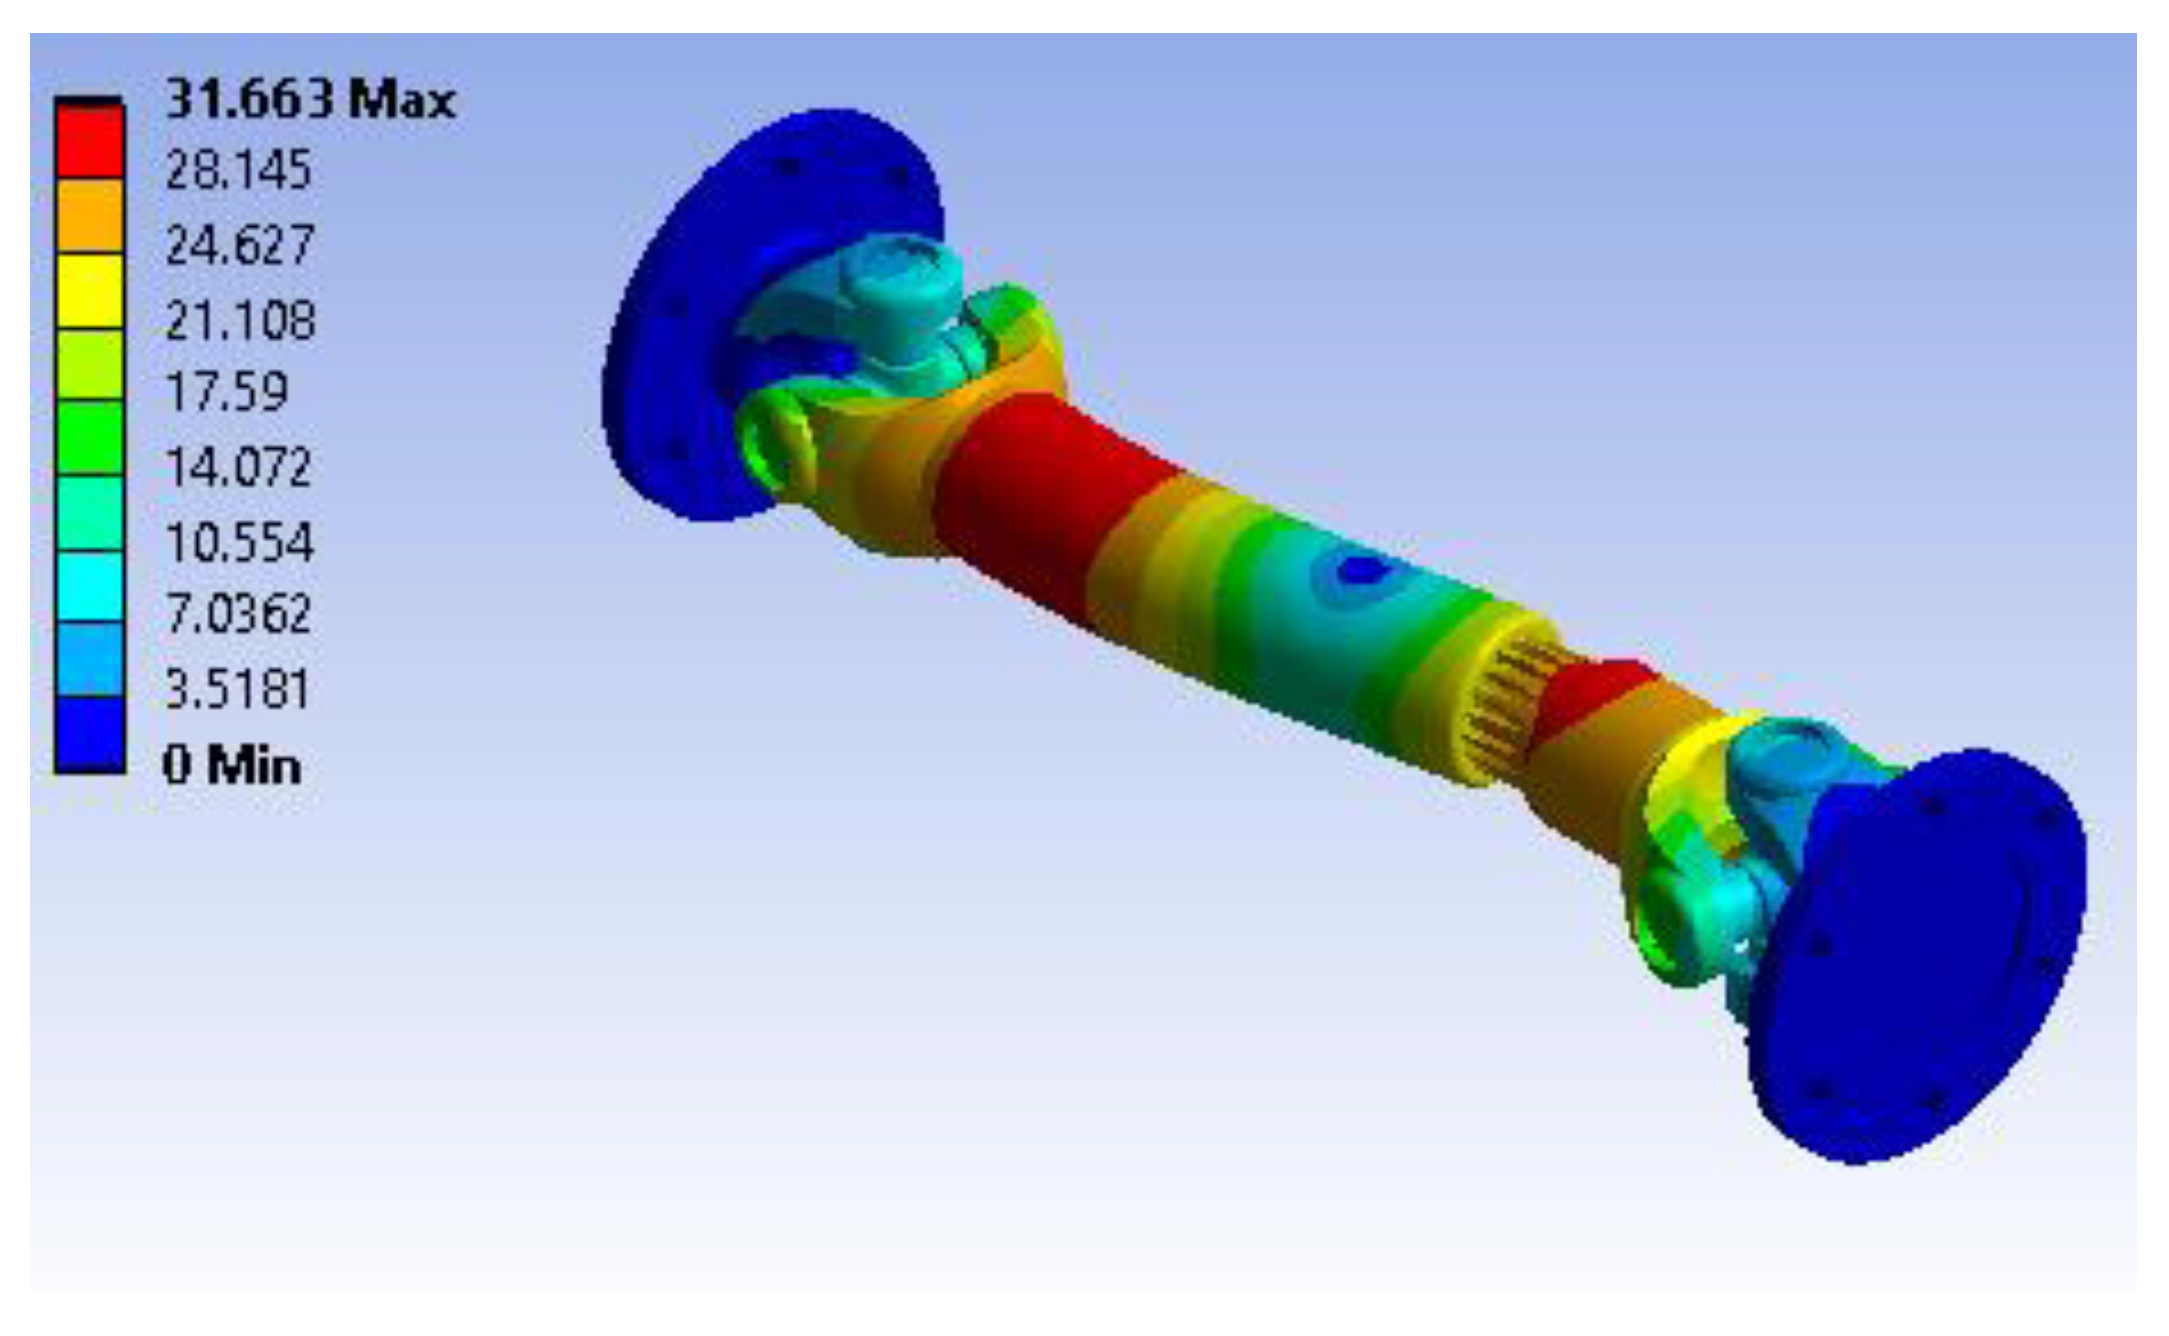
Figure 46.
Mode 6, F6 = 2085.4 Hz.
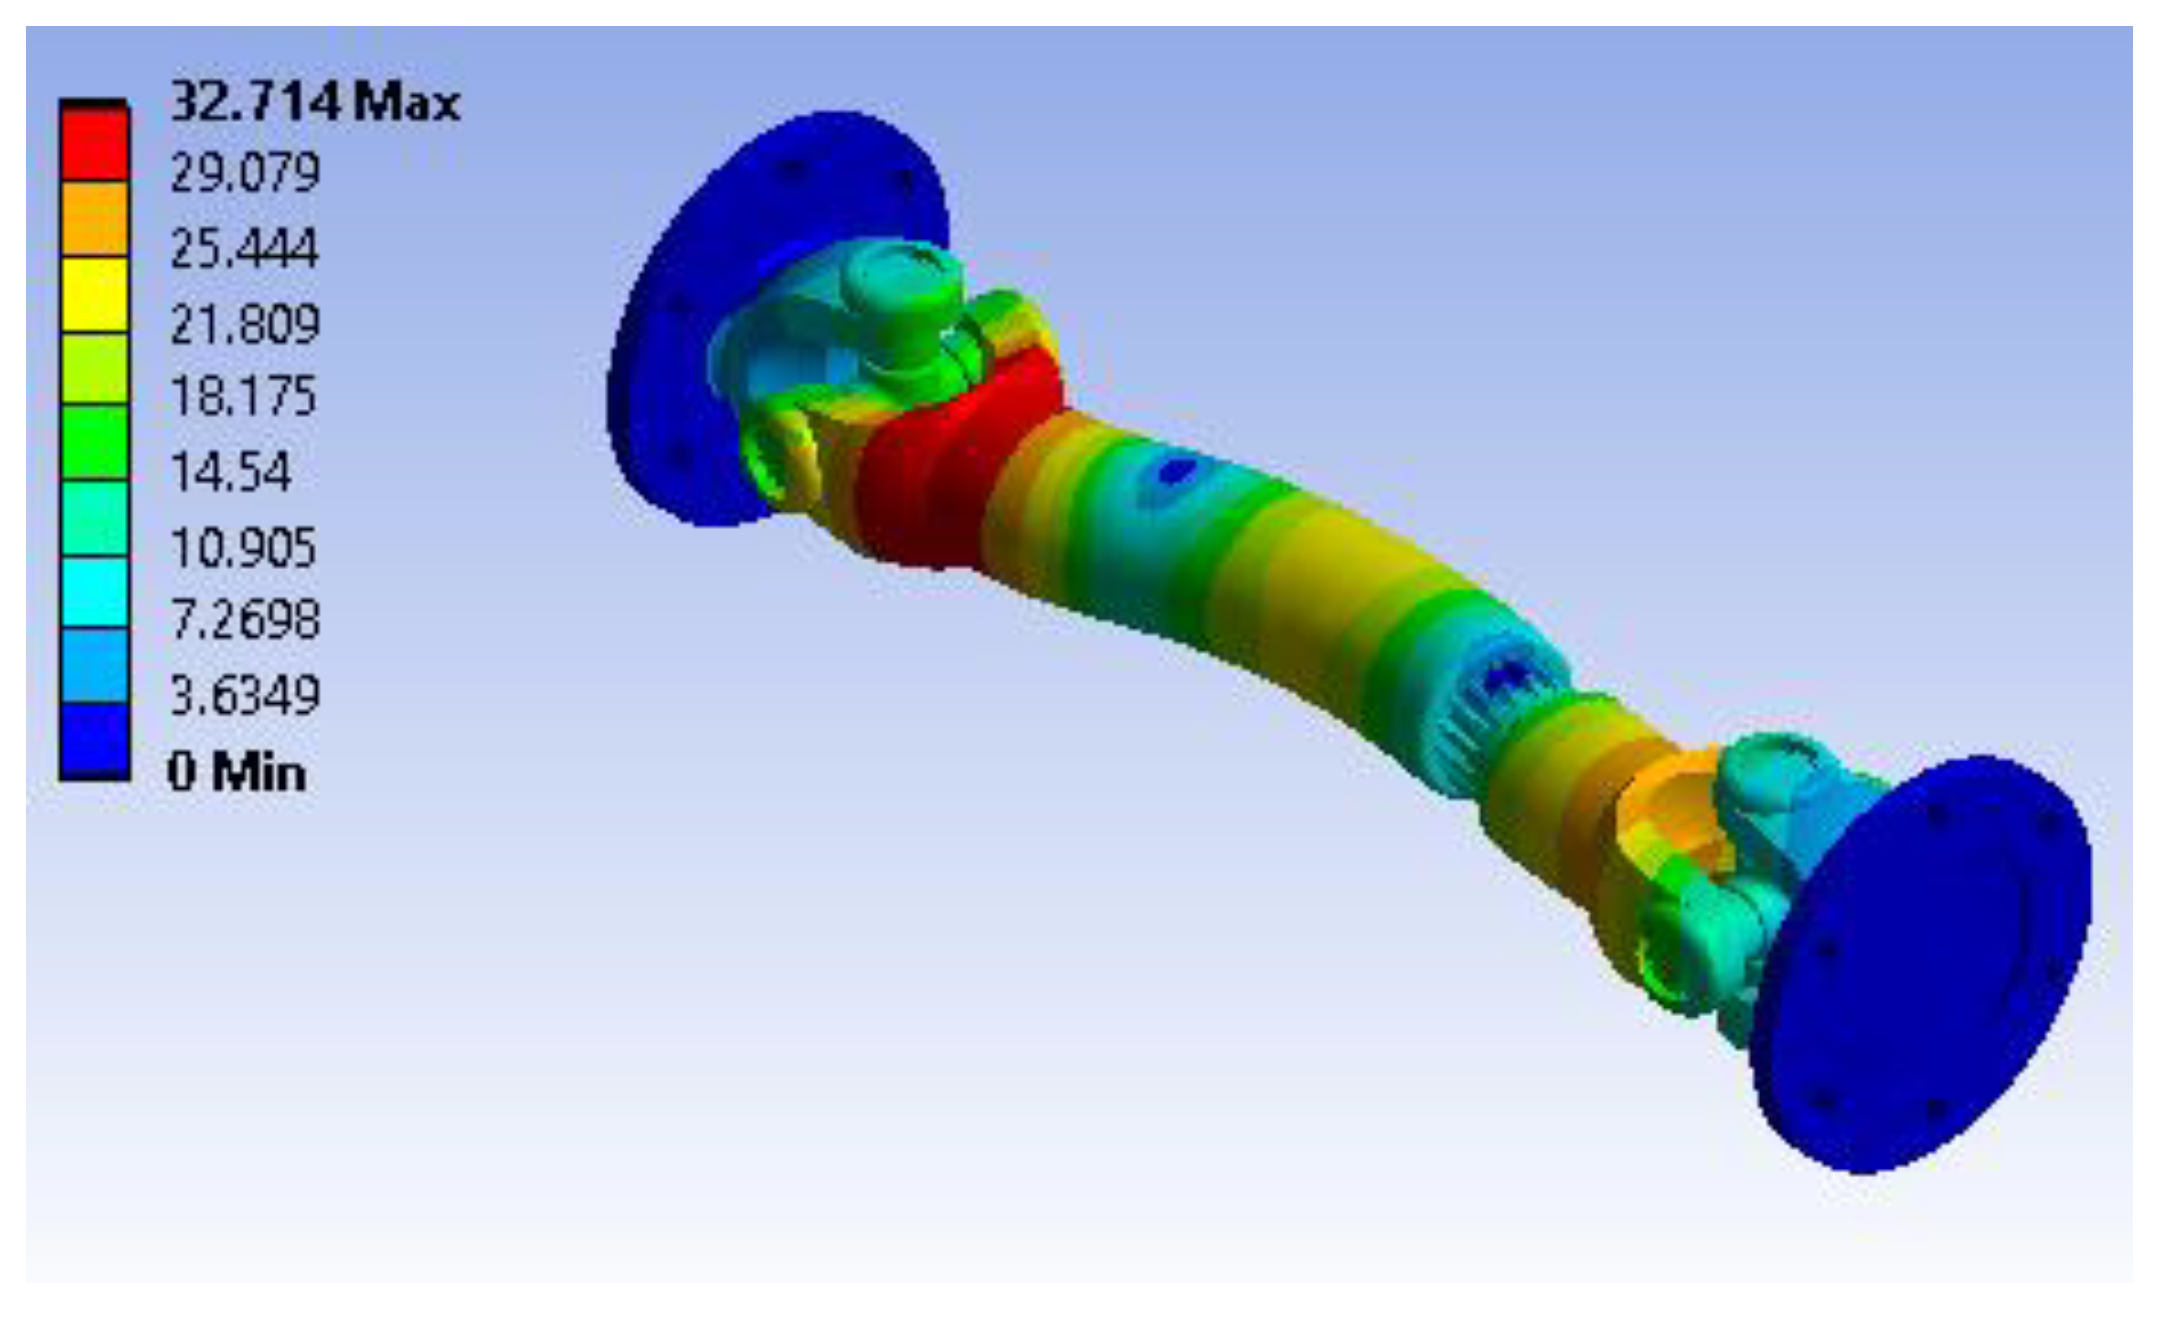
Figure 47.
Mode 12, F12 = 3842.9 Hz.
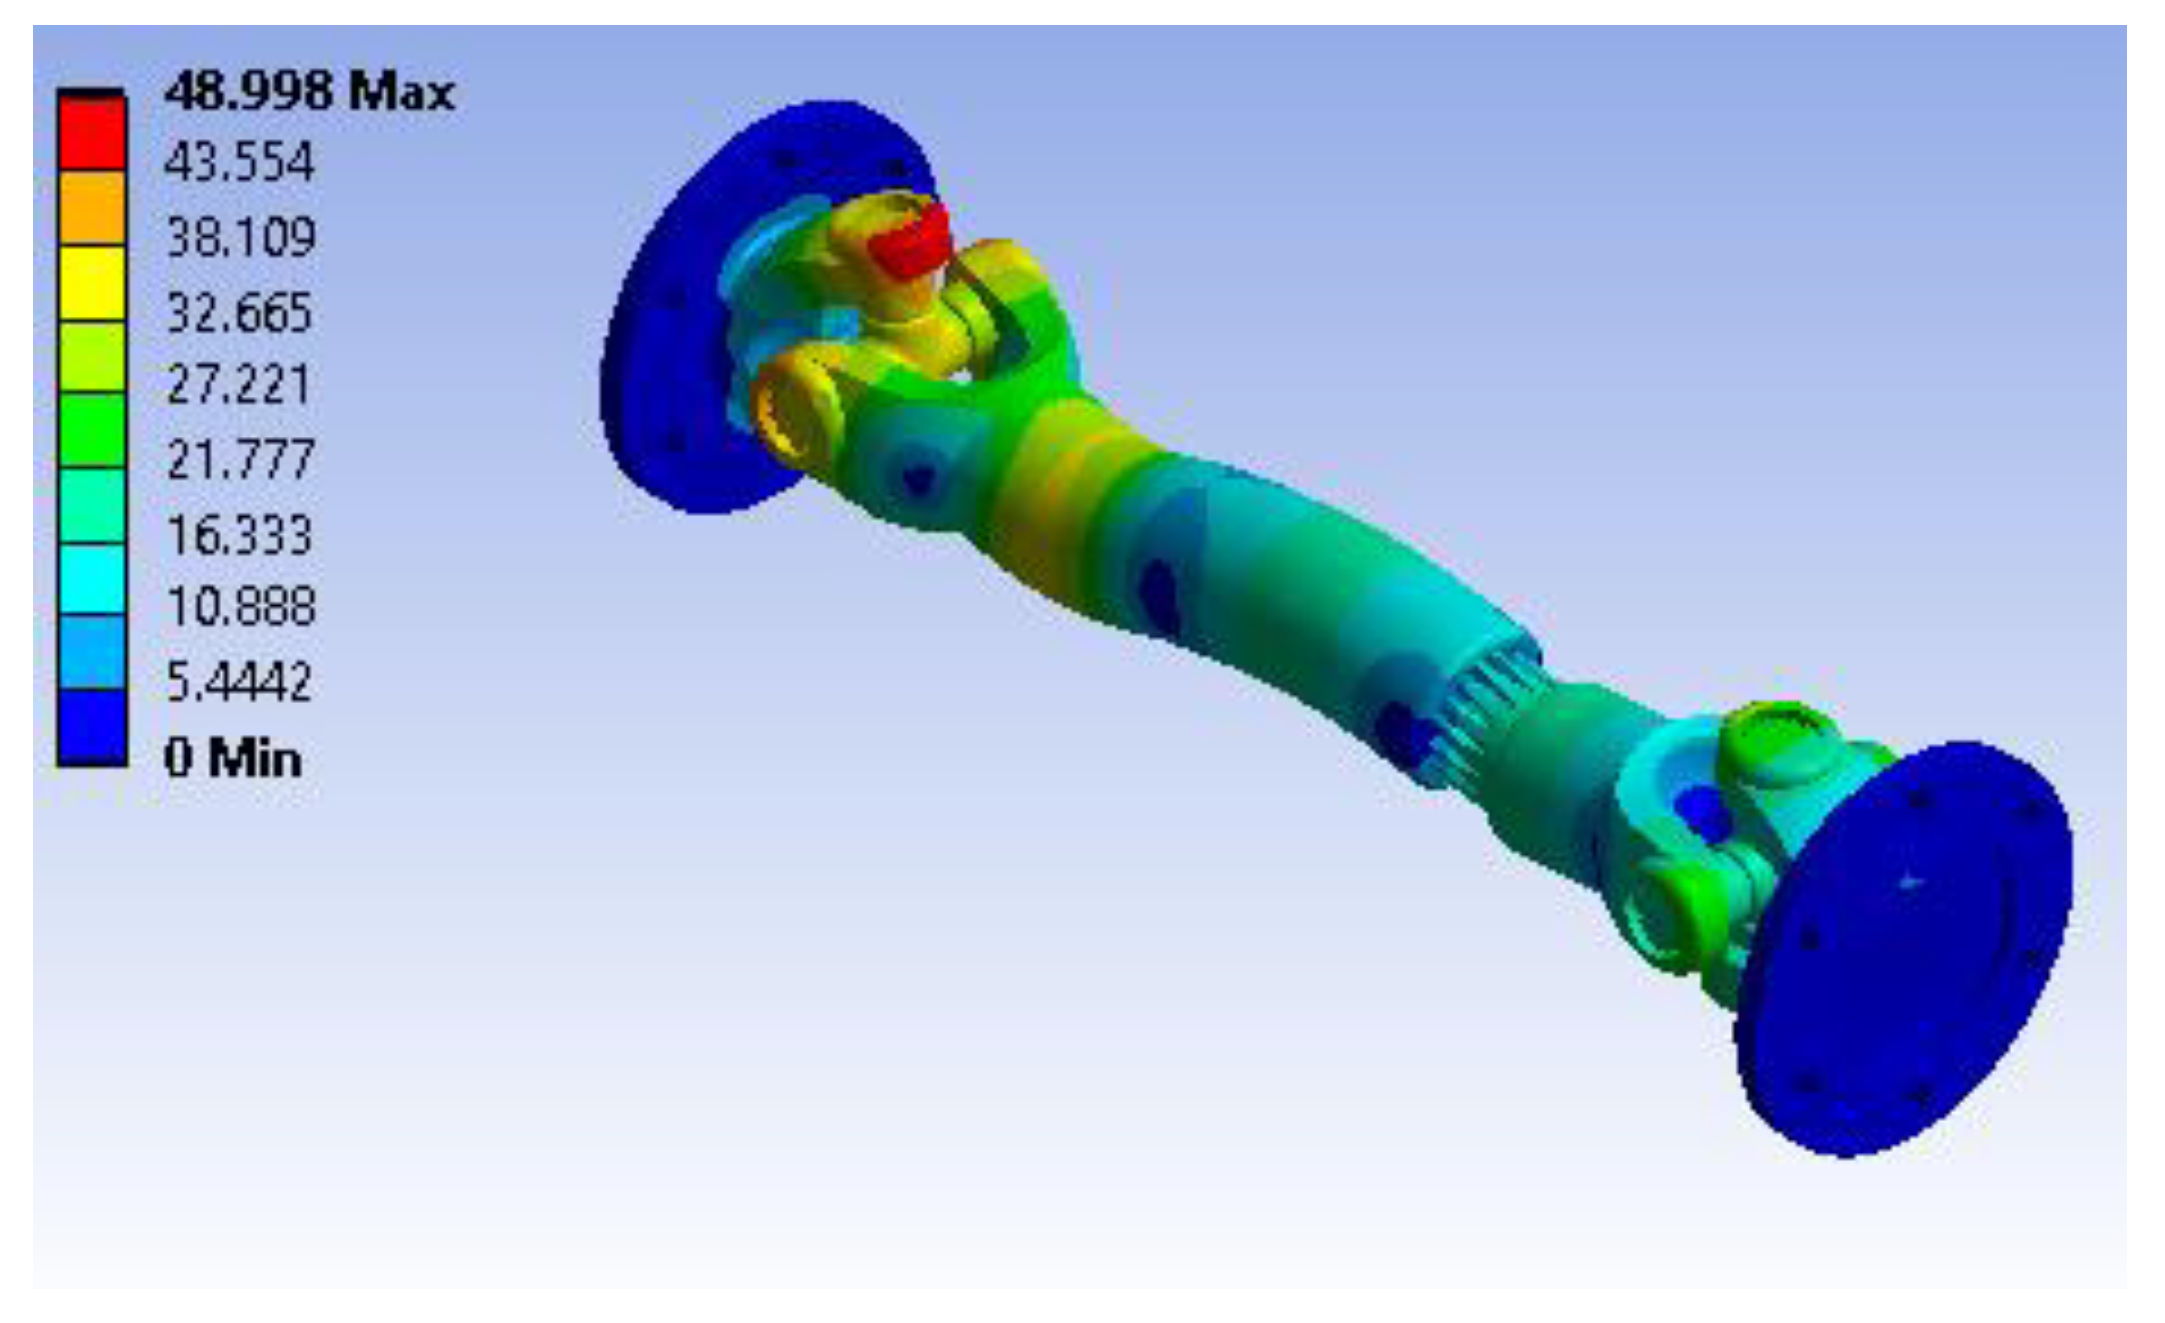
Figure 48.
Mode 16, F16 = 5314.5 Hz.
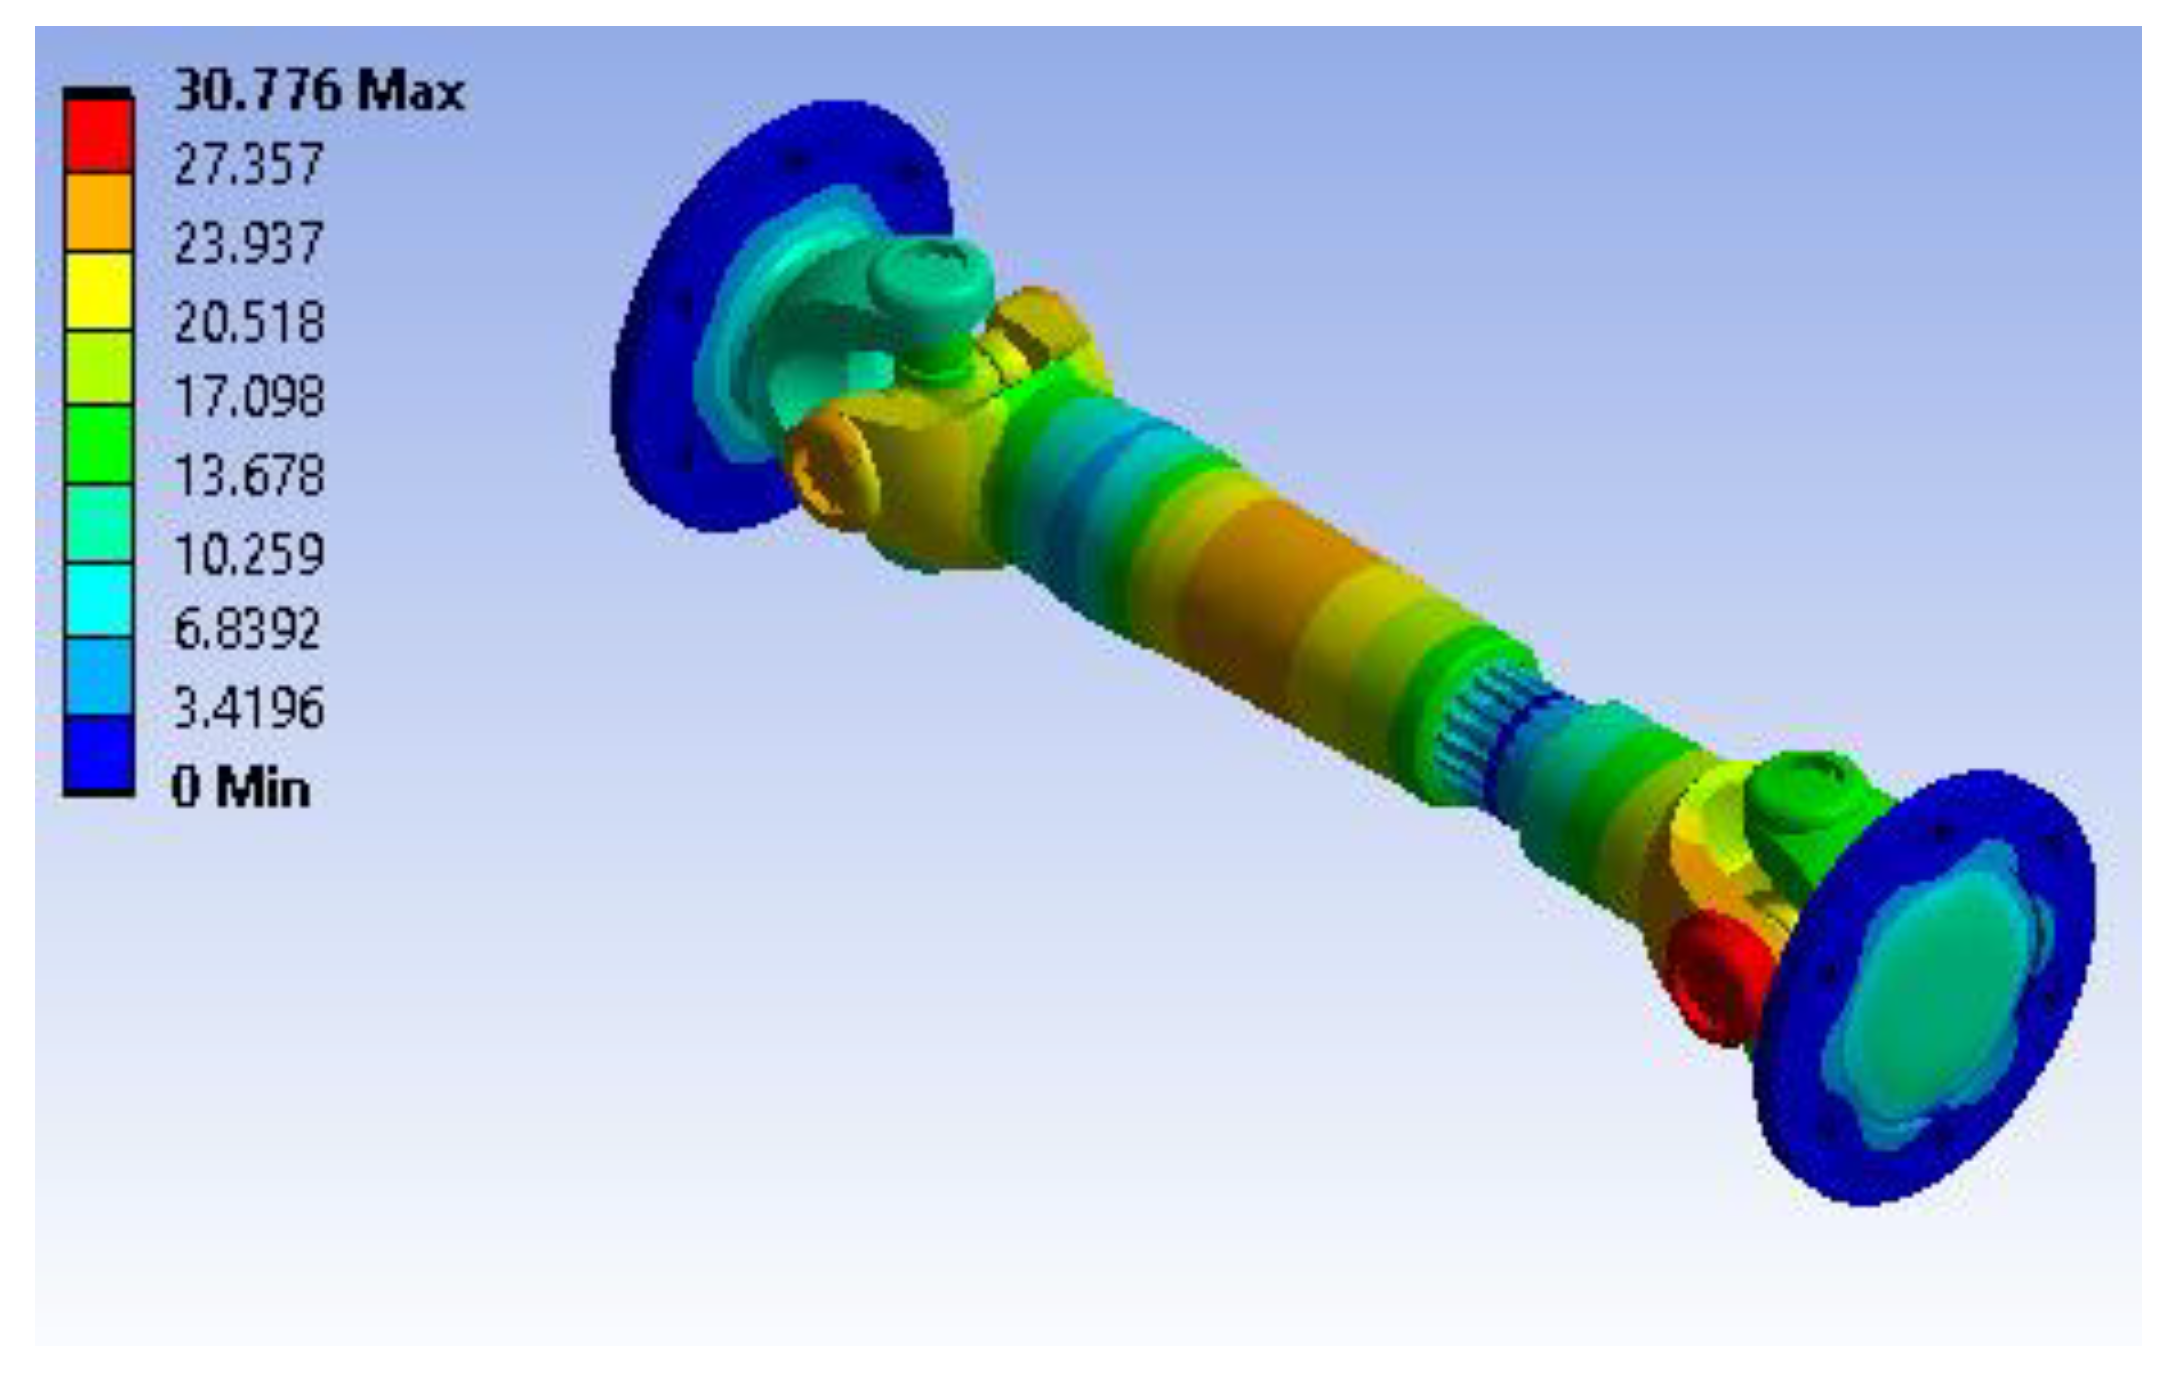
Table 2.
Physical properties for universal joint.
| No. | Physical Property | ||
| Property | Notation | Value | |
| 1 | Shaft speed | N | 2000 RPM |
| 2 | Ultimate torque | T | 1250 N/mm |
| 3 | Rotational velocity | V | 209.3 rad/sec |
| 4 | Frequency range | F | 500-10000 Hz |
| 5 | Shaft size selection | 53 | |
Table 3.
Properties of materials used.
| Cardan materials | Property of materials | |
| Young’s Modulus | Poisson’s Ratio | |
| Steel | 2.07e+011 | 0.3 |
| HS-Carbon Epoxy | 2.1e+011 | 0.3 |
| E-Glass Polyester | 3.4e+010 | 0.366 |
| Stainless Steel | 1.93e+011 | 0.31 |
| Hardox 400 | 1.93e+010 | 0.29 |
| Cardan materials | Property of materials | |
| Density (kg/m3) | Shear Modulus | |
| Steel | 7600 | 7.9615 e+010 |
| HS-Carbon Epoxy | 1600 | 8.0769 e+010 |
| E-Glass Polyester | 2100 | 2.433e+009 |
| Stainless Steel | 7750 | 7.366 e+010 |
| Hardox 400 | 8000 | 7.5 e+009 |
Disclaimer/Publisher’s Note: The statements, opinions and data contained in all publications are solely those of the individual author(s) and contributor(s) and not of MDPI and/or the editor(s). MDPI and/or the editor(s) disclaim responsibility for any injury to people or property resulting from any ideas, methods, instructions or products referred to in the content. |
© 2025 by the authors. Licensee MDPI, Basel, Switzerland. This article is an open access article distributed under the terms and conditions of the Creative Commons Attribution (CC BY) license (http://creativecommons.org/licenses/by/4.0/).
Copyright: This open access article is published under a Creative Commons CC BY 4.0 license, which permit the free download, distribution, and reuse, provided that the author and preprint are cited in any reuse.


