
Submitted:
12 August 2025
Posted:
14 August 2025
You are already at the latest version
Abstract
This paper discusses whether the principal response features of composites subjected to fatigue loadings, including residual strength and lifetime statistics under variable amplitude (VA) loadings, can be resolved based on constant amplitude (CA) fatigue life data. The approach is based on the Strength- Residual Strength-Life Equal-Rank Assumption (SRSLERA), providing a statistical correspondence between the static strength, residual strength, and fatigue life distribution functions under CA loadings. Under VA loadings, the strength degradation progression and then the fatigue lifetime are calculated by dividing the loading spectrum into a sequence of CA block loadings of given extents (including one cycle), and assuming that the strength at the end of a generic block loading equals the strength at the start of the consecutive one, namely the Equivalent Residual Strength Assumption (ERSA). The consequences of SRSLERA and ERSA are first discussed by re-elaborating a series of uniaxial, statistically sound CA residual strength and fatigue life data obtained under different loading ratios, R, from pure tension, to mixed tension-compression, to pure compression. It is shown that the static strength Weibull's shape and scale parameters and the fatigue formulation parameters recovered under pure compression or tension loadings represent the fingerprint of composite materials subjected to fatigue and characterize their unicity. The residual strength statistics, fatigue probability density functions (PDF), and constant life diagram (CLD) construction are theoretically reported. Then, based on ERSA, the statistical lifetimes under VA loadings and the cycle-by-cycle damage progressions of block repeated loadings are analyzed, and a residual strength-based damage rule is compared to Miner's rule.
Keywords:
fatigue
; residual strength
; constant amplitude loadings
; spectrum loadings
; constant life diagram
; statistical modeling
; damage rule
1. Introduction
Mechanical properties of composite materials, including the stress-strain and fatigue behavior, are broadly scattered even when the material's behavior is evaluated in a lab environment, where balanced, symmetrical, relatively thin laminates are subjected to uni-axial, in-plane loadings and the manufacturing processes are well-controlled. The scatter is due to the material's heterogeneity, the unavoidable manufacturing defects (such as residual stresses, bubbles, inclusions, bent fibers, resin-deficient areas, and resin-rich areas), and the multiple damage mechanisms that develop during the material's life at different time and length scales, that makes the mechanical characterization of composite materials mandatory on a statistical basis [1,2,3,4,5,6]. The mechanical properties scatter is a critical issue: it limits the composites' potential by leading to a conservative design approach and requires extensive use of Safety Factor (SF) parameters, which diminishes the primary advantage of lightweight composite materials [1]. Thus, intensive experimental efforts are required to characterize the fatigue response of composite materials to account for the stochastic nature of fatigue, the inherent complexity deriving from the interactions of different damage mechanisms, and the impact of manufacturing defects [7]. Furthermore, the unicity of any composite system, from micro to macro scale, significantly hinders the predictive capabilities of many models and prevents generalization in modeling. Phenomenological fatigue damage formulations are practical tools since damage increases monotonically with increasing cycles, and the strength or stiffness decreases monotonically. The "equivalent strength" models (ESM) [6,8,9,10,11,12,13,14] are the limiting case of residual strength models [13,14,15,16,17,18,19,20] since failure occurs when the strength degrades to the peak stress of fatigue loading. The strength loss can be used as a metric to model fatigue damage in composites globally and phenomenologically by defining a proper cumulative damage model. The ESMs establish an ordered correlation between the static strength and the fatigue life statistics, inherently fulfilling the strength-life equal-rank assumption (SLERA) [6,11,12,13,14]. The SLERA establishes an exact correlation between the initial static strength (0) and fatigue life expectancy (N), as well as the scattering of fatigue data due to the variation in the static strengths of individual specimens.
Although many authors have discussed the applicability of SLERA [12,13], Barnard et al. [14] showed analytically that the SLERA is valid for a wide range of fiber-reinforced plastic laminates, provided there is no change in failure mode with fatigue life. Also, they stated that the SLERA could not predict the residual strength, though some researchers have attempted to do so, e.g., Chou and Croman [13]. Gamsted and Sjögren [15] doubted the validity of the strength–life–equal–rank assumption for the particular case of cross-ply laminates, showing that progressive delamination in fatigue is almost absent in static loading. However, although the SLERA was refutable, it can still work for practical purposes. It gives a fair correspondence between the static strength distribution and the fatigue life distribution for some composite materials, provided the disparity in damage accumulation under static and fatigue loading was negligible.
Instead, from the knowledge of the experimental static strength and CA fatigue life distribution functions, the conjecture of SLERA was amplified and applied to a wide series of composite materials [22,23,24,25], assuming that the strength degrades continuously with increasing the number of cycles. It was shown that the residual strength distribution function conforms to the ordered statistics of the static strength σ0, and the number of cycles to failure, N, namely the Strength-Residual Strength-Life Equal Rank Assumption (SRSLERA) [11]. Consequently, given the loading ratio, R, and σmax, any experimental residual strength data in the cycle interval 1<n<N, remain confined in a domain bounded between the strength degradation curves starting from the extreme tails of the static strength distribution function, σ0, and falling to the maximum applied stress in a "sudden drop" modality in the vicinity of failure.
The concept was strengthened by arguing that, under moderate loadings, the multiple damage mechanisms contributing to the strength degradation develop with different kinetics and manifest their effectiveness at different observable time scales, and, by increasing the loading severity, the timescales largely superpose and coalesce at one cycle [25]. Consequently, the static strength data were considered fatigue data, where failure occurred within the first cycle [25]. As a corollary, the static strength data should be obtained at the loading rates adopted in fatigue testing.
Based on simple experiments, the SRSLERA represents a simplified physical framework that, in principle, allows for generalized modeling and predictions for more complicated cases such as
block and variable loading situations. Various methods, relying on damage accumulation rules, residual strength/stiffness models, and load interaction corrections, have been proposed to recover the fatigue response of composite materials subjected to spectrum loading from CA fatigue data. Historically, the empirical Miner's rule [26] was commonly adopted to evaluate the damage progression under VA fatigue loadings, even if its inadequacy is well documented [27,28,29,30,31]. The Miner's rule assumes that damage accumulates linearly with loading cycles and does not account for the loading extent's and sequence's effects. Instead, the composite material has a memory, in the sense that the damage development depends on the order of the various stress levels. At best, Miner's rule was used to calibrate the reliability of the different damage rules in the literature [30,31]. Sometimes, it was modified to restore the nonlinearity and the loading sequence effects, but it required estimating adjunctive parameters under different loading patterns in most cases with debatable accuracy and predictive capability [31,32,33].
Moreover, the discrepancies in modeling the VA responses were attributed to the complex stress states induced by the cycle-by-cycle amplitude and stress ratio variation, which cause more widespread and diverse damage than that observed under CA loadings. Researchers have compensated for these effects through more complex models [34,35] but only for the data they are modeling and the efforts spent to quantify the effect of the "cycle-mix" of the loading spectrum to account for the degradation of strength and life, as Shaft and Davidson hypothesized [32,33], were unsatisfactory for the lack of statistically sound evidence [35,36,37,38]
In this paper, the cycle-mix effects are ignored: under VA loading, the spectrum is subdivided into a series of CA blocks of a given extent (including one cycle), and the strength at the end of a generic block loading equals the strength at the start of the consecutive one, namely the Equivalent Residual Strength Assumption (ERSA).
SRSLERA and ERSA depict an ideal physical background to cast the fatigue formulations and harmonize their capabilities to predict the principal features of composites subjected to fatigue loadings. However, they may simplify the complex fatigue behavior of composites, which could introduce limitations and potential inaccuracies, particularly when dealing with real-world, variable conditions and complex material behaviors. The theoretical results stemming from applying SRSLERA and ERSA are compared to the complexities of statistically sound literature data, and the approach's limits are discussed. The series of assumptions inherently adopted herein is summarized as follows to refine the phenomenological nature of the approach:
1) Under constant amplitude (CA) loadings, no change in the damage modes is allowed. In practice, the deterministic fatigue life formulation should exhibit no curvature changes. The apparent downward curvature frequently observed in the low cycle-high stress region is because static strength data are measured at loading rates well below those in fatigue, as discussed and clarified in Ref. [23]. In the present approach, the static strength distribution function is mandatorily requested to optimize the fatigue life formulation and plays a dominant role in predicting the constant and variable amplitude fatigue responses. In practice, we assume that static strengths are fatigue data where failure occurs within the first cycle (n=1) and that failure in fatigue occurs with the same damage progression at a longer timescale when n>1.
2) The statistical distribution of cycles to failure and the residual strength correlate to the static strength statistical distribution through the Strength-Residual Strength-Life Equal-Rank Assumption (SRSLERA). SRSLERA is an extension of the Strength-Life Equal-Rank Assumption (SLERA) first discussed by Hahn and Kim [12] and then postulated by Chou and Croman [13]. The analytic development of SRSLERA states that samples tested for static strength, residual strength, and fatigue life expectancy would occupy the same rank in the strength, residual strength, and fatigue life statistical distribution data sets.
3) The Equivalent Residual Strength Assumption (ERSA) is applied. ERSA implies that under variable amplitude loading, the spectrum is subdivided into a sequence of CA block loadings of a given extent (including one cycle), and the residual strength at the end of a block equals the strength at a consecutive one. Thus, being hampered by large scatters (typically one decade in fatigue life), the hypothesized stress interaction effects are neglected herein.
Following the analysis illustrated in Refs. [23,28], where the stress ratio, R, remained fixed at 0.1, this study re-analyzes a series of CA fatigue and residual strength literature data obtained at different stress ratios from pure tension and compression to mixed tension-compression fatigue loadings [36]. Then, the block extent's and sequence's effects on experimental lifetimes with different block loading orders and block extent are analyzed, and a residual strength-based damage rule is proposed and compared to the Miner's rule.
From the approach, the following series of fatigue response features will be discussed:
(1) The CA fatigue life cumulative distribution function (CDF) as a function of the applied maximum stress
(2) The lifetime probability density function (PDF) as a function of the number of cycles.
(3) The constant life diagram (CLD)
(4) The residual strength statistics
(5) The statistical lifetime predictions based on a strength-based damage rule accounting for the block extent and sequence effects.
The above bullets are sequentially described and compared to the experimental data in the next paragraphs, following the description of the basic principles approach.
2. Materials and Testing
The material under study, DD16, is a glass/orthopolyester laminate, which was selected among other materials from the DOE/MSU database for wind turbine applications because it produced acceptable scatter results [37]. DD16 was comprised of Owens Corning D155 (stitched unidirectional) and DB120 (stitched ± 45 ) fabrics in a [90/0/±45/0]s layup for a total of ten plies and eight layers of fabric. Plates of this material were fabricated by a resin transfer molding (RTM) process with Interplastics Corporation CoRezyn 63-AX-051 orthopolyester matrix to an average fiber volume fraction of 0.36. Static strength data in compression and tension were performed, subjecting samples to a loading rate comparable to that in fatigue tests and reported in Table 1. Constant amplitude fatigue data performed at different loading ratios of 0.1, 10, 2, and -1 are reported in Table 2 and Table 3.

Table 1.
The experimental static strength under tension and compression. The data are taken from Ref. [36].
Table 1.
The experimental static strength under tension and compression. The data are taken from Ref. [36].
| Static strength, MPa | ||
| Tension | Compression | |
| 1 2 3 4 5 6 7 8 9 10 11 12 13 14 15 16 17 18 19 20 21 22 23 24 |
625,00 657,00 658,00 658,00 661,00 664,00 665,00 665,00 673,00 674,00 675,00 678,00 680,00 683,00 684,00 685,00 686,00 691,00 701,00 705,00 |
399,48 395,82 405,49 368,34 410,54 368,21 416,44 379,01 435,09 427,49 408,58 406,71 387,75 419,75 370,86 404,78 426,97 397,16 421,48 394,64 411,15 374,45 415,66 413,70 |
Table 2.
Experimental fatigue life data under pure tension (R=0.1). The data are taken from Ref. [36].
Table 2.
Experimental fatigue life data under pure tension (R=0.1). The data are taken from Ref. [36].
| R=0.1 | |||||||
| N | σmax | N | σmax | N | σmax | N | σmax |
| 78,000 85,000 91,000 149,00 155,00 161,00 162,00 180,00 234,00 274,00 283,00 286,00 290,00 310,00 311,00 334,00 342,00 356,00 429,00 491,00 757,00 783,00 |
410,00 410,00 410,00 410,00 410,00 410,00 410,00 410,00 410,00 410,00 410,00 410,00 410,00 410,00 410,00 410,00 410,00 410,00 410,00 410,00 410,00 410,00 |
763,00 769,00 814,00 1081,0 1289,0 1306,0 1339,0 1690,0 1706,0 1722,0 1794,0 1914,0 2078,0 2297,0 2329,0 2433,0 2611,0 2620,0 3139,0 3152,0 3306,0 3744,0 4190,0 4375,0 8653,0 |
327,00 327,00 327,00 327,00 327,00 327,00 327,00 327,00 327,00 327,00 327,00 327,00 327,00 327,00 327,00 327,00 327,00 327,00 327,00 327,00 327,00 327,00 327,00 327,00 327,00 |
15680 16884 31732 31943 35109 37576 37576 37855 41493 43491 43618 54487 57742 58826 78888 89527 1,0468e+05 1,1552e+05 1,4138e+05 1,4348e+05 1,6375e+05 1,8152e+05 1,8627e+05 1,8729e+05 |
241,00 241,00 241,00 241,00 241,00 241,00 241,00 241,00 241,00 241,00 241,00 241,00 241,00 241,00 241,00 241,00 241,00 241,00 241,00 241,00 241,00 241,00 241,00 241,00 |
2,6129e+05 2,7427e+05 2,8661e+05 2,9455e+05 3,1889e+05 3,7331e+05 3,8283e+05 4,1889e+05 4,2127e+05 4,3819e+05 4,9540e+05 4,9635e+05 5,4453e+05 5,8837e+05 5,9861e+05 6,9745e+05 7,3287e+05 1,1376e+06 |
207,00 207,00 207,00 207,00 207,00 207,00 207,00 207,00 207,00 207,00 207,00 207,00 207,00 207,00 207,00 207,00 207,00 207,00 |
Table 3.
Experimental fatigue life data under pure compression (R=10) and prevailing compression (. The data are taken from Ref. [36].
Table 3.
Experimental fatigue life data under pure compression (R=10) and prevailing compression (. The data are taken from Ref. [36].
| R=10 | R=2 | ||||||
| N | σmax (MPa) | N | σmax (MPa) | N | σmax ((MPa) | N | σmax (MPa) |
| 4861,0 55555 60035 1,1189e+05 1,7397e+05 5,7736e+05 62837 7,4481e+05 93249 9,3635e+05 9,0210e+05 1,3140e+07 1,8148e+07 1,9627e+06 2,1083e+07 |
-178,42 -182,78 -178,27 -182,08 -180,64 -144,85 -148,49 -146,81 -146,24 -146,31 -110,25 -110,94 -111,68 -111,28 -114,45 |
3335,0 3215,0 1035,0 1305,0 5325,0 4145,0 4325,0 10185 3265,0 3635,0 1,1608e+05 59035 40625 44095 51225 1,5393e+05 38495 82875 24625 1,0692e+05 43525 27265 24685 19565 50095 |
-335,37 -333,46 -325,19 -323,79 -322,94 -322,88 -322,83 -322,72 -322,67 -322,39 -280,47 -279,74 -277,77 -277,70 -277,27 -277,22 -277,19 -276,95 -276,81 -276,54 -276,42 -276,36 -276,04 -275,39 -259,09 |
21240 5,4873e+05 6,7972e+05 1,1738e+05 3,6657e+05 14172 11145 3,7906e+06 92345 67035 1,8841e+07 9,3307e+06 1,5087e+07 1,6807e+06 4,8795e+06 1,0372e+07 1,4646e+07 8,4254e+06 1,5057e+07 1,8598e+07 1,7471e+07 2,0219e+07 2,0508e+06 1,9803e+07 2,3530e+06 |
-245,30 -243,89 -243,15 -243,14 -242,98 -242,94 -242,84 -242,60 -242,46 -241,37 -216,49 -216,39 -215,17 -214,46 -211,49 -209,86 -209,11 -208,50 -208,16 -208,10 -208,09 -208,03 -207,93 -207,90 -207,49 |
4,6303e+05 4,8990e+05 6,2258e+05 1,3073e+06 1,5840e+06 1,6240e+06 1,9259e+06 4,0000e+06 2,7000e+07 |
-280,58 -273,84 -274,67 -275,92 -279,27 -280,91 -275,89 -273,41 -242,36 |
Table 4.
Estimated model parameters under pure tension and compression, Equation (3), and the static strength's Weibull scale and shape parameters.
Table 4.
Estimated model parameters under pure tension and compression, Equation (3), and the static strength's Weibull scale and shape parameters.
| DD16 | α | β | γ (MPa) | δ | |
| Pure tension Prevailing tension |
R=0.1; R=0.3; R=0.5; R= 0.7 R=-0.4; R=-0.62 |
1.0957 | 0.0886 | 661 | 19.5 |
| Pure compression Prevailing compression |
R=10; ; ; ,; |
0.54 | 0.068 | 413 | 22 |
3. Analytical Background
Under uniaxial and constant amplitude (CA) loadings, and ignoring the environmental and frequency conditions, the residual strength, can be expressed in its implicit form as a function of the static strength, the current loading cycle, n, the maximum applied stress, and the loading ratio, :
Fixing the loading conditions, namely, , failure occurs when the residual strength degrades to ,
where N is the number of cycles to failure, and Equation (2) is the fatigue life formulation, namely the limiting case of the residual strength equation. The stochastic nature of fatigue implies that , are statistical variables. Equation (2), in its explicit form, represents the deterministic formulation to fit the experimental CA fatigue data generally reported as as a function of the cycles to failure, N, given the loading ratio, R. Yang and Liu (17) proposed a strategy to implement the fatigue life deterministic formulation in a statistical framework by debiting the fatigue life scatter to the static strength data scatter, originating the Strength-Life Equal Rank assumption (SLERA). Caprino and D'Amore (10, 18) followed the approach, which is briefly resumed herein.
The two-parameter Caprino's fatigue life formulation [10] was adopted to model the experimental CA data (but any other formulation is suitable within the theoretical development):
where , , N and R are already defined, and α and β are the model parameters.
In our approach framework, the static strength data are fatigue data of samples that failed within one cycle (provided they are obtained at the loading rate adopted in fatigue), so that they are included in the regression analysis to recover the model's parameters α and β, of Equation (3).
The two-parameter Weibull distribution function expresses the static strength:
where is the cumulative distribution function (CDF), P is the probability to find and δ and γ are the shape and the scale factors, respectively. Once the parameters α and β are obtained from Equation (3), and the shape and scale factors, δ and γ, are recovered from the Weibull distribution of the static strength, from Equations (3) and (4) it follows that:
where represents the theoretical cumulative distribution function of the number of cycles to failure, given , and R. Comparing Equations (4) and (5), it can easily be recognized that longer lifetimes, N, correspond to stronger samples, the SLERA.
The approach was applied to several experimental CA data sets in the literature concerning different materials, from random-continuous to short glass fiber composites to glass/polyester and high-performance carbon/epoxy laminates [10,11,18]. With a minimum number of experimental tests, the model accurately reproduces the S-N curve and the probability of failure under assigned loading conditions.
4. Results and Discussion
4.1. Constant Amplitude (CA) Fatigue Modeling
The CA fatigue data under pure tension and compression with equivalent stress ratios R=0.1 and R=10, respectively, are plotted in Figure 1 with corresponding curve fitting based on Equation (3). It should be noted that Equation (3) is formally identical in tension and compression fatigue provided R is substituted by 1/R under pure compression when 1<R<∞. The results indicate the different material behavior under tensile and compressive loading at low cycle regimes until around 104 cycles lifetime. Then, the material appears to be more vulnerable to tensile loading patterns.
With the parameters fixed in tension and compression (Table 4), the fatigued samples' theoretical distribution of virgin strength, , can be recovered from the experimental fatigue life data, N, reported in Table 2 and Table 3, utilizing Equation (3). The results are compared with the experimental data in Table 1 for self-consistency and reported in Figure 2, where a reasonable superposition of the strength's experimental and calculated cumulative distribution functions (CDF) can be recognized.
Also, based on the tension and compression model parameters α and β, and the scale and the shape factor of the static strength distribution, γ and δ, reported in Table 4, respectively, the statistical distribution of the fatigue life under given and R, can be predicted using Equation (5). Figure 3 illustrates the quality of the statistical lifetime predictions at R=0.1 and R=10 compared to the experimental data taken at different applied peak stresses.
From Equation (5), it follows that the statistical lifetime's shape parameters are algebraically constant. As a physical consequence, the scatter at different peak stresses is the same, indicating a uniform damage progression that develops at different timescales according to the loading severity. This primary result opposes Bedi and Chandra's (37) report on pultruded glass/polyester and glass/epoxy composites with a higher volume fraction of fibers. Different failure modes were observed at low and high fatigue stress levels for both the materials investigated in their study, establishing different damage mechanisms. Gamsted and Sjögren [38] also refuted using the SLERA for the particular case of cross-ply laminates subjected to tension-compression loadings.
Moreover, the model parameters recovered by best fitting the fatigue data under pure compression, R=10 (the counterpart of fatigue data under pure tension at R=0.1), remain fixed to predict the responses at , a mixed compression/tension loading with prevailing compression, and , a pure compression loading less severe than R=10, as shown in Figure 4. The correlation coefficients φ=0.93, 0.97, and 0.98 for , 10 and 2, respectively, reveal the goodness of fit. Indeed, the approach inherently assumed that the model parameters are independent of the stress ratio, R, a case that can verified by rewriting Equation (3) as follows:
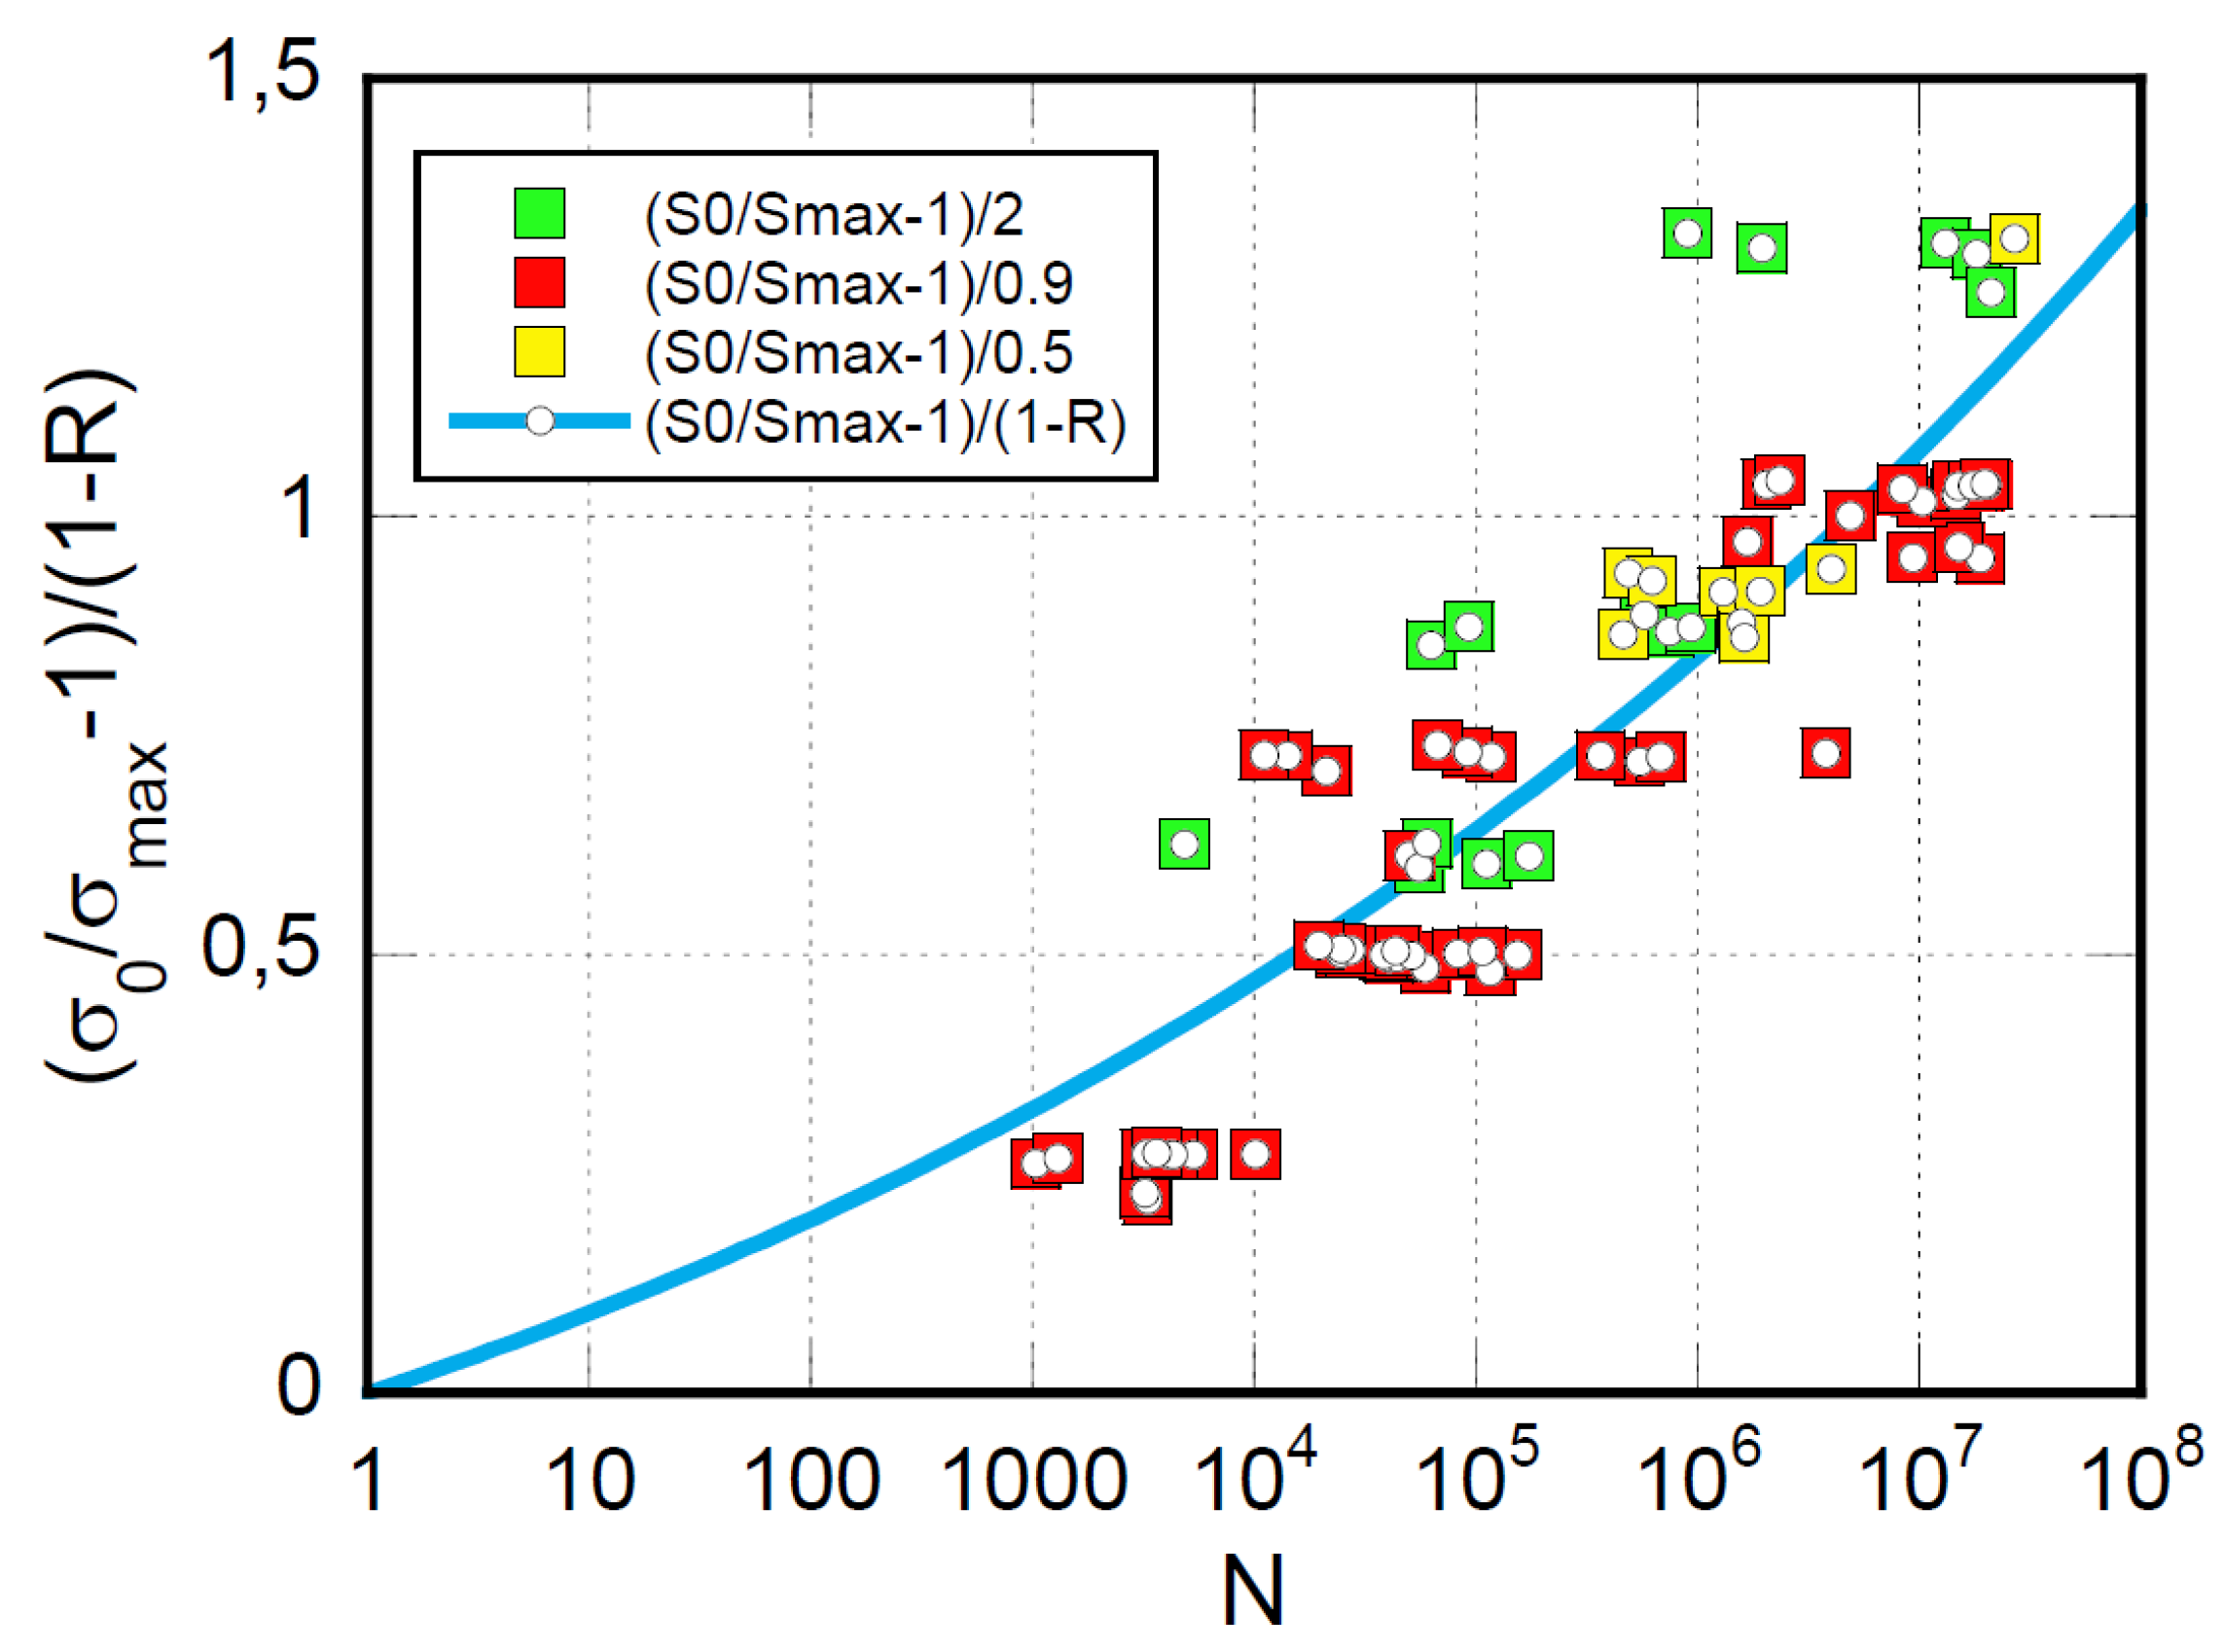
Pooling the fatigue data at R=10, -1, and 2 and reporting the left side of Equation (6) as a function of the number of cycles to failure, N, all the data should fall on a single curve passing through the origin, as shown in Figure 5. Please notice that, in Equation (3) and Equation (6), R is replaced by 1/R for pure compression, namely , and the factors () become 2, 0.9, and 0.5, for
respectively, as indicated in the inset. Applying Equation (6) results in a global correlation coefficient of φ=0.87, witnessing that the model parameters are acceptably loading ratio-independent, at least for the range of the loading ratios under study.
Figure 3.
Experimental fatigue life data under pure compression, R=10, (left) and tension, R=0.1, (right) at different maximum stresses as indicated in the insets. Curves are the predictions based on Equation (5).
Figure 3.
Experimental fatigue life data under pure compression, R=10, (left) and tension, R=0.1, (right) at different maximum stresses as indicated in the insets. Curves are the predictions based on Equation (5).
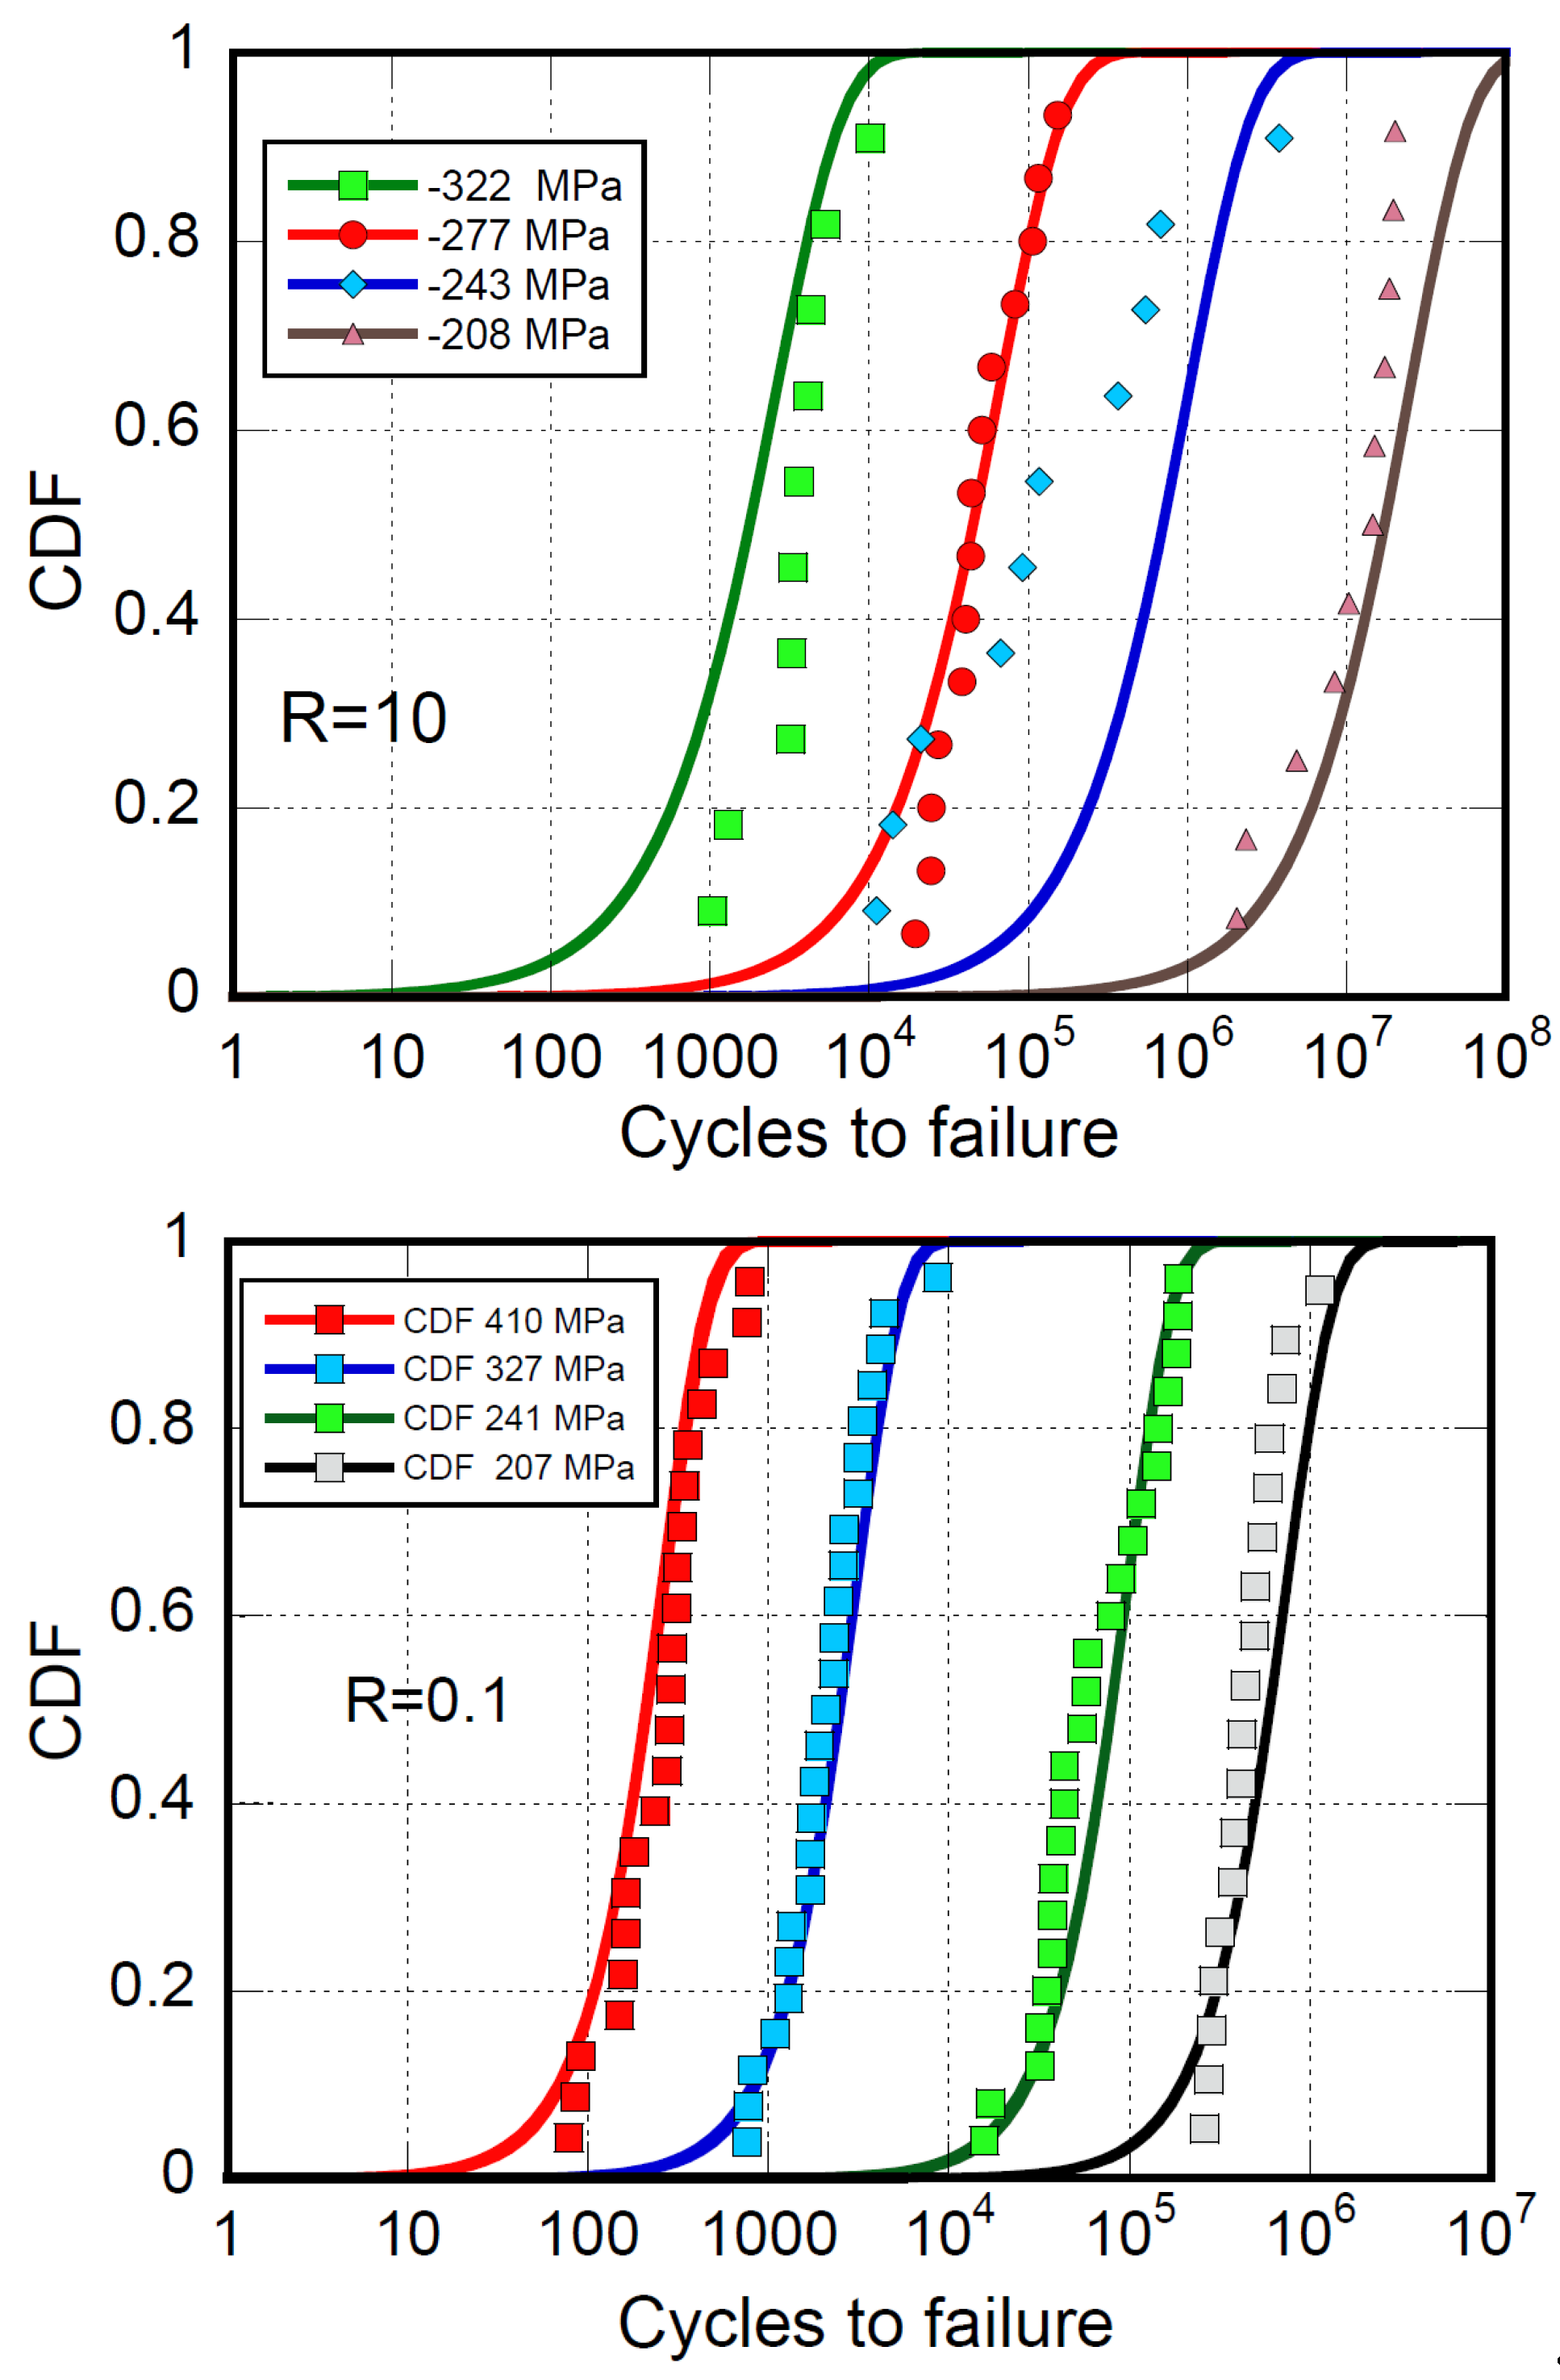
Figure 4.
Experimental fatigue life under pure compression (R=10 and R=2) and prevailing compression loadings (). Model fitting and predictions are based on Equation (3).
Figure 4.
Experimental fatigue life under pure compression (R=10 and R=2) and prevailing compression loadings (). Model fitting and predictions are based on Equation (3).
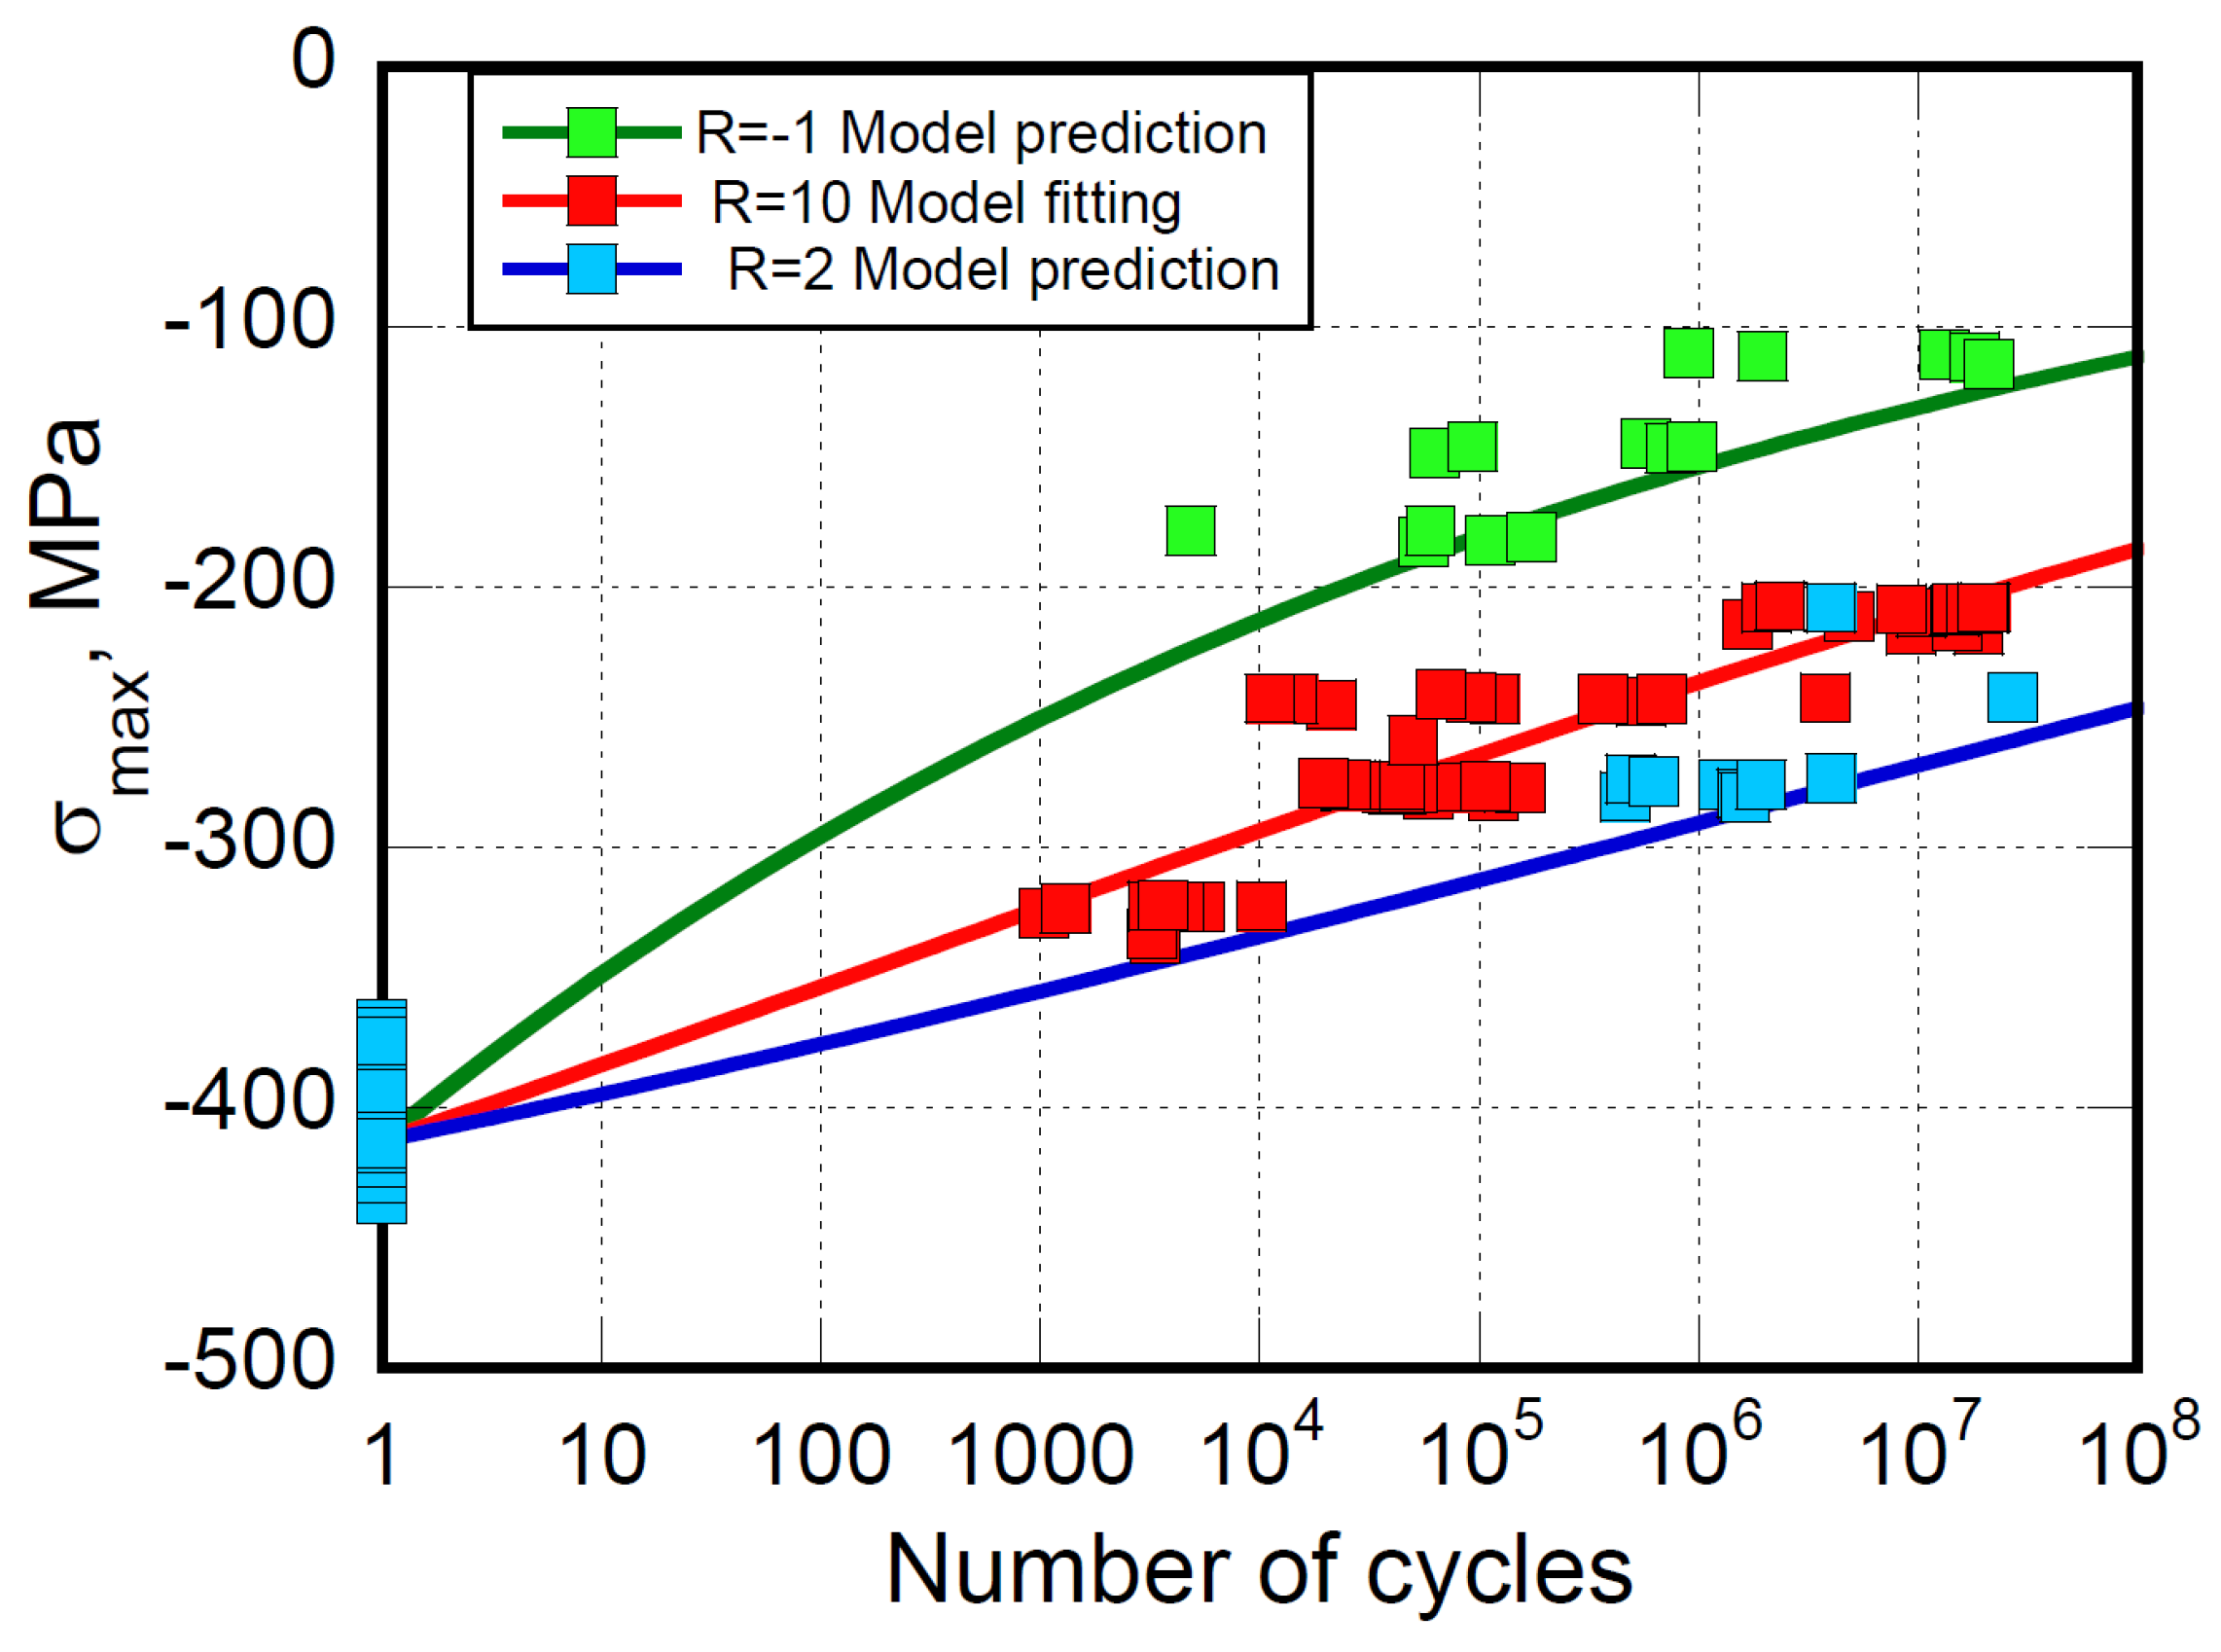
Figure 5.
The experimental fatigue data are normalized based on Equation (6).
From Equation (5), the probability density function (PDF) at a given elapsed cycle, n, as a function of the maximum applied stress, can be obtained as follows:
The theoretical PDF as a function of peak stress at different elapsed cycles for pure compression fatigue loading at R=10 is reported in Figure 6. In the framework of our approach, the probability of failure during any fatigue cycle is not constant, in contrast to the fatigue formulation proposed by Kassapoglou [39], where the probability of failure during any fatigue cycle was assumed theoretically constant and equal to the probability of failure under static loading.
Interestingly, based on Equation (3), Figure 7 reports the experimental compression strength and the virgin strength calculated from fatigue life data obtained at , namely a mixed tension/compression loading. As expected, the calculated strength does not superpose the experimental strength data, contrary to what was observed in Figure 2. Several implications may justify the limited accuracy of the predictions, which may appear as a fault of the modeling approach. First, static strength is, by definition, a property measured under a monotonic loading pattern, tension, or compression, so it cannot represent the tension/compression fatigue data () at one cycle. Also, let us recall that, for many composite materials, the symmetry reflected by is only numerical, the loading being more severe in compression than in tension. For the case under study, the characteristic monotonic strength in tension and compression are 661 and 413 MPa, respectively, and the symmetry of mixed loading can be recovered at the critical loading ratio, . Thus, the counterpart strengths of tension/compression fatigue data at one cycle are those compression strengths measured after samples are somewhat loaded (and damaged) in tension. Discussion around the subject is rather involved and left to a future paper. It can only be mentioned that, in the framework of the present approach, the nominal strength (namely, the fatigue life at one cycle) under mixed tension/compression loadings should be lower than under pure compression, as shown in Figure 7. This aspect is accounted for in the next paragraph.
4.2. Constant Life Diagram (CLD)
CLDs represent the combined effect of mean stress and material anisotropy on the fatigue life of composite material. They are used as a predictive tool for estimating the fatigue life of the material under loading patterns differing from the experimental ones [40,41,42]. However, extrapolating the CA data to spectrum loadings, generally assuming linear or simplified cumulative damage, is challenging, if not an erroneous practice. Primary because the approach used for variable amplitude life estimates employs Miner's Rule [26,40,41,42], sometimes based on cycle counting methods, reducing a complex loading spectrum into simplified sequences of ascending or descending load cycles to facilitate fatigue analysis. The cycle counting methods do not account for cycle-by-cycle sequence effects, such as overloads or underloads, which can either accelerate or retard damage accumulation. Thus, CLDs allow a rough estimate of fatigue life. An algebraic construction of CLDs with a similar defective representation of reality can be obtained based on Equation (3), as follows.
Under uniaxial loadings, Equation (3) mandatorily requires different parameters set under pure tension or compression, namely when 0≤R<1 and ∞ > R > 1, since, in composite materials, the strength in compression, , is lower than in tension, , and tension and compression fatigue loadings determine completely different damage mechanisms and fatigue sensitivity, as shown in Figure 1. Controversies arise when tension/compression loadings are in order, namely when R<0. In that case, the turning point is the critical compression-to-tension strength ratio, . In our calculations, it is assumed that at loading ratios above and below fatigue failure occurs due to the prevailing damage modes in tension and compression, respectively, despite the development of a mix of fatigue damage mechanisms. This conjecture helps reduce the model parameters, at any loading ratio, to those recovered from fatigue data obtained under uniaxial tension or compression. The hypothesized cycle-mix effects are ignored in this framework.
The algebraic construction of CLD can be obtained by recovering. , the amplitude and mean stresses from Equation (3), as follows:
With N ranging from 100 to 106, cycles, the results are reported in Figure 8. The diagram shows a turning line corresponding to the critical aspect ratio, Rc. The right and left side points represent CA fatigue data at different stress ratios (R), calculated by fixing the model parameters (α and β), as reported in Table 4 and recovered from the experimental data under pure tension and compression (R=0.1 and R=10, respectively). However, despite the predictions are reasonable under pure compression when R=10 R=2 and 2, and mixed tension/compression, , as shown in Figure 4, uncertainties arise at the critical stress ratio, Rc, and close to it, where failure may occur in tension or compression depending on the kinetics of damage progression under mixed modes loading. Thus, predictions at the critical stress ratio were performed using the parameters obtained under pure tension and compression. CLDs are redundant once formulations like Equation (3) express analytically, and with some accuracy, the dependence of CA fatigue response on the stress ratio, R. Thus, Figure 8 represents purely theoretically predicted data, except for R=10 and R=0.1. It includes oversimplifications depending on the linear dependence of the fatigue response on the loading ratio. As mentioned, the strengths under mixed modes loadings (namely, the fatigue behavior at one cycle) are sensibly lower than those represented, so in the domain around the critical loading ratio, Rc, the contour lines should not be straight, as was well represented by Boestra [42]. However, his multi-slope model required seven parameters, and it loses accuracy for very low numbers of cycles, ignoring the static strength. Indeed, it was stated that fatigue has nothing to do with static strength, which is the opposite of our approach, where the static data represents the fatigue data at one cycle. To this end, let us mention that by recovering the virgin strength of fatigued samples under mixed mode tension/compression loading, the mean and alternate stress can be easily re-calculated, sensibly lowering their corresponding values represented in Figure 8. The argument can be tackled writing a mathematical routine, an issue left to a forthcoming paper. Still, the approach framework lends itself to describing CLD diagrams analytically.
4.3. Residual Strength
The Caprino's original model adopted so far was unreliable in predicting the residual strength [43] despite being derived from precise strength degradation law. D'Amore et al. [11] discussed this inconvenience by postulating a statistical correspondence between static strength, fatigue life, and residual strength distribution functions using the same fatigue life formulation. In Ref. [29], it was hypothesized that, given and R, after a given number of cycles, n, the percentile strength degradation function, , shares the same functional form of Equation (4) and Equation (5) as follows:
where is the amount of degraded strength at the current cycle, n, is the total amount of strength degradation (from the static strength to the peak stress), and is the characteristic decay strength defined below. The schematic of residual strength evolution for a generic sample and the phenomenology behind Equation (10) is illustrated in Figure 9.
Equations (4), (5), and (10) represent the cornerstone of the approach.
Equation (10) can be rearranged as follows:
From Equation (11), the strength of the generic sample, , degrades with a "sudden drop" modality towards the maximum applied stress, .
Also, let us recall that is a statistical variable; therefore, the statistical distribution of residual strength, under fixed loading conditions, namely and R, can be obtained from Equation (10) at any cycle, n. As a consequence, under CA loading, all the residual strength data should be confined between the degradation curves starting from the extreme tails of the static strength distribution function, .
Depending on the selected level of confidence (in practice, failure occurs when the left side of Equation (10) is set to or Equation (11) can be rearranged to obtain the decay strength:
The experimental and calculated residual strength data under pure tension fatigue loading ( at different elapsed cycles are reported in Figure 10. According to the theoretical expectations, the experimental data are confined between the strength degradation curves starting from the extreme tails of the static strength distribution and falling at the extreme tails of the fatigue life distribution when the residual strength equals the maximum applied stress, . Similarly, residual strength data and the corresponding theoretical domains are reported in Figure 11 for pure tension loading at different applied maximum stress, namely = 414, 325 and 207 MPa. Again, the sparse data are well confined within the domains described by the corresponding upper and lower-bound degradation curves.
The theoretical residual strength cumulative distribution function can be recovered at any cycle, according to Equation (10). Figure 12 reports the CDF of residual strength at different elapsed cycles of samples fatigued under CA (. In the first decades of the elapsed cycles, the CDFs practically coincide with the static strength and are not reported for convenience, and with the cycle progression, the distribution widens towards lower strengths until the CDF truncation occurs at longer elapsed cycles, as some weaker samples had progressively failed.
4.4. Variable Amplitude (VA) Modeling
Under variable amplitude loadings, we assume that the stress history consists of a sequence of block loadings of arbitrary extent, ni, with 1 ≤ i ≤ ntot, maximum stress, ϭmaxi, and loading ratio, Ri.
The method to evaluate the residual strength evolution for an arbitrary loading history is schematically reported in Figure 13 for high-to-low (H-L) and low-to-high (L-H) three-block loading. The CA residual strength curves, Equation (11), are drawn as baseline behavior under the loading conditions, namely R and . For simplicity, the fatigue and residual strength curves are drawn assuming R=0.1. Based on the CA strength degradation baselines, passing from one block to another implies the assumption that the residual strength at the end of a block loading equals the residual strength at the start of the successive one (ERSA). Yang and Jones proposed the shifting procedure [34] and applied it to block loading experiments of cross-ply E-glass/epoxy specimens to replace the Miner's sum with the residual strength concepts.
From the Equation (11) application, the shifting procedure based on ERSA was elaborated analytically [29] and reported here for convenience:
where is the fictive number of cycles after i-blocks to be defined in what follows (please notice that for i=1, m1=n1), is the residual strength after cycles at (or, equivalently, the residual strength after the i-th block loading) and is the number of cycles to get the same residual strength, , when the maximum applied stress is . Then, the "effective number of cycles" , namely, the equivalent number of loading cycles necessary to produce the same strength loss on passing from a block loading to the successive one, can be calculated from Equation (13) and takes the following form:
Thus, the residual strength at the end of the subsequent block can be calculated as follows:
with
Irrespective of the spectrum complexity, the shifting procedure can be applied cycle-by-cycle, given the arbitrary extent of the block loadings.
From the above analytical development, it follows that the damage accumulates as the sum of the relative amounts of strength "consumed" along each block loading, so the explicit damage accumulation rule takes the following general form:
In the SRSLERA and ERSA framework, analyzing Figure 13, the H-L sequence is more damaging, with the strength at the end of the loading sequence being much lower than the L-H sequence. Also, applying Equation (17), the H-L and L-H damage values are DH-L=0.84 and DL-H=0.73, respectively. A somewhat different result arises by applying the Miner's rule:
where ni is the block extent and Ni is the number of cycles to failure.
For the case illustrated in Figure 13, the number of cycles to failure, Ni, are 600, 10,000, and 300,000, and the block extents, ni, are 200, 2000, and 20000 cycles, at 414, 325, and 241 MPa, respectively, so the damage calculated by Miner's rule (MR) in ascending and descending sequences is DMR=0.60.
The fact that the H-L sequence was the most detrimental was theoretically confirmed for a similar material [23], reducing a random spectrum of 22 loading blocks to ascending and descending sequences. The response to the repeated random spectrum sequences until failure remained confined between the responses to ascending and descending spectra, and the descending spectrum was the most devastating. However, the obtained fatigue features are limited to the oversimplified assumptions so far described: the effect of load sequence on the fatigue life of composite materials being complex and highly dependent on specific material systems and loading conditions. At the same time, if the L-H sequences are more devastating than H-L, then the material does not belong to the category obeying the SRSLERA and ERSA. In some cases, the CA fatigue curve exhibits a bimodal progression with the number of cycles, indicating a change in damage modes at high and low applied stress levels [32,44]. This is particularly evident in cross-ply [15] and [±35]s [45] laminates. Therefore, it is crucial to consider the specific context when evaluating fatigue life and not generalize the effects of loading sequences across all composite materials.
Furthermore, the SRSLERA and ERSA approach cannot discriminate the hypothesized stress interaction effects [32,33,34], namely the transitions from low- to high-stress levels and vice versa. A few data on the matter, with sound statistical significance, are available in the literature. Wahl [36] analyzed the lifetime responses to two-block testing to study both the effect of a simple spectrum on fatigue and the sequencing of cycles within the spectrum. Testing the sequence effect involved applying ten cycles of high-stress level ( within 1000 cycles of a lower stress level ( until failure. Three cases were chosen: 1) one high amplitude cycle followed by 100 low; 2) ten high amplitude cycles followed by 1000 low; and 3) ten high amplitude cycles randomly interspersed within 1000 low. 82 two-block and 38 constant amplitude tests were performed for R = 0.1. No significant differences were found among the resulting statistical lifetimes, appearing almost superposed. Thus, it was unclear whether the cycle-mix effect is irrelevant to the material or whether the widespread statistical results mask it. Our simulations on the same material subjected to the same loading conditions are reported in Figure 14. Based on the model's parameters, α and β, and the Weibull static strength parameters, γ and δ (Table 4), the statistical lifetimes for each loading sequence were predicted by selecting 30 equispaced values from the static strength distribution and applying the procedure described in Equations (13)–(16) cycle- by- cycle. The routine was stopped, and the sample virtually failed when the percentile residual strength function, Equation (10), degraded to =0.95 in the vicinity of 325 MPa. The responses to the three different two-block loadings are practically indistinguishable and intermediated between the CA lifetimes, as experimentally found. Additional two-block results were obtained by increasing the extent of high to low block cycles to 10/100, revealing that the lifetimes shift towards the high amplitude CA response and highlighting the block extent effect on two-block repeated loadings.
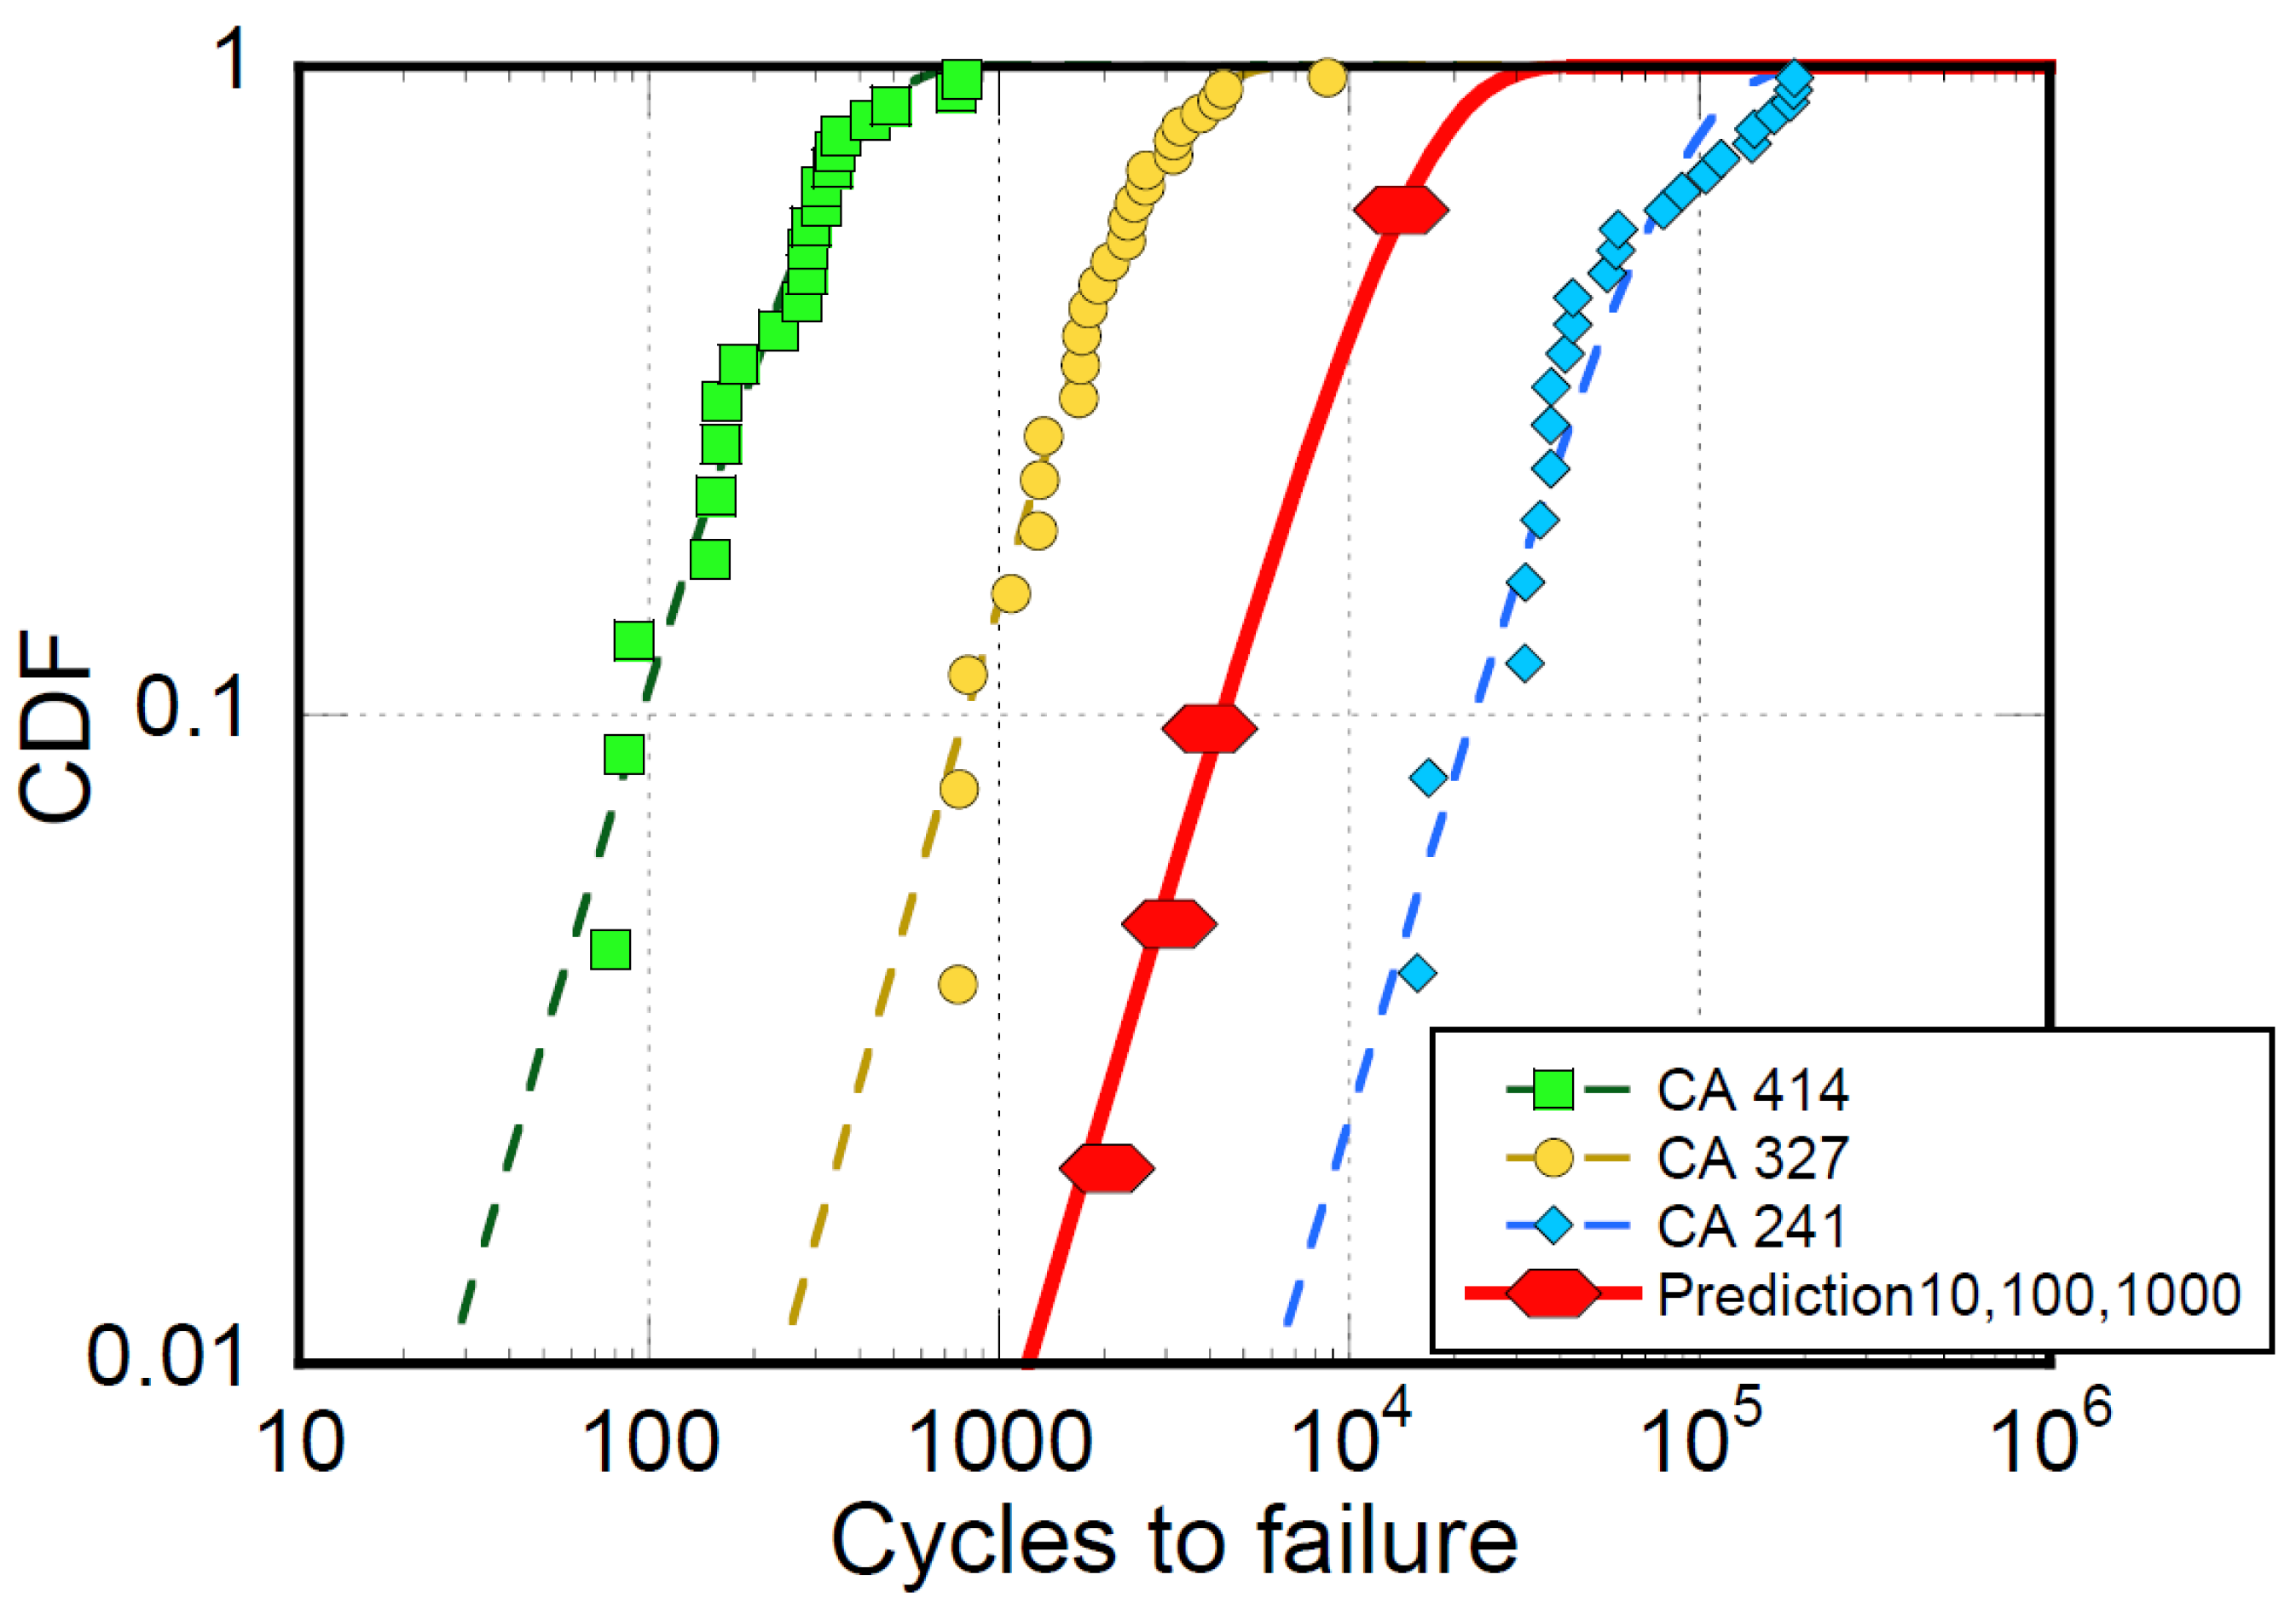
Figure 15 reports the prediction of the statistical lifetimes on the same material subjected to repeated three-block loadings consisting of ten cycles at 414 MPa, 100 cycles at 325 MPa, and 1000 cycles at 235 MPa. It is shown that by changing the order sequence of blocks, apart from the first triplet, the approach correctly predicts that the effect of block sequence is lost on repeated three-block loadings.
5. Conclusions
The SRSLERA and ERSA depict an ideal behavior of composite materials subjected to fatigue loadings. In that case, the static strength Weibull's shape and scale parameters and the fatigue formulation parameters, recovered under pure compression or tension loadings, represent the fingerprint of composite materials subjected to uniaxial fatigue loadings and characterize their unicity. The experimental results can be statistically treated, ranging from pure tension to compression to mixed tension-compression, for CA and VA fatigue data. The material under study perfectly fits the SRSLERA and ERSA, so from the theoretical development of the approach, a series of response features of composite materials subjected to fatigue loads are obtained and summarized as follows:
1) Under pure tension or compression fatigue loadings, the static strength data are fatigue data where failure occurs within one cycle (provided they are obtained at the fatigue loading rate).
2) The scatter in fatigue life is recovered from the scatter in static strength; thus, the statistical lifetime's shape parameters, at different applied maximum stresses, are constant from the algebraic development. As a physical consequence, a uniform damage progression develops at different timescales according to the loading severity.
3) The probability density function (PDF), namely the probability of failure during any fatigue cycle, is not constant, evolving to sharp distributions at longer cycles.
4) Under mixed tension/compression loadings, the static strength, namely the fatigue life at n=1, does not coincide with the static strength under monotonic tensile or compressive strength.
5) During fatigue loadings, the strength degrades monotonously with a "sudden drop" modality towards the maximum applied stress, . As a consequence of the SRSLERA, under CA loading, all the residual strength data should be confined between the degradation curves starting from the extreme tails of the static strength distribution function, .
6) Under VA loading, the H-L sequence is more devastating than the L-H one, based on the ERSA. The effects of block extent and sequences can be recovered. The response to complex random loadings can be evaluated analytically and relies on the CA fatigue responses.
All the above features cannot fit the responses of composites where different damage mechanisms are recognized at low- and high-stress levels during fatigue. In that case, the large variability of experimental data necessitates more in-depth investigations to establish a general relationship for predicting fatigue life under spectrum loading. In the framework of SRSLERA and ERSA the static strength and the CA fatigue life statistics are only required. Even depicting an ideal and simplified material's behavior, the SRSLERA and ERSA can complement mechanistic approaches, which rely on physical principles to predict fatigue life. A hybrid approach, where a mechanistic model is corrected or supplemented by phenomenological residual strength degradation laws, can yield more accurate and computationally feasible predictions for fatigue life under variable amplitude loading, which is the subject of our following paper.
Author Contributions
Conceptualization, Alberto D'Amore; Methodology, Alberto D'Amore; Software, Luigi Grassia; Validation, Luigi Grassia; Formal analysis, Alberto D'Amore; Writing – original draft, Alberto D'Amore.
Data Availability Statement
The original contributions presented in this study are included in the article/supplementary material. Further inquiries can be directed to the corresponding author(s).
References
- Halpin J. C., Requirements for certification of composite airframes: historical evolution Wiley Encyclopedia of Composites (Eds. Luigi Nicolais and Assunta Borzacchiello) ISBN: 978-0-470-12828-2 May 2012.
- Halpin J.C. , Johnson T.A., and. Waddoups M.E.,, Int. J. Fracture Mech., 8 (1972) 465.
- K.L. Reifsneider Ed. Fatigue of Composite Materials, Elsevier Publ., New York, 1990.
- A.P. Vassilopoulos , T. Keller (Eds.) "Fatigue of Fiber-reinforced Composites "Springer (2013) ISBN-10: 1447126947.
- A.P. Vassilopoulos, The history of fiber-reinforced polymer composite laminate fatigue, Int. J. Fatigue 134 (2020). [CrossRef]
- Van Paepegem W, Degrieck J. A new coupled approach of residual stiffness and strength for fatigue of fibre-reinforced composites. Int J Fatigue 2002;24(7):747–62. [CrossRef]
- Yutong Fu, Xuefeng Yao A review on manufacturing defects and their detection of fiber reinforced resin matrix composites Composites Part C: Open Access 8 (2022) 100276.
- Sendeckyj, G. P., Life prediction for resin-matrix composite materials. In Fatigue of Composite Materials, ed. K. L. Reifsneider. Elsevier Science Publishers, 1990, pp. 431-83.
- Kassapoglou C. Fatigue life prediction of composite structures under constant amplitude loading. J Compos Mater 2007;41(22):2737–54.
- D'Amore, G. Caprino, P. Stupak, J. Zhou, L. Nicolais, Effect of stress ratio on the flexural fatigue behavior of continuous strand mat reinforced plastics, Science and Engineering of Composite Materials 5, 1-8 (1996).
- D'Amore A., Giorgio M., Grassia L., Modeling the residual strength of carbon fiber reinforced composites subjected to cyclic loading. Int. J. Fatigue 78, 31–37 (2015).
- Hahn H. T. and Kim, R. Y. 'Proof testing of composite materials' J Comp Mater9 (1975) pp 297-311.
- Chou P.C., Croman R., 'Residual strength in fatigue based on the strength-life equal rank assumption', Journal of. Composite Materials (1978), 12, pp. 177-194.
- Barnard P. M., Butler R. J. and Curtis P. T., The Strength-Life Equal Rank Assumption and its application to the fatigue life prediction of composite materials Int J Fatigue10 No 3 (1988) pp 171-177.
- Gamstedt, E. K. and Sjögren, B. A. (2002) An experimental investigation of the sequence effect in block amplitude loading of cross-ply laminates. Int. J. Fatigue 24, 437-446.
- Hashin Z. Cumulative damage theory for composite materials: residual life and residual strength methods. Compos. Sci. Technol. 1985;23:1–19.
- Yang J.N., Liu M.D., Residual strength degradation model and theory of periodic proof tests for graphite/epoxy laminates. J Compos. Mater. 1977;11:176–203.
- Caprino, G., & D’Amore, A. (1998). Flexural fatigue behavior of random continuous-fibre-reinforced thermoplastic composites. Composites Science and Technology, 58(6), 957–965.
- Philippidis TP, Assimakopoulou TT, Antoniou AE, Passipoularidis VA, Residual Strength Tests on ISO Standard ± 45_ Coupons, OB_TG5_R008_UP, July 2005. Available from: http://www.kcwmc.nl/optimatblades/Publications.
- Passipoularidis, V.A., Philippidis, T.P., Strength Degradation due to Fatigue in Fiber Dominated Glass/Epoxy Composites: A Statistical Approach, Journal of Composite Materials 04/2009; 43(9):997-1013.
- Tserpes K.I., Papanikos P., Labeas G., Pantelakis Sp., Fatigue damage accumulation and residual strength assessment of CFRP laminates, Composite Structures 63 (2004) 219-230.
- D'Amore, A.; Grassia, L.The Fatigue Response's Fingerprint of Composite Materials Subjected to Constant and Variable Amplitude Loadings. J. Compos. Sci. 2024, 8, 11. [CrossRef]
- D'Amore, A., Grassia, L., A method to predict the fatigue life and the residual strength of composite materials subjected to variable amplitude (VA) loadings Composite Structures Volume 228, 15 November 2019, 111338 . [CrossRef]
- D’Amore, A., Califano, A., Grassia, L. (2021). Modelling the loading rate effects on the fatigue response of composite materials under constant and variable frequency loadings. International Journal of Fatigue, 150, 106338. [CrossRef]
- A.D'Amore, L. Grassia, Phenomenological approach to the study of Hierarchical damage mechanisms in composite materials subjected to fatigue loadings, Compos. Struct. 2017, 175, 1–6. [CrossRef]
- Miner, M. A., "Cumulative Damage in Fatigue," Journal of Applied Mechanics, Sept., 1945.
- Whitworth HA. Cumulative damage in composites. J. Eng. Mater. Technol. 1990; 112:358–61.
- D'Amore, A.; Grassia, L. Comparative Study of Phenomenological Residual Strength Models for Composite Materials Subjected to Fatigue: Predictions at Constant Amplitude (CA) Loading. Materials 2019, 12, 3398. [CrossRef]
- D'Amore, A.Grassia, L. Statistical Lifetime of Composites Subjected to Random and Ordered Block Loadings, Fatigue and Fracture of Engineering Materials and Structures, 2025, 48(1), pp. 359–370.
- Wahl, Neil. Samborsky, Daniel, Mandell, John, Cairns, Douglas, "Spectrum FatigueLifetime and Residual Strength for Fiberglass Laminates in Tension," A Collection of the 2001 ASME Wind Energy Symposium, American Institute of Aeronautics and Astronautics, Inc. and American Society of Mechanical Engineers, 2001, pp. 49- 59.
- Philippidis, T. P., & Vassilopoulos, A. P. (2004). Life prediction methodology for GFRP laminates under spectrum loading. Composites Part A: Applied Science and Manufacturing, 35(6), 657–666. [CrossRef]
- Schaff, J.R. and Davidson, B.D. (1997). Life prediction methodology for composite structures. Part I -Constant amplitude and two-stress level fatigue. Journal of Composite Materials, 31(2), 128-157.
- Schaff, J.R. and Davidson, B.D. (1997). Life prediction methodology for composite structures. Part II -Spectrum fatigue. Journal of Composite Materials, 31(2), 158-181.
- Yang JN, Jones DL. Load sequence effects on the fatigue of unnotched composite materials. In: Lauraitis KN, editor. Fatigue of fibrous composite materials. 100 Barr Harbor Drive, PO Box C700, West Conshohocken, PA 19428-2959: ASTM International; 1981, p. 213–32. [CrossRef]
- Adam T, Gathercole N, Reiter H, Harris B. Life prediction for fatigue of T800/5245 carbon-fibre composites: II. Variable-amplitude loading. Int J Fatigue 1994;16(8):533–47. [CrossRef]
- Wahl, N.K., 'Spectrum fatigue lifetime and residual strength for fiberglass laminates',.
- Ph.D. Thesis, Montana State University, Bozeman, 2001.
- Bedi R., Chandra R., "Fatigue-life distributions and failure probability for glass-fiber reinforced polymeric composites" Composites Science and Technology 69 (2009) 1381–1387.
- Gamsted E.K, and Sjögren B.A., Micromechanisms in tension-compression fatigue of composite laminates containing transverse plies, Composites Science and Technology 59 (1999) 167-178.
- Kassapoglou, C. Fatigue life prediction of composite structures under constant amplitude loading, J Compos Mater, 2007; 41(22): 2737–2754.
- Kawai M, Koizumi M. Nonlinear constant fatigue life diagrams for carbon/epoxy laminates at room temperature. Compos: Part A 2007;38(11):2342–53.
- Harris B. A parametric constant-life model for prediction of the fatigue lives of fibre-reinforced plastics. In: Harris B, editor. Fatigue in composites. Woodhead Publishing Limited; 2003. p. 546–68.
- Boerstra GK. The multislope model: a new description for the fatigue strength of glass reinforced plastic. Int J Fatigue 2007;29(8):1571–6.
- Caprino G., D'Amore A., Fatigue Life of Graphite/Epoxy Laminates Subjected to Tension-Compression Loadings, Mechanics of Time-Dependent Materials 4: 139–154, 2000. © 2000 Kluwer Academic Publishers. Printed in the Netherlands.
- M. S. Found, M. Quaresimin, Two-stage fatigue loading of woven carbon fibre reinforced laminates Fatigue and Fracture of Engineering Materials and Structure. Volume26, Issue 1, January 2003, Pages 17-26.
- Yang JN, Jones DL. Load sequence effects on graphite/epoxy [±35]2s laminates. In: Long-term behavior of composites, STP 813. Philadelphia: ASTM, 1983:246–62.
Figure 1.
Experimental fatigue life under pure tension, compression, and curve fitting with Equation (3).
Figure 1.
Experimental fatigue life under pure tension, compression, and curve fitting with Equation (3).
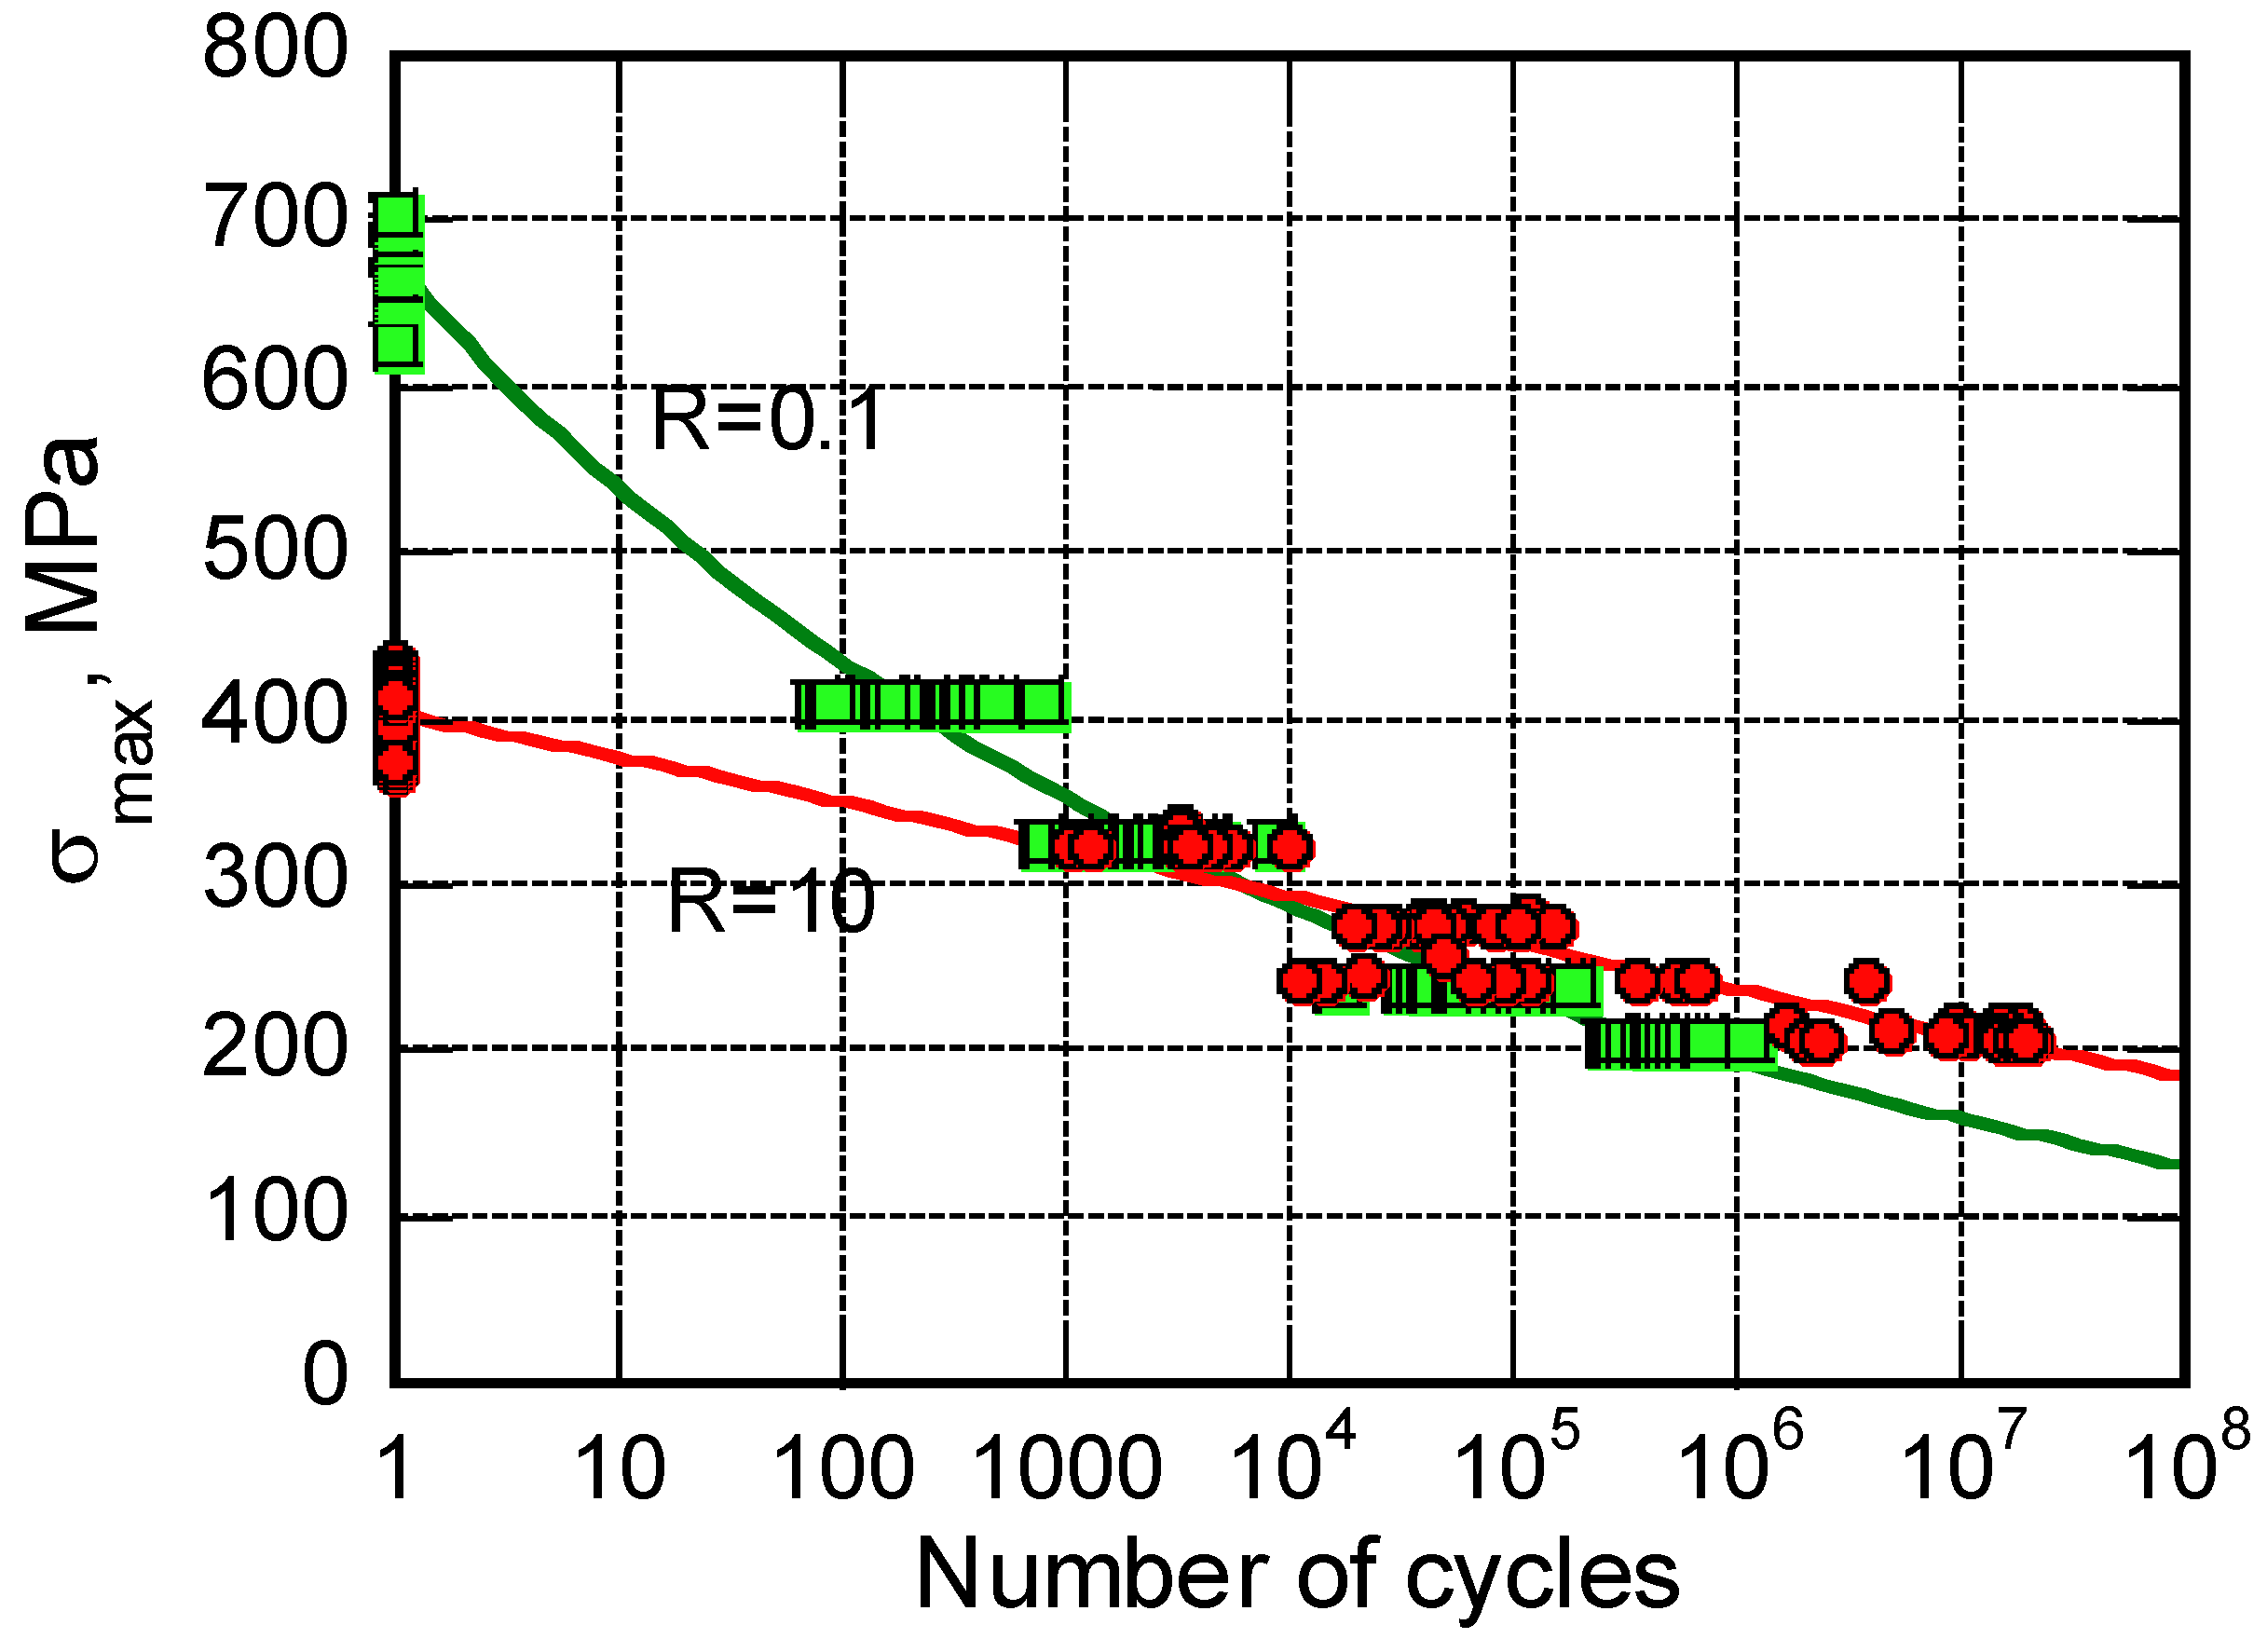
Figure 2.
The cumulative distribution functions of experimental (empty symbols) and calculated (filled symbols) static strength in tension (R=0.1) and compression (R=10), respectively.
Figure 2.
The cumulative distribution functions of experimental (empty symbols) and calculated (filled symbols) static strength in tension (R=0.1) and compression (R=10), respectively.
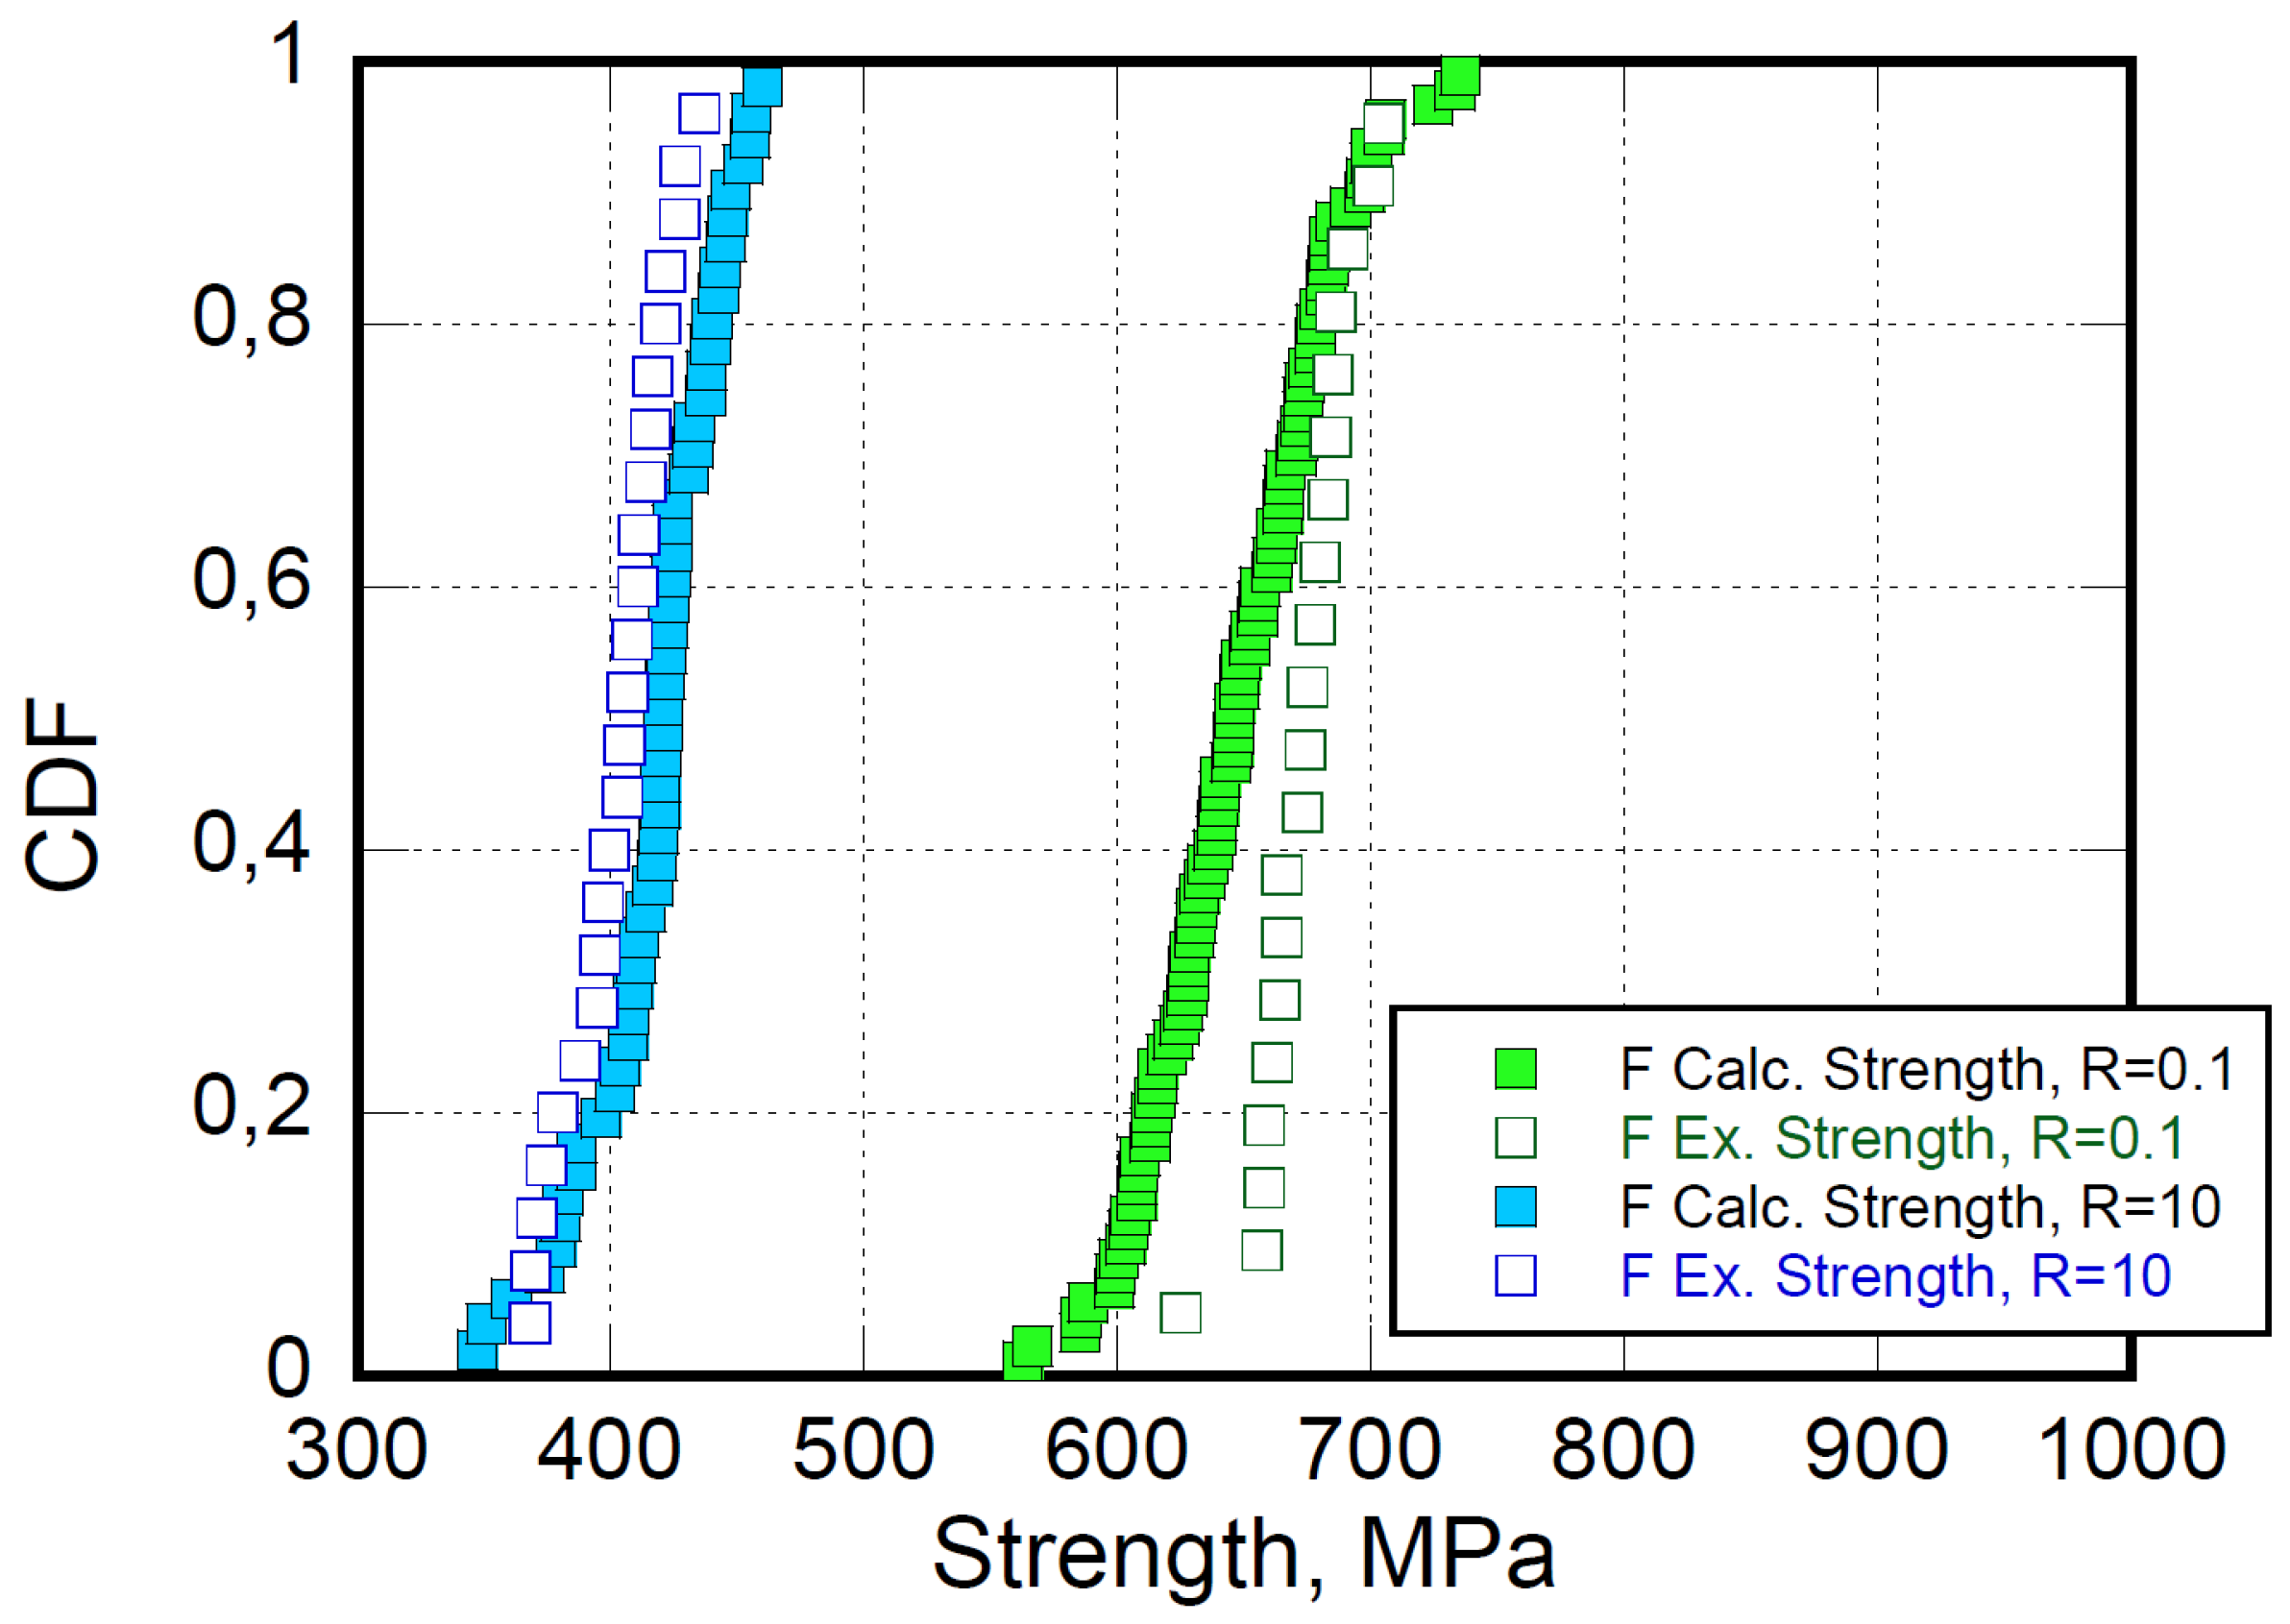
Figure 6.
The probability density function of fatigue life, f(n), at different elapsed cycles for pure compression fatigue loading at R=10.
Figure 6.
The probability density function of fatigue life, f(n), at different elapsed cycles for pure compression fatigue loading at R=10.
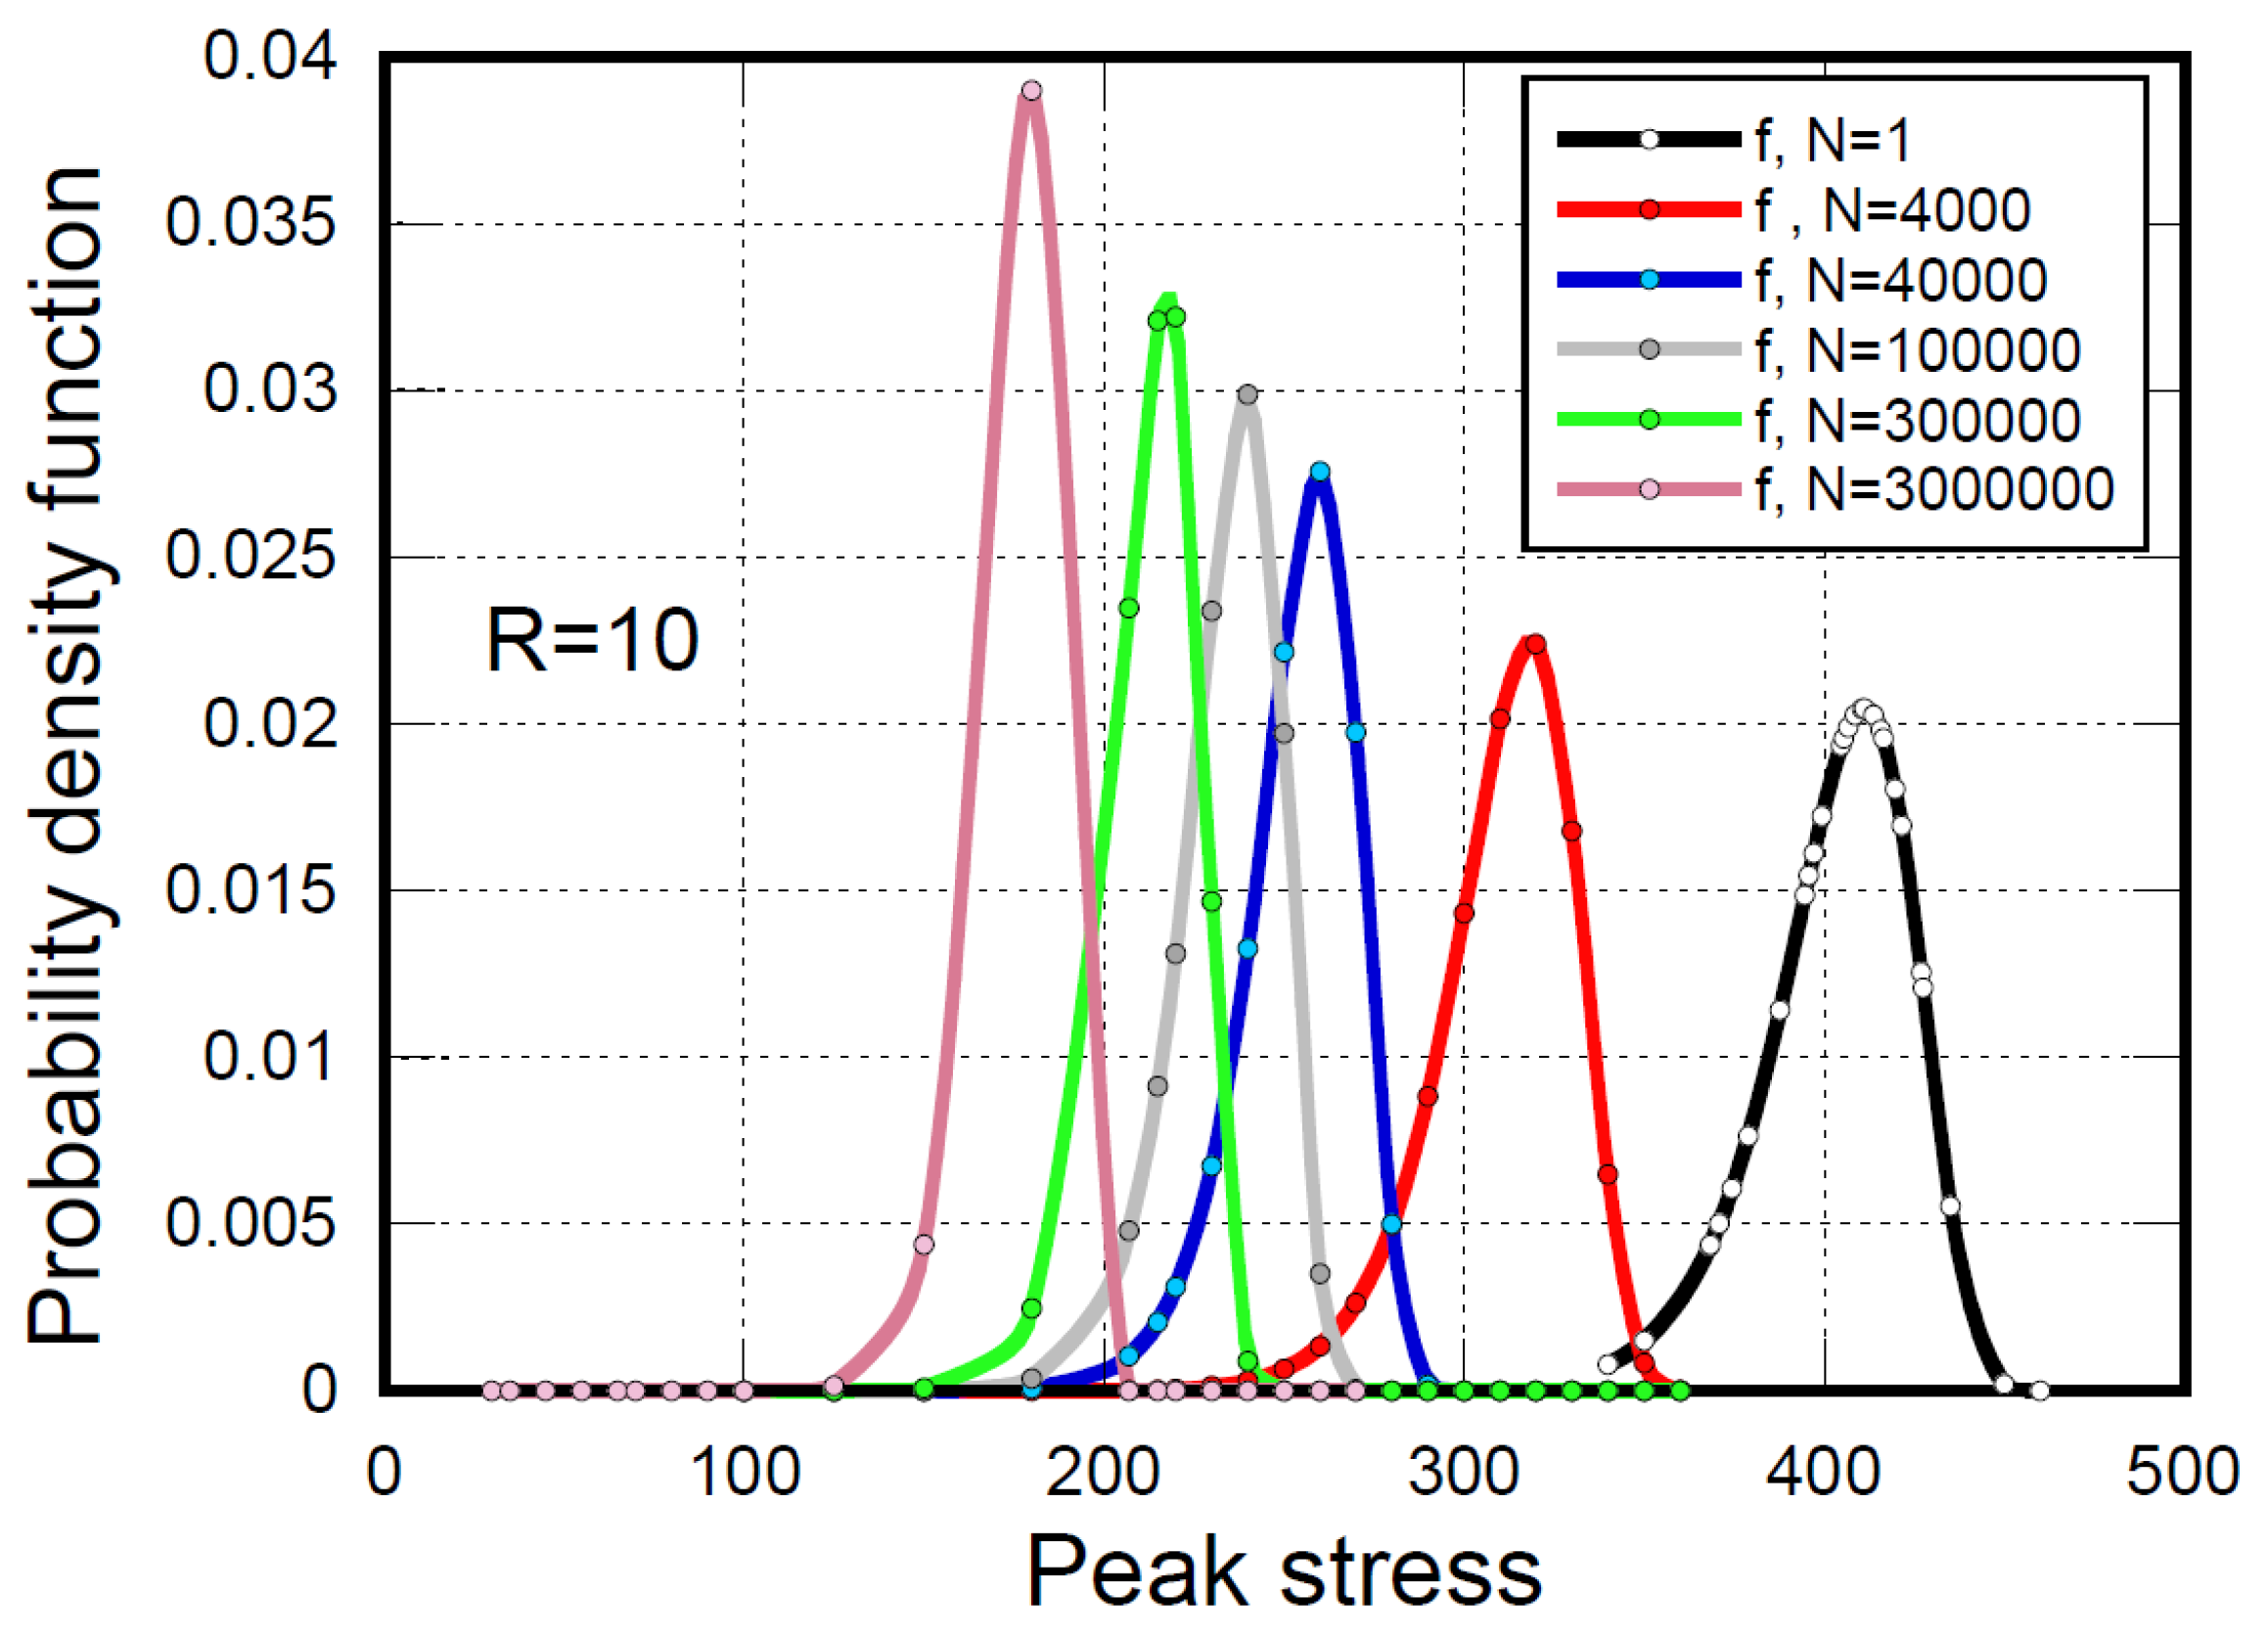
Figure 7.
The calculated compression strength distribution, obtained using Equation (3) by pooling the experimental fatigue data at different and compared to the experimental static strength data.
Figure 7.
The calculated compression strength distribution, obtained using Equation (3) by pooling the experimental fatigue data at different and compared to the experimental static strength data.
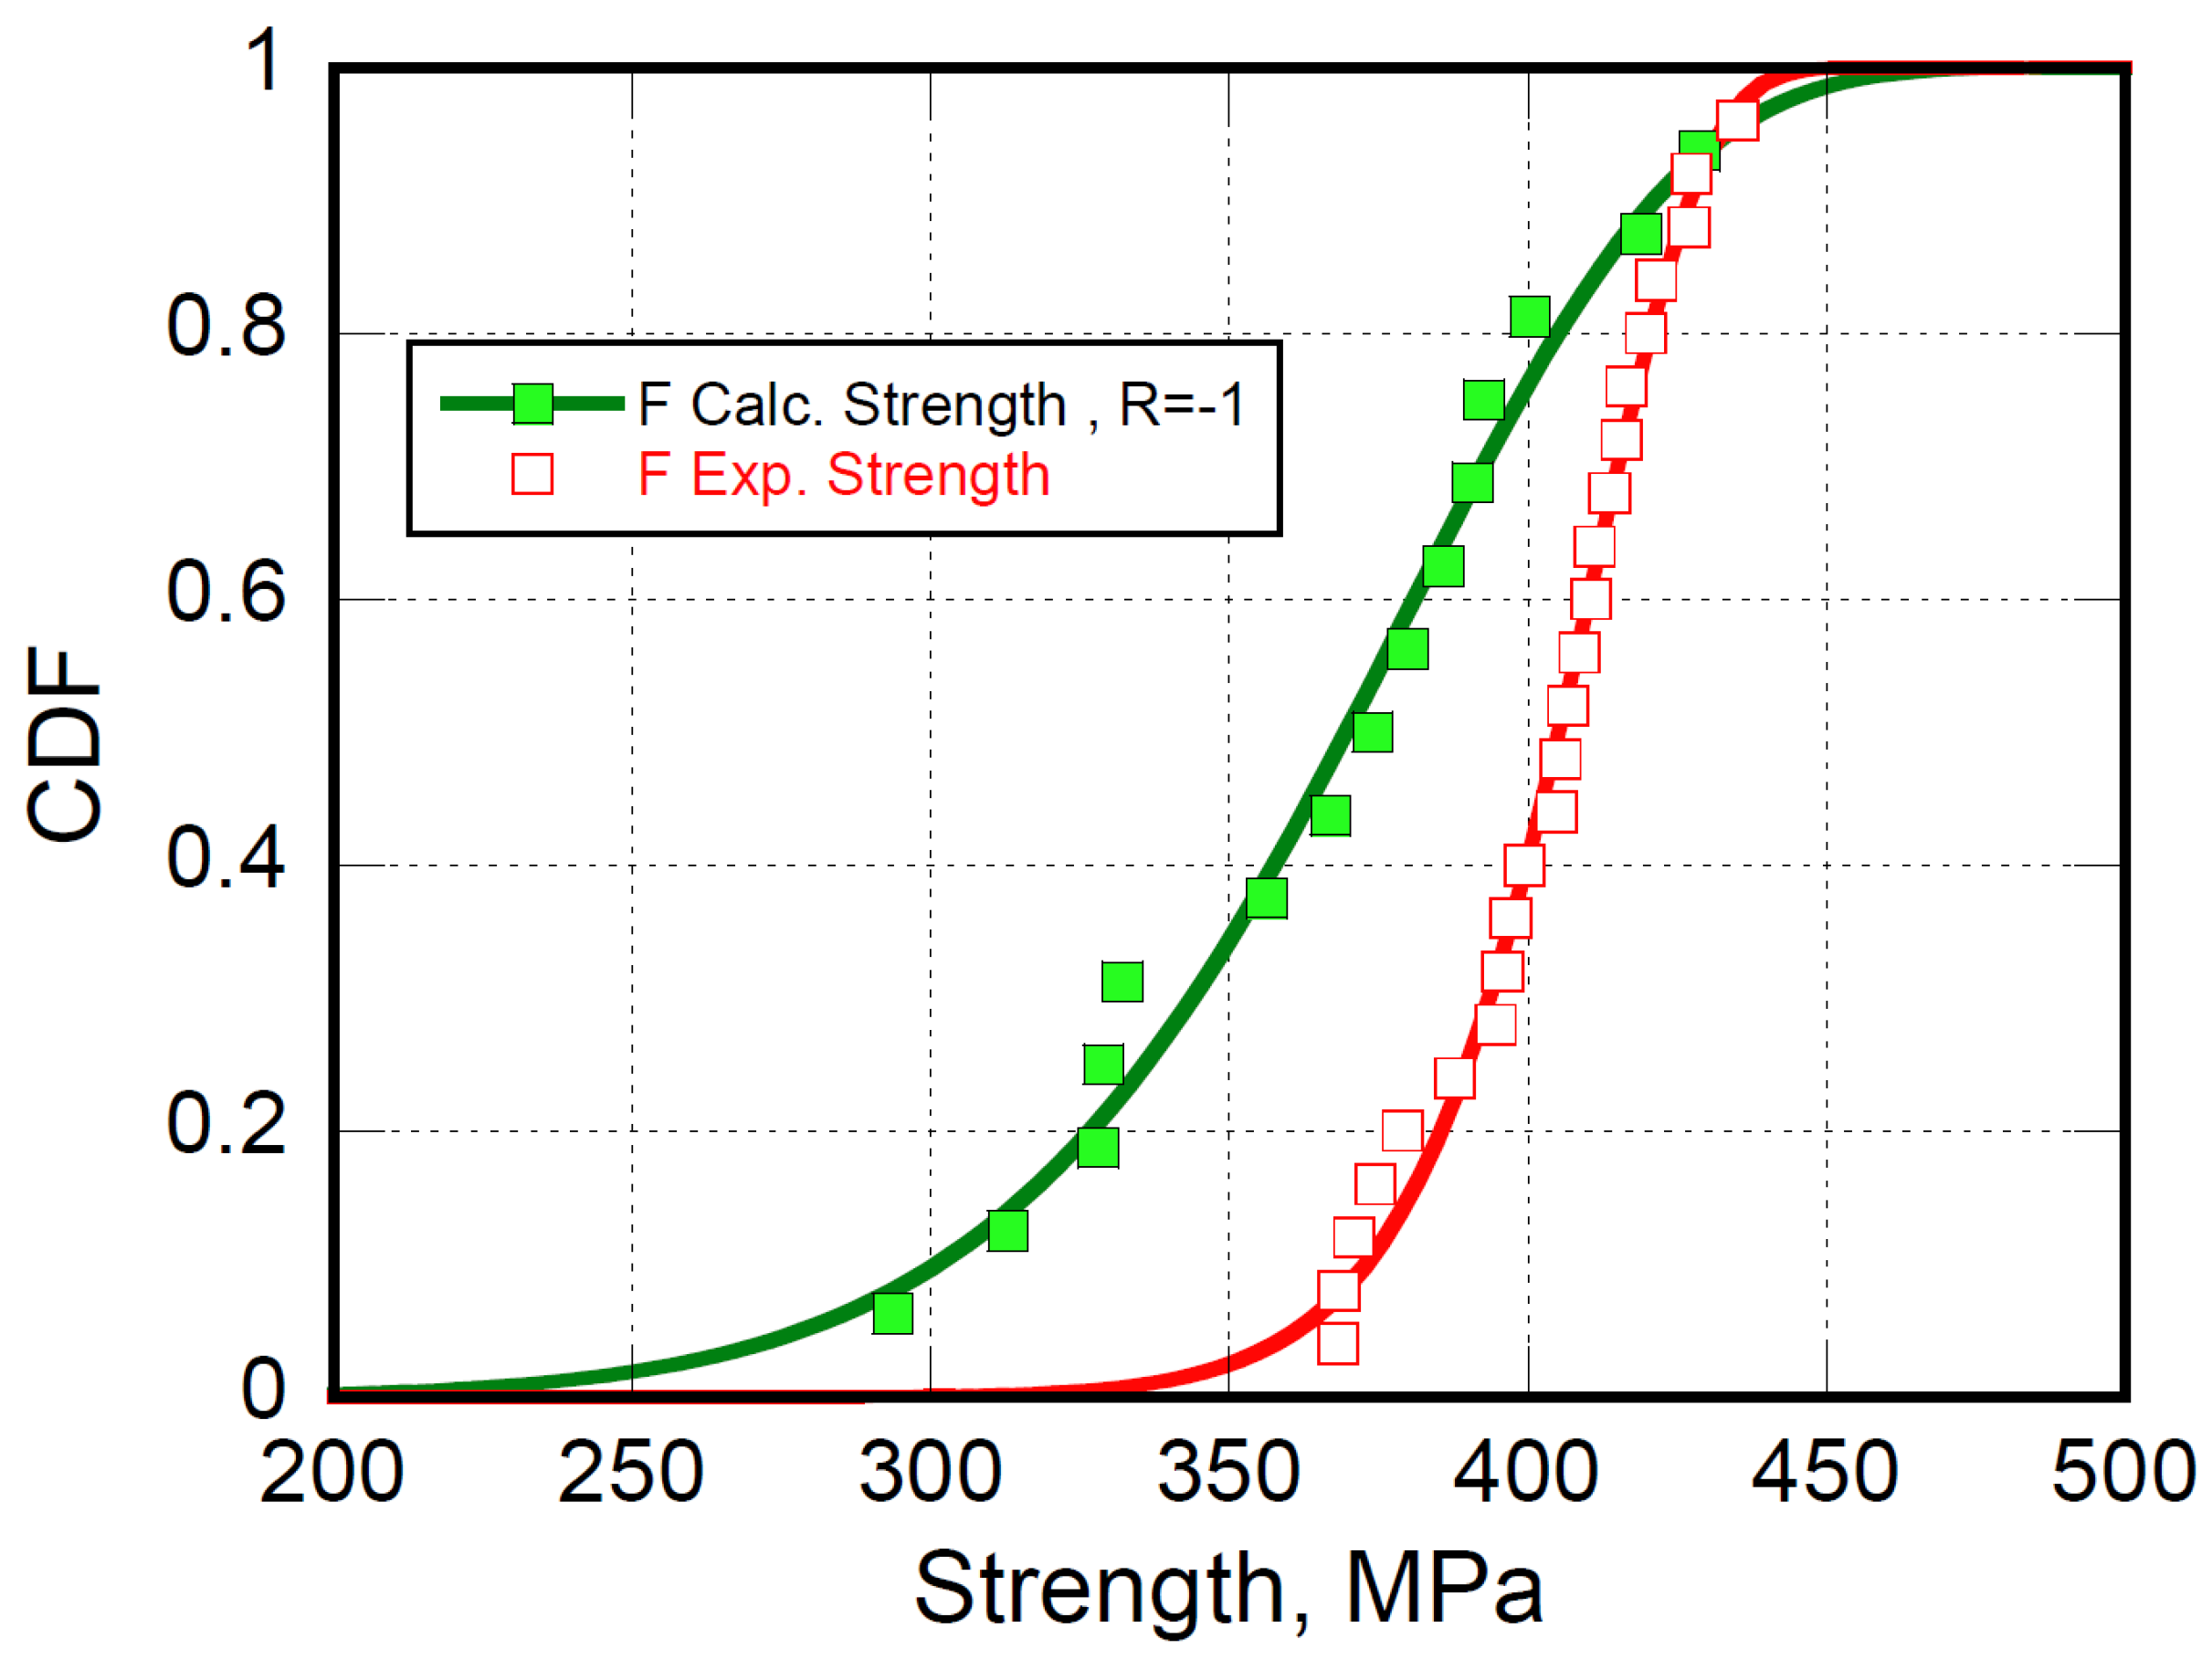
Figure 8.
The CLD diagram recovered from applying Equation (8) at different stress ratios, R. Yellow and green symbols represent the theoretical compression- and tension-dominated fatigue life, respectively.
Figure 8.
The CLD diagram recovered from applying Equation (8) at different stress ratios, R. Yellow and green symbols represent the theoretical compression- and tension-dominated fatigue life, respectively.
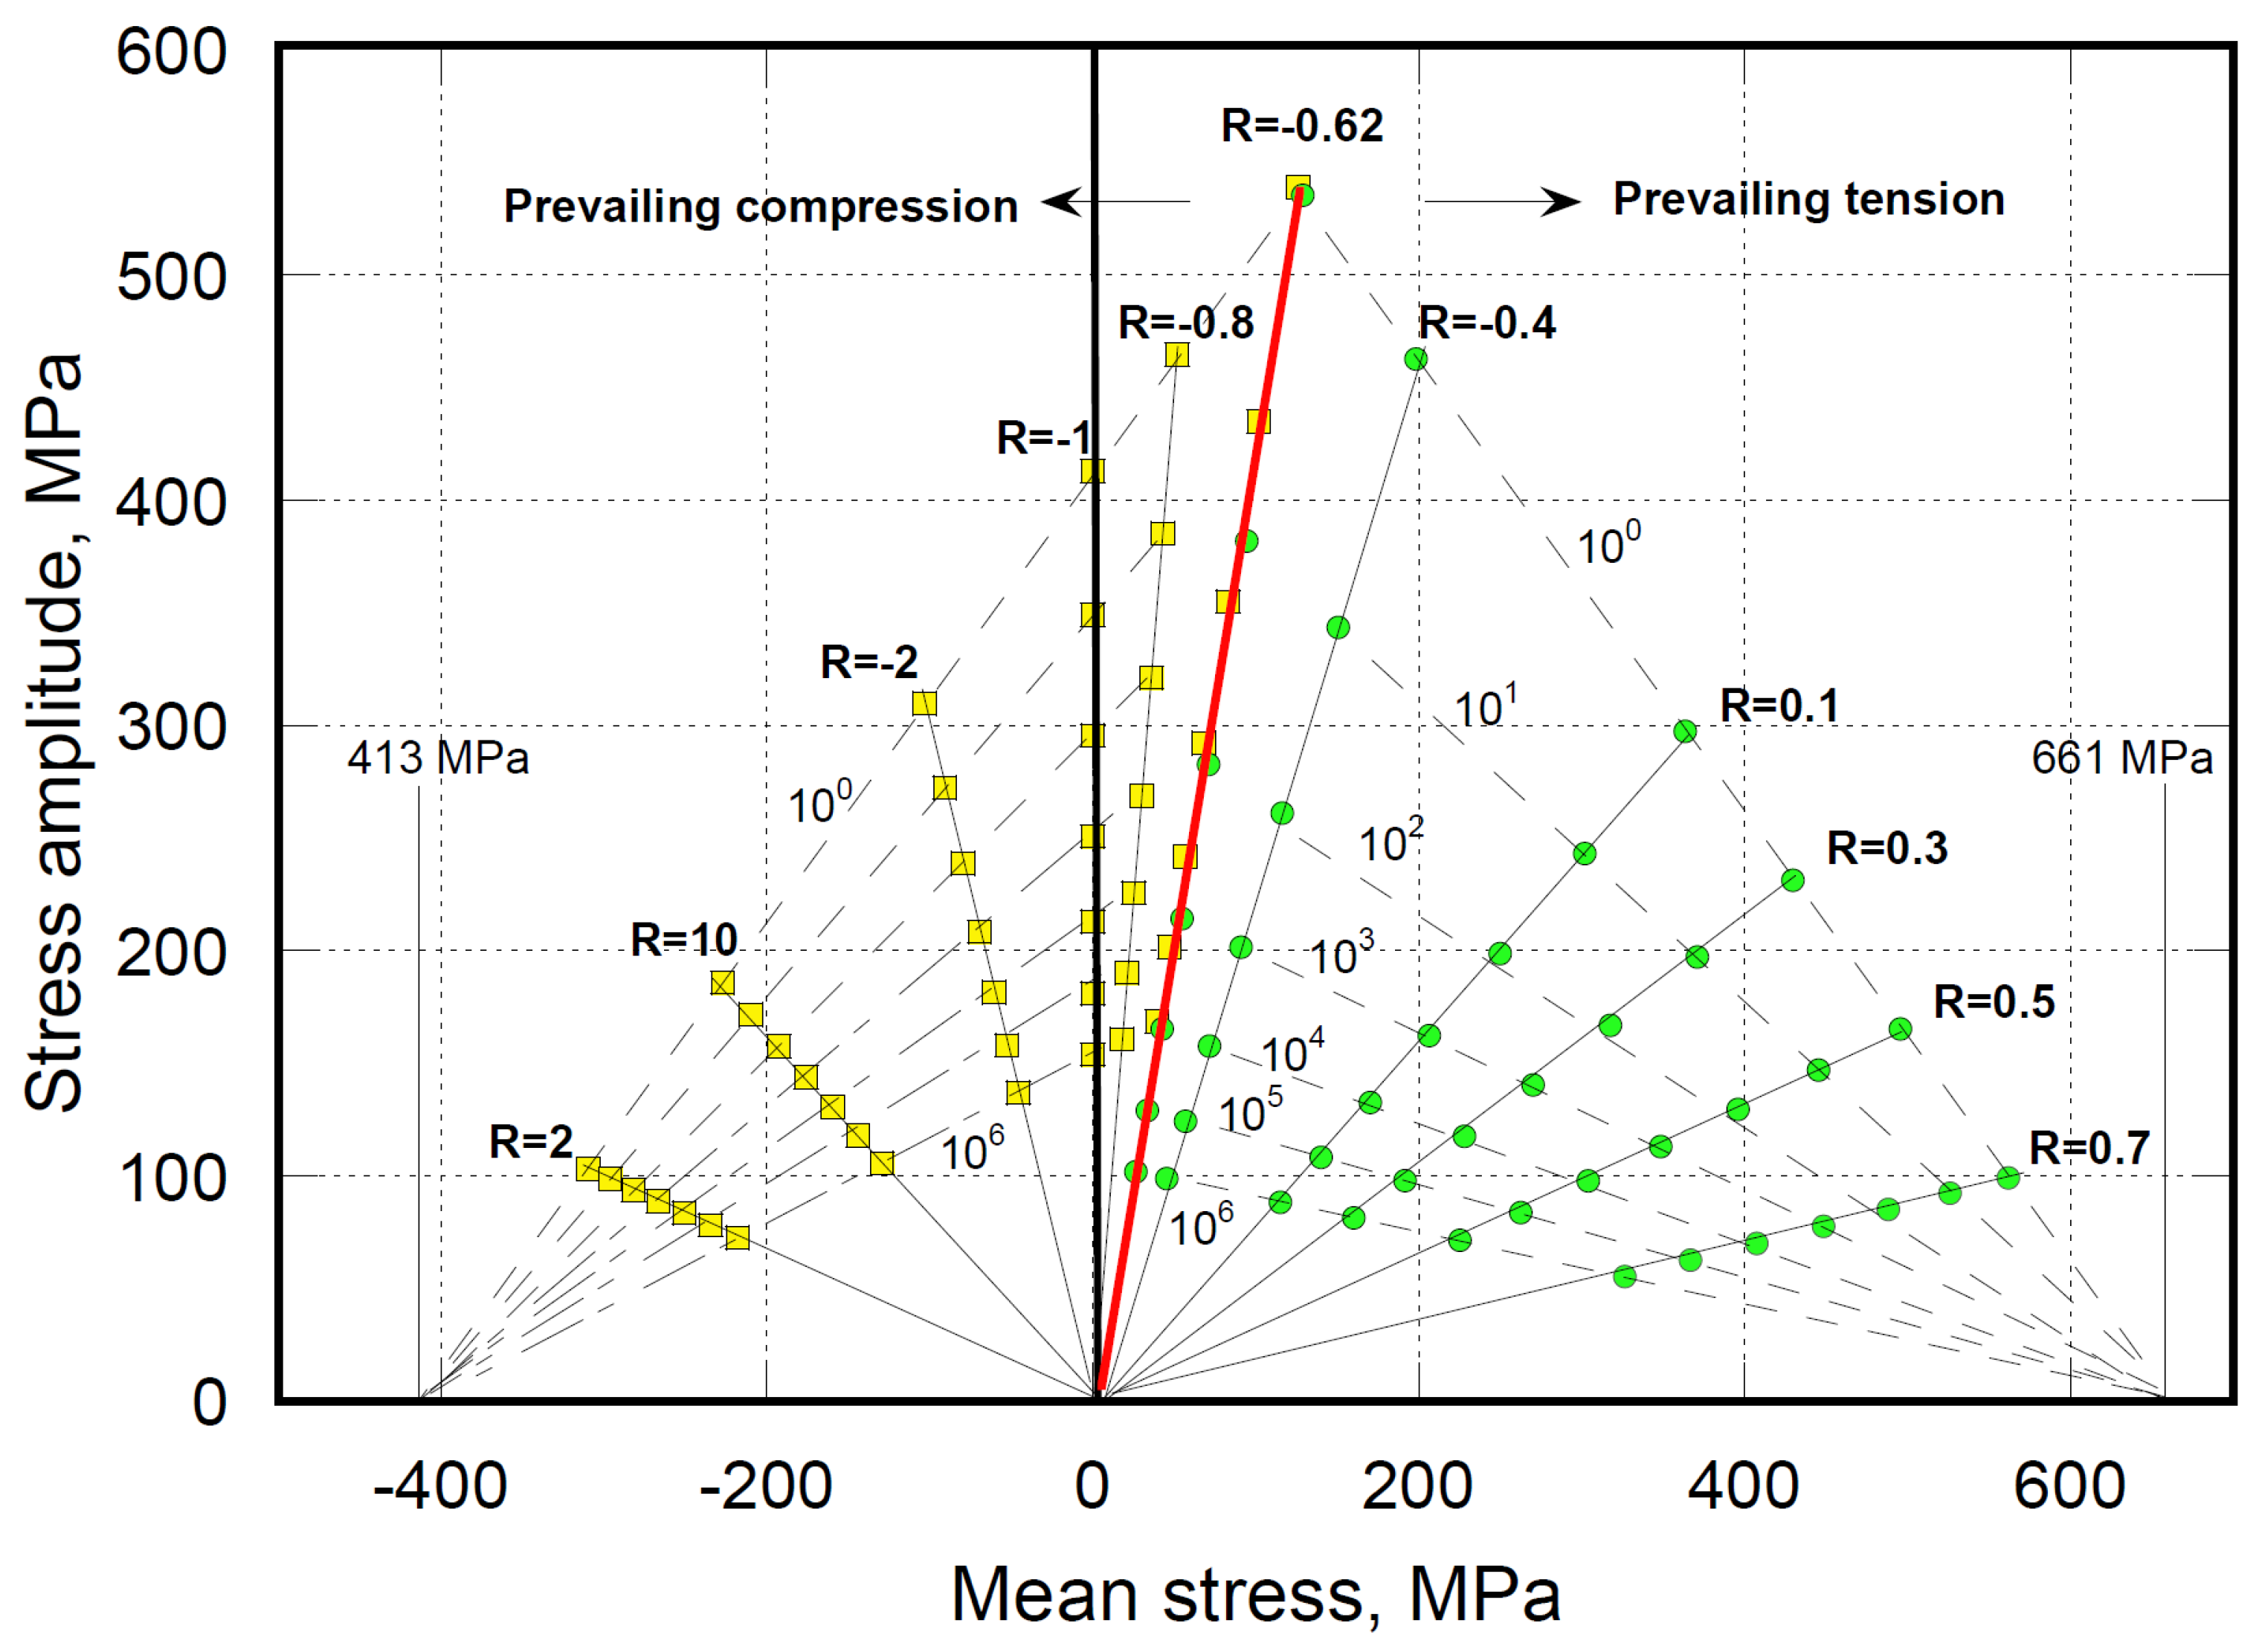
Figure 9.
Schematic of strength degradation path (Equation 10) for a generic sample with static strength of arbitrary rank, .
Figure 9.
Schematic of strength degradation path (Equation 10) for a generic sample with static strength of arbitrary rank, .
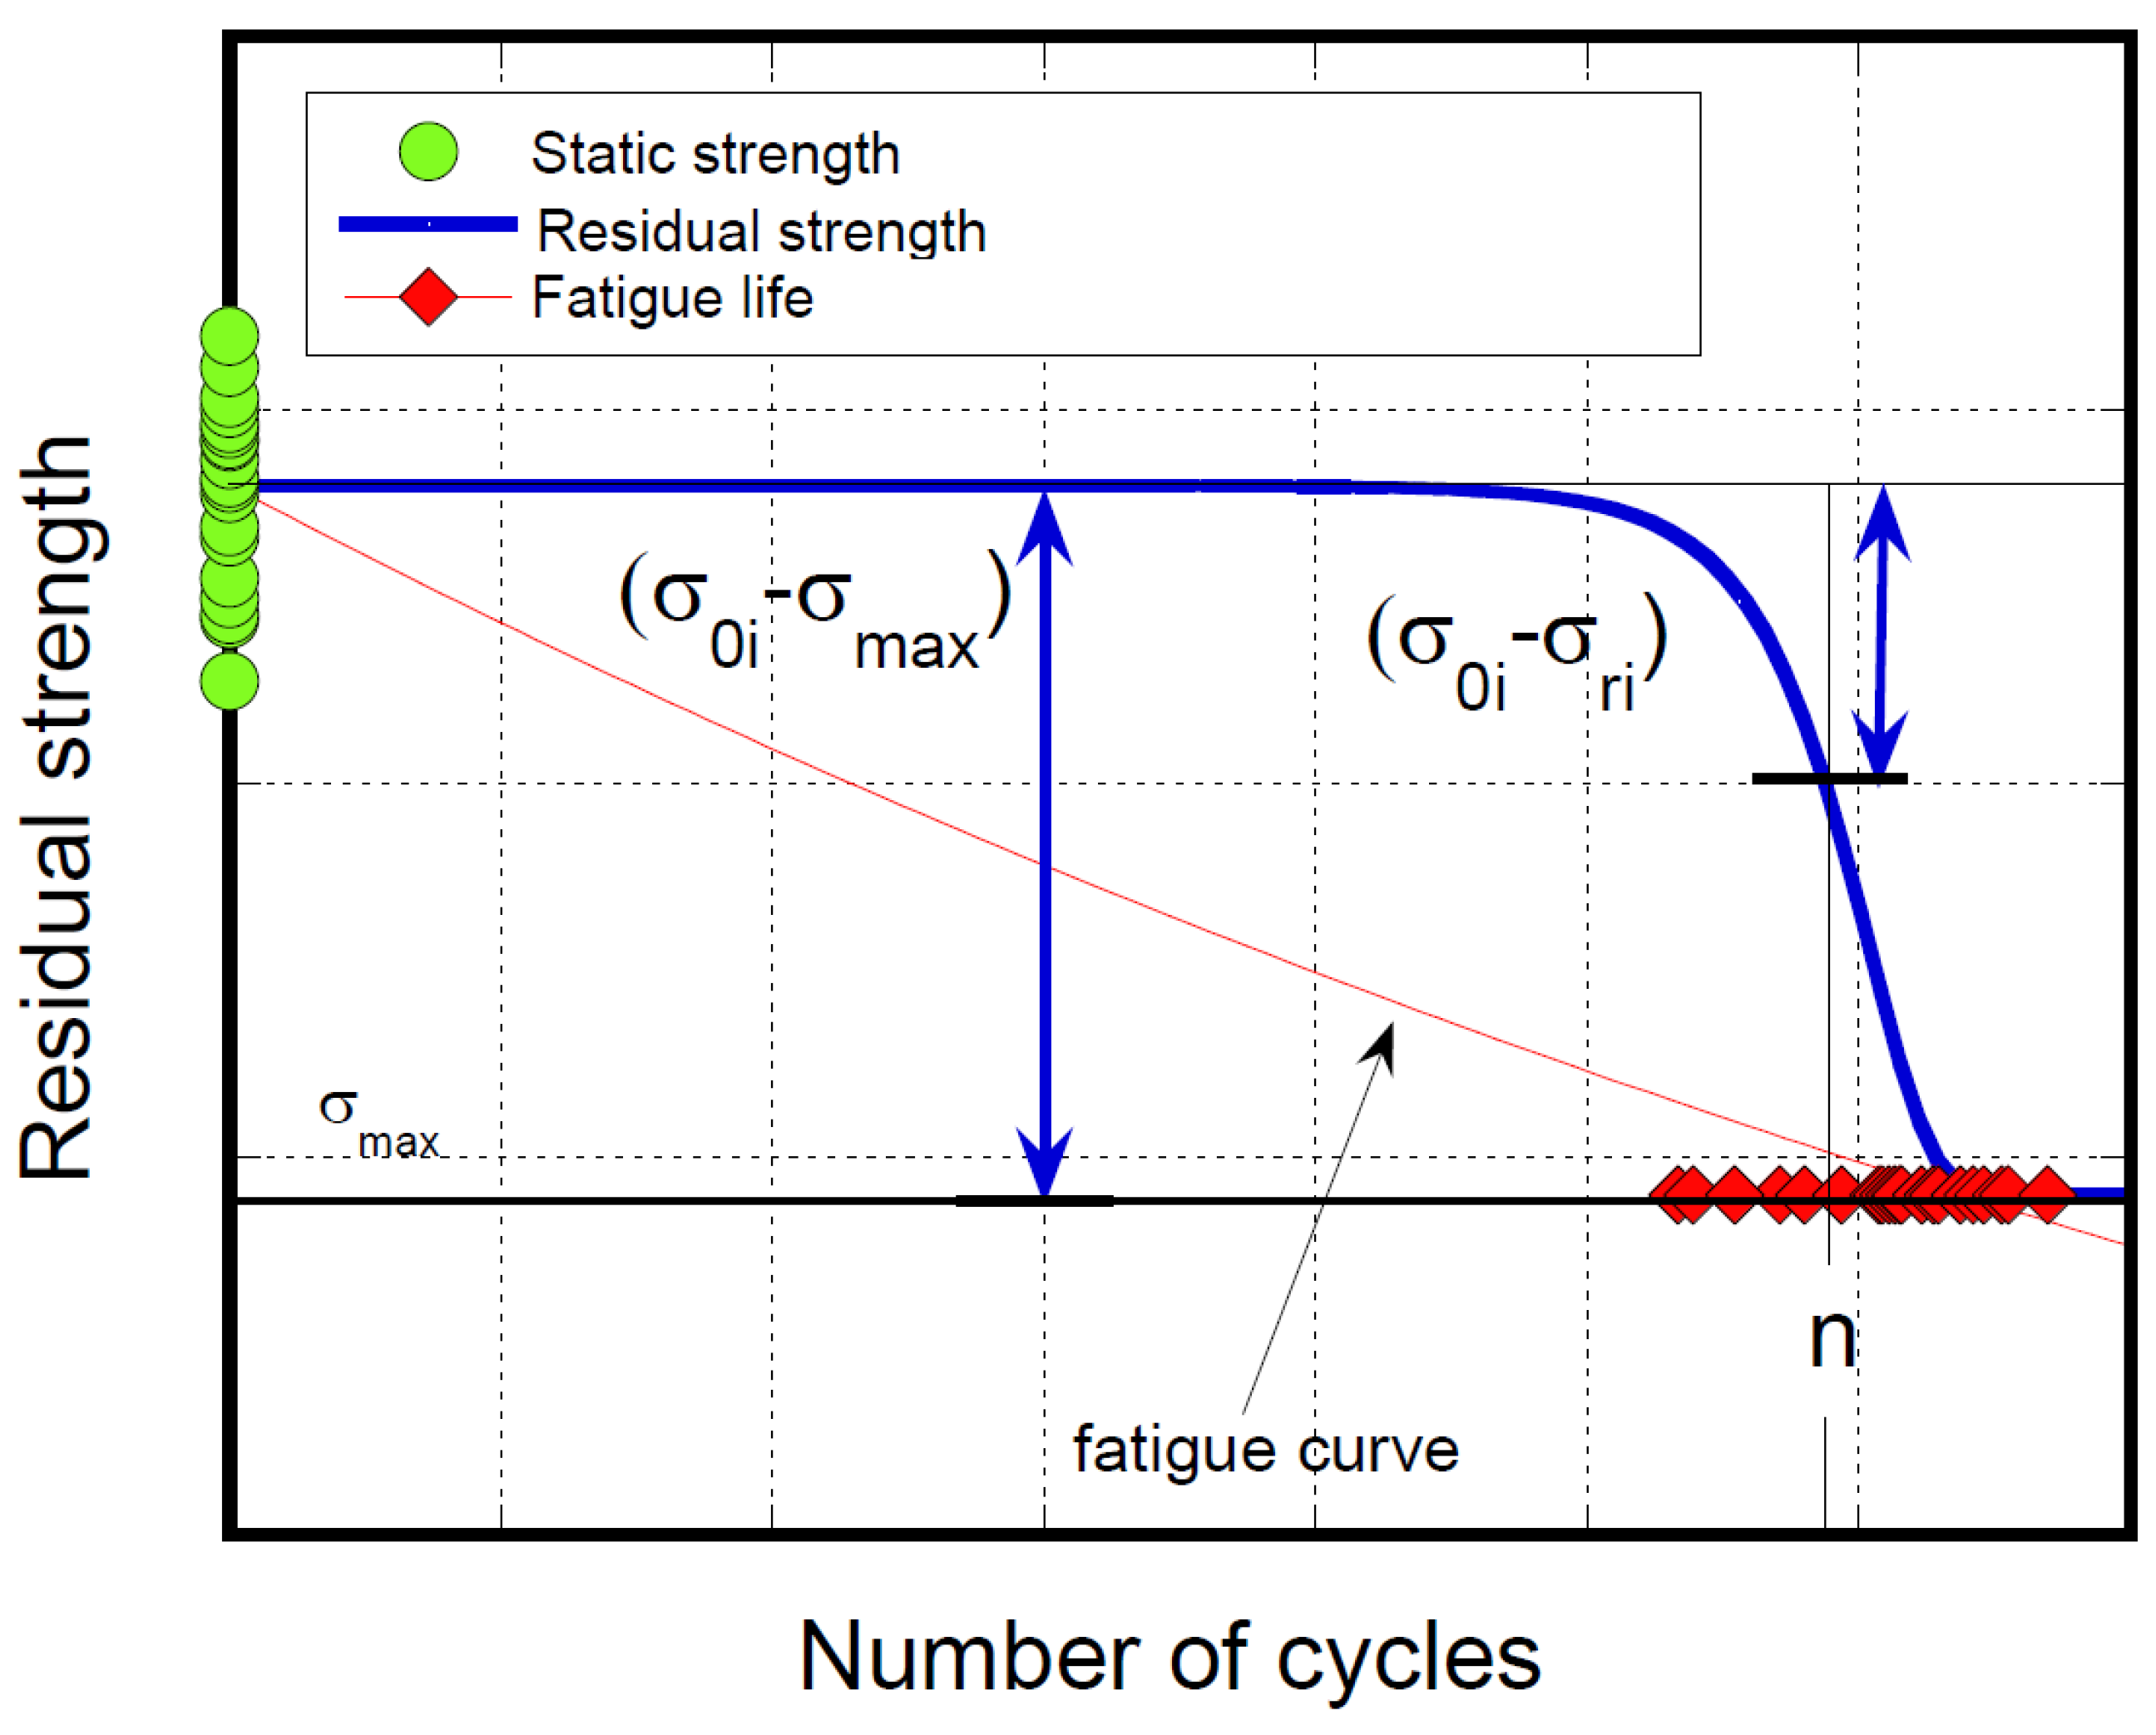
Figure 10.
The experimental (empty symbols) and theoretical (filled symbols) residual strengths under pure tension fatigue loading ( at different elapsed cycles as indicated in the inset.
Figure 10.
The experimental (empty symbols) and theoretical (filled symbols) residual strengths under pure tension fatigue loading ( at different elapsed cycles as indicated in the inset.
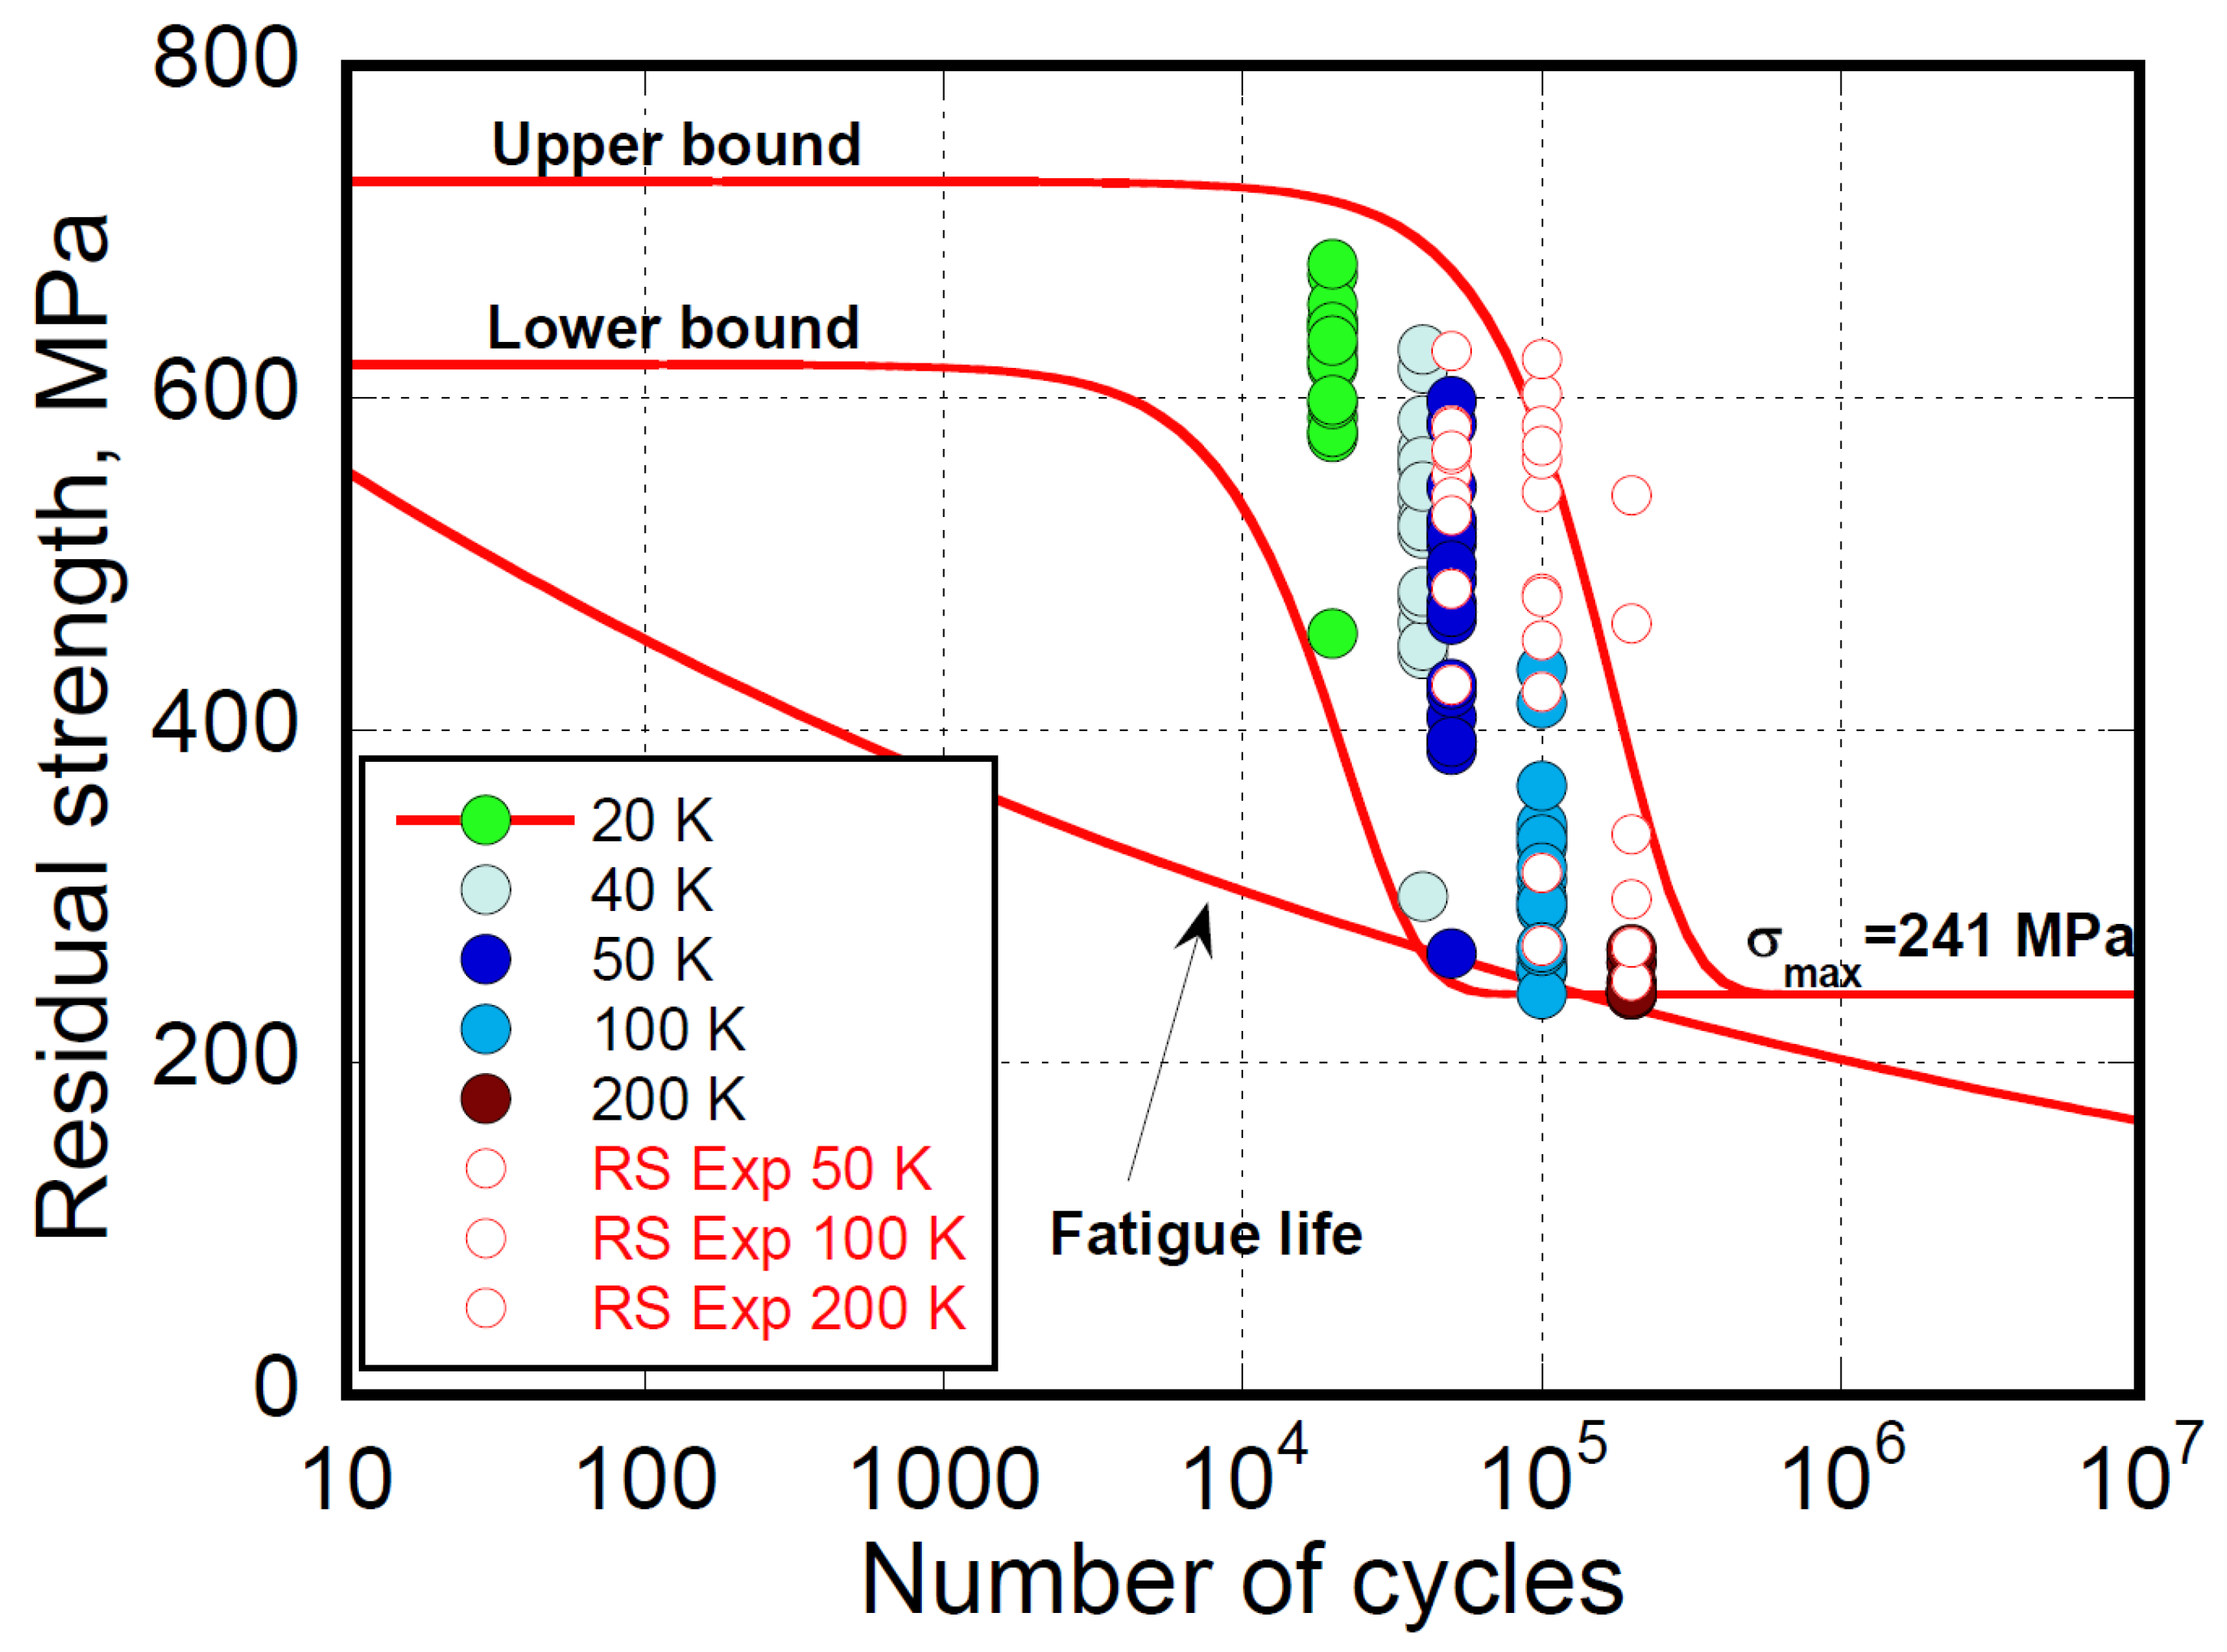
Figure 11.
Experimental residual strength data and their confinement within the domains described by the theoretical upper and lower strength degradation curves at 414, 325, and 207 MPa maximum stresses. The green symbols are the experimental CA fatigue data.
Figure 11.
Experimental residual strength data and their confinement within the domains described by the theoretical upper and lower strength degradation curves at 414, 325, and 207 MPa maximum stresses. The green symbols are the experimental CA fatigue data.
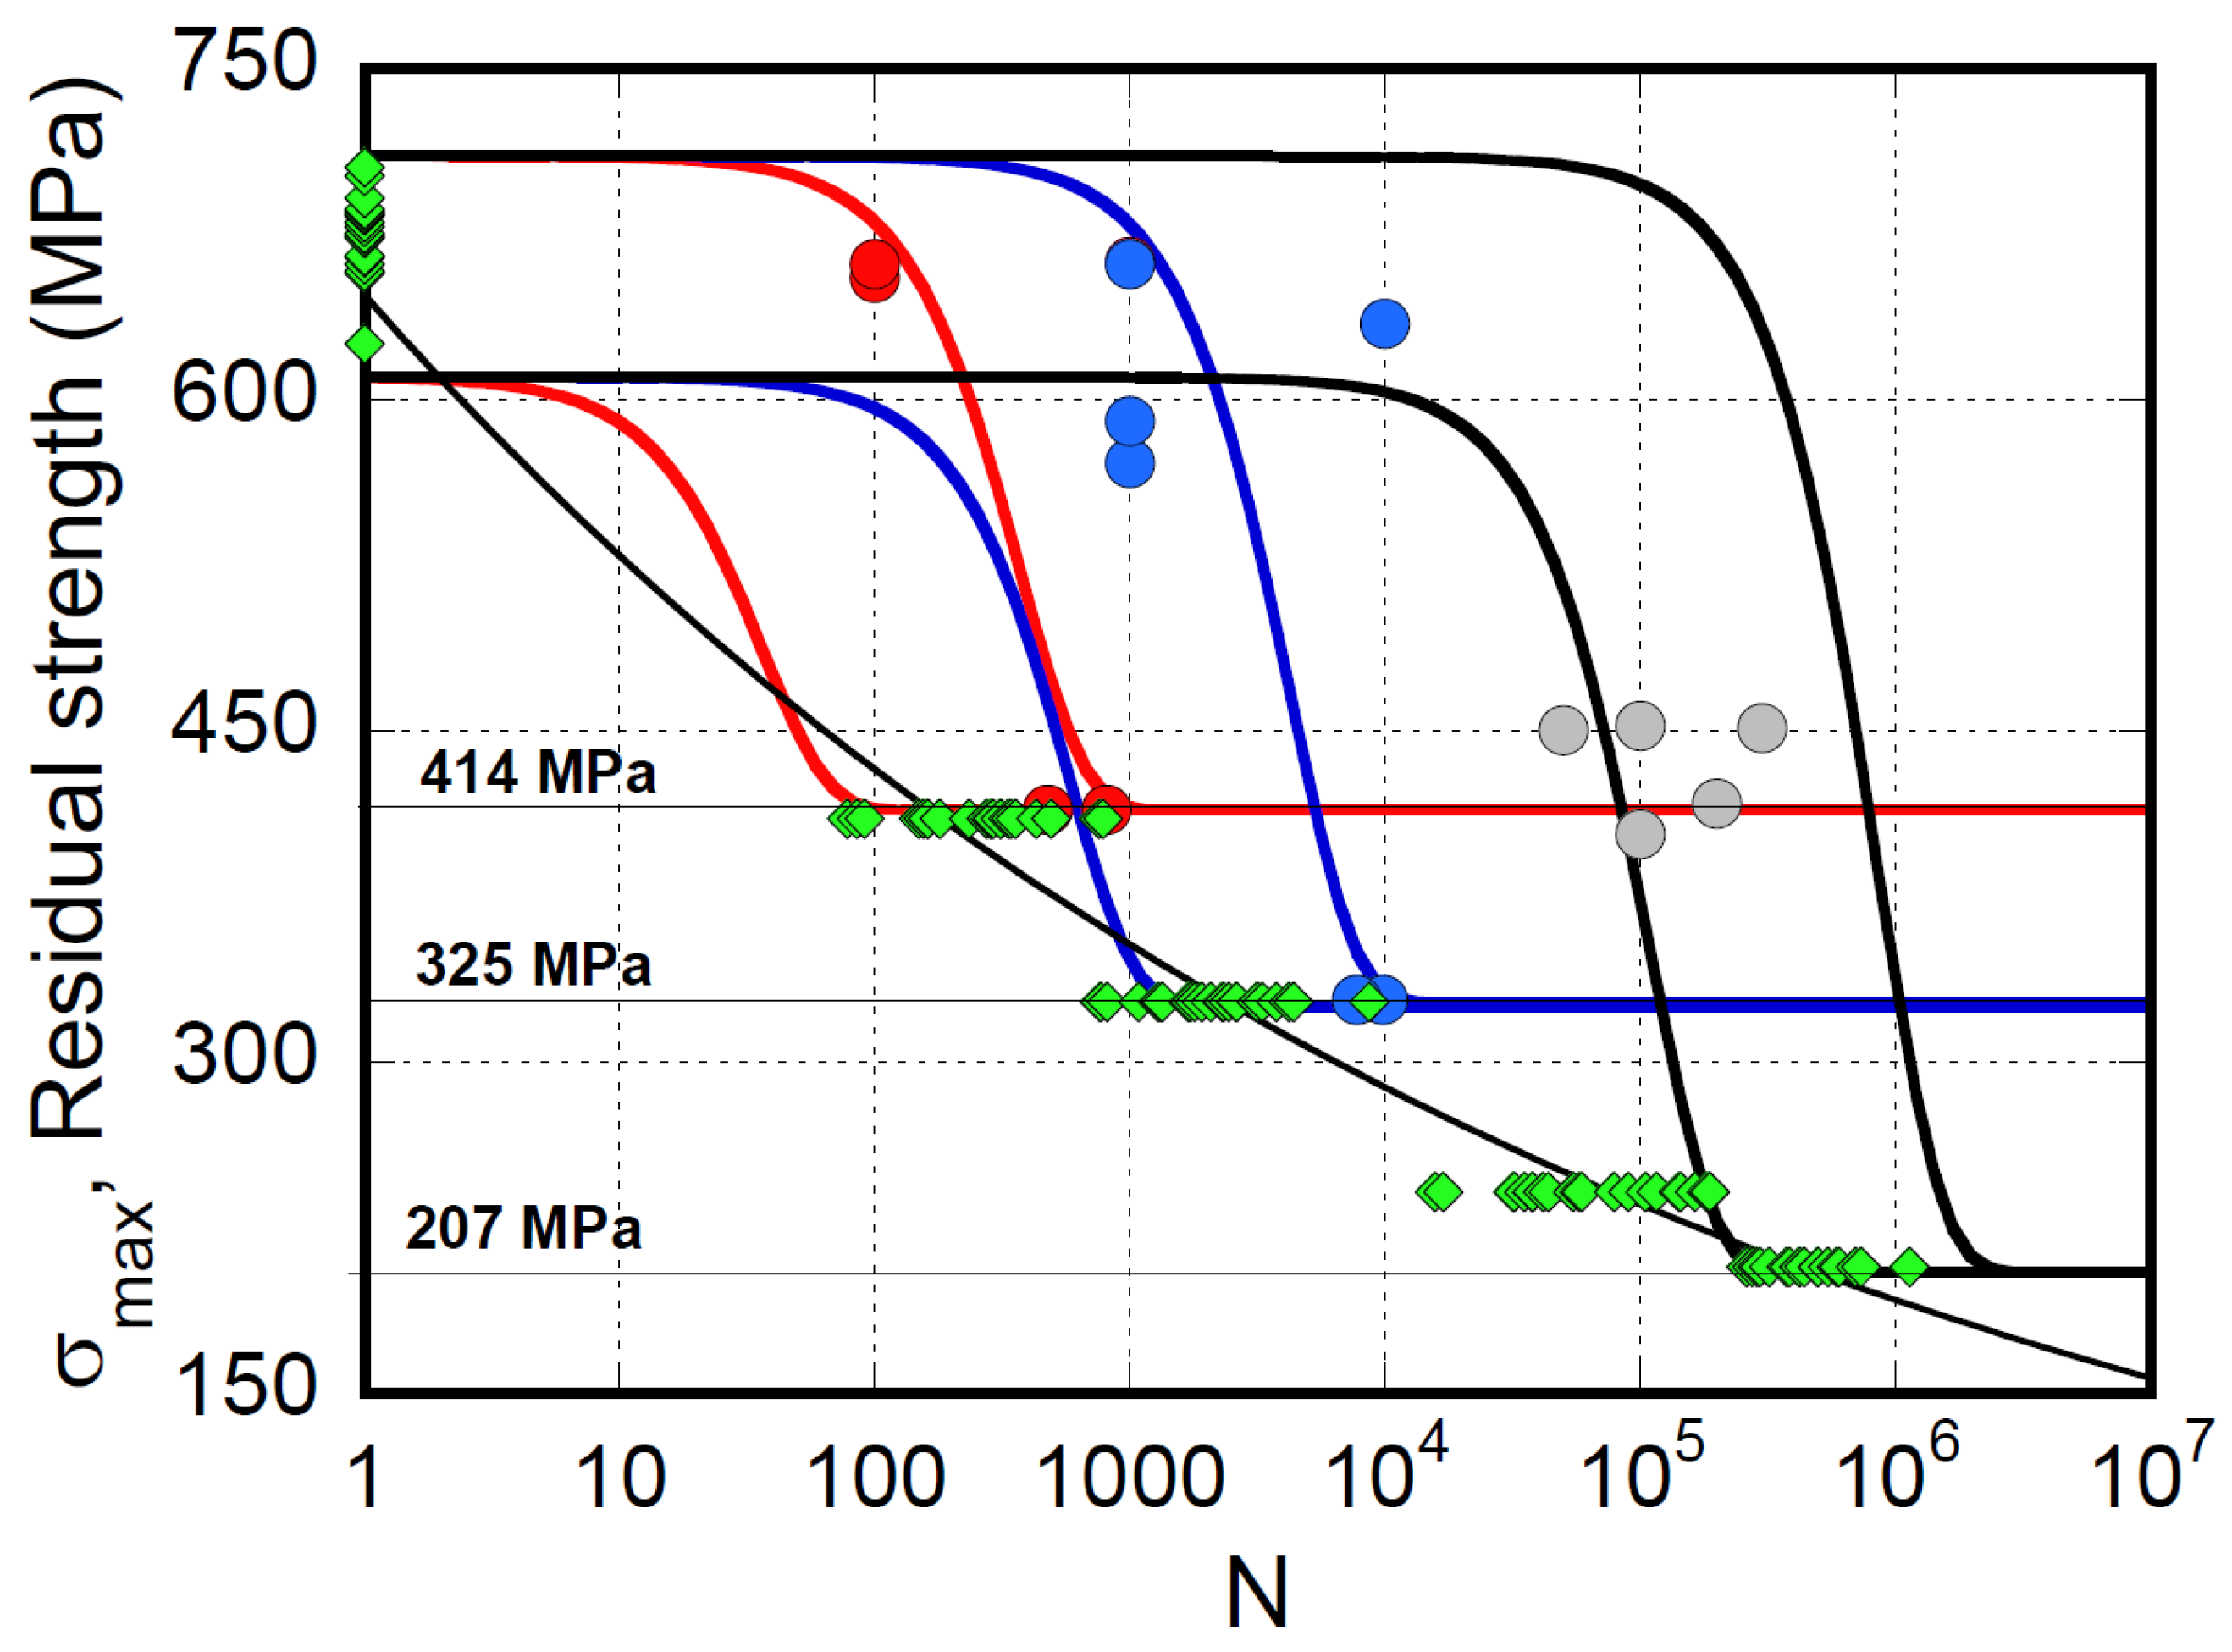
Figure 12.
Theoretical description of the residual strength (RS) statistics under CA loading (R=0.1 , ) at different elapsed cycles, as indicated in the inset.
Figure 12.
Theoretical description of the residual strength (RS) statistics under CA loading (R=0.1 , ) at different elapsed cycles, as indicated in the inset.
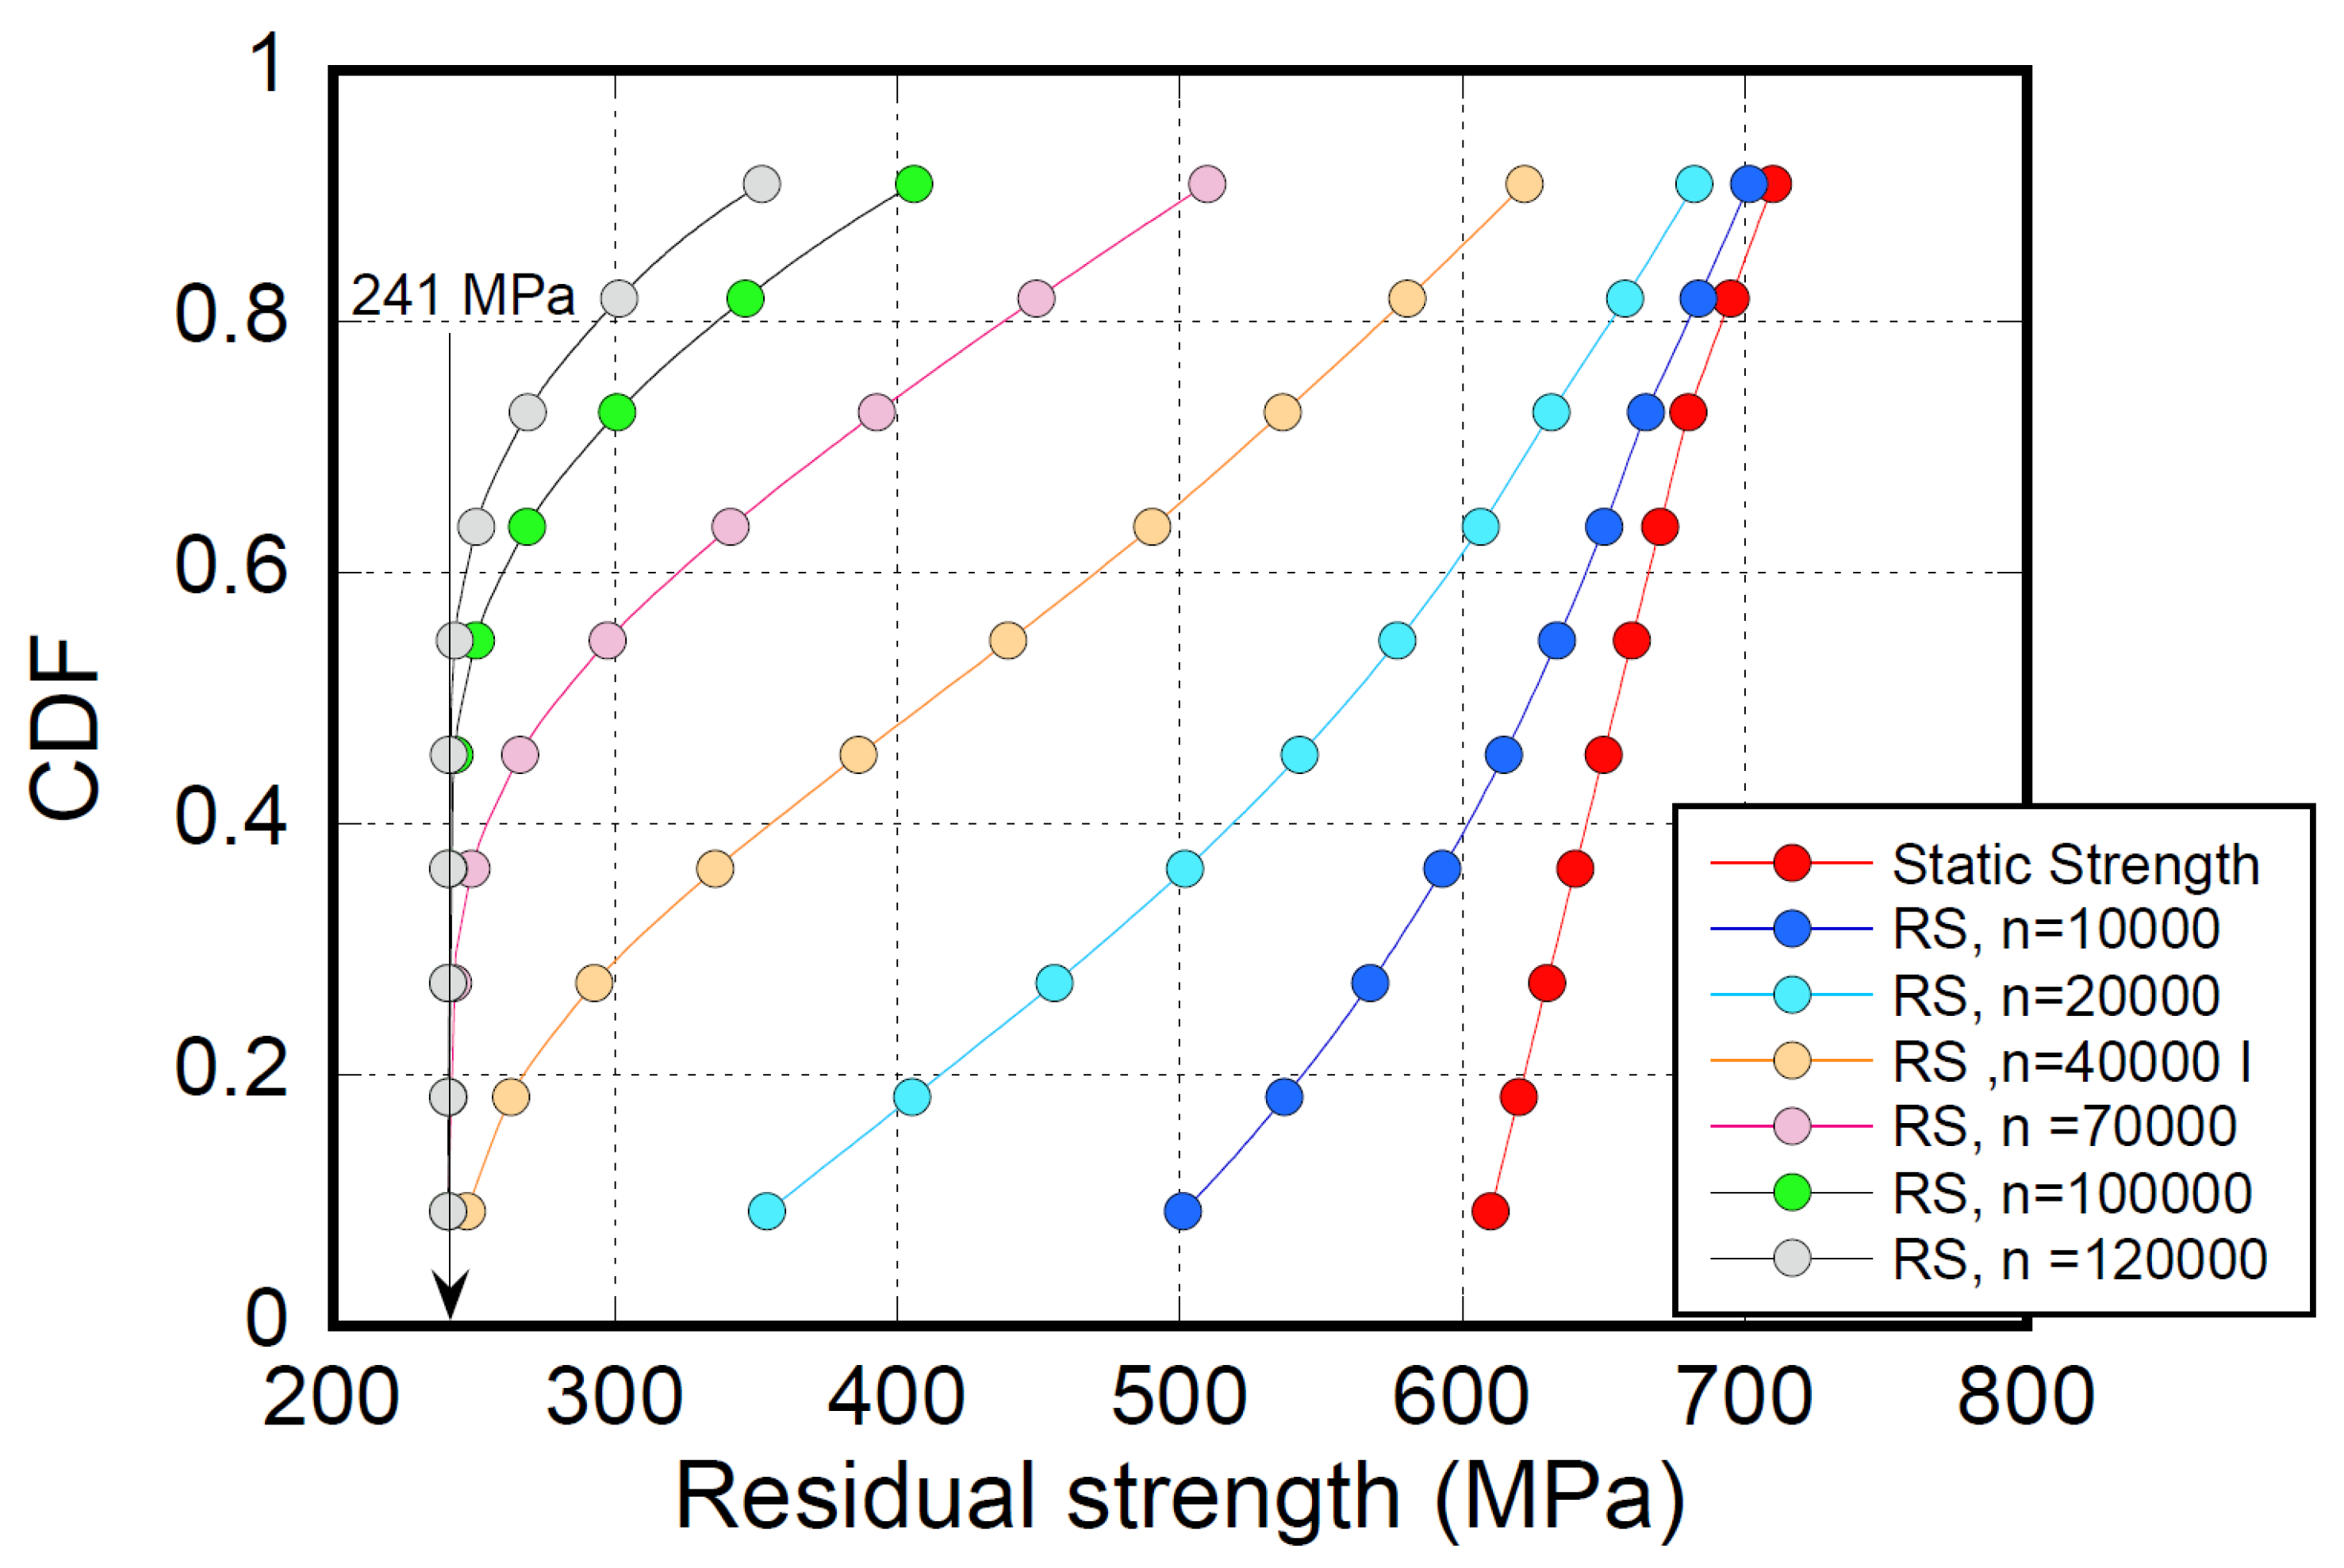
Figure 13.
Schematic of (H-L) descending (left) and L-H ascending (right) three-block loading sequence. The continuous curves represent the CA residual strength baselines where the ERSA is applied to blocks of 2x10², 2x10³, and 2x10⁴ cycles at , respectively.
Figure 13.
Schematic of (H-L) descending (left) and L-H ascending (right) three-block loading sequence. The continuous curves represent the CA residual strength baselines where the ERSA is applied to blocks of 2x10², 2x10³, and 2x10⁴ cycles at , respectively.
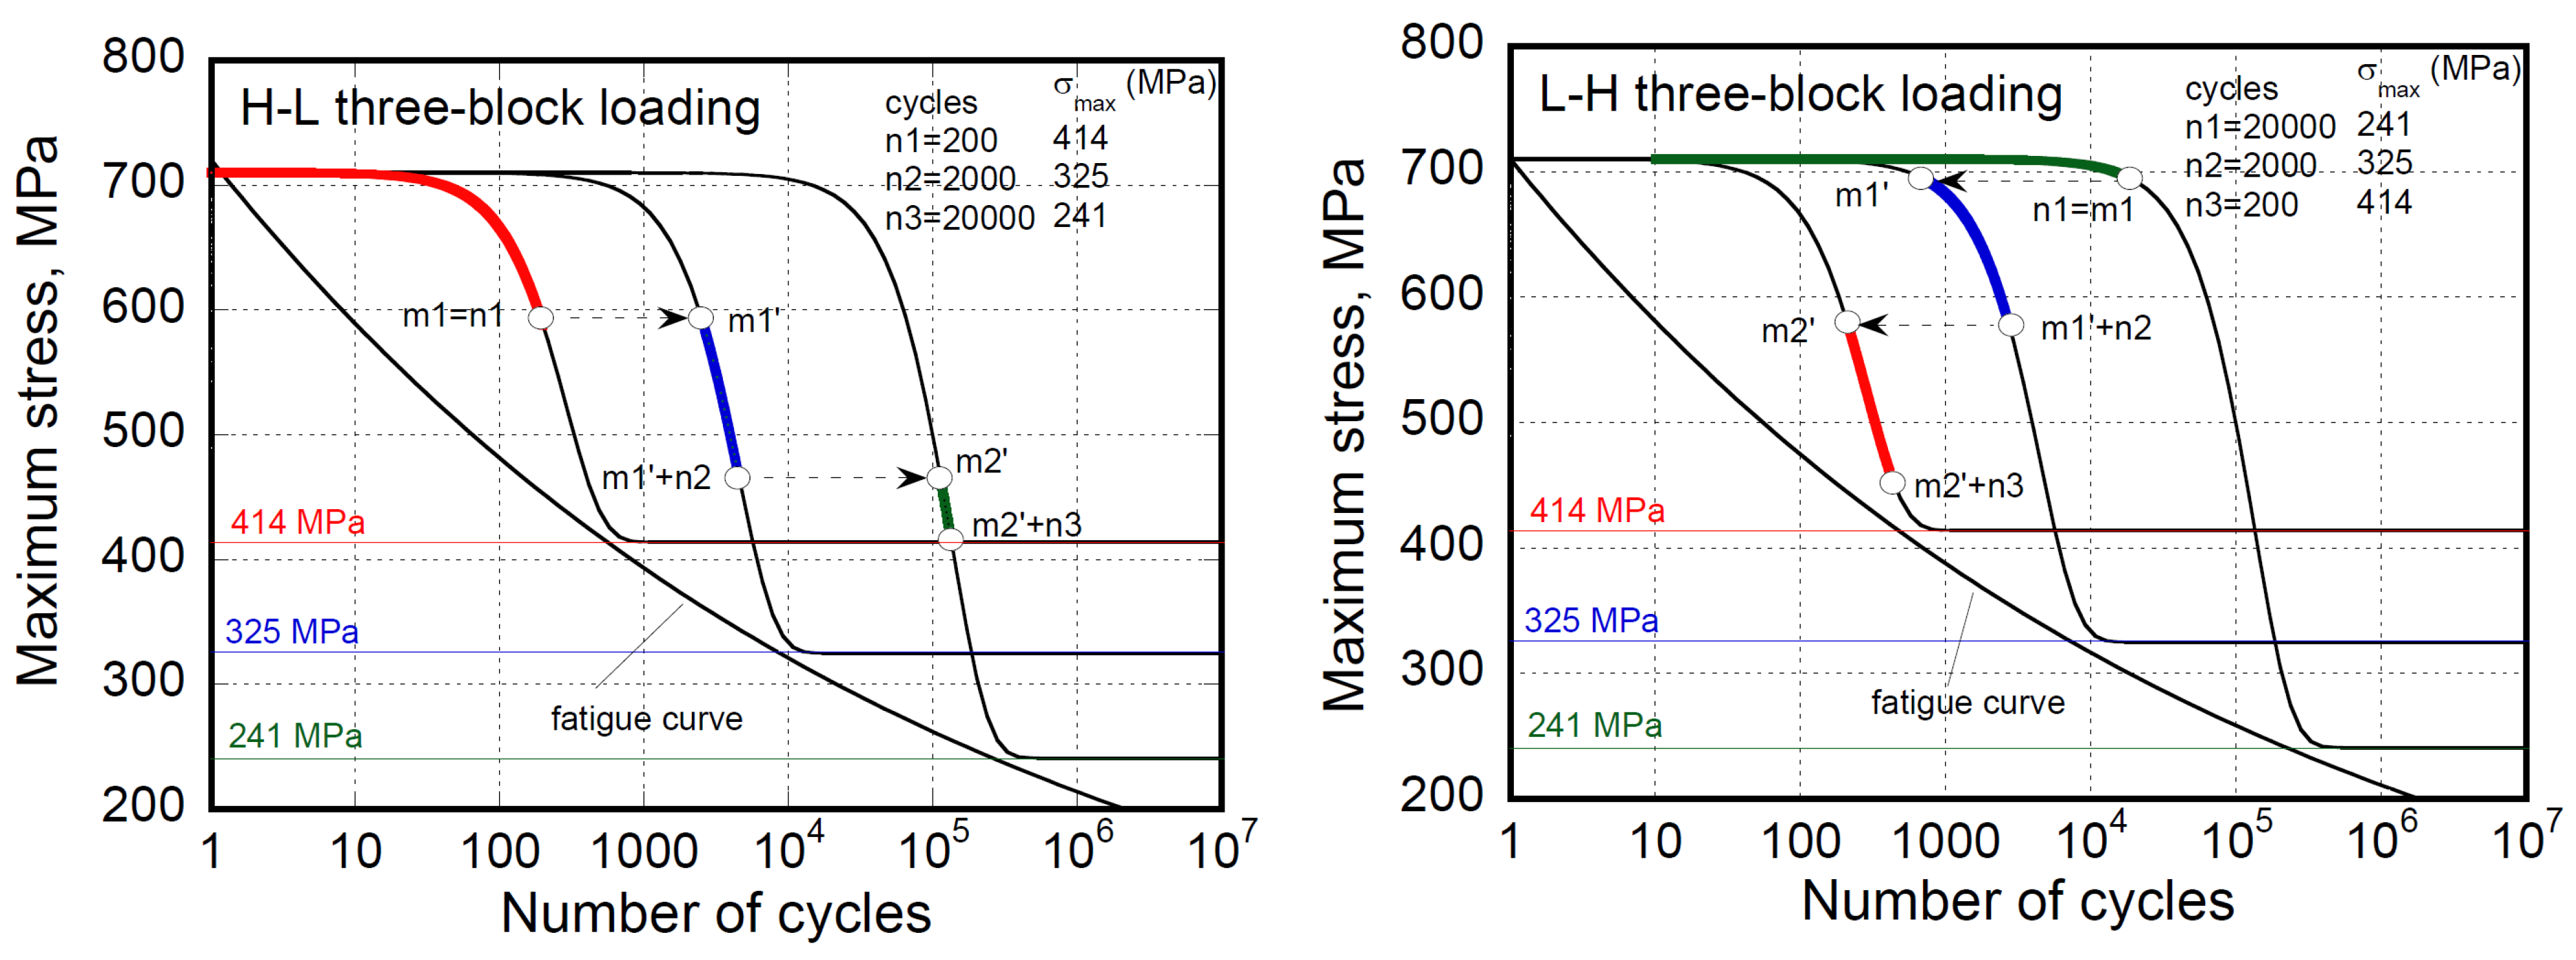
Figure 14.
Predicted statistical fatigue lifetimes under different two-block loading sequences as indicated in the inset and the experimental CA fatigue data.
Figure 14.
Predicted statistical fatigue lifetimes under different two-block loading sequences as indicated in the inset and the experimental CA fatigue data.
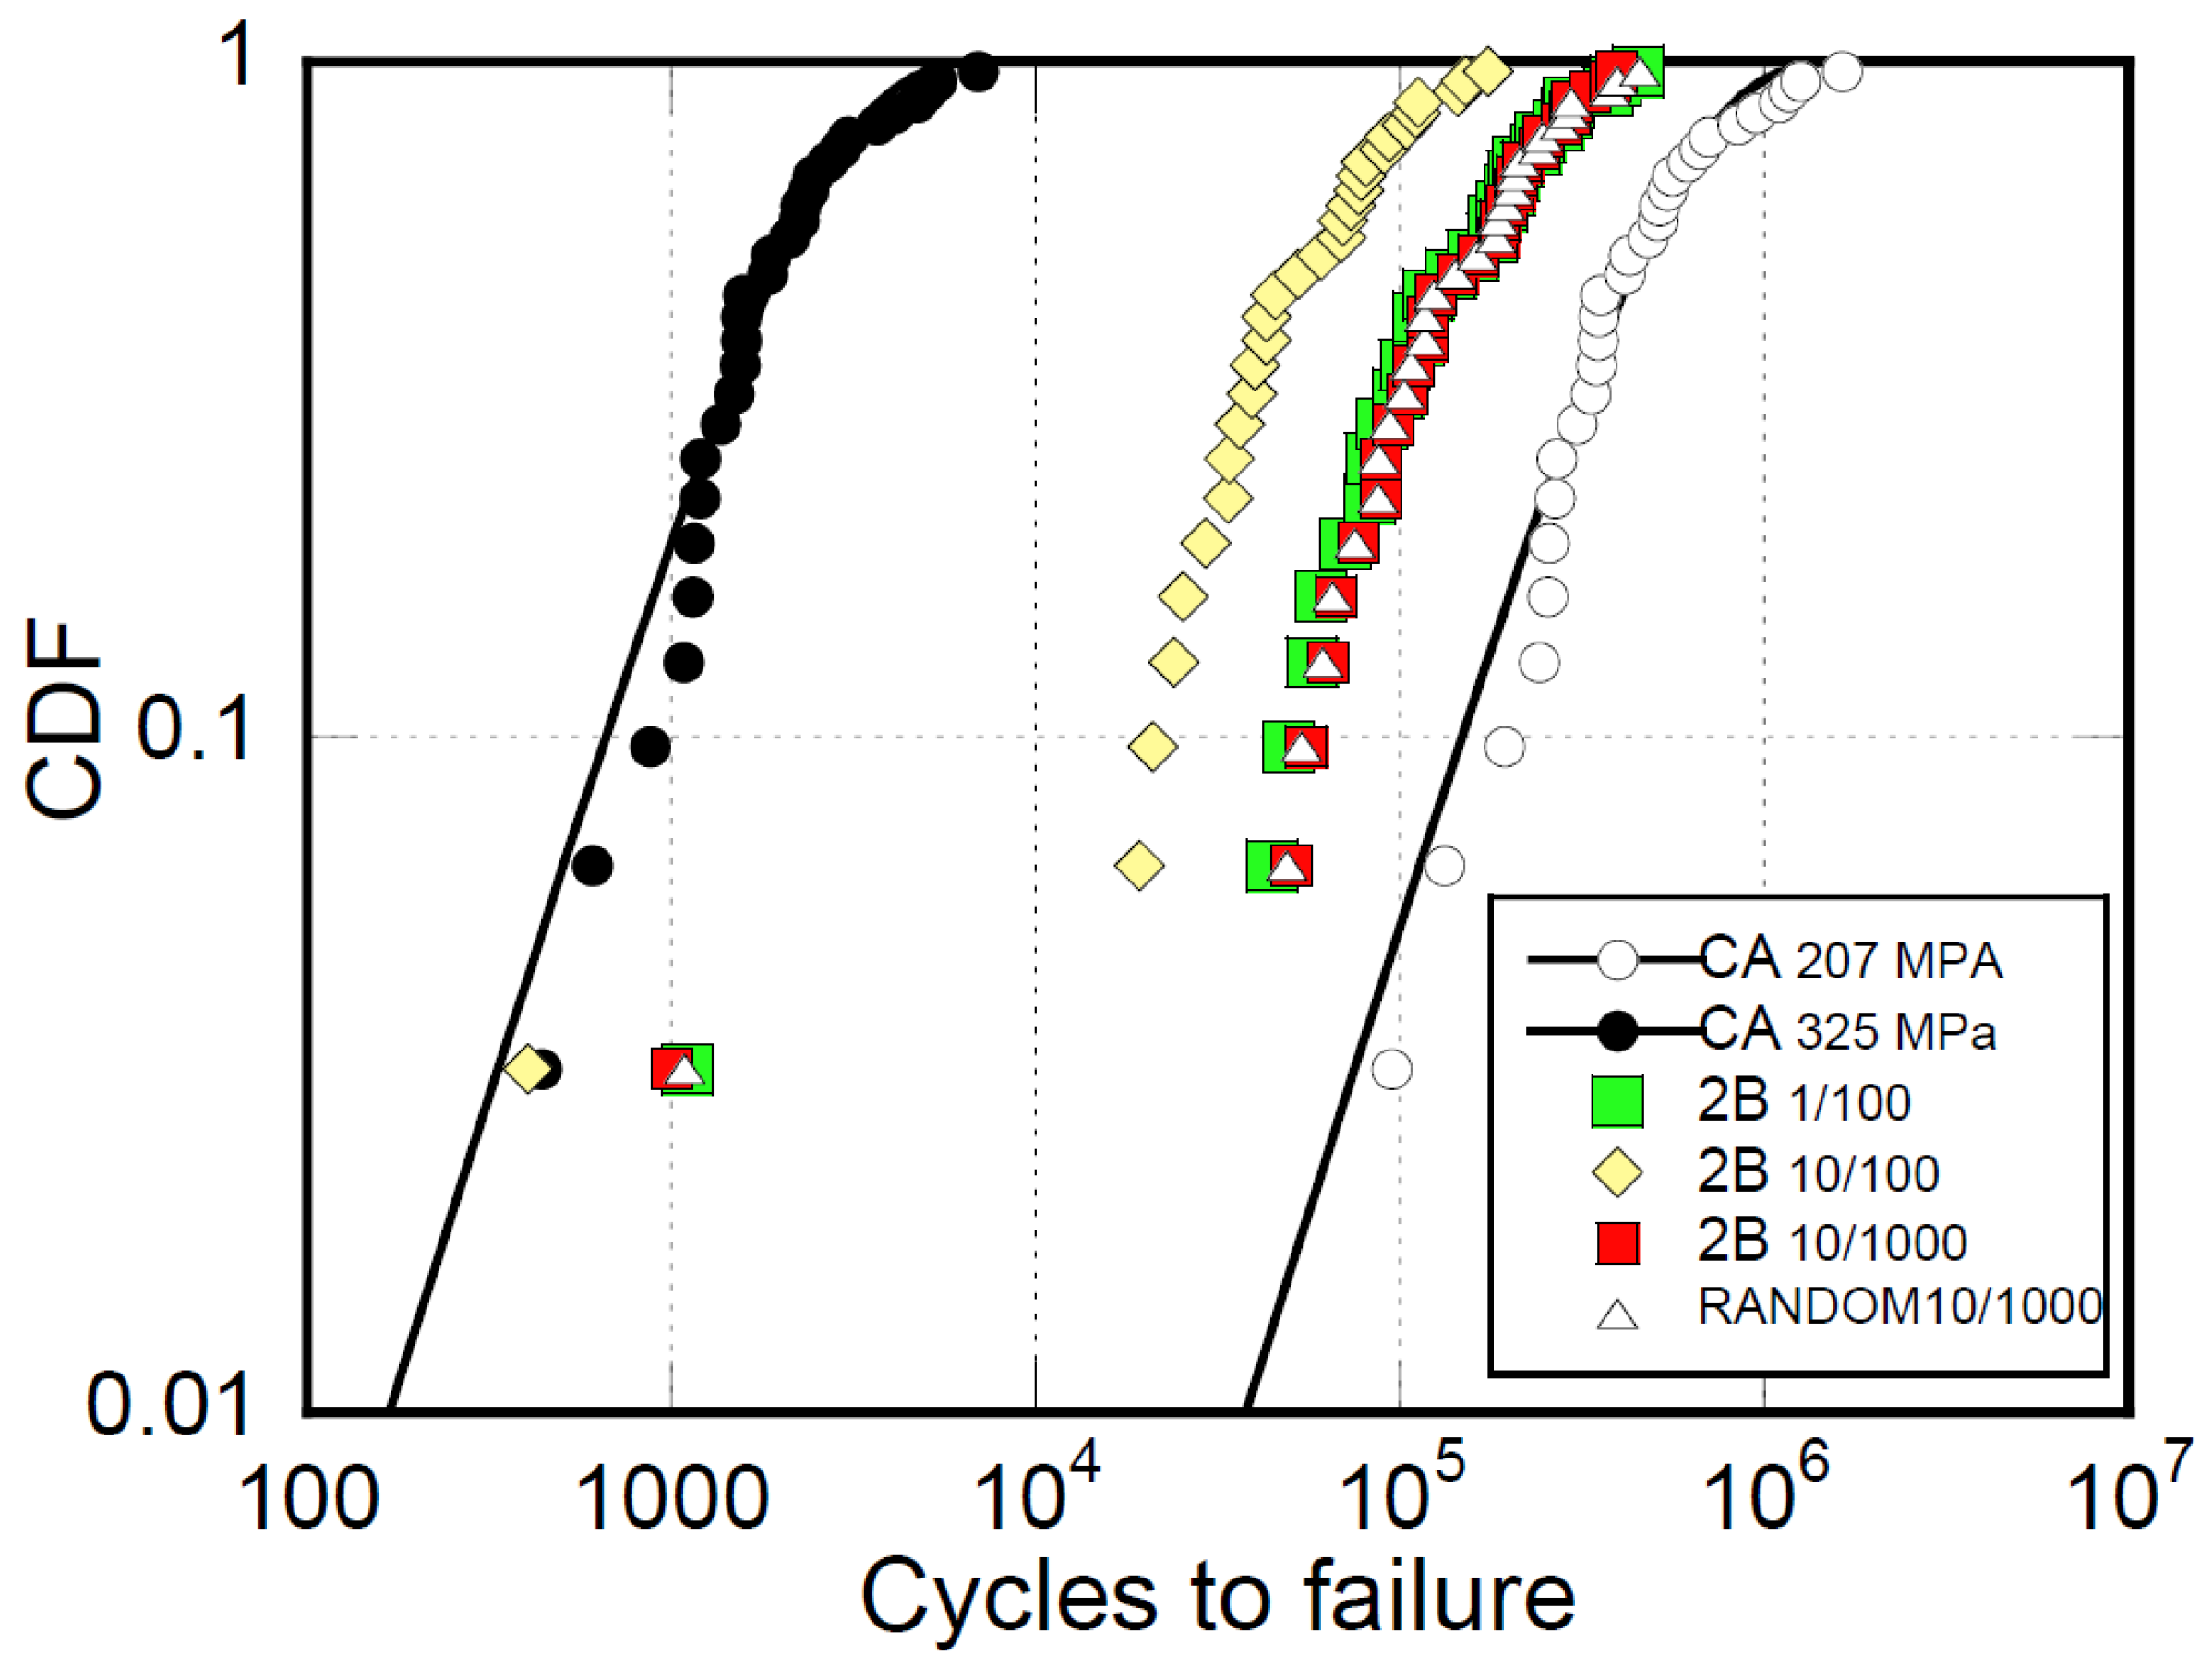
Figure 15.
Predicted lifetime response to repeated block loading consisting of ten cycles at 414 MPa, 100 cycles at 325 MPa, and 1000 cycles at 235 MPa compared to the constant amplitude fatigue data.
Figure 15.
Predicted lifetime response to repeated block loading consisting of ten cycles at 414 MPa, 100 cycles at 325 MPa, and 1000 cycles at 235 MPa compared to the constant amplitude fatigue data.
Disclaimer/Publisher’s Note: The statements, opinions and data contained in all publications are solely those of the individual author(s) and contributor(s) and not of MDPI and/or the editor(s). MDPI and/or the editor(s) disclaim responsibility for any injury to people or property resulting from any ideas, methods, instructions or products referred to in the content. |
© 2025 by the authors. Licensee MDPI, Basel, Switzerland. This article is an open access article distributed under the terms and conditions of the Creative Commons Attribution (CC BY) license (http://creativecommons.org/licenses/by/4.0/).
Copyright: This open access article is published under a Creative Commons CC BY 4.0 license, which permit the free download, distribution, and reuse, provided that the author and preprint are cited in any reuse.


