
Submitted:
26 June 2025
Posted:
27 June 2025
You are already at the latest version
Abstract
This study explores the initial stages of recrystallization in interstitial-free (IF) steel subjected to an unconventional continuous annealing process with a controlled thermal gradient. A cold-rolled steel strip was exposed to varying annealing temperatures along its length, allowing for analysis of microstructural evolution under different thermal conditions. The microstructure and stored energy were evaluated at various positions along the strip using Electron Backscatter Diffraction (EBSD), with an emphasis on the effects of local misorientation gradients.
The results underscore the significant influence of local misorientation and structural inhomogeneity on the kinetics of recrystallization. A notable correlation was identified between the non-recrystallized fraction (NRF) and the misorientation gradient, suggesting that even minor reductions in misorientation can substantially modify the kinetics of recrystallization. Collectively, these findings highlight the crucial role of stored energy distribution and texture evolution in the initial stages of recrystallization during continuous annealing, thereby providing valuable insights for optimizing thermal processing in interstitial-free (IF) steels.
Keywords:
recrystallization
; recovery
; misorientation gradient
; EBSD
; crystallographic texture
1. Introduction
Interstitial free (IF) steel is widely regarded within the automotive industry as the material of choice for its excellent drawability[1]. Good deep-drawability is achieved through a homogeneous recrystallization texture with a strong fiber texture such that the {111} crystal plane is parallel to the rolling plane (the γ-fiber). The γ-fiber is obtained through the appropriate selection of chemical composition and meticulous control of the thermomechanical process, as is done for commercially manufactured IF steels. The manufacturing process of IF steel sheets comprises four main stages: steelmaking, continuous casting, cold rolling, and annealing. Regarding the annealing process, the application of continuous annealing (CA) allows achieving higher annealing temperatures than possible with batch annealing (BA). This results in a reduction in recovery times and an increase in recrystallisation kinetics. The CA process exerts a profound influence on the recrystallisation texture of IF steel. The application of elevated annealing temperatures and rapid cooling rates facilitates homogeneous recrystallisation and grain growth, resulting in a uniform and fine microstructure. This process optimizes the formability and mechanical properties of IF steel, which is of paramount importance for demanding industrial applications [2,3].
Plastic deformation in crystalline metals is primarily accommodated by the movement of dislocations, facilitating shear deformation by slip between atom planes, which is a dissipative process whereby thermal energy is released. During the deformation process, dislocations are created, move, interact with one another and accumulate. This accumulation is not uniform; in response to gradients in plastic deformation, the material must maintain internal mechanical compatibility. This requirement leads to the formation of geometrically necessary dislocations (GNDs). GNDs accommodate strain differences between adjacent regions of the same grain. This redistribution generates local angular variations in crystallographic orientation, known as orientation gradients.[4].
During plastic deformation of high stacking fault materials such as low carbon steels, due to dynamic recovery processes, dislocations are self-organized in a cellular structure as strain increases; the average cell size will diminish, accompanied by an increase in the misorientation between adjacent cells [4]. This research aims to examine the variation of stored energy in IF steel during the continuous annealing process, utilizing the local misorientation gradient as an indicative parameter, which is known to have a positive correlation with stored energy [5,6,7,8,9]. To this end, the Electron Backscattered Diffraction (EBSD) technique has been employed to obtain precise measurements of the misorientation gradients at various stages of the recrystallization process [10,11,12]. The present study has examined samples subjected to varying degrees of deformation, as well as those in different states of recovery. This approach allows for a detailed understanding of how the internal energy of the material is distributed among various crystal orientations and how it evolves during annealing, providing valuable information that can be used to optimize industrial processes and improve material properties
2. Materials and Methods
The chemical composition of the as-received samples is listed in Table 1. The samples were commercially hot rolled to a thickness of 3.5 mm before undergoing cold rolling in the laboratory with varying degrees of thickness reduction (75%, 80%, 85%, and 90%) through multiple passes using a two-high rolling mill with rolls having a diameter of 350 mm. Subsequently, each cold-rolled strip, measuring 400 mm long and 25 mm wide, was subjected to a gradient annealing treatment (Figure 1a). The process involved the immersion of one end of the sample in a salt bath oven for a period of 120 to 200 s, whereby the temperature of 950 °C was indicated by the thermocouple positioned centrally within the salt bath. In contrast, the opposite end of the strip was secured to a solid copper block kept at room temperature. The temperature variations along the strip were meticulously recorded using five thermocouples (TC), strategically welded at intervals along its length (Figure 1b). The recorded temperatures revealed a gradient, whereby the end immersed in the oven reached a temperature of 900°C. The end attached to the copper block registered a temperature of 60°C.
This unconventional gradient annealing approach has been selected to enable the simultaneous examination of microstructural and mechanical transformations across a broad temperature range within a single sample. Unlike traditional uniform annealing methods, this technique allows for continuous observation of temperature-dependent phenomena, enhancing efficiency and reducing experimental variability by eliminating discrepancies between batches. Additionally, it offers valuable insights into the localized effects of thermal gradients commonly observed in industrial practices, which can be challenging to replicate in laboratory conditions.
However, this methodology presents certain challenges, including the need for precise control and accurate measurement of the temperature profile along the sample, as well as the complexity of interpreting results due to the non-uniform thermal history. Despite these drawbacks, the gradient annealing strategy provides significant advantages for studying temperature-dependent behaviors with high spatial resolution and under more realistic thermal conditions.
The microstructural characterization at each of the points monitored by the thermocouples was performed by electron backscatter diffraction (EBSD). EBSD measurements were conducted using an FEI Quanta™ 450-FEG-SEM, which was equipped with a Hikari EBSD camera. Sample preparation for EBSD analysis involved the application of conventional grinding, polishing, and electropolishing methods. The scanning electron microscope (SEM) was operated with an acceleration voltage of 20 kV and a beam current of 2.3 nA. Each scan for microstructural analysis encompassed approximately 1,000,000 points within an area of 35 × 35 µm², with a step size of 0.1 µm. To analyze the crystallographic textures, scans were conducted in an area of 385 x 1280 µm² with a step size of 0.2 µm, comprising approximately 1,000,000 points. To analyze the progress of recrystallisation between thermocouples 1 and 2, each millimeter is subjected to examination. This is achieved through a scan of an area measuring 250 µm x 1000 µm, with a step size of 0.4 µm, with approximately 700,000 points. The data were subjected to post-processing using OIM™ software version 8.2. [13]
The assessment of locally stored energy due to plastic deformation, as determined through EBSD, has been carried out using metrics based on kernels, specifically the Kernel Average Misorientation (KAM). This metric is critically dependent on the number of nearest neighbours considered. To mitigate this intrinsic dependence, the use of the KAM slope has been reported as a metric for plastically stored energy. [10,12,14]. This approach consists of evaluating, for each pixel, the misorientation gradient (Δθ/Δx), as it was observed that for n nearest neighbours (with n ≤ 4), there is a linear increase of the KAM as a function of the number of nearest neighbours. The dimension of this slope is °/µm and corresponds to the elements of the curvature tensor described by Nye [15]. Pantleon [16] demonstrated that this curvature tensor is positively correlated with the dislocation density. This approach enables a more robust estimation of the locally stored energy, circumventing the constraints associated with selecting the number of nearest neighbors in the KAM calculation.
In the post-processing of the data, the Kuwahara filter was employed to optimize the angular resolution of the EBSD measurement [17,18,19]. The filter applies edge-preserving noise smoothing, which is crucial for detecting short-range misorientations, as it suppresses short-range noise induced by experimental scatter. In the study by Brough et al.[20], It was demonstrated that the utilization of the Kuwahara filter can increase the angular resolution to less than 0.02°, which significantly facilitates the detailed analysis of EBSD maps of the type pursued in this study, and which are relevant to revealing subtle misorientation changes observed during recovery and recrystallization processes. Conversely, the recrystallised microstructure was identified through the application of a criterion based on the Grain Orientation Spread (GOS), which yielded a value of GOS < 1.5 °[21,22,23].
3. Results
Figure 2a–e shows the inverse pole Figures (IPF) of various samples subjected to deformation by rolling to different reductions. It is evident that as the reduction percentage rises, the fragmentation of the grains also increases, signifying notable microstructural changes. Figure 2(e-h) depicts the gradual evolution of texture with increased deformation. Notably, as reduction increases, the α fiber largely dominates and intensifies.
Figure 3 presents the frequency distribution and accumulative frequency of the misorientation gradient across various reduction percentages. Figure 3a illustrates that the distributions significantly shift to larger values of orientation gradients with increasing rolling reduction. Figure 3b further underscores that with reduction ratio on the rise, the values of the misorientation gradient trend towards larger values. This observed behavior suggests that a higher reduction percentage is associated with an enhancement in short-range misorientation, thereby reflecting the influence of strain amplitude on the microstructural heterogeneity induced within the material.
Figure 4 illustrates the microstructural evolution at distinct locations along a strip subjected to continuous heat treatment under the influence of a thermal gradient. Illustrated in Figure 4a–d, grain orientation spread (GOS) maps depict that, following annealing at temperatures of 60°C and 145°C, the deformed microstructure is preserved, exhibiting a pronounced degree of internal grain misorientation, as observed in Figure 4a,b. At a temperature of 600°C, recrystallization commences in select regions, as evidenced in Figure 4c. By reaching 800°C, the recrystallization process is complete, leading to minimal internal misorientation among the grains, as demonstrated in Figure 4d. An examination of the crystallographic texture at each analyzed point is provided in Figure 4e–h. Notably, the intensity of the α-fiber diminishes with increasing peak temperature, eventually vanishing altogether, while a distinct γ-fiber is observed to emerge once the material attains the fully recrystallized state.
As illustrated in Figure 5, a reduction in peak temperature is accompanied by an increase in the mean misorientation gradient and the standard deviation of said gradient. This increase in standard deviation is indicative of greater heterogeneity in the microstructure, or variations in internal misorientations within the grains.
Figure 4 illustrates that the fully recrystallized fraction is attained between thermocouple 1 and thermocouple 2. To evaluate the recrystallization process, a rigorous analysis was performed on the segment between these two locations utilizing Electron Backscatter Diffraction (EBSD). The findings of this analysis are depicted in Figure 6, which demonstrates that the percentage of recrystallization at the initial millimeter of the sample reaches 46%. In contrast, at the sixth millimeter, this percentage has increased to 77%. This significant enhancement in recrystallization throughout the sample substantiates the efficacy of the methodology employed to monitor the process.
Furthermore, Figure 7 illustrates the energetic evolution of the material between ~600 °C and ~ 630 °C. In Figure 7a, the variation of the mean misorientation gradient is shown as a function of distance along the sample. Notably, as the temperature increases, both the gradient value and its standard deviation decrease, indicating an improvement in the homogeneity of the material. It is important to emphasize that the misorientation gradient was derived exclusively from the deformed microstructure.
Figure 7b presents the relationship between the fraction of deformed/recovered (non-recrystallized) structure and the normalized mean misorientation gradient, expressed as a percentage of its maximum value. The correlation observed between energy reduction and the deformed/recovered microstructure follows a potential growth pattern.
Figure 8 shows the different ODFs for the non-recrystallized grain (deformed/recovery microstructure) (Figure. 8a) and the recrystallized grains (Figure. 8 b). The ODF reveals the development of a strong γ fiber in the early stages of recrystallization and a strong α fiber for the non-recrystallized microstructure.
4. Discussion
Figure 2(a-d) illustrates the evolution of microstructure, while Figure 2(e-h) depicts the texture as a function of increasing degrees of deformation. This increase in deformation leads to greater grain fragmentation and a more heterogeneous microstructure. Concurrently, the intensity of the alpha component of the deformation texture exhibits a significant variation, increasing from a maximum value of 7.8 in the {112}<110> component at 75% reduction to 16.3 at 90% reduction. The energetic changes associated with varying degrees of reduction are presented in greater detail in Figure 3. As the degree of reduction increases, the misorientation gradient progresses towards higher values. The analysis conducted by Rollet et al. [24] indicates that the orientation gradients are predominantly concentrated near the grain boundaries in Fe-α alloys, as observed in both experimental and numerical experiments. This concentration can be attributed to the accumulation of dislocations, which is critical for accommodating plastic deformation and is closely associated with local stress gradients. This phenomenon, involving changes in crystallographic orientation due to the activation of multiple slip systems, is similarly observed in shear bands, where deformation is intensified, leading to significant variation in orientation within adjacent grains.
Both Figure 4c and Figure 6 illustrate the initiation of primary recrystallization. The microstructural analysis indicates that the onset of recrystallization is primarily concentrated at high-angle grain boundaries (HAGB) and is predominantly observed in γ-fiber grains exhibiting the <111> crystal orientation parallel to the normal direction (ND). When evaluating these observations within the framework of the deformed microstructure, it is evident that the kinetics of recovery and recrystallization are enhanced by increasing regions of significant misorientation. During the plastic deformation phase, dislocations interact with one another and with various defects, resulting in the generation of internal stresses and modifications to the crystalline orientation. As the percentage reduction increases, the significance of grain fragmentation and the accumulation of imperfections becomes more pronounced, contributing to an enhancement of misorientation within the microstructure [25,26].
Figure 7a demonstrates the dynamics of stored energy across different stages of recovery and recrystallisation. It is evident that an increase in both peak temperature and the volume fraction of recrystallisation leads to a progressive reduction in stored energy of deformed matrix grains that have not yet been consumed by the growing recrystallized grains. Recrystallisation is characterized as a process that diminishes energy by substituting deformed regions with defect-free grains. Conversely, recovery serves to reduce energy without altering the microstructural configuration. The kinetic equation governing recrystallization has been extensively modeled using an Arrhenius form [27,28,29,30,31], which elucidates the exponential relationship between the recrystallization rate and temperature, attributed to atomic diffusion. Nonetheless, uncertainties persist regarding the precise impact of heterogeneity on deformation mechanisms and grain nucleation across different alloys, as contemporary models fail to account for the observed variability under disparate processing conditions fully.
The correlation between the unrecrystallized volume and the stored energy in metals subjected to plastic deformations is governed by dislocation density. Analyzing the relationship between the recovered microstructure and its corresponding stored energy (refer to Figure. 7. b) reveals that the energy follows a potential model. This finding indicates that the non-recrystallized fraction (NRF) exhibits heightened sensitivity to variations in the misorientation gradient, particularly as it decreases more markedly from higher misorientation values during annealing. This observation emphasizes the influence of fluctuations in strain energy accumulation on the recrystallization dynamics in interstitial-free (IF) steel.
The present results provide insight into the role of misorientation gradients in the recrystallization behavior of IF steels. EBSD inverse pole Figure (IPF) maps shown in Figure 6f (recrystallized grains) and 6 h (non-recrystallized grains) reveal a distinct difference in morphology and orientation distribution between the two populations. This microstructural contrast is further supported by the texture analysis in Figure 8a,b, where the non-recrystallized regions display an α-fiber texture, while the recrystallized grains exhibit a pronounced γ-fiber component.
These observations suggest that orientations characterized by higher initial misorientation gradients may recrystallize preferentially. This hypothesis is consistent with the idea that recrystallization is strongly influenced by orientation-dependent stored energy, as reflected in the local misorientation fields. Higher stored energy associated with specific orientations can act as a driving force for nucleation and growth during annealing.
5. Conclusions
The study of recrystallization in interstitial-free (IF) steels using a non-conventional continuous annealing process shows that recovery and recrystallization are strongly influenced by the misorientation gradient generated during prior deformation. Stored energy of cold deformation is a direct function of dislocation density, promoting the nucleation of new grains during annealing.
Microstructural characterization and stored energy analysis reveal that structural heterogeneity and local misorientation variations are key factors governing recrystallization kinetics. The non-recrystallized fraction (NRF) exhibits a nonlinear relationship with the reduced average misorientation gradient, following a power-law-type model with a high exponent. This indicates a strong sensitivity of the recrystallization process to small changes in local misorientation.
EBSD texture analysis confirms that non-recrystallized regions retain an α-fiber texture, while recrystallized grains develop a pronounced γ-fiber component. This evolution suggests that orientations with higher stored energy—associated with higher misorientation gradients—are more prone to recrystallization. Overall, the misorientation gradient emerges as a key parameter for predicting and evaluating the progress of recrystallization during thermal processing of IF steels.
Author Contributions
Conceptualization, Estefania Sepulveda Hernandez, and Leo A.I Kestens.; methodology, Estefania Sepulveda Hernandez, Felipe Castro Cerda, Leo A.I Kestens.; software Estefania Sepulveda Hernandez, Leo A.I Kestens.; validation, Estefania Sepulveda Hernandez; formal analysis, Estefania Sepulveda Hernandez, Felipe Castro Cerda, and Leo A.I Kestens.; investigation, Estefania Sepulveda Hernandez, Felipe Castro Cerda and Leo A.I Kestens . Resources, Estefania Sepulveda Hernandez, Leo A.I, Kestens ;Data curation, Estefania Sepulveda Hernandez; writing—original draft preparation, Estefania Sepulveda Hernandez writing—review and editing, Leo A.I Kestens, Felipe Castro Cerda, and Estefania Sepulveda Hernandez; visualization, Estefania Sepulveda Hernandez.; supervision, Felipe Castro Cerda and Leo A.I Kestens .; project administration, Estefania Sepulveda Hernandez.; funding acquisition, Estefania Sepulveda Hernandez, and Leo A.I Kestens. All authors have read and agreed to the published version of the manuscript.”.
Funding
This research was funded by the National Agency for Research and Development (ANID-Chile), grant number 2021– 21210158.
Conflicts of Interest
The authors declare that they have no known competing financial interests or personal relationships that could have appeared to influence the work reported in this paper.
References
- Ye: W.; Le Gall, R.; Saindrenan, G. A Study of the Recrystallization of an IF Steel by Kinetics Models. Materials Science and Engineering A 2002, 332. [CrossRef]
- Saha, R.; Ray, R.K. Effect of Severe Cold Rolling and Annealing on the Development of Texture, Microstructure and Grain Boundary Character Distribution in an Interstitial Free (IF) Steel. ISIJ International 2008, 48. [CrossRef]
- Massardier, V.; Ngansop, A.; Fabrègue, D.; Merlin, J. Identification of the Parameters Controlling the Grain Refinement of Ultra-Rapidly Annealed Low Carbon Al-Killed Steels. Materials Science and Engineering A 2010, 527. [CrossRef]
- Humphreys, F.J.; Rohrer, G.S.; Rollett, A. Recrystallization and Related Annealing Phenomena (Third Edition); 2017;
- Every, R.L.; Hatherly, M. ORIENTED NUCLEATION IN LOW-CARBON STEELS. Texture 1974, 1. [CrossRef]
- Hutchinson, B. Nucleation of Recrystallisation. Scripta Metallurgica et Materiala 1992, 27. [CrossRef]
- Lefevre-Schlick, F.; Brechet, Y.; Zurob, H.S.; Purdy, G.; Embury, D. On the Activation of Recrystallization Nucleation Sites in Cu and Fe. Materials Science and Engineering: A 2009, 502. [CrossRef]
- Traka, K.; Sedighiani, K.; Bos, C.; Galan Lopez, J.; Angenendt, K.; Raabe, D.; Sietsma, J. Topological Aspects Responsible for Recrystallization Evolution in an IF-Steel Sheet – Investigation with Cellular-Automaton Simulations. Comput Mater Sci 2021, 198. [CrossRef]
- Diehl, M.; Kertsch, L.; Traka, K.; Helm, D.; Raabe, D. Site-Specific Quasi in Situ Investigation of Primary Static Recrystallization in a Low Carbon Steel. Materials Science and Engineering: A 2019, 755. [CrossRef]
- Moussa, C.; Bernacki, M.; Besnard, R.; Bozzolo, N. About Quantitative EBSD Analysis of Deformation and Recovery Substructures in Pure Tantalum. In Proceedings of the IOP Conference Series: Materials Science and Engineering; 2015; Vol. 89.
- Moussa, C.; Bernacki, M.; Besnard, R.; Bozzolo, N. Statistical Analysis of Dislocations and Dislocation Boundaries from EBSD Data. Ultramicroscopy 2017, 179. [CrossRef]
- Lanjewar, H.; Naghdy, S.; Verleysen, P.; Kestens, L.A.I. Statistical Analysis of Dislocation Substructure in Commercially Pure Aluminum Subjected to Static and Dynamic High Pressure Torsion. Mater Charact 2020, 160. [CrossRef]
- EDAX OIM Analysis Help. Chart 2013.
- Sepúlveda Hernández, E.; Nguyen-Minh, T.; Traka, K.; Castro Cerda, F.; Kestens, L.A.I. Orientation Dependence of Dynamic Compared to Static Recovery in Interstitial Free Steel. Scr Mater 2024, 249, 116151. [CrossRef]
- Nye, J.F. Some Geometrical Relations in Dislocated Crystals. Acta Metallurgica 1953, 1. [CrossRef]
- Pantleon, W. Resolving the Geometrically Necessary Dislocation Content by Conventional Electron Backscattering Diffraction. Scr Mater 2008, 58. [CrossRef]
- Kuwahara, M.; Hachimura, K.; Eiho, S.; Kinoshita, M. Processing of RI-Angiocardiographic Images. In Digital Processing of Biomedical Images; 1976.
- Humphreys, F.J. Grain and Subgrain Characterisation by Electron Backscatter Diffraction. J Mater Sci 2001, 36.
- Humphreys, F.J.; Bate, P.S.; Hurley, P.J. Orientation Averaging of Electron Backscattered Diffraction Data. J Microsc 2001, 201. [CrossRef]
- Brough, I.; Bate, P.S.; Humphreys, F.J. Optimising the Angular Resolution of EBSD. Materials Science and Technology 2006, 22. [CrossRef]
- Ayad, A.; Ramoul, M.; Rollett, A.D.; Wagner, F. Quantifying Primary Recrystallization from EBSD Maps of Partially Recrystallized States of an IF Steel. Mater Charact 2021, 171. [CrossRef]
- Mirzadeh, H.; Cabrera, J.M.; Najafizadeh, A.; Calvillo, P.R. EBSD Study of a Hot Deformed Austenitic Stainless Steel. Materials Science and Engineering A 2012, 538. [CrossRef]
- Alvi, M.H.; Cheong, S.W.; Suni, J.P.; Weiland, H.; Rollett, A.D. Cube Texture in Hot-Rolled Aluminum Alloy 1050 (AA1050)-Nucleation and Growth Behavior. Acta Mater 2008, 56. [CrossRef]
- Rollett, A.D.; Wagner, F.; Allain-Bonasso, N.; Field, D.P.; Lebensohne, R.A. Comparison of Gradients in Orientation and Stress between Experiment and Simulation. In Proceedings of the Materials Science Forum; 2012; Vol. 702–703.
- Beck, P.A.; Hu, H. Recrystallization, Grain Growth and Textures. American Society for Metals: Metals Park 1966, 393–433.
- Doherty, R.D.; Hughes, D.A.; Humphreys, F.J.; Jonas, J.J.; Juul Jensen, D.; Kassner, M.E.; King, W.E.; McNelley, T.R.; McQueen, H.J.; Rollett, A.D. Current Issues in Recrystallization: A Review. Materials Science and Engineering: A 1997, 238, 219–274. [CrossRef]
- Kraft, F.F.; Wright, R.N.; Jensen, M.K. Kinetics of Nonisothermal Recrystallization. Eur J Radiol 1996, 21.
- Todinov, M.T. On Some Limitations of the Johnson-Mehl-Avrami-Kolmogorov Equation. Acta Mater 2000, 48. [CrossRef]
- Ruitenberg, G.; Woldt, E.; Petford-Long, A.K. Comparing the Johnson-Mehl-Avrami-Kolmogorov Equations for Isothermal and Linear Heating Conditions. Thermochim Acta 2001, 378. [CrossRef]
- Farjas, J.; Roura, P. Modification of the Kolmogorov-Johnson-Mehl-Avrami Rate Equation for Non-Isothermal Experiments and Its Analytical Solution. Acta Mater 2006, 54. [CrossRef]
- Fanfoni, M.; Tomellini, M. The Johnson-Mehl-Avrami-Kolmogorov Model: A Brief Review. Nuovo Cimento della Societa Italiana di Fisica D - Condensed Matter, Atomic, Molecular and Chemical Physics, Biophysics 1998, 20. [CrossRef]
Figure 1.
(a) Representation of the behavior of the strip with a simulation of nonlinear heat transfer in a transient solution (200 sec), the temperature in degrees Celsius (b) Heating curve at different points of the strip.
Figure 1.
(a) Representation of the behavior of the strip with a simulation of nonlinear heat transfer in a transient solution (200 sec), the temperature in degrees Celsius (b) Heating curve at different points of the strip.
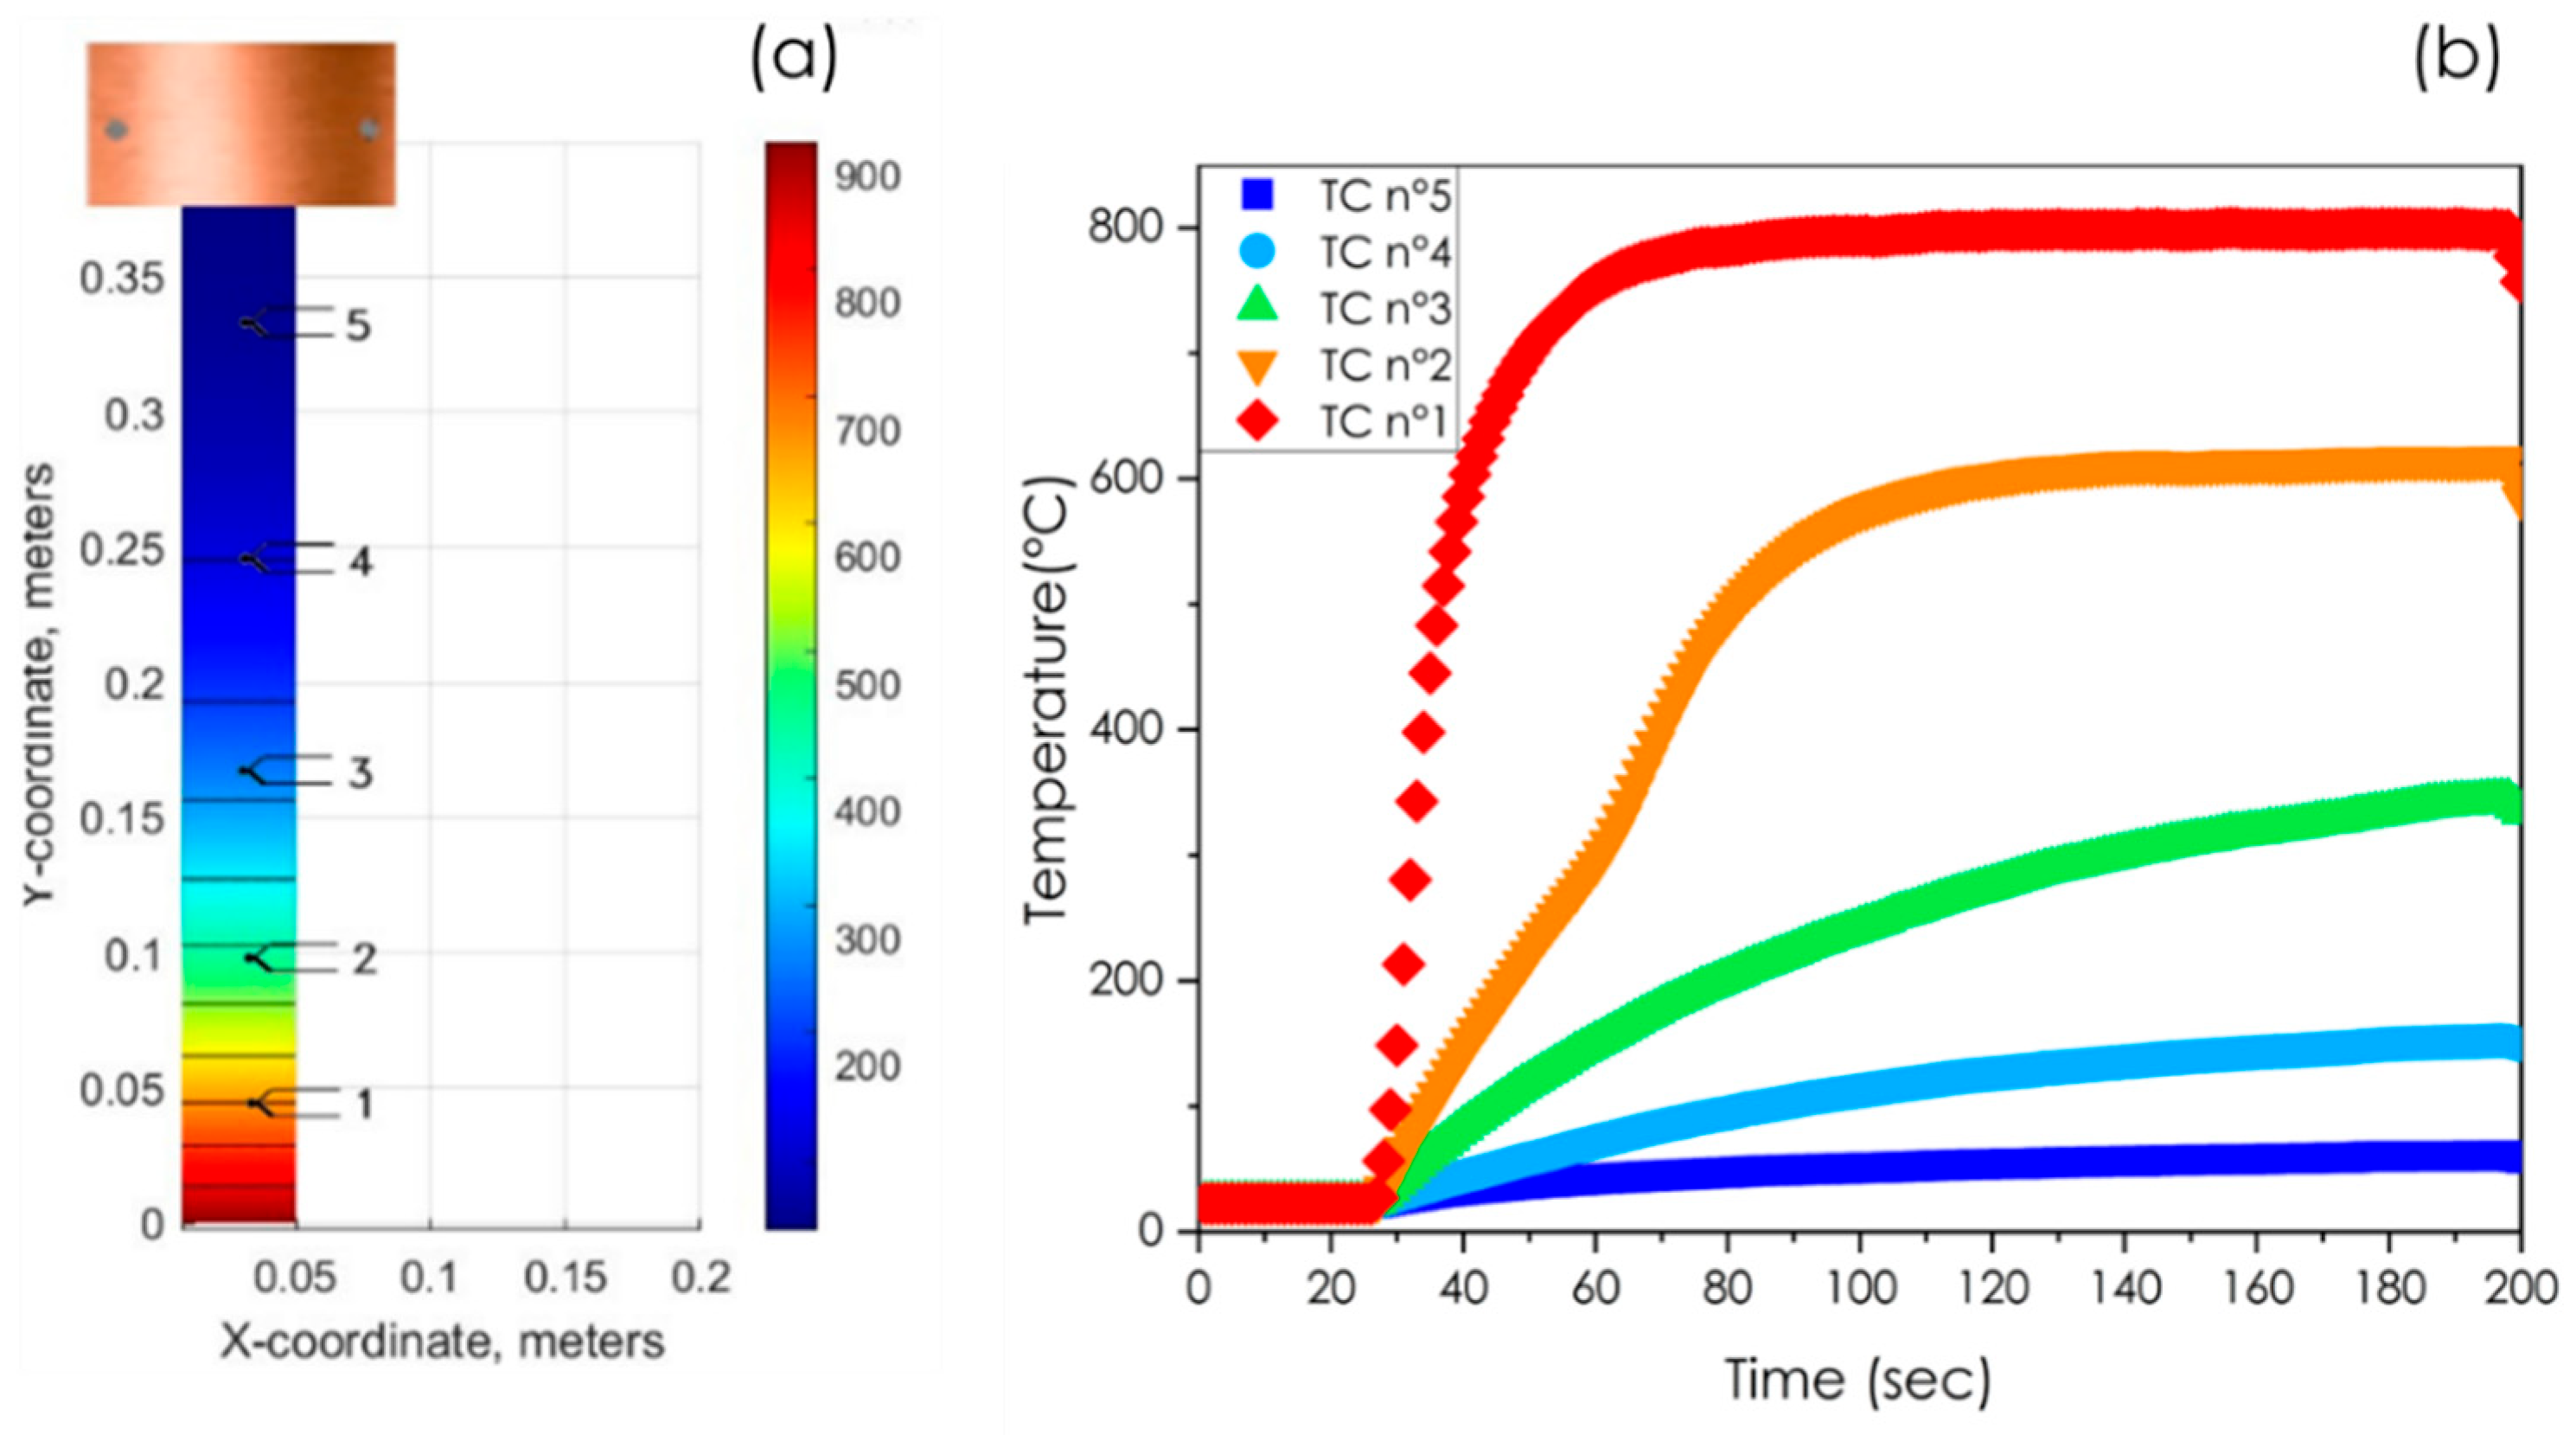
Figure 2.
Inverse Pole Figure (IPF) and φ2=45° sections of the Orientation Distribution Function (ODF) for Interstitial Free (IF) steel after cold rolling to different levels of thickness reduction: (a) and (e) 75%, (b) and (f) 80%, (c) and (g) 85%, and (d) and (h) 90%.
Figure 2.
Inverse Pole Figure (IPF) and φ2=45° sections of the Orientation Distribution Function (ODF) for Interstitial Free (IF) steel after cold rolling to different levels of thickness reduction: (a) and (e) 75%, (b) and (f) 80%, (c) and (g) 85%, and (d) and (h) 90%.
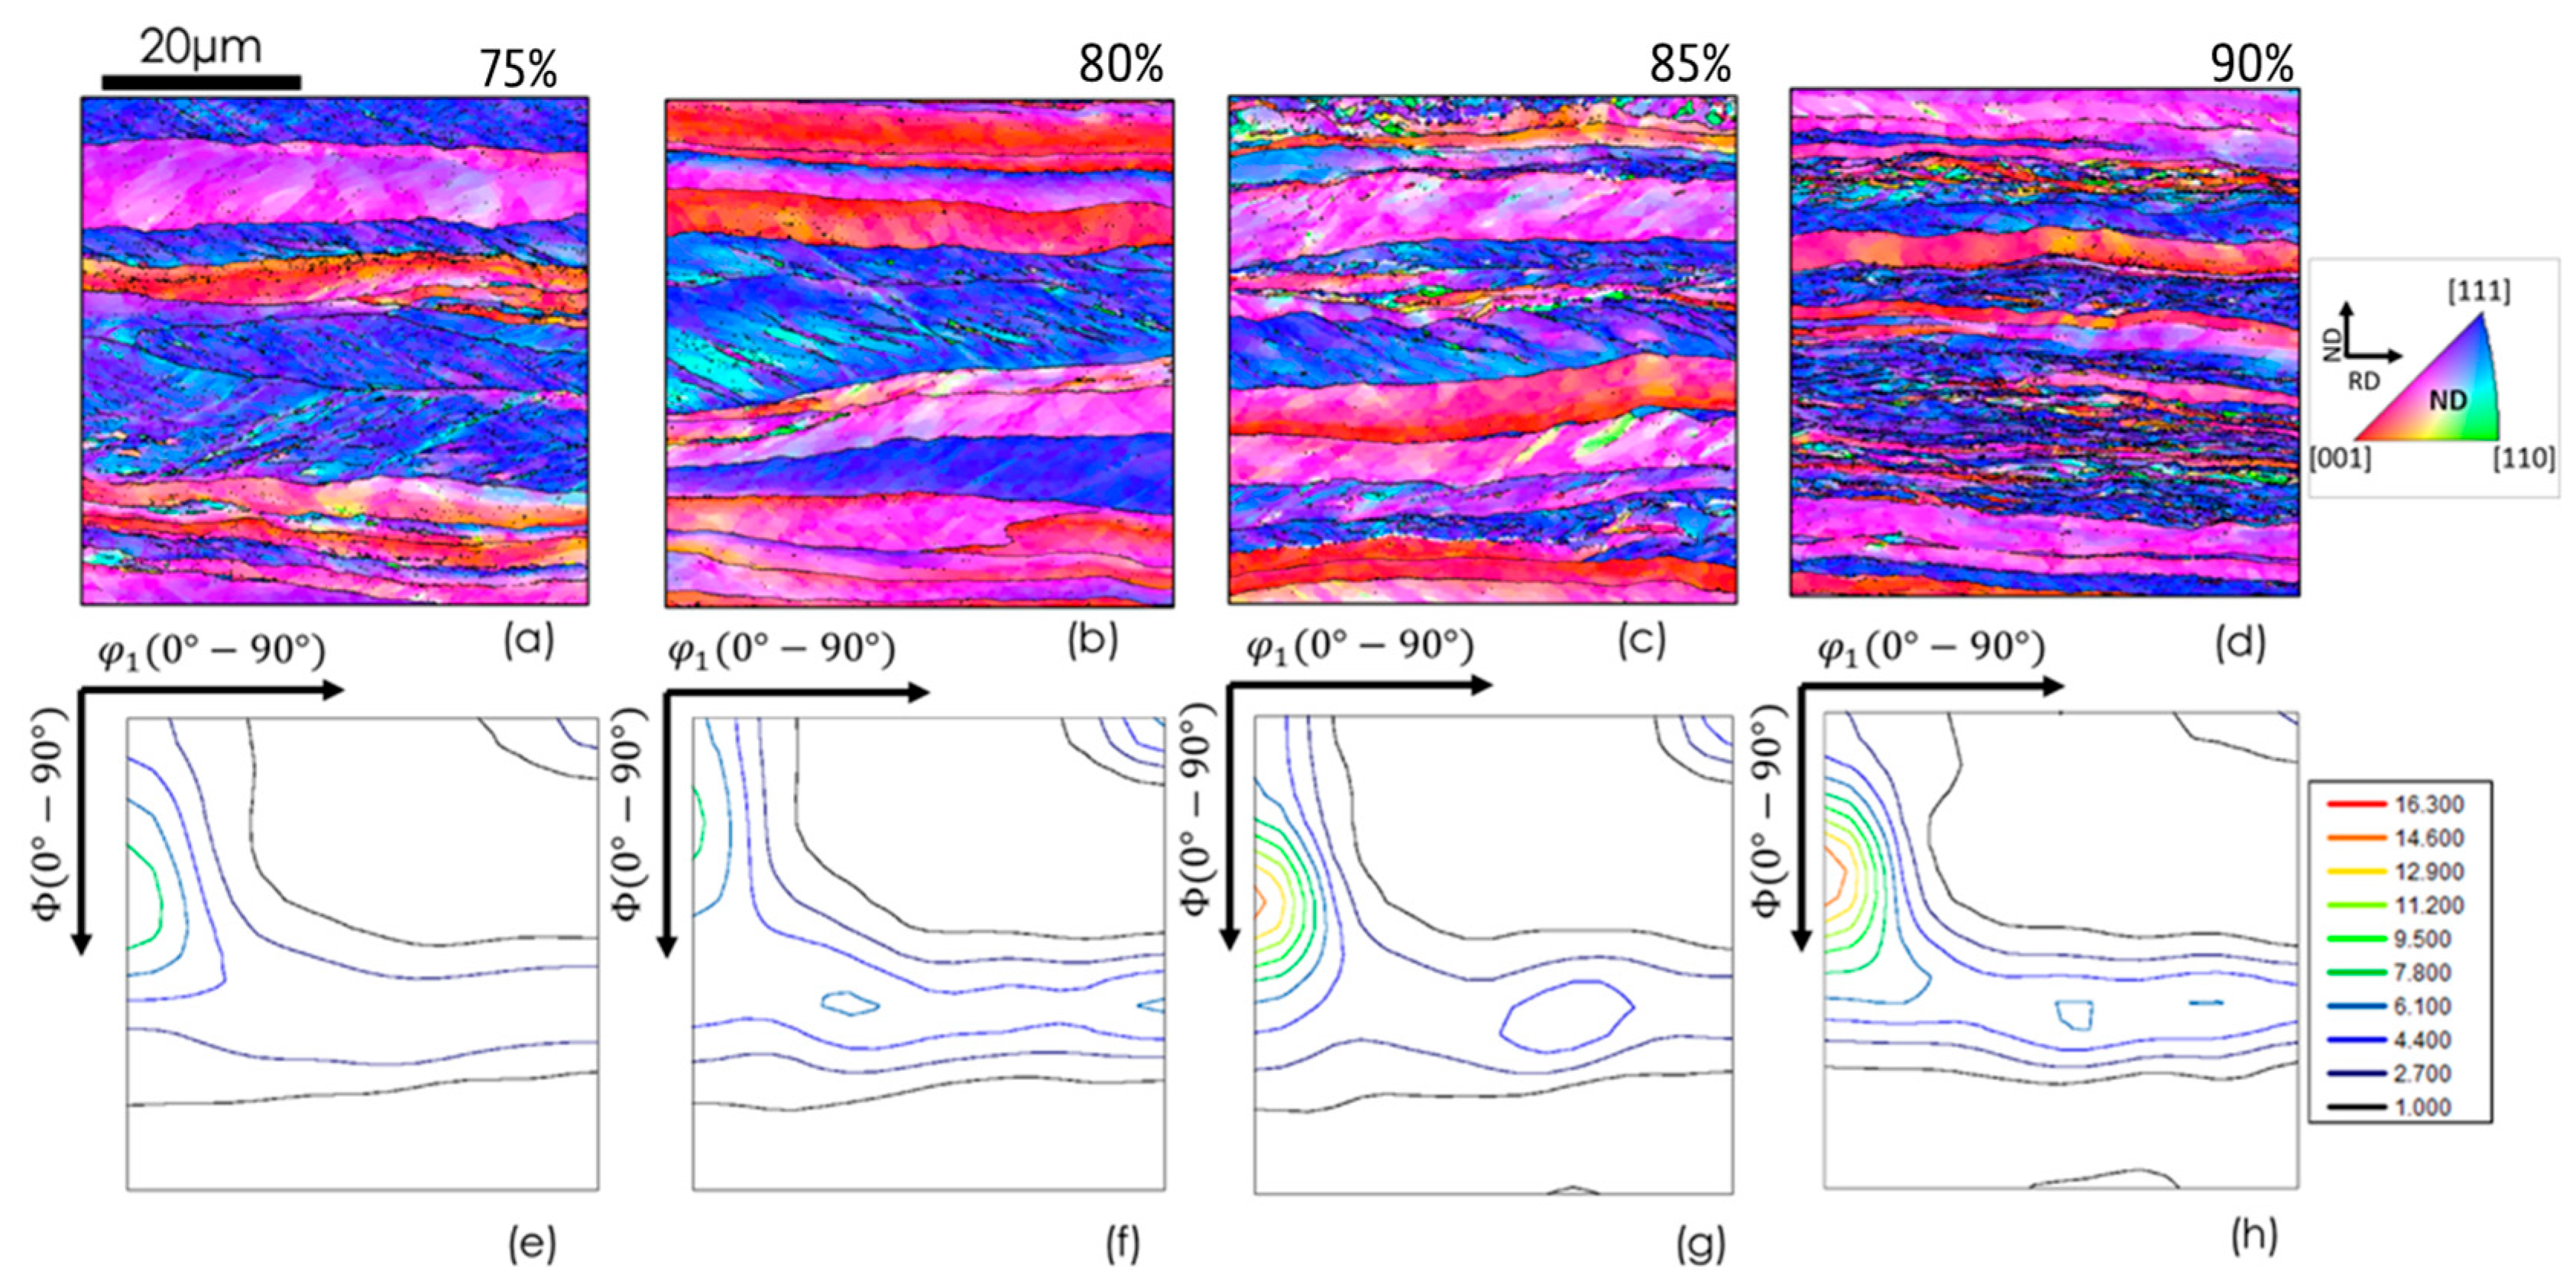
Figure 3.
a) Frequency of misorientation gradient as a function of the reduction percentage during cold rolling. b) Accumulative frequency of the misorientation gradient for the exact reduction percentages.
Figure 3.
a) Frequency of misorientation gradient as a function of the reduction percentage during cold rolling. b) Accumulative frequency of the misorientation gradient for the exact reduction percentages.
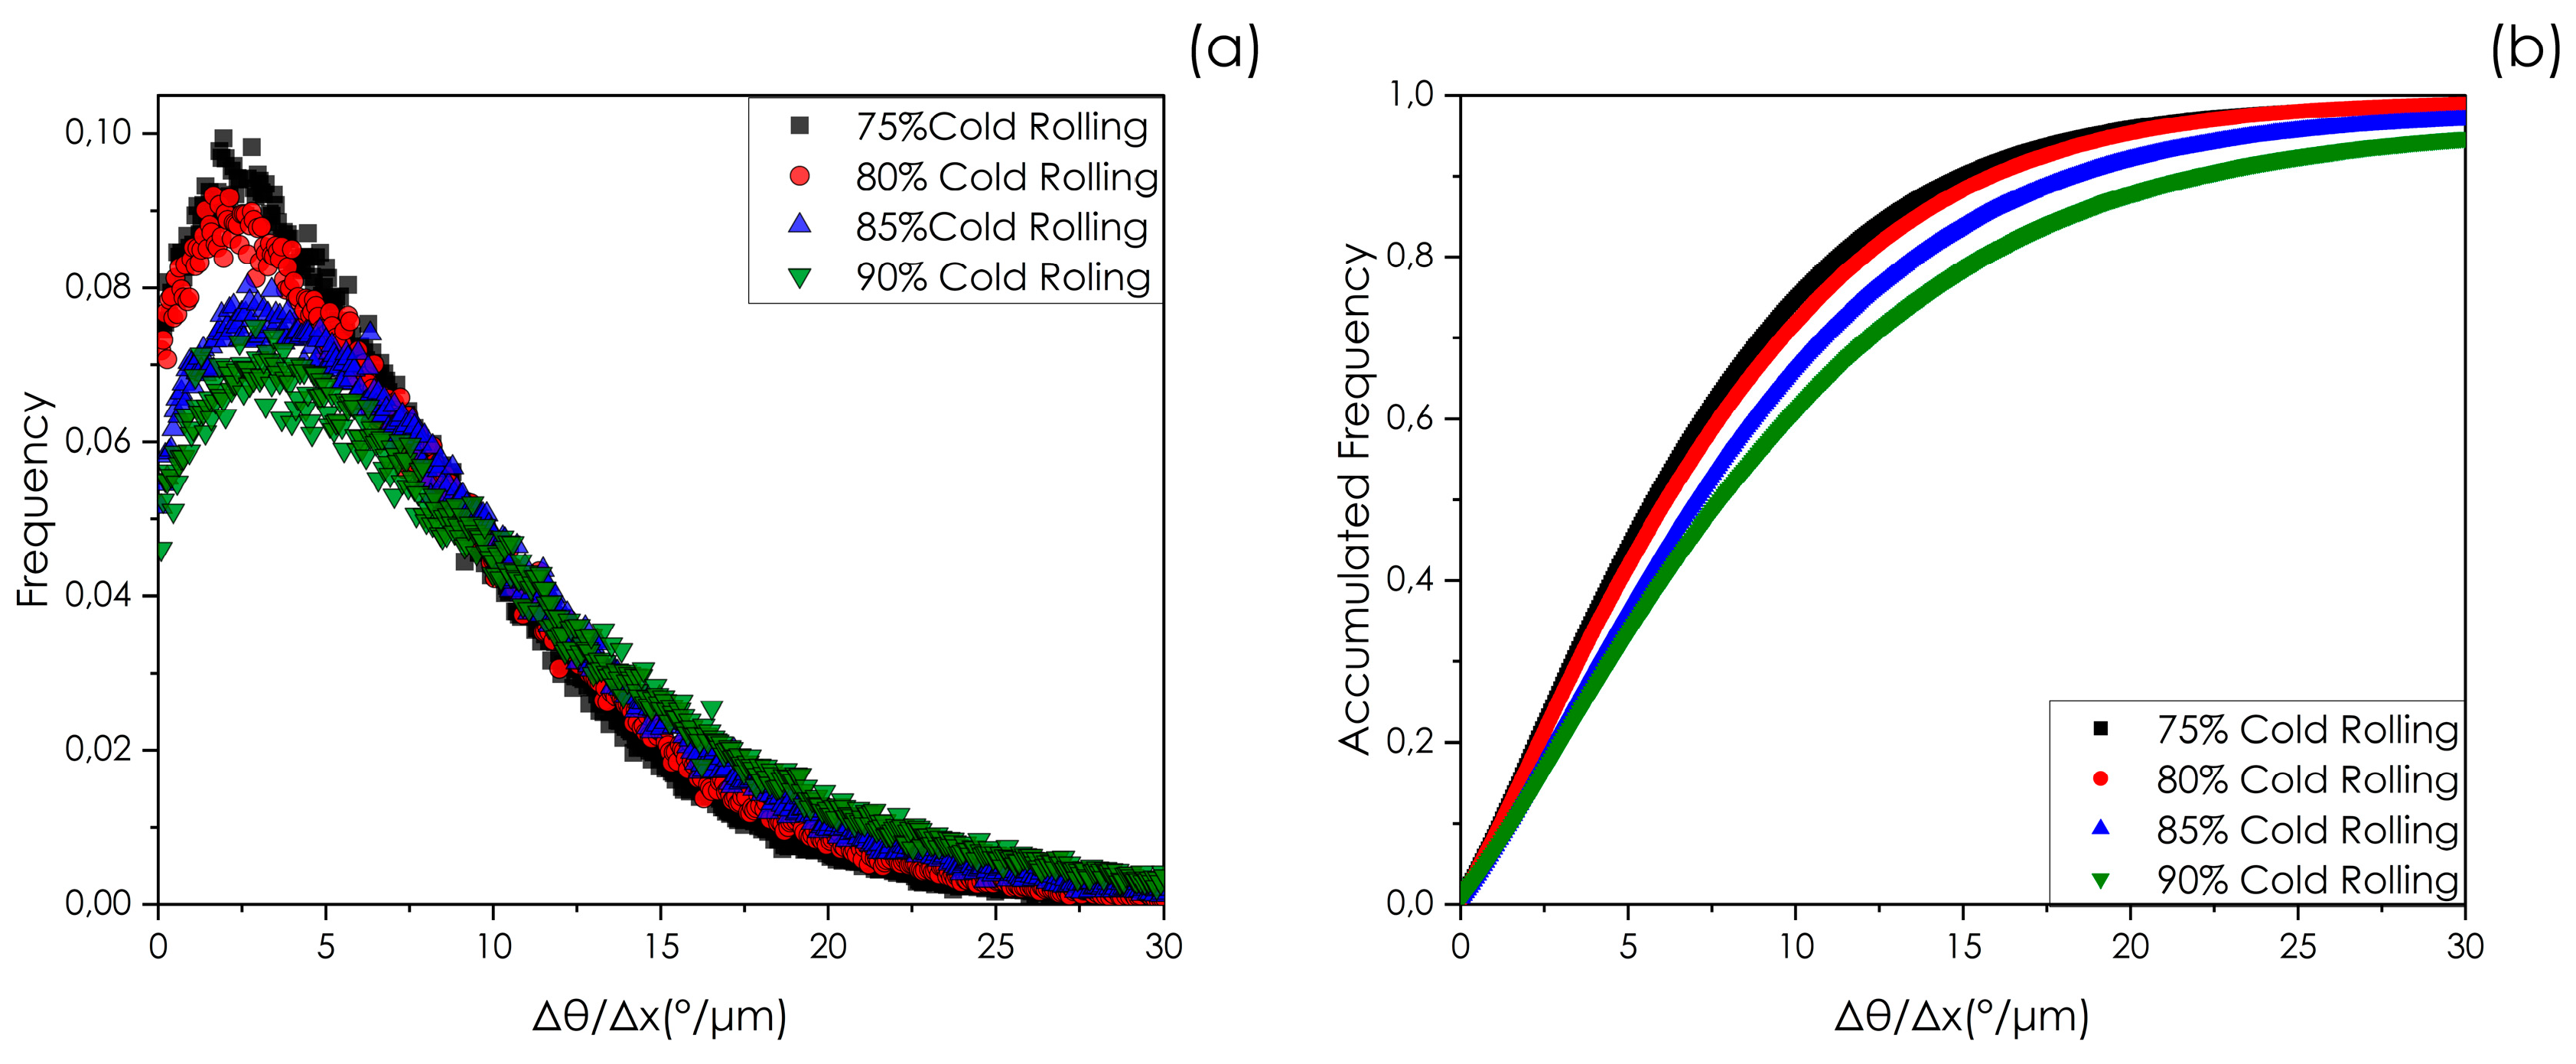
Figure 4.
Grain Orientation Spread (GOS) maps and sections of the Orientation Distribution Function (ODF) for Interstitial Free (IF) steel subjected to 80% reduction by cold rolling followed by continuous annealing. The GOS maps are shown for samples annealed at four different peak temperatures: (a) 60°C, (b) 145°C, (c) 600°C, and (d) 800°C. Correspondingly, φ2 = 45° sections of the ODF for these temperatures are depicted in panels (e), (f), (g), and (h).
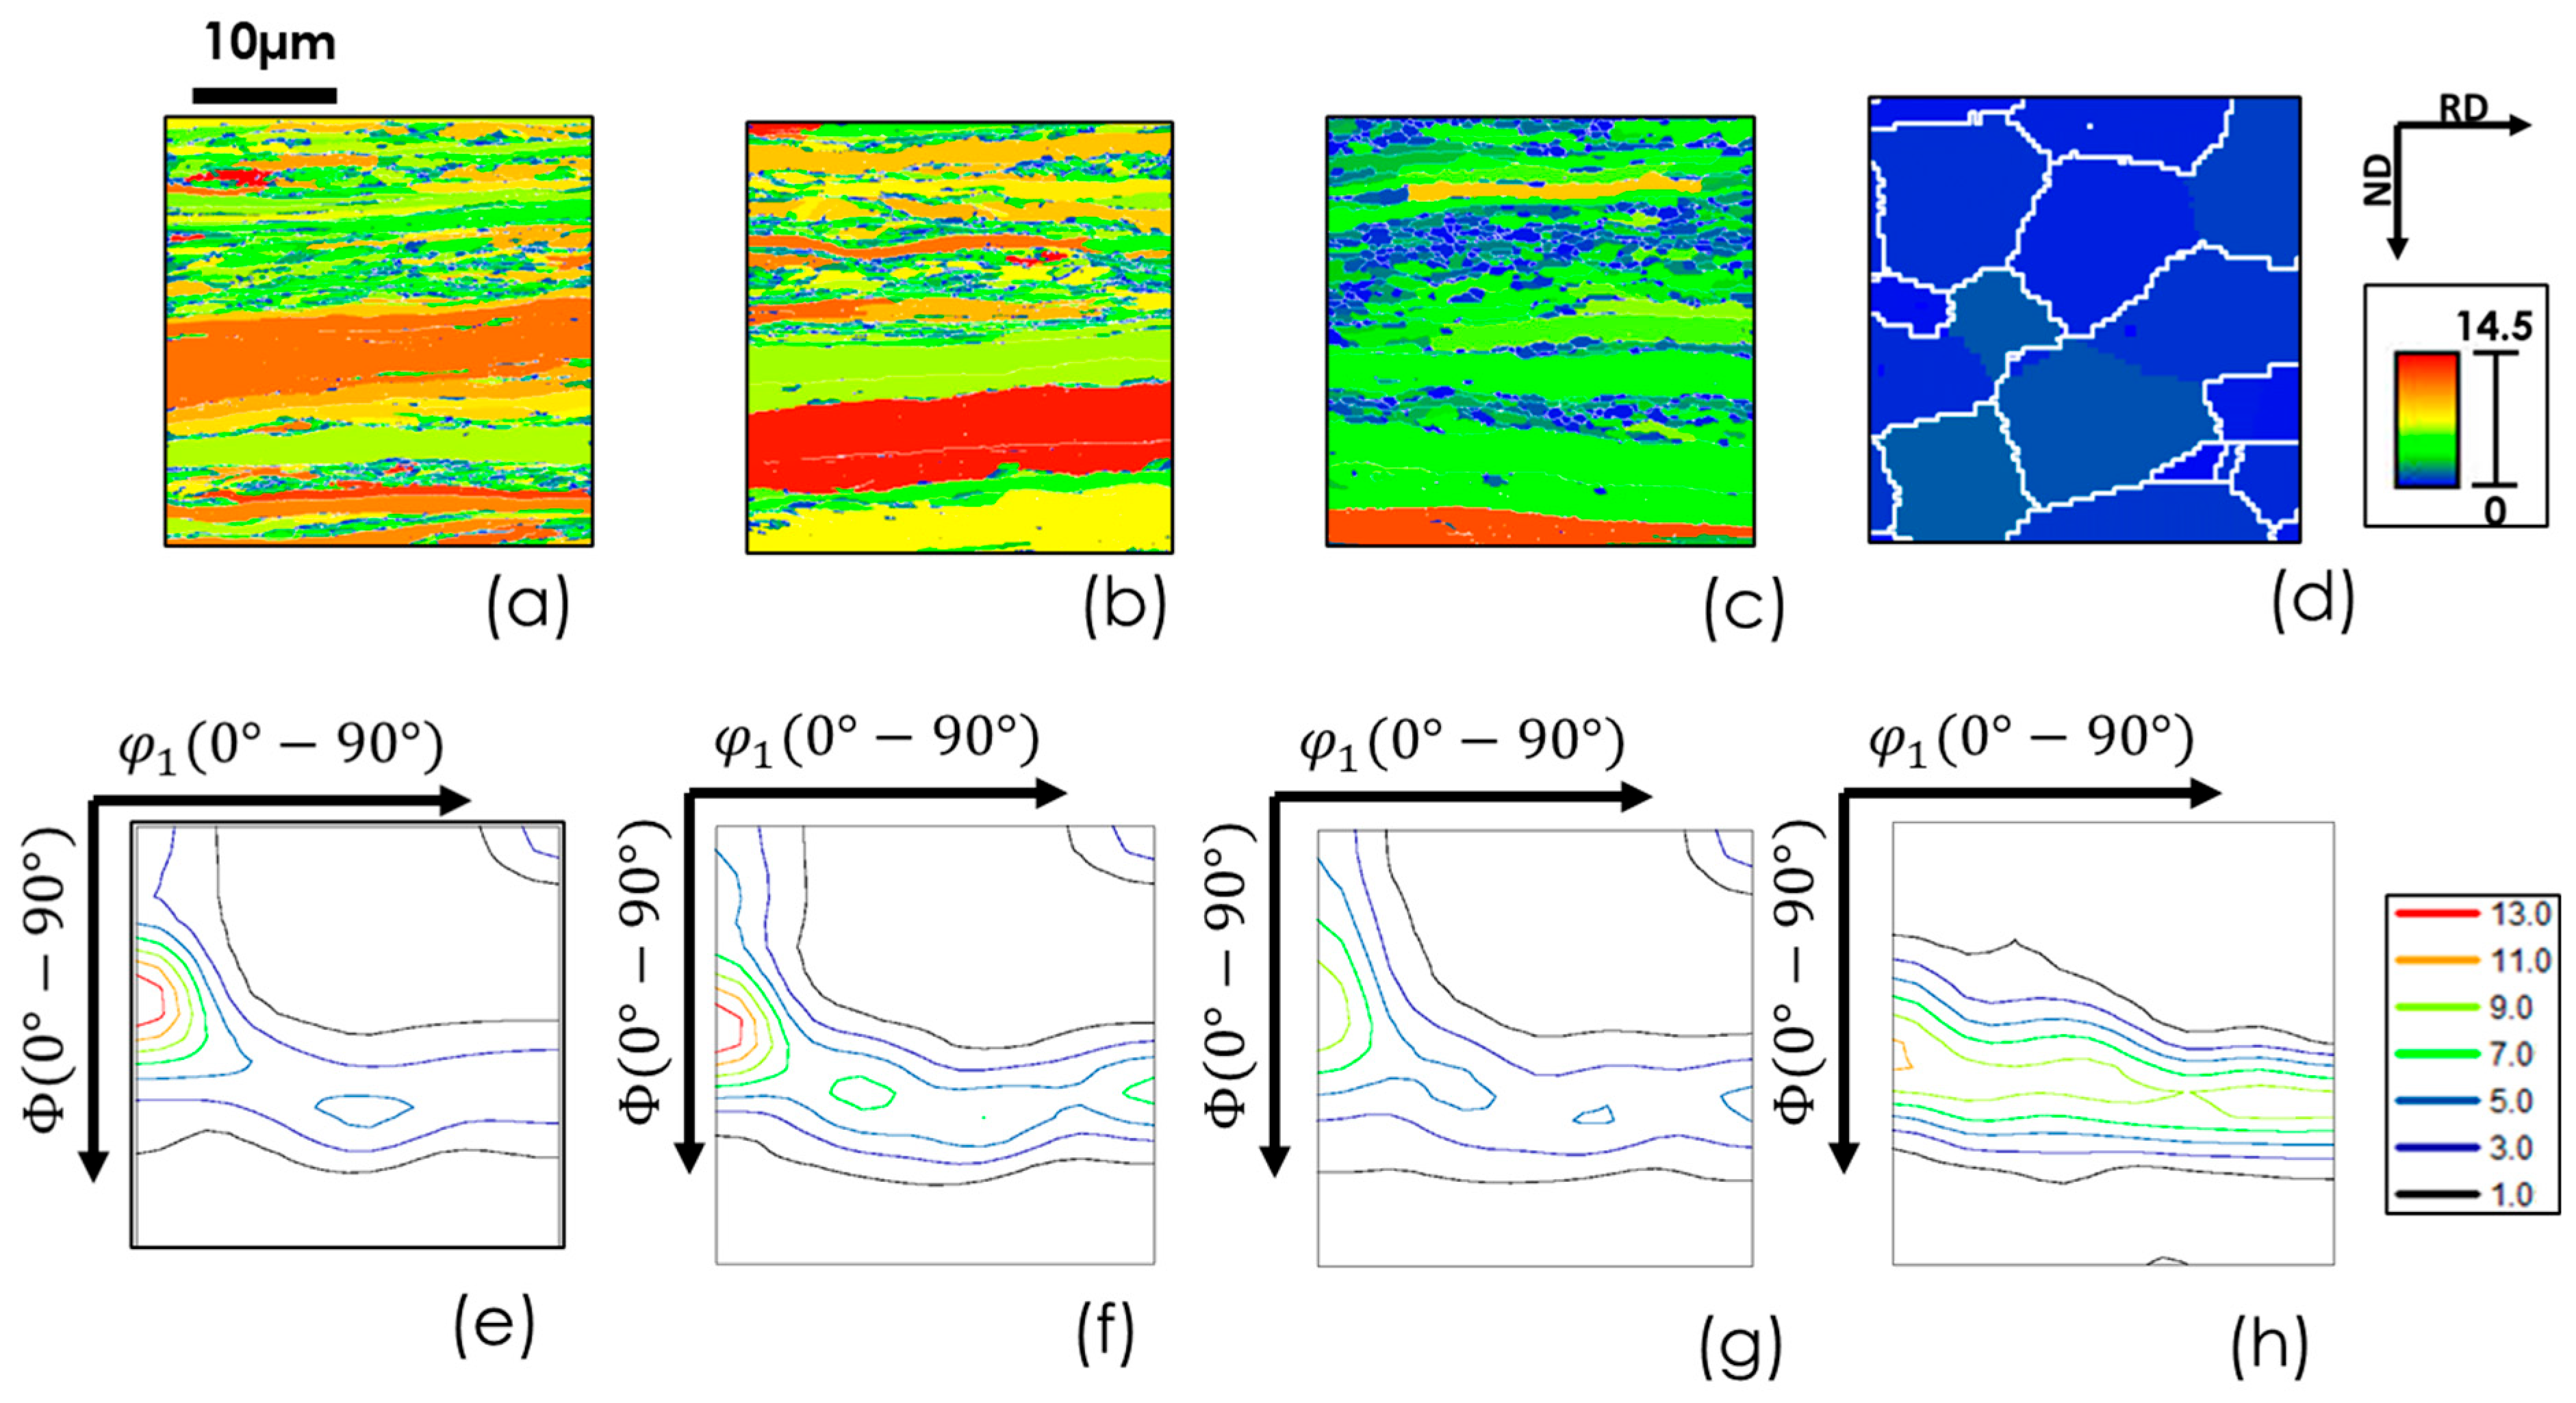
Figure 5.
Mean misorientation gradient in different peak temperatures in continuous annealing of IF steel. .
Figure 5.
Mean misorientation gradient in different peak temperatures in continuous annealing of IF steel. .
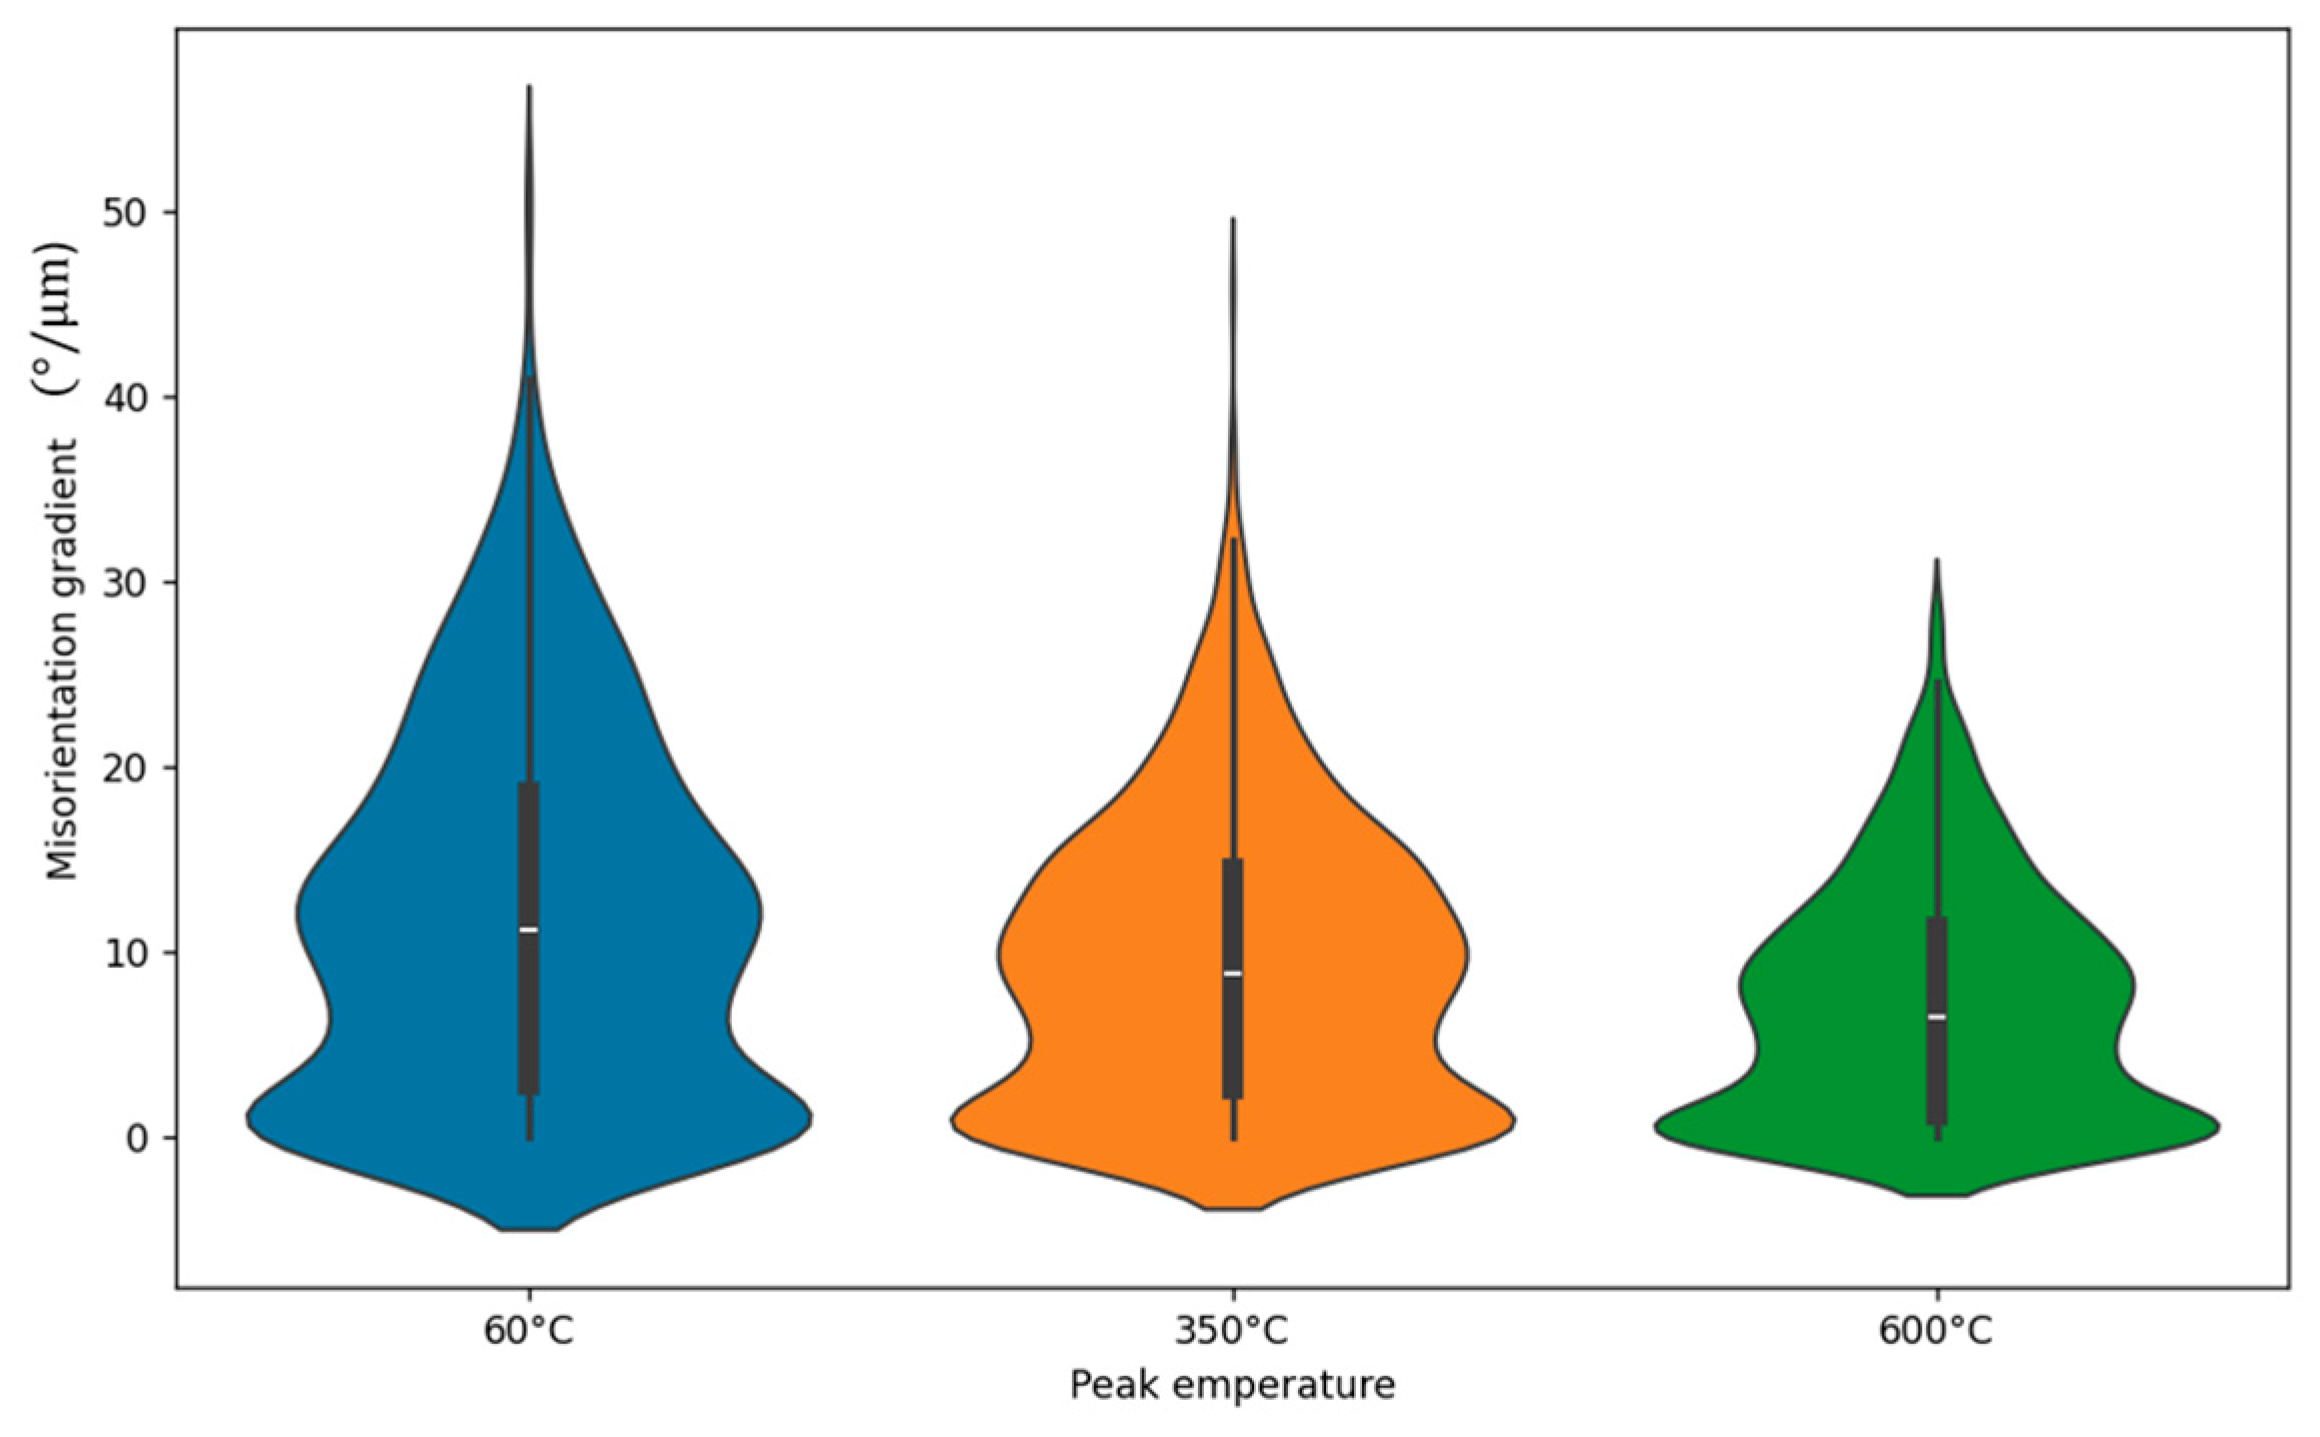
Figure 6.
ND-IPF and GOS maps of 80% cold-rolled IF steel exposed to a temperature gradient from 600°C to 800°C.(a)-(b) ND-IPF maps from 0-1 mm to 5-6 mm from the end with the lowest maximum temperature. (c)-(d) GOS maps from 0-1 mm to 5-6 mm from the end with the lowest maximum temperature. (e)-(f) Recrystallisation fraction from 0-1 mm to 5-6 mm from the end with the lowest maximum temperature. (g)-(h) non-recrystallized fraction from 0-1 mm to 5-6 mm from the end with the lowest maximum temperature.
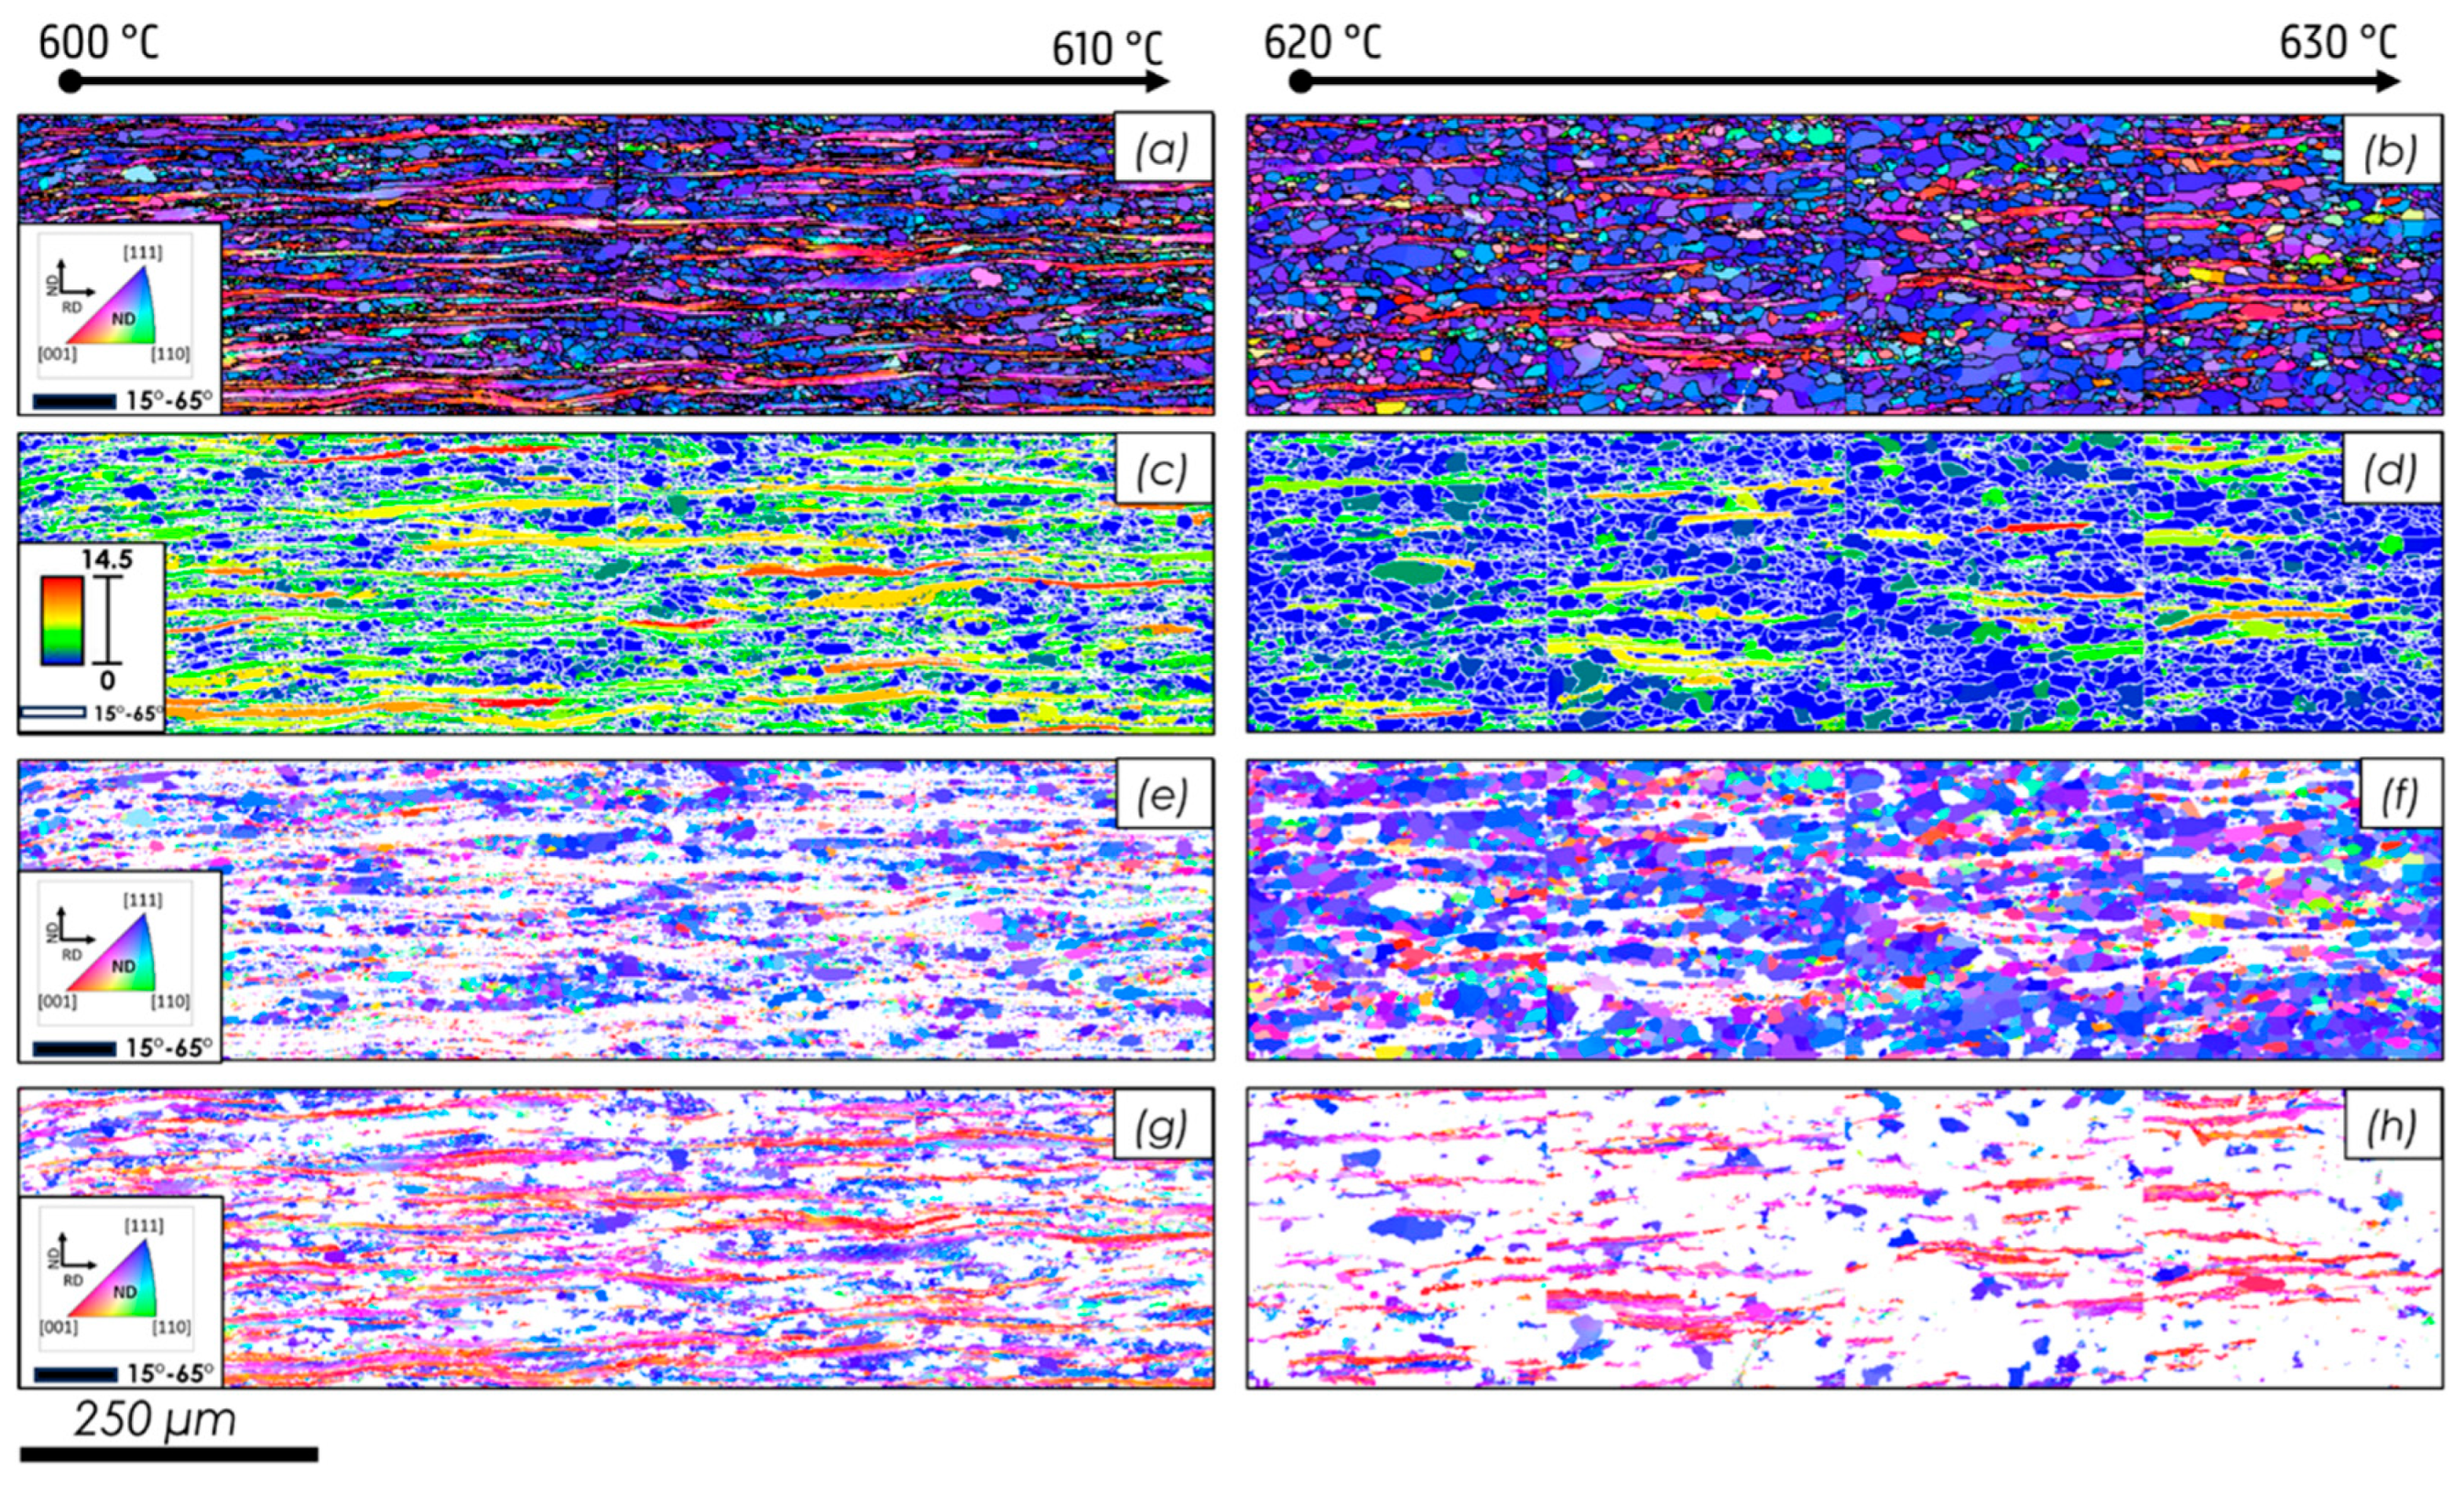
Figure 7.
Variation in the misorientation gradient of the recovery/deformed matrix for an initial 80% reduction: (a) average misorientation gradient across various distances and temperatures for deformed matrix grains that are not yet recrystallized, and (b) non-recrystallized fraction (NRF) versus reduction in the average misorientation gradient, including the fitted curve and R² value shown.
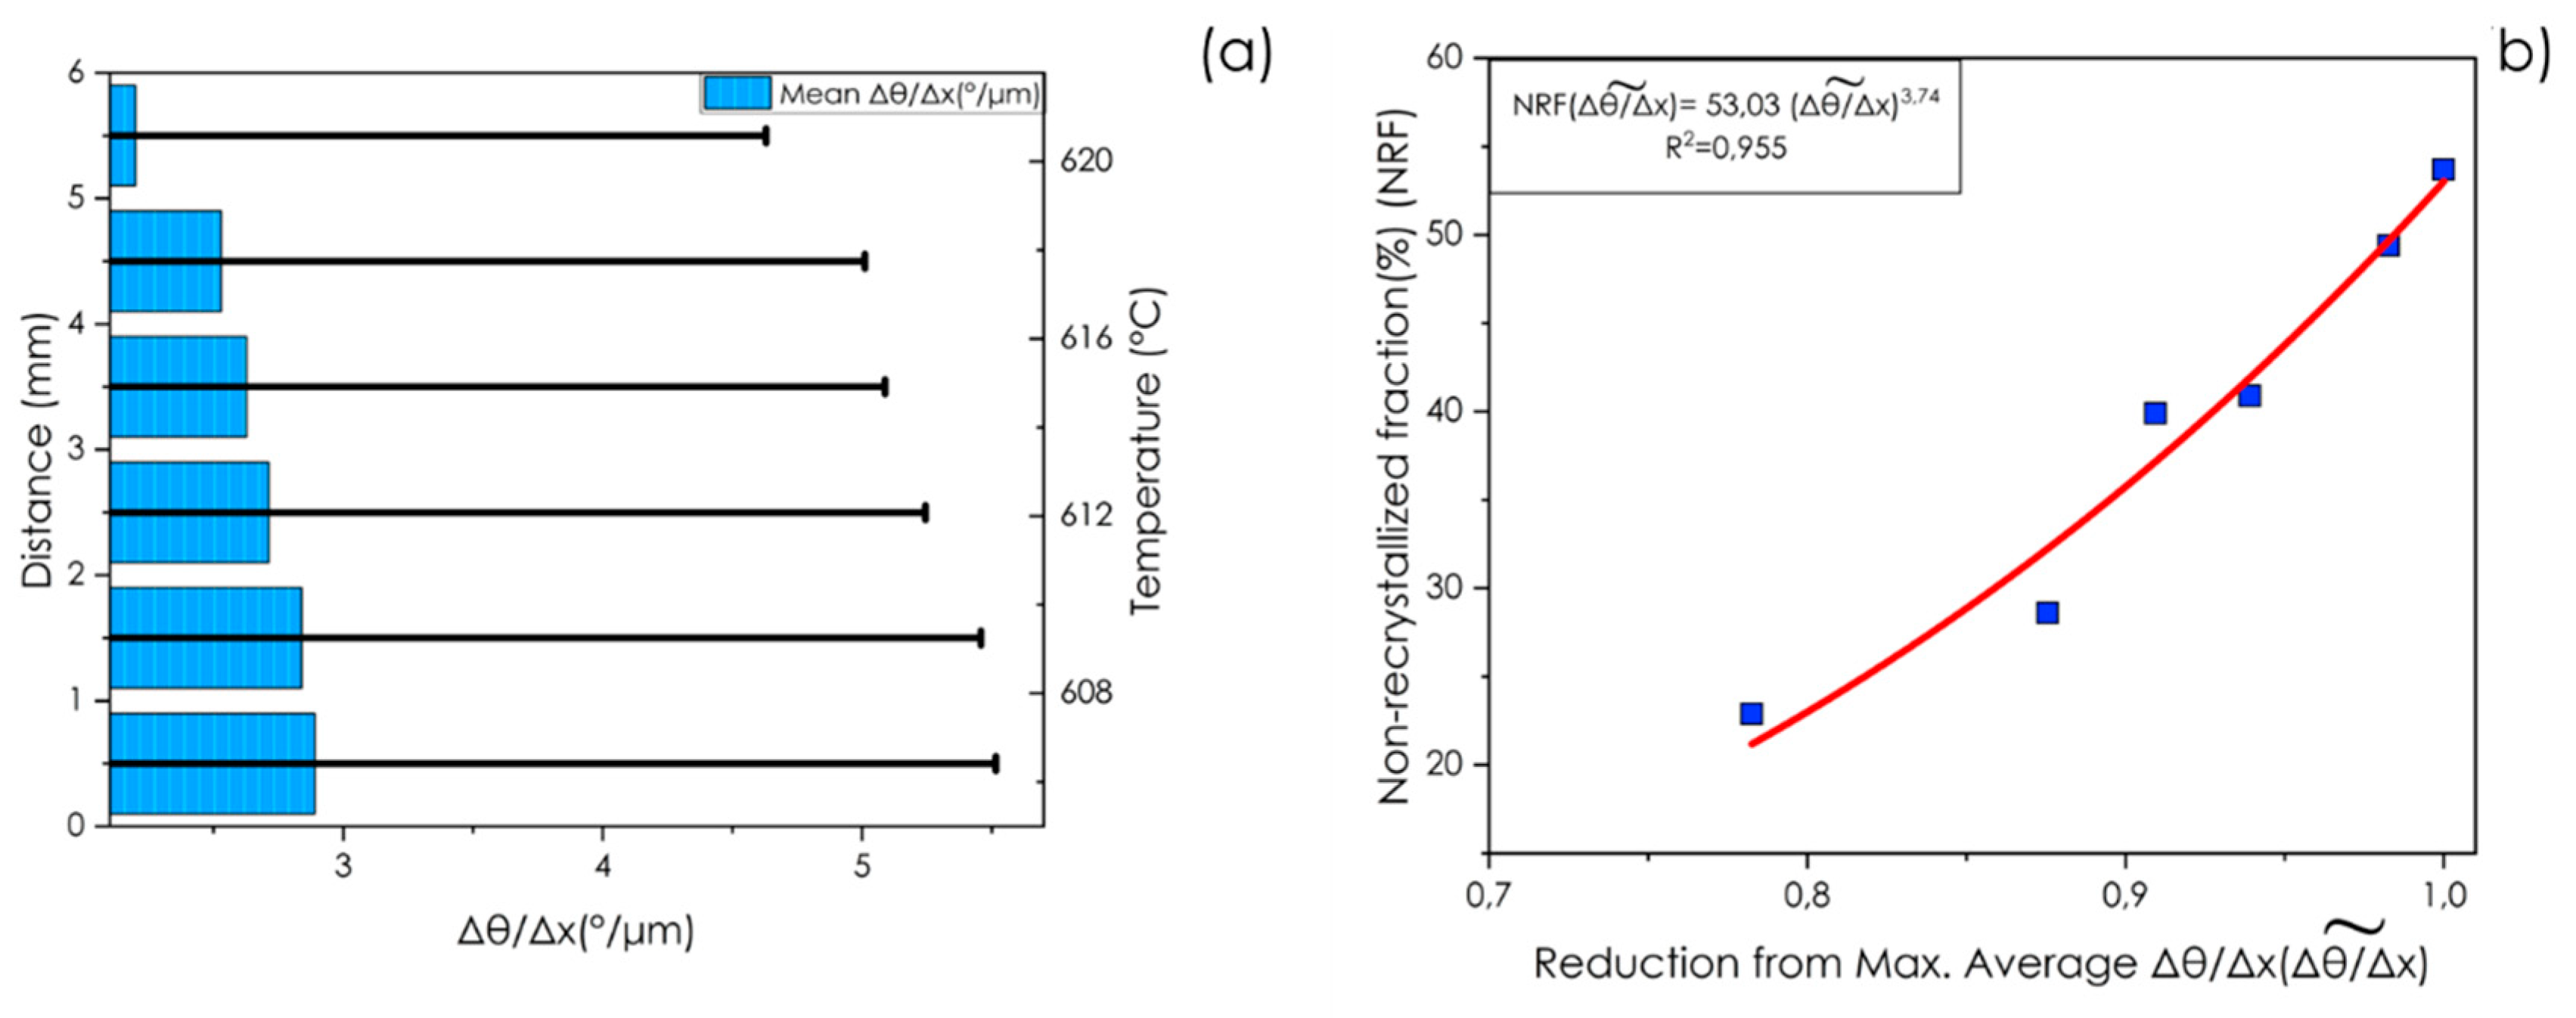
Figure 8.
φ2=45° sections of the Orientation Distribution Function (ODF) for Interstitial Free (IF) steel after 80% cold rolling and continuous annealing at a peak temperature between 620°C and 630°C, showing (a) non-recrystallized fraction and (b) recrystallized fraction.
Figure 8.
φ2=45° sections of the Orientation Distribution Function (ODF) for Interstitial Free (IF) steel after 80% cold rolling and continuous annealing at a peak temperature between 620°C and 630°C, showing (a) non-recrystallized fraction and (b) recrystallized fraction.
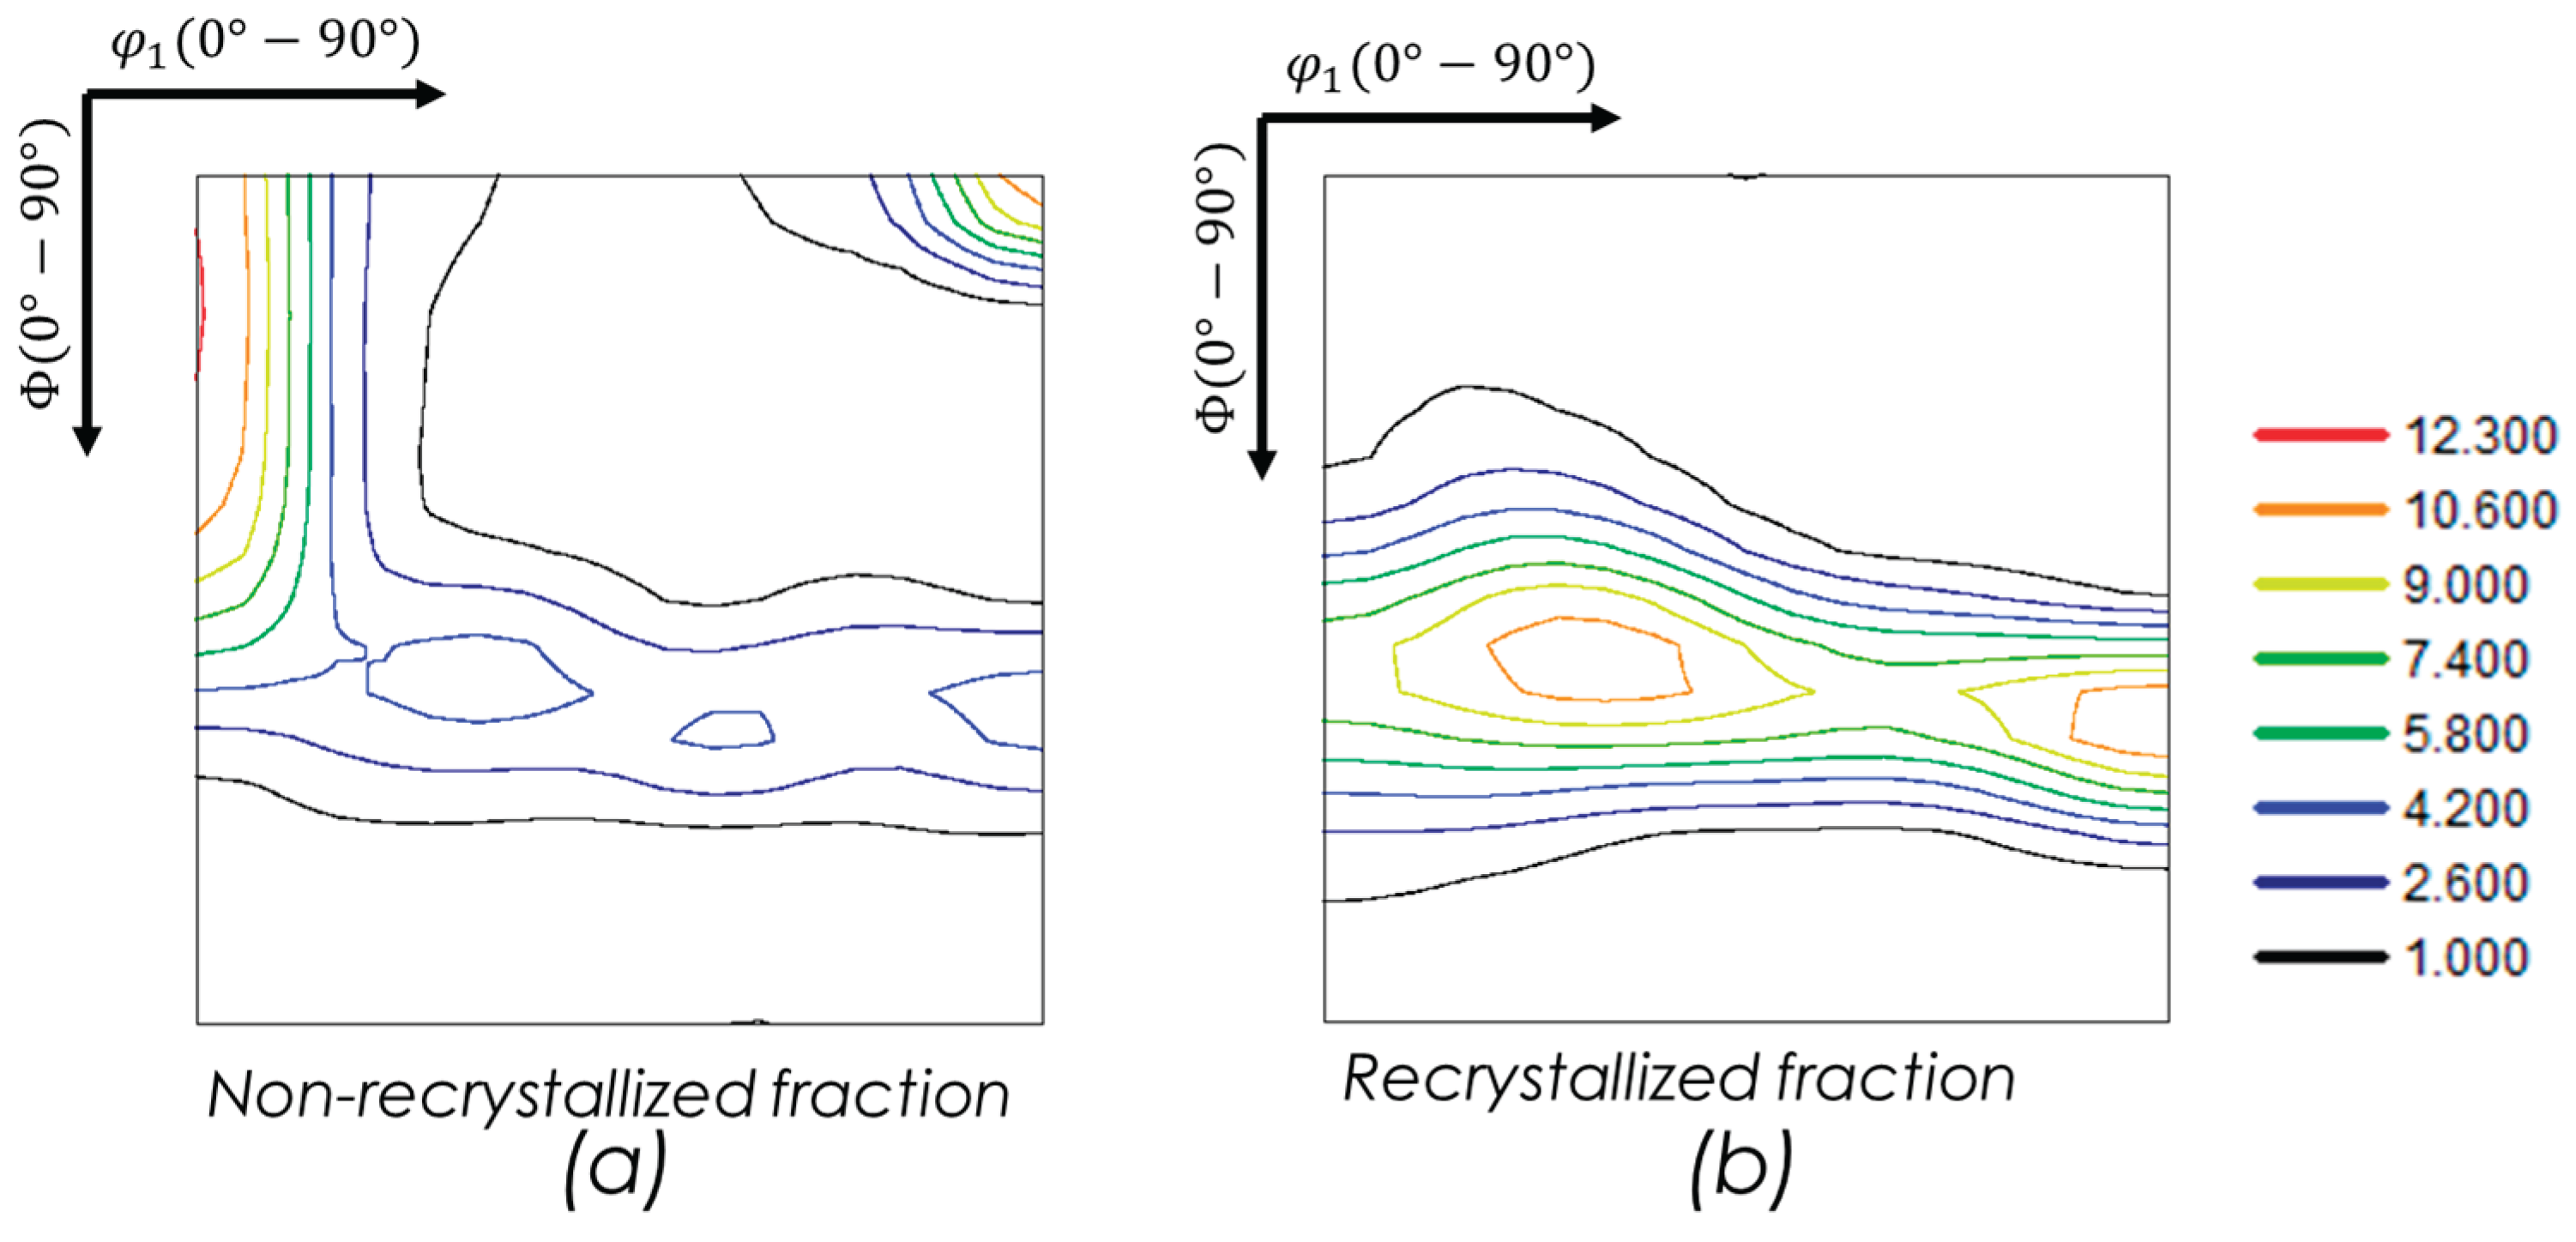

Table 1.
Chemical composition of interstitial free steel.
| C | Mn | Al | N | Ti |
|---|---|---|---|---|
| 0.002 | 0.095 | 0.05 | 0.002 | 0.045 |
Disclaimer/Publisher’s Note: The statements, opinions and data contained in all publications are solely those of the individual author(s) and contributor(s) and not of MDPI and/or the editor(s). MDPI and/or the editor(s) disclaim responsibility for any injury to people or property resulting from any ideas, methods, instructions or products referred to in the content. |
© 2025 by the authors. Licensee MDPI, Basel, Switzerland. This article is an open access article distributed under the terms and conditions of the Creative Commons Attribution (CC BY) license (http://creativecommons.org/licenses/by/4.0/).
Copyright: This open access article is published under a Creative Commons CC BY 4.0 license, which permit the free download, distribution, and reuse, provided that the author and preprint are cited in any reuse.


