
Submitted:
25 June 2025
Posted:
26 June 2025
You are already at the latest version
Abstract
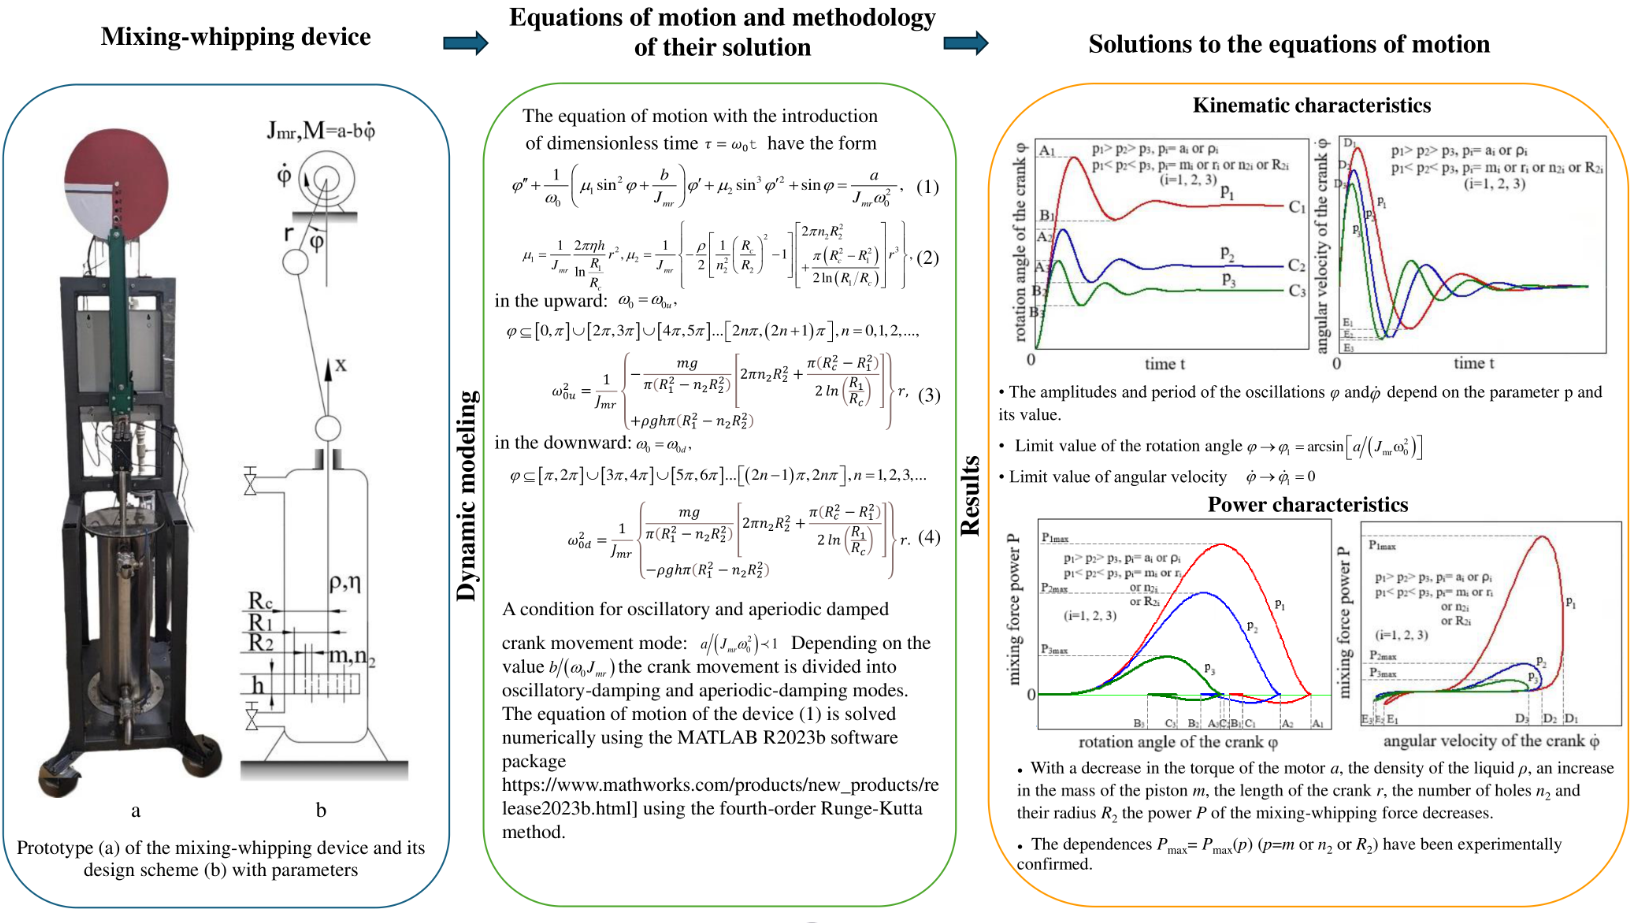
The dynamics of the librational mode of motion of the driving member of a nonideal system, a mixing-whipping device based on a simple slide-crank mechanism, is studied. The highly nonlinear differential equations of motion were solved numerically by the Runge-Kutta method. The dependences of the rotation angle of the driving member, rotational speed of the actuating motor shaft on time and the dependences of the mixing-whipping force power on the rotation angle and rotational speed of the force source shaft, and the parameters of the nonideal system are obtained. The interaction of the mixing-whipping device with the nonideal excitation source causes the rotational speed of the engine shaft and the rotation angle of the driving member to fluctuate, accomplishing a damped process. The parameters of the device and the nonideal energy source have an effect on the kinematic, vibrational and energy characteristics of the system. The effects of a non-ideal energy source may be used in designing a mixing-whipping device based on a slider-crank mechanism to select effective system parameters and an energy-saving motor in accordance with the requirements of technological processes and products.
Keywords:
dynamic modeling
; oscillatory motion
; nonideal system
; nonideal source
; slide-crank mechanism
; mixing and whipping
1. Introduction
Studying nonideal oscillating systems wherein the excitation source is affected by the dynamic behavior of the slave nonlinear system is considered a challenging task in theoretical and practical research in engineering sciences. When this behavior has no effect on excitation, such systems are known as ideal systems or ideal-powered systems. The behavior of ideal systems is very well known in the modern literature, but there are fewer findings on nonideal systems. A review of nonideal problems has been published in the papers [1,2,3,4] The theory of non-ideal mechanical system (NIS) is developed in [5] and [6]. For this kind of nonideal dynamic system, it is necessary to add a member (equation) describing the interaction between the power supply and the slave system. Compared to an ideal system, the differential equations of a nonideal system are significantly nonlinear.
The nonideal source effect is known to be manifested in actual machines and mechanisms. Let’s consider the response of the dynamics of nonideal vibrating systems based on some lever mechanisms.
More generalized dynamic and mathematical models of the nonideal flat lever orthogonal vibration table mechanism were created in the article [7]. In the paper [8], the responses of rotational motion dynamics and oscillatory damped motion of the mechanism were studied. As a result of the influence of the lever mechanism on the excitation source during stable modes of the motor shaft rotation, it was shown that its rotational speed fluctuates relative to its average value. The frequency of variation of rotational speed was equal to its mean value, and its amplitude was inversely proportional to this value. This means that the smaller the rotational speed of the motor, the larger the amplitude and smaller the frequency of variation of the rotational speed of the driving member. The actuated rotational speed depends on the length of the crank and the engine torque. The conditions imposed on the amplitude of oscillations, regularities of change in the amplitude of the oscillatory damped motion of the crank, as well as the dependence of the frequency of the oscillatory motion on its amplitude and the parameters of the energy source and mechanism are established. Stability conditions of rotational motion and oscillatory damped motion are found. The studies in [9] focused on the oscillatory motion of the mechanism at slow engine speeds. The characteristics of the change in the amplitude of the motor rotational speed depending on the length of the driving member and on the mass of the load on the operating member were determined. In the papers [7, 10] the influence of friction in kinematic pairs on the dynamics of the orthogonal vibration table mechanism with a low-speed engine at a constant stationary load in the operating member was studied.
One of the simplest lever mechanisms is the crank-slider mechanism, which converts the rotational movement of the driving element into translational movement, and therefore it is the base for many devices. This mechanism has been widely analyzed and applied in internal combustion and Stirling engines, compressors [11,12,13], robots and mechatronic devices [14,15], construction machines [16], energy devices and for other various purposes [17,18]. There is a significant amount of research carried out on the simple crank-driven mechanism, since it is the main element of the devices. Most of the studies relate to rigid member mechanisms with the crank (crankshaft) being rigidly supported and rotating at a constant rotational speed [11]. Most of these studies are either analytical or numerical and examine various mechanical aspects of the dynamic response and stability of crank-driven mechanism of devices [19]. In papers [20,21] the problem is extended by incorporating a nonideal force and flexible support for the crank (crankshaft). These two factors in combination with the nonlinearity of the kinematics give rise to a model that closely resembles the actual mechanism. The slide-crank mechanism, due to its simplicity, is adopted as the basic mechanism for the cutting device. In the paper [22], a more realistic system is considered: the mechanism is mounted on an elastic support and the effect of nonideal force on the system and the cutting process is analyzed. In the paper [6] different designs of mechanisms are compared: simple, eccentric and slide-crank mechanism. Kinematic and dynamic analysis of ideal and non-ideal force systems resting on rigid and spring supports is given. The advantages and disadvantages of the systems are outlined.
In articles of [23,24] a new model of the effect of the movement of a single-action crank-driven pump on the modes of a nonideal energy source, i.e., a damless hydraulic turbine, and vice versa, was developed and studied. Consequently, the rotation of the hydraulic turbine becomes nonuniform, and the coefficient of nonuniformity of motion depends on the parameters of the piston pump and the hydraulic turbine itself. The average value of the hydraulic turbine angular velocity depends only on the parameters of the nonideal force source and the velocity of the watercourse flow.
To date, although there are patents and hand-made unsophisticated slide-crank mixing mechanisms (see, for example, [25,26,27,28]), there has been no mathematical modeling of the dynamics of these mechanisms, taking into account the technological processes carried out by different modes of motion of the driving member, the interaction with the source of energy. For this reason, this paper aims to study the dynamics of oscillation-damped mode of the driving member motion, focused on the application of slide-crank mechanism for mixing-whipping and shaking slurry with appropriate technological characteristics is studied, thus making a significant contribution to the theory of nonideal mechanical system. To this end, in the second section, differential equations of motion of the mechanism are prepared taking into account the pressure force, gravity force and buoyant force acting on the piston, the projection of friction force on the outer lateral boundary of the piston, the projection of friction force on the faces of the holes when the piston moves up and down in the cylinder in the considered volumes of fluid. They are strongly nonlinear. This complicates their analytical solution and analytical studies. Therefore, in order to obtain approximate solution thereof, we use numerical method of their solution - the Runge-Kutta method. The results of solving the differential equations of motion are presented in the form of graphical dependences of the angle of rotation, the angular velocity of the driving link on time, the power of the stirring and whipping force on the angle of rotation of the crank and the speed of rotation of the engine shaft. The third section is completely devoted to the analysis and discussion of the results of the influence of the parameters of the engine, device and technological environment on these dependencies, which are used to form the principles of operation and create a mixing-churning device, shaking on the basis of a crank-slider mechanism. The last section is devoted to the results of experimental studies of the dynamics of the prototype of the mixing-churning and stirring device based on the piston crank-slider mechanism in order to verify the reliability of the obtained results of numerical solutions of the differential equations of the device under the oscillatory and aperiodic damping mode of motion.
2. Materials and Methods
2.1. Equations of Motion and Their Solutions
The Schematic diagram of the device for slurry mixing, whipping and shaking, based on slide-crank mechanism, is shown in Figure 1.
For the piston slide-crank mechanism shown in Fig. 1 the following member sizes, engine and fluid parameters were taken: crank length r=0.10 m, connecting rod length lcr=0.60 m, connecting rod mass Mcr=1 kg, piston mass with slide m=2.0 kg, cylinder radius Rc=0.10 m, piston radius R1=0.08 m, hole radius R2=0.02 m, number of holes n2=4, piston height h=5⋅10-3 m, fluid density ρ=1038 kg/m3, dynamic viscosity of fluid η=1.75⋅10-3 Pa*s (20o C), engine rotating torque a=43 N⋅m, engine rotor drag force torque b=0.179 N⋅m/s, engine rotor moment of inertia Jmr=60.75⋅10-3 kgm2.
We accept the following assumptions, simplifications and hypotheses. The density of the liquid in the working volume is considered unchangeable. When the liquid passes through the holes of the piston, in the thin applied layer, the flow is assumed to be laminar, the edge effects are neglected, and the flow in the gap between the cylinder and the piston is assumed to be laminar under the conditions of smallness of the radius of the holes and the size of the gap between the piston and the cylinder compared to the radius of the piston. To simplify the equation of motion of the device, we assume the length of the crank is many times less than the length of the connecting rod, the mass of the engine rotor is many times greater than the mass of the piston. The focus is on the dynamics of technological processes carried out by the piston with the mixing-whipping force in the operating volume, and therefore, compared to the mixing-whipping force, the friction forces in kinematic pairs and in guides of vertical motion of a slide can be neglected, due to their insignificance.
Using the Lagrangian method, construct the differential equations of motion of the mixing and churning device based on a simple piston crank-slider mechanism for cases of upward and downward movement of the piston (Figure 1). The position of the non-ideal system: motor mechanism is determined by the generalized coordinate: the angular coordinate φ of the drive element due to its rotation. Then the differential equation of Lagrange motion has the form
where T is the kinetic energy of the system, Qφu and Qφd – are the generalized forces in cases of upward and downward movement of the piston, respectively. To do this, it is necessary to make expressions of the kinetic energy of the system: the device-motor.
The kinetic energy of the system consists of two components: the kinetic energy of the rotary motion of the engine rotor, the kinetic energies of the translational energy of the piston with the slide at r<<lcr:
where is the inertia moment of the engine rotor, v is the speed of the piston with the slide. To determine the velocity v, it is necessary to take into account some geometric properties of the device.
If the influence of the final length of the connecting rod is neglected, the path traveled by the piston can be related to the angle φ of rotation of the crank by the following relation:
Piston and slide speed
Substituting this expression in (2), obtain the kinetic energy of the system in the form
Considering that Mmr>>m
The crank of the mechanism is driven by the dynamic torque of the motor M and as a result of the translational movement of the slide creates the resulting F of the pressure forces F1, friction F2 and F3 acting on the piston. For the proposed mechanism, the DC motor with rectilinear characteristic has a dynamic torque
where a is the motor torque (motor performance), b is the moment of resistance to the motor rotor spinning.
Pressure force, buoyancy force and gravity force acting on the piston and taking into account the value of v according to (4):
ρ is the density of the liquid, h is the height of the piston, gx is the projection of acceleration g of gravity on the x-axis.
According to [29], the projection of the friction force acting on the outer lateral border of the piston
projection of the friction force acting on the surface of the n2 holes
where η is the dynamic viscosity of the liquid.
The expression of the virtual work of the resulting force F acting on the side of the liquid on the piston and the torque M of the engine has the form
where is the change in the coordinate x, and substituting this value in (11), obtain
Generalized forces of the system, according to (12)
Substituting (6), (7) into (1), taking into account (13), (8)-(10), obtain the equation:
for the upward movement of the piston:
for downward movement of the piston:
where
Replacing the mechanical characteristic of the motor with the expression (7), introducing dimensionless time and after small transformations, obtain the equation of motion of the device in the form:
for the piston lifting time:
where for the piston lowering time:
where Equations (17) and (18), the dash sign denotes the dimensionless time derivative. Differential equations (17) and (18) differ from each other by coefficients and , but have the same form; therefore, it is sufficient to solve one of them. Equations (17) and (18) are significantly nonlinear since the nonlinear term enters the equations without a small parameter. At <1 oscillationally and aperiodically damped crank motion modes occur. Depending on the value the crank movement is divided into oscillatory-damping and aperiodic-damping modes.
The mixing and whipping processes are carried out mainly under the influence of the piston pressure force, and therefore the mixing and whipping force and its power are determined by the expressions
The equations of motion of the device (17) and (18) are solved using the MATLAB R2023b software package [https://www.mathworks.com/products/new_products/release2023b.html] using the fourth-order Runge-Kutta method for oscillating and aperiodic damped modes of motion of the crank. This resulted in graphical dependences of the rotation angle and rotational speed of the actuating engine shaft on time, mixing and whipping force power from the angle of rotation and rotational speed of the excitation source shaft, and the parameters of the nonideal mechanical system. The obtained graphical dependences of the engine shaft rotation speed on time indicate the superiority of the main harmonic of the solutions of the equations of motion in them and, consequently, the inherent oscillatory characteristics for them.
3. Results and Discussion
The results of solving the equations of motion (17) and (18) and calculating the mixing and whipping force power (19), as graphs of dependencies φ=φ(t), , and at different parameters of the system, are shown in Figures 2–25.
If the engine power (torque a) is insufficient for the rotary motion of the crank, then the crank will perform a damped oscillation process. The crank, under the action of torque a, initially rotates upwards by some angle and then falls downwards, before reaching the neutral equilibrium position under the action of torque it rises again, etc., until the oscillations are completely damped out.
The greater the a engine torque, the greater the initial maximum crank angle (Figure 2). The crank deflection angle φ tends to a limit constant value φ1 as time elapses after completing the oscillating process. The greater the a engine torque, the greater the value of the crank angle . This means that the crank makes damped oscillations not around the neutral equilibrium position, but around a certain value of angle φ. This is caused by the fact that at the rotational speed of the crank its angle of rotation is . With constant magnitude of and coefficient the limiting angle of rotation of the crank ~ (where ). Considering that the maximum crank angle is 1.57 rad, that the larger a the engine torque, the larger the limiting crank angle φl and the oscillation period.
The rotational speed of the crank also makes damped oscillations around the zero value with initial and subsequent amplitudes, the less, the less the corresponding torque value with decreased period (Figure 3).
Dependency graphs P=P(φ) and in Figure 4 and Figure 5 show that during the upward rotation of the crank, the pressure force on the piston from above increases, and, accordingly, the power of the mixing-whipping force, and the value of P reaches its maximum in further increasing the crank angle, it decreases (Figure 4). In this case, the rate of increase of the rotational speed of the excitation source shaft will be greatly attenuated and the motor shaft rotational speed will decrease by the end of the cycle (Figure 5). From the relations (19): ~. The general character of dependence P=P(φ) (Figure 4) is determined by the relation ~, but the amplitude and periodicity of the function are influenced by the value , to be more precise, by the value a. Since and (Figure 3), then (Figure 2). The smaller is the value of the a engine torque, the smaller is the amplitude and period of oscillation of the mixing-whipping force power P depending on the angle of rotation φ of the crank according to the graphical
Figure 4.
Dependence P=P(φ) for different values of a.
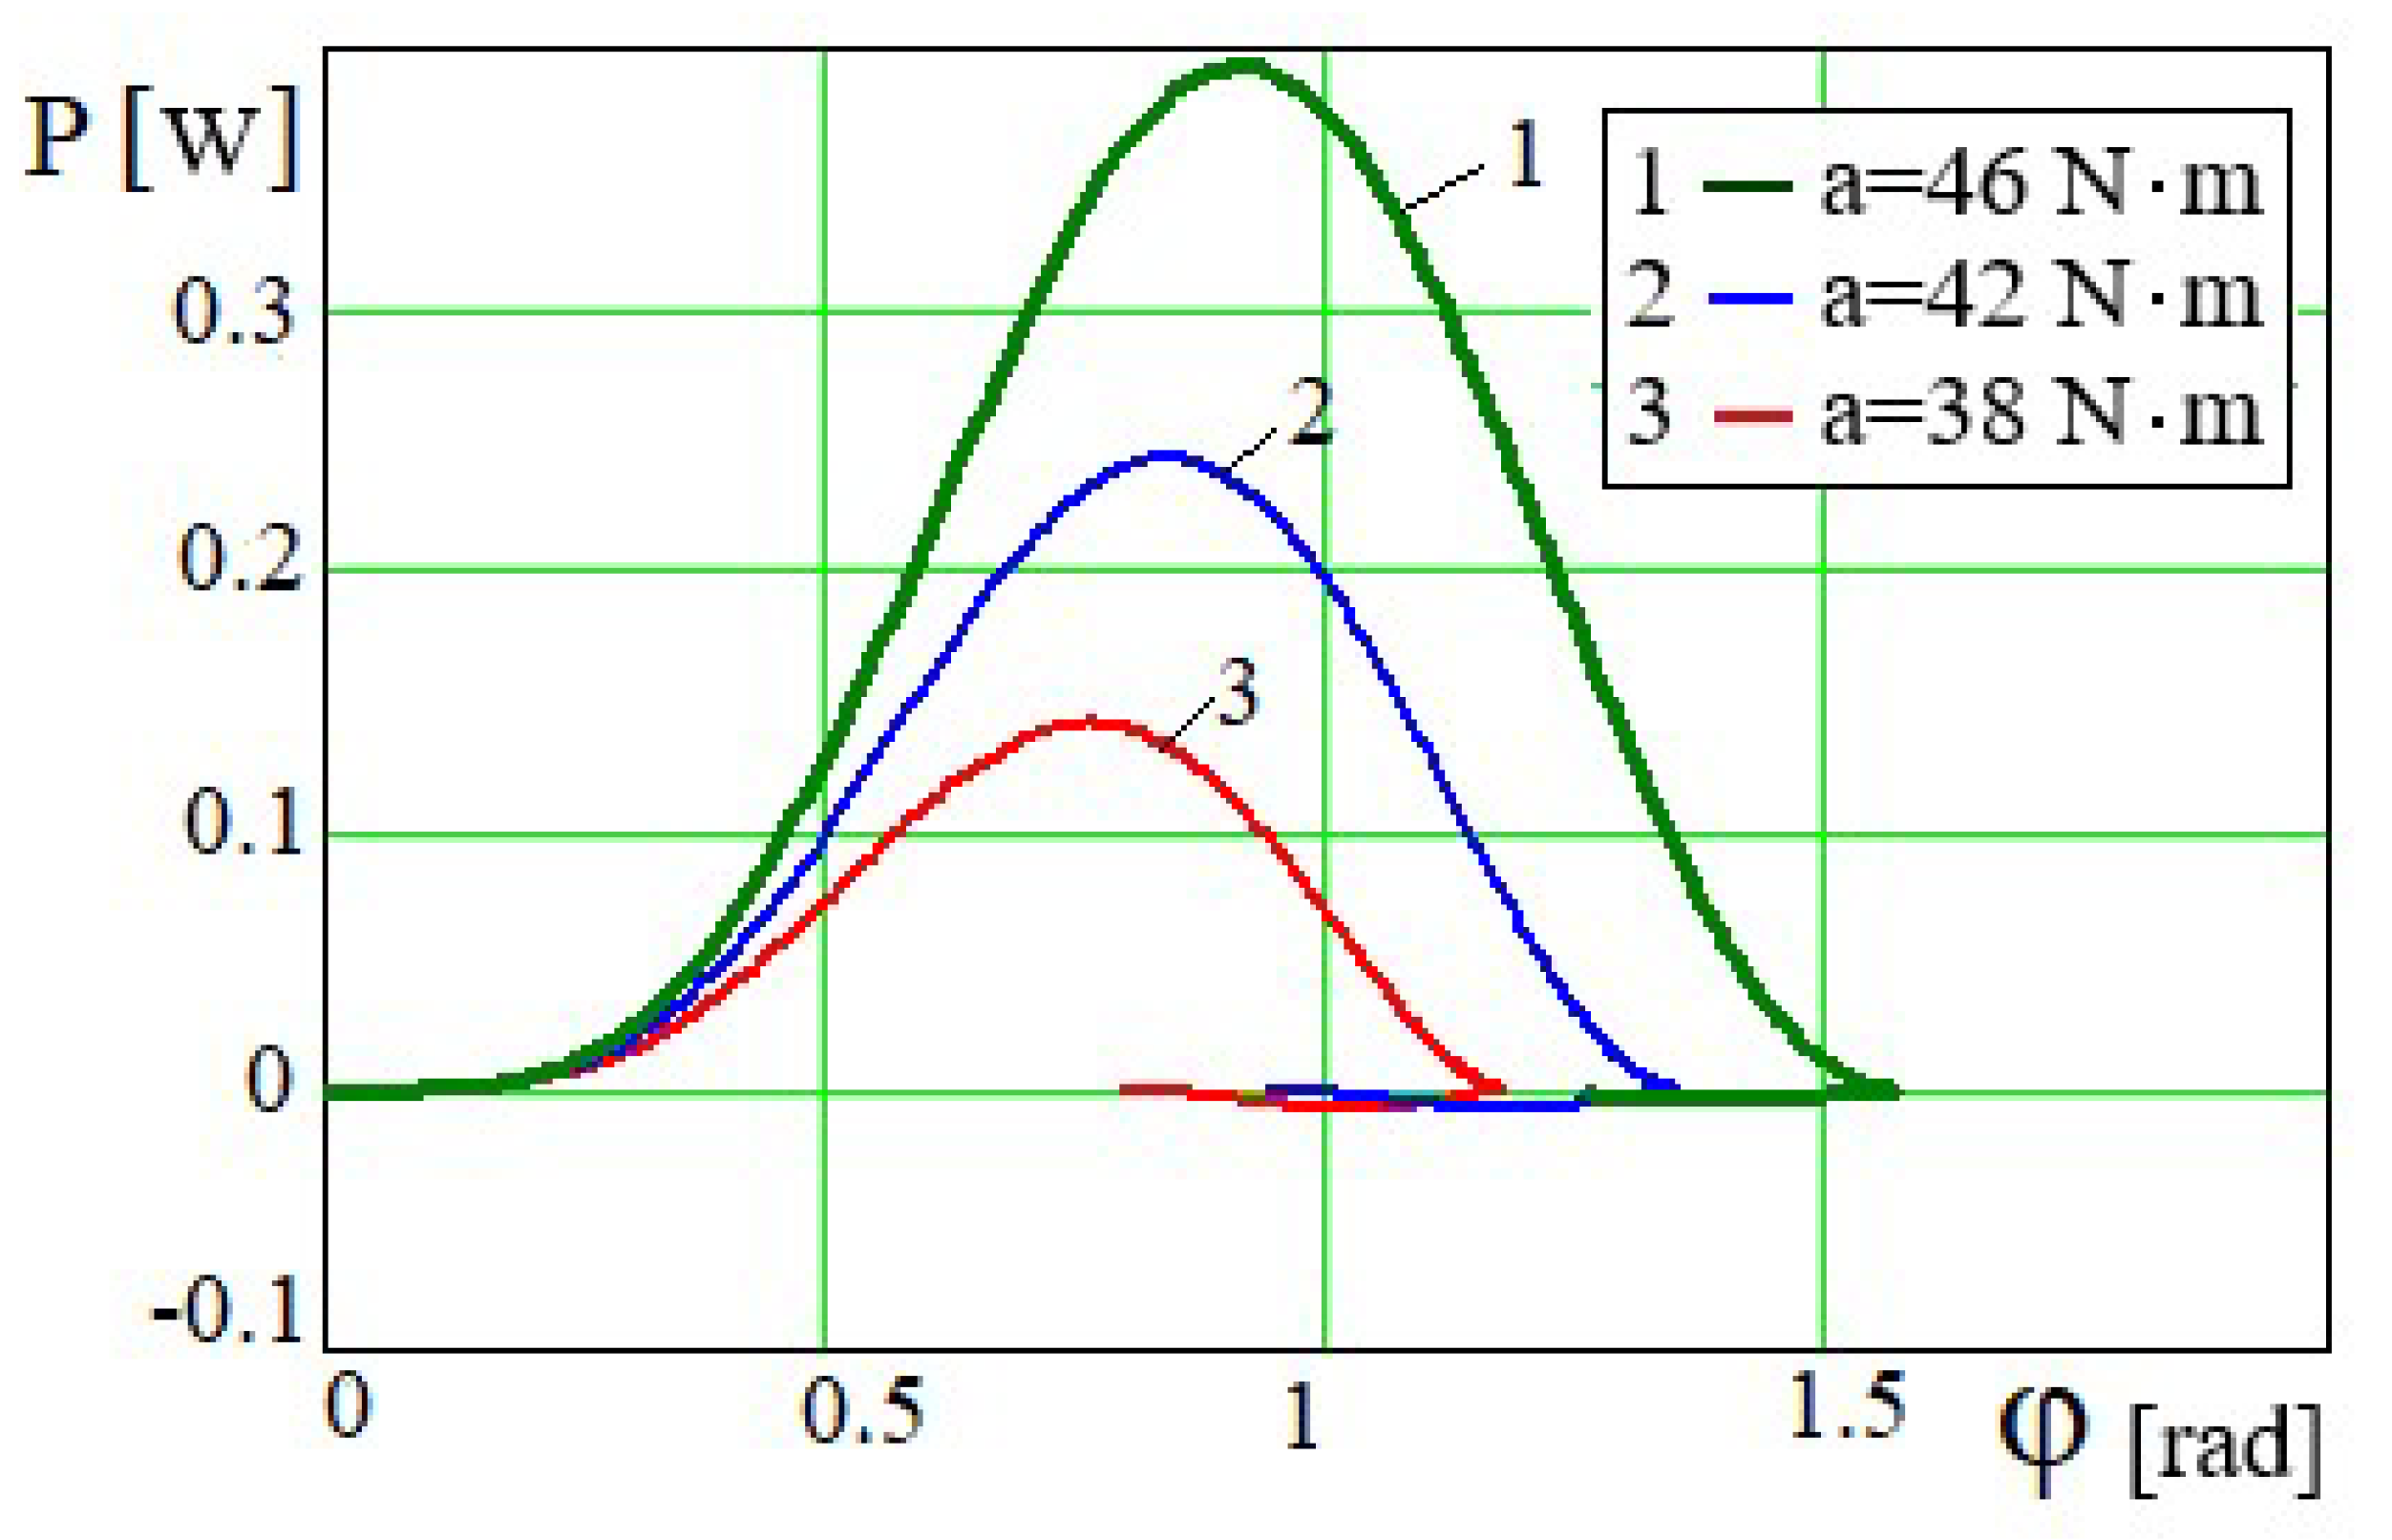
Figure 5.
Dependence for different values of a.
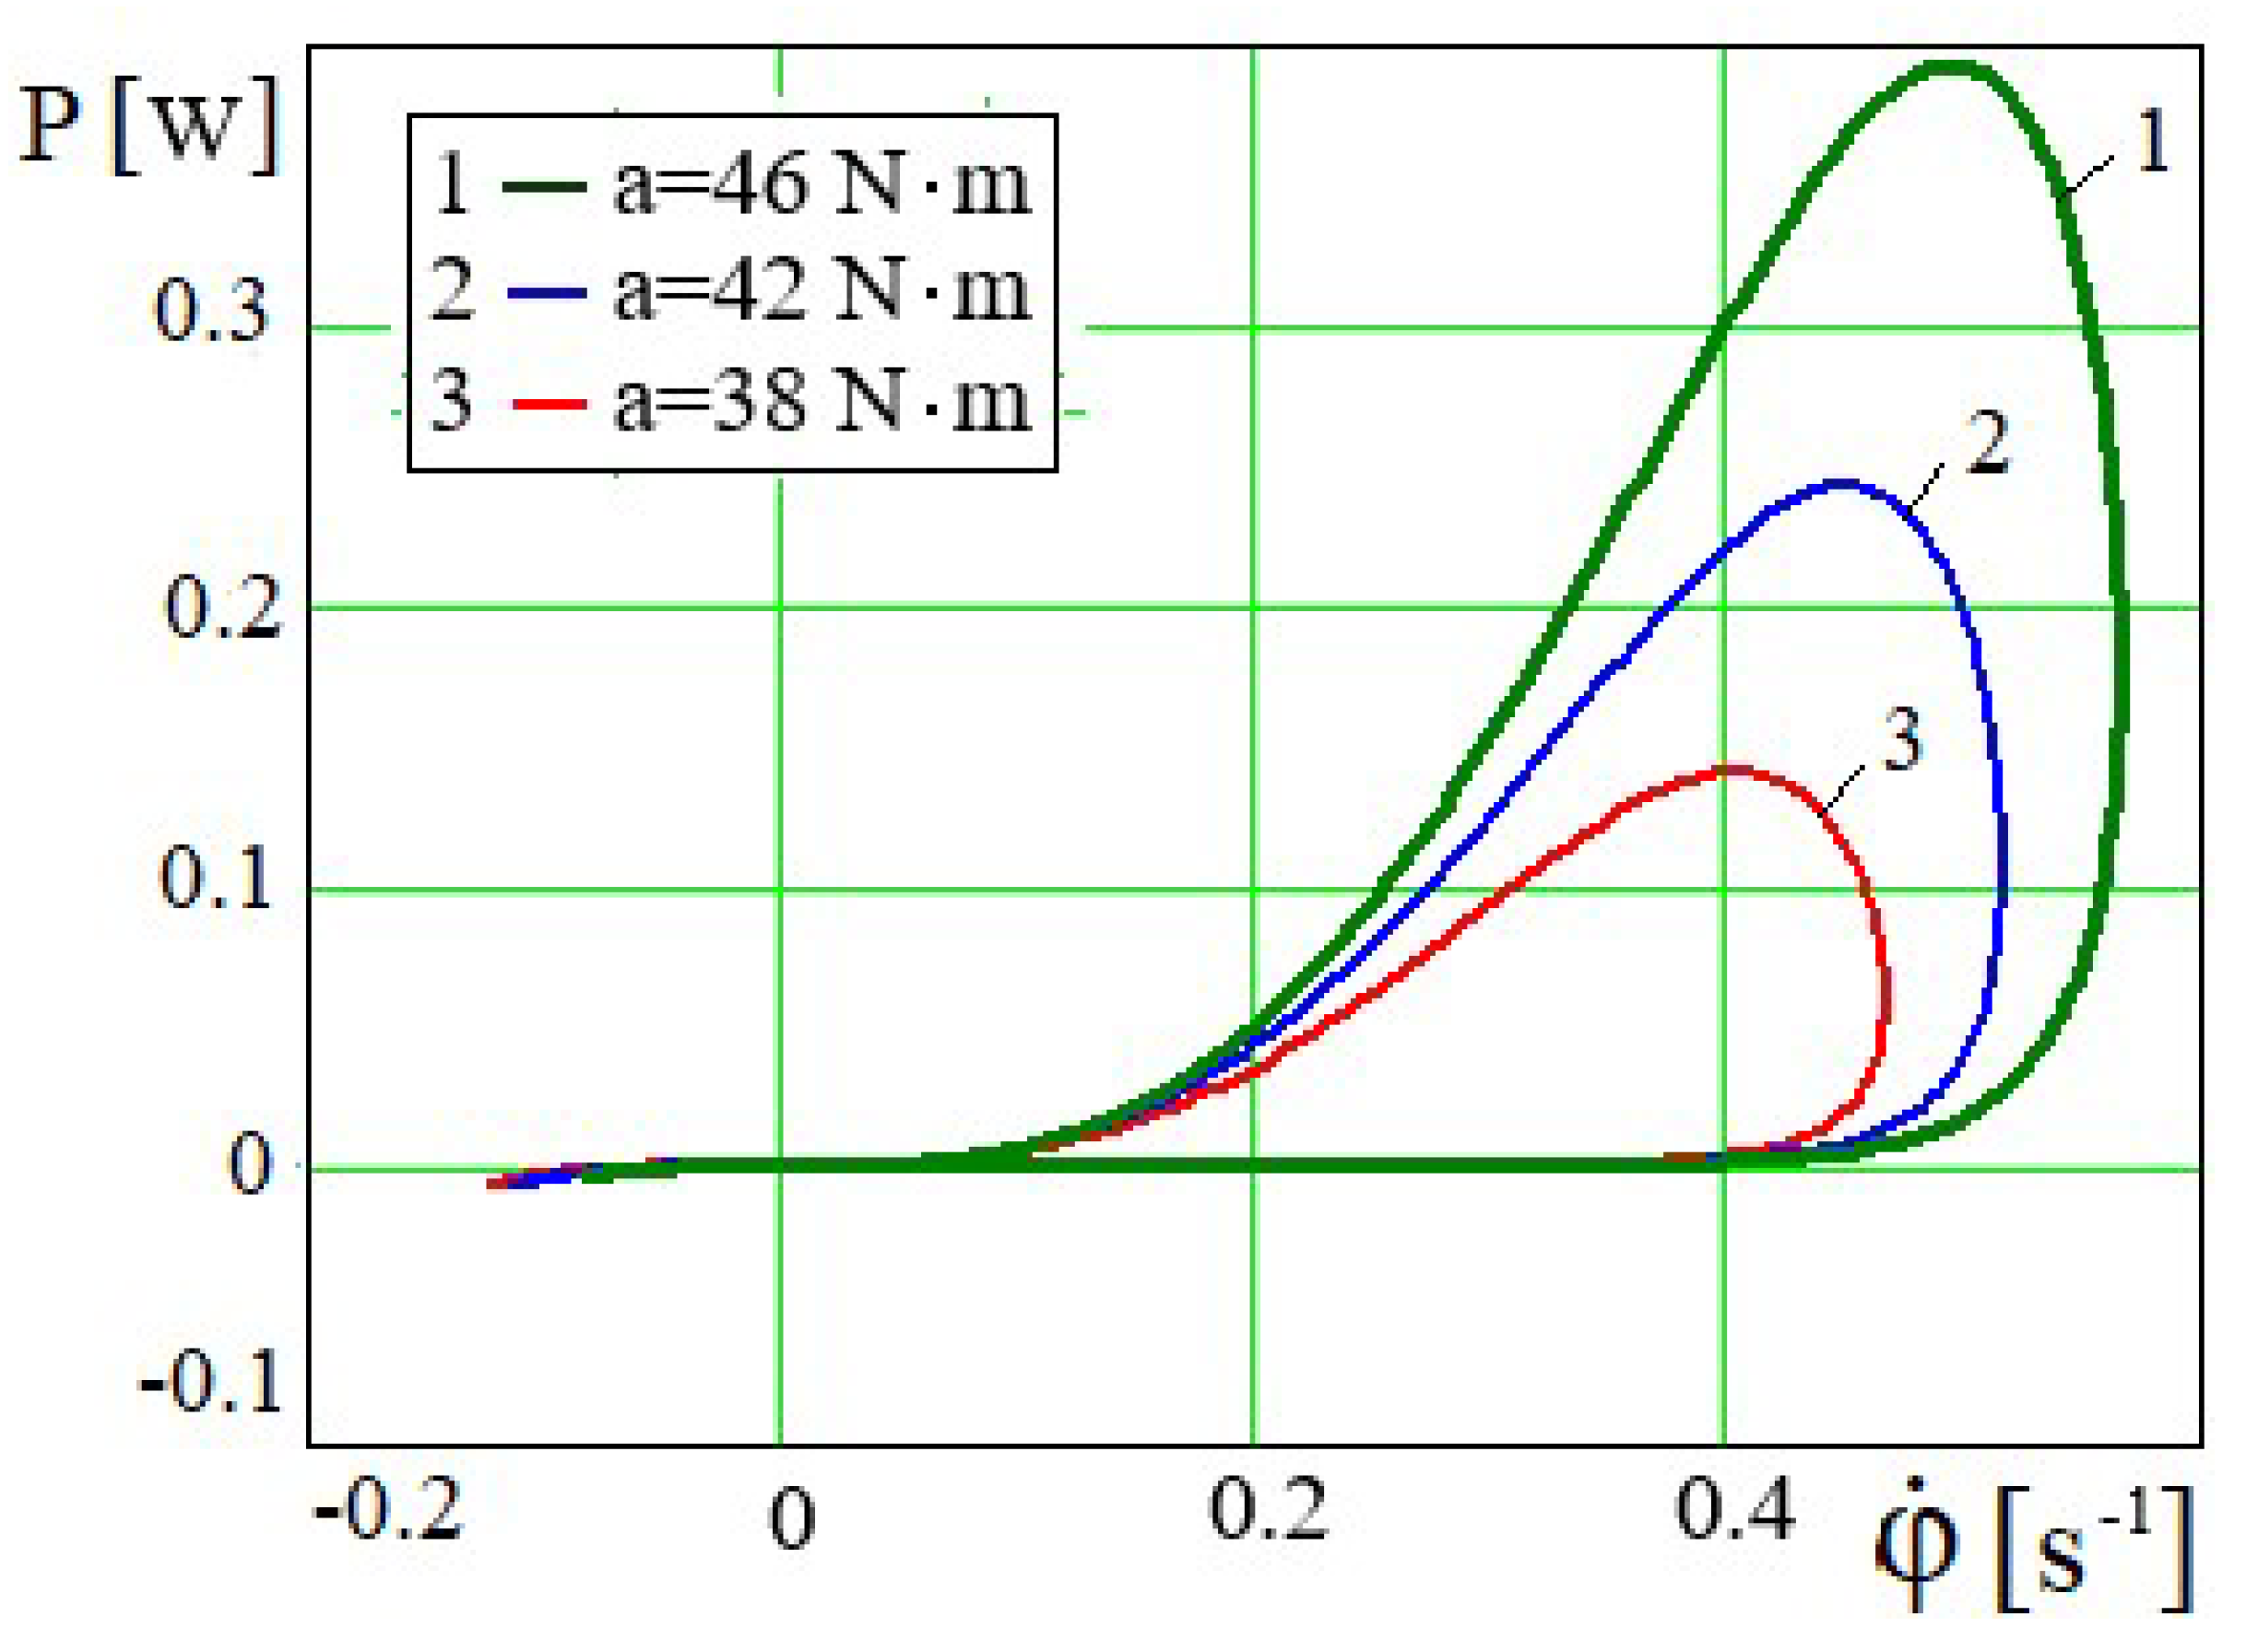
relationships φ=φ(t) and in Figure 2 and Figure 3. Maximum magnitudes of the values φ and in the graphical dependencies φ(t) and (Figure 2 and Figure 3) determine the right boundaries of the dependencies P=P(φ) and (Figure 4 and Figure 5), the the minimum values φl and () (Figure 2 and Figure 3) the left boundaries of the power graphical dependencies.
Thus, the graphs in Figures 2-5 show the results of the action of the power parameters of the excitation source on the kinematic parameters of the driving member of the device and on the energy characteristic of the dynamics of the operating member.
In Figures 6 and 7 lines 1, 2 and 3, which are oscillatory characteristics of the librational mode of engine shaft motion, depend on the piston mass. The values of the mass of the piston m are taken in relation to the rotating torque of the motor a for the effect of an oscillationally and aperiodically damped mode of crank movement. As the piston mass increases, the amplitude of oscillations of the angle , and the period of its damped oscillations decrease. After a lapse of time, the lines practically straighten out and the angle of rotation
tends to the limit values. The limiting value of the rotation angle ~ (where ), in turn ~. As the mass of the piston increases, this value of the angle φ decreases (Figure 6).
The vibrational characteristics of the motor shaft rotation depend on the parameters of the device members. At relatively small piston masses, the engine shaft performs a rotational motion. In Figure 7, at sufficiently large piston masses, the shaft of the force source makes a damped oscillation of the engine shaft speed . As the piston mass increases, the initial and subsequent amplitudes and period of oscillation decrease, the line around which the oscillation process occurs is defined by the zero magnitude value. The greater the magnitude of the force moment resulting from the piston gravity (or piston mass) directed opposite to the a engine torque, the smaller the maximum magnitudes of the oscillations and , the smaller the repeatability of their oscillations.
It follows from formula (4) that the power of the mixing and whipping force is~ .
Then, in turn, the limit value of the excitation source shaft rotation angle based on equation (17) or (18) is: ~. At ( – engine shaft rotational speed limit value) limit magnitude value is ~ taking into account ~. The limit values of the rotation angle corresponding to the power value coincide with the values of this angle in the dependencies φ=φ(t) in Figure 6. Dependency graphs and in Figure 8 and Figure 9 show that the larger the mass of the piston, the smaller the maximum power values of the mixing and whipping forces . The decrease of the maximum value of P with increasing mass m is accompanied by a shift of the corresponding magnitudes of the values and to the beginning of the abscissa. The graphs in Figure 9 show that, with approaching to the end of the oscillating damping process, the technological process of whipping intensifies, which is demonstrated by a sharp increase in the force of mixing and whipping and its power and at some of their values and a sharp drop in their values. At : (Figure 9). The rightmost limits of the graphs P=P(φ) and are limited by the maximum values of φ and . The leftmost limits of the graphs P=P(φ) and are defined by the minimum values of φ and.
The device parameters, including the crank length, influence the kinematic oscillation parameters of the engine shaft motion (Figure 10 and Figure 11). After a lapse of time, the rotation angle of the driven engine shaft oscillates around the values to which it tends to oscillate, with an amplitude and period of oscillation smaller the longer the length of the driving member. As it is known that the limiting value of the rotation angle φ: ~ while~.
From the formula (4), we obtain ~. From this dependence the first thing noticed is the proportionality ~. Despite this dependence, based on the graphical relationships in Figure 12 and Figure 13, the predominant relationship is ~, i.e., the value is proportional to the minus n-th degree of , the value is proportional to the minus m-th degree of , the total should be n+m>3.
On the other hand, the limit values of the excitation source shaft angle ~ for different values of r, to which the value of φ at the end of the oscillating damping process will tend, are the same in Figure 10 and Figure 12. The rightmost limits of the curves P=P(φ) along the axis φ at various values of r in Figure 12 are determined by the maximum values of φ in the graphical patterns φ=φ(t) in Figure 10. The curves P=P(φ) end at those points that correspond to the limit values ~ of the rotation angle . Likewise, the right borders of the curves in Figure 13 are determined by the maximum values of rotational speed , the left borders - by the minimum values in Figure 11. The sections P=P(φ) in Figure 12, where there is a "decrease" of φ along the abscissa axis, correspond to the sections of the dependences φ=φ(t) in Figure 10 after the maximum values of φmax.
The limit value of the shaft angle of a nonideal engine is ~ . The value is ~ . Therefore, the lines φ(t), that correspond to the values of ρ are positioned so densely (Figure 14), that at the end of the oscillating and aperiodic damped oscillation the lines φ(t) merge into a single line and . Dense placement of lines of dependence of at various values of fluid density ρ is also observed in Figure 15. It follows from formula (19) that ~. The general character of the dependence P=P(φ) in Figure 16 is determined by the graph of the periodic function , its amplitude is affected by . Regardless of the fact that there are dependencies and , the density of the fluid ρ slightly affects the oscillation period of P=P(φ). This effect has been well observed in the graphical relationships φ=φ(t) and in Figure 14 and Figure 15.
It is obvious from graphical dependences P=P(φ) and in Figure 16 and Figure 17, that the more density of fluid, the more force and its power will be required for implementation of technological processes of mixing and whipping. In contrast to similar graphical dependences P=P(φ) and , the values of abscissas φ and , corresponding to the maximum values of power, with increasing density of fluid remain almost unchanged. Approximately the same for all curves φ=φ(t) and at various values of density of fluid in Figure 14 and Figure 15 maximum values φmax=1.25 rad and determine the rightmost limits of graphical dependences P=P(φ) and in Figure 16 and Figure 17, the limit value of rad and value (Figure 14 and Figure 15) of the endpoints graphs.
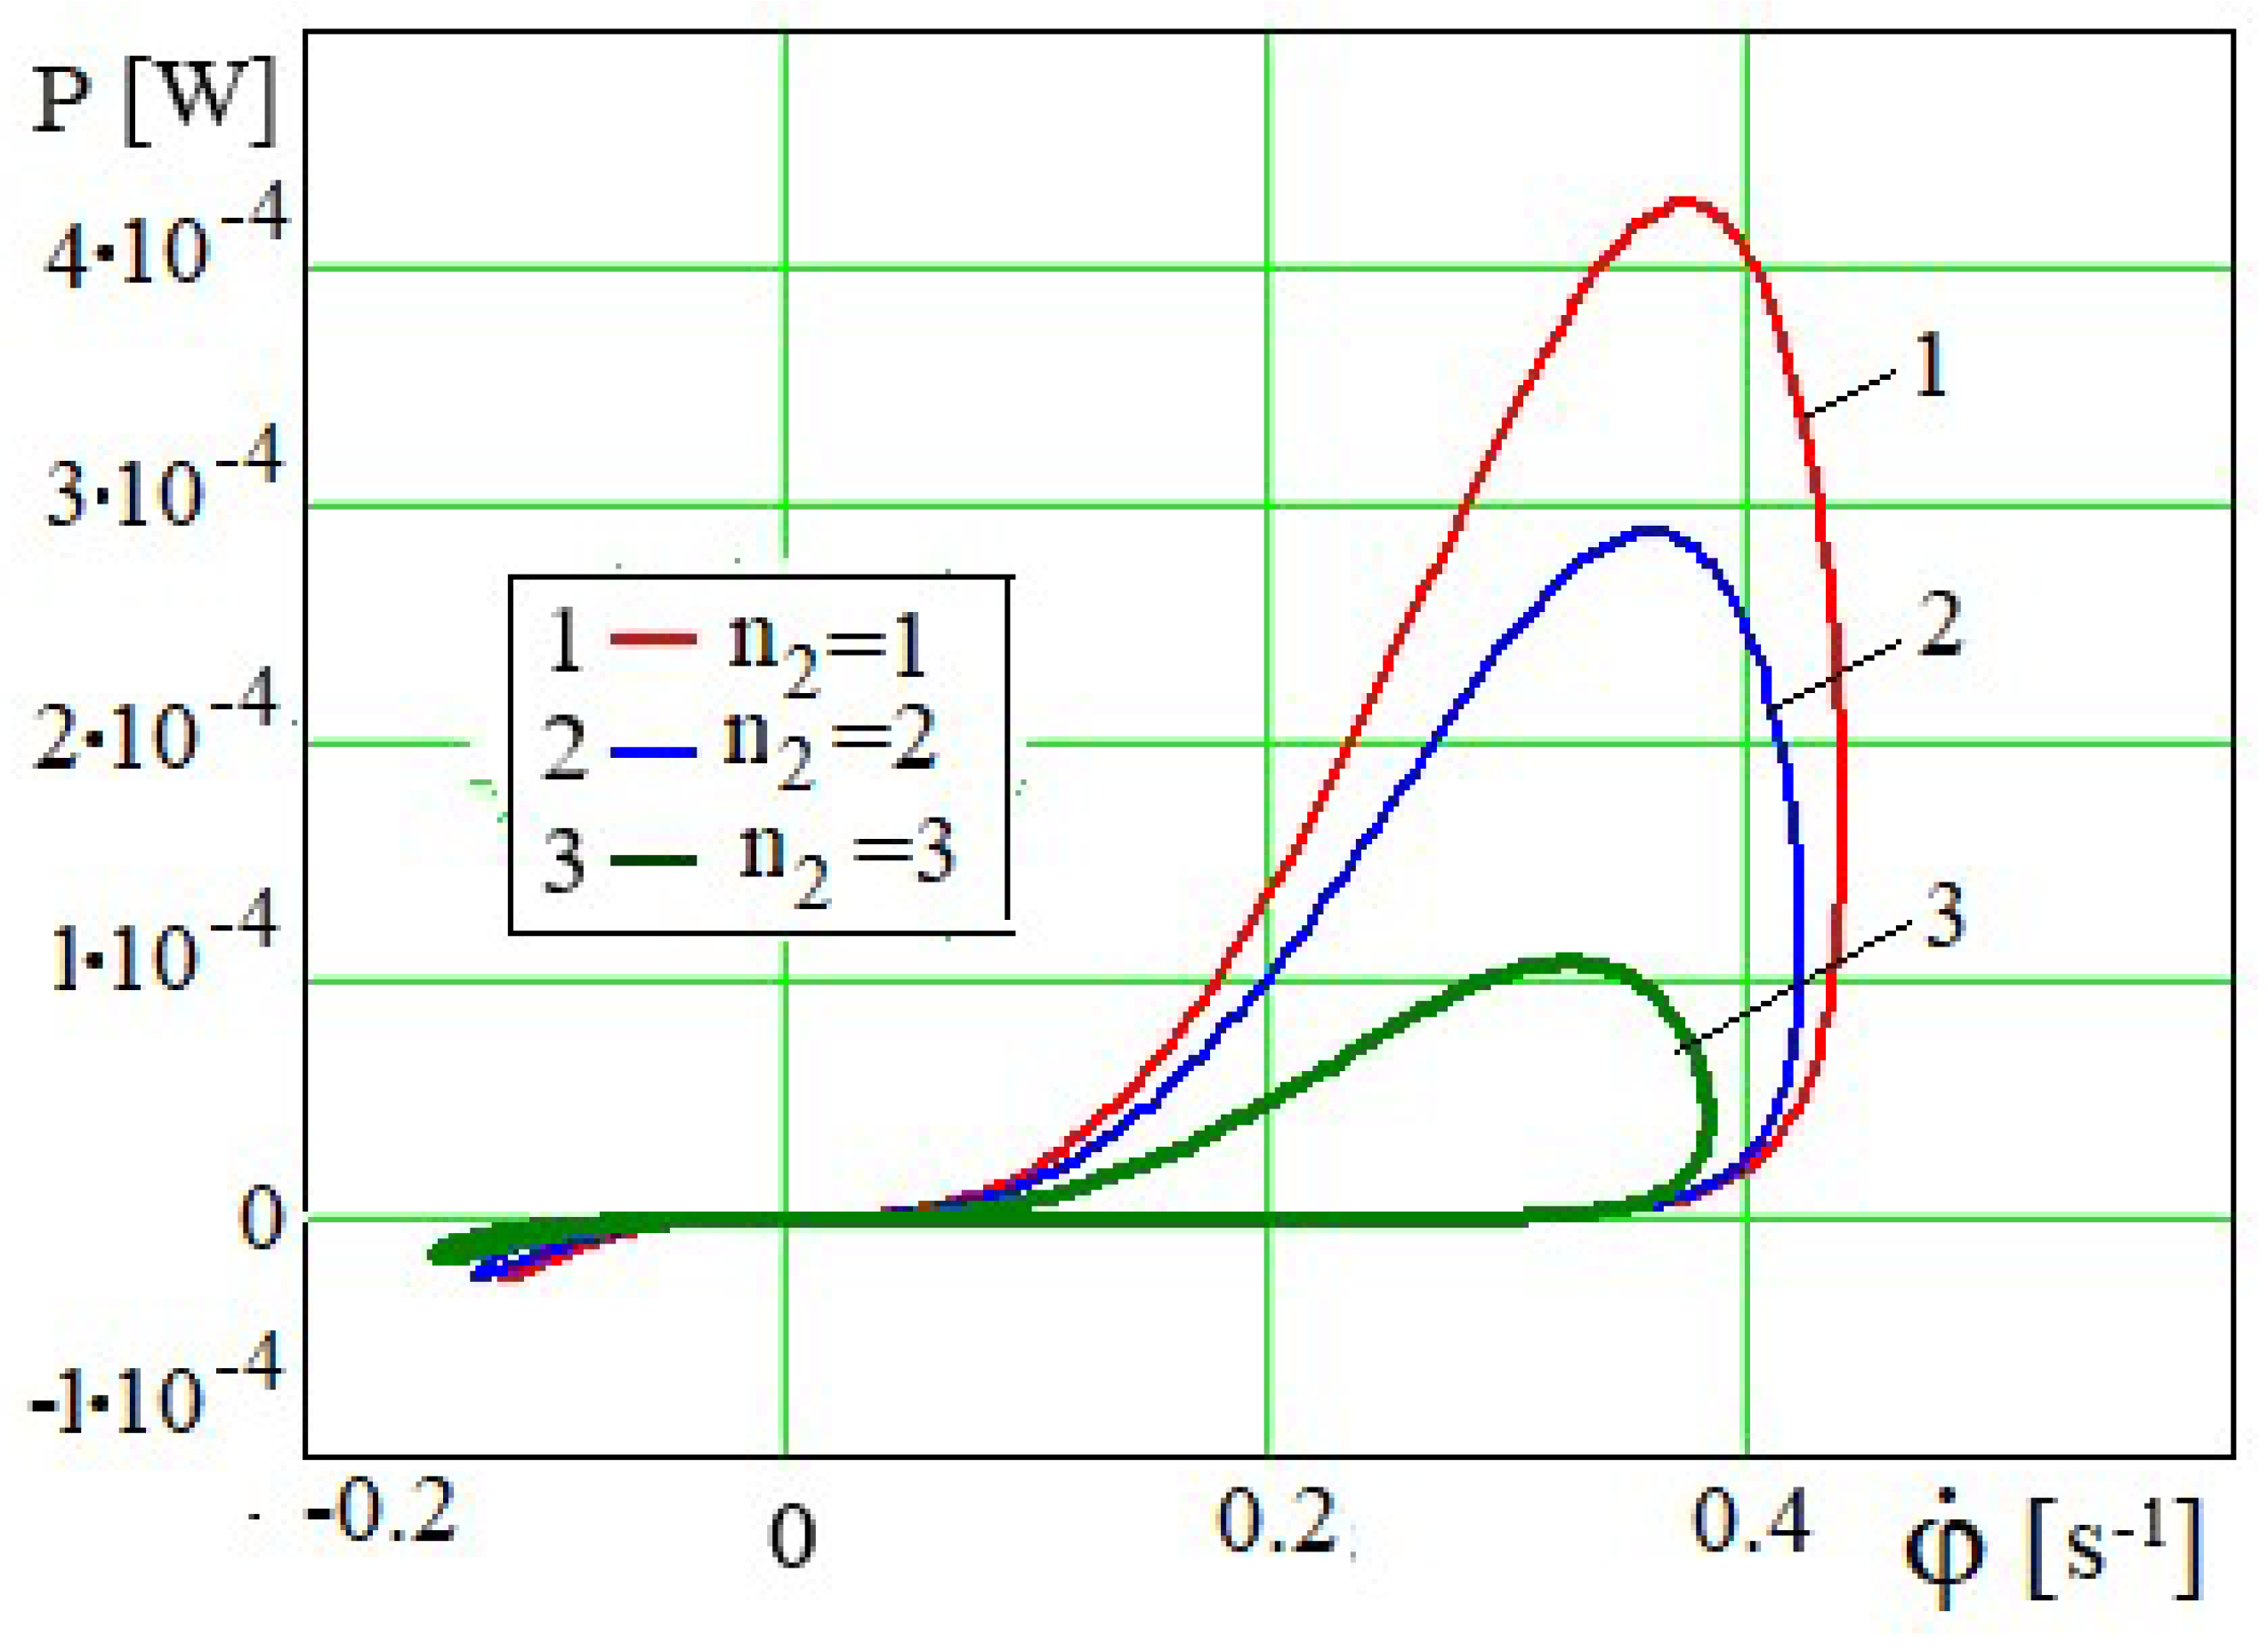
The effect of the number of piston holes on the dependencies is graphically presented in Figure 18 and Figure 19. The greater the number of holes , the less the resistance to the movement of the piston and, accordingly, the less the stirring-beating force (19.1) and the initial maximum angle of deflection of the motor shaft. At the rotational speed of the crank its angle of rotation (where ), in turn the value depends on according to the formula (16.2). The limit values of , to which the angle φ tends during the damped oscillatory process are different from zero (Figure 18).
At the force source shaft angle of : engine shaft rotational speed is.
As seen from Fig. 20, the greater the number of holes , the less the maximum power of the upward lifting force of the piston will be required. This is obvious from the dependence of the power of the stirring-beating force on the number of holes n2 of the piston (19.2). The maximum deflection angles of φ in Figure 18 define the right limits of the dependence P=P(φ) at various values of , and the limit values of the left end limits. The value affects the rotation angle φ in the relation of ~, since
Figure 20.
Dependence P=P(φ) at m=25 kg and various values of .
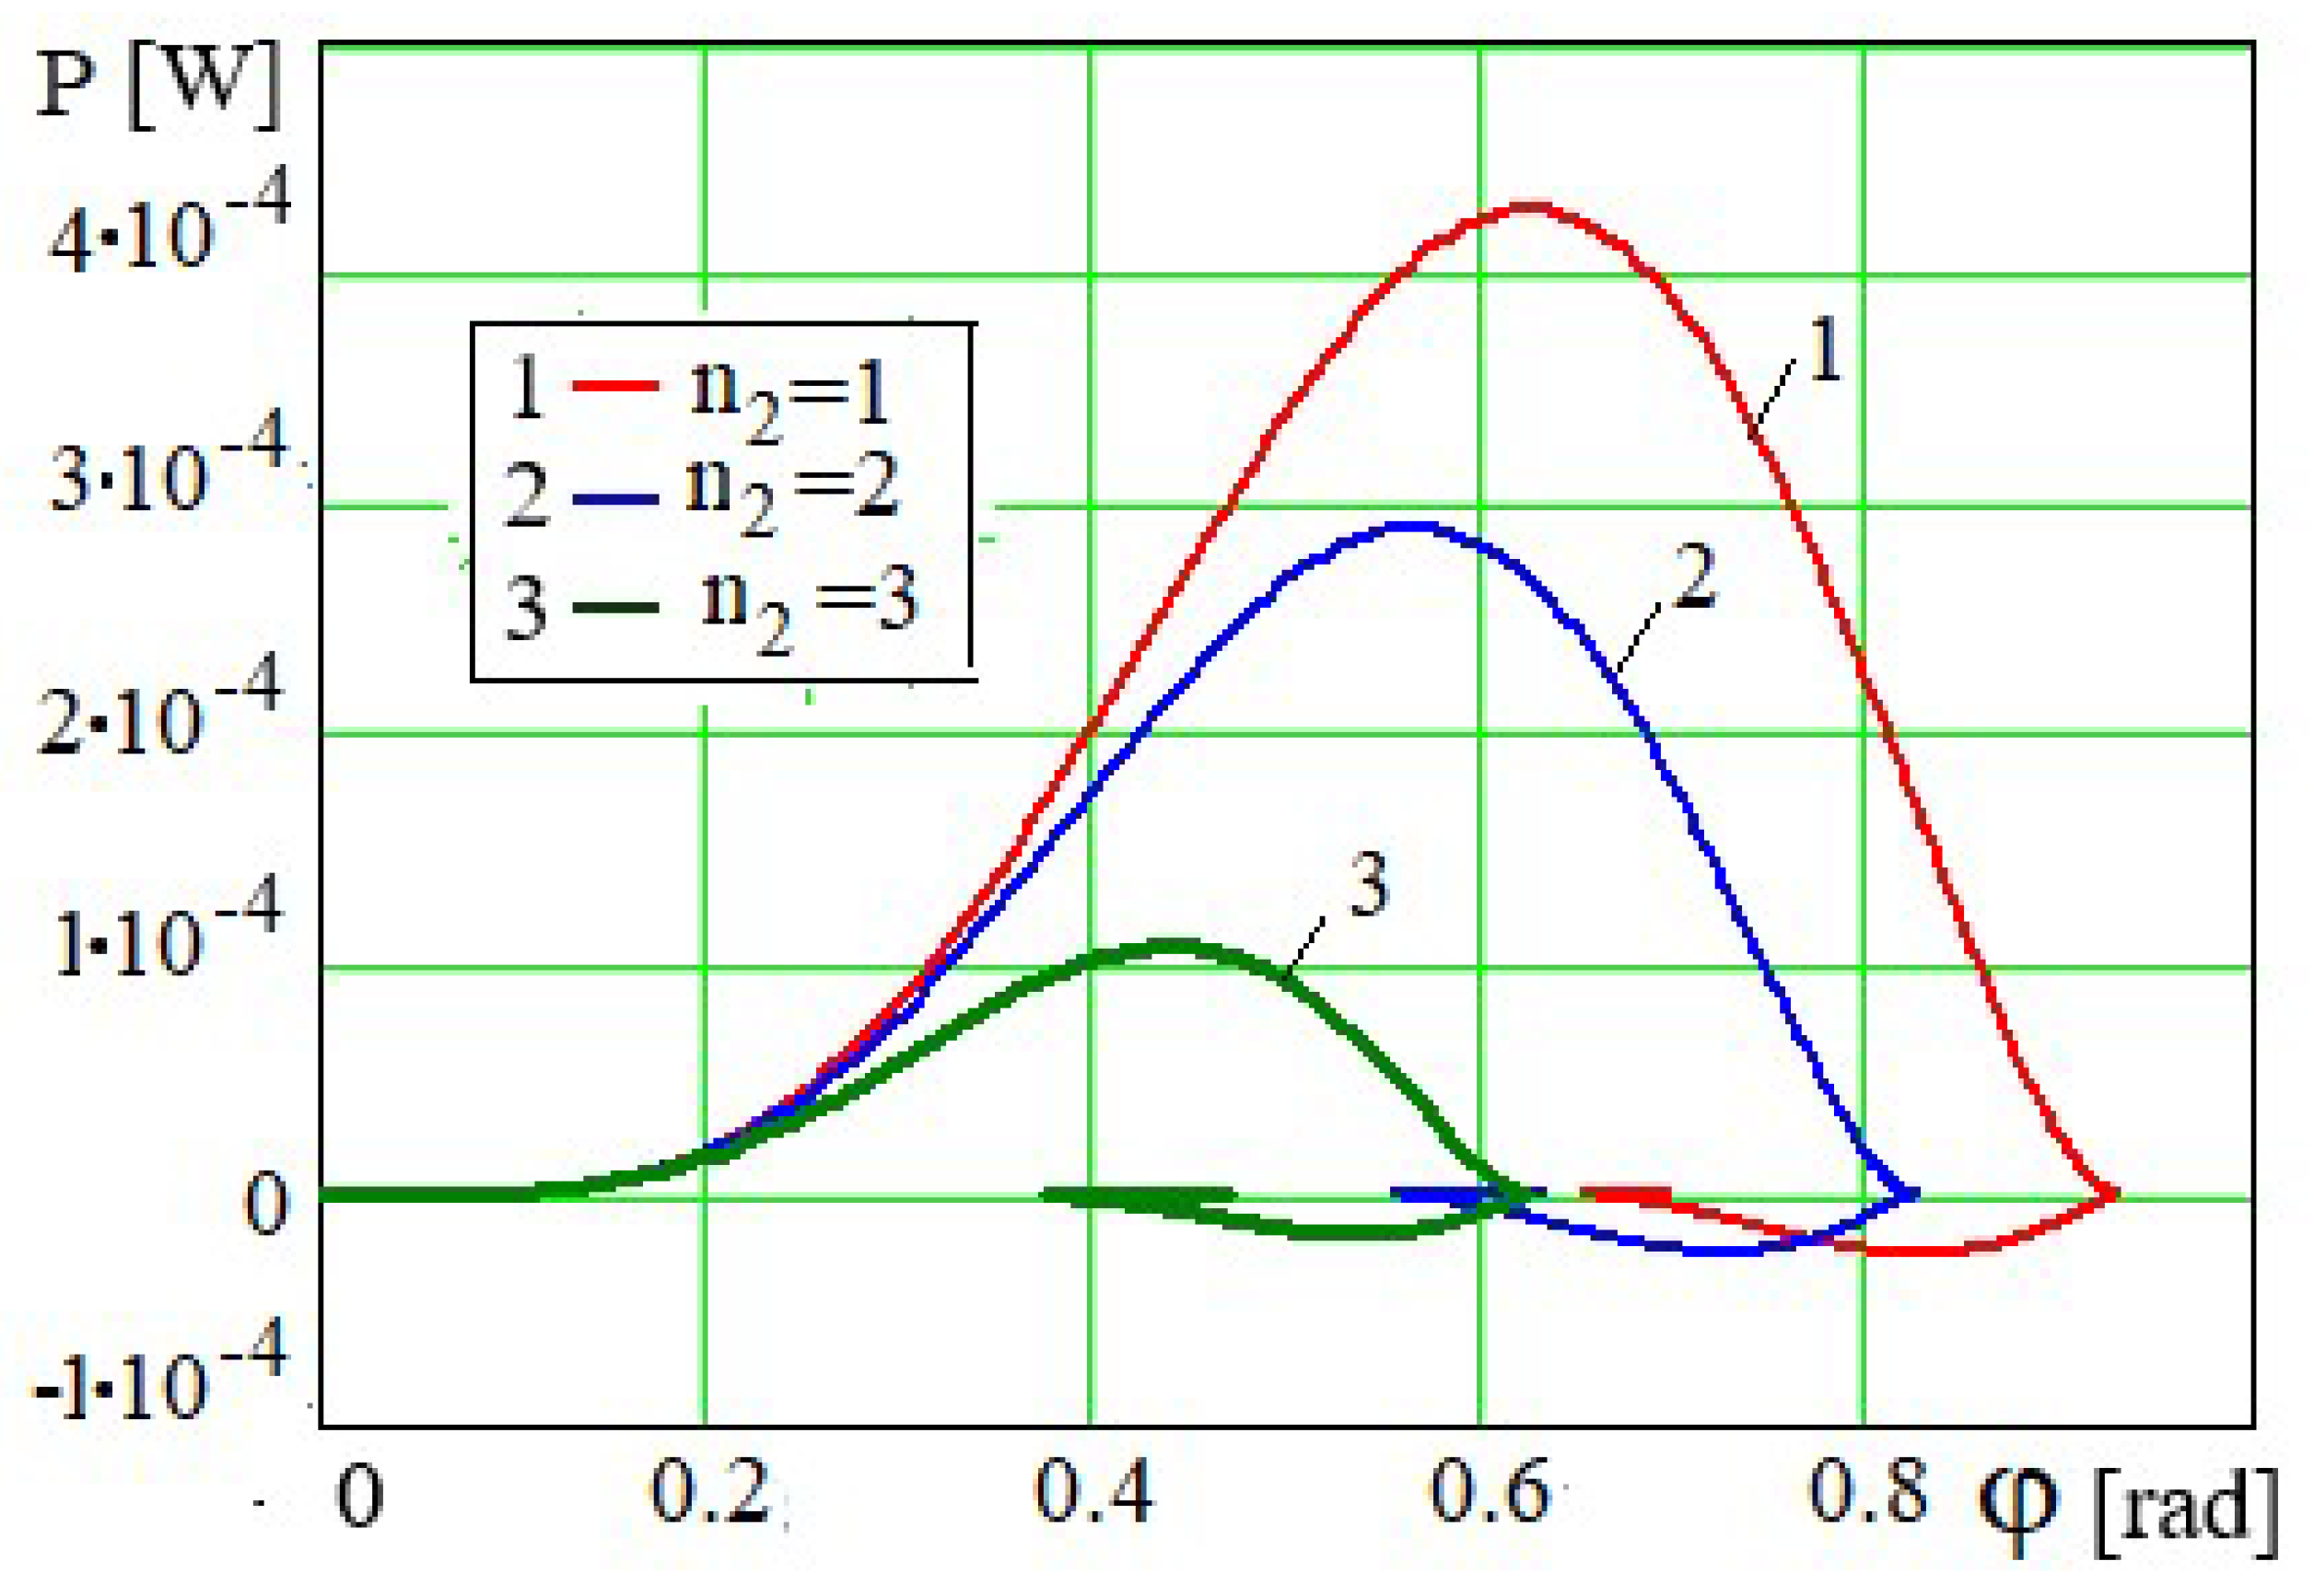
and , and therefore the periodicity of the function . The larger , the larger is the period of the function (Figure 20).
Figure 21.
Dependence at m=25 kg and various values of .
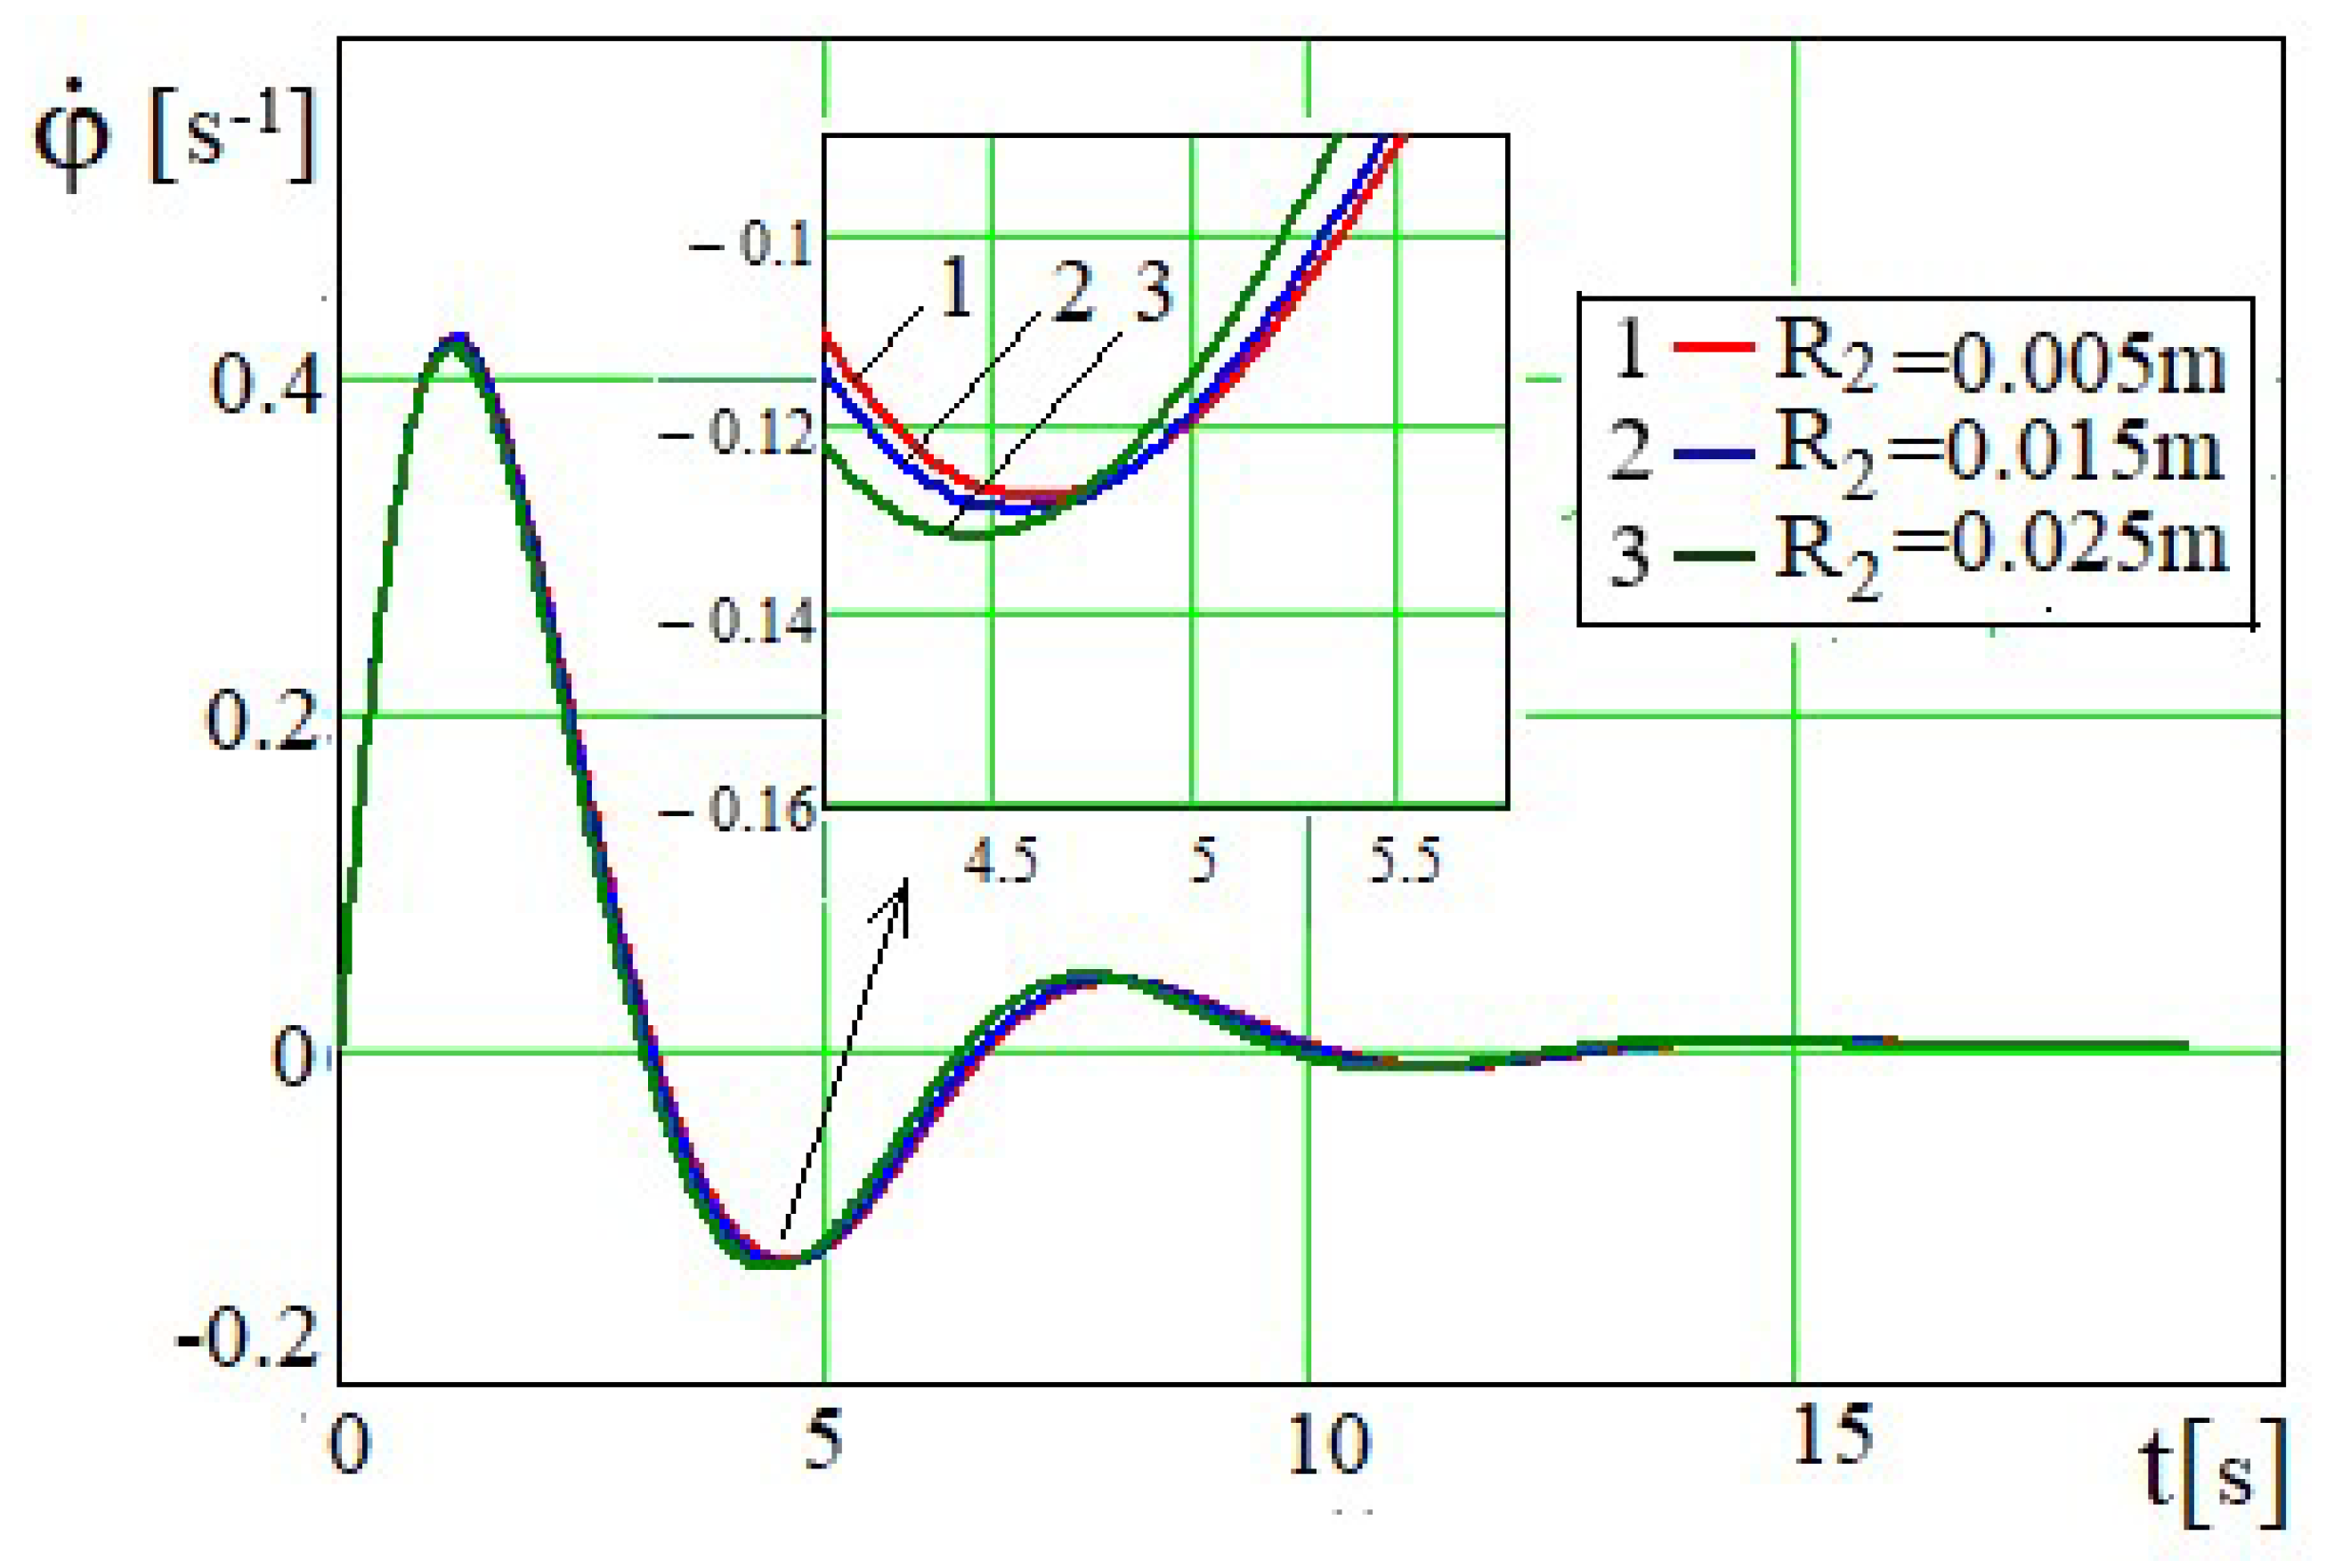
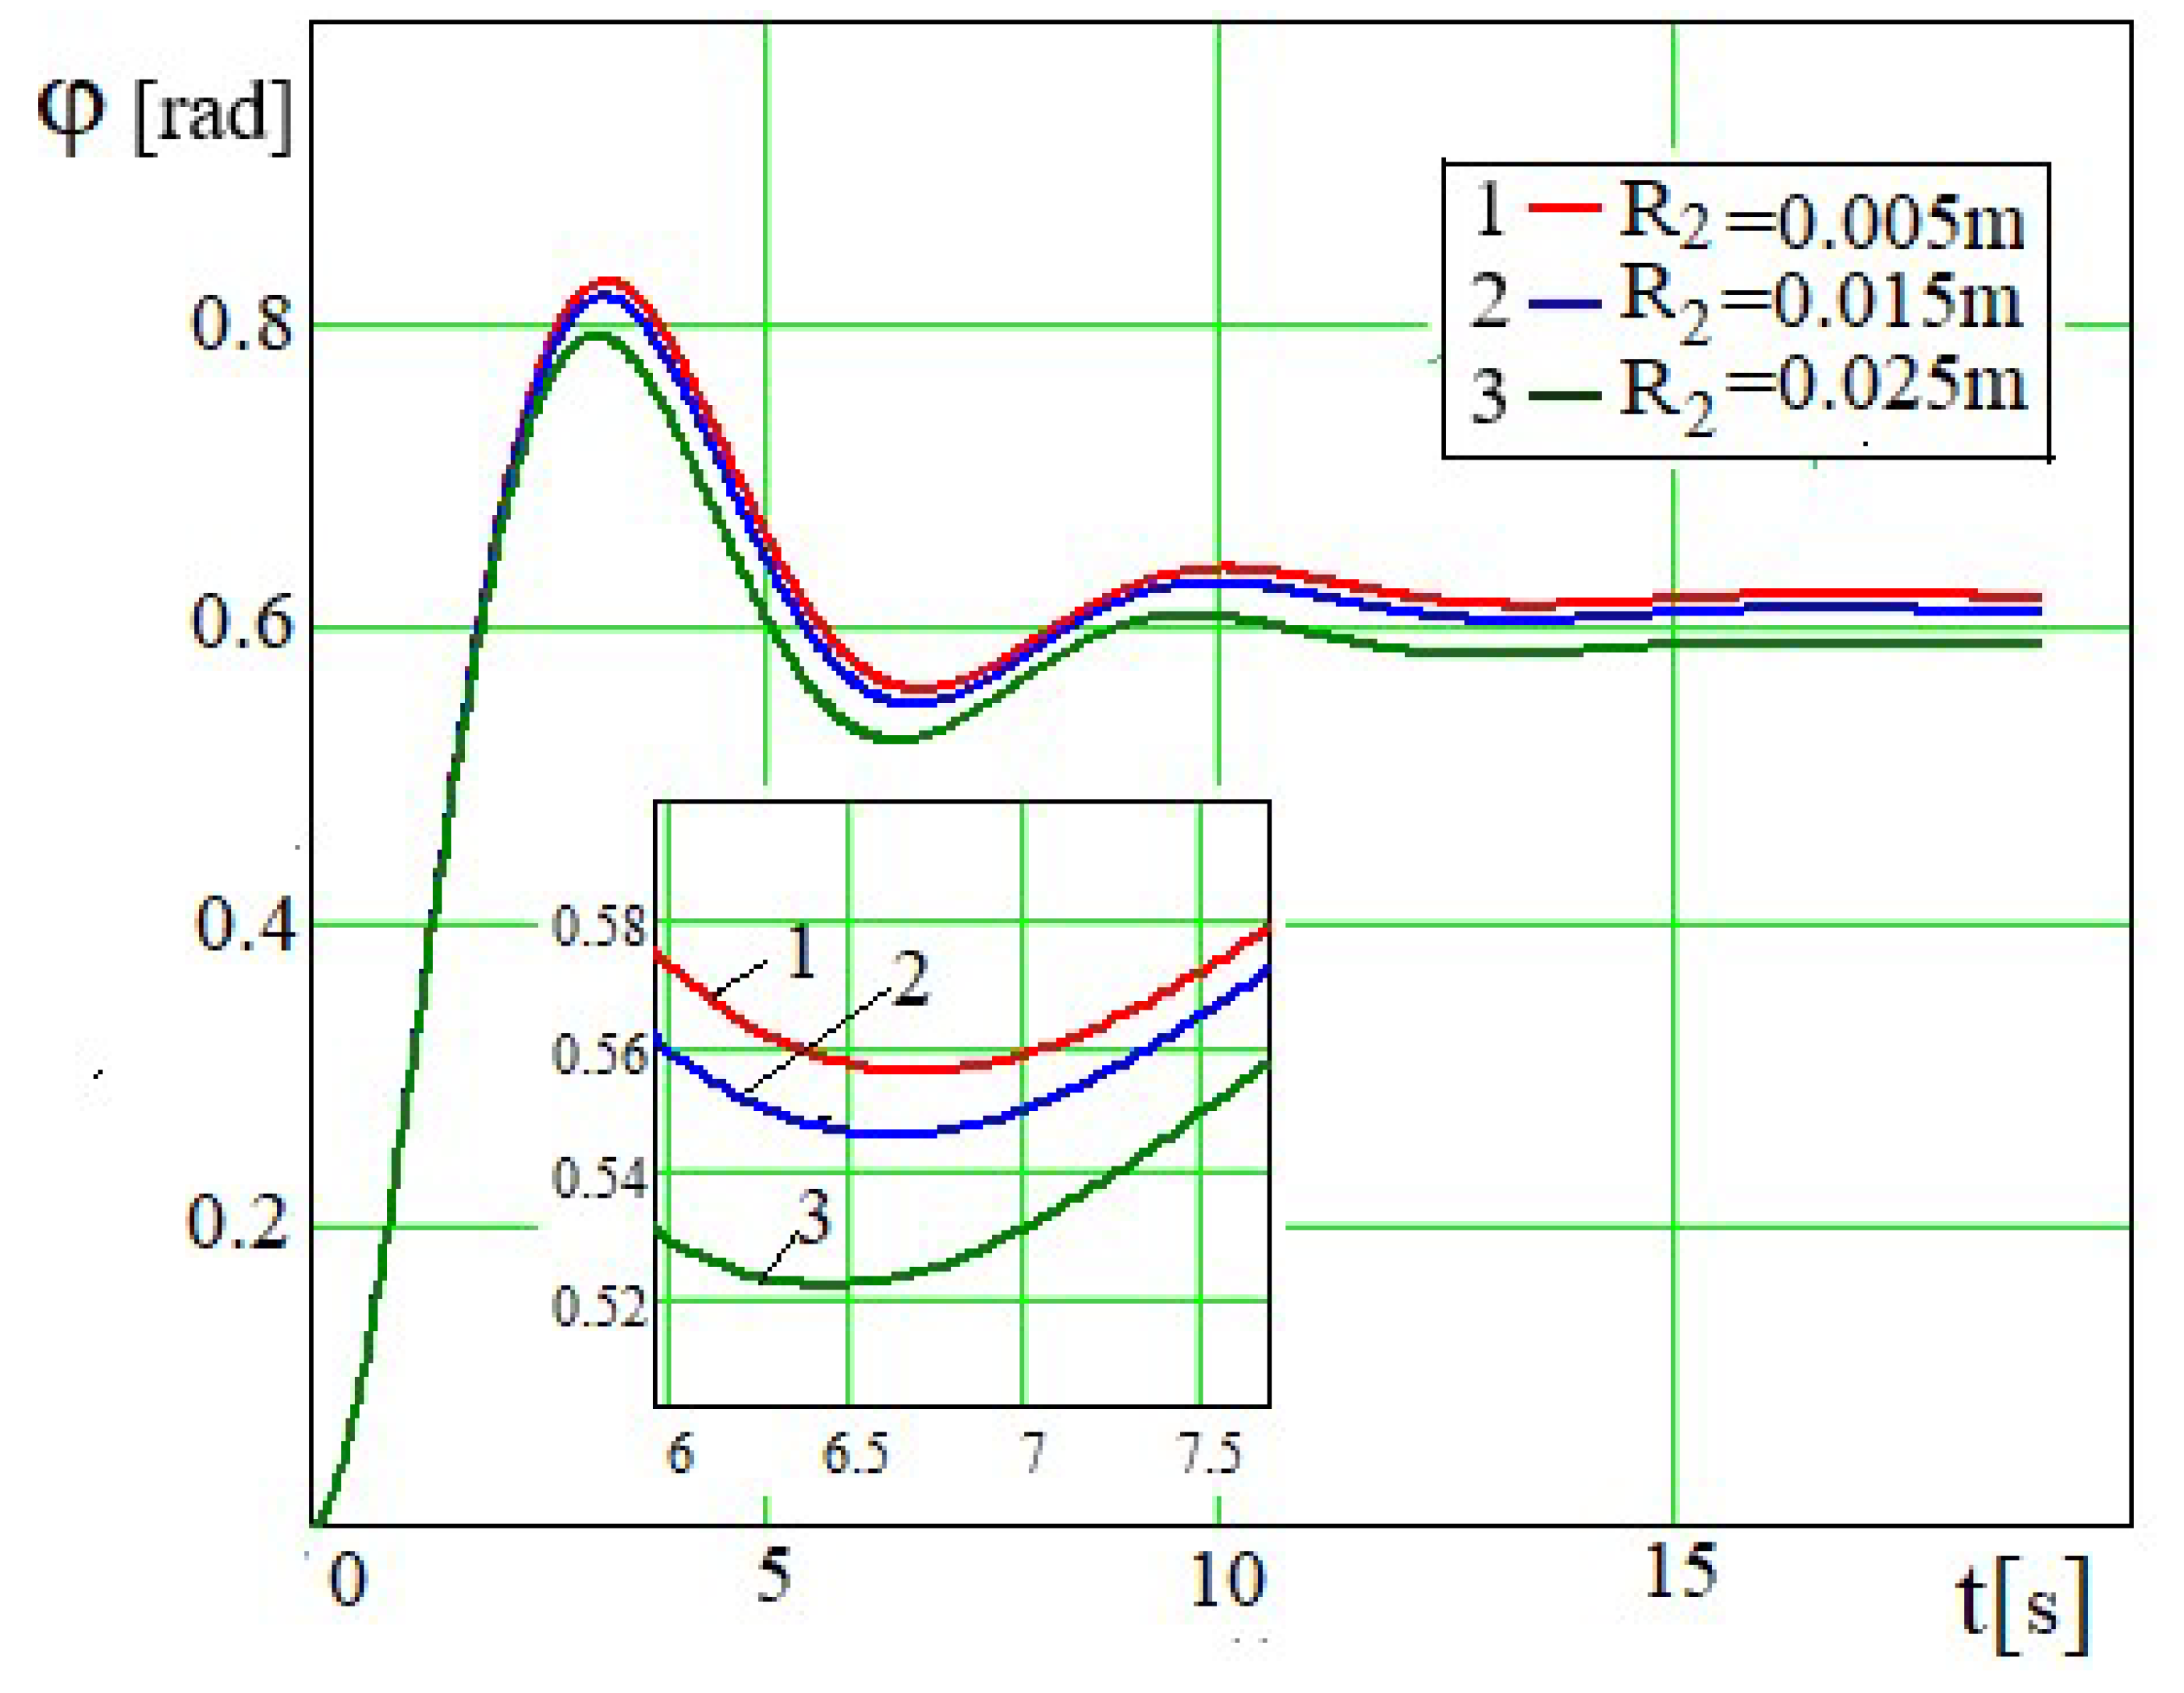
The radius of the holes on the piston has little effect on the dependences φ=φ(t) and (Figure 22 and Figure 23). Therefore, the values are taken to obtain more visual graphs. These graphical dependences have almost the same period of oscillation, the initial and subsequent amplitudes are larger. The angle of rotation φ over time tends to
the limits, which are determined by the relation which are determined by the relation, where . Obviously, at (Figure 23).
Figure 23.
Dependence at m=30 kg and various values of .
When the piston hole expands, less power of the mixing-whipping force is utilized, because the resistance of the fluid to the piston motion will be reduced (Figure 24 and Figure 25). The higher the amplitudes of oscillations of (Figure 22), the wider the right boundary and larger the left final boundary of the dependence P=P(φ) and larger the period of oscillations (Figure 24). The appearance of the negative parts of the dependence P=P(φ)
Figure 24.
Dependence P=P(φ) at m=30 kg and various values of .
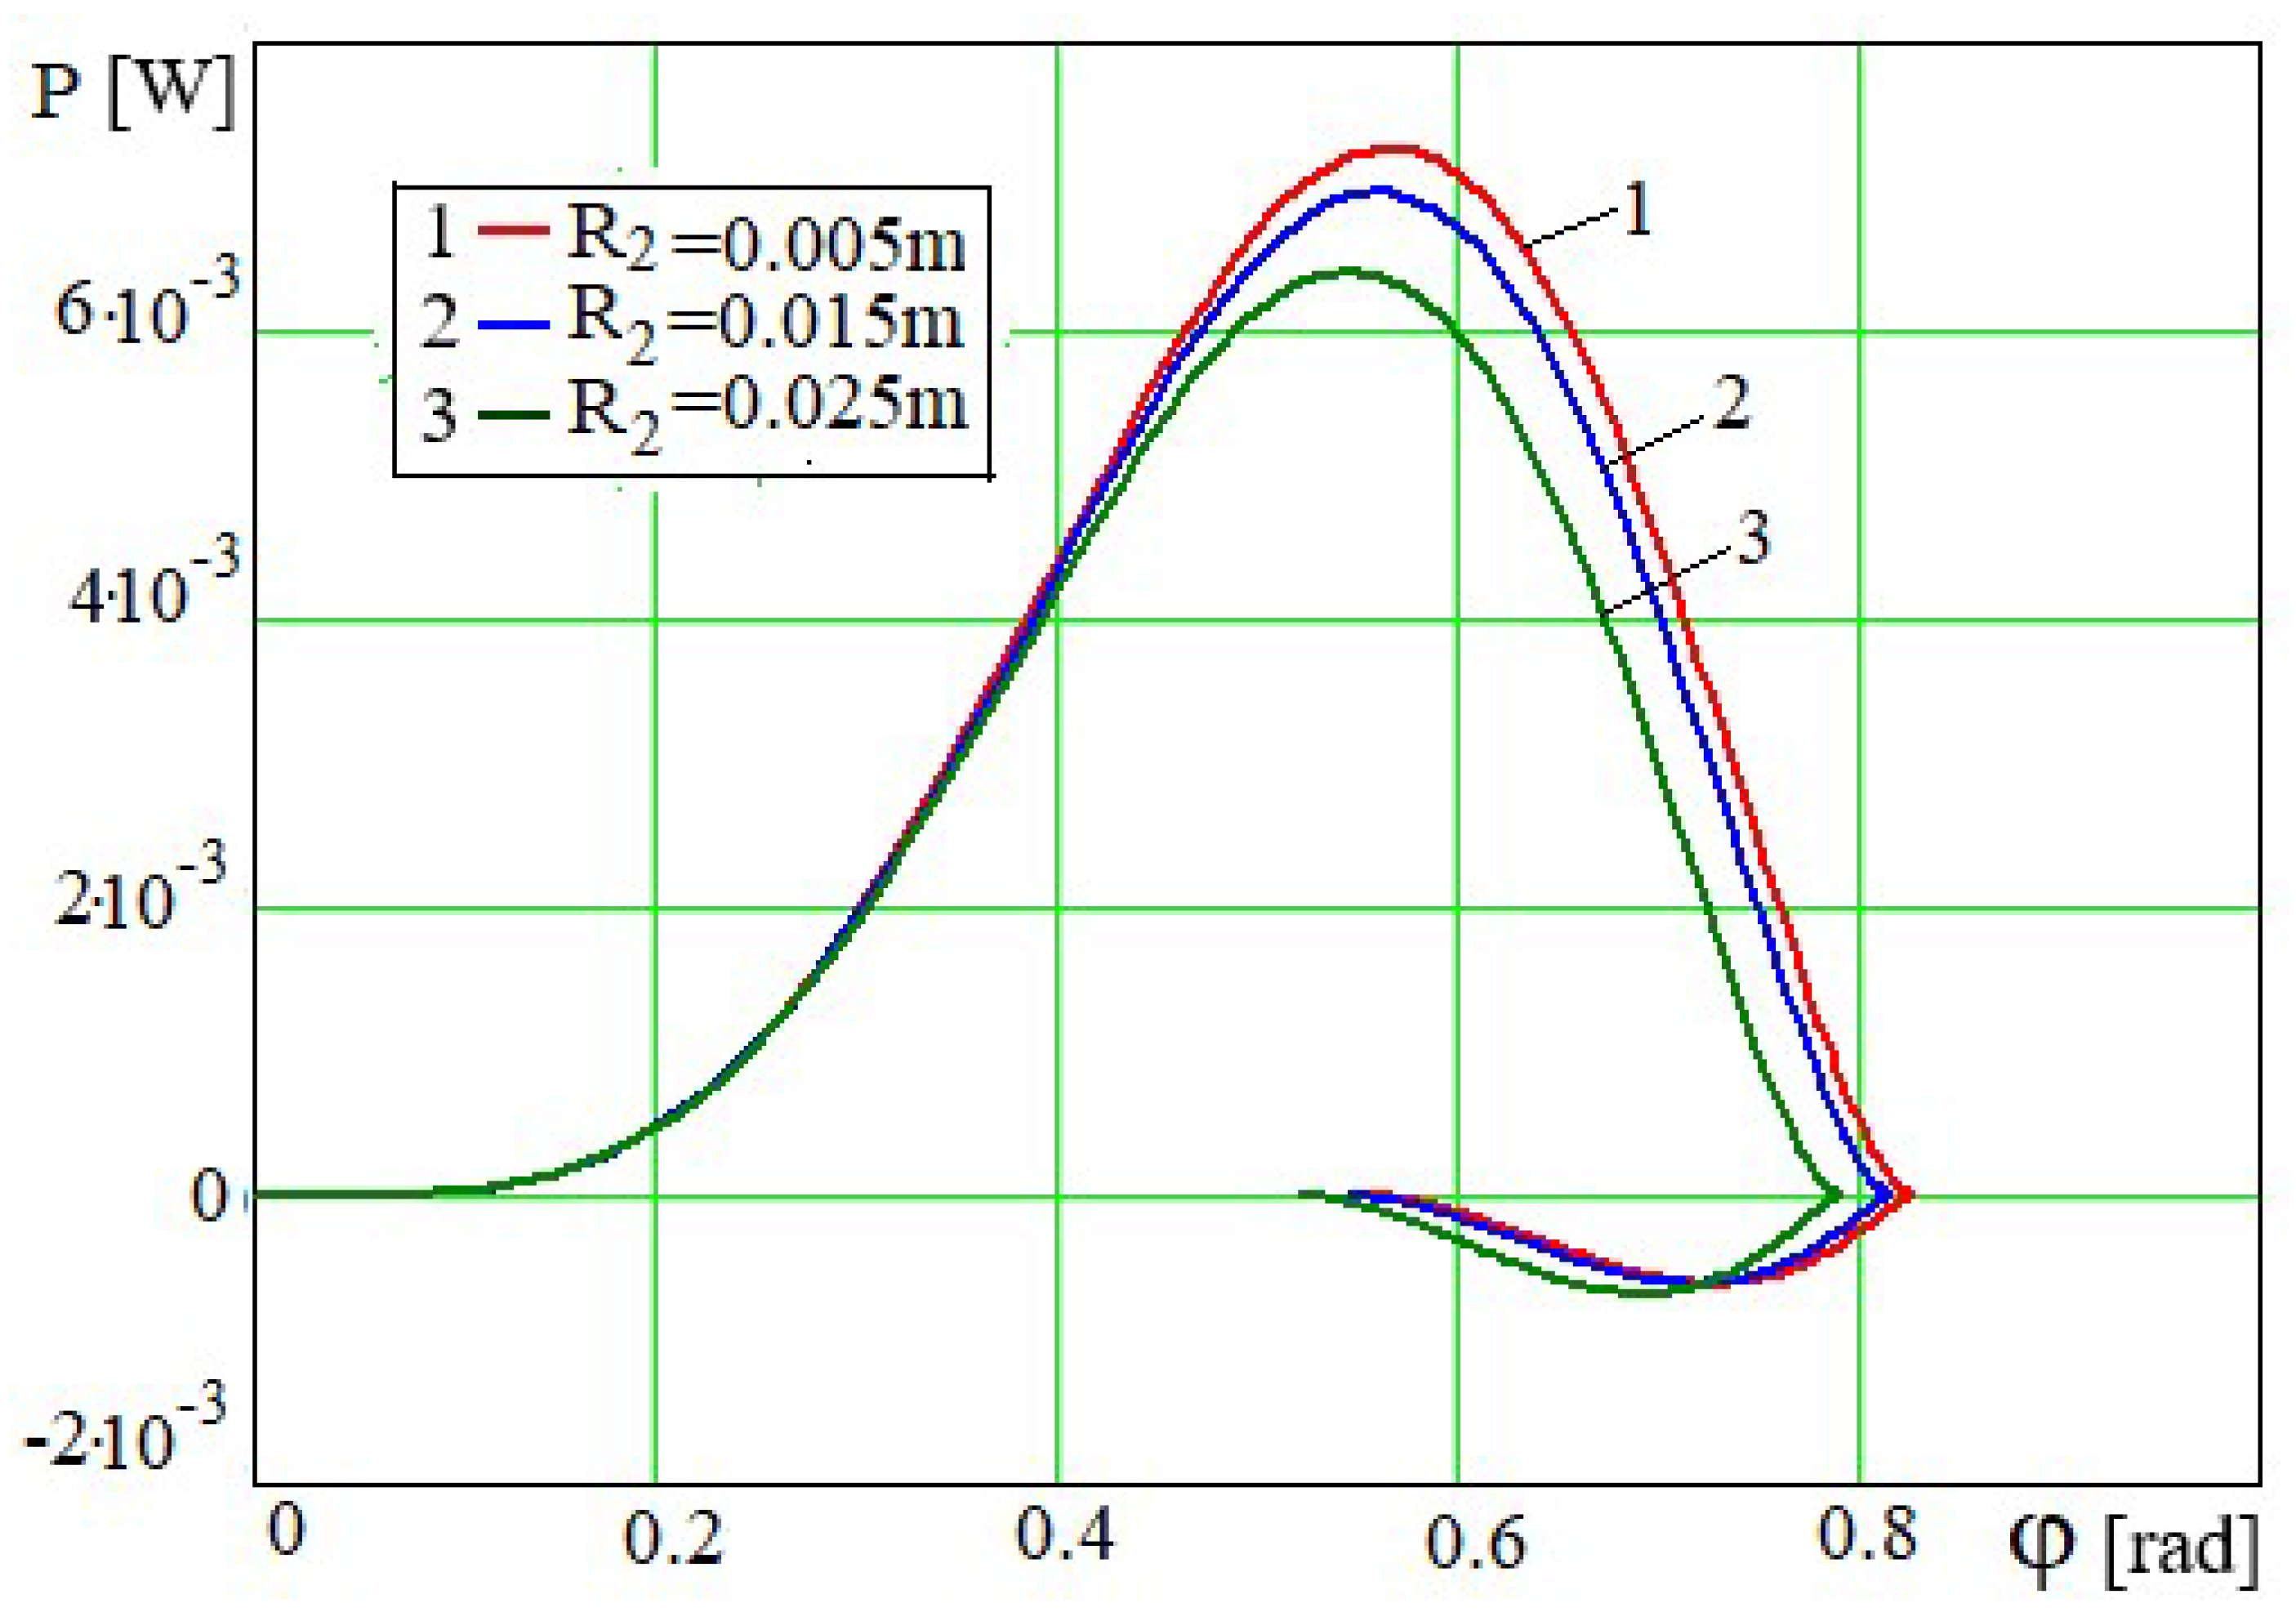
and is associated with the decrease of the value of after the initial maximum (Figure 22) and the negative part of the dependence (Figure 23). Obviously, the right boundary of the dependence (Figure 25) is determined by the maximum value of (Figure 23).
Figure 25.
Dependence at m=30 kg and various values of

4 Principles of Operation and Creation of a Mixing and Churning Device Based on a Crank-Slider Mechanism
The device based on the slide-crank mechanism of the second class operates as follows (Fig. 26). From the engine 1 through the drive (gearbox and clutch) rotating crank 2, the motion is transmitted through the connecting rod 3 to the slide 4 and then to the piston 5. The piston is made in the form of a cylindrical disk with round holes for technological processes.
Figure 26.
The device for mixing and whipping the suspension based on the slider–crank mechanism: a–the first variant of the arrangement of the mechanism; b–the second variant of the arrangement of the mechanism.
Figure 26.
The device for mixing and whipping the suspension based on the slider–crank mechanism: a–the first variant of the arrangement of the mechanism; b–the second variant of the arrangement of the mechanism.

The piston with oscillating motion mixes, whips and agitates the primary products fed into the cylinder 6 through the nozzle 7. The periodic movement of the piston contributes to the uniform distribution of ferment in the cylinder, the breakdown of protein flakes into fine particles, the strengthening of enzymatic processes, as a result of which the quality of fermented milk products and aroma are achieved. The whipping process occurs at the moment when the maximum force of mixing and whipping of the piston or its power is reached. The shaking process can be enhanced by means of a communicating tube 8 to the cylinder. The finished products of the technological process are discharged through the nozzle 9. The mixing and whipping force or its power can be adjusted by varying the torque of the engine, the length of the crank, the number of piston holes and their radius.
If the power of the engine is equal to or slightly greater than the power of the resulting pressure force, the buoyancy force and gravity, the friction forces between the piston and the liquid in the round holes and in the gap between the cylinder, then the crank performs the rotational mode of movement, if the torque a of the engine is less than the torque caused by the action of the total forces of pressure and gravity, the buoyancy force, the friction forces between the piston and the liquid, i.e. not enough for the rotational movement of the crank, then the crank will perform the damping oscillatory process. Thus, the mixing and beating device can operate in two driving modes of the leading link: in rotary and oscillatory damping, depending on the requirements for the quality of the products produced. All this suggested the idea of creating a device based on a crank-slider mechanism, carrying out adjustable technological processes of mixing, whipping and agitating suspensions, from an engine with adjustable torque and power, a driving link of different lengths, a replaceable piston disk with a different number of holes and their radius, a 3D model and an experimental sample of which are presented in Figure 27. Due
Figure 27.
3D model (a) and prototype (b) of the mixing-churning and agitating device: 1 – disc-crank, 2 – engine, 3 – connecting rod, 4 – housing on wheels, 5 – engine power regulator, 6 – cabinet of measuring instruments: ammeter, voltmeter and wattmeter, 7 – sensor for measuring the force of interaction of the piston with the liquid, 8 – slide on the guide, 9 – cylinder containing a piston and liquid, 10 – tube with a valve for supplying liquid, 11 – communicating pipe with a valve for regulating the agitation process, 12 – tube with a valve for draining liquid.
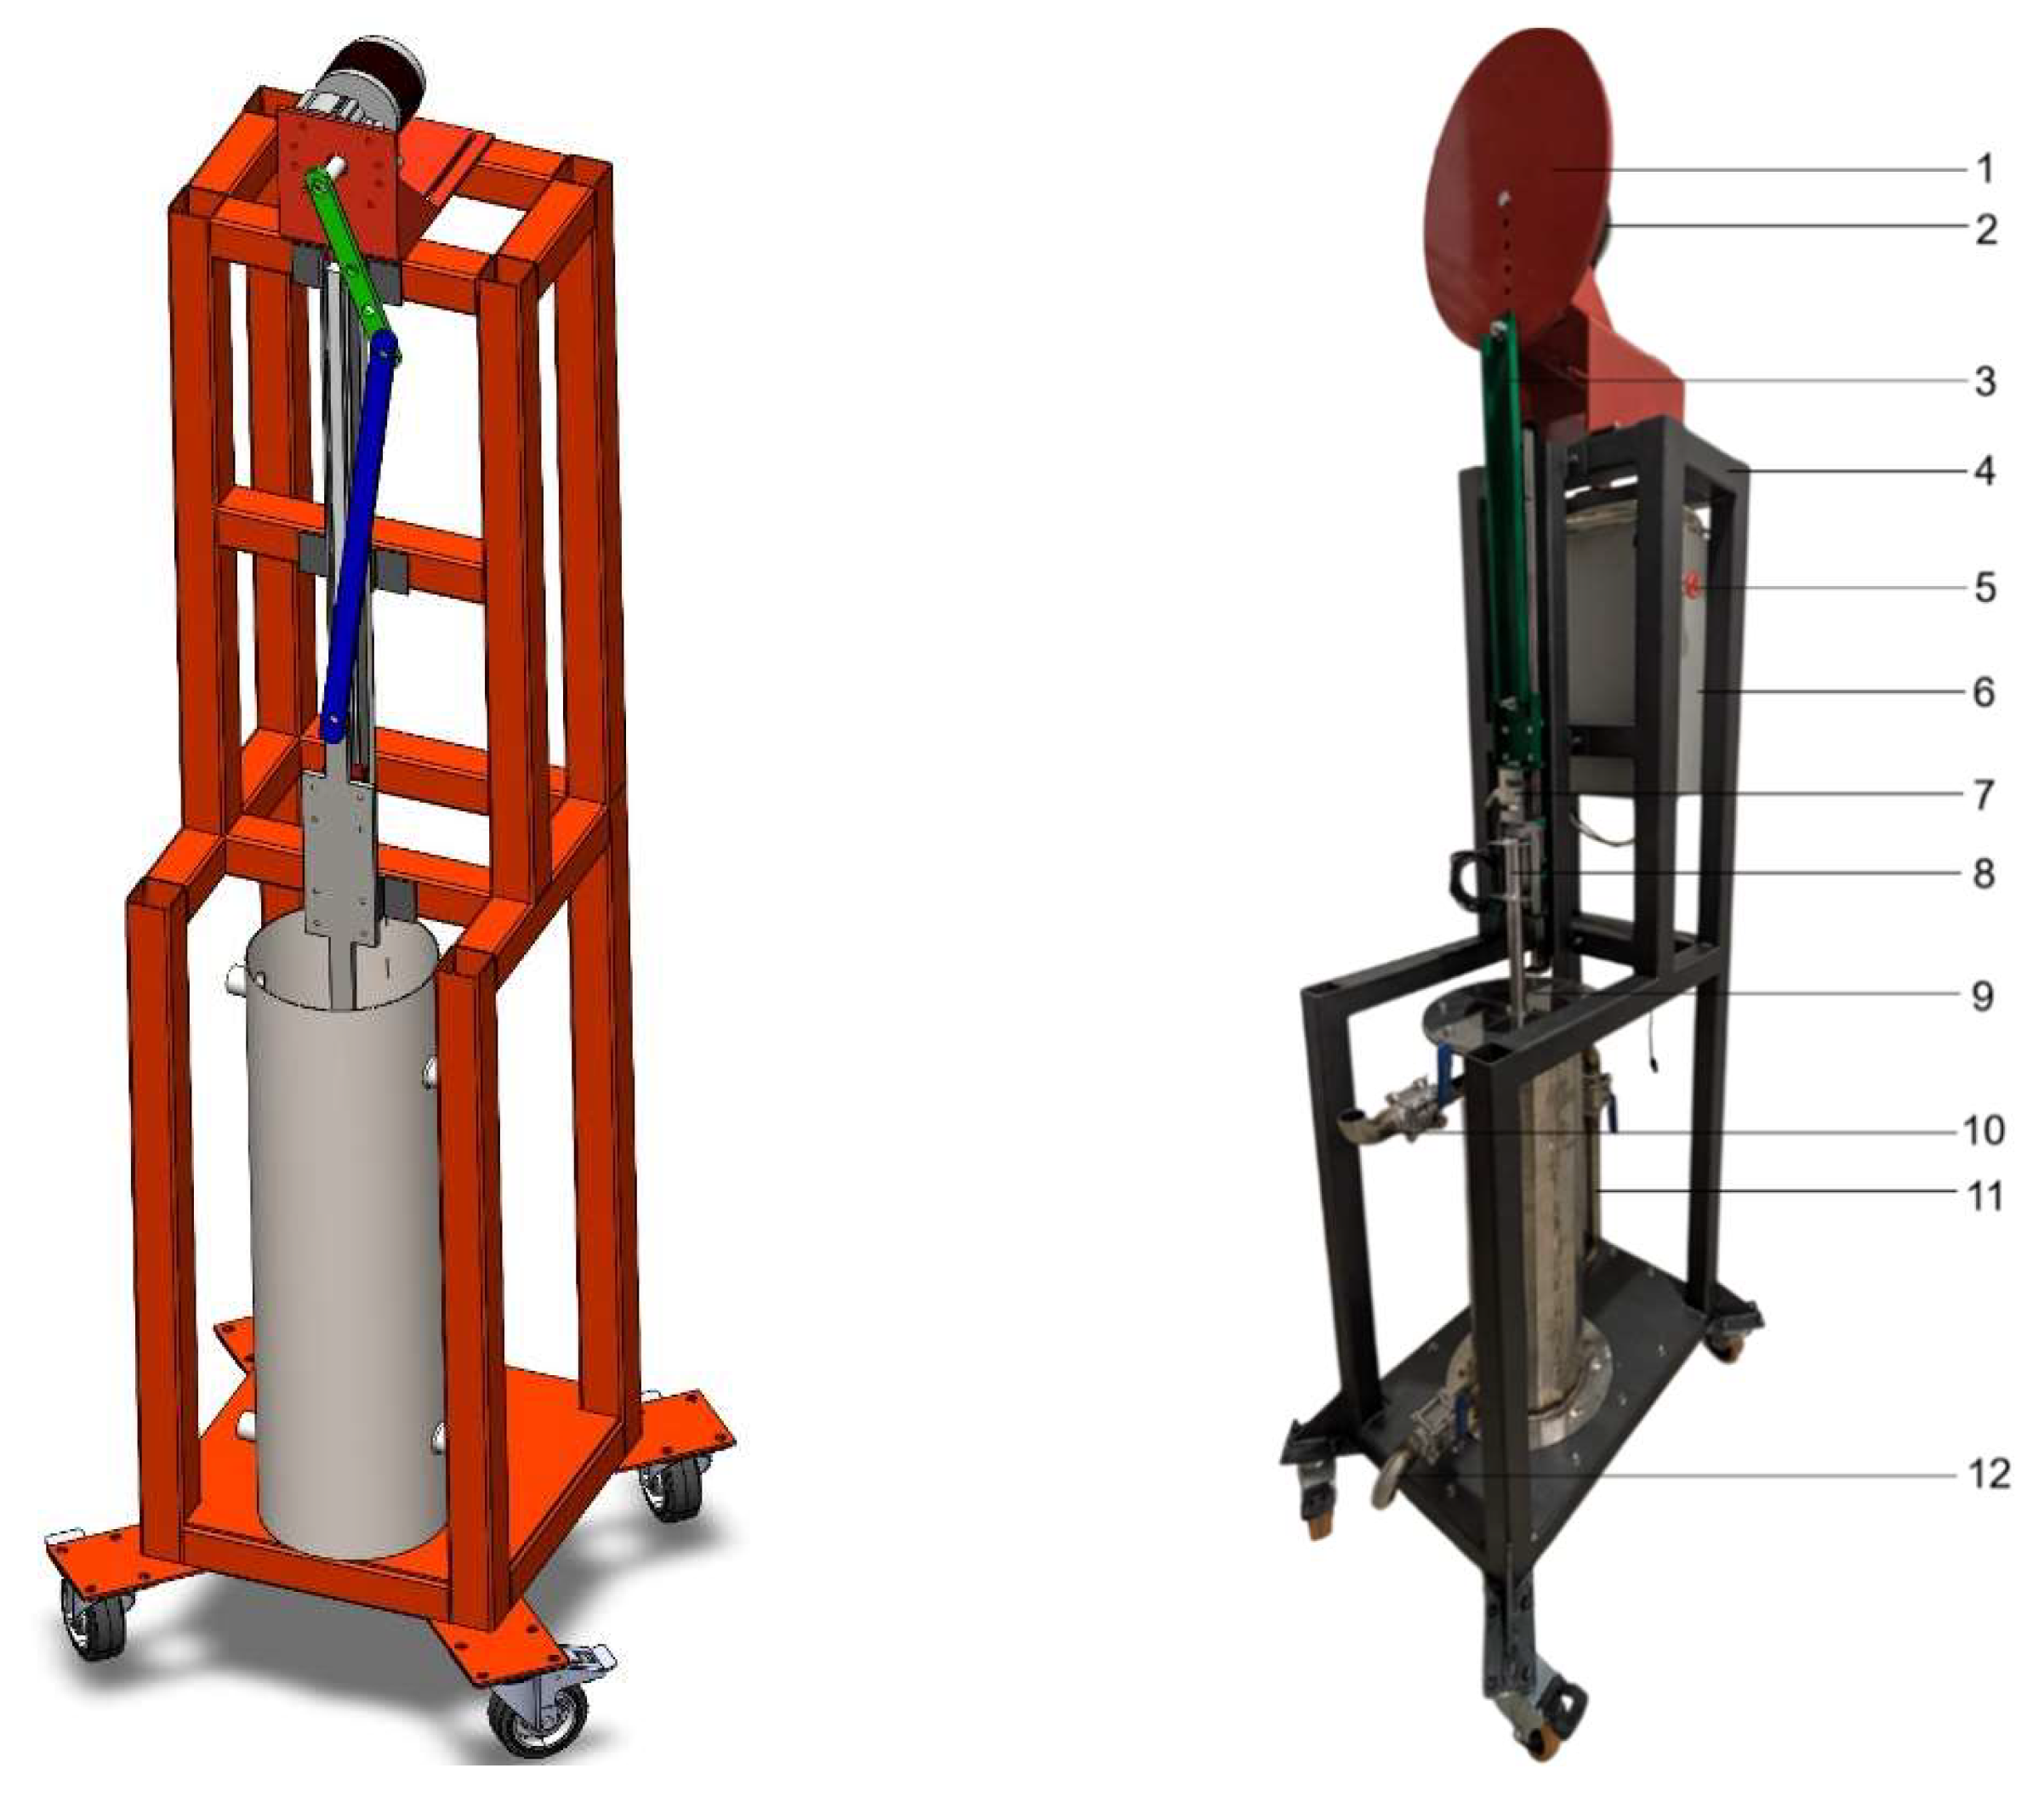
to the existing guide (Figure 26 and Figure 27) of the slide movement, the reciprocating movement of the piston takes place strictly vertically, parallel to the cylinder forming the production environment. This prevents the devices from dangling the piston and unnecessary contact, friction with the cylinder walls and knocking. The horizontal platform and on which the resting outer frame provide stable operation of the device and the engine in which they are fixed. The presence of support wheels makes it possible for the device to move freely over the production area.
5. Experimental Study of the Dynamics of the Stirring-Beating and Shaking Up Device
An experimental study of the dynamics of the stirring-beating and shaking up device under the oscillatory and aperiodic damping mode of the disk-crank movement was carried out according to the following methodology. The voltage and the motor power were selected at a constant current in the motor circuit, at which the disc-crank rises up, slowing down the movement, stops before reaching 90° of the rotation angle and then descends downward, slowing down the movement, and stops before reaching a static zero equilibrium. This oscillatory and aperiodic damping process occurs in the interval of the disk-crank rotation angle φ (0, π/2), as expected following the results of numerical studies of the dependence φ = φ (t) (Figure 2, Figure 6, Figure 10, Figure 14, Figure 18 and Figure 22) and after a while the process repeats again.
Figure 28.
The prototype stirring and shaking up device during experimental studies.
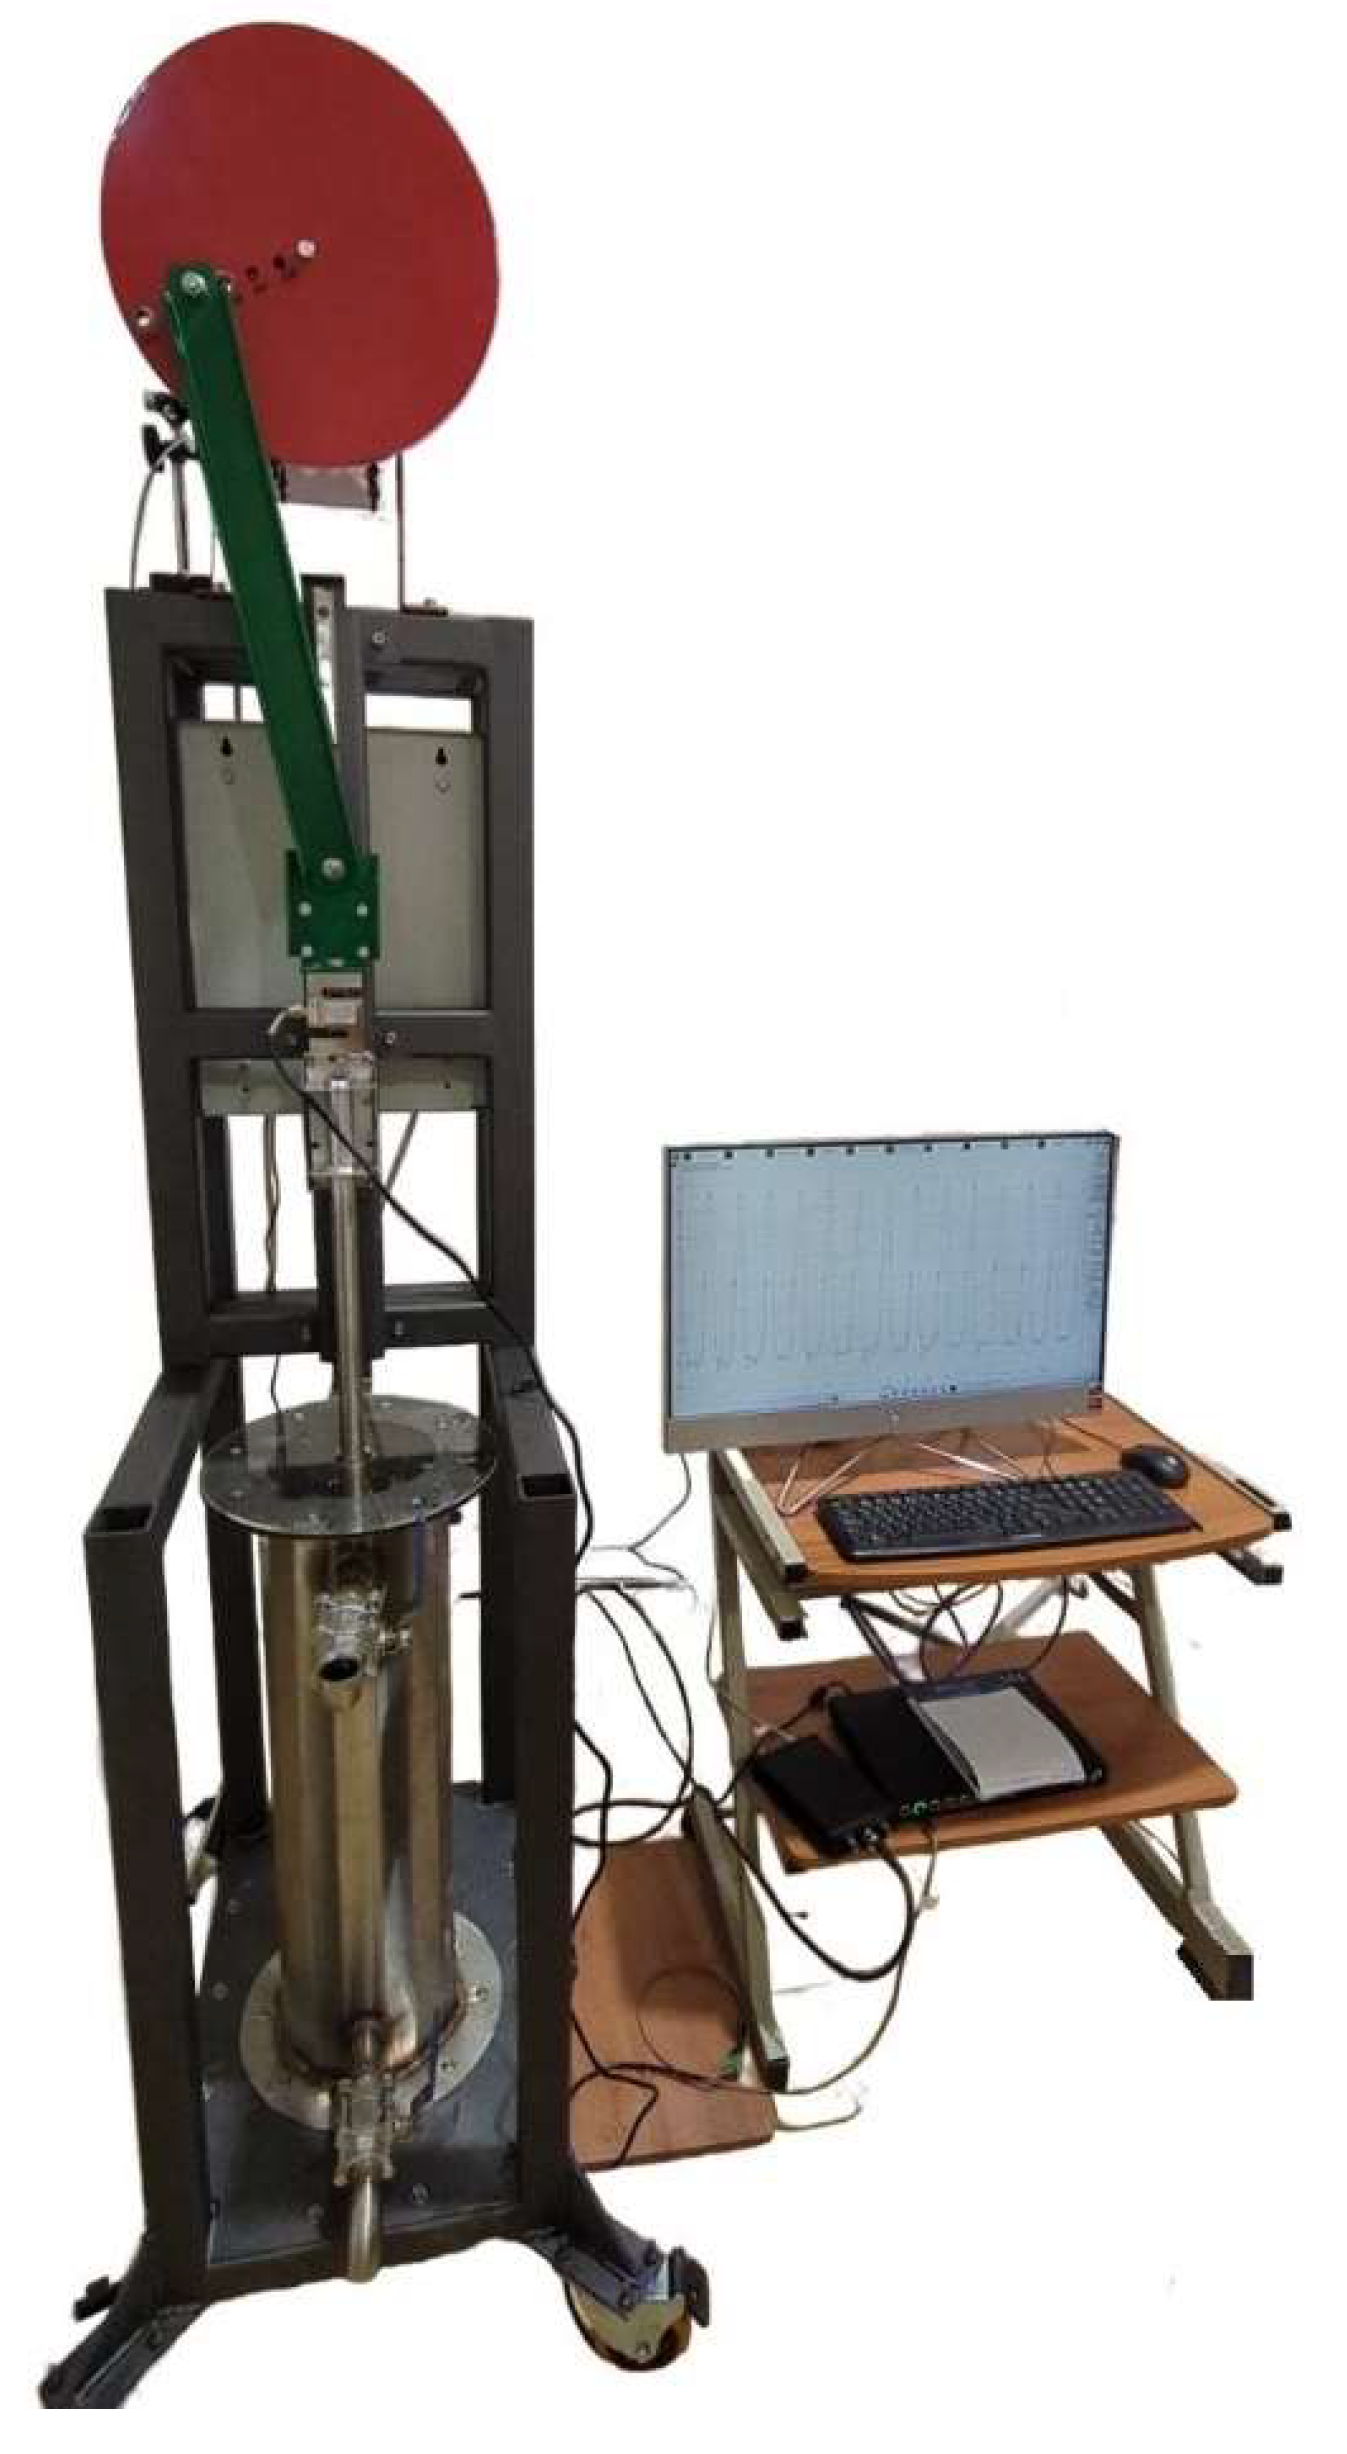
In order to determine experimentally the power of the piston and liquid interaction force it is necessary to measure the force of the piston and liquid interaction and the corresponding piston (slide) speed. The piston and liquid interaction force was measured by the strain gauge CALT DYLY-103 built into the slide, which was connected to the strain gauge station ZET058 [www.zetlab.com] and then to the computer. Using the ZETLAB software [www.zetlab.com], an oscillogram of the force acting on the slide was obtained for various cases of oscillatory and aperiodically damped operation of the disc-crank of the prototype stirring-beating device. According to the obtained force oscillogram, the maximum force of interaction of the piston with the liquid was estimated for various cases of the motion mode.
The linear acceleration of the slide was measured using a digital accelerometer Zet 7052-N [www.zetlab.com], which was connected via the interface Zet 7076 [www.zetlab.com] to the computer. Using the filtration program [www.zetlab.com], the linear velocity of the slide was obtained, which was recalculated through the transfer function of the device to the angular velocity of the crank.
The results of the experimental work were processed using the ZETLAB software [www.zetlab.com] and the MATLAB program.
The prototype stirring-beating device in combination with the measuring equipment during the experimental studies is shown in Fig. 28 and the video material showing the oscillatory and aperiodically damped mode of motion of the stirring-beating and shaking up device is presented in the appendix [30, 31]. For experimental studies, a disc-crank with holes located at different distances from the center, a piston in the form of a disc with different mass and holes of different numbers and different radii have been prepared.
The standard values of parameters of the prototype stirring-beating device andthe liquid are as follows: crank length r=0.10 m, connecting rod length lcr=0.48 m, connecting rod weight Mcr=1.2 kg, slide weight ms=2.49 kg, cylinder radius Rc=0.095 m, piston weight m=2 kg, piston thickness h=0.012 m, piston radius R1=0.09 m, number of holes n2=4, hole radius R2=0.02 m, liquid density ρ =1000 kg⋅m-3, dynamic liquid viscosity η=8,90·10−4 Pa*s (25o C).
The oscillogram of the periodic variation of the force of the piston and liquid interaction, minus the values of the buoyancy force and the force of gravity of the piston, represents the oscillogram of the variation of the force of stirring and beating by the piston. The power of the stirring-beating force is determined by the product of the stirring-beating force with the corresponding speed of the piston (slide). The results of experimental studies are presented in Figures 29–32. They show a good agreement between the results of experimental and numerical
Figure 29.
Experimentally and analytically constructed graphical dependencies Pmax =Pmax(m).
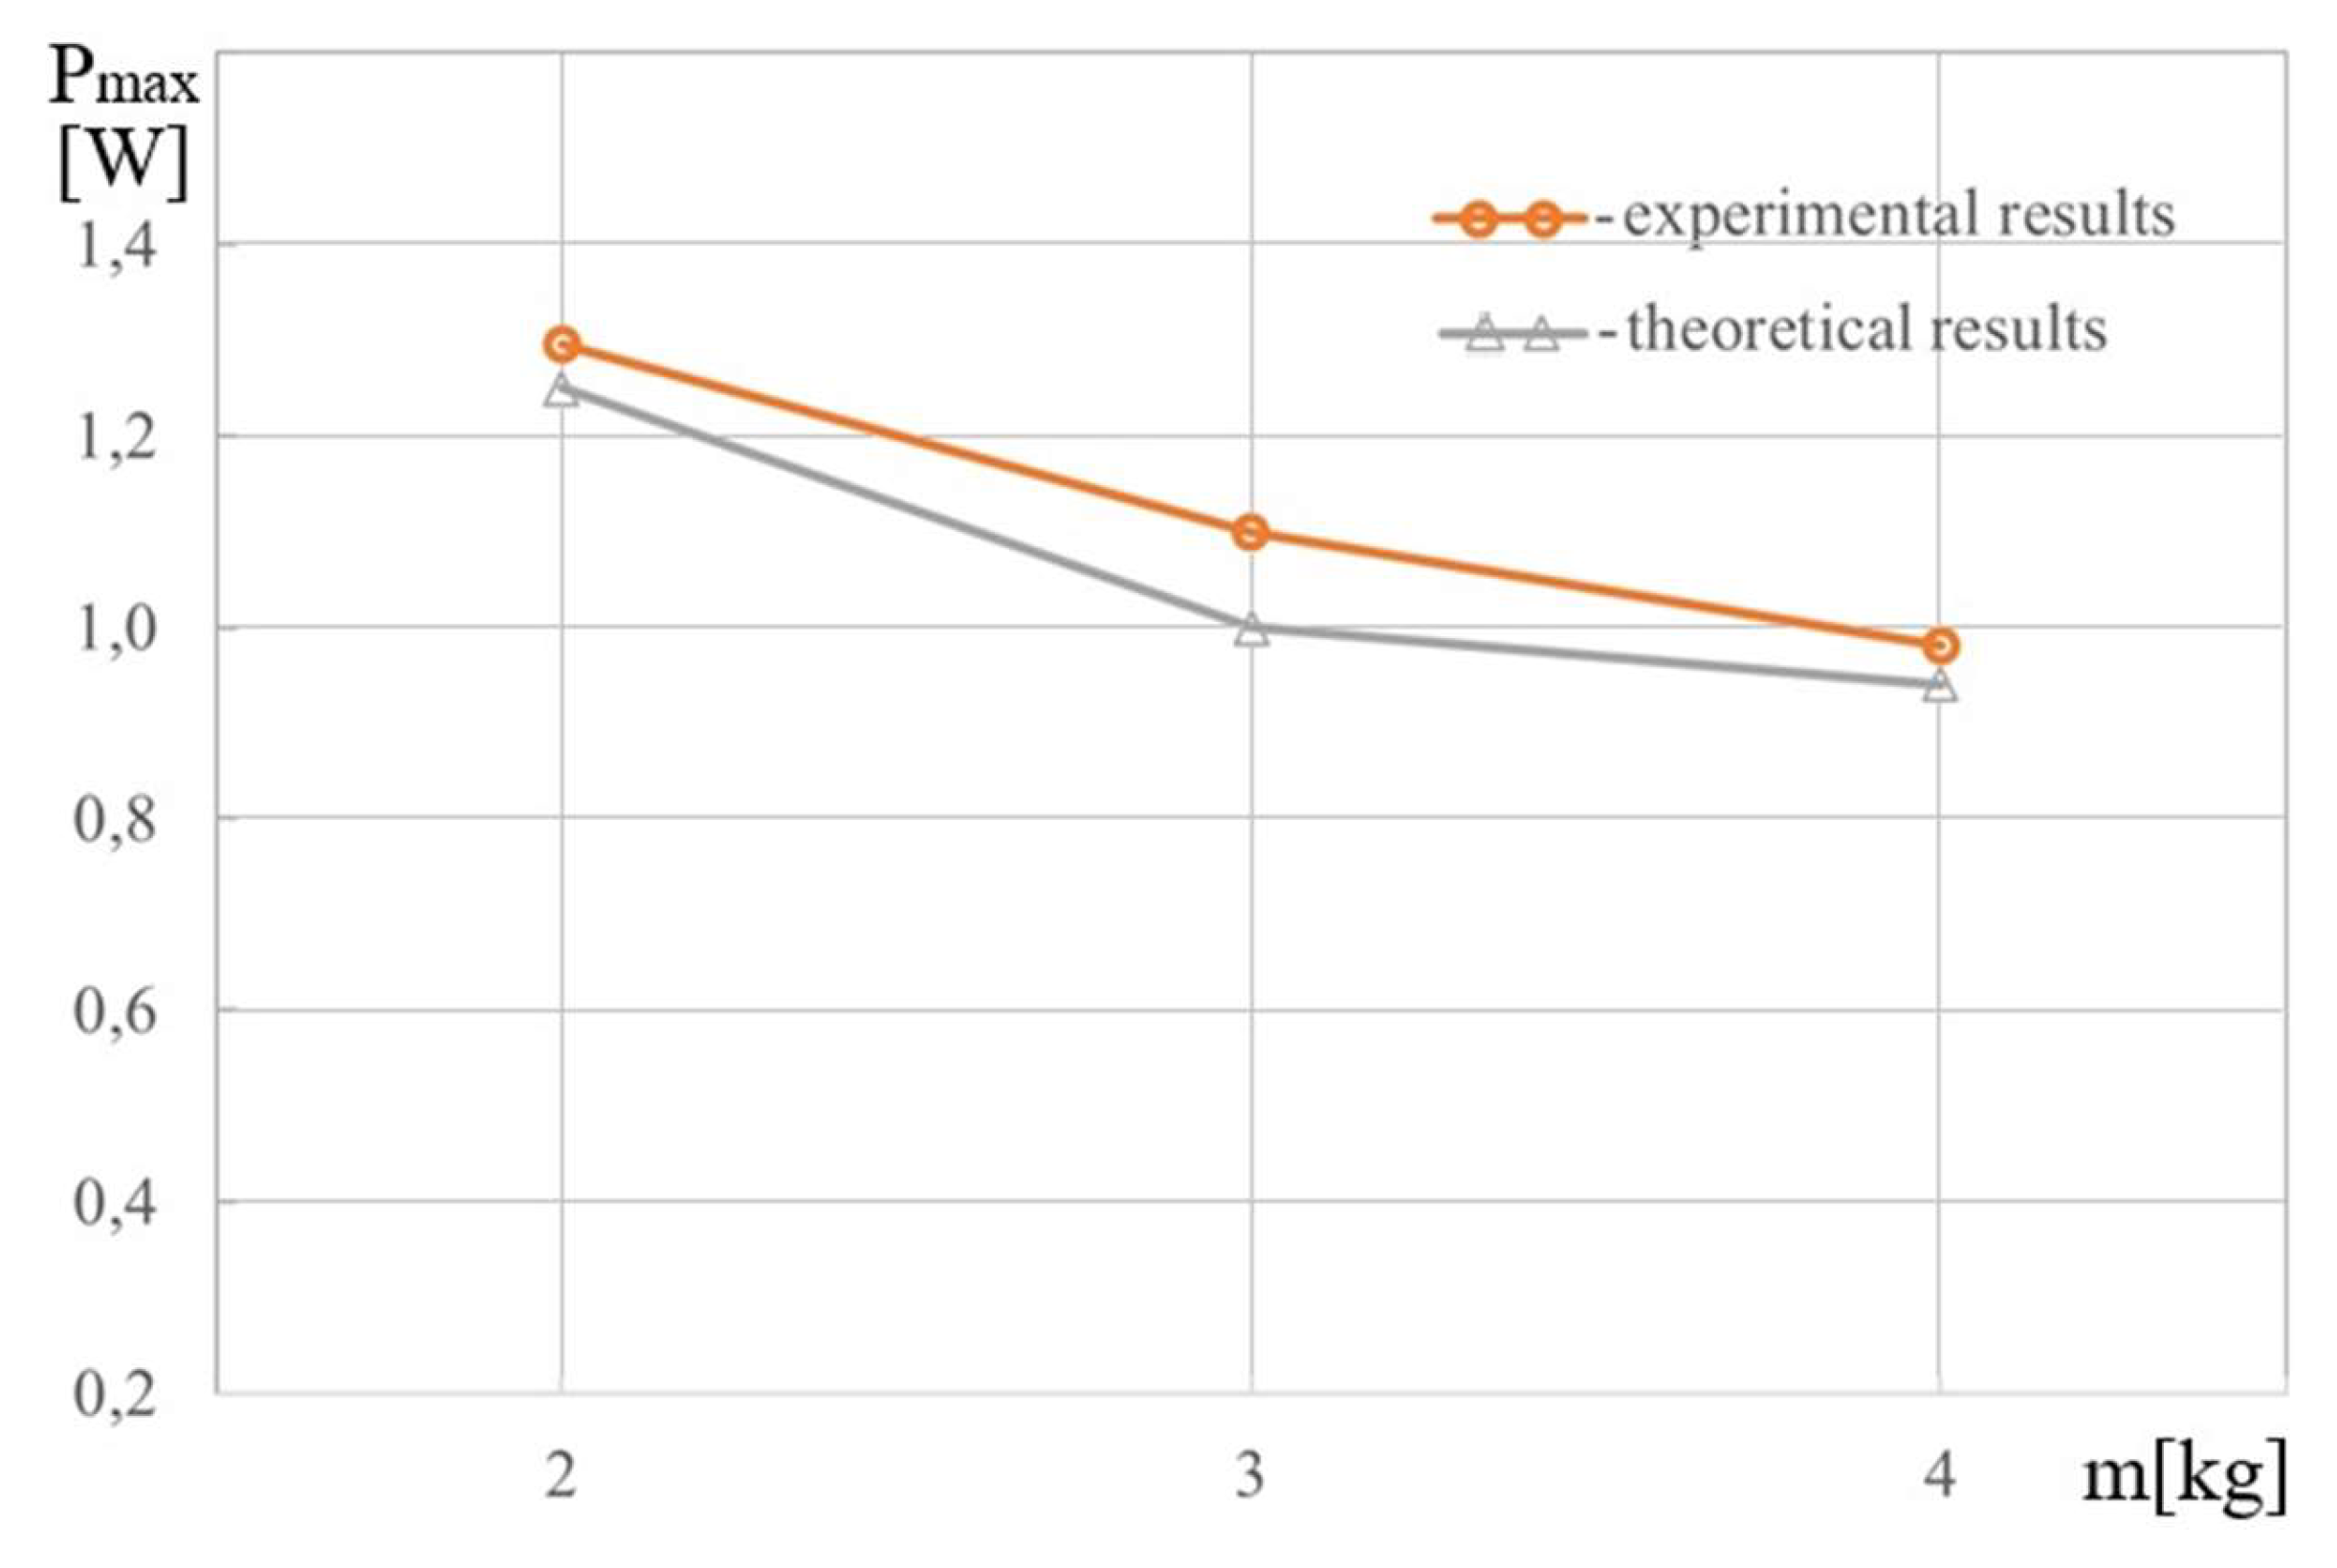
Figure 30.
Experimentally and analytically constructed graphical dependencies Pmax =Pmax(r).
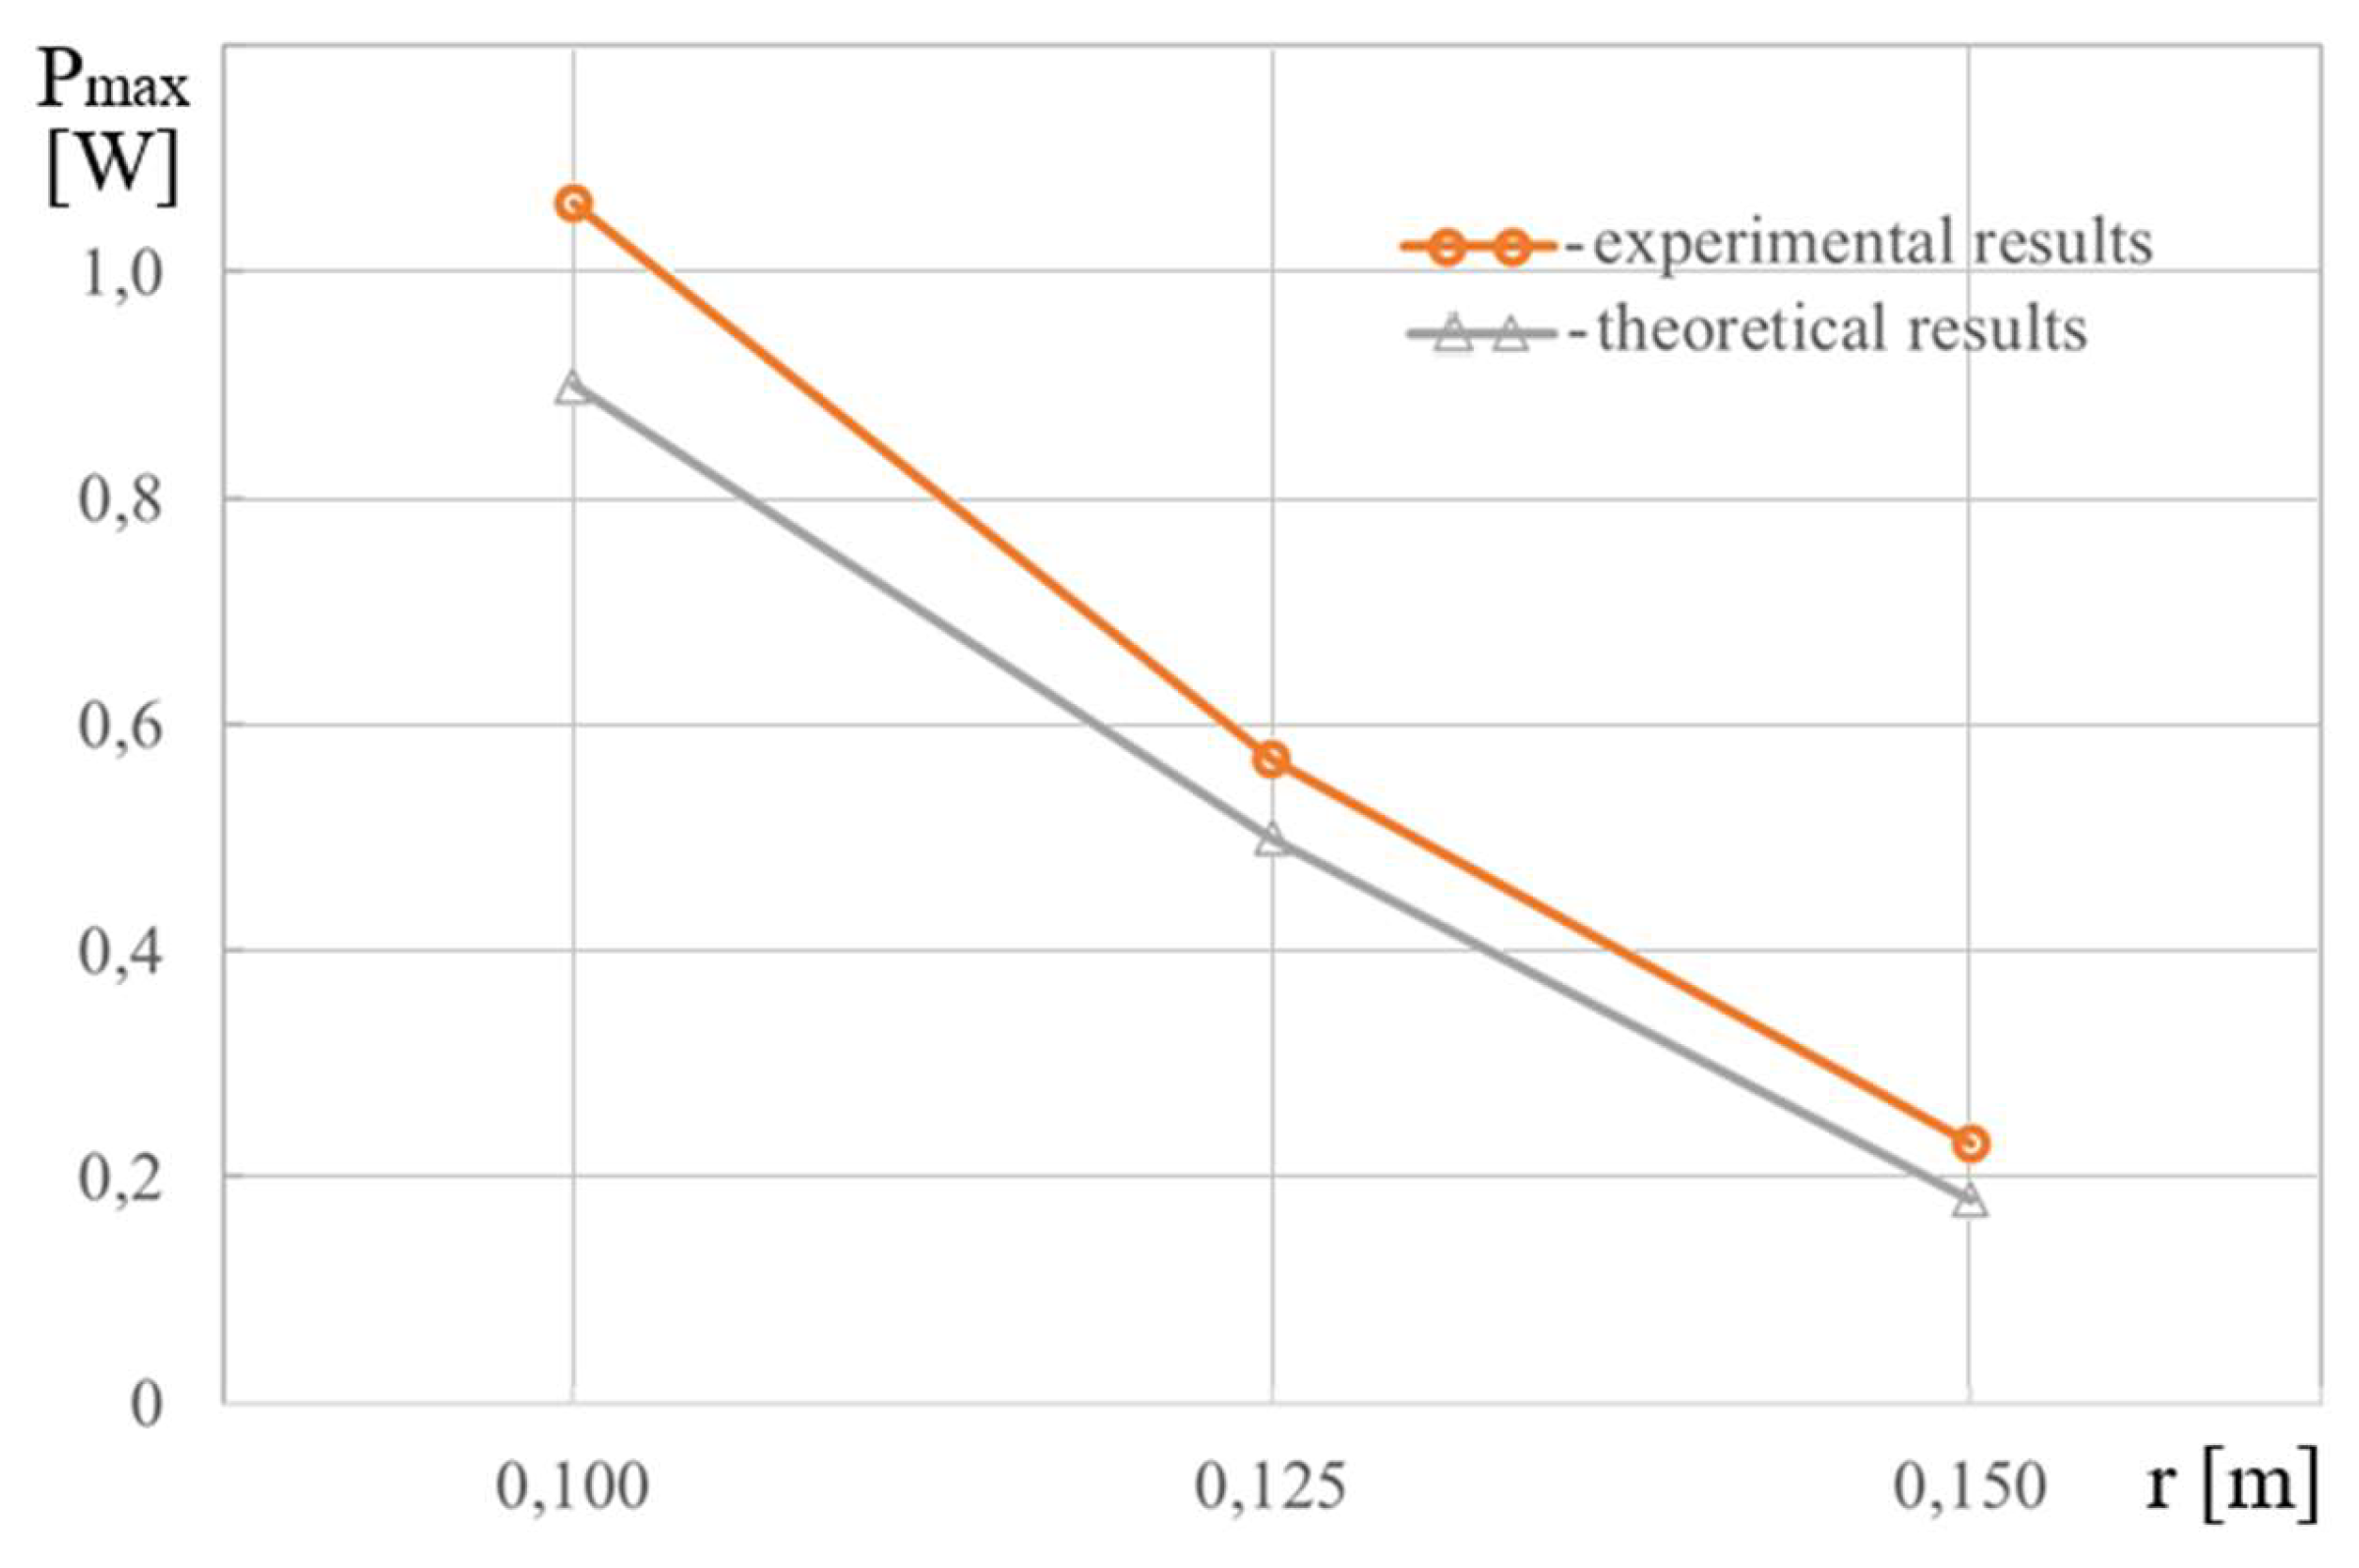
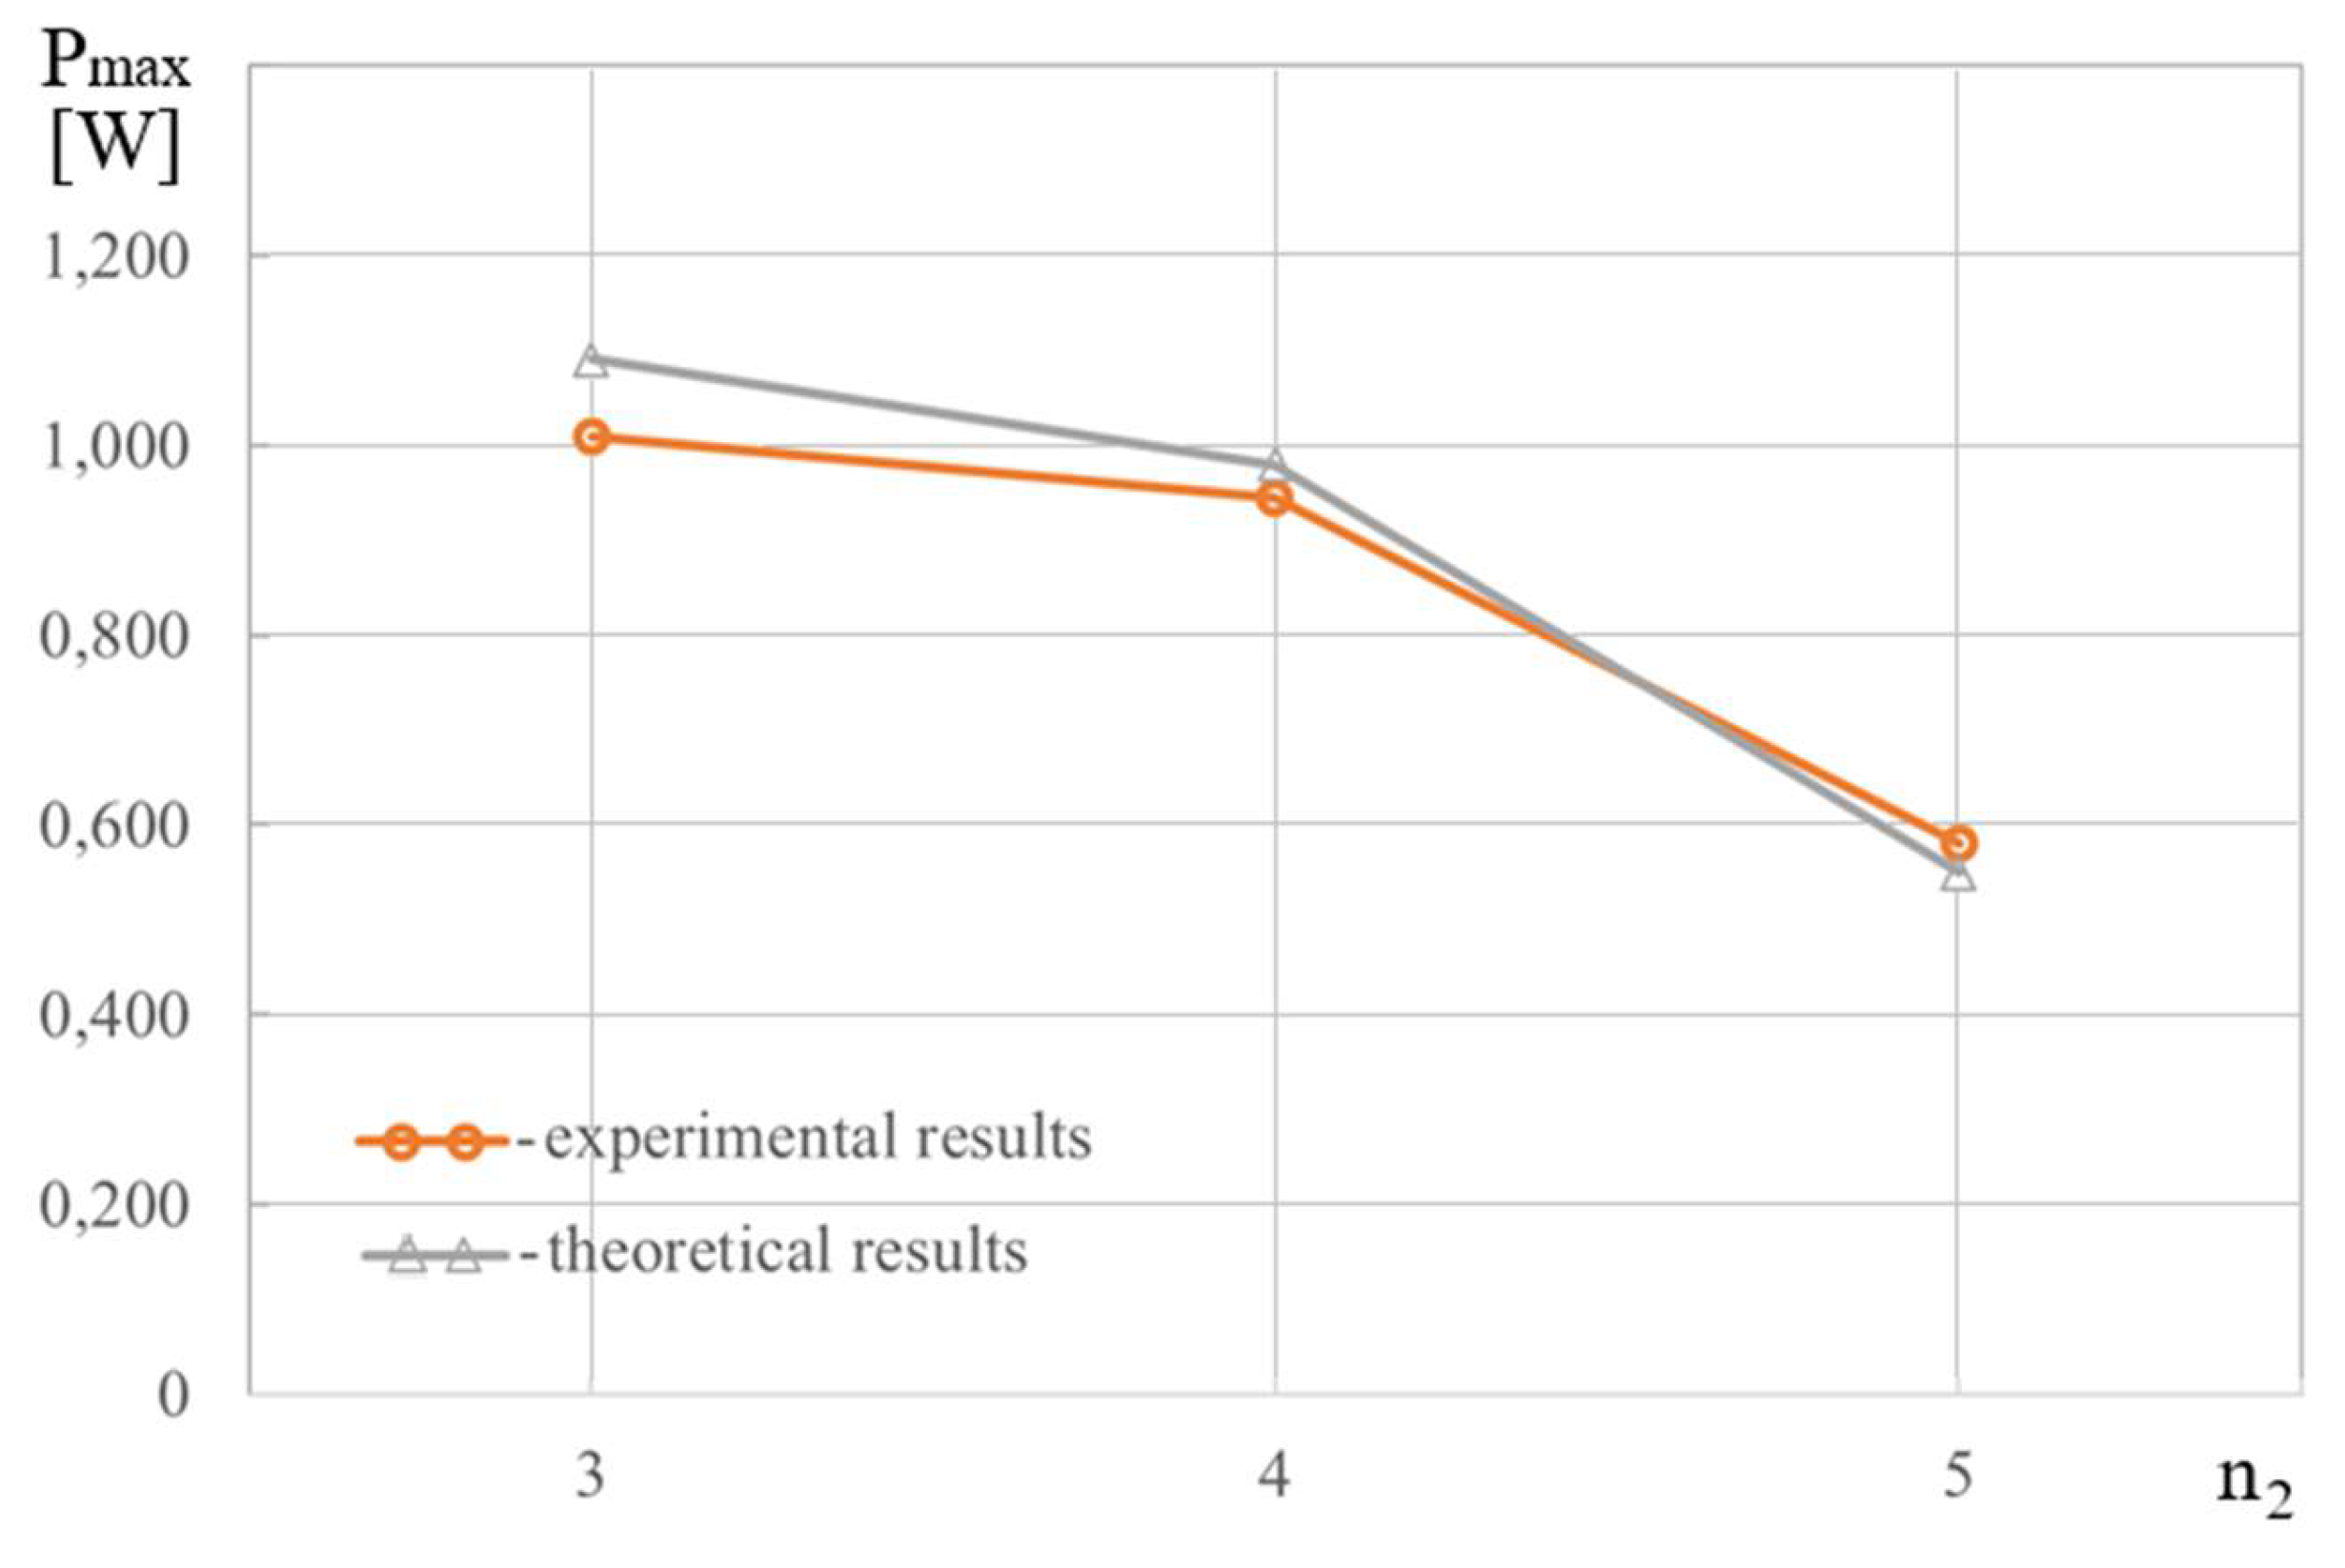
Figure 31.
Experimentally and analytically constructed graphical dependencies Pmax =Pmax(n2).
As the mass of the piston increases, the torque created by the gravity action with the initial torque remaining unchanged increases, the difference between the engine torque and the torque created by the gravity action, the buoyancy and the friction forces between the piston and the liquid decreases, as do the values of the disc-crank rotation angle and its angular velocity. As a result, the power of the stirring-beating force and its maximum value are reduced (Figure 29).
When the crank is elongated, the torque created by the gravity action increases, as in the previous case, but by increasing the throw of the crank, with the engine torque initially unchanged, the torque created by the action of the stirring-beating force and its power, including its maximum value, decreases (Fig. 30), as do the values of the disc-crank rotation angle and its angular velocity.
Both with increasing the number of piston holes (Fig. 31), and with the expansion of the piston holes (Fig. 32) the resistance to the movement of the piston decreases, the force
Figure 32.
Experimentally and analytically constructed graphical dependencies Pmax =Pmax(R2).
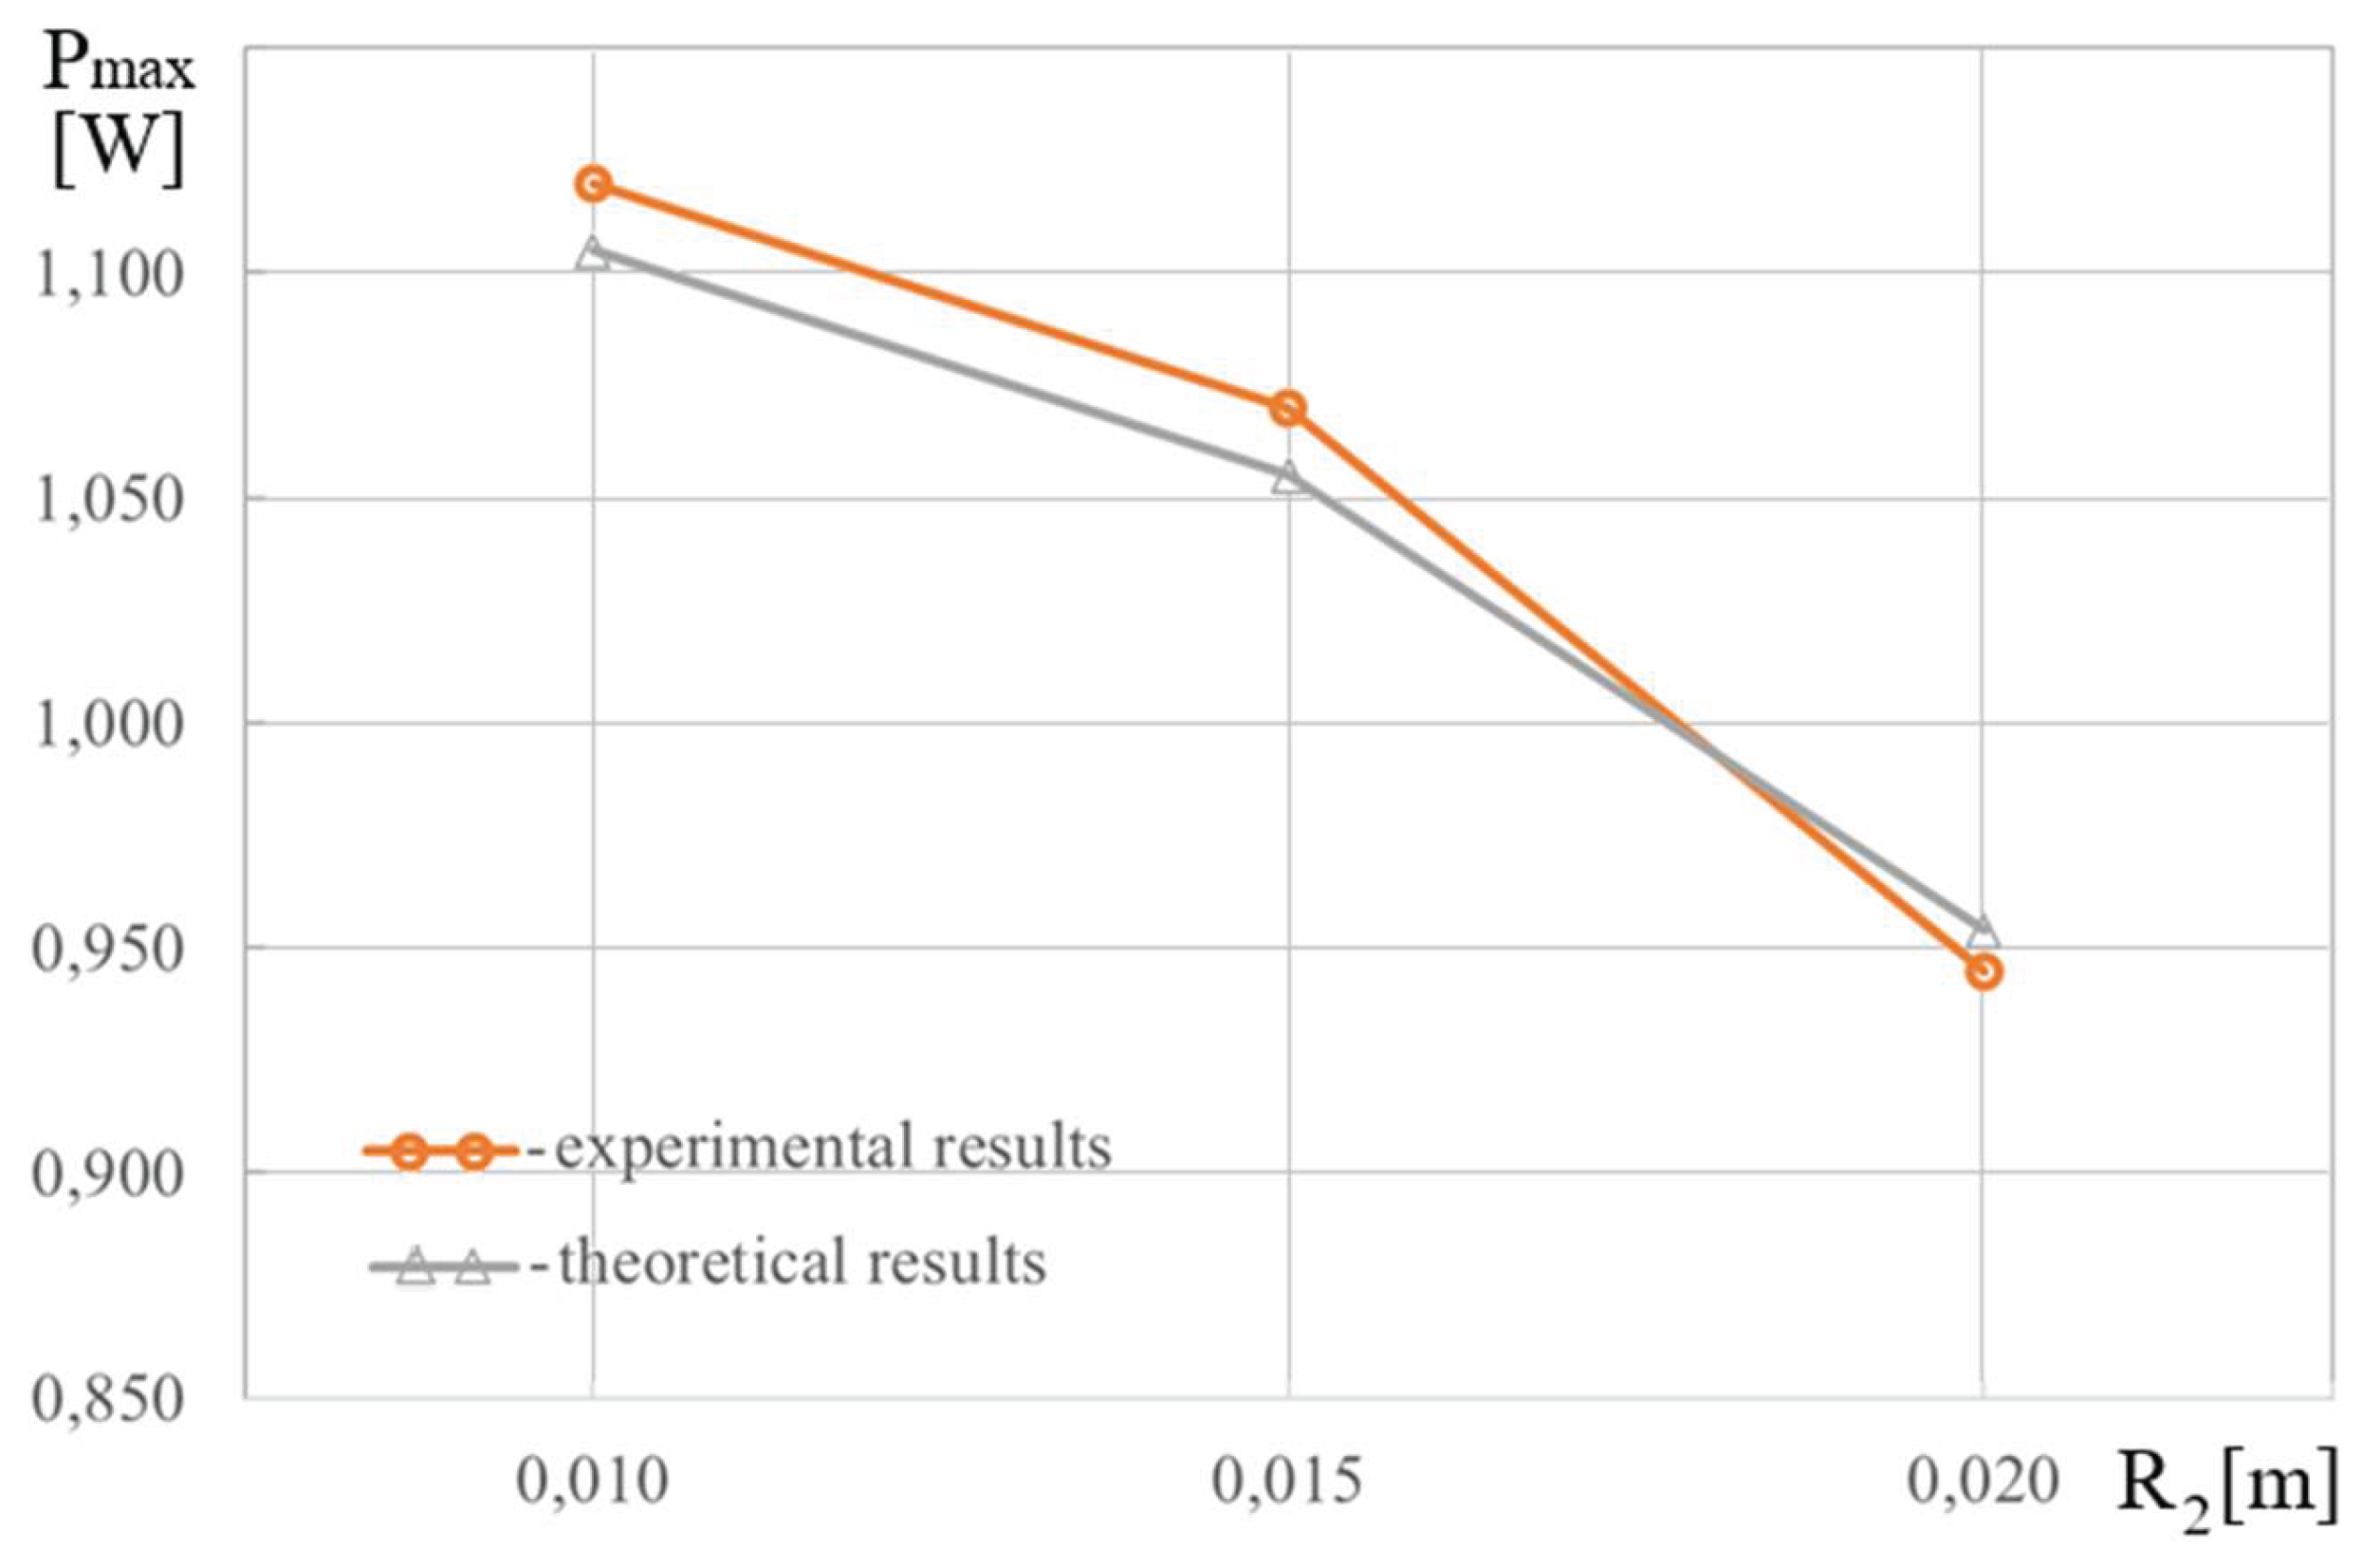
of the pressure difference on the piston, its power, including its maximum value decrease, the values of the rotation angle of the driving link and its angular velocity decrease (see formulas (19)).
6. Conclusions
Differential equations of motion of nonideal system, i.e. mixing-whipping device based on slide-crank mechanism based on Lagrange equations are built, taking into account expressions of kinetic energy of the device, elementary works of fluid pressure force, gravity force and buoyant force acting on the piston, projection of friction force on the outer side border of the piston, projection of friction force on the faces of the holes, dynamic moment of the permanent magnet engine.
The differential equations of motion are highly nonlinear and are solved numerically by the Runge-Kutta method for the oscillation and aperiodic damped mode of motion of the driving member.
The dependences of the rotational speed of the driving member and the angle of rotation of the actuating engine shaft on time and mixing and whipping force power on its angle of rotation, and the speed of rotation of the force source shaft and the parameters of the nonideal mechanical system are obtained.
The result of the interaction of the piston slide-crank mechanism with the excitation source is the variability with the time of the engine shaft rotational speed and subsequently changes in the angle of rotation of the force source shaft with time, the power of the mixing-whipping force depending on the angle of rotation and rotational speed of the excitation source shaft, and the parameters of the nonideal system.
It is manifested in the effects of device parameters and nonideal energy source on the kinematic, oscillatory and energy characteristics of the system. For example, the increased value of the engine torque causes a decrease in the maximum angle of rotation of the crank and its limit value, a decrease in the amplitude of oscillations of the engine shaft speed and the power of the mixing-whipping force. Increase in the piston mass, crank length is accompanied by a decrease in the range of oscillations of the angle of rotation, amplitude and period of oscillations of the engine shaft speed and the power of the mixing and whipping force. The density of the fluid has little effect on the rotational speed and angle of rotation of the engine shaft, and the growth of this parameter results in an increase in the maximum power of the mixing and whipping force and its period of oscillation. An increase in the number and expansion of the piston holes reduces the amplitude of the mixing and whipping force power and its oscillation period.
General characters of dependences P=P(φ) and are determined by relations of ~ and ~, - a parameter of the mixing-whipping device or rheological medium, on which the power of the mixing-whipping force depends.
The maximum values of fluctuations of the rotation angle φ and the rotational speed of the engine shaft determine the right boundary points of the power graphs of the mixing-whipping force as a function of the values φ and , respectively. The limit values, to which the rotation angle φ of the engine shaft tends after the time elapses, are the leftmost endpoints of the graphs of the mixing-whipping force power depending on the value of φ, and the minimum values of the rotational speed of the excitation source shaft are the leftmost limits of the power dependence of the mixing-whipping force as a function of the value of .
The results of experimental studies are in good agreement with the results of numerical studies. It has been experimentally confirmed that with an increase in the piston mass, a decrease in the number of piston holes and their radius, the maximum power of the mixing and whipping force decreases.
The results of the effects of a nonideal energy source can be utilized in selecting effective system parameters and an energy-saving engine in designing a new device that performs the technological processes of mixing and whipping.
Author Contributions
Conceptualization, Zharilkassin Iskakov and Kuatbay Bissembayev; Data curation, Zharilkassin Iskakov and Assylbek Jomartov; Formal analysis, Zharilkassin Iskakov and Assylbek Jomartov; Funding acquisition, Zharilkassin Iskakov; Investigation, Zharilkassin Iskakov, Kuatbay Bissembayev, Assylbek Jomartov and Akmaral Kalybayeva; Methodology, Zharilkassin Iskakov, Kuatbay Bissembayev and Assylbek Jomartov; Project administration, Zharilkassin Iskakov; Resources, Zharilkassin Iskakov and Assylbek Jomartov; Software, Kuatbay Bissembayev, Assylbek Jomartov and Akmaral Kalybayeva; Supervision, Zharilkassin Iskakov; Validation, Zharilkassin Iskakov, Kuatbay Bissembayev, Assylbek Jomartov and Akmaral Kalybayeva; Visualization, Zharilkassin Iskakov and Kuatbay Bissembayev; Writing – original draft, Zharilkassin Iskakov; Writing – review & editing, Zharilkassin Iskakov, Kuatbay Bissembayev and Assylbek Jomartov.
Funding
This work was supported by the Science Committee of the Ministry of Science and Higher Education of the Republic of Kazakhstan (Grants No. AP19677103, BR20280990).
Conflicts of Interest
The authors declare no conflict of interest.
References
- Balthazar, J.M.; Mook, D.T.; Weber, H.I.; Brasil, R.M.I.R.F.; Fenili, A.; Beltano, D.; et al. An overview on non-ideal vibrations. Meccanica 2003, 38(6), 613–621. [Google Scholar] [CrossRef]
- Balthazar, J.M.; Brasil, R.M.L.R.F.; Weber, H.I.; Fenili, A.; Belato, D.; Felix, J.L.P.; & Garzeri, F.J. A review of new vibrating issues due to non-ideal energy sources. In: Udwadia F., Weber, H.I., Leitmann, G., (Eds.); Dynamics Systemsand Control, Stabilityand Control Theory. Methods and Applications 2004, vol. 22, pp. 237–258. London: Chapman & Hall.
- Balthazar, J.M.; Pontes, B.R.Jr. On friction induced nonlinear vibrations: a source of fatigue. In Inman, D. (Ed.); Damage Prognosis- Fro Aerospace, Civil and Mechanical System, New York: Wiley 2005.
- Cveticanin, L. Dynamic of the non-ideal mechanical systems: A review. Journal of the Serbian Society for Computational Mechanics 2010, 4(2), 75–86. [Google Scholar]
- Kononenko, V.O. Vibrating systems with a limited power supply; Iliffe Books Ltd., London, 1969.
- Cveticanin, L.; Zukovic, M.; & Balthazar, J.M. Dynamics of Mechanical Systems with Non-Ideal Excitation; Springer International Publishing AG, 2018. [CrossRef]
- Iskakov, Zh.; Bissembayev, K.; & Jamalov N. The nonlinear vibrations of orthogonal mechanism of vibrating table in view of friction. Mech. Sci. 2018, 9, 307–325. [CrossRef]
- Bissembayev, К.; Iskakov, Zh. Oscillations of the orthogonal mechanism with a non-ideal source of energy in the presence of a load on the operating link. Mech. Mach. Theory 2015, 92, 153 - 170. [CrossRef]
- Bissembayev К.; Iskakov Zh. Nonlinear vibrations of orthogonal mechanism of shaking table. International Journal of Applied Mechanics and Engineering 19 (3) (2014) 487 – 501. [CrossRef]
- Iskakov, Zh.; Bissembayev, K.; & Jamalov, N. Dynamics of Orthogonal Mechanism of Vibrating Table in View of Friction. ech. Mach. Sci. 2017, 52, 261–268. [CrossRef]
- Metallidis, P.; Natsiavas, S. Linear and nonlinear dynamics of reciprocating engines. Int. J. Non-Linear Mech. 2003, 38(5), 723-738.
- Koser, K. A slider crank mechanism-based robot arm performance and dynamic analysis. Mech. Mach. Theory 2004, 39, 169–182. [Google Scholar] [CrossRef]
- Ha, J. L., Fung, R. F., Chen, K. Y., & Hsien, S. C. Dynamic modeling and identification of a slider-crank mechanism. J. Sound Vib. 2006, 289, 1019–1044.
- Erkaya, S., Su, S., & Uzmay, I. Dynamic analysis of a slider-crank mechanism with eccentric connector and planetary gears. Mech. Mach. Theory 2007, 42, 393–408.
- Li, H.; Xie, J.; and Wei, W. Numerical and Dynamic Errors Analysis of Planar Multibody Mechanical Systems With Adjustable Clearance Joints Based on Lagrange Equations and Experiment. J. Comput. Nonlin. Dyn. 2020, 15(8), 081001. [Google Scholar] [CrossRef] [PubMed]
- Wu, X.Z.; Sun, Y.; Wang, Y.; and, *!!! REPLACE !!!*; et al. Dynamic analysis of the double crank mechanism with a 3D translational clearance joint employing a variable stiffness contact force model. Nonlinear Dynam. 2020, 99(3), 1937–1958. [Google Scholar] [CrossRef]
- Chen, Y.; Wu, K.; Wu, X.Z.; and, *!!! REPLACE !!!*; et al. Kinematic accuracy and nonlinear dynamics of a flexible slider-crank mechanism with multiple clearance joints. European Journal of Mechanics A-Solids 2021, 88, 104277. [Google Scholar] [CrossRef]
- Bisht, R.S.; Panigrahi, S.K.; Singh, S.; and et al. Design analysis of a machine for manufacturing of bricks from industrial waste: simulations and experiments, International Journal of Interactive Design and Manufacturing - IJIDEM 2021, 15 (4). 587-596. [CrossRef]
- Goudas, I.; Stavrakis, I.; & Natsiavas, S. ; & Natsiavas, S. Nonlinear Dynam. 2004, 35(3), 205–227. [Google Scholar]
- Wauer, J.; &Buhrle, P. Dynamics of aflexible slider-crank mechanism driven by a non-ideal source of energy. Nonlinear Dynam 1997, 13, 221–242.
- oudas, I.; Stavrakis, I.; & Natsiavas, S. Dynamics of slider-crank mechanisms with flexible supports and non-ideal forcing. Nonlinear Dynam. 2004, 35(3), 205–227.
- Zukovic, M.; Cveticanin, L.; & Maretic, R. Dynamics of the cutting mechanism with flexible support and non-ideal forcing. Mech. Mach. Theory 2012, 58, 1–12.
- Bissembayev, K.; Kinzhebayeva D. Research on the dynamics of single-acting crank pump with damless hydro turbine drive. Mechanika 2014, 20(6), 566−572. [CrossRef]
- Bissembayev K., Zhamenkeyev Y.К. Study of non-steady process in “Single-acting piston pump – damless pitched-blade hydroturbine” hydrodynamic system. Mechanics 2015, 21(4), 284–277. [CrossRef]
- Patent KZ 22464 A4 17.05.2010, Bul. 5.
- Patent KZ 28784 A4 15.08.2014, Bul. 8. https://kazpatent.kz/images/bulleten/2014/gazette/pdf/2-201408.pdf.
- Patent KZ 2583 B 15.12.1995.
- https://www.instagram.com/reel/C6kjzyyCRNr/?igsh=ZDdoNGU1dHRqYzM1.
- Papanastasiou, T.C.; Georgiou, G.C.; Alexandrou, A.N. Viscous fluid flow, CRC Press, Boca Raton, London, New York, Washington, D.C. 2000.
- [dataset] [30] Iskakov, Zharilkassin; Kamal, Aziz (2025), “Modeling of Dynamics of Nonideal Mixer at Oscillation and Aperiodic Damped Mode”, Mendeley Data, V1. [CrossRef]
- [dataset] [31] Kamal, Aziz; Iskakov, Zharilkassin; Asylbek, Jomartov (2025), “Experiment with kumysnitsa”, Mendeley Data, V1. [CrossRef]
Figure 1.
Device for mixing, whipping and shaking of slurry based on slide-crank mechanism device with indication of parameters of its elements.
Figure 1.
Device for mixing, whipping and shaking of slurry based on slide-crank mechanism device with indication of parameters of its elements.
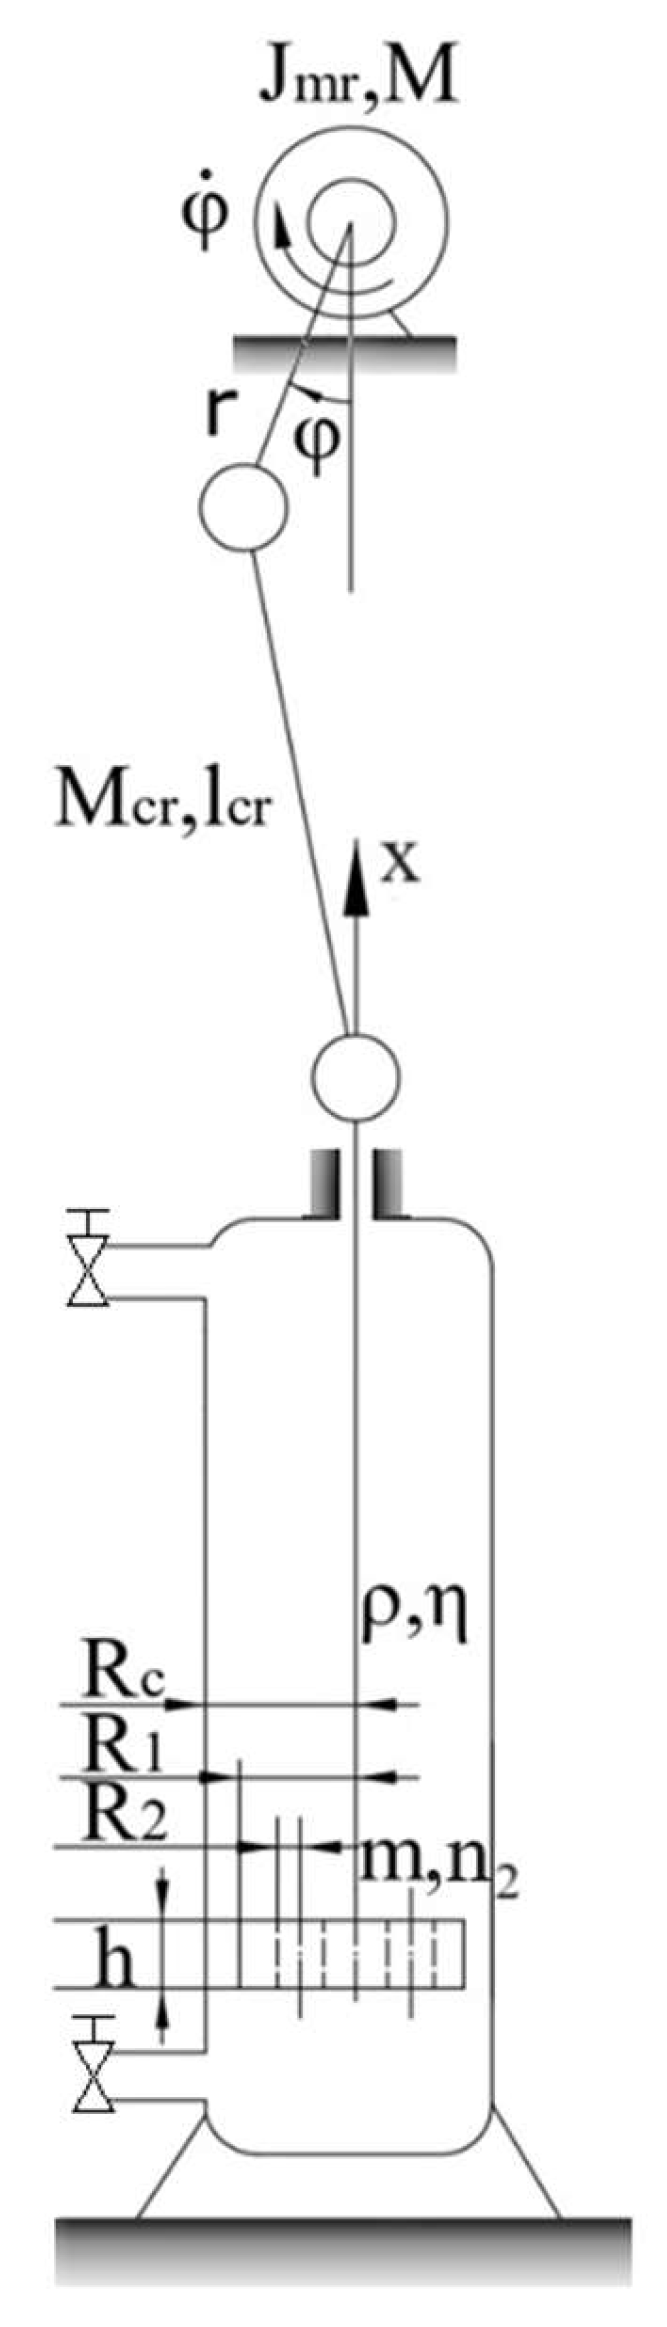
Figure 2.
Dependence φ=φ(t) for different values of a.
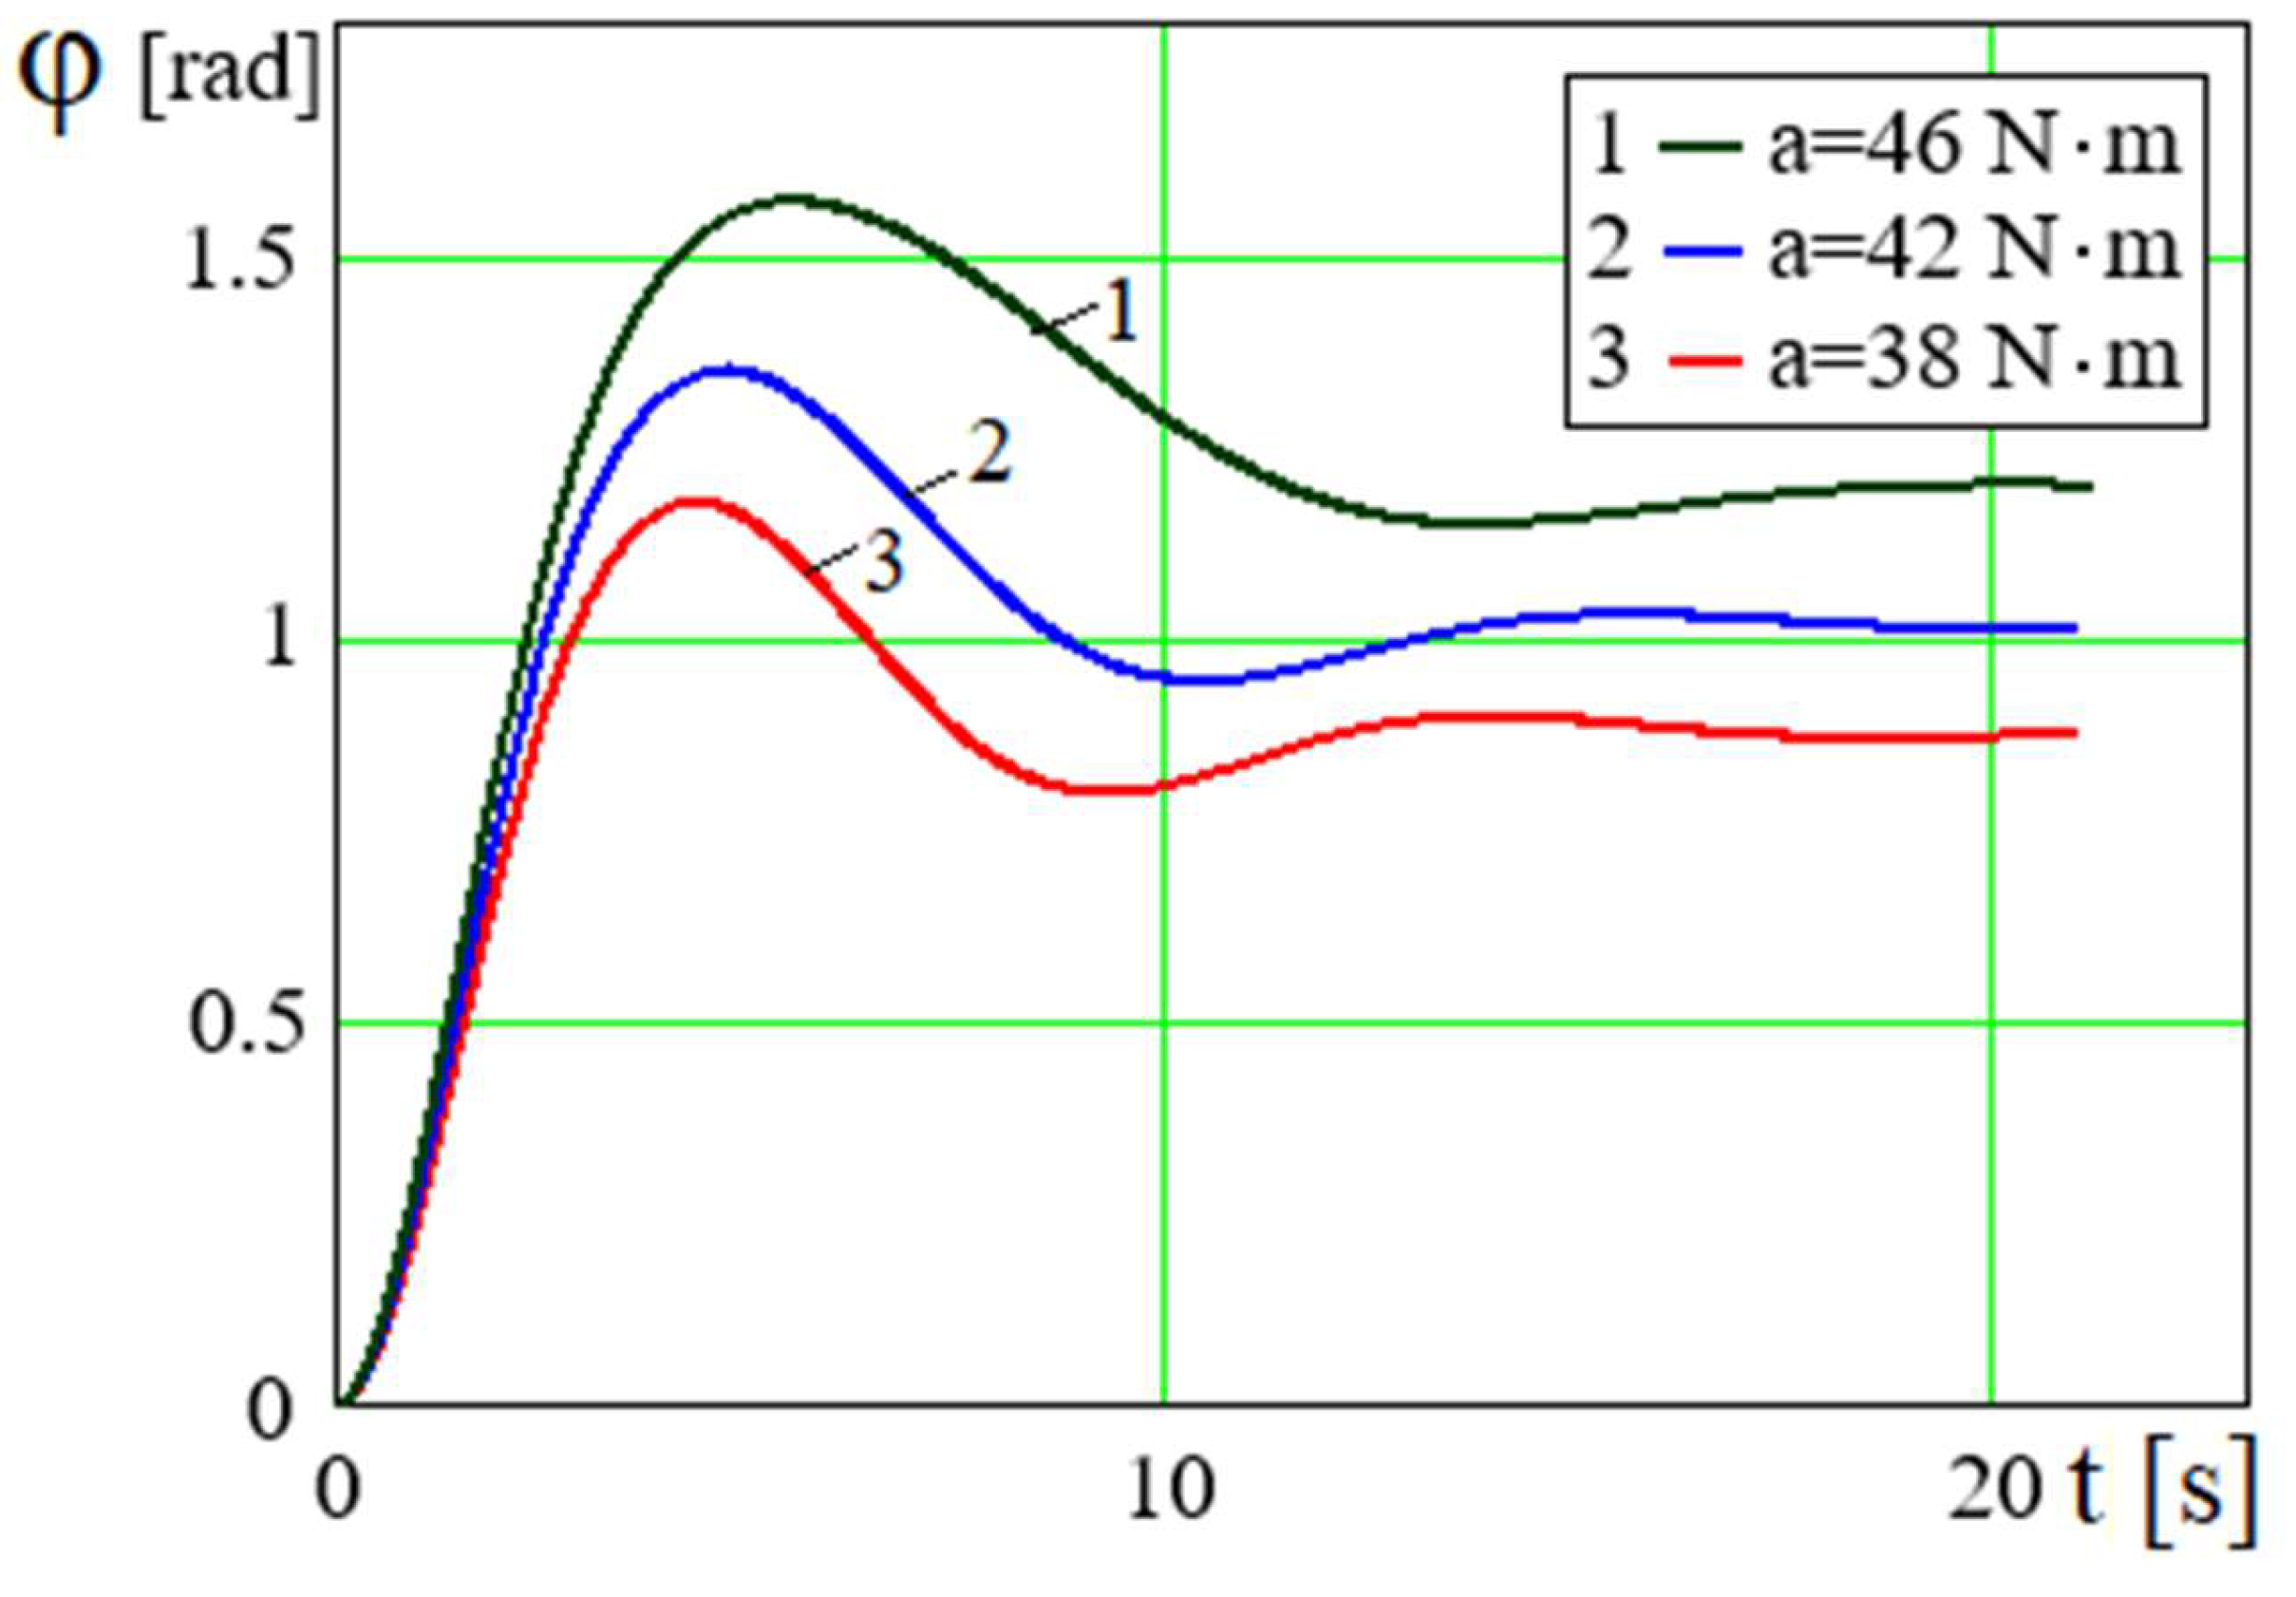
Figure 3.
Dependence for different values of a.
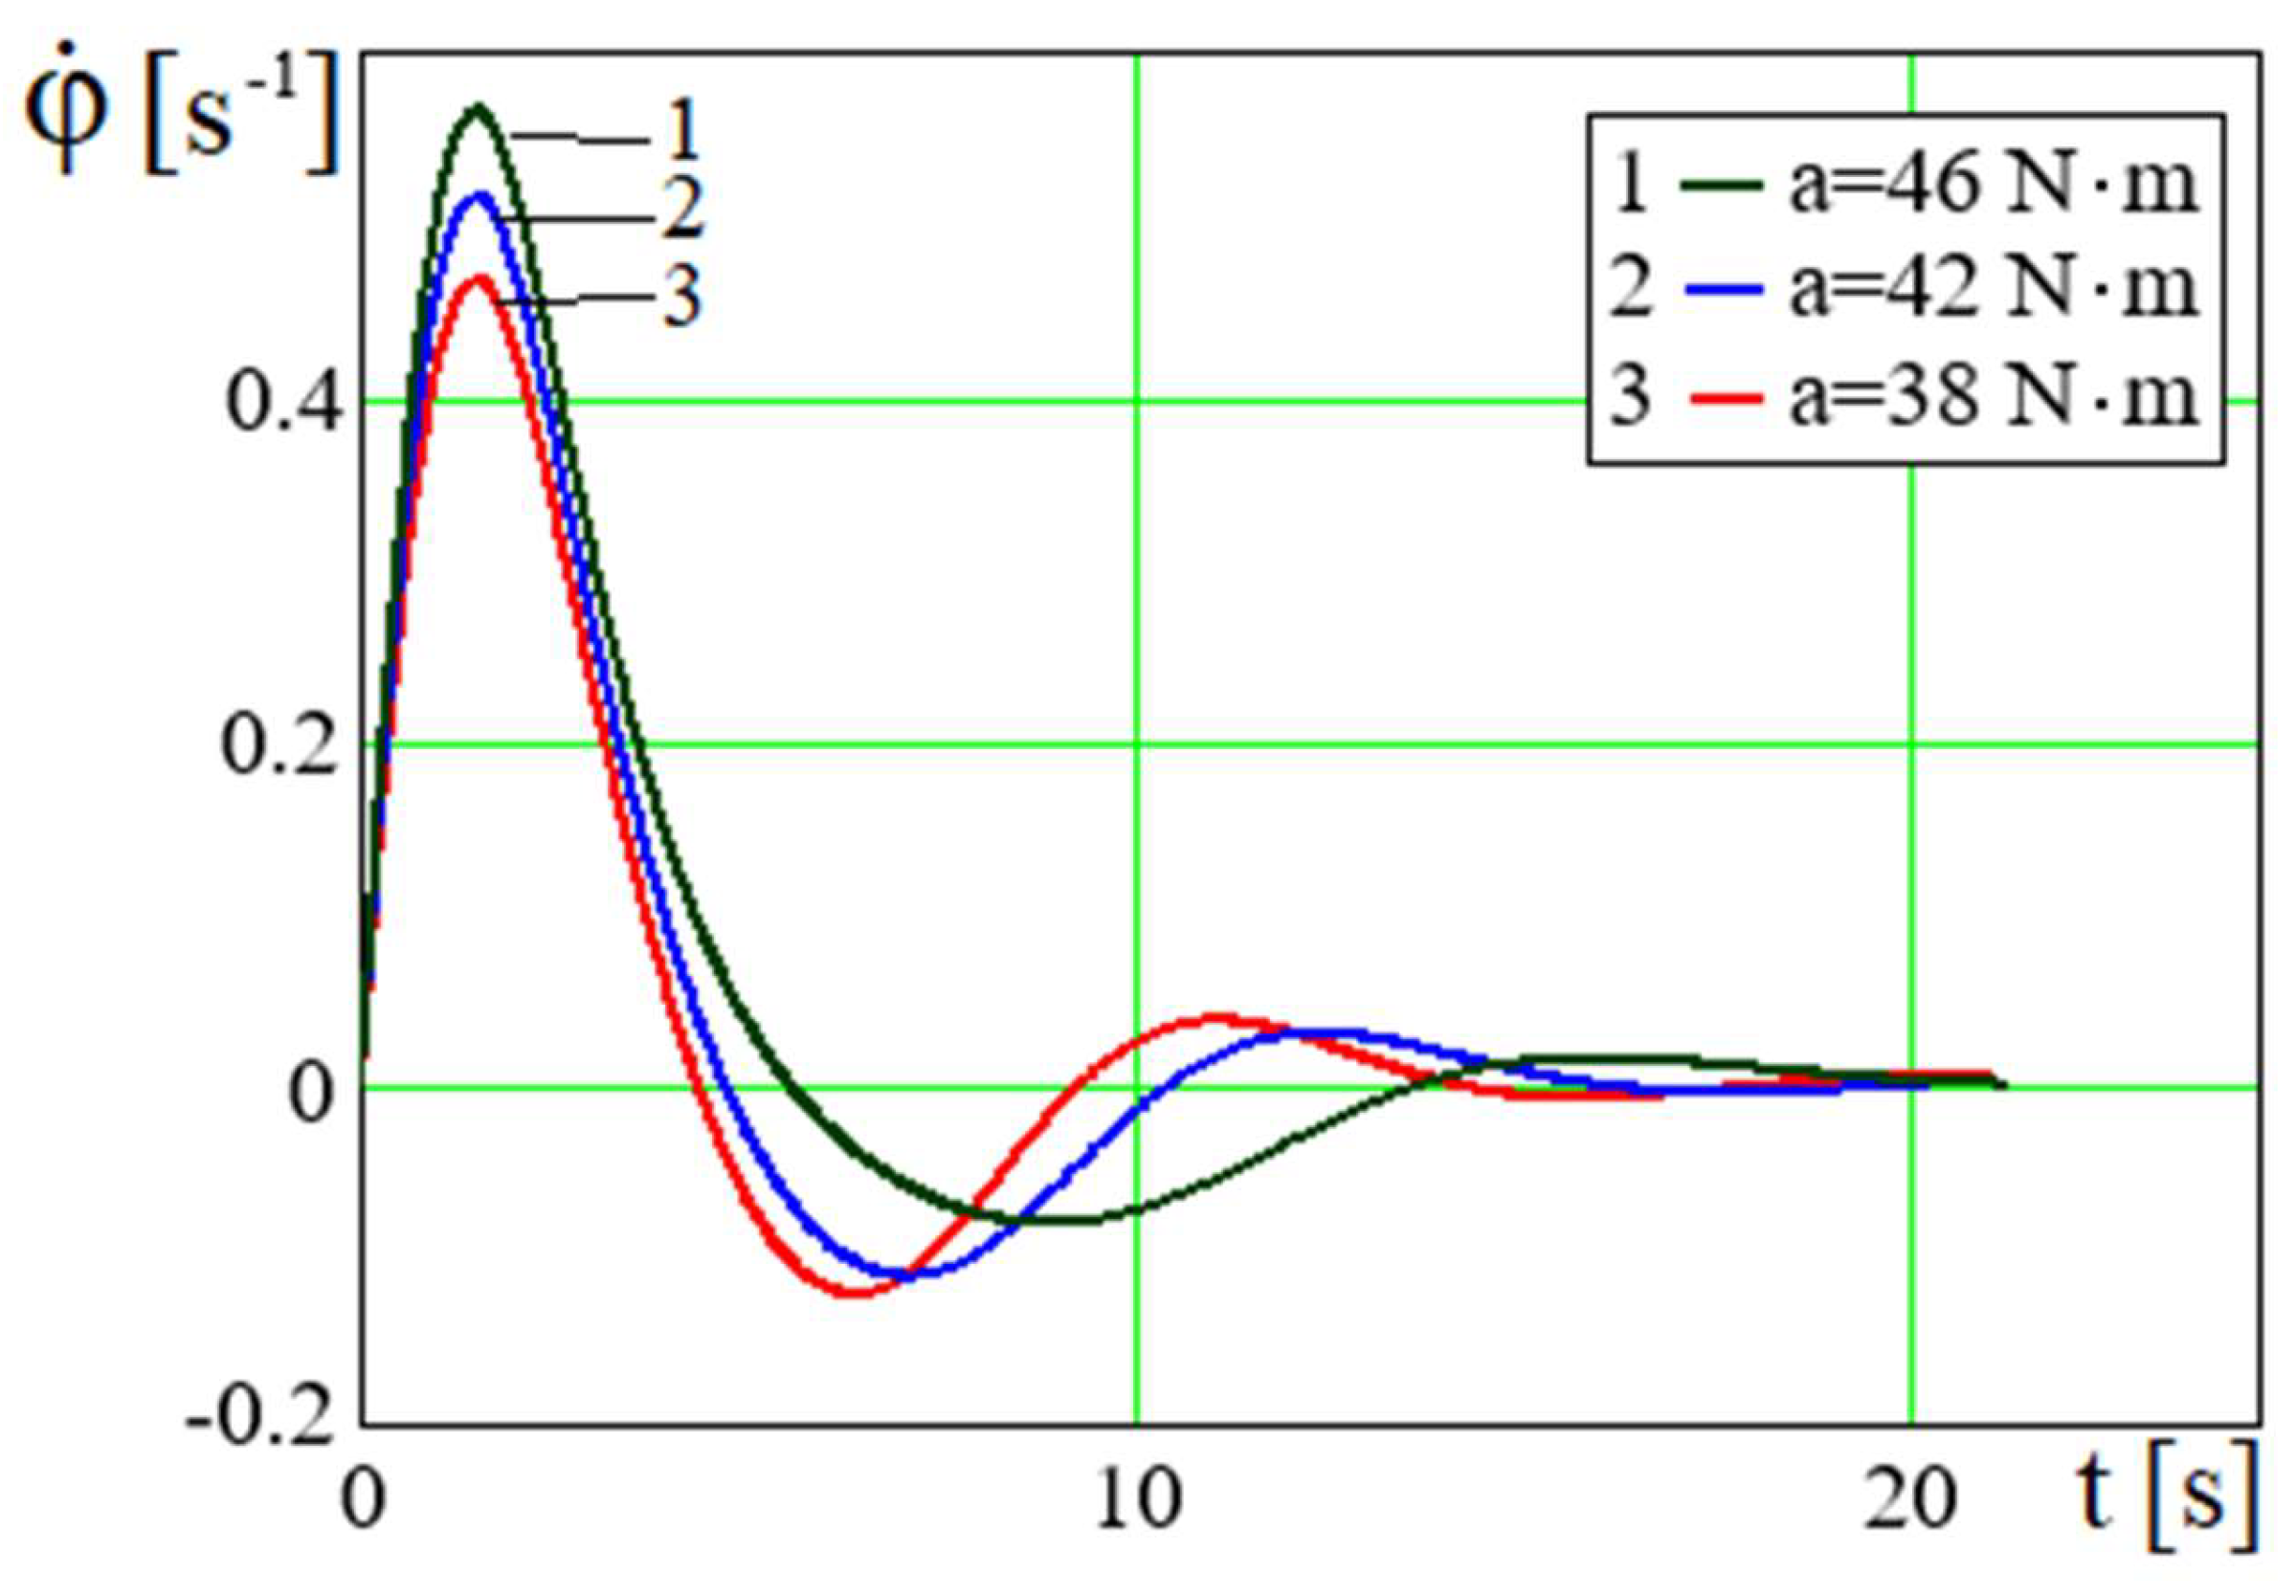
Figure 6.
Dependence φ=φ(t) for different values of m.
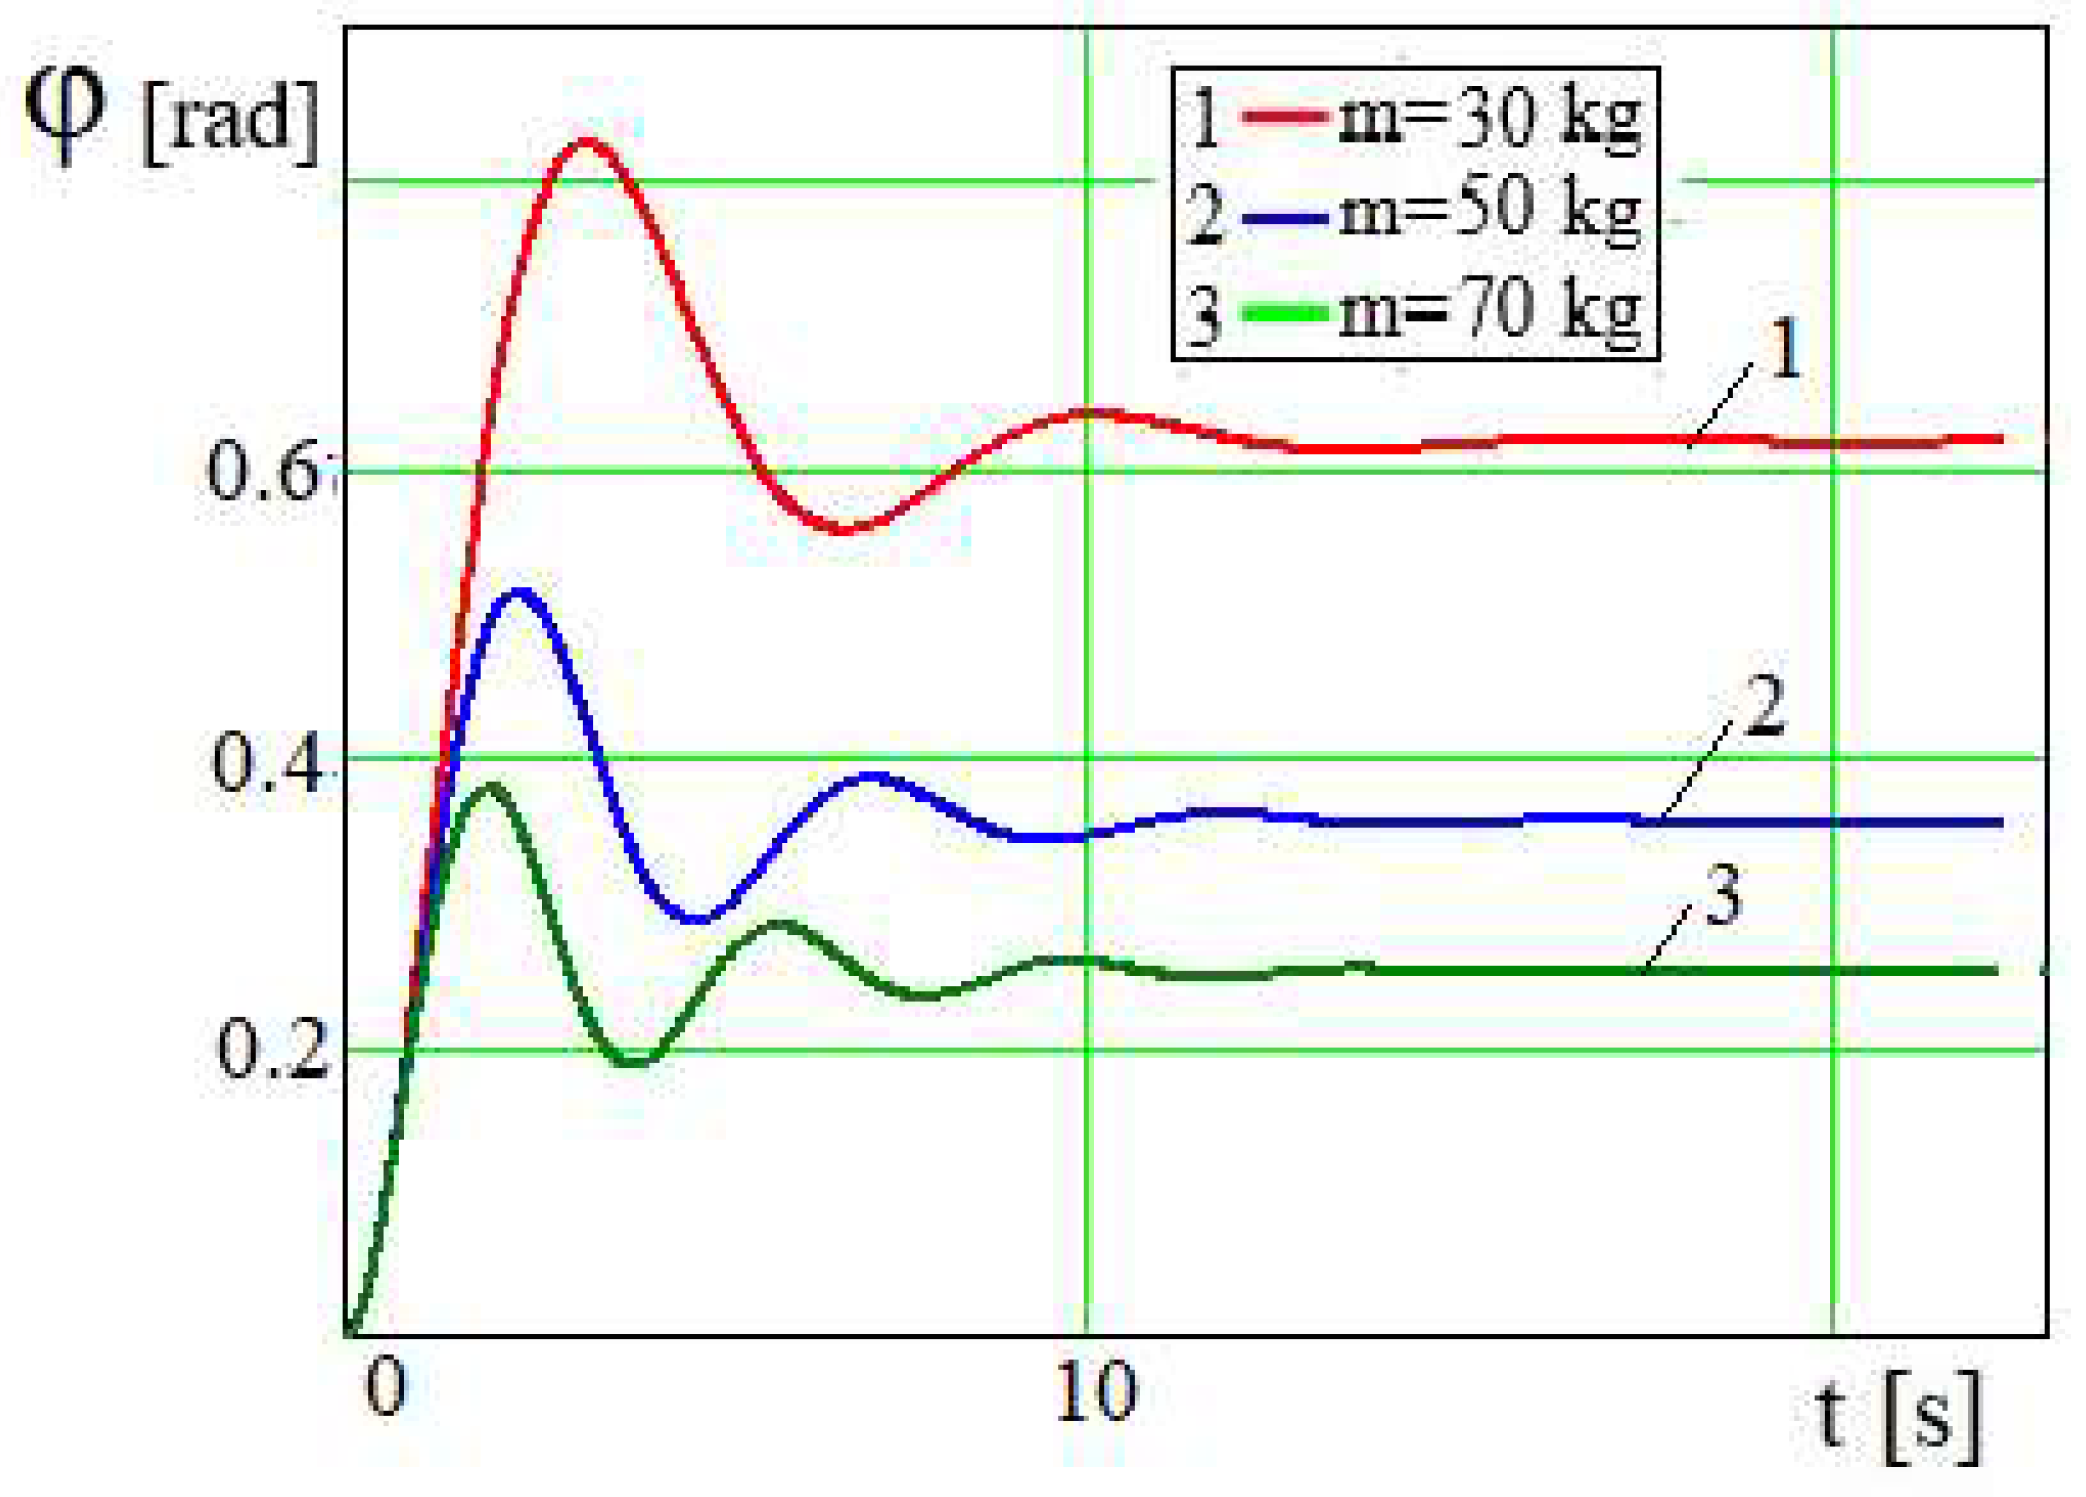
Figure 7.
Dependence for different values of m.

Figure 8.
Dependence P=P(φ) for different values of m.
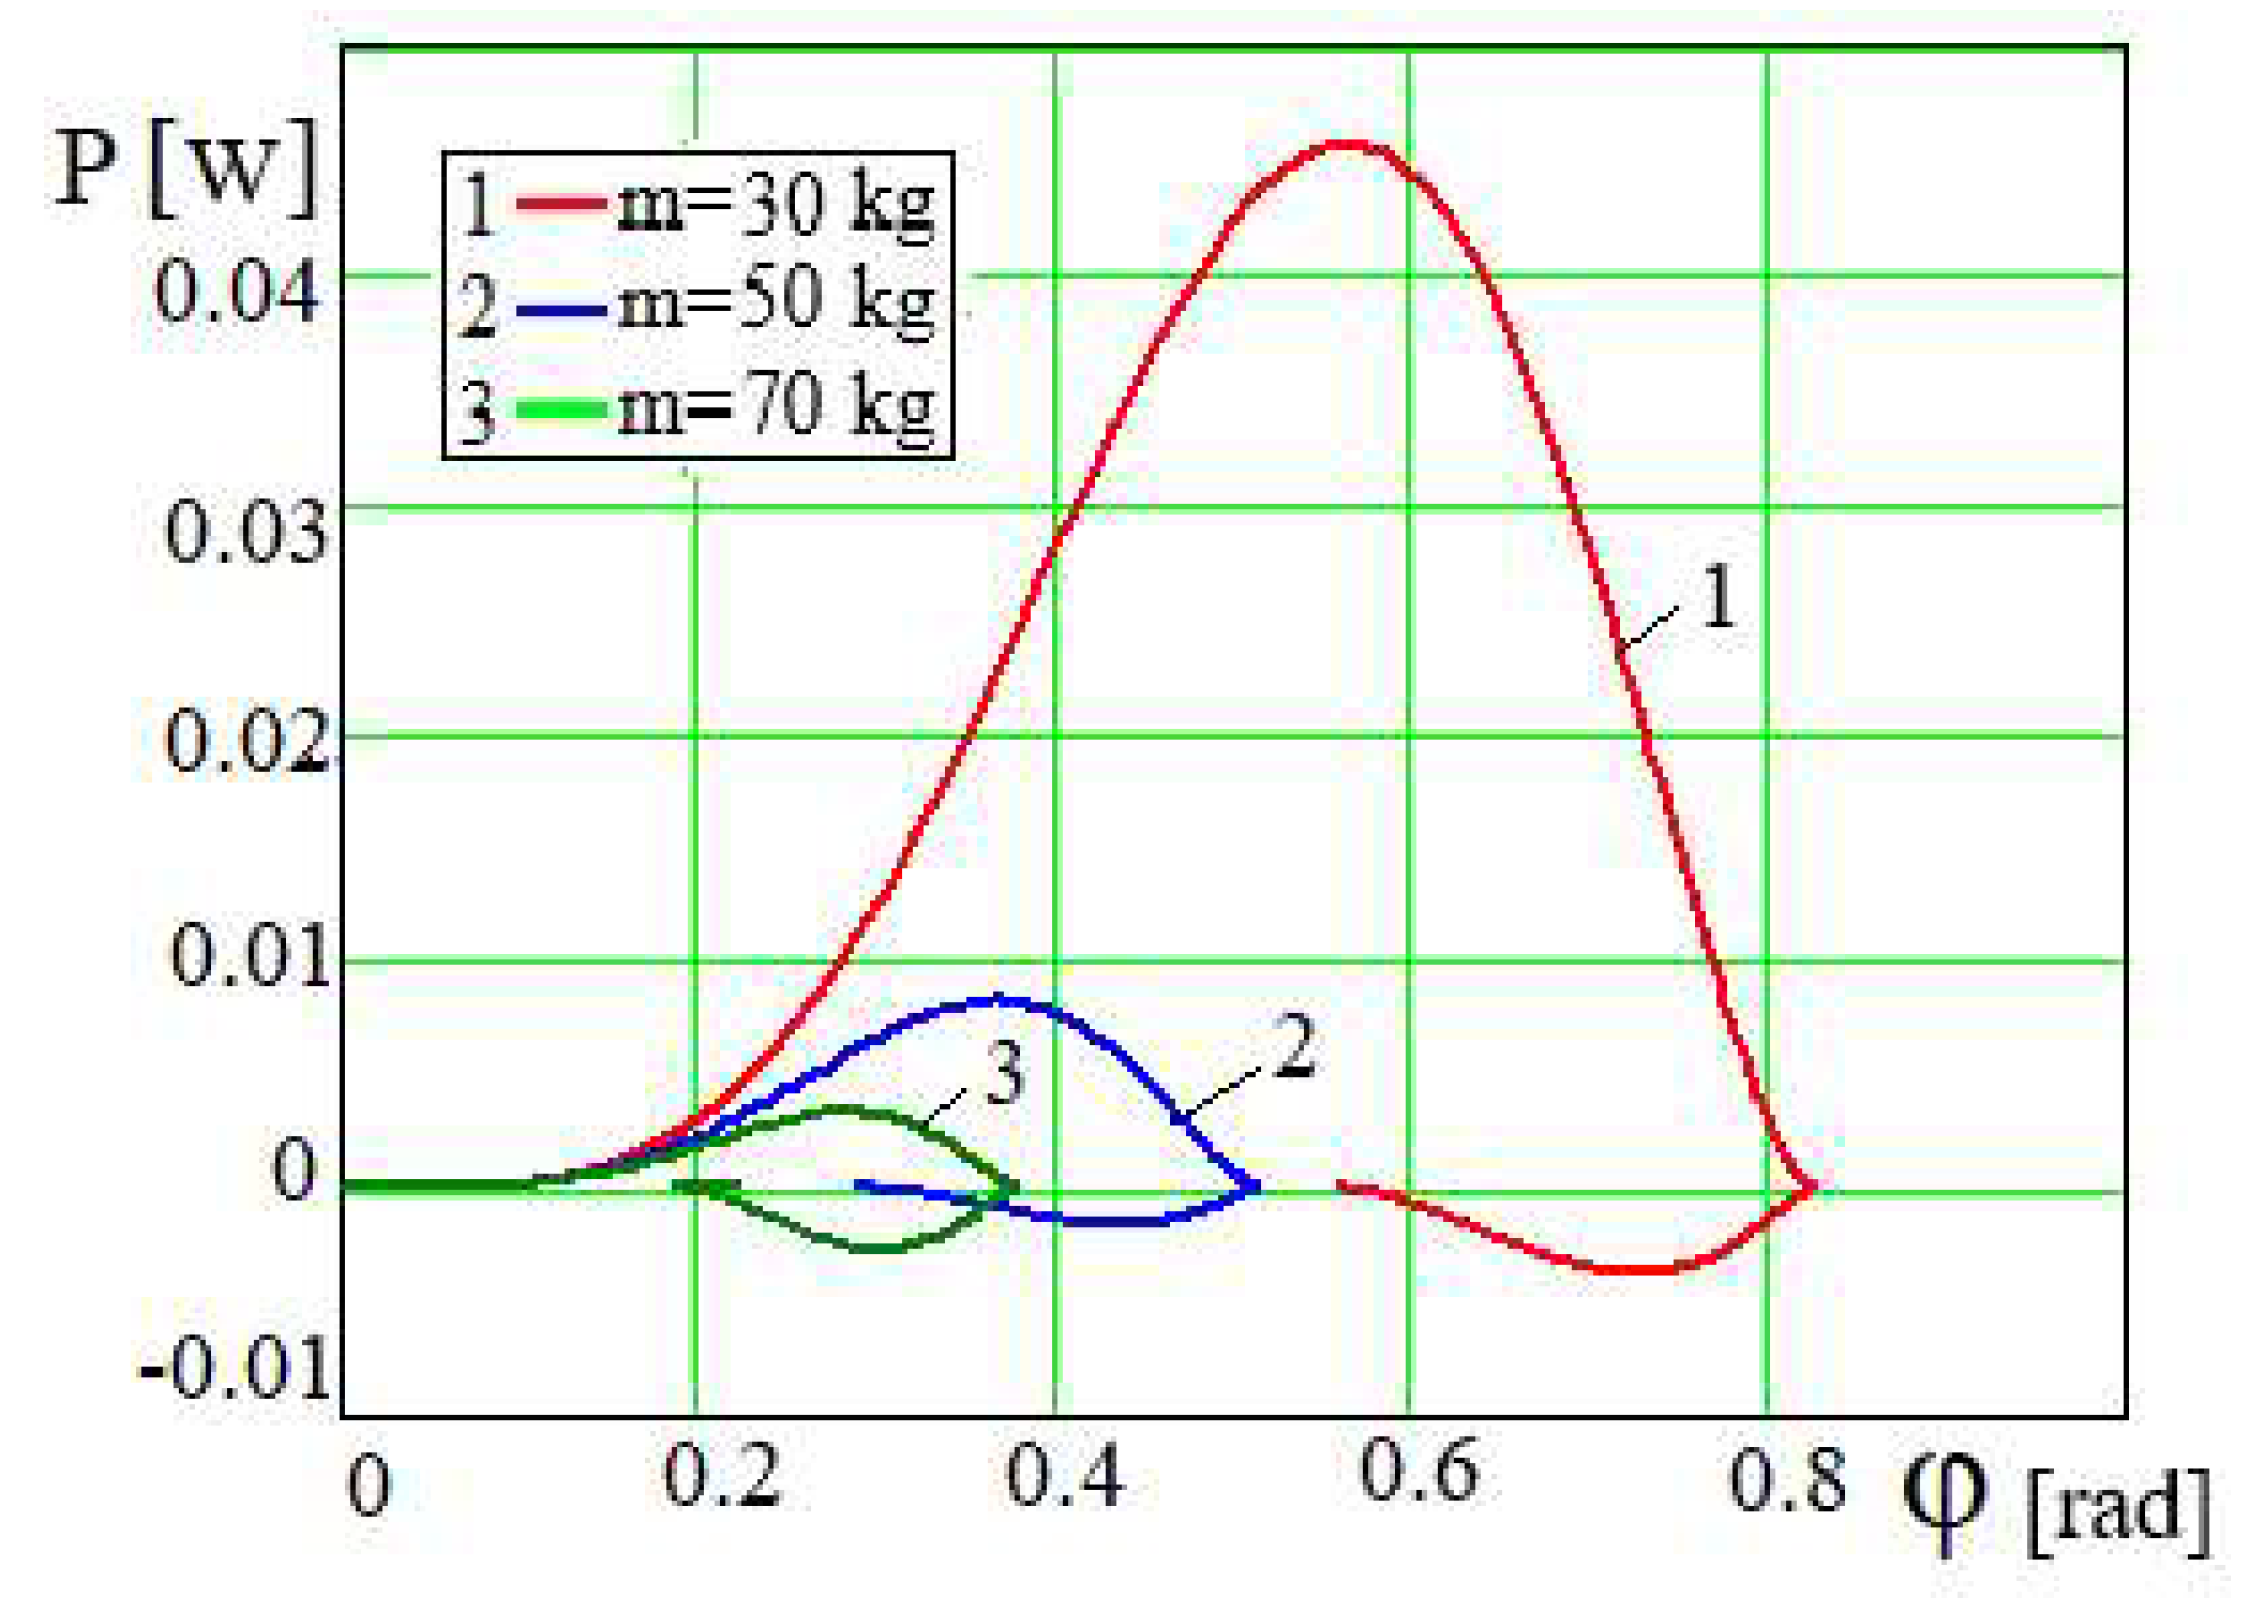
Figure 9.
Dependence for different values of m.
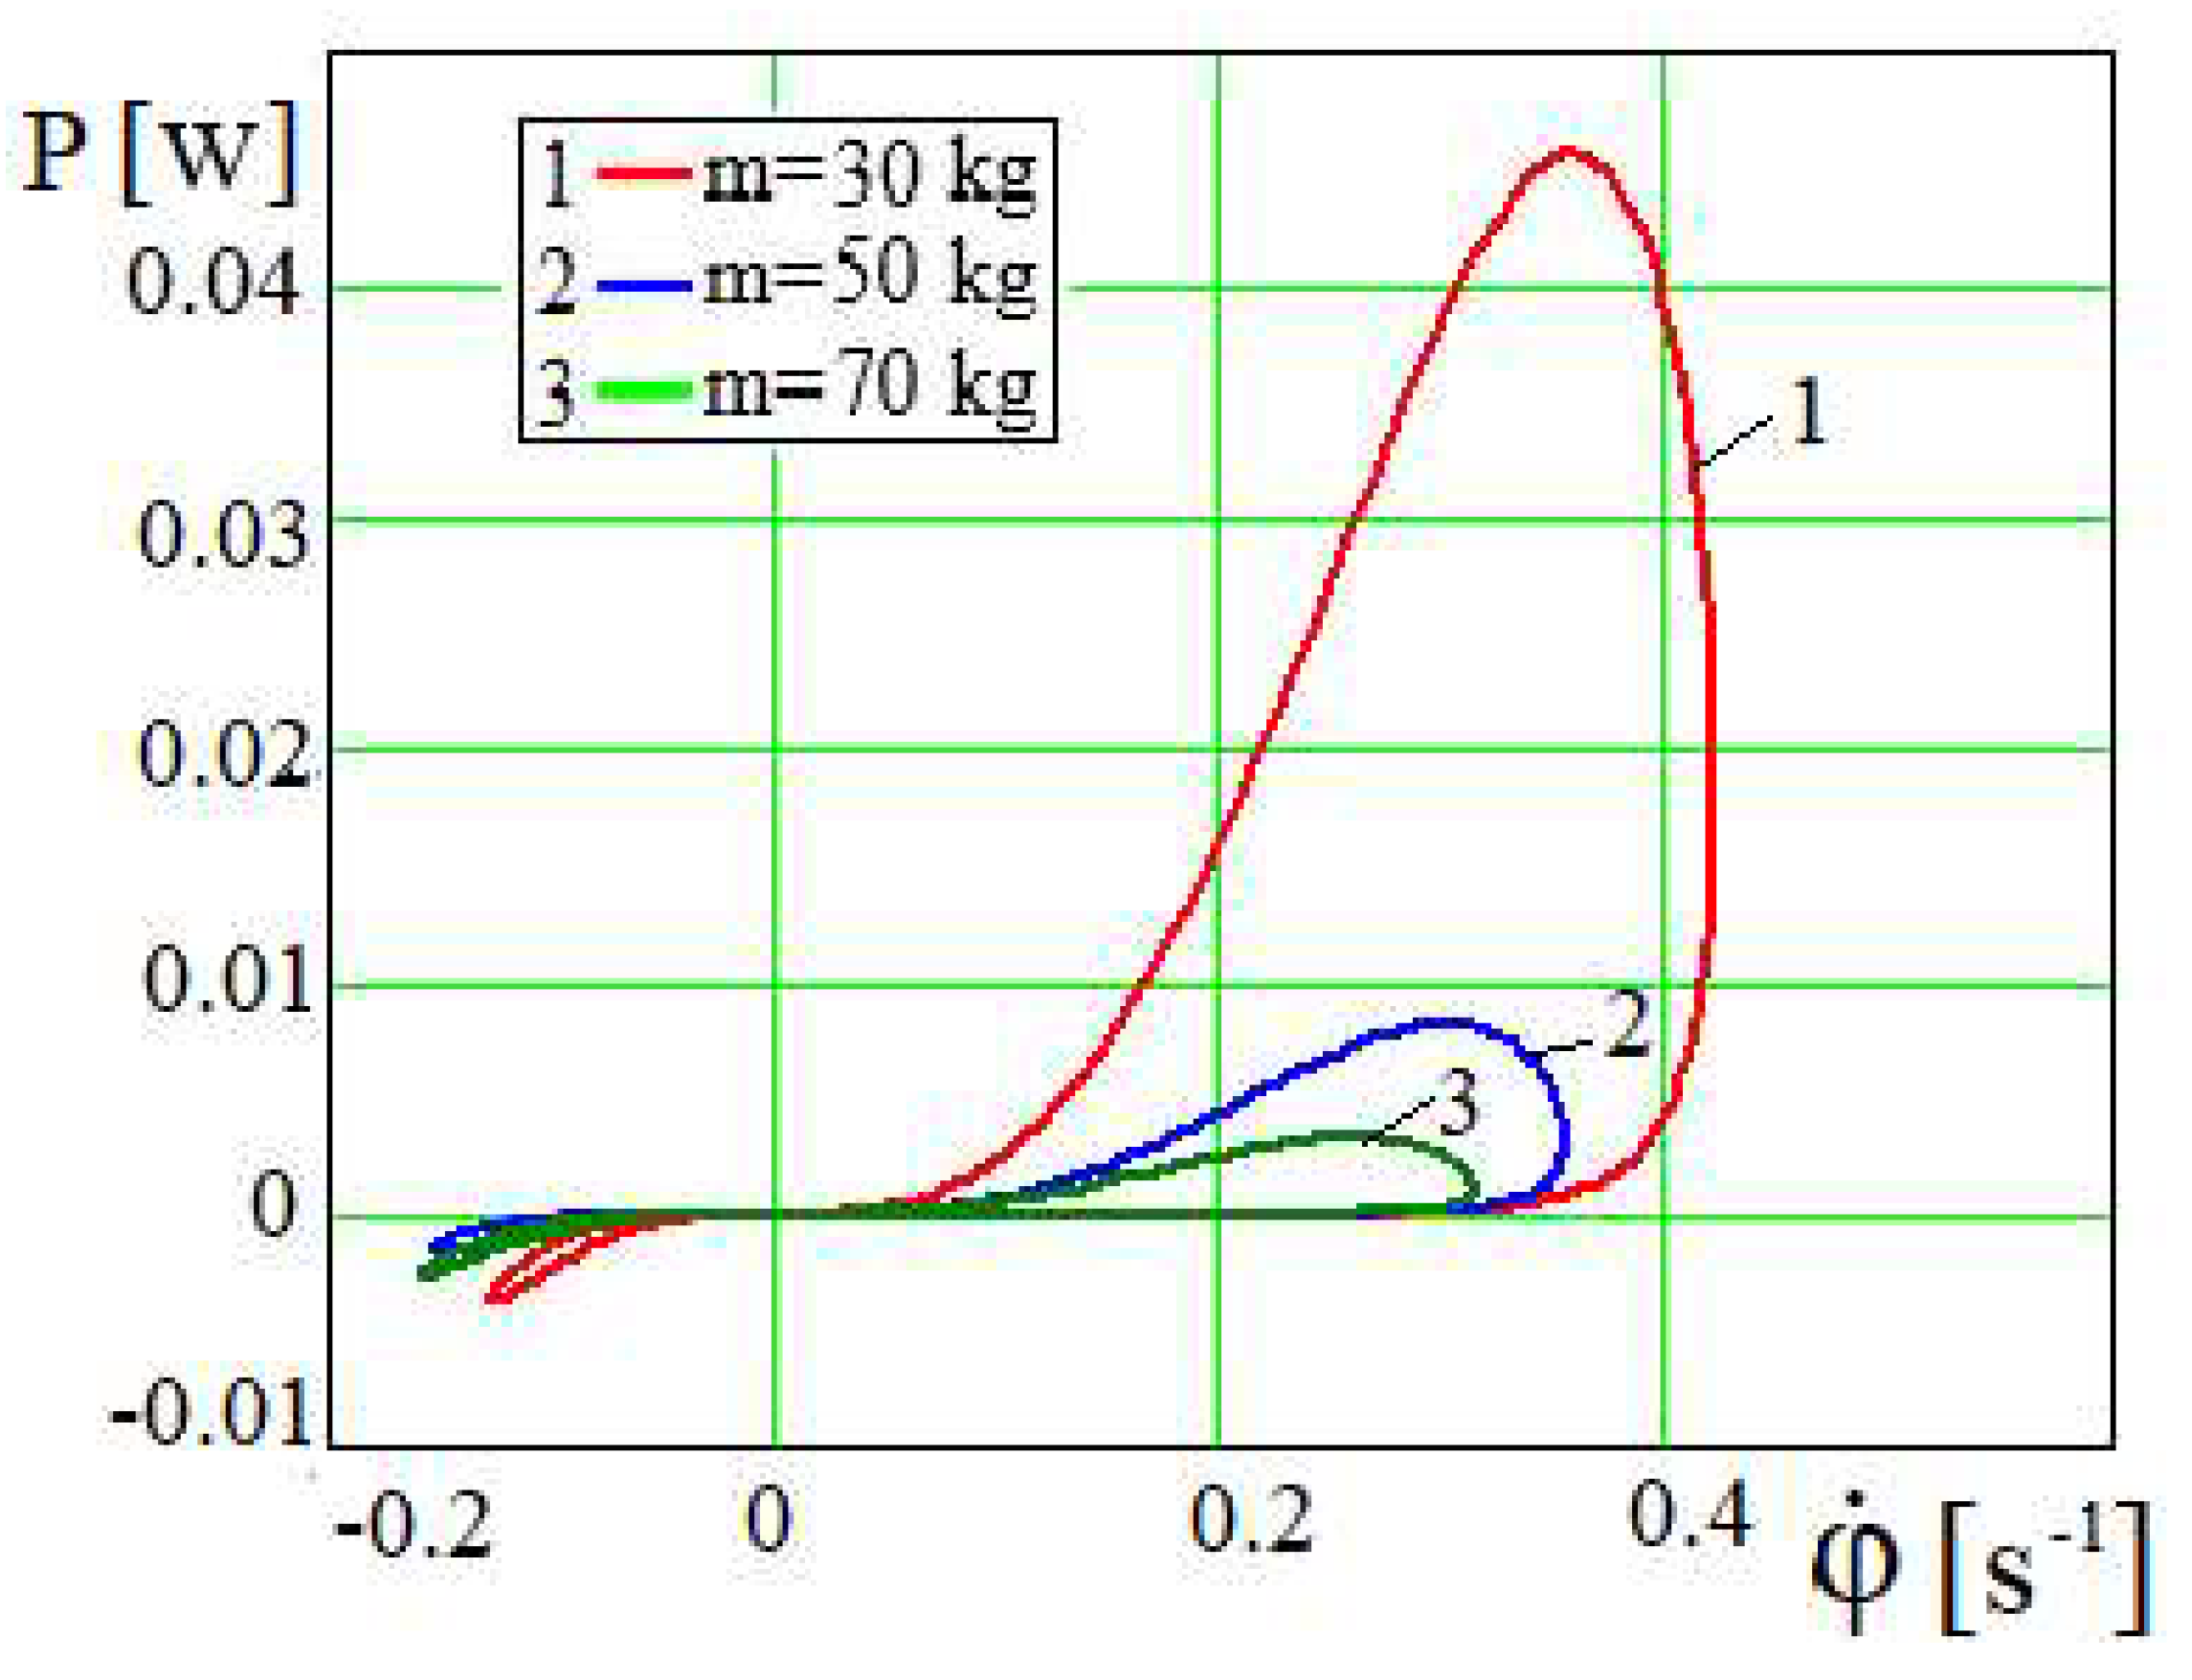
Figure 10.
Dependence φ=φ(t) for different values of r.

Figure 11.
Dependence for different values of r.
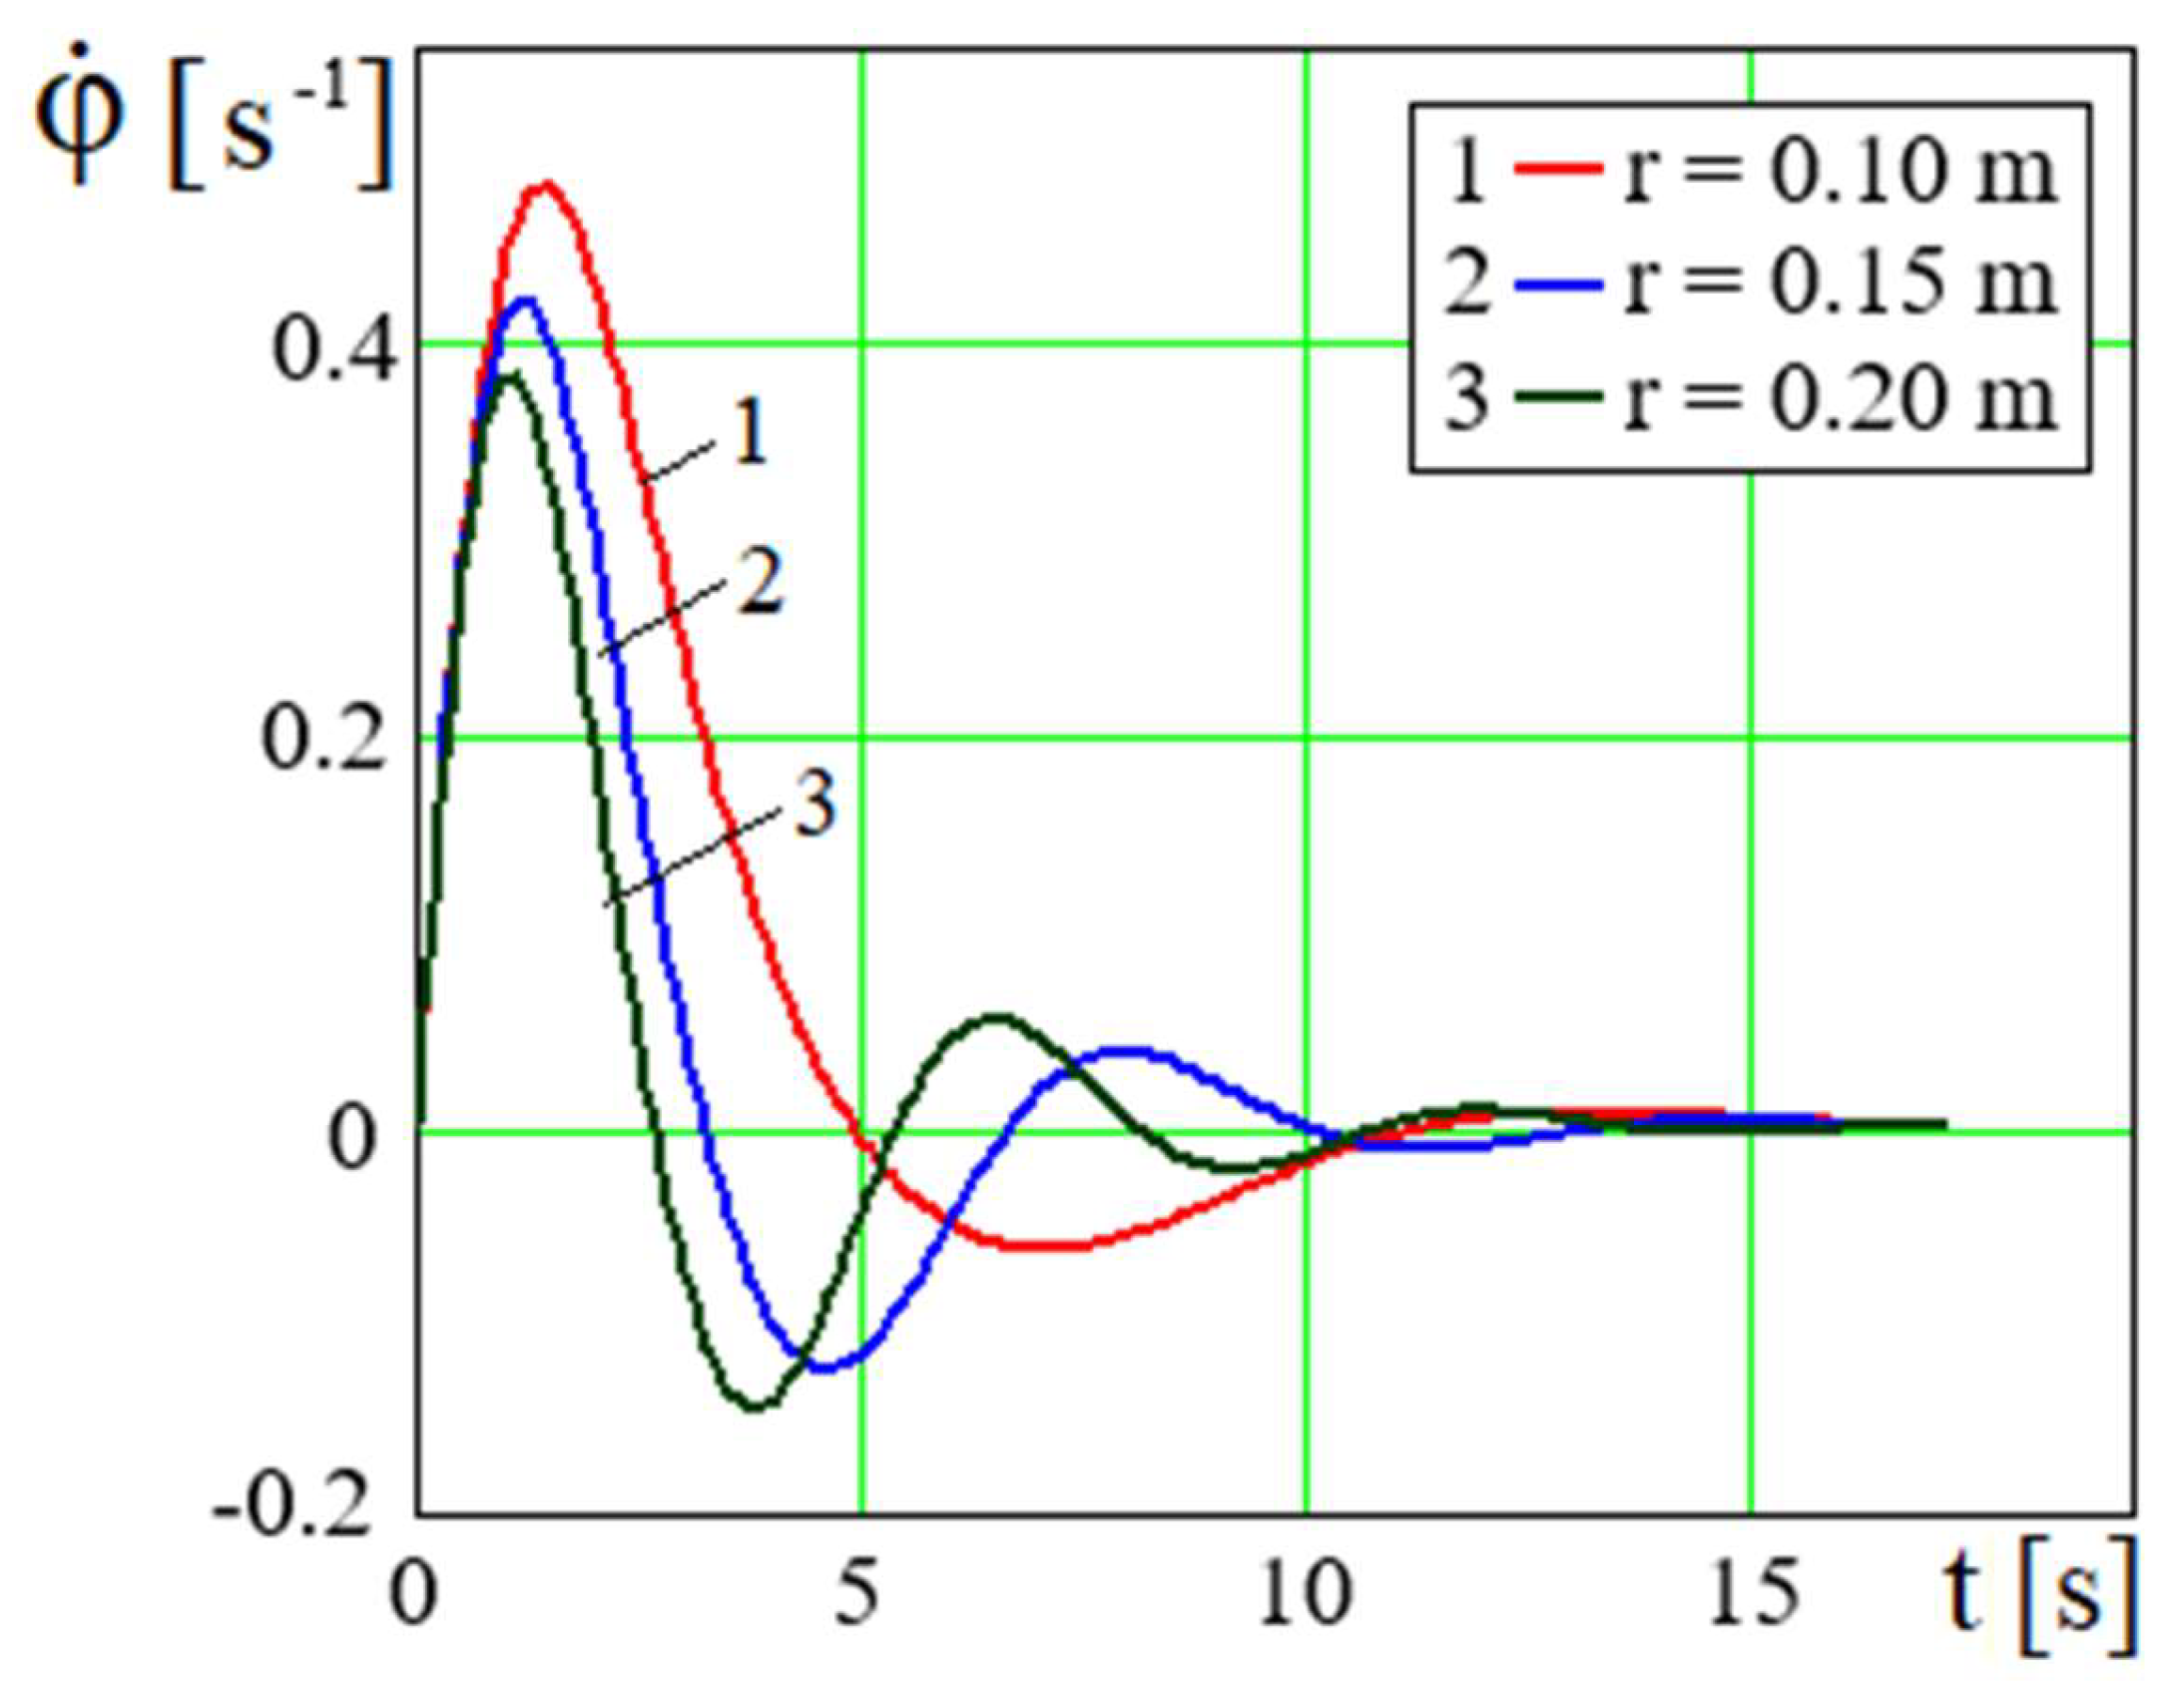
Figure 12.
Dependence P=P(φ) at a=23 N•m, m=20 kg and various values of r.
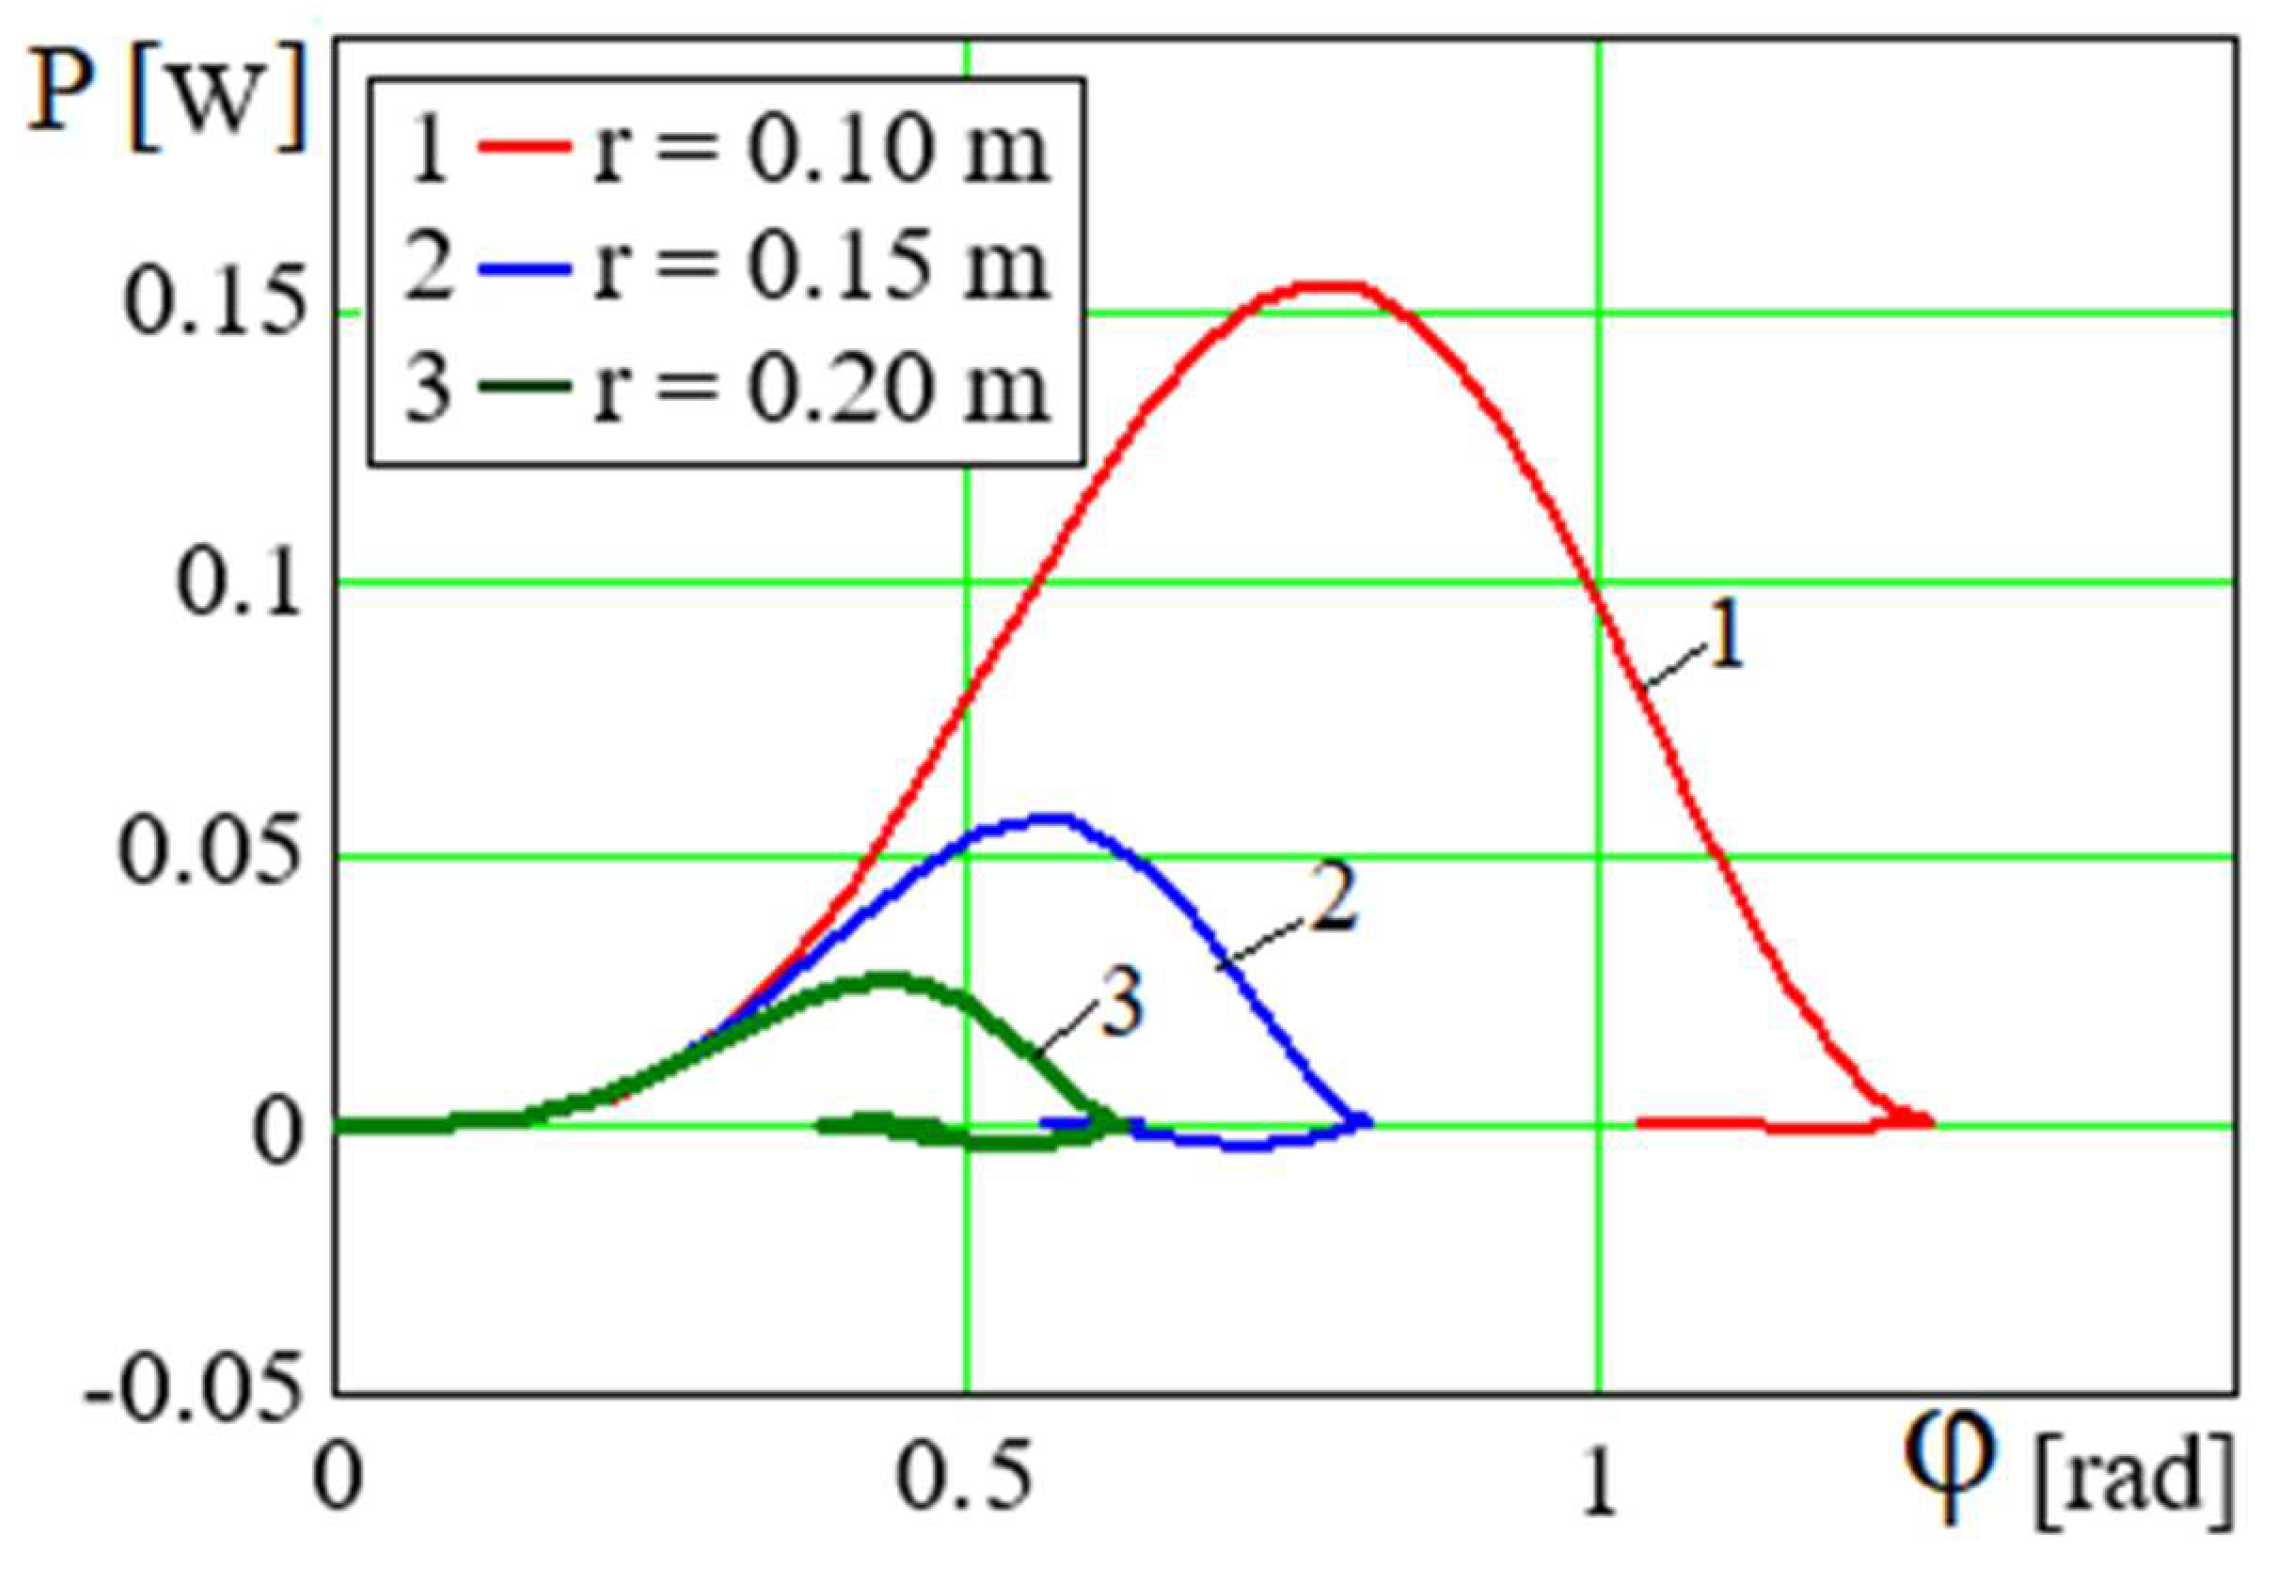
Figure 13.
Dependence for different values of r.

Figure 14.
Dependence φ=φ(t) for different values of ρ.
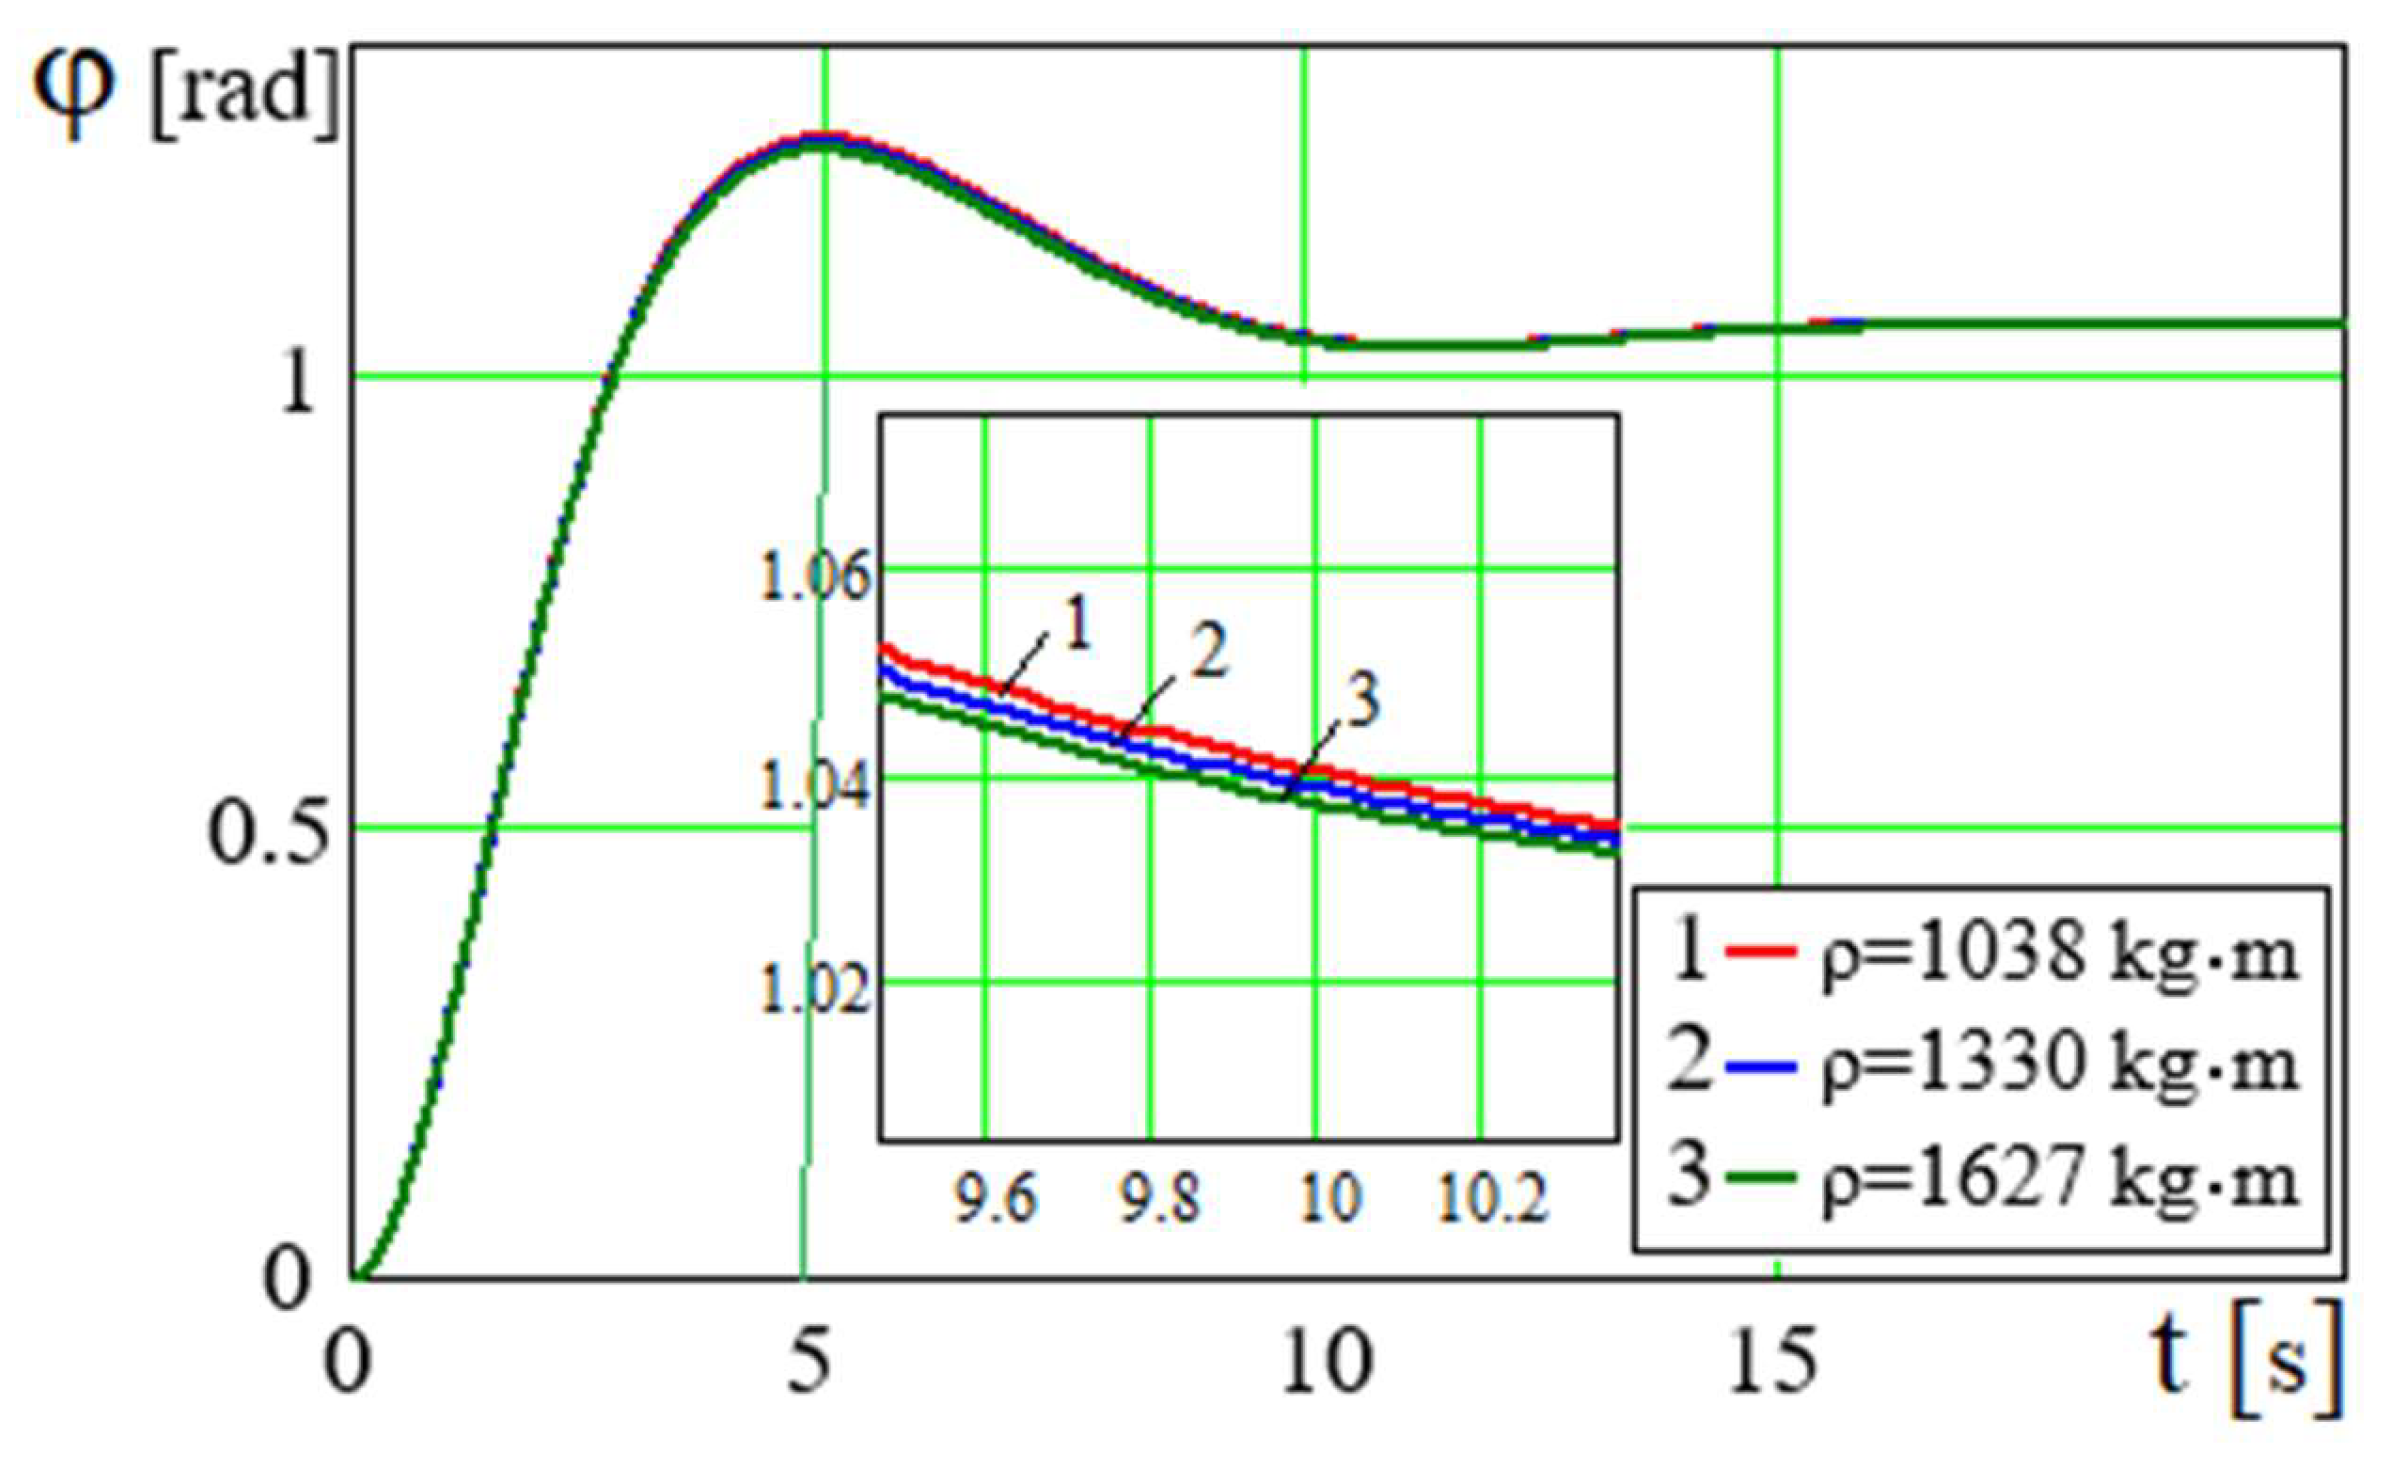
Figure 15.
Dependence for different values of ρ.
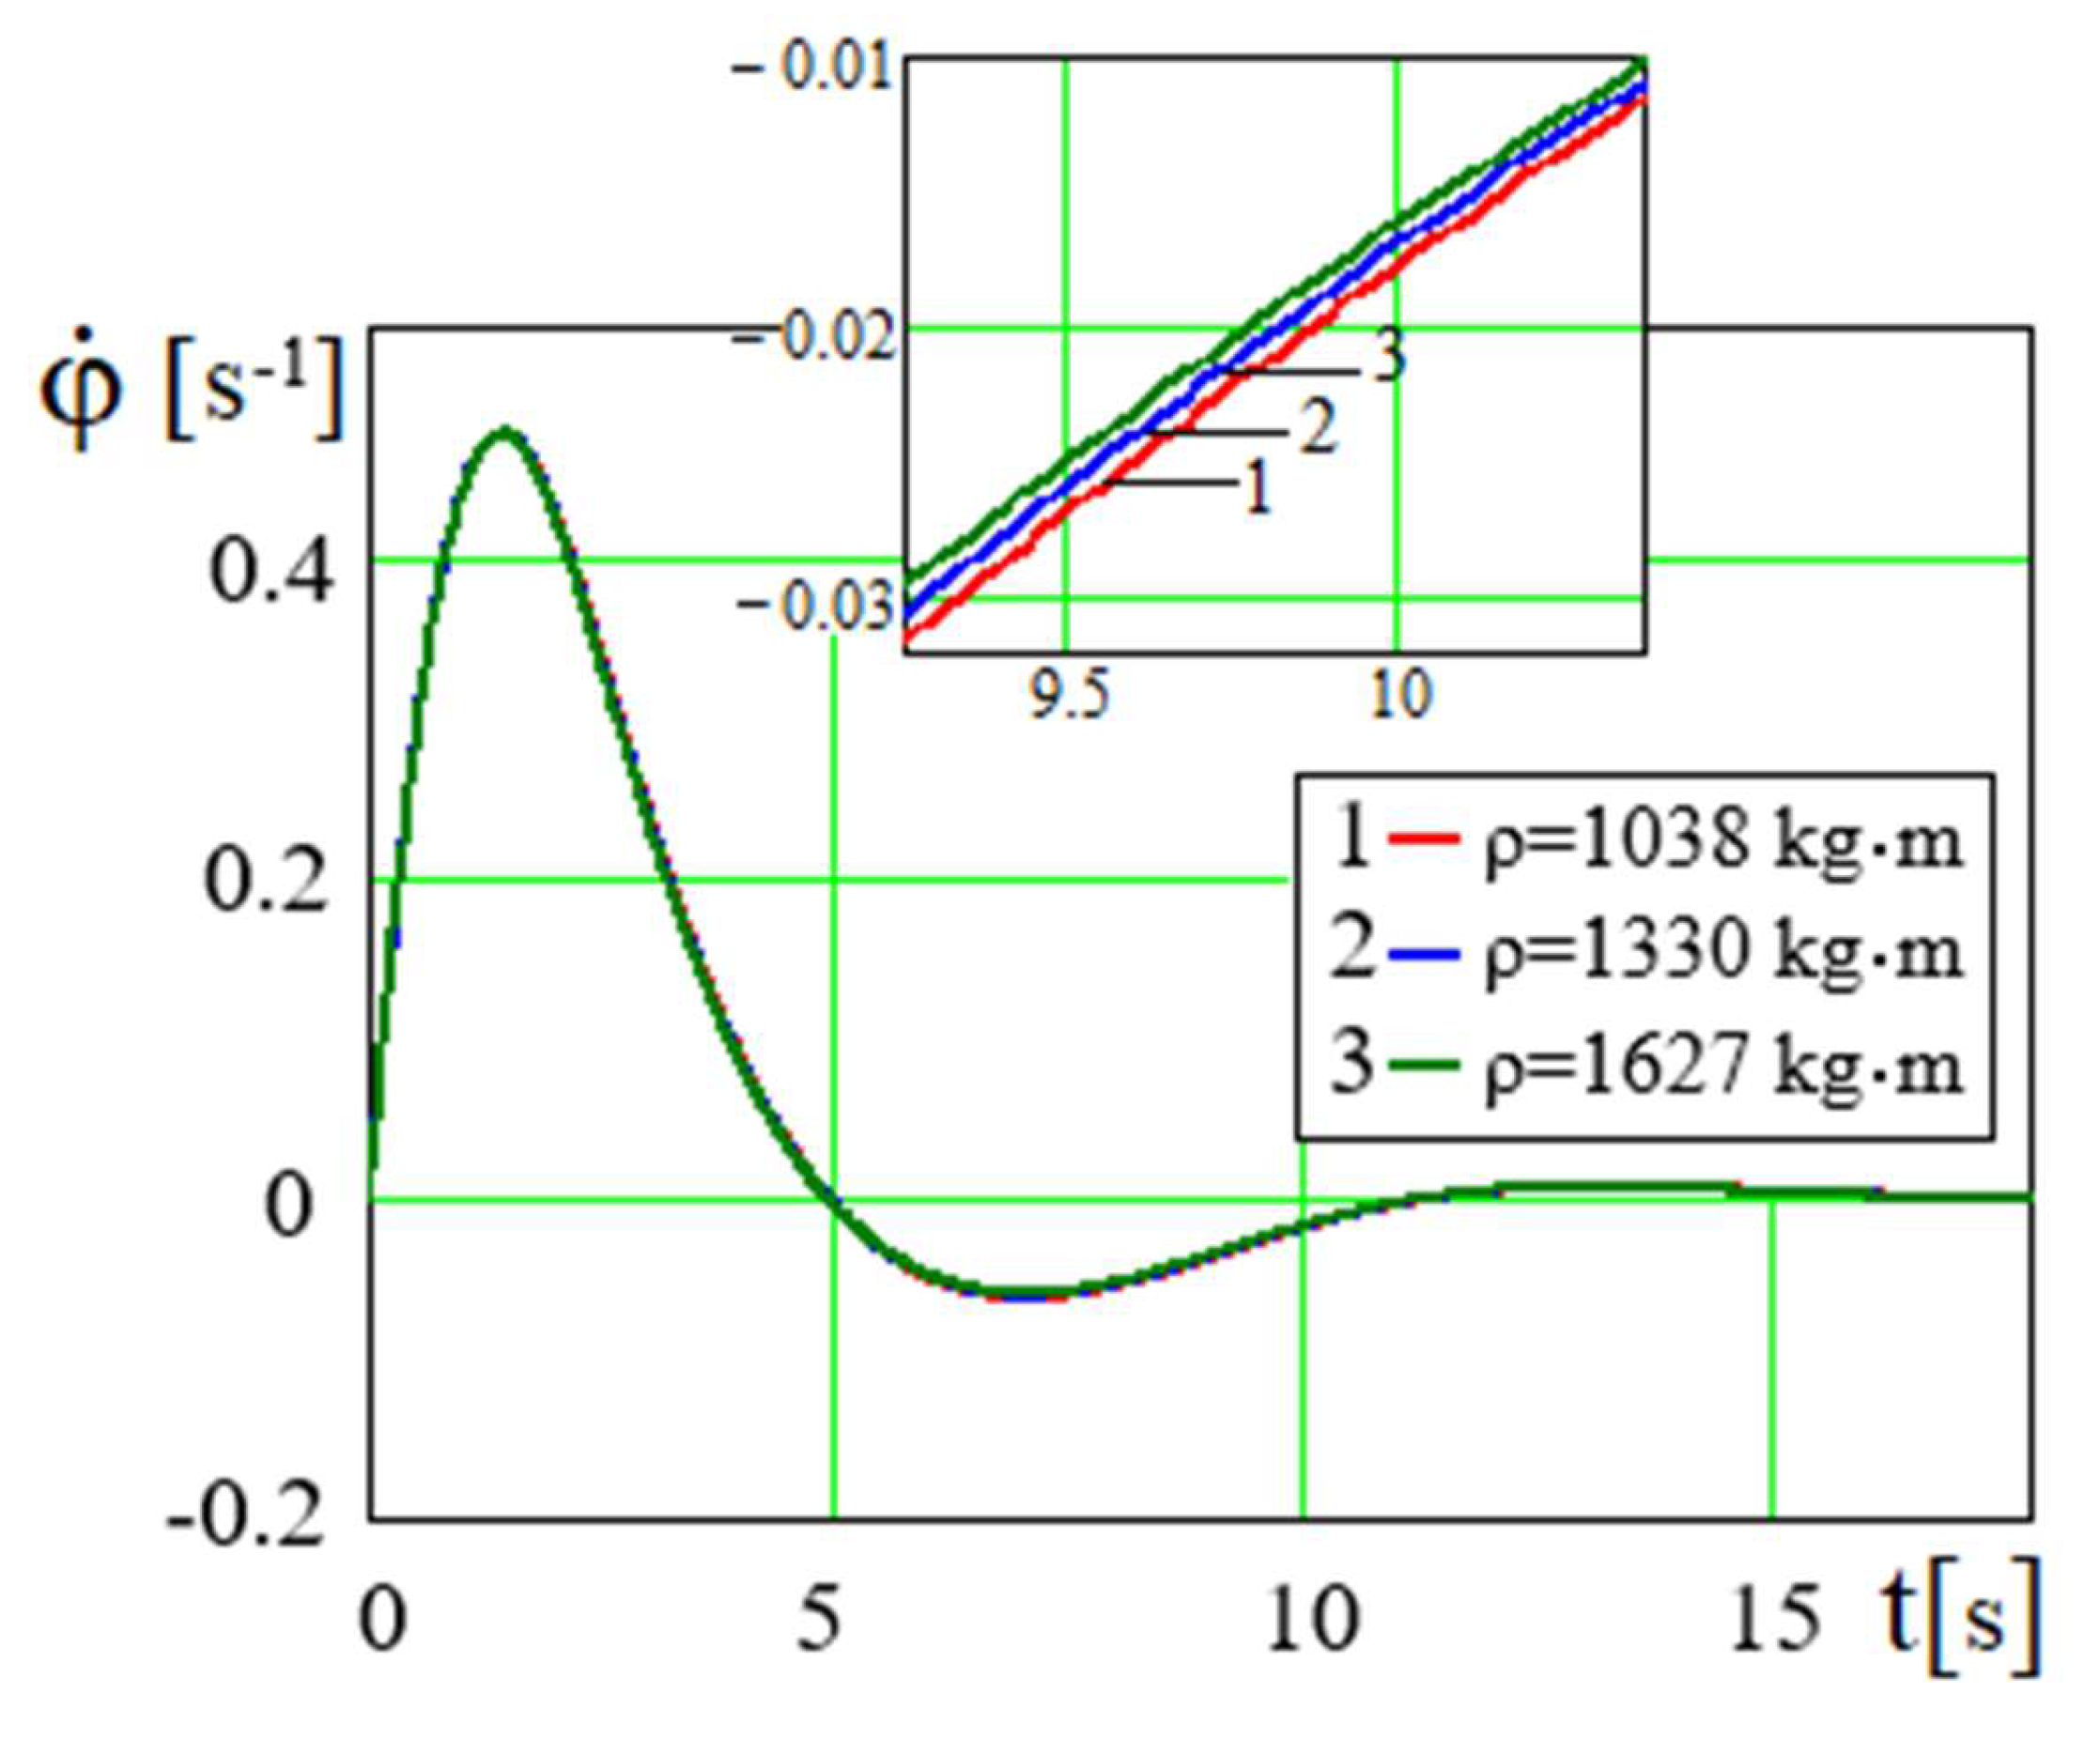
Figure 16.
Dependence P=P(φ) for different values of ρ.

Figure 17.
Dependence for different values of ρ.
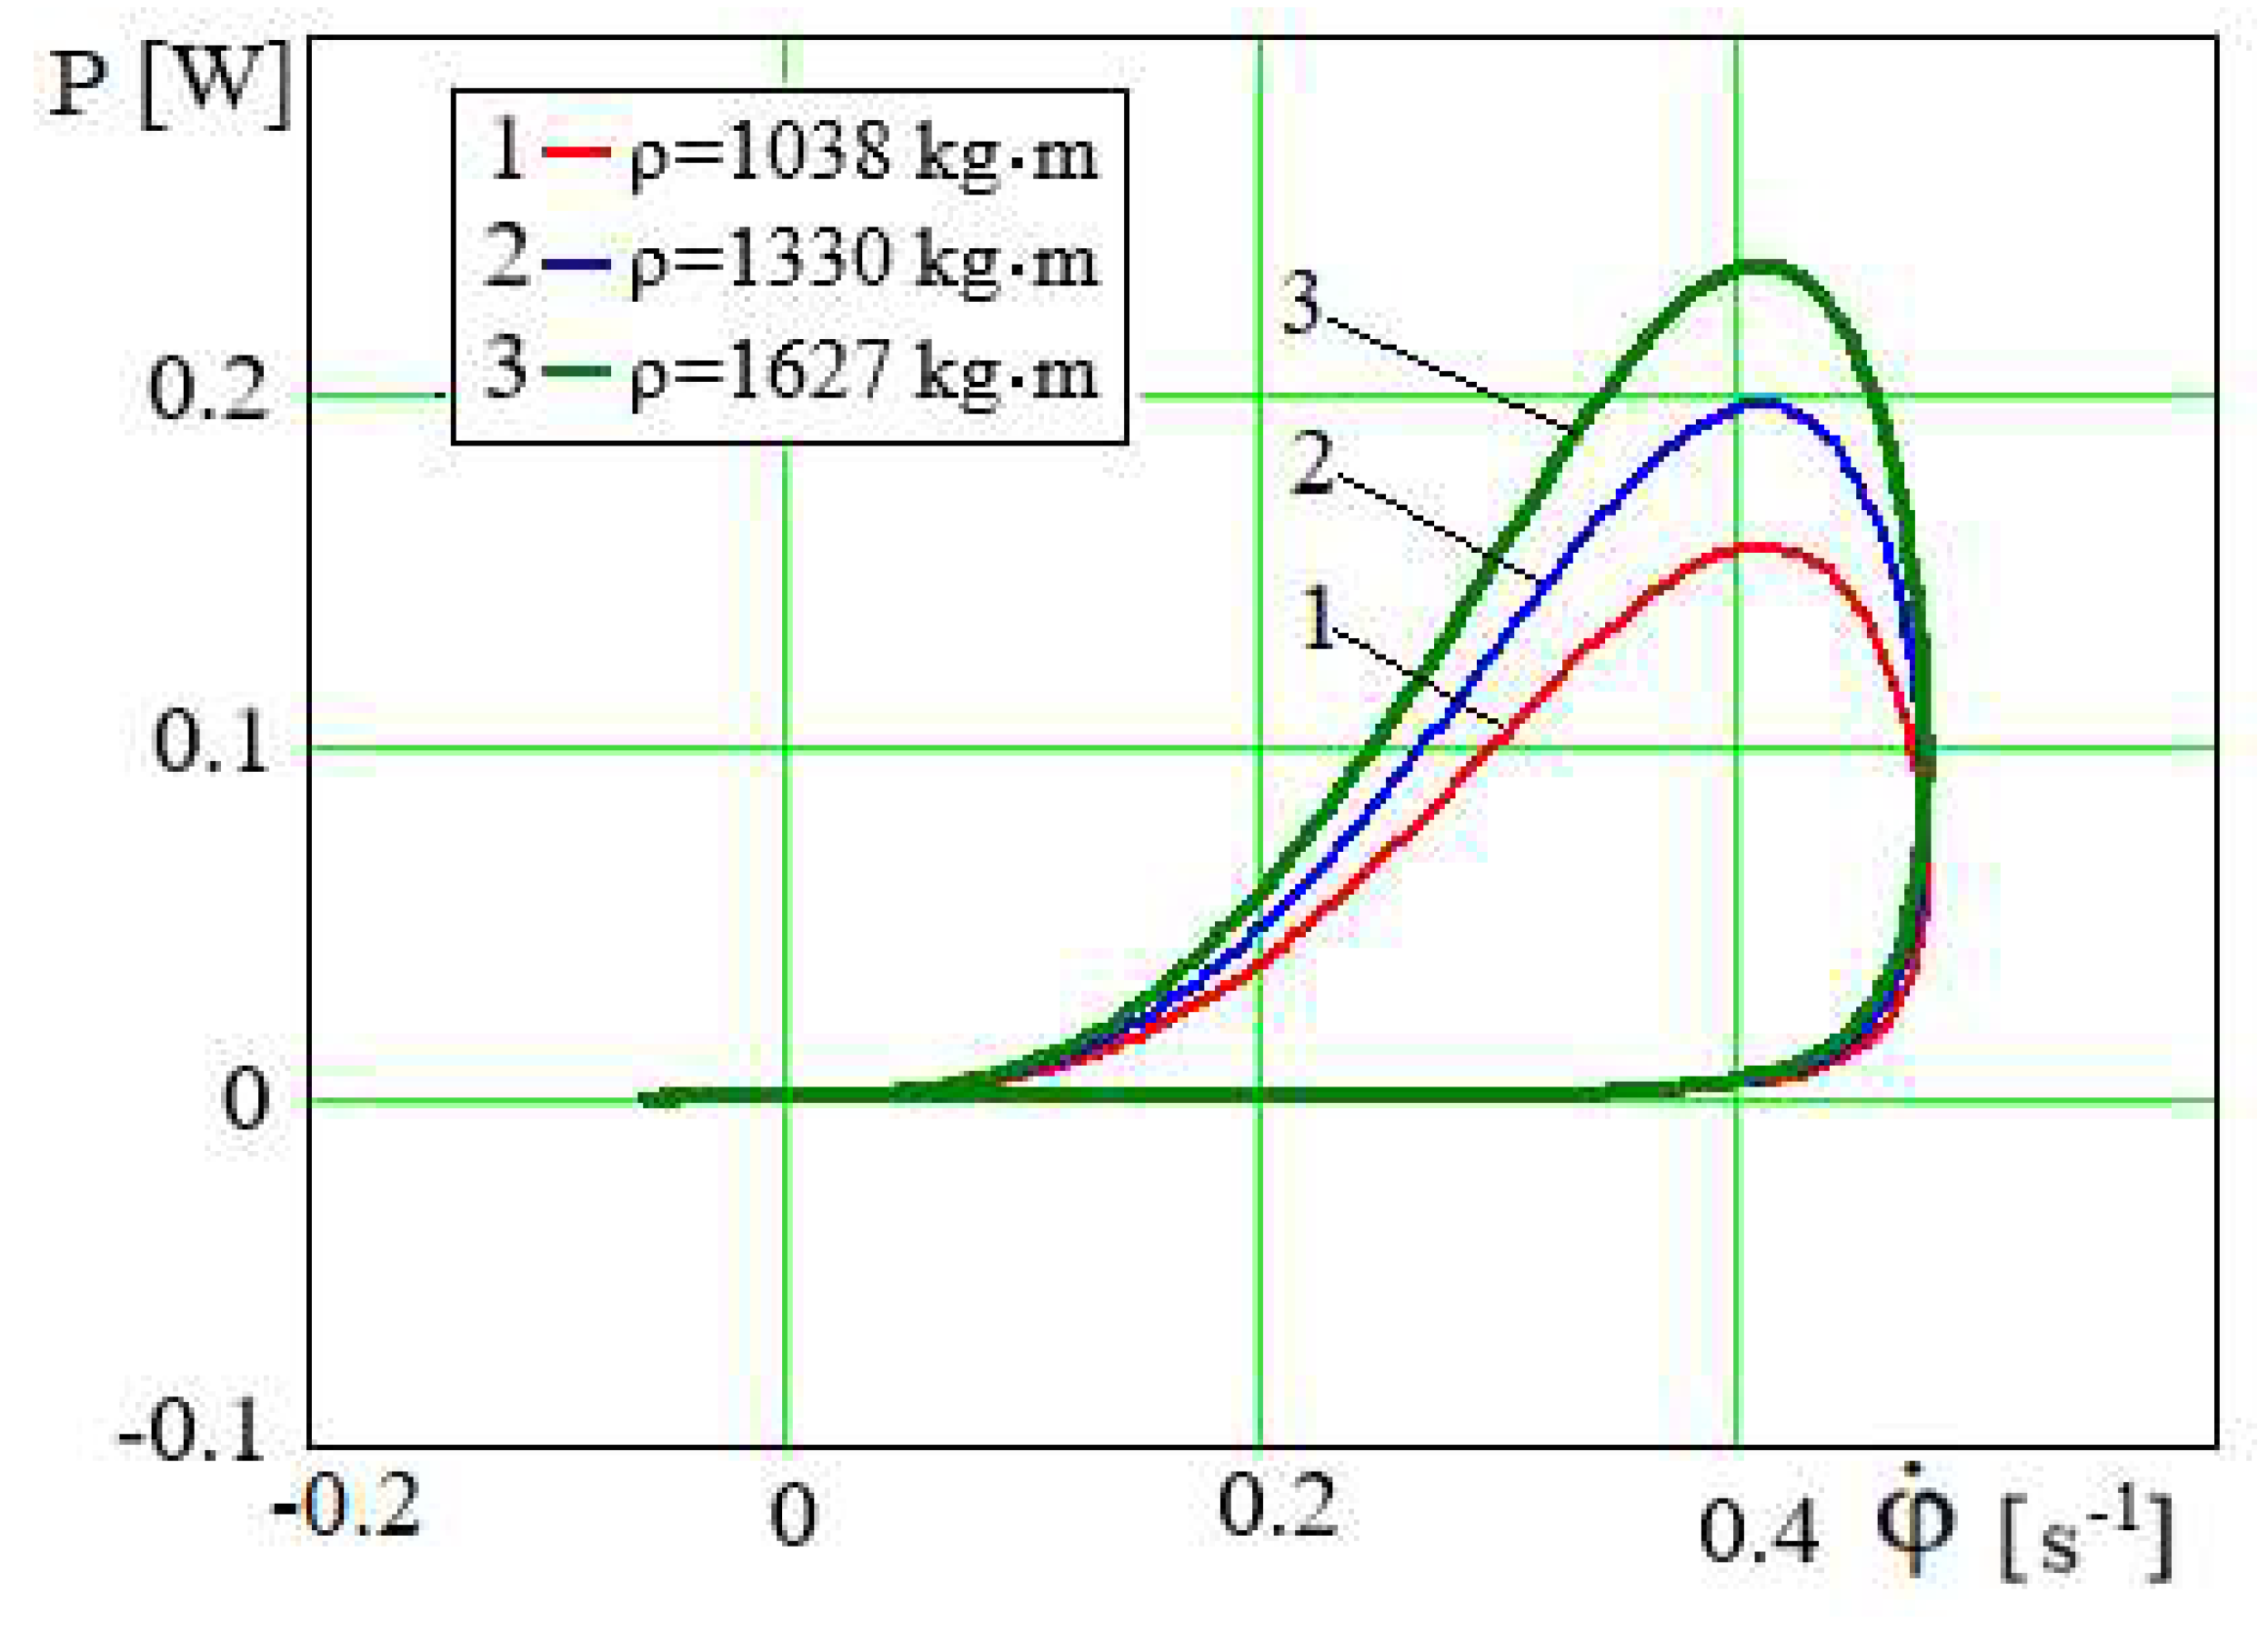
Figure 18.
Dependence φ=φ(t) at m=25 kg and various values of .
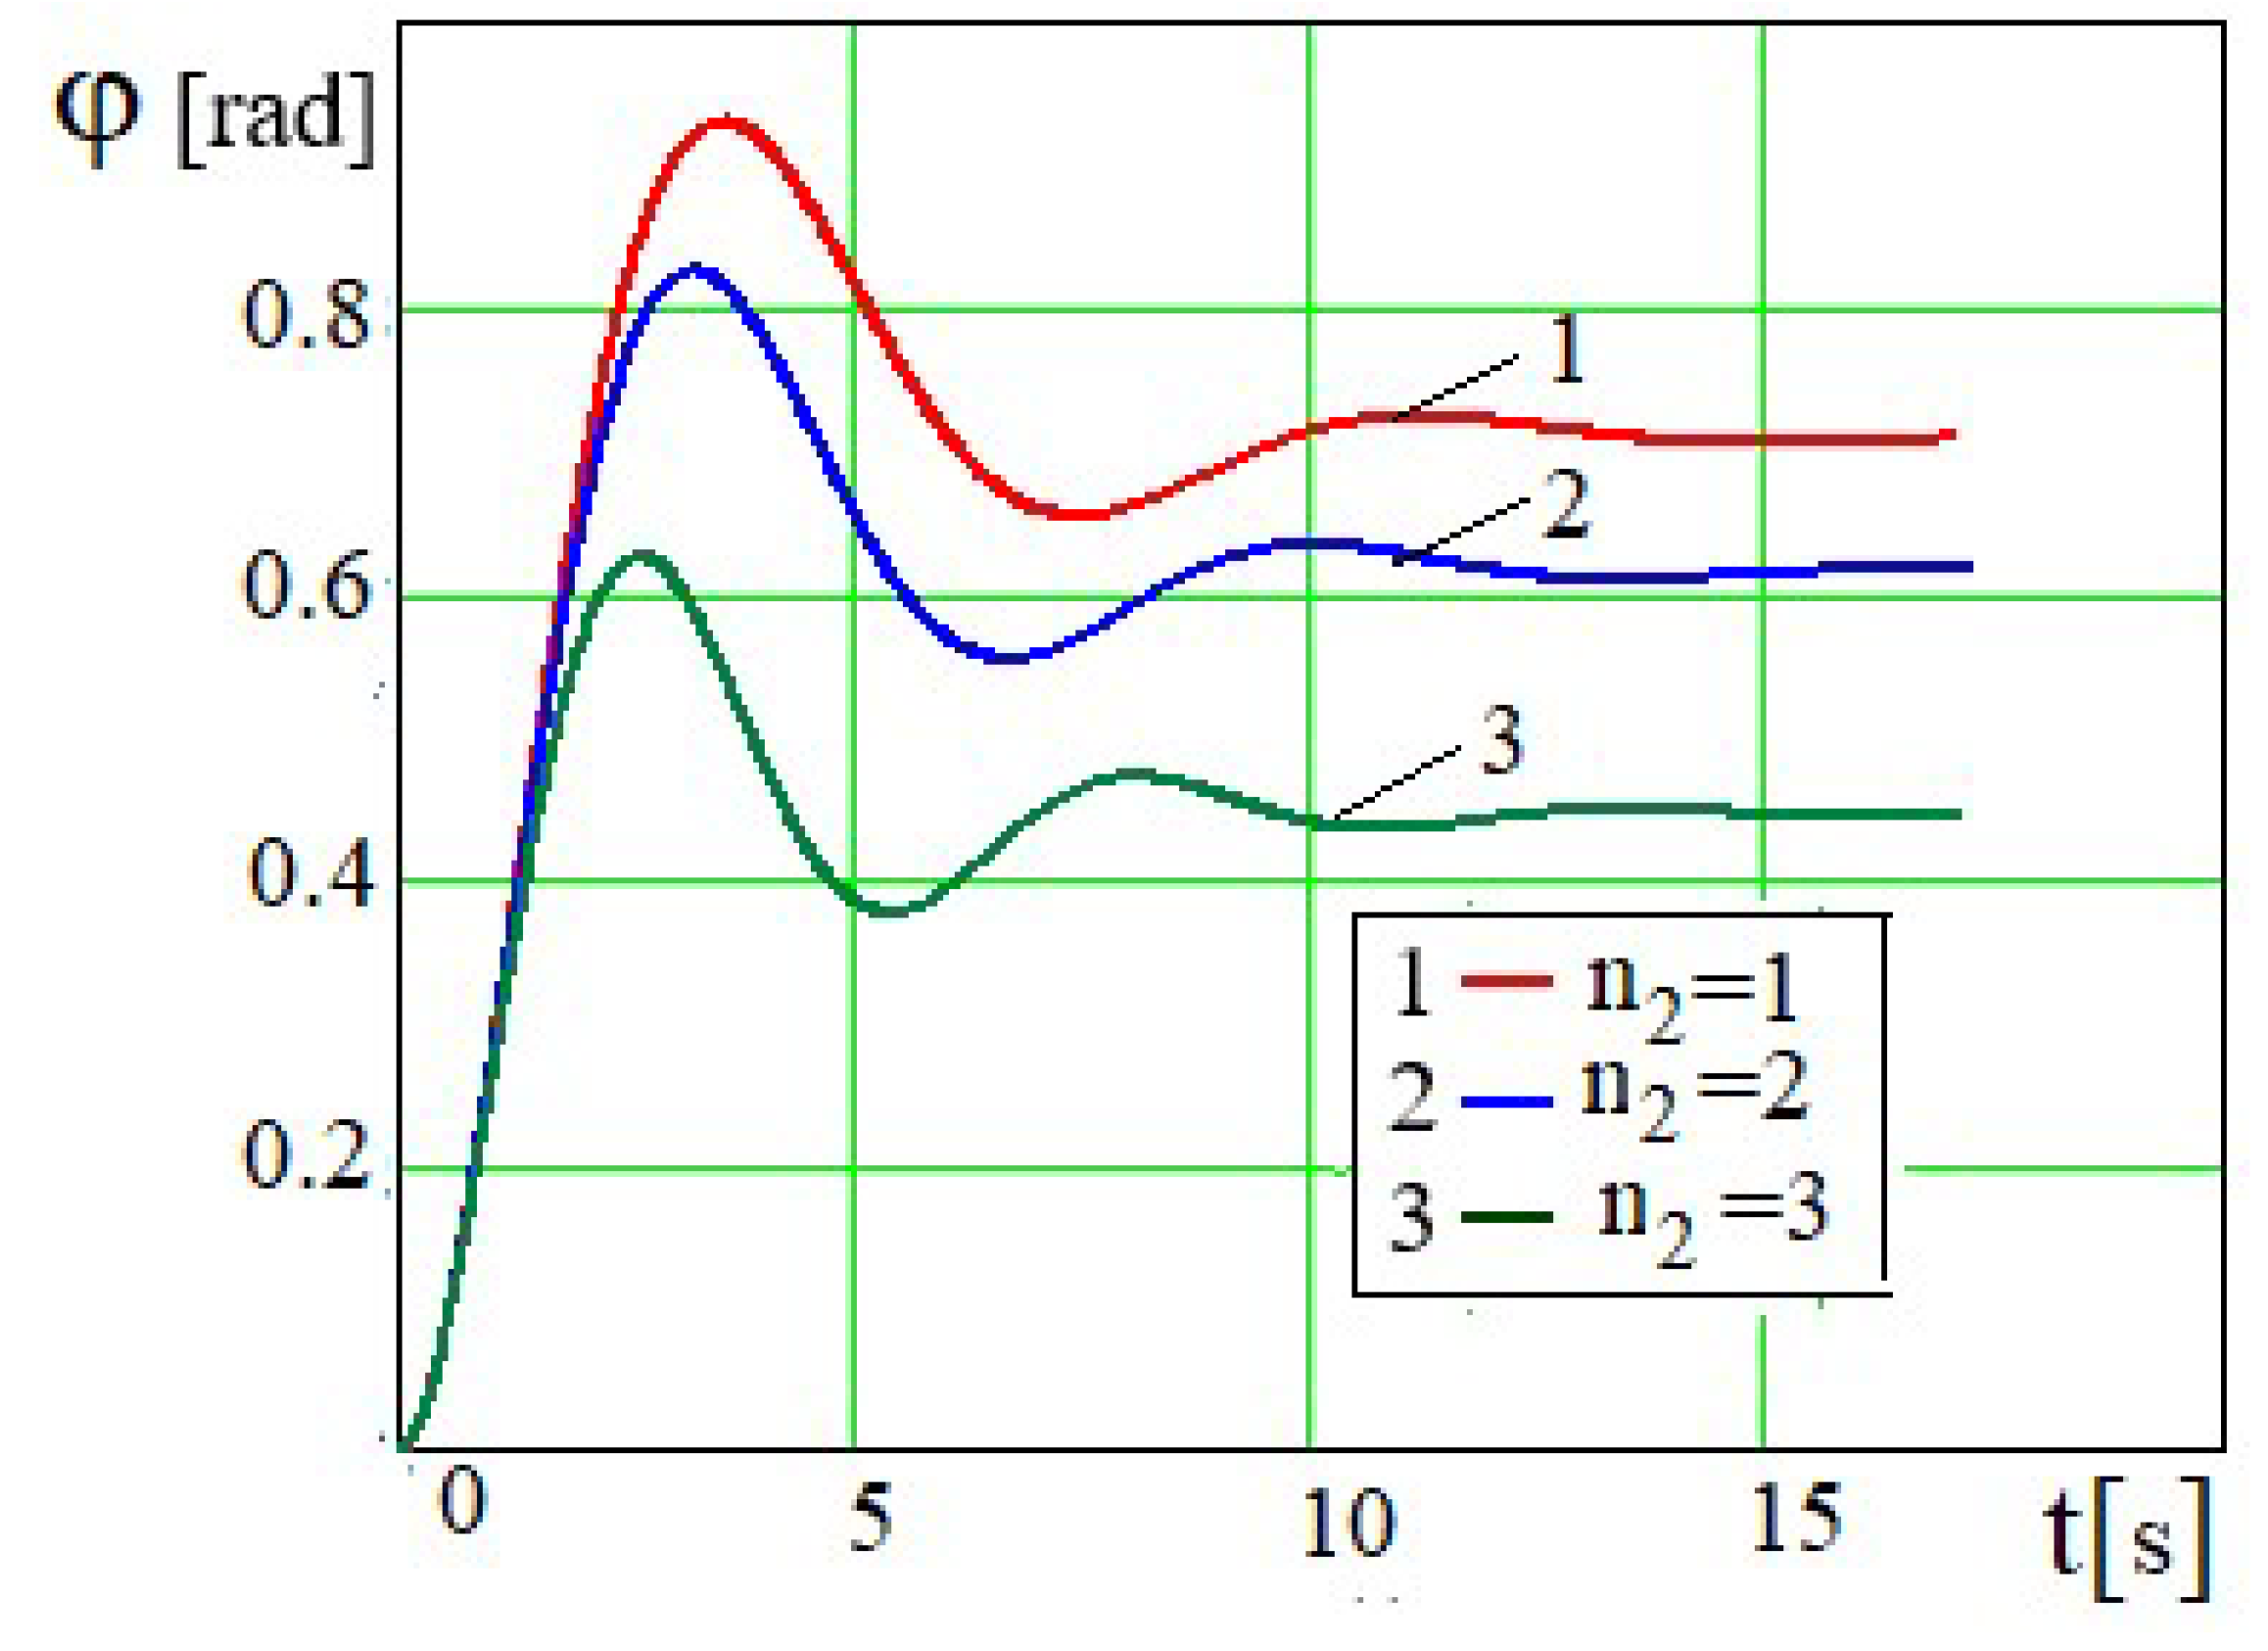
Figure 19.
Dependence at m=25 kg and various values of .
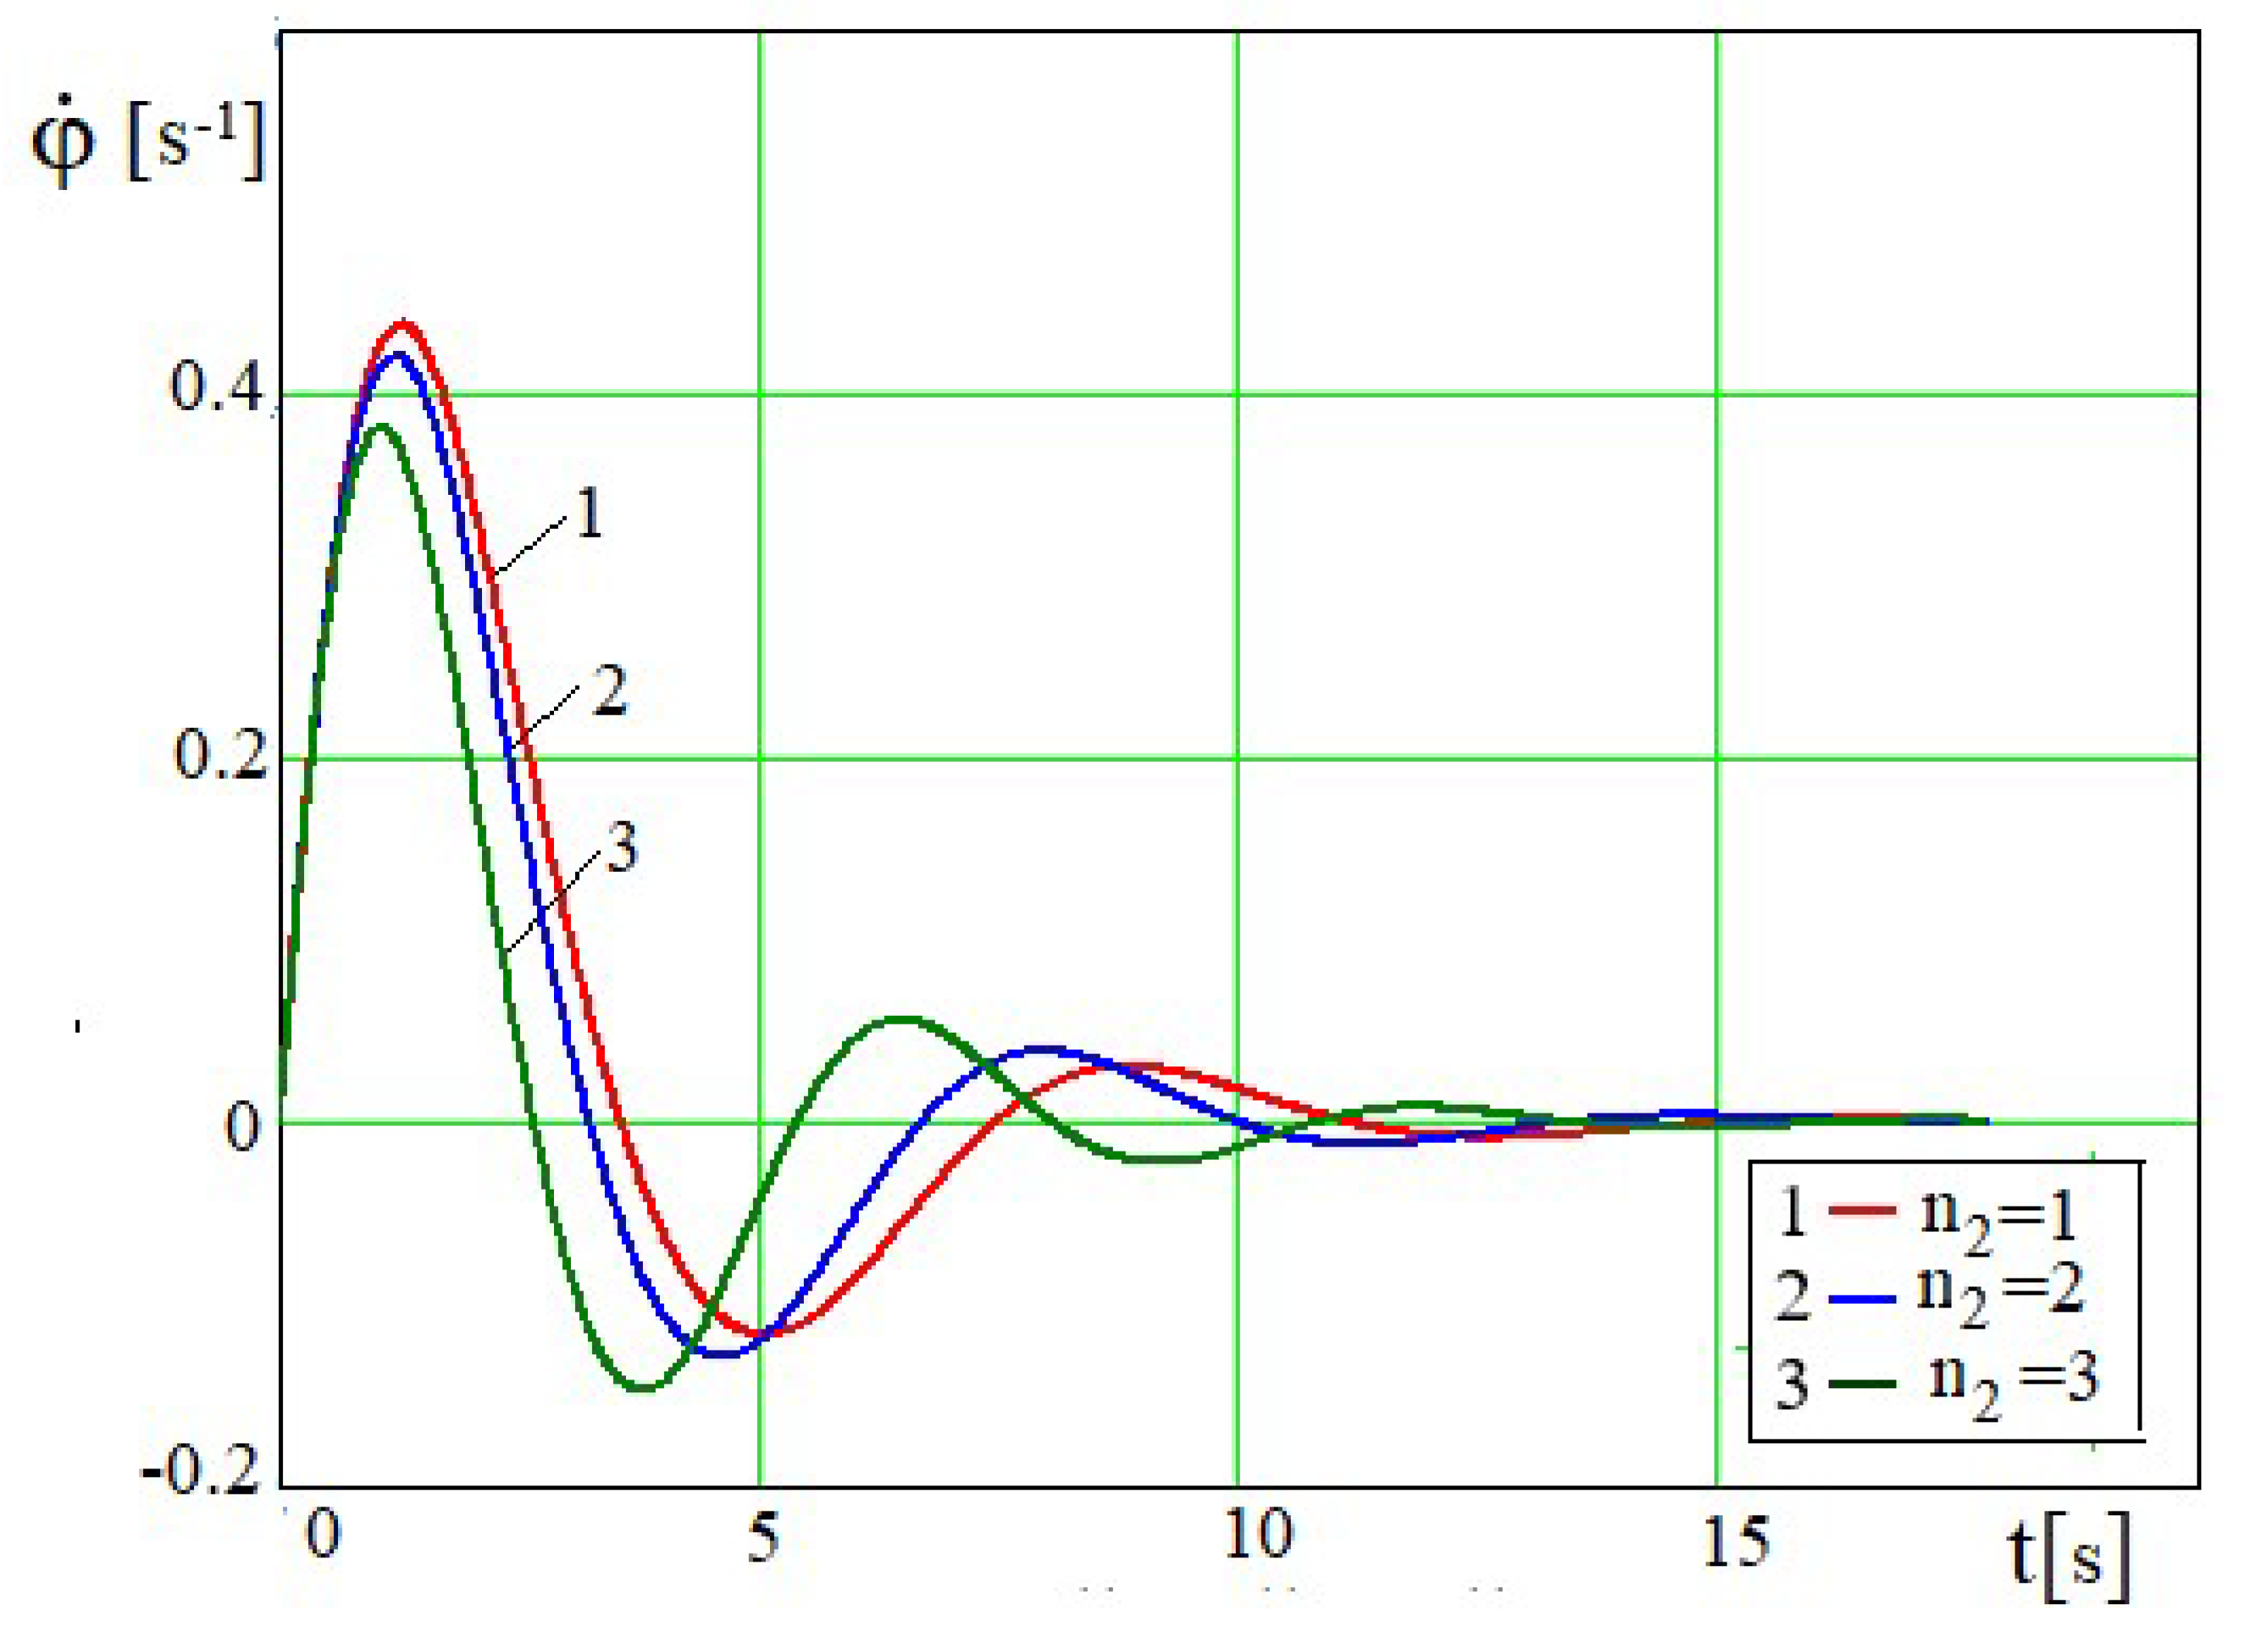
Figure 22.
Dependence φ=φ(t) at m=30 kg and various values of .
Disclaimer/Publisher’s Note: The statements, opinions and data contained in all publications are solely those of the individual author(s) and contributor(s) and not of MDPI and/or the editor(s). MDPI and/or the editor(s) disclaim responsibility for any injury to people or property resulting from any ideas, methods, instructions or products referred to in the content. |
© 2025 by the authors. Licensee MDPI, Basel, Switzerland. This article is an open access article distributed under the terms and conditions of the Creative Commons Attribution (CC BY) license (http://creativecommons.org/licenses/by/4.0/).
Copyright: This open access article is published under a Creative Commons CC BY 4.0 license, which permit the free download, distribution, and reuse, provided that the author and preprint are cited in any reuse.


