
Submitted:
25 June 2025
Posted:
26 June 2025
You are already at the latest version
Abstract
Several factors related to the obesity can affect mitochondrial ATP biosynthesis including the uncoupling of oxidative phosphorylation (OXPHOS) by proton leak induced by accumulated free fatty acids (FFA), the over-expression of uncoupling proteins (UCPs) and altered expression of ATPase inhibitory protein factors 1 (IF1). Therefore, the present work was aimed to evaluate the activity of ATP synthase in isolated mitochondria from skeletal and heart muscle of animal models of obesity induced by sucrose diet at different periods. Short periods of sucrose intake (6 and 12 weeks) are sufficient to induce fat accumulation, hypertriglyceridemia and high plasma FFA. However, a significant decline in the activity of the ATP synthase starts to be obvious in mitochondria from skeletal muscle after 24 weeks of sucrose consumption. This impairment of ATP synthase is associated with increased FFA in skeletal muscle homogenate. Both skeletal and heart muscle ATP synthase activity were found sensitive to oleic acid and to GDP, a physiological inhibitor of UCPs, found enhanced by aging. In addition, sucrose diet increases the IF1 content in both skeletal and heart muscle probably to avoid the hydrolysis activity of ATP synthase. In mitochondria from heart muscle a decrease in the ATP synthase activity was only observed according to the age in both groups of rats and it was not affected by sucrose feeding. Our results suggest that the decline of the ATP synthase activity in mitochondria from skeletal muscle can be due to the accumulation of FFA in skeletal muscle tissue as uncouplers, and the IF1 over-expression induced by sucrose diet is an adaptative mechanism to inhibit the ATP synthase hydrolysis activity.
Keywords:
ATP synthase
; free fatty acid
; mitochondria
; obesity
; sucrose diet
Introduction
Fatty acids and glucose through fatty acid beta-oxidation and glycolysis are, respectively, the main nutrients and fuels that drive mitochondrial ATP generation in both skeletal and cardiac muscle [1]. In mitochondria, ATP biosynthesis is further regulated by ATP demand, by substrate supply and by the coupling of oxidative phosphorylation (OXPHOS) to the proton gradient resulting from mitochondrial electron transfer. However, the excess FFAs due to the obesogenic diet characterized by high caloric intake particularly from fats and sucrose, have been described to induce uncoupling of OXPHOS through multiple mechanisms, including activation of uncoupling proteins (UCPs), the modulation of the ATP/ADP antiporter and increased ROS generation [2]. UCPs have been described to be involved in a dual effect on cell function: on the one hand, they protect against lipotoxicity, and on the other hand, they exhibit an uncoupling effect on the biosynthesis of ATP [3]. UCP2 and UCP3, a specific uncoupling protein of muscles, have been described to mediate energy expenditure via uncoupling, thereby dissipating the mitochondrial proton gradient necessary for ATP synthesis [4]. In addition, UCP3 over expression is considered protective against lipotoxicity [5]. In skeletal muscle, UCP3 has been found up-regulated when the mitochondria exceed its capacity to oxidize fatty acids, and down-regulated when oxidative capacity is high or improved suggesting its role in fatty acid oxidation [6,7]. In heart muscle from high fat-fed mice, UCP3 has been found to contribute to energy deficiency, and it is associated to heart failure probably by FFA-induced OXPHOS uncoupling [8,9].
The increased supply of FFA by high nutrients availability from obesogenic diet, significantly contributes to lipid accumulation and subsequent mitochondrial and cellular dysfunction in both skeletal and heart muscle [10,11]. Indeed, a detailed review on the increased intramuscular lipid content and its association to mitochondrial dysfunction has recently been published [12]. In contrast, nutrient restriction maintains mitochondrial function as a major site of ATP biosynthesis in both skeletal and heart muscles [13]. The FFA accumulation in both skeletal and heart muscle tissues, may depend on to the type and the duration of the obesogenic diet. The impact of obesogenic diets on free fatty acids (FFAs) has been extensively studied but non studies had particularly a focus on both short and long-term effects on the ATP biosynthesis in skeletal and heart muscle. These studies reveal that short-term exposure to high-fat diets (HFDs) or obesogenic diets has been shown to induce rapid changes in FFA profiles and metabolic parameters. Whereas. the long-term exposure to obesogenic diets results in more pronounced and persistent changes in FFA metabolism and lipid profiles [14]. The duration of the diet-induced obesity may play a crucial role in the degree of metabolic syndrome disorders, by disrupting energy metabolism through mitochondrial dysfunction, determining the extent of impairment in ATP biosynthesis [15]. During the development of obesity and metabolic syndrome, tissue FFA may increase chronically and may affect mitochondria function in both skeletal and heart muscle. Moreover, the very long period of obesogenic diet involves aging which may play a critical role in the exacerbation of metabolic diseases with the disruption of energy metabolism through mitochondrial dysfunction [16]. The prolonged intake of sucrose diet (20 to 24 weeks) has been described to induce FFA accumulation in kidney and liver which is related to obesity and oxidative stress without mitochondrial dysfunction [17,18]. Whereas short-term of sucrose intake may not lead to significant changes in mitochondrial function, but it can accelerate the process of aging as suggested elsewhere [19,20]. Moreover, it remains to establish the effect of the short, long and very long-term sucrose intake on the decline of ATP biosynthesis in skeletal and heart muscle. Therefore, the present study aims to clarify the order in which changes in FFA content may affect the mitochondrial ATP biosynthesis in skeletal and heart muscle during the development of obesity induced by high sucrose diet in Wistar rats. We hypothesized that mitochondrial ATP synthase would show a negative correlation with FFA accumulation in both tissues.
Experimental Design
Animals and Their Treatment
The experiments were conducted in compliance with the Mexican Federal Regulation for Animal Experimentation and Care (NOM-062-ZOO-2001), with permission number INC/CICUAL/003/2023 from the Committee for Care and Use of Laboratory Animals of Nacional Institute of Cardiology Ignacio Chavez (CICUAL). Male Wistar rats, aged 21 days and weighing 65 ± 5 g, were used for this study. The animals were randomly assigned to one of two experimental groups: The sucrose-fed rats (SF) received 30% commercially refined sugar dissolved in their drinking water ad libitum for different periods of 6, 12, 24, and 56 weeks. The control rats (C) were administered only tap water. All animals had ad libitum access to commercial rat chow (PMI Nutrition International, Inc., LabDiet 5008, Richmond, IN, USA) and were housed in a controlled environment maintained at 22-24 °C with a 12-hour light-dark cycle.
Following the overnight fasting period, the animals were weighed and subsequently euthanized by decapitation; the heart, soleus and red gastrocnemius muscles, were promptly excised and placed in ice-cold isolation buffer. Intra-abdominal fat was meticulously dissected from the retro-peritoneal cavity and immediately weighed. It is noteworthy that visceral and duodenal fat was excluded from this dissection procedure.
Measurement of Plasma Glucose, Cholesterol and Triglycerides
The venous blood was promptly drawn into a tube containing EDTA (0.1%) and immediately subjected to centrifugation at 600 x g for a duration of 20 minutes at a temperature of 4°C. The resultant plasma was subsequently separated and preserved at -70°C until the analyses of FFA, triglycerides, cholesterol, and glucose were conducted. The concentrations of plasma triglycerides, cholesterol, and glucose were quantitatively using enzymatic colorimetric methods, by immunoturbidimetry (Roche/Hitachi, Germany) on a Hitachi analyzer 902 (Hitachi LTD, Tokyo, Japan) [21].
FFA Extraction and Determination by Gas Chromatography (GC).
FFAs were extracted from 100 µl of plasma and from 10 mg protein of tissue homogenates in the presence of 50 and 20 µg of heptadecanoic acid as internal standard respectively. The extraction was performed using chloroform-methanol (2:1 V/V) containing 0.002% BHT as described by Folch et al. [22]. The obtained lipid residue was dissolved in 1 ml methanol containing, 0.1 ml 2,2-dimethoxypropane and 0.01 ml concentrated H2SO4 to transform FFA to their corresponding methyl esters at room temperature for 15 minutes according to the method of Tserng et al. [23] modified in our laboratory [24]. The concentration and composition of FFA methyl esters were evaluated by GC as described elsewhere [24].
Mitochondria Preparation
Mitochondria were isolated from heart and skeletal muscle by differential centrifugation. The tissues were quickly removed and homogenized in ice-cold medium containing 250 mM of sucrose, 10 mM HEPES and 1 mM of EGTA (pH:7.4), followed of differential centrifugation [25]. The final mitochondrial pellet was suspended in cold buffer containing 250 mM sucrose, 10 mM HEPES (pH: 7.4). Sample protein content was quantified by the method of Bradford [26] using bovine serum albumin for the standard curve. The fresh mitochondrial were used for the following assays of ATP Biosynthesis.
Mitochondrial Oxygen Consumption Rate (OCR)
Mitochondrial oxygen uptake was measured by using a Clark-type O2 electrode and by incubating 0.25 mg protein/ml of fresh mitochondria in an air-saturated medium containing: 125 mM KCl, 10 mM HEPES (pH adjusted to 7.4 with KOH), 10 mM EGTA, 2 mM K2HPO4, 5 mM MgCl2. Oxygen uptake was assessed by energizing mitochondria with succinate (10 mM), at 30°C. ADP (250 µM) was added to evaluate state III. State IV corresponds to oxygen uptake after ADP exhausting.
ATP Biosynthesis
ATP synthesis was measured as follows: 0.25 mg of skeletal muscle and 0.3 mg of protein in the case of heart were incubated in 20 mM Tris-HCl, 0.15 M sucrose, 1 mM ADP, 20 mM Pi, 5 mM MgCl2, 100 µM diadenosinepentaphosphate to inhibit adenylate kinase, 10 mM glucose, 37.5 Unit/ml hexokinase (Sigma, type IV), pH 7.5. Samples (0.4 ml) were incubated at 37°C with vigorous shaking for maximal oxygenation. Reaction was started with 20 mM succinate and arrested at desired time with 25 mM EDTA, 10 µM CCCP and immediately transferred to ice. Samples were transferred to Eppendorf tubes, boiled for 10 min, and centrifuged (10,000 x g,10 min) to removed denatured protein. In supernatants, the synthesized glucose-6-phosphate was oxidized by NADP in the presence of 3 units of glucose-6 phosphate dehydrogenase. NADPH formation was monitored at 340 nm until completion. ATP formation was calculated after correction for trapping efficiency of hexokinase, which was determined by adding know amounts of ATP to the reaction mixture in the absence of succinate [27]. In other experiments series, the mitochondria were incubated with different concentrations oleic acid (2.5, 5 and 10 µM) and in the presence of 0.5 mM GDP, an inhibitor of UCPs, and was added to the reaction medium at the start of the experiment.
Western Blot Analysis of UCPs, IF1 and Mitochondrial Respiratory Complex V
Forty μg of mitochondria or tissue homogenate protein was loaded in SDS-PAGE gel whose acrylamide percentage depends on the molecular weight of proteins to analyze as indicated in figure legends. The electrophoresis was run for 3 hours at 120 V. The protein transfer was performed on PVDF membrane (polyvinyldene floride, pore size 0.22 μm, Millipore Corporation) at 20 V for 30 min in a wet chamber of transfer (Invitrogen, Trans Blot SD). The non-specific protein detection was reduced by blocking membranes in tris buffer saline (TBS) (25 mM tris base, 150 mM NaCl) solution containing 1% albumin free-fatty acid and 0.1 % Tween 20 for one hour at room temperature. After washing with TBS three times, the membranes were incubated with the total OXPHOS rodent WB Antibody Cocktail (Abcam) at a concentration of 1:3000. This cocktel contain antibodies anti complex V ATP 5A subunit (ATP synthase 5A), For ATPase inhibitor protein F1 (IF1), UCP2 and UCP3, the antibodies against IF1 and against UCP2 and UCP3 were also purchased from ABCAM corporation, and were used at a dilution of 1:1000 in TBS-Tween (0.1%) under gentle agitation overnight at 4 °C. At the end of incubation, the membranes were washed 3 times with TBS-Tween (0.1 %) for 5 min each, and twice with TBS for 10 minutes each. As a secondary antibody, anti-rabbit IgG peroxidase conjugate was used at a dilution of 1:1000 in TBS-Tween (0.1 %) at room temperature for 2 hours. The membranes were subsequently washed 5 times, twice with TBS-Tween (0.1 %) and three times with only TBS; proteins were revealed by chemiluminescent reagent (Immobilon, Millipore). Membranes were exposed to image plates (BioMax Kodar) for 5 min. The bands obtained were analyzed by an UVP image analyzer (Inc, Upland, CA, USA). For loading control, the same membrane was incubated in a solution of 40 mM SDS, and 250 mM glycine (pH: 2) for 30 min to remove reagents and antibodies used above. Subsequently incubated in TBS-Tween (0.1 %) solution containing 1% free fatty acid albumin for 1 hour, the membrane was then treated as described above but, in this case, it was treated with VDAC and GAPDH antibodies as a control load according to the tissue analyzed.
Statistical Analysis
All statistical analysis were performed using GraphPad Prism version 8.2.1 for Windows (GraphPad Software, Boston, Massachusetts USA). All values are presented as means ± SD. The differences between groups were determined by one-way ANOVA for selected variables flowed by ad hoc Tuckey test. The number of animals used for each analysis is indicated in the Figure and Table legends. The differences between group mean were considered significant when p<0.05.
Results
General Characteristics of Animals
Table 1 shows that the administration of sucrose at 30% in drinking water of Wistar rats, increases intraabdominal fat accumulation, plasma triglycerides and FFA concentrations at the end of different sucrose treatment periods of animals. It also shows that all measured variables tend to increase with age but not all reached a statistically significant difference. Adipose tissue amount starts to display a significant difference (p<0.01) between control and SF rats after the sucrose treatment period of 12 week. Whereas triglycerides start to increase at short period of 6 weeks of sucrose uptake of rats in plasma from SF rats when compared with C rats and this increase in triglycerides is every time more significant during the two long periods of sucrose treatment (24 and 56 weeks). In regard to plasma FFA, table 1 shows that their concentrations in plasma starts to significantly increase at 12 weeks of
Al values correspond to mean ± SD of 7 to 8 animals. C correspond to control rats and SF corresponds to sucrose-fed rats. The differences between groups were determined by one-way ANOVA for selected variables followed by Tuckey test. * p<0.01 corresponds to C vs SF at same age or period of sucrose treatment, $ p<0.01 between ages and between periods of sucrose treatment in the same group.sucrose treatment of rats, and the differences between C and SF rats increase as well as the periods of sucrose treatment increase. Our finding is that, the longer the animals consumed sucrose, the greater the difference in TG, FFAs and fat accumulation between the two groups. In regard to the body weight table 1 do not show significant changes between the two groups during the first 24 weeks period of sucrose diet. However, at 56 weeks of sucrose treatment increases significantly the body weight of the SF rats as compared with its corresponding C rats. About the plasma glucose and cholesterol concentrations, no differences were observed between animals and nor the treatment period could influence these two parameters (Table 1).
Skeletal and Heart Muscle FFA Content
Figure 1 shows the FFA composition in skeletal and heart muscle homogenates, induced by different periods of sucrose diet. Palmitic, palmitoleic and oleic acid concentrations start to significantly increase in skeletal muscle homogenate from the 12-week period of sucrose treatment of rats (Figures 1A, 1B and 1C); and the difference between C and SF rats increases as well as the periods of sucrose treatment increase. In C rats, on the other hand, there is an age-related increase in the concentrations of the three fatty acids mentioned above, without reaching a statistically significant difference. Finally, the observed changes in the concentrations of each of the identified fatty acids are reflected in the increase in total FFA concentrations that are related to both the sucrose diet treatment period and age, as shown in figure 1D. In heart muscle homogenate, there was no change in palmitic, palmitoleic and oleic acid concentrations with age, nor with the period treatment of sucrose (Figures 1E to 1G). In the same way no changes in the concentration of total FFA were found in heart muscles at any period of sucrose diet (Figure 1H).
Mitochondria Oxygen Consumption Rates (OCR)
Table 2 shows the OCR of mitochondria oxidizing succinate as a substrate of complex II in both states III and IV and in the presence of rotenone. In skeletal muscle mitochondria, the OCR oxidizing succinate only and in the presence of ADP (state III) decreases with age in C rats and also decrease as well as the duration of sucrose intake in SF rats increase. At 56 weeks of age, OCR in C rats is significantly reduced compared to 6 weeks of age (69.9±10.8 vs 121.0±7.2 nmol O2/min/mg protein; p<0.05). In SF rats after 56 weeks of sucrose intake, mitochondrial OCR is also significantly reduced compared to 6 weeks of sucrose intake (50.08±7.1 vs 115.6±9.15 nmol O2/min/mg protein; P<0.01).
On the other hand, in state IV after ADP depletion, mitochondrial OCR increased significantly after 56 weeks of sucrose intake compared with 6 weeks of sucrose intake (27.4±2.8 vs 22.1±3.1 nmol (O2)/min/mg protein; p<0.05). Whereas in skeletal muscle from C rats, the aging did not affect state IV mitochondrial OCR.
In heart muscle mitochondria, the OCR oxidizing succinate in the presence of ADP (state III) decreased with age in C rats (61.7±8.9 vs 118.8±10.2 nmol (O2) /min /mg protein; p<0.05) and with the duration of sucrose intake in SFR (50.8±16.4 vs. 95.6±14.8, p<0.05). However, no differences in OCR were found between C and SF rats at any age or sucrose intake period. Regarding the state IV corresponding to the ADP depletion, no differences in OCR were observed between mitochondria from C and SF rats at any age or sucrose intake period (see Table 2).
ATP Biosynthesis in Skeletal and Heart Muscles
In skeletal muscle, the short periods of sucrose diet (6 and 12 weeks) did not influence the ATP synthase activity (Figure 2A). Whereas, long and very long periods (24 and 56 weeks) of obesogenic diet, significantly decrease the activity of ATP synthase in mitochondria from skeletal muscle of SF rats as compared with that from C rats (30.1±6.4 vs 47.8±5.6 nmol/min/mg protein at 24 weeks (p<0.001) and 24.2±4.9 vs 38.8±3.29 at 56 weeks (p<0.001)). In addition, a slight decrease in the ATP activity was observed according to the age in C rats but did not reach a significant difference. This activity of ATP synthase in mitochondria from skeletal muscle is sensitive to oligomycin independently of the period of sucrose treatment nor of the age in C rats (Figure 2A).
In heart muscle, ATP synthase activity was examined and Figure 3B shows that there is no difference in ATP synthase activity between mitochondria from C and SF rats at the end of any sucrose treatment period. However, a slow decrease in ATP synthase activity is observed in C rats according to age without reaching a significant difference. As described above for skeletal muscle, ATP synthase activity in heart muscle was found sensitive to oligomycin and this sensitivity is independent on the period of the diet rich in sucrose nor of the age of animals (Figure 2B).
Effect of Oleic Acid on ATP Synthase Activity in Skeletal and Heart Muscles
The figure 3 shows that oleic acid inhibits the biosynthesis of ATP in a dose dependent manner in mitochondria from skeletal and heart muscles. At short period of sucrose diet (6 and 12 weeks), oleic acid, at all concentrations assayed, inhibits ATP synthase activity in the mitochondria from skeletal muscle of C rats in a similar manner as it does in the mitochondria of SF rats (Figure 3A and 3B). However, at long period of sucrose diet (24 and 56 weeks), the ATP synthase activity in mitochondria from skeletal muscle of both C and SF rats, shows a more sensitivity to oleic acid at any concentration assayed than that from mitochondria of 6 and 12 weeks-period treatment (Figure 3C and 3D). At long and very long periods of sucrose treatment (24 and 56 weeks) oleic acid at high concentration (10 µM) exhibits an inhibition by more than 90% approximately, of the ATP synthase activity in mitochondria from skeletal muscle of both C and SF rats (Figure 3C, 3D).
At 10 µM, oleic acid inhibition of ATP biosynthesis in mitochondria from skeletal muscle is abolished by 0.5 mM of GDP, a physiological inhibitor of UCPs at all periods of sucrose consumption being more appreciated in SF than C rats at the end of 56 weeks of sucrose diet and age.
In heart muscle, oleic acid inhibits the ATP synthase in a doses-response and equally in both type of C and SF mitochondria (Figure 4). At high concentration (10 µM) at short period of sucrose diet Figure 3E and F) oleic acid partially inhibits the ATP synthase. Whereas at long period of sucrose diet (24 and 56 weeks) 10 µM oleic acid significantly inhibit the biosynthesis of ATP by 90% approximately in both SF and C rats. The inhibition of the ATP biosynthesis by oleic acid at 10 µM was partially abolished by GDP at short period of sucrose diet 6 and 12 weeks). Whereas at long period of sucrose diet the activity of ATP synthase is recuperated by approximately 90 % in both type of mitochondria (Figure 3H ,G).
Analysis of Protein Involved in ATP Biosynthesis
Figure 4 shows a Western blot analysis of UCP2 and 3 in skeletal and heart muscles at the end of different periods of sucrose consumption in comparison with C animals.
In skeletal muscle mitochondria, UCP2 and UCP3 assays showed no significant age- or diet-dependent differences between the optical densities (O.D.) of UCP2 and 3 from C and SF rats mitochondria (Figure 4A). In mitochondria from heart of C rats, the O.D. of UCP2 and 3 bands increase as well as the age increase. In mitochondria from heart muscle of SF rats, the O.D. of UCP2 and 3 increase as well as the periods of sucrose diet increase but, in same grade, as compared with mitochondria from C rats (Figure 4B).
With regard to the ATP 5A subunits, figure 5 shows the western blot images of the different bands of the protein from skeletal at the bottom of panel A and of heart muscle at the bottom of panel B. Figures 5A shows no difference in the ratio of O.D. ATP 5A/O.D. GAPDH between C and SF rats nor between the different periods of sucrose treatment and ages in skeletal muscle.
In heart muscle, the analysis of the ATP5 subunit, did not show a significant differences between the two groups of animals, neither it was affected by the duration of sucrose intake or by aging in CR (Figure 5B).
In the case of the ATPase inhibitory factor 1 (IF1), figure 6A and 6B show and increase in the O.D. of the bands corresponding to the IF1 protein in mitochondria from both skeletal and heart muscle with sucrose diet, and this increase do not depend on the period of sucrose diet.
Discussion
The increasing statistical differences in the lipid metabolism parameters such as fat accumulation, plasma FFAs and TGs between C and SF rats is associated with the Increased duration periods of sucrose treatment. The longer the duration of the sucrose treatment period increases, the more pronounced the effect on lipid metabolism. The induced changes in FFA and TG concentrations and in the amount of intra-abdominal fat reflect increased lipogenic activity at any period of high sucrose consumption. In addition, the long and very long periods of sucrose treatment exacerbate the lipogenic activity which results in an accumulation of palmitic, palmitoleic and oleic acids in skeletal muscle homogenate more than in heart muscle. Such accumulation of FFA in skeletal muscle is a marker of altered lipid metabolism and lipotoxicity [28], and it is due to the impaired capacity of skeletal muscle to oxidize fatty acids which contributes to the accumulation of FFA and further impairing fatty acid and glucose metabolism [29]. However, the non-accumulation of FFA in heart muscle may be attributed to the high energy demand in the heart, where the major ATP synthesis comes more from the fatty acid beta-oxidation than glycolysis compared with skeletal muscle.
Among FFA accumulated in skeletal muscle homogenate are palmitoleic and oleic acids which are the products of the elongation and desaturation of PA [17]. The elongation and desaturation processes are considered as an act of detoxification of PA to favor its incorporation as palmitoleic and oleic acids in TG, that in turn accumulates in adipose and non-adipose tissue to prevent the adverse effects of the excess PA as reviewed recently [28,30].
The increased FFA accumulation in skeletal muscle homogenate, particularly PA and oleic acid after a long periods of sucrose intake, is associated with the impaired ATP biosynthesis in mitochondria from skeletal muscle. The negative correlation between skeletal FFA and ATP synthase activity suggests the influence of FFA on the biosynthesis of ATP in SFR (Figure 7). Unlike skeletal muscle, the heart muscle did not present a significant association between ATP synthase activity and FFA acid accumulation suggesting a resistance to the sucrose diet induced both alterations.
A less accumulation of FFA in the heart may be attributed to the fatty acids beta-oxidation activity as an essential process for ATP generation in heart. Indeed, FFAs activated to FA-CoA, serves as substrates source for ATP synthesis after their conversion to acetyl-CoA through mitochondrial β-oxidation and the synthesis of NADH and FAD in the tricarboxylic acid cycle which transfer electrons to mitochondrial respiratory complexes for ATP biosynthesis [31]. Our finding suggests that the reduction of ATP biosynthesis in skeletal muscle, can be due to detrimental effects of FFA on mitochondrial function. FFAs has been described to reduce the mitochondrial membrane potential affecting the electron transport chain function and mitochondrial ATP synthesis [32], and also by decreasing the expression of the beta subunit of ATP synthase[33]. In addition, mitochondria dysfunction characterized by uncoupling ATP biosynthesis is well known to be related to fat accumulation and metabolic syndrome [34].
Several mechanisms to decrease ATP synthesis in cells through excessive FFAs has been reported [35]. One of them, is the high availability of FFA to activate UCPs uncoupling OXPHOS and to reduce ATP biosynthesis. In our study, the interplay between UCPs and ATP production, is demonstrated by using oleic acid and GDP as activator and inhibitor of UCPs respectively. Oleic acid inhibits ATP biosynthesis in a doses response and this inhibition is sensitive to GDP suggesting the participation of UCPs in the uncoupling of the ATP biosynthesis. In addition, mitochondria from both heart and skeletal muscle of SFR exhibit higher ATP biosynthesis inhibition compared to C rats when challenged with oleic acid at low concentration (2.5 µM). Moreover, this sensitivity to oleic acid increase as well as the duration of sucrose treatment increase. In both skeletal and heart muscles, UCP2 and UCP3, has been described to influence ATP production and energy expenditure [36]. In mitochondria from heart muscle our findings indicate that both UCP2 and 3 expressions increase with age in mitochondria from C rats equally to those from SF rats and did not change with the period of sucrose treatment. as described elsewhere [37]. UCP3 has been described to protect against lipotoxicity by managing fatty acid oxidation and energy dissipation in muscles [7] improving mitochondrial functionality [6,38]. In heart muscle the influence of sucrose-rich diet on the expression of UCP2 and UCP3 involves various molecular mechanisms including oxidative stress and inflammation, which in turn elevate the expression of UCPs as a protective response against mitochondrial lipotoxicity and cell apoptosis [39].
In this study, the increased content of UCP2 appears to be more related to the age than to the fat and FFA accumulation, suggesting an adaptive response to mitigate oxidative stress related to aging [40]. In previous study, high-sucrose diet for 24 weeks have been described to increase the levels of UCP2 in liver mitochondria in response to enhanced ROS generation [41]. Indeed, the UCP2 over-expression has been described to play a dual role in obesity. On one hand, UCP2 can protect against oxidative stress by dissipating the proton gradient. On the other hand, its overexpression results in a reduction in ATP biosynthesis [42]. In heart muscle, it was reported that UCP3 plays a significant role in exporting non-esterified fatty acid anions from the mitochondrial matrix, thereby preventing their accumulation and lipotoxicity [43,44]. Moreover, it has been demonstrated that proton leak decreases mitochondrial respiratory efficiency in aged cardiomyocytes [45] and impact the ATP synthase activity, which may contribute to heart dysfunction in the aging. On the other hand it has been reported that in muscle cells UCP3 and 2 overexpression, do not influence the ATP biosynthesis nor the mitochondria function [46] but it promote fatty acid oxidation, especially under conditions of high fatty acid availability, thereby preventing cytosolic triglyceride storage [47].
In skeletal muscle form SF rats, FFA accumulation may contribute to energy regulation by uncoupling OXPHOS, or by the direct inhibition of adenine nucleotide translocase (ANT) and ATP synthase, thereby modulating ATP production [48]. Our finding, show that the reduction in ATP synthase activity in skeletal muscle correlates inversely with the accumulation of total FFA and oleic acid (Figure 7). When total FFA or oleic acid levels reached the maximal concentrations per mg protein, ATP biosynthesis is significantly depressed. This means that as the amount of fatty acid increases, its ability to regulate uncoupling or to inhibit the ATP biosynthesis also increases.
In skeletal muscle of SF rats, the decrease of ATP biosynthesis in mitochondria can be also due to the possible alterations in the content or to the changes in mitochondrial respiratory chain complexes which need a further investigation. Mitochondria ATP 5A, a marker of the complex V and key step in ATP generation is carried out by a set of protein complexes in the electron transport chain which were analyzed in the current study. The no differences between mitochondria from C and SF rats in the ATP5 (complex V) suggests that the decreased ATP synthesis is not related to the amount of ATP 5 subunit which reflect the expression of ATP synthase.
Mitochondrial ATP biosynthesis is also regulated by the ATP synthase inhibitory factor 1 (IF1), a protein found increased in heart and skeletal muscle from SFR. The IF1 is a nuclear-encoded protein that interacts and suppresses the hydrolysis activity of ATP synthase.
The role of IF1 in obesity-related metabolic disorder is not well understood and need further investigation. However, the increased IF1 in mitochondria from both tissue of SF rats allow us to speculate that IF1 may participate in the regulation of ATP biosynthesis. Indeed, the upregulation of IF1 in hearts subjected to pressure overload, suggests a maladaptive response in obesity-related cardiac hypertrophy and can lead to enhanced glycolysis and altered energy metabolism, which are detrimental under pathological conditions [49, 50]. In contrast, IF1 depletion protects the heart from pressure overload-induced cardiac hypertrophy [49]. Moreover, the overexpression of IF1 in skeletal and heart muscle can be considered as a response to the shift from oxidative to glycolysis metabolisms, which may exacerbate metabolic dysfunctions associated with metabolic syndrome as described elsewhere [51]. In contrast, IF1 deficiency, leads to increased ATP production and increased maximal oxygen consumption, which correlate with improved exercise capacity [52]
Indeed, IF1 knockout mice when subjected to high fat diet it shows a substantially slower increase of body weight and had less fat mass [53]. These observations suggest that IF1 may play a regulatory role in energy metabolism that may influence diseases such as metabolic syndrome and require further study. Moreover, IF1 inhibition may serve as a potential therapeutic target in treating pathological cardiac hypertrophy and heart failure.
In summary, our study indicates that long period of sucrose diet impairs ATP synthase activity, which is crucial for ATP production in mitochondria from skeletal muscle and did not affected in heart muscle. ATP biosynthesis impairment in skeletal muscle is linked to the FFA accumulation induced by long and very long period of obesogenic diet, and as the concentration of FFA increases, their ability to induce uncoupling and inhibit ATP biosynthesis also rises. In the case of oleic acid as a free fatty acid, it acts as protonophoric uncouplers, facilitating the dissipation of the proton gradient across the mitochondrial membrane and reducing the ATP biosynthesis. Moreover, the sensitivity of ATP biosynthesis to oleic acid increases as well as the duration of sucrose treatment increase. In both skeletal and heart muscles, this sensitivity can be attributed to the UCP2 and UCP3 expression, which has been described to influence ATP production and energy expenditure. This study also established that the expression of IF1 was elevated in all groups that were administered a sucrose diet, irrespective of the duration of sucrose treatment. However there is no relationship between fatty acid levels and IF1 expression. Moreover the provided literature does not establish a correlation between increasing fatty acid levels and IF1 expression, it highlights the possible regulatory mechanisms of transcription factors that may influence gene expression, including those related to energy metabolism. In addition FFA effects on ROS production, and mitochondria dysfunction in the context of obesity, can be involved in several mechanisms to reduce ATP production. Thus. to understand these mechanisms is critical for developing therapeutic strategies to mitigate the adverse effects of FFA-induced uncoupling in metabolic diseases.
Acknowledgments
Vianey Nava-Aguilera is a doctoral student from Programa de Doctorado en Ciencias Biomédicas, Universidad Nacional Autónoma de México (UNAM) and received fellowship from CONAHCYT. The work was partially supported by Grant 106845 to MEH from CONAHCYT, Mexico and Instituto Nacional de Cardiología, Ignacio. Chavez
Conflicts of Interest
The authors declare no conflicts of interest.
References
- D. Shao, S.C. Kolwicz, P. Wang, N.D. Roe, O. Villet, K. Nishi, Y.-W.A. Hsu, G. V. Flint, A. Caudal, W. Wang, M. Regnier, R. Tian, Increasing Fatty Acid Oxidation Prevents High-Fat Diet–Induced Cardiomyopathy Through Regulating Parkin-Mediated Mitophagy. Circulation 2020, 142, 983–997. [Google Scholar] [CrossRef] [PubMed]
- S. Nesci, S. Rubattu, UCP2, a Member of the Mitochondrial Uncoupling Proteins: An Overview from Physiological to Pathological Roles. Biomedicines 2024, 12, 1307. [Google Scholar] [CrossRef]
- A. M. Bertholet, A.M. Natale, P. Bisignano, J. Suzuki, A. Fedorenko, J. Hamilton, T. Brustovetsky, L. Kazak, R. Garrity, E.T. Chouchani, N. Brustovetsky, M. Grabe, Y. Kirichok, Mitochondrial uncouplers induce proton leak by activating AAC and UCP1. Nature 2022, 606, 180–187. [Google Scholar] [CrossRef]
- L. Križančić Bombek, M. Čater, Skeletal Muscle Uncoupling Proteins in Mice Models of Obesity. Metabolites 2022, 12, 259. [Google Scholar] [CrossRef]
- M. Čater, L.K. Križančić Bombek, Protective Role of Mitochondrial Uncoupling Proteins against Age-Related Oxidative Stress in Type 2 Diabetes Mellitus. Antioxidants 2022, 11, 1473. [Google Scholar] [CrossRef]
- L. Della Guardia, L. Luzi, R. Codella, Muscle-UCP3 in the regulation of energy metabolism. Mitochondrion 2024, 76, 101872. [Google Scholar] [CrossRef]
- M. Nabben, J. Hoeks, Mitochondrial uncoupling protein 3 and its role in cardiac- and skeletal muscle metabolism. Physiol Behav 2008, 94, 259–269. [Google Scholar] [CrossRef]
- G. D. Lopaschuk, Q.G. Karwi, R. Tian, A.R. Wende, E.D. Abel, Cardiac Energy Metabolism in Heart Failure. Circ Res 2021, 128, 1487–1513. [Google Scholar] [CrossRef]
- S. Boudina, Y.H. Han, S. Pei, T.J. Tidwell, B. Henrie, J. Tuinei, C. Olsen, S. Sena, E.D. Abel, UCP3 Regulates Cardiac Efficiency and Mitochondrial Coupling in High Fat–Fed Mice but Not in Leptin-Deficient Mice. Diabetes 2012, 61, 3260–3269. [Google Scholar] [CrossRef]
- X. Zhang, M. Mao, Z. Zuo, Palmitate Induces Mitochondrial Energy Metabolism Disorder and Cellular Damage via the PPAR Signaling Pathway in Diabetic Cardiomyopathy. Diabetes Metab Syndr Obes Volume 2022, 15, 2287–2299. [Google Scholar] [CrossRef]
- Haas de Mello, G.K. Ferreira, G.T. Rezin, Abnormal mitochondrial metabolism in obesity and insulin resistance, in: Clinical Bioenergetics, Elsevier, 2021: pp. 83–92. [CrossRef]
- Y. Li, S. Xu, X. Zhang, Z. Yi, S. Cichello, Skeletal intramyocellular lipid metabolism and insulin resistance. Biophys Rep 2015, 1, 90–98. [Google Scholar] [CrossRef]
- B. J. Berry, E. Mjelde, F. Carreno, K. Gilham, E.J. Hanson, E. Na, M. Kaeberlein, Preservation of mitochondrial membrane potential is necessary for lifespan extension from dietary restriction. Geroscience 2023, 45, 1573–1581. [Google Scholar] [CrossRef]
- S. Y. Sun, W.Y. Yang, Z. Tan, X.Y. Zhang, Y.L. Shen, Q.W. Guo, G.M. Su, X. Chen, J. Lin, D.Z. Fang, Serum Levels of Free Fatty Acids in Obese Mice and Their Associations with Routine Lipid Profiles. Diabetes Metab Syndr Obes Volume 2022, 15, 331–343. [Google Scholar] [CrossRef] [PubMed]
- G. de O. Lemos, R.S. Torrinhas, D.L. Waitzberg, Nutrients, Physical Activity, and Mitochondrial Dysfunction in the Setting of Metabolic Syndrome. Nutrients 2023, 15, 1217. [Google Scholar] [CrossRef]
- P. Owesny, T. Grune, The link between obesity and aging - insights into cardiac energy metabolism. Mech Ageing Dev 2023, 216, 111870. [Google Scholar] [CrossRef] [PubMed]
- M. El Hafidi, A. Cuéllar, J. Ramı́rez, G. Baños, Effect of sucrose addition to drinking water, that induces hypertension in the rats, on liver microsomal Δ9 and Δ5-desaturase activities. J Nutr Biochem 2001, 12, 396–403. [Google Scholar] [CrossRef]
- Ruiz-Ramírez, M. Chávez-Salgado, J.A. Peñeda-Flores, E. Zapata, F. Masso, M. El-Hafidi, High-sucrose diet increases ROS generation, FFA accumulation, UCP2 level, and proton leak in liver mitochondria, Am J Physiol Endocrinol Metab 301 (2011). [CrossRef]
- P. Owesny, T. Grune, The link between obesity and aging - insights into cardiac energy metabolism. Mech Ageing Dev 2023, 216, 111870. [Google Scholar] [CrossRef]
- B. Drew, S. Phaneuf, A. Dirks, C. Selman, R. Gredilla, A. Lezza, G. Barja, C. Leeuwenburgh, Effects of aging and caloric restriction on mitochondrial energy production in gastrocnemius muscle and heart, American Journal of Physiology-Regulatory. Integrative and Comparative Physiology 2003, 284, R474–R480. [Google Scholar] [CrossRef]
- G. C. Cardoso-Saldaña, N.E. Antonio-Villa, M. del R. Martínez-Alvarado, M. del C. González-Salazar, R. Posadas-Sánchez, Low HDL-C/ApoA-I index is associated with cardiometabolic risk factors and coronary artery calcium: a sub-analysis of the genetics of atherosclerotic disease (GEA) study. BMC Endocr Disord 2024, 24, 110. [Google Scholar] [CrossRef]
- G. H. FOLCH, J., LEES, M., & SLOANE STANLEY, A simple method for the isolation and purification of total lipides from animal tissues. J Biol Chem 1957, 226, 497–509. [Google Scholar]
- S. C. Tserng, K. Y., Kliegman, R. M., Miettinen, E. L., & Kalhan, A rapid, simple, and sensitive procedure for the determination of free fatty acids in plasma using glass capillary column gas-liquid chromatography. J Lipid Res 1981, 22, 852–858. [Google Scholar]
- M. El Hafidi, I. Pérez, J. Zamora, V. Soto, G. Carvajal-Sandoval, G. Baños, Glycine intake decreases plasma free fatty acids, adipose cell size, and blood pressure in sucrose-fed rats, American Journal of Physiology-Regulatory. Integrative and Comparative Physiology 2004, 287, R1387–R1393. [Google Scholar] [CrossRef]
- M. E. Vázquez-Memije, V. Izquierdo-Reyes, G. Delhumeau-Ongay, The insensitivity to uncouplers of testis mitochondrial ATPase. Arch Biochem Biophys 1988, 260, 67–74. [Google Scholar] [CrossRef]
- M. M. Bradford, A rapid and sensitive method for the quantitation of microgram quantities of protein utilizing the principle of protein-dye binding. Anal Biochem 1976, 72, 248–254. [Google Scholar] [CrossRef]
- J. J. Garcı́a, I. Ogilvie, B.H. Robinson, R.A. Capaldi, Structure, Functioning, and Assembly of the ATP Synthase in Cells from Patients with the T8993G Mitochondrial DNA Mutation. Journal of Biological Chemistry 2000, 275, 11075–11081. [Google Scholar] [CrossRef]
- E. Front Nutr 9 ( 2022. [CrossRef]
- E. E. Blaak, Characterisation of fatty acid metabolism in different insulin-resistant phenotypes by means of stable isotopes. Proceedings of the Nutrition Society 2017, 76, 419–424. [Google Scholar] [CrossRef]
- Z. A. Ceja-Galicia, C.L.A. Cespedes-Acuña, M. El-Hafidi, Protection Strategies Against Palmitic Acid-Induced Lipotoxicity in Metabolic Syndrome and Related Diseases. Int J Mol Sci 2025, 26, 788. [Google Scholar] [CrossRef]
- M. M. Adeva-Andany, N. Carneiro-Freire, M. Seco-Filgueira, C. Fernández-Fernández, D. Mouriño-Bayolo, Mitochondrial β-oxidation of saturated fatty acids in humans. Mitochondrion 2019, 46, 73–90. [Google Scholar] [CrossRef]
- M. A. Abdul-Ghani, F.L. Muller, Y. Liu, A.O. Chavez, B. Balas, P. Zuo, Z. Chang, D. Tripathy, R. Jani, M. Molina-Carrion, A. Monroy, F. Folli, H. Van Remmen, R.A. DeFronzo, Deleterious action of FA metabolites on ATP synthesis: possible link between lipotoxicity, mitochondrial dysfunction, and insulin resistance. American Journal of Physiology-Endocrinology and Metabolism 2008, 295, E678–E685. [Google Scholar] [CrossRef]
- J. Mei, M. Park, D.A. York, C. Erlanson-Albertsson, Fatty acids and glucose in high concentration down-regulates ATP synthase β-subunit protein expression in INS-1 cells. Nutr Neurosci 2007, 10, 273–278. [Google Scholar] [CrossRef]
- V. Rzheshevsky, Decrease in ATP biosynthesis and dysfunction of biological membranes. Two possible key mechanisms of phenoptosis. Biochemistry (Moscow) 2014, 79, 1056–1068. [Google Scholar] [CrossRef]
- Z. Long, X. Zhang, Q. Sun, Y. Liu, N. Liao, H. Wu, X. Wang, C. Hai, Evolution of metabolic disorder in rats fed high sucrose or high fat diet: Focus on redox state and mitochondrial function. Gen Comp Endocrinol 2017, 242, 92–100. [Google Scholar] [CrossRef] [PubMed]
- P. Schrauwen, M. Hesselink, UCP2 and UCP3 in muscle controlling body metabolism. Journal of Experimental Biology 2002, 205, 2275–2285. [Google Scholar] [CrossRef] [PubMed]
- Hespel, Hyperglycemic diet and training alter insulin sensitivity, intramyocellular lipid content but not UCP3 protein expression in rat skeletal muscles. Int J Mol Med 25 ( 2010. [CrossRef]
- E.E. Pohl, A. E.E. Pohl, A. Rupprecht, G. Macher, K.E. Hilse, Important Trends in UCP3 Investigation. Front Physiol 10 (2019). [CrossRef]
- Y. HE, N. WANG, Y. SHEN, Z. ZHENG, X. XU, Inhibition of high glucose-induced apoptosis by uncoupling protein 2 in human umbilical vein endothelial cells. Int J Mol Med 2014, 33, 1275–1281. [Google Scholar] [CrossRef] [PubMed]
- C. Pheiffer, C. Jacobs, O. Patel, S. Ghoor, C. Muller, J. Louw, Expression of UCP2 in Wistar rats varies according to age and the severity of obesity. J Physiol Biochem 2016, 72, 25–32. [Google Scholar] [CrossRef]
- Ruiz-Ramírez, M. Chávez-Salgado, J.A. Peñeda-Flores, E. Zapata, F. Masso, M. El-Hafidi, High-sucrose diet increases ROS generation, FFA accumulation, UCP2 level, and proton leak in liver mitochondria. American Journal of Physiology-Endocrinology and Metabolism 2011, 301, E1198–E1207. [Google Scholar] [CrossRef]
- Ruiz-Ramirez, O. Lopez-Acosta, M. Barrios-Maya, M. El-Hafidi, Uncoupling Protein Overexpression in Metabolic Disease and the Risk of Uncontrolled Cell Proliferation and Tumorigenesis. Curr Mol Med 2018, 17, 598–607. [Google Scholar] [CrossRef]
- K.E. Hilse, A. K.E. Hilse, A. Rupprecht, M. Egerbacher, S. Bardakji, L. Zimmermann, A.E.M.S. Wulczyn, E.E. Pohl, The Expression of Uncoupling Protein 3 Coincides With the Fatty Acid Oxidation Type of Metabolism in Adult Murine Heart, Front Physiol 9 (2018). [CrossRef]
- P. Schrauwen, J. Hoeks, G. Schaart, E. Kornips, B. Binas, G.J. Vusse, M. Bilsen, J.J.F.P. Luiken, S.L.M. Coort, J.F.C. Glatz, W.H.M. Saris, M.K.C. Hesselink, Uncoupling protein 3 as a mitochondrial fatty acid anion exporter. The FASEB Journal 2003, 17, 2272–2274. [Google Scholar] [CrossRef]
- H. Zhang, N.N. H. Zhang, N.N. Alder, W. Wang, H. Szeto, D.J. Marcinek, P.S. Rabinovitch, Reduction of Elevated Proton Leak Rejuvenates Mitochondria in the Aged Cardiomyocyte, (2020). [CrossRef]
- J. D. MacLellan, M.F. Gerrits, A. Gowing, P.J.S. Smith, M.B. Wheeler, M.-E. Harper, Physiological Increases in Uncoupling Protein 3 Augment Fatty Acid Oxidation and Decrease Reactive Oxygen Species Production Without Uncoupling Respiration in Muscle Cells. Diabetes 2005, 54, 2343–2350. [Google Scholar] [CrossRef] [PubMed]
- L. Della Guardia, L. Luzi, R. Codella, Muscle-UCP3 in the regulation of energy metabolism. Mitochondrion 2024, 76, 101872. [Google Scholar] [CrossRef] [PubMed]
- J. Ciapaite, S.J.L. Bakker, M. Diamant, G. Van Eikenhorst, R.J. Heine, H. V. Westerhoff, K. Krab, Metabolic control of mitochondrial properties by adenine nucleotide translocator determines palmitoyl-CoA effects. FEBS J 2006, 273, 5288–5302. [Google Scholar] [CrossRef] [PubMed]
- K. Yang, Q. Long, K. Saja, F. Huang, S.M. Pogwizd, L. Zhou, M. Yoshida, Q. Yang, Knockout of the ATPase inhibitory factor 1 protects the heart from pressure overload-induced cardiac hypertrophy. Sci Rep 2017, 7, 10501. [Google Scholar] [CrossRef]
- M. G. Pavez-Giani, P.I. Sánchez-Aguilera, N. Bomer, S. Miyamoto, H.G. Booij, P. Giraldo, S.U. Oberdorf-Maass, K.T. Nijholt, S.R. Yurista, H. Milting, P. van der Meer, R.A. de Boer, J. Heller Brown, H.W.H. Sillje, B.D. Westenbrink, ATPase Inhibitory Factor-1 Disrupts Mitochondrial Ca2+ Handling and Promotes Pathological Cardiac Hypertrophy through CaMKIIδ. Int J Mol Sci 2021, 22, 4427. [Google Scholar] [CrossRef]
- L. Guo, Z. Front Oncol 13 ( 2023. [CrossRef]
- R. Domin, M. Pytka, J. Niziński, M. Żołyński, A. Zybek-Kocik, E. Wrotkowska, J. Zieliński, P. Guzik, M. Ruchała, ATPase Inhibitory Factor 1—A Novel Marker of Cellular Fitness and Exercise Capacity? Int J Mol Sci 2022, 23, 15303. [Google Scholar] [CrossRef]
- F. Diabetes 67 ( 2018. [CrossRef]
Figure 1.
Effect of different period of sucrose intake on various FFA concentrations in skeletal (Panels A to D) and heart muscle (panel E to H) homogenate. Black bars correspond to SF rats and open bars correspond to C rats. For more details of FFA extraction and their GC analysis see Methods section. The values correspond to the mean ± SD of 6 to 7 different samples from different animals. Horizontal square brackets indicate the significant differences between groups and the corresponding p-value (* p<0.05 and ** p<0.01).
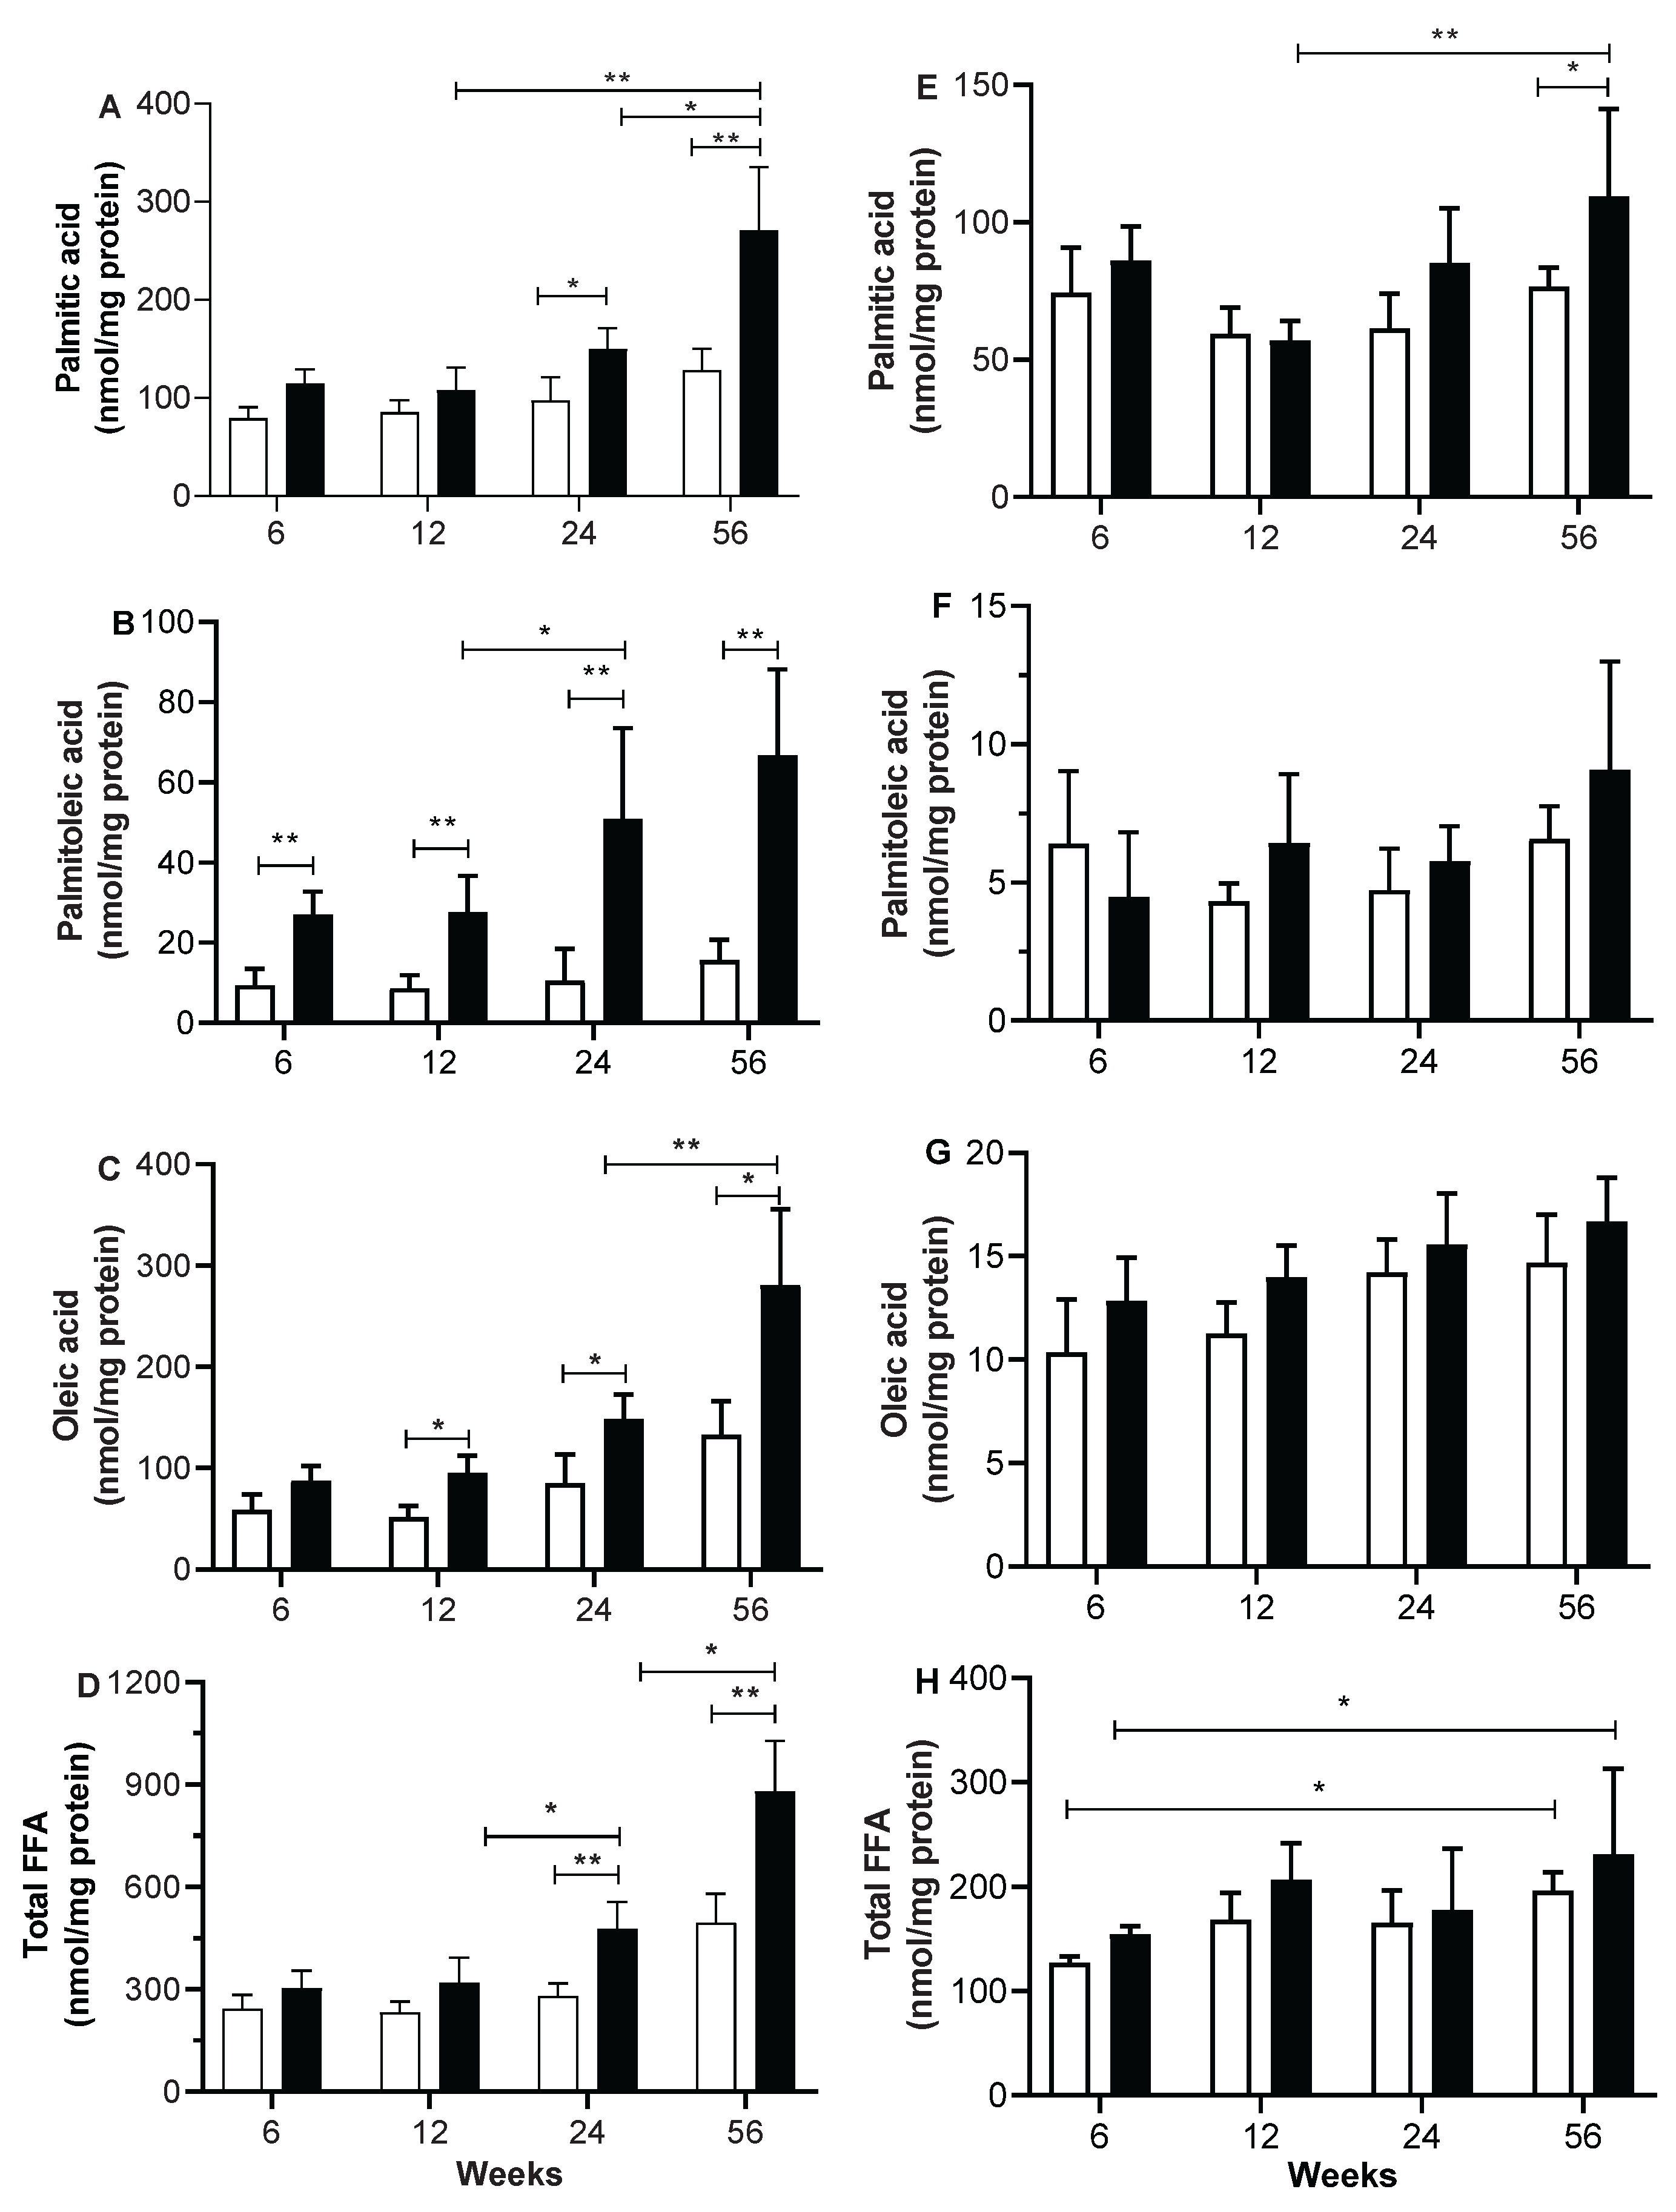
Figure 2.
ATP biosynthesis at different period of sucrose consumption and age in mitochondria from skeletal muscle (Panel A) and heart muscle (Panel B). Black circles correspond to SF rats and open circles correspond to C rats. Black square corresponds to oligomycin sensitive ATP biosynthesis of SF rats and open square corresponds to oligomycin sensitive ATP biosynthesis of C rat. For more information about the experiment see Method section. The values correspond to the mean ± SD of 8 different samples from different animals. *p<0.01 from SF rats and **p<0,05 corresponds to the difference between ages or periods of sucrose diet.
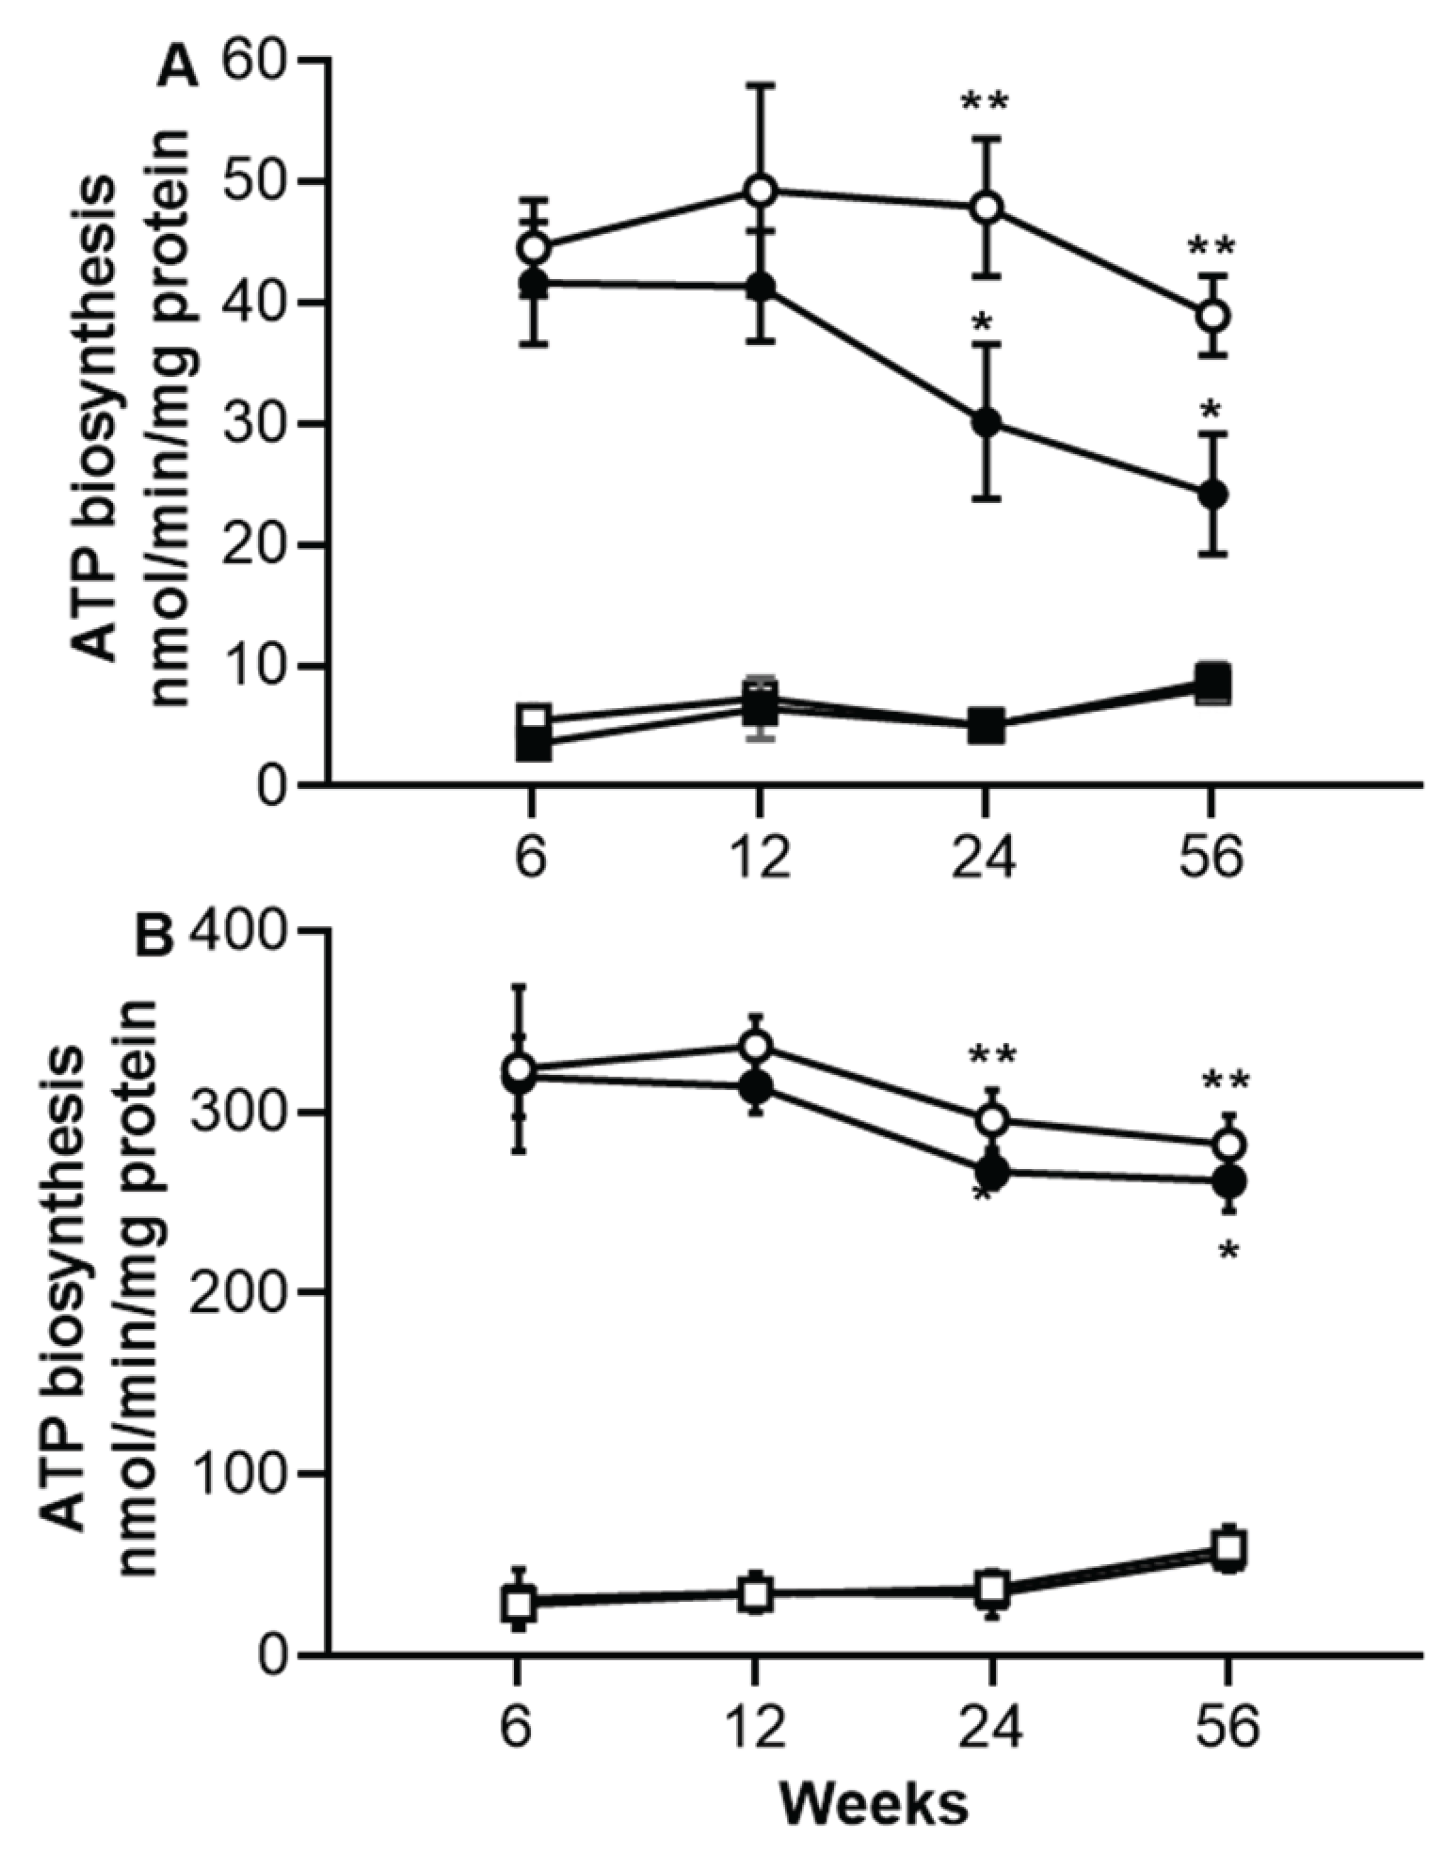
Figure 3.
Effect of oleic acid on ATP synthase in mitochondria from C rats (Open bar) and from SF rats (black bars). Oleate effect on ATP biosynthesis was performed in mitochondria from skeletal muscles (SM) and from heart muscle (HM) of 6, 12, 24 and of 56 weeks of sucrose treatment in comparison to their corresponding C rats . GDP was assayed to inhibit UCPs at O.5 mM in the presence of 10 M oleic acid. Data are means ± SD. of 6 to 7 experiments performed in separate mitochondria preparations. Horizontal square brackets indicate the significant differences between groups and the corresponding p-value * p < 0.01 and; ** p <0.001 .
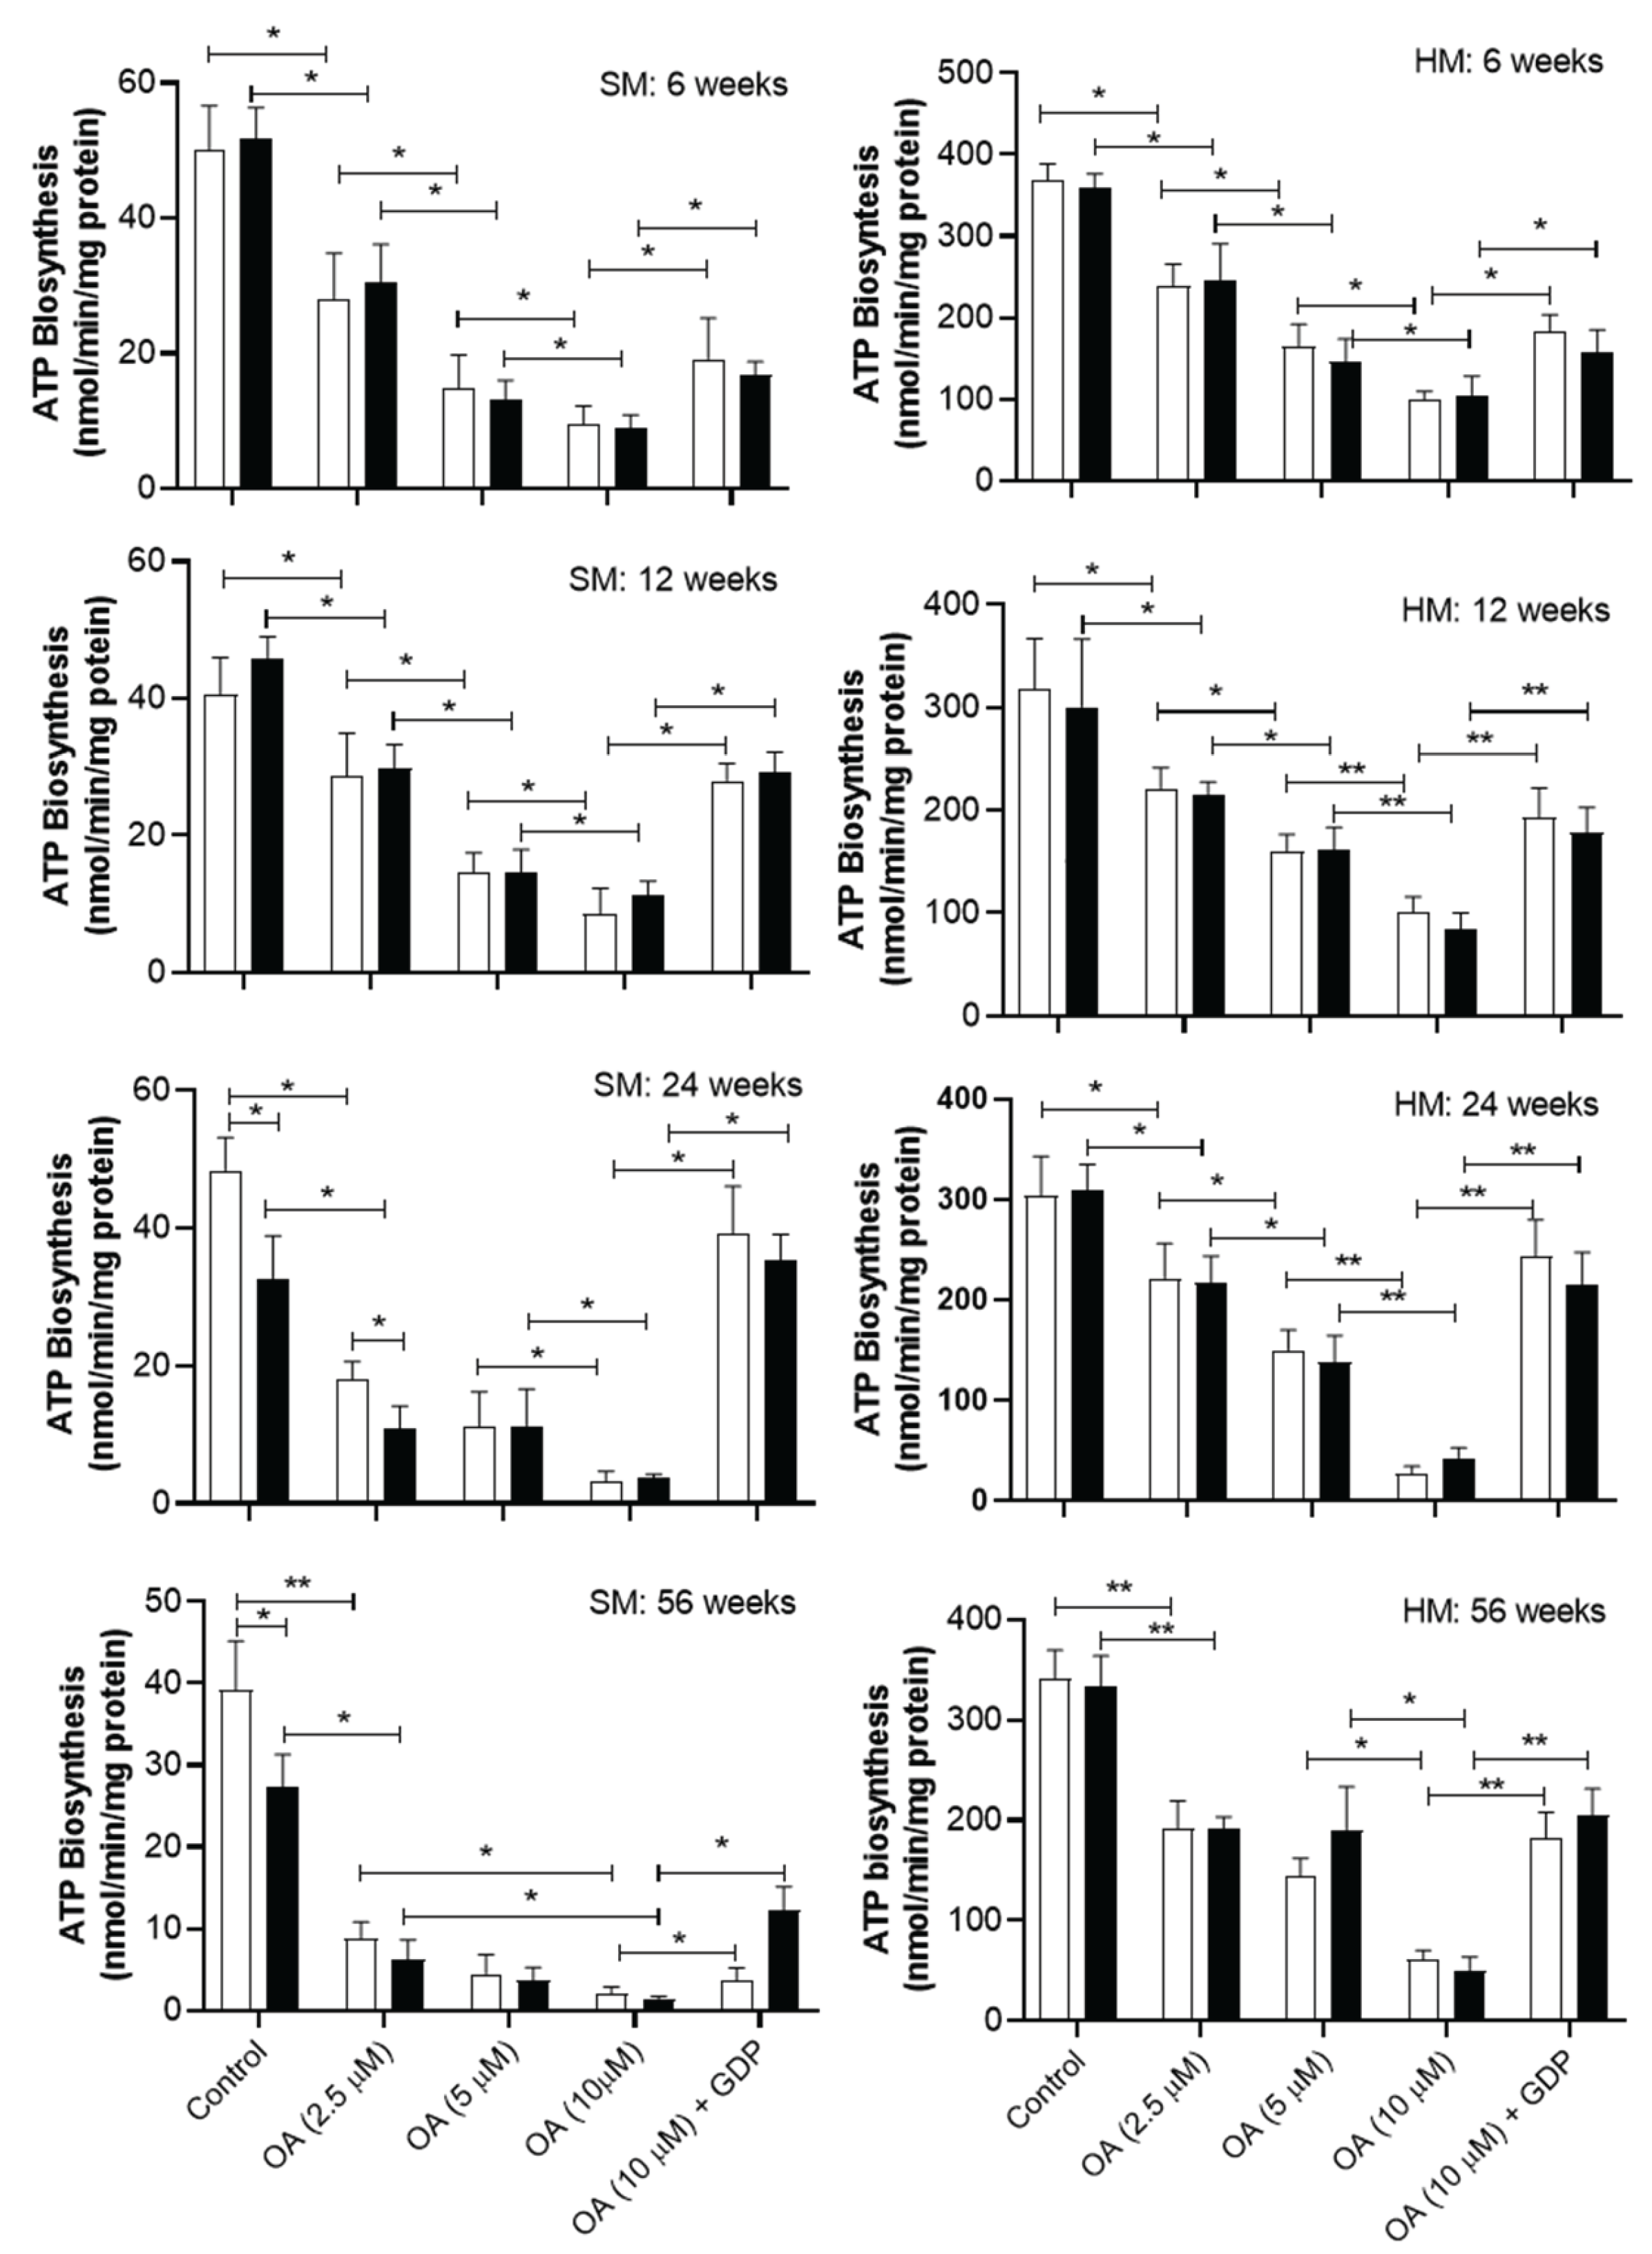
Figure 4.
Western blots analysis of UCP2 and UCP3 in mitochondria from skeletal (panel A and C) and heart muscle (panel B and D). Forty g of proteins were electrophoresed on SDS-PAGE with 12% acrylamide, electroblotted and incubated with anti UCP2 and UCP3 antibodies. The Optical density (O.D.) of the UCPs were normalized to the (O.D.) of VDAC as leading control in different mitochondria. The values correspond to ratio of the optical density (O.D.) of the UCPs to the O.D. of VDAC. Each value is the mean ± SD of 4 independent mitochondria preparation of each animals. Horizontal square brackets indicate the significant differences between groups and the corresponding p-value. * P< 0.05, ** P <0.01.
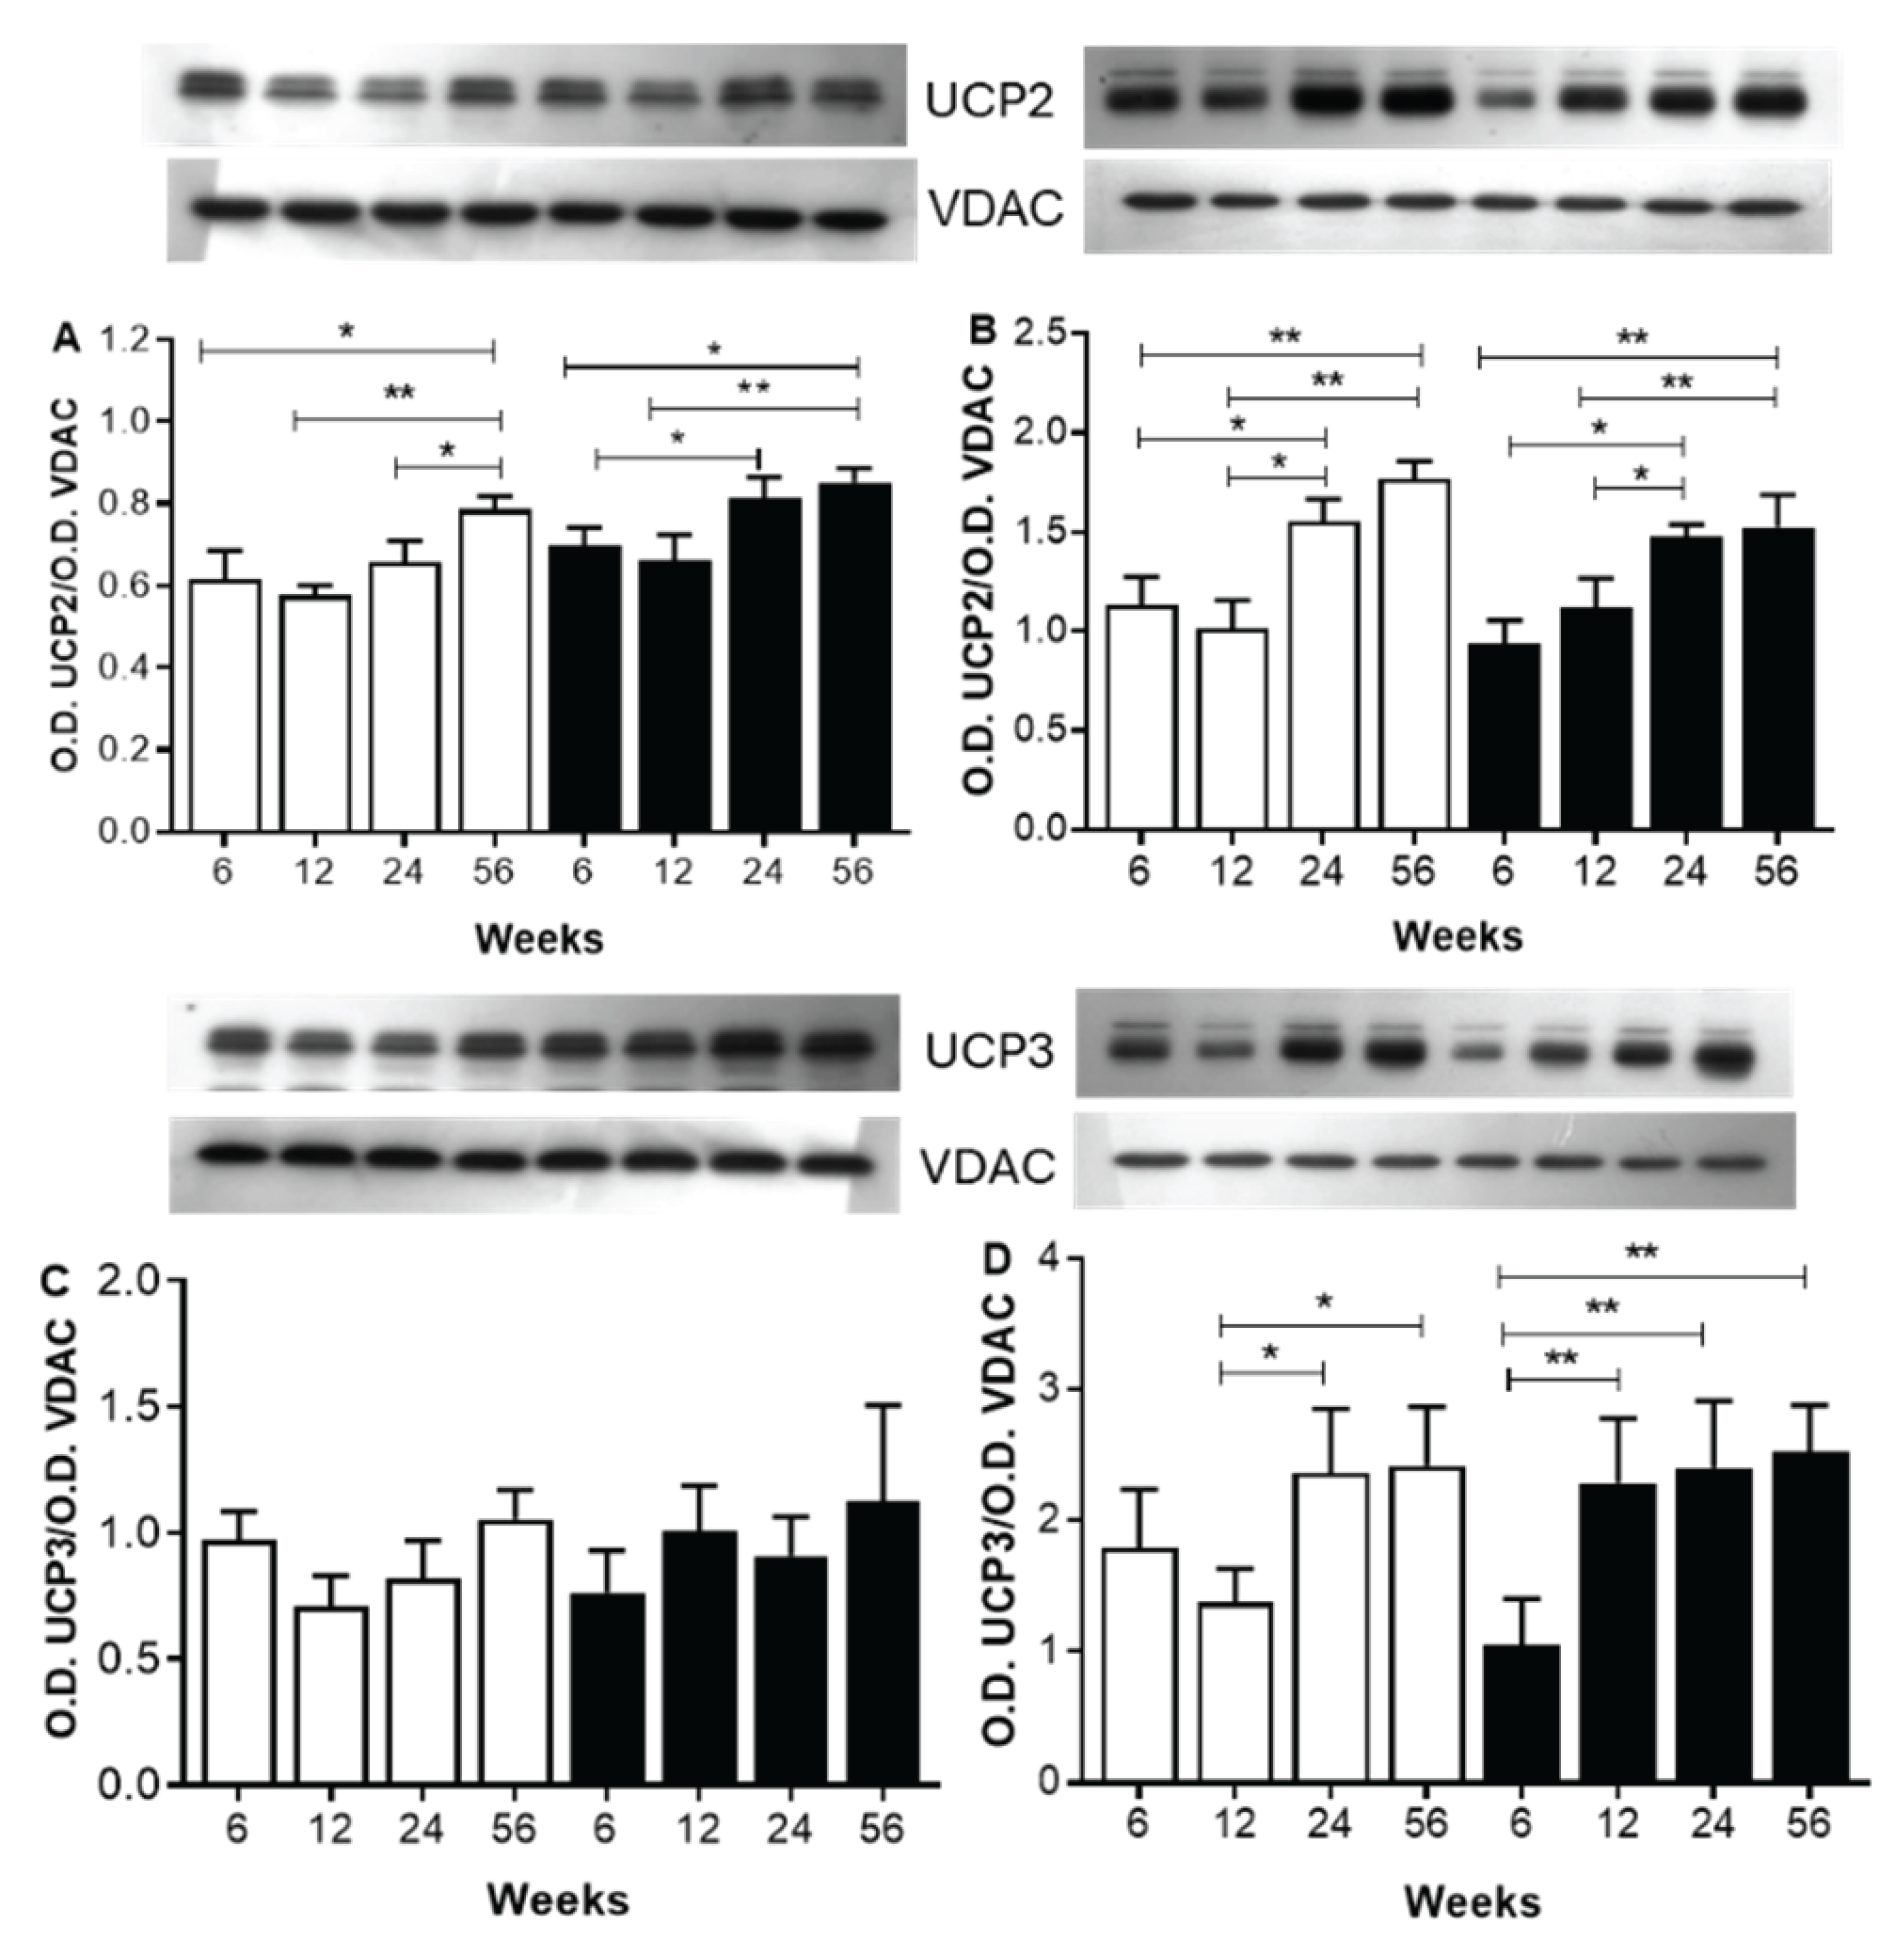
Figure 5.
Western blot analysis of mitochondrial ATP synthase 5A (ATP 5A, CV)).. Forty g of proteins from skeletal (Panel A) and heart (Panel B) muscle homogenates at various period of sucrose diet and age were electrophoresed through a SDS-PAGE with 15% of acrylamide, electroblotted and incubated with a cocktail antibody anti subunits of respiratory complex comprising the anti body anti ATP 5A. The Western blot image of ATP 5A subunit complex shows. protein band and GAPDH in SF compared to C rats. The black bars correspond to SF and the open bars compared to C rats. The values correspond to the ratio of the optical density (O.D.) of the subunit to the O.D. of GAPDH. Each value is the mean ± SD of 4 independent homogenate preparation from separate animals.
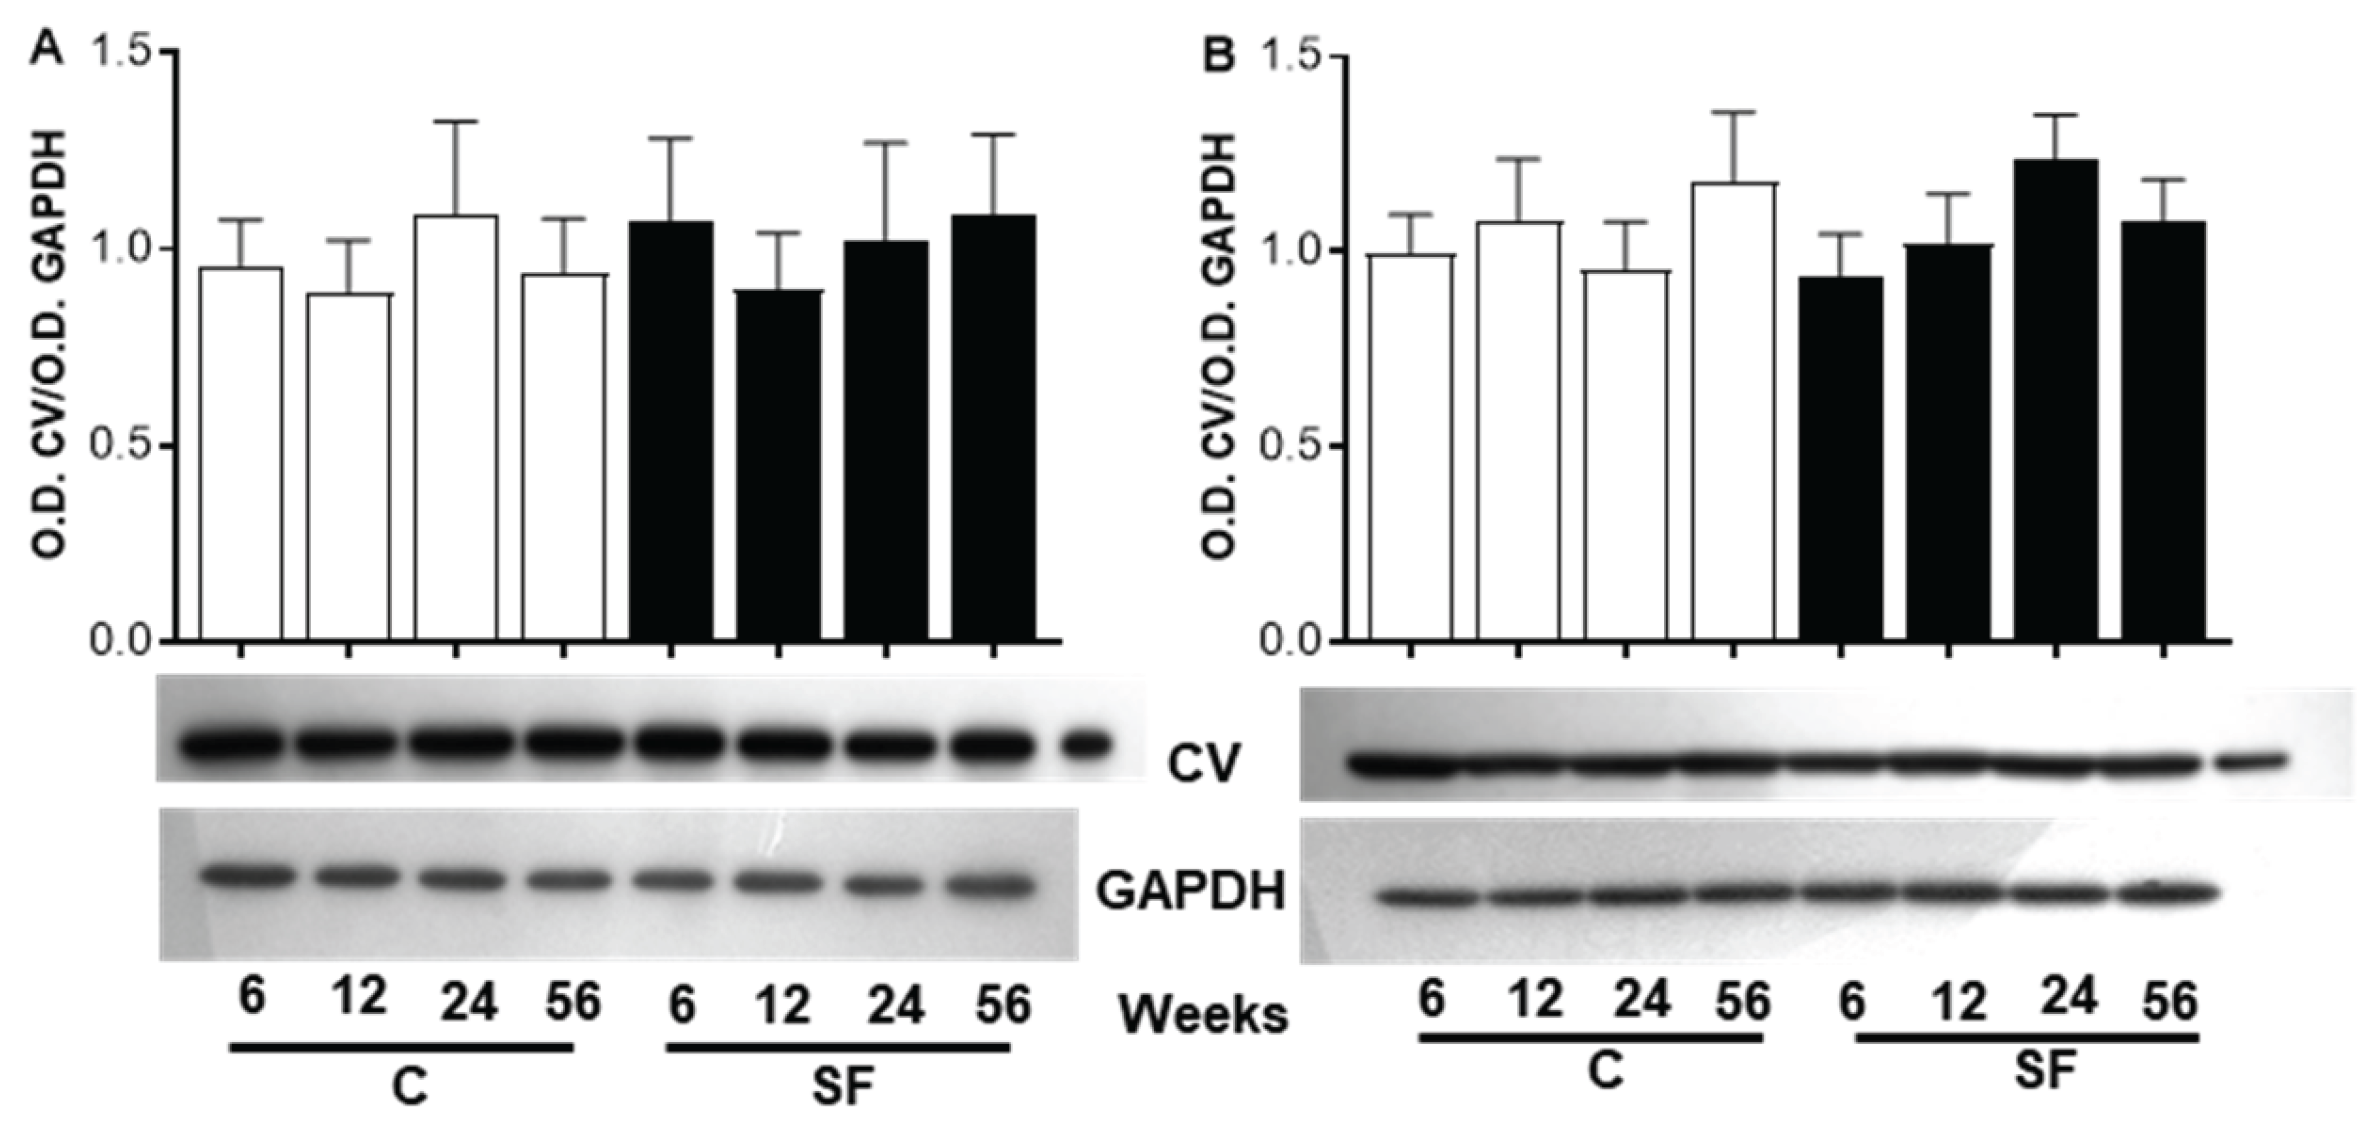
Figure 6.
Western blot analysis of ATPase inhibitor factor 1 (IF1) in mitochondria from skeletal muscle (Panel A) and from heart muscle (Panel B). Forty g of protein were electrophoresed on SDS-PAGE at 12% acrylamide, electroblotted and incubated with anti-IF1 anti-body (1/2000). The Optical density (OD) of IF1 is normalized to the OD of VDAC as loading control. The values correspond to the ratio of the OD of the subunit to the OD of VDAC. Each value is the mean ± SD of 4 independent mitochondria preparation from separate animals. *p<0.05 corresponds to the significant difference between C and SF rats at the same period of aging and sucrose treatment.
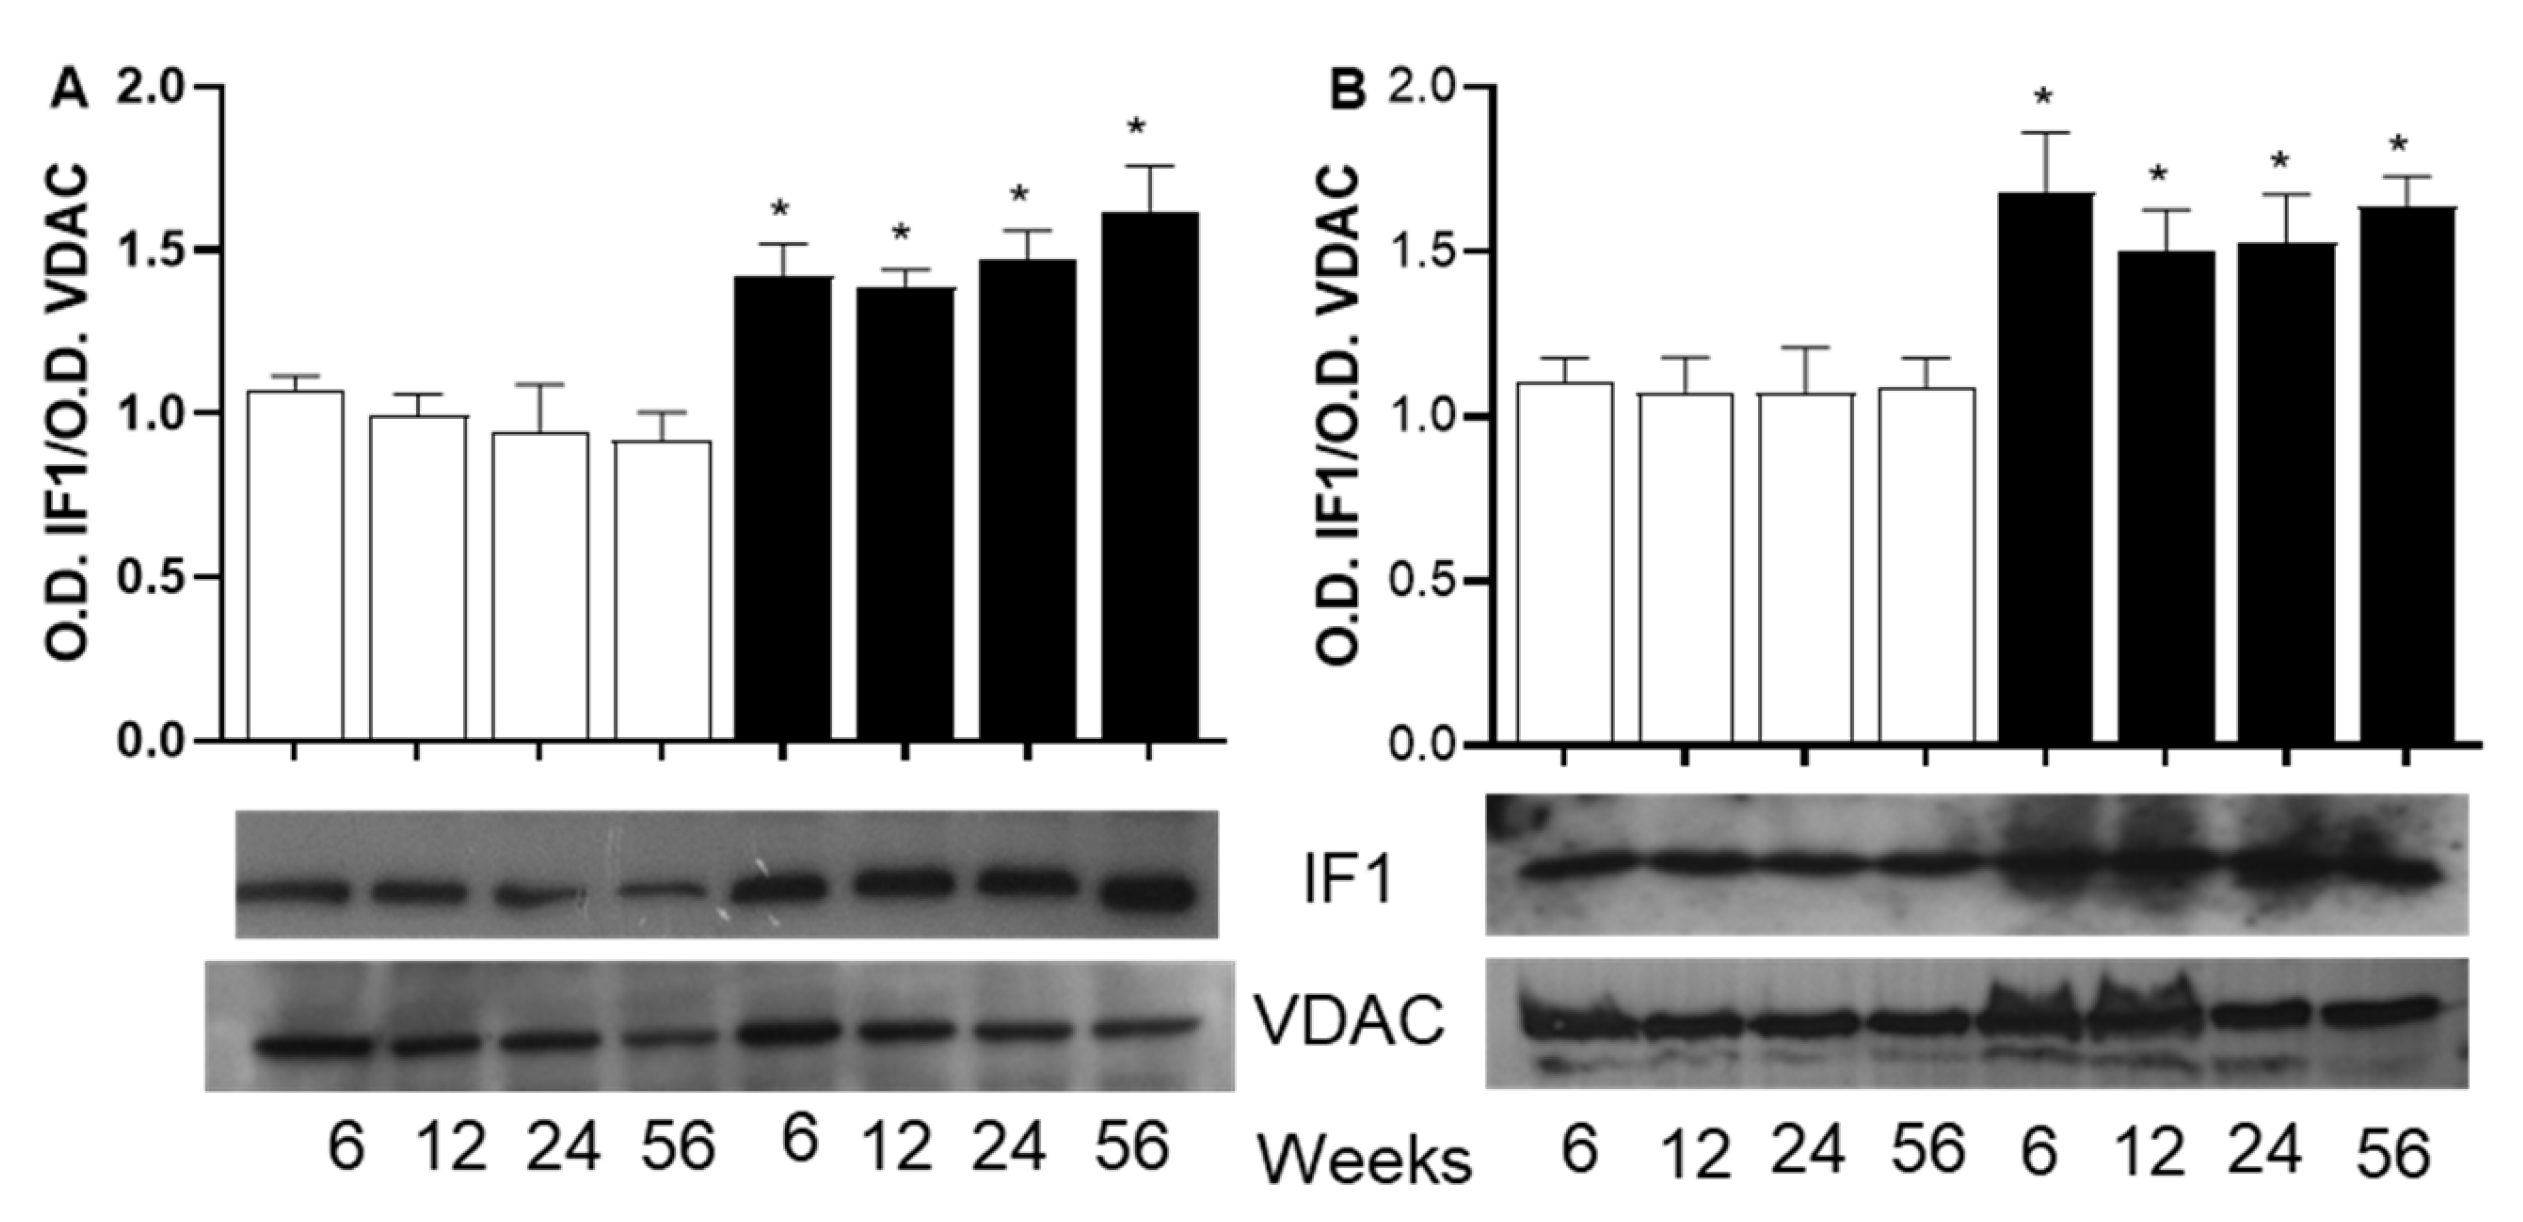
Figure 7.
Pearson correlation analysis of total FFA and oleic acid (nmol/mg protein) with ATP synthase (nmol/min /mg protein) in skeletal muscle (panels A and B). and in the heart muscle (panels C and D). Black circles correspond to SF rats and open circles correspond to C rats.
Figure 7.
Pearson correlation analysis of total FFA and oleic acid (nmol/mg protein) with ATP synthase (nmol/min /mg protein) in skeletal muscle (panels A and B). and in the heart muscle (panels C and D). Black circles correspond to SF rats and open circles correspond to C rats.
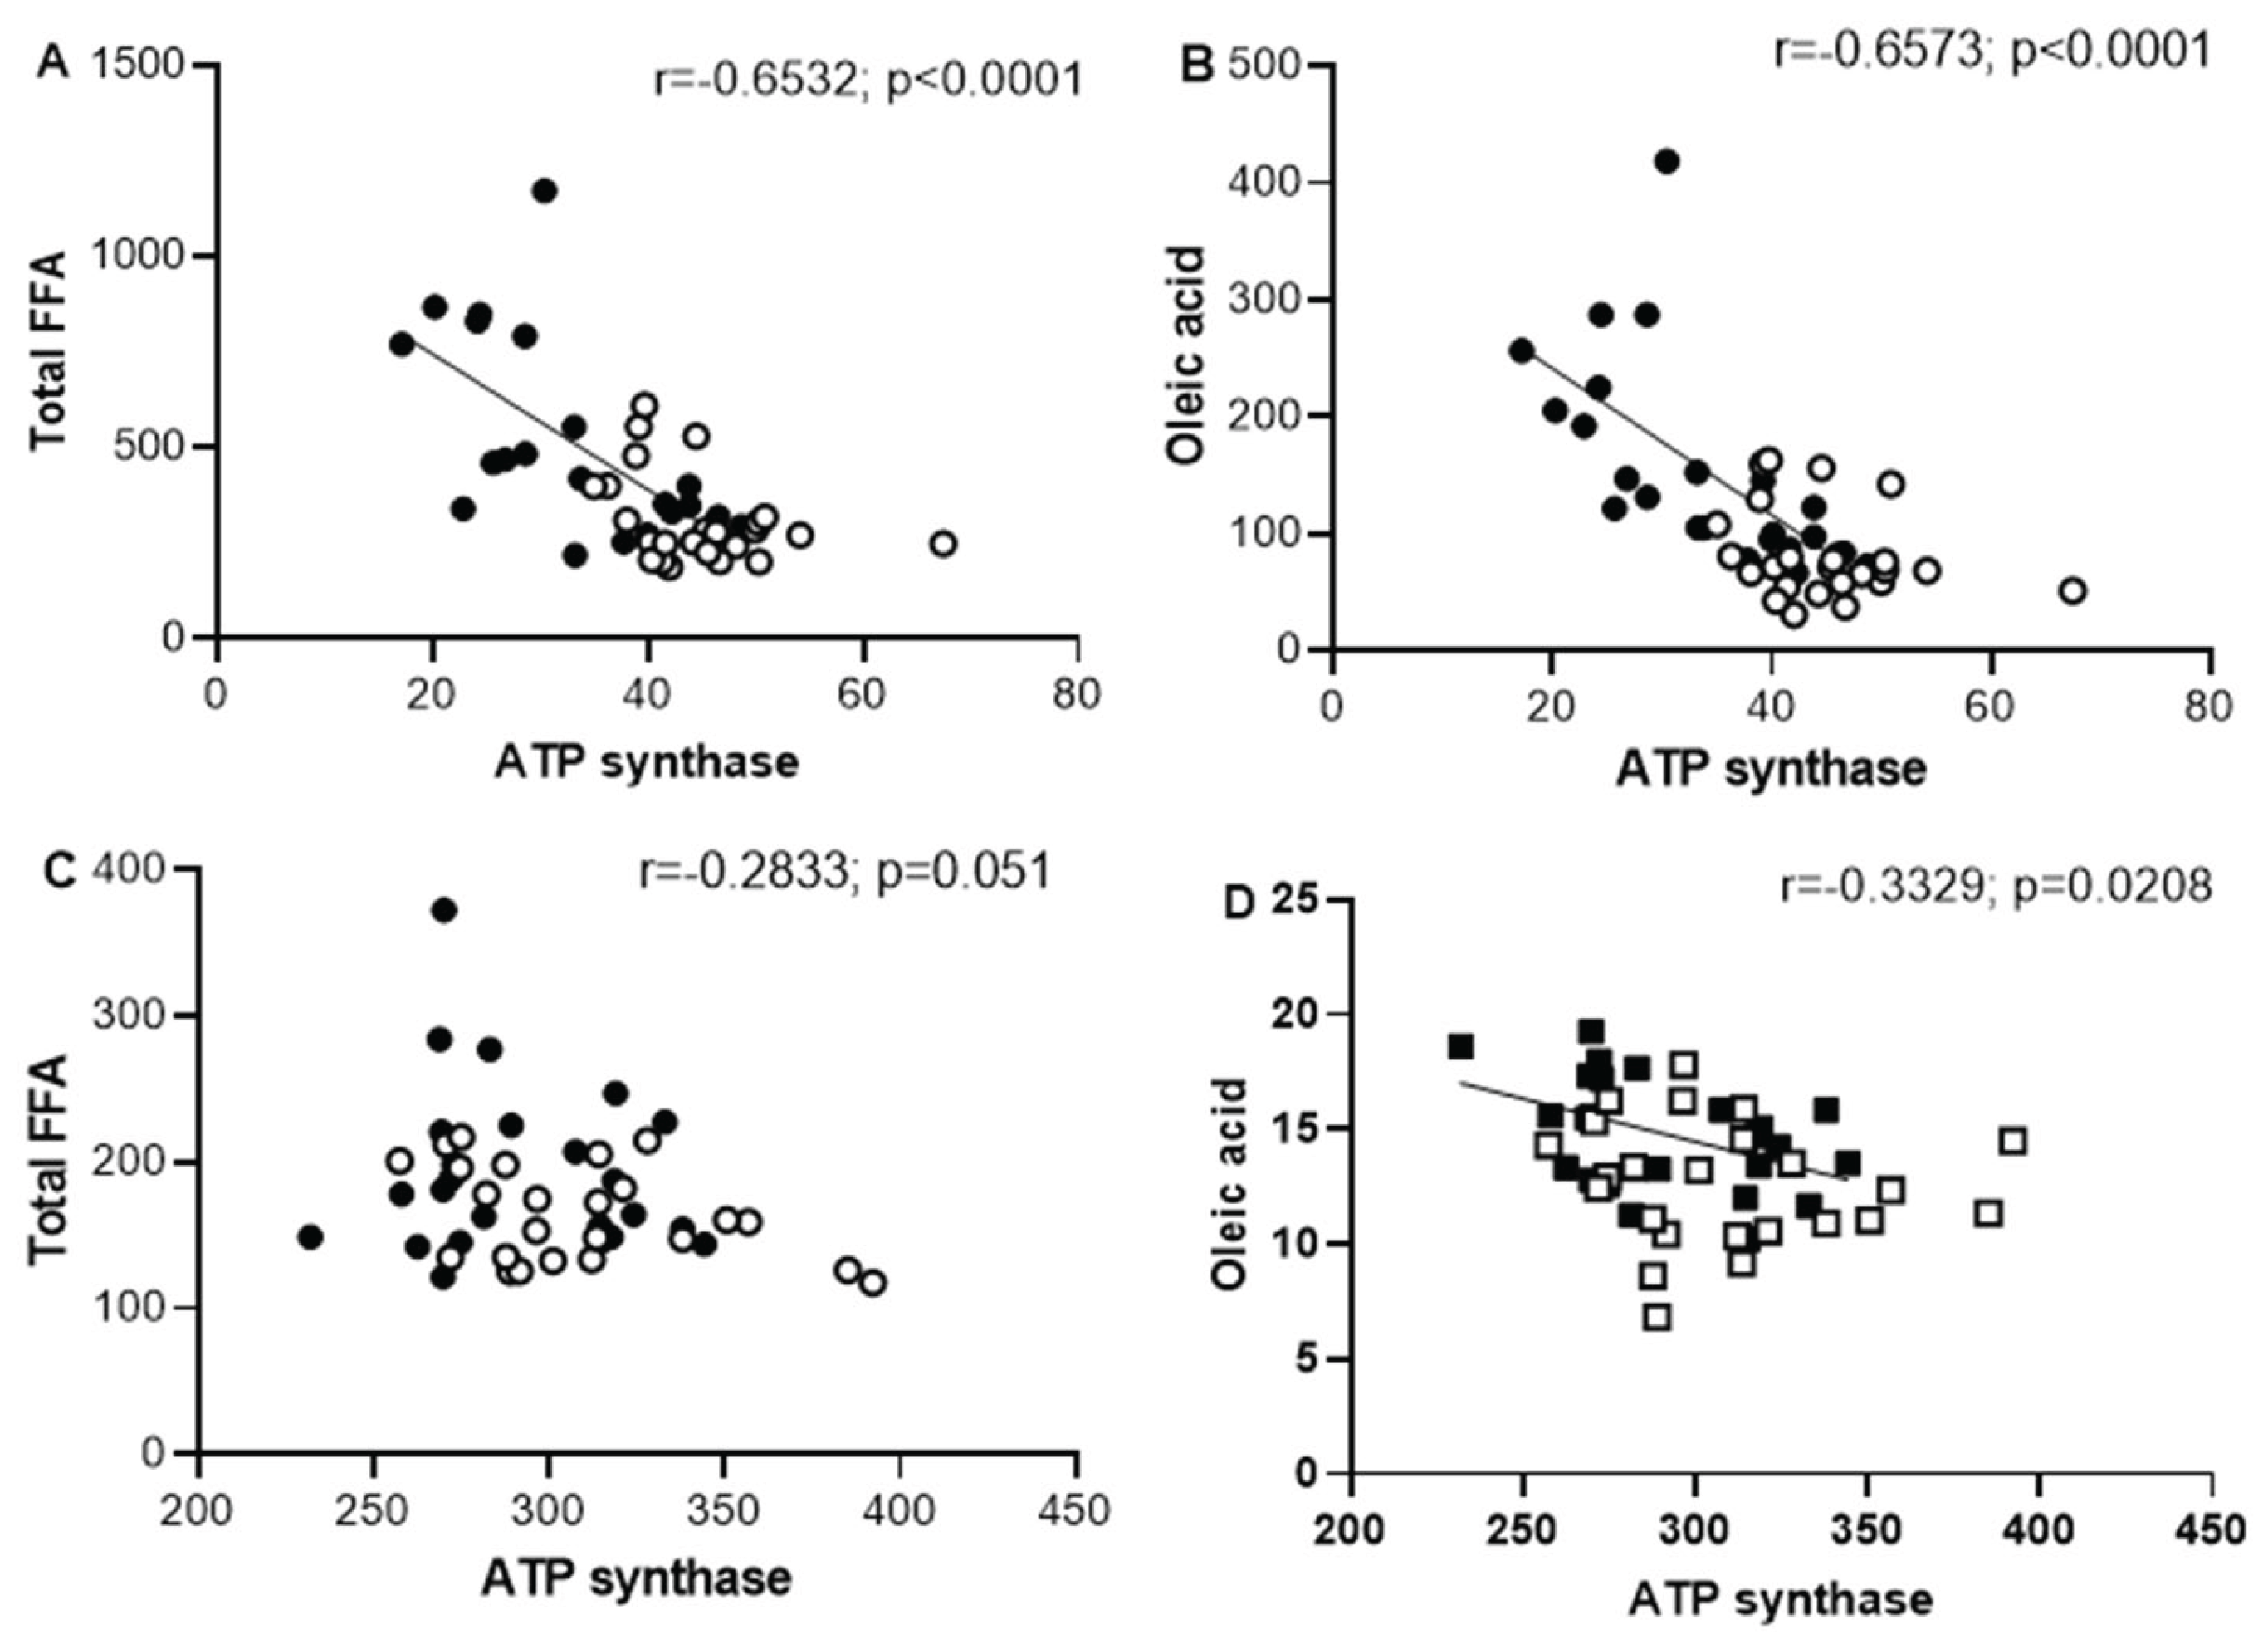

Table 1.
General characteristics of animals with and without sucrose diet intake during different period.
Table 1.
General characteristics of animals with and without sucrose diet intake during different period.
| Animals | C | SF | |||||||
|---|---|---|---|---|---|---|---|---|---|
| Weeks | 6 | 12 | 24 | 56 | 6 | 12 | 24 | 56 | |
| Variables | |||||||||
| Body mass (g) | 284.8±20.1 | 384.15±2.7 | 552±33.5 | 575.7±46.4 | 259.1±17.7 | 388±35.3 | 572.9±37.4$ | 716.8±50.3*$ | |
| Intrabdominal fat (g) | 2.3±0.9 | 4.3±0.79 | 5.9±1.2 | 8.6±2.9 | 3.4±0.7 | 8.6±1.5*$ | 14.9±2.6*$ | 25.6±5.96*$ | |
| Triglycerides (mM) | 0.8±0.1 | 0.8±0.1 | 0.9±0.2 | 1.2±0.2 | 1.2±0.1* | 1.4±0.2* | 1.8±0.3*$ | 1.7±0.2*$ | |
| Total FFA (µM) | 243.2±40.8 | 248.9±38.9 | 312.8±106.1 | 479.6±113.2 | 353.7±41.7 | 319.7±74.4 | 461.1±87.7*$ | 830.2±202.3*$ | |
| Glucose (mM) | 6.2±0.8 | 4.8±1.9 | 4.9±2.1 | 5.8±0.7 | 5.5±1.1 | 4.6±1.8 | 4.9±1.9 | 6.2±0.7 | |
| Cholesterol (mM) | 1.3±0.2 | 1.5±0.1 | 1.4±0.2 | 1.6±0.2 | 1.7±0.2 | 1.4±0.2 | 1.2±0.2 | 1.6±0.3 | |
Table 2.
Mitochondria oxygen consumption rate (OCR) oxidizing succinate.
| Animals | C | SF | |||||||
|---|---|---|---|---|---|---|---|---|---|
| Weeks | 6 | 12 | 24 | 56 | 6 | 12 | 24 | 56 | |
| OCR | |||||||||
| Mitochondria from skeletal muscle | |||||||||
| State III | 121.0±7.2 | 108.2±16.0* | 79.2±7.1* | 69.9±10.8** | 115.6± 9.15 | 101.1±13.6 | 70.9±13.0$ | 50.08±7.1$$ | |
| State IV | 22.6±5.3 | 23.1±6.5 | 20.8±2.8 | 21.4±3.2 | 22.1±3.1 | 22.1±4.4 | 26.1±2.3& | 27.4±2.8&& | |
| Mitochondria from heart muscle | |||||||||
| State III | 118.8±10.2 | 98.6±9.2 | 89.5±24.8* | 61.7±8.9** | 95.6±14.8 | 92.1±18.2 | 60.4±9.7$ | 50.8±16.4$$ | |
| State IV | 22.4±3.3 | 21.7±2.8 | 18.5±3.4 | 19.3±3.8 | 21.4±4.6&& | 22.8±3.5& | 21.3±2.4& | 23.0±6.6& | |
Al values correspond to mean ± SD of 7 to 8 animals. OCR is expressed as nmolO2/min/mg protein. C correspond to control rats and SF corresponds to sucrose-fed rats. The differences between groups were determined by one-way ANOVA for selected variables followed by Tuckey test ad hoc. * p<0.01 corresponds to the differences between CR at different age. $ p<0.01 corresponds to the difference between SFR at different period of sucrose diets.
Disclaimer/Publisher’s Note: The statements, opinions and data contained in all publications are solely those of the individual author(s) and contributor(s) and not of MDPI and/or the editor(s). MDPI and/or the editor(s) disclaim responsibility for any injury to people or property resulting from any ideas, methods, instructions or products referred to in the content. |
© 2025 by the authors. Licensee MDPI, Basel, Switzerland. This article is an open access article distributed under the terms and conditions of the Creative Commons Attribution (CC BY) license (http://creativecommons.org/licenses/by/4.0/).
Copyright: This open access article is published under a Creative Commons CC BY 4.0 license, which permit the free download, distribution, and reuse, provided that the author and preprint are cited in any reuse.


