
Submitted:
12 July 2024
Posted:
15 July 2024
You are already at the latest version
Abstract
Succinate is proposed to be a mediator of muscle exercise-induced adaptations. We studied metabolic health and changes of muscle mass in 6-month-old male mice after 12 weeks of feeding regular diet (RD, 13.4 kcal% fat, 66.8 kcal% carbohydrate, 29.8 kcal% protein), high fat diet (HFD, 60 kcal% fat, 20 kcal% carbohydrates, 20 kcal% protein) and ketogenic diet (KD, 80 kcal% fat, <1 kcal% carbohydrates, 20 kcal% protein) with or without 2% succinate supplements (SUS) in drinking water (n=8-12 per group). Functional overloading of the plantaris muscle (PL) was induced in a group of mice by denervation of the gastrocnemius and soleus muscles at week 6 of feeding different diets. HFD induced the greatest (p < 0.001) increase in body and fat mass. HFD and KD lead to significant (p < 0.01) impairment in glucose tolerance compared to RD. SUS blunted (p < 0.01) initial surge in energy intake when mice were switched from RD to HFD, but did not influence any measures of metabolic health after 12 weeks of the study. Functional overloading lead to ~25% increase in PL mass which was not affected by diet or SUS. In conclusion, SUS does not have a long-term effect on metabolic health or muscle mass.
Keywords:
glucose tolerance
; high-fat diet
; ketogenic diet
; muscle hypertrophy
1. Introduction
Large numbers of people around the world are overweight or obese [1]. Obesity contributes to muscle dysfunction and diminished quality of life [3]. Resistance exercise (RE) has emerged as a promising strategy for managing obesity, since it fosters muscle growth which might lead to increased resting metabolic rate having a positive effect on weight control and health [4]. Adequate protein intake promotes gains in muscle mass after RE training [5]. However, the efficacy of RE may be hindered by obesogenic high-fat diets, which are prevalent in a considerable portion of the population [6,7]. Animal studies can provide a useful insight into physiological effects of such diets on skeletal muscles as human studies are often compromised by difficulties in controlling diet, poor adherence to exercise interventions and heterogeneity of the volunteers [8].
Skeletal muscle exercise plays a pivotal role in metabolic health, as it releases cytokines and other bioactive molecules that exert beneficial effects on various tissues and organs [9]. The exploration of compounds capable of mediating health benefits has garnered significant interest [10]. Succinate, an intermediate in the citric acid cycle, emerged as a promising candidate in this regard. Plasma succinate levels surge during aerobic exercise [11], and might contribute to thermogenesis and cellular adaptations in various tissues and organs [12,13]. Succinate supplementation (SUS) acutely boosts metabolic rate and can enhance glucose tolerance in mice subjected to a high-fat diet for several weeks [13]. Studies on mice have demonstrated that SUS promotes protein synthesis in skeletal muscles [14]. There is also evidence that succinate signals via its cognate receptor SUCNR1 in non-myofibrillar cells in muscle tissue to control muscle-remodeling transcriptional programs [15]. These findings underscore the need for further investigation into the long-term effects of SUS on metabolic health and muscle responses to exercise and inactivity.
Our study aimed to explore the impact of 12-week SUS on body composition and metabolic health in mice fed diets varying significantly in carbohydrate and fat ratios. Additionally, we examine the effects of SUS on skeletal muscle response to functional overloading and denervation. We hypothesize that SUS will positively influence muscle mass, particularly under conditions of high-fat dietary intake.
2. Materials and Methods
2.1. Animals Diets, Tissue Sampling and Measurements
The study was carried out at the animal research facility of the Lithuanian Sports University after receiving approval by the Lithuanian Republic Alimentary and Veterinary Public Office (Ref. G2-90, 2018). Males of C57BL/6J mouse strain were studied at 6 months of age. Mice were housed in standard cages at a temperature of 20-21 ºC and 40-60% humidity with the normal 12/12-h light/dark cycle reversed. Initially, animals were fed regular chow diet (RD, 13 kcal% fat, 67 kcal% carbohydrate, 20 kcal% protein, Joniskio grudai, Lithuania), and received tap water ad libitum before being isolated in separate cages for 12-week exposure to three different diets (n = 10-12 per diet). This included control RD, high fat diet (HFD, 60 kcal% fat, 20 kcal% carbohydrates, 20 kcal% protein, D12492, Research Diets, New Brunswick, NJ, USA), and ketogenic diet (KD, 80 kcal% fat, <1 kcal% carbohydrates, 20 kcal% protein, D03022101, Research Diets). Food intake and body mass of mice was measured weekly. Energy expenditure, plasma β-hydroxybutyrate (HB) and glucose tolerance (GT) was assessed during the last week of the 12-week study using methods as in our previous studies [16,17]. Mice were sacrificed by the exposure to CO2 at the end of study. Afterwards blood was collected by heart puncture. This was followed by dissection and weighing of liver, heart, fat depots and hindlimb muscles (Kern, ABS 80-4, Germany). The combined mass of plantaris (PL), gastrocnemius (GAS), tibialis anterior (TA) and extensor digitorum longus (EDL) and soleus (SOL) muscles was used as muscle mass index (MMI). The total white adipose tissue (tWAT) was quantified as the fat excised from the subcutaneous area covering the hind limbs as well as gonadal, mesenteric and perirenal areas. Interscapular brown adipose tissue (iBAT) was also weighed. Average energy intake was estimated based on food consumption of each mouse which was assessed every week by subtracting food leftovers from the initially provided food with corrections for effects of humidity on the pellet weight and caloric density of the diets (3.3, 5.2 and 6.1 kcal/g for RD, HFD and KD, respectively).
2.2. Muscle overloading and Denervation
An additional group of mice (n=10-12 per diet) was subjected to functional overloading (FO) of PL muscle as induced by denervation of GAS and SOL muscles after six weeks of exposure to different diets [18]. Briefly, branches of the ischiatic nerve that supply GAS and SOL muscles were cut and a portion of each branch was excised to prevent reinnervation. Surgery was performed under aseptic conditions and anaesthesia as induced by subcutaneous injection of ketamine (100 mg/kg) and xylazine (10 mg/kg). After 6 weeks of DEN, mice were sacrificed by the exposure to CO2 and hindlimb muscles of both legs were removed and weighed.
2.3. Energy Expenditure and Physical Activity
Energy expenditure (EE) was assessed using indirect calorimetry. Briefly, the metabolic cage was connected to the gas analyzer with a switching device (L4005 and LE400, Panlab Harvard Apparatus, Spain). The air flow of 250 ml min-1 and 3-min switching time were used for alternating measurements of O2 and CO2 in the metabolic cage and the external environment, respectively. Physical activity of mice was assessed using strain gauges for measurements of the ground reaction forces generated by mice. Infrared light beams were also used to assess rearing activity which including lifting of the body above the ground. All the metabolic measurements were performed at a light phase of the day between 9:00 and 18:00. Each mouse was weighed (Kern 440-45N, Germany) and transferred into metabolic cage for 3-h assessment of EE. The EE (kcal day-1) was calculated as the average values of the last two hours of measurements.
2.4. Blood Glucose and β-Hydroxybutyrate
After overnight fast mice were subjected to intraperitoneal glucose injection (2 g glucose / kg body wt). Blood glucose was measured (Glucocard X-mini plus, Japan) using the whole blood samples taken from tail tips immediately before and at 15, 30, 60, 90 and 120 min after the injection. The area under glucose—time curve (glucose AUC) was calculated with adjustment for baseline glucose level using Prism 7.0 software. Blood β-hydroxybutyrate (HB) levels were measured with ketone strips (FreeStyle Optium Neo, Abbott, USA) in the whole blood samples taken from tail tips.
2.5. Statistical Analysis
The statistical analysis was performed using Prism 7.0 and IBM SPSS Statistics (v20) software. Data normality was verified using the Shapiro–Wilk test. Analysis of variance (ANOVA) with Bonferroni’s post hoc test was used to assess effects of succinate supplementation (SUS) and diet (RD, HFD and KD) on various measures. Pearson’s correlation coefficient was calculated to assess strength of the association between the variables. Linear regression analysis was also carried out. The level of significance was set at p < 0.05. All data are presented as means ± SD.
3. Results
3.1. Energy intake and Body Mass
Figure 1 illustrates the trends in energy intake and body mass changes during the study. Mice on a regular diet (RD) maintained a steady energy intake pattern (Figure 1A) while gradually gaining body mass (p < 0.001) (Figure 1B). SUS did not alter these patterns. In contrast, mice on a high-fat diet (HFD) exhibited a significant increase in energy intake (Figure 1C), surpassing that of RD mice (p < 0.001) and showing a trend towards exceeding the ketogenic diet (KD) group (p = 0.078). SUS mitigated the initial spike in energy intake induced by HFD, but did not significantly affect subsequent changes. Furthermore, HFD resulted in accelerated weight gain compared to RD (p < 0.001) and KD (p < 0.01) (Figure 1D). Although SUS attenuated the rate of weight gain during the initial two weeks, it did not have a sustained effect on body mass thereafter. Transitioning mice to a KD also led to an immediate rise in calorie intake, though less pronounced than that observed with HFD (Figure 1E). SUS showed a tendency to alleviate this peak in energy intake, but its impact on subsequent weight gain was not significant (Figure 1F).
3.2. Tissue and Blood Measures
Figure 2 presents data on muscle, heart, liver, tWAT and iBAT mass as well as blood β-hydroxybutyrate (HB) levels. SUS did not alter any of these parameters. However, muscle, liver, tWAT and iBAT mass, as well as blood HB levels, exhibited diet-dependent variations. Specifically, HFD induced greater skeletal muscle mass compared to RD (p < 0.05), although not significantly different from KD (p = 0.267) (Figure 2A). No discernible differences were observed in heart mass between the dietary groups (Figure 2B). Notably, HFD was associated with increased liver mass relative to KD (p < 0.05), while showing no significant difference from RD (p = 0.215) (Figure 2C). Additionally, HFD resulted in a substantial augmentation of tWAT compared to both RD (p < 0.001) and KD (p < 0.001) (Figure 2D). KD led to greater tWAT accumulation compared to RD (p < 0.001), but did not influence iBAT, which remained significantly smaller than that observed with HFD (p < 0.001) (Figure 2E). Blood HB levels were highest (p < 0.001) in KD groups and smallest (p < 0.001) in RD mice (Figure 2F).
3.3. Energy Expenditure and Physical Activity
Data on energy expenditure (EE) is presented in Figure 3. Neither diet nor SUS had an effect on EE (Figure 3A). KD mice showed lower respiratory exchange ratio (RER) than RD (p < 0.001) and HFD groups (p < 0.001) (Figure 3B). Physical activity varied, and neither estimates based on ground reaction forces nor rearing counts were affected by the diet or SUS (Figure 3C and D, respectibely).
3.4. Glucose Tolerance
Data on glucose tolerance (GT) tests are presented in Figure 4. SUS did not affect GT, but GT was dependent on the diet (p < 0.001). Blood glucose peaked after 30 min of the test and decreased by the end of the test (p < 0.05) in RD mice (Figure 4A). HFD and KD groups did not show any significant decrease in glucose levels after reaching peak values during the initial 30-60 minutes of the test (Figure 4 B and C, respectively). Glucose area under the curve (glucose AUC) was smaller (p < 0.001) in RD group compared to both HFD and KD groups (Figure 4d).
3.5. Muscle Hypertrophy and Atrophy
Data on hindlimb muscle mass in mice subjected to denervation are presented in Table 1. HFD was associated with greater mass of GAS (p < 0.05), SOL (p < 0.001), and PL muscles compared to RD, but not KD. Muscle mass decreased (p < 0.001) in the denervated GAS and SOL muscles and increased (p < 0.001) in PL which was subjected to functional overloading as a result of the denervation.
The percentage changes in muscle mass are presented in Figure 5. These measures were not affected by the diet or SUS. PL showed similar levels of hypertrophy independent of the diet (Figure 5 A, B and C). GAS consistently showed greater (p <0.001) wasting than SOL muscle (p < 0.001). There was no significant association between glucose tolerance as reflected in glucose AUC and extent of muscle hypertrophy or atrophy when results of all three diets were pulled for this analysis (Figure 5 D, E and F).
4. Discussion
The results presented in this study examine interaction between dietary fat content and SUS in relation to energy intake, weight gain, glucose tolerance and changes in muscle mass after muscle denervation and functional overloading. Understanding how SUS affects these physiological measures in C57BL/6J mice might contribute to development of new dietary interventions in human populations.
The major finding of the study is that SUS reduced the initial spike in energy intake induced by transition from regular low-fat diet to high-fat diet highlighting potential usefulness of these supplements in modulating dietary behavior. However, the lack of sustained effect on subsequent changes in energy intake, and weight gain is a significant limitation of this treatment. Systemic administration of succinate was associated with excessive heat generation in brown adipose tissue and increased energy expenditure of the whole body [13]. Improved glucose tolerance was also reported after four weeks of SUS in HFD-fed mice in this study as well. Similarly, a reduction in weight gain was noted in mice fed HFD with SUS during the first two weeks of our study. However, there was also a reduction in energy intake which could account for a significant part of this apparent delay in weight gain. Importantly, no significant effects on energy intake, body composition, glucose tolerance, energy expenditure, or physical activity were observed at the end of the 12-week study period. Thus, the beneficial influence of SUS on metabolic health does not appear to be sustained during prolonged exposure as examined in our study.
We have also studied effects of SUS on mice fed regular diet (RD) which is low in fat and ketogenic diet (KD) with as much as 80% kcal from fat. Mice on RD displayed stable energy intake throughout the study period, coupled with a gradual increase in body mass. SUS did not have any effect on this pattern. Switching from RD to KD elicited a rise in energy intake, albeit less pronounced than that observed with HFD. SUS tended to reduce this peak in energy intake, but this effect was not significant. These findings suggest that the metabolic effects of SUS are not directly dependent on the fat content of the diet and might be influenced by energy intake, which was particularly large in the case of HFD, as observed in other studies as well [19]. Energy intake of mice increases with dietary fat content up to 60% kcal and then starts to decrease when fat content increases beyond that threshold up to 80% kcal, as in the KD used in this study [20]. Both carbohydrates and fat are required to induce a strong subconscious drive to overeating [21]. Interestingly, blood β-hydroxybutyrate (HB) levels increased with increase in fat content of the diet indicating intensified fat metabolism, but only KD led to a reduced respiratory exchange ratio (RER), indicating improved fat oxidation. Despite this improvement, KD was coupled with a significant worsening of glucose tolerance compared to RD, highlighting the negative consequences of KD feeding. Similar findings have been reported by other investigators of KD, even when matching energy intake to that of a high carbohydrate diet similar to the RD used in this study [22]. Despite these negative effects on glucose metabolism, KD led to a longer lifespan of C57BL/6J mice compared to a high carbohydrate diet [22]. However, this comparison was made under conditions of fixed energy intake of ~12 kcal per day, which is ~20% less than what ad libitum fed KD mice were consuming in our study. This energy shortfall might translate into a time-limited feeding effect, as mice on KD are likely to consume all their food in a shorter period than those fed a high carbohydrate diet. Time limited feeding improves health even without caloric restriction [22]. It is likely that the positive effects of KD on life expectancy was mediated by feeding regime of fixed caloric intake rather than KD per se.
There is evidence that SUS promotes skeletal muscle protein deposition via the Erk/Akt signaling pathway [14]. We did not observe any effect of succinate on tissue mass or changes in muscle mass after denervation or functional overloading. These findings contradict the hypothesis that extracellular succinate plays important role in skeletal muscle hypertrophy or atrophy [12]. Indeed, pathways leading to mechanical overload-induced increases in protein synthesis remain under intensive investigation [23], but it is unlikely that succinate plays an important role in this regard. Generally, HFD-fed mice had greater muscle mass compared to mice fed RD or KD, likely due to greater body mass inducing greater overload of skeletal muscles, especially those associated with posture and locomotion, such as the soleus muscle which exhibits particularly high levels of activity [24]. Neither increase in dietary fat content nor SUS influenced muscle response to functional overloading or denervation. Plantaris muscle hypertrophy was not reduced in mice with significant impairments in glucose tolerance due to HFD or KD feeding. This contrasts with other studies showing somewhat reduced muscle hypertrophy after functional overloading in mice fed HFD [6,26]. We used a HFD with higher fat content (60% kcal compared to 45% kcal) and applied muscle denervation rather than surgical removal of gastrocnemius and soleus muscles to induce overloading of plantaris muscles. Muscle denervation is less invasive and is likely to induce lower levels of inflammation. This might explain the different outcomes though we are unaware of any study comparing physiological responses to these two models of muscle functional overloading.
Our results also question the hypothesis that obesity-linked impairment in glucose tolerance is associated with impaired muscle response to functional overloading or disuse. HFD promotes insulin resistance [27], and it is believed that obesity related insulin resistance is a major factor in ageing related muscle wasting and explains the so called sarcopenic obesity [28]. This belief is not supported by our finding. However, we studied adult mice and insulin resistance might be caused by different factors at old compared to adult age. The HFD and KD used had 20% kcal from protein, which appears sufficient to maintain mTORC1 signaling which is important for muscle hypertrophy and prevent negative effects of HFD feeding linked to insulin and anabolic resistance [29].
In conclusion, while SUCC supplementation showed potential in mitigating adverse effects of HFD on energy intake and weight gain, its efficacy was limited to the initial phase of the transition from low to high-fat diet. Furthermore, SUCC did not have any significant effect on changes in muscle mass after overloading or denervation, questioning the usefulness of these supplements as a nutritional intervention to promote muscle hypertrophy or limit muscle atrophy after denervation.
Author Contributions
Conceptualization, A.R. and D.M.; methodology, A.R. M.D. and P.M.; formal analysis, A.R and M.D..; investigation, D.M. and P.M.; data curation, A.R. and D.M..; writing—original draft preparation, A.R.; writing—review and editing, A.R., M.D. and P.M.
Funding
This research received no external funding.
Institutional Review Board Statement
The study was carried out at the animal research facility of the Lithuanian Sports University after receiving approval by the Lithuanian Republic Alimentary and Veterinary Public Office (Ref. G2-90, 2018).
Data Availability Statement
The data that support the findings of this study are available from the corresponding author upon reasonable request.
Acknowledgments
We would like to thank Mrs. Indrė Libnickienė and Dr. Mindaugas Kvedaras for their excellent technical assistance.
Conflicts of Interest
The authors declare no conflicts of interest.
References
- The statistical office of the European Union (Eurostat). Accessed May 20, 2024. https://ec.europa.eu/eurostat/statistics-explained/index.php?title=Overweight_and_obesity_-_BMI_statistics.
- Tomlinson, D.J. , Erskine R.M., Morse C.I., Winwood K., Onambélé-Pearson G. The impact of obesity on skeletal muscle strength and structure through adolescence to old age. Biogerontology 2016, 17, 467–483. [Google Scholar] [CrossRef] [PubMed]
- Dye, L. , Boyle N.B., Champ C., Lawton C. The relationship between obesity and cognitive health and decline. Proc. Nutr. Soc. 2017, 76, 443–454. [Google Scholar] [CrossRef]
- Debes, W.A. , Sadaqa M., Németh Z., Aldardour A., Prémusz V., Hock M. Effect of Resistance Exercise on Body Composition and Functional Capacity in Older Women with Sarcopenic Obesity-A Systematic Review with Narrative Synthesis. J. Clin. Med. 2024, 13, 441. [Google Scholar] [CrossRef] [PubMed]
- Morton, R.W. , Murphy K.T., McKellar S.R., Schoenfeld B.J., Henselmans M., Helms E., Aragon A.A., Devries M.C., Banfield L., Krieger J.W., Phillips S.M. A systematic review, meta-analysis and meta-regression of the effect of protein supplementation on resistance training-induced gains in muscle mass and strength in healthy adults. Br. J. Sports Med. 2018, 52, 376–384. [Google Scholar] [CrossRef] [PubMed]
- Sousa, L.G.O. , Marshall A.G., Norman J.E. et al. The effects of diet composition and chronic obesity on muscle growth and function. J. Appl. Physiol. (1985). 2021, 130, 124–138. [Google Scholar] [CrossRef] [PubMed]
- Eilander, A. , Harika R.K., Zock P.L. Intake and sources of dietary fatty acids in Europe: Are current population intakes of fats aligned with dietary recommendations? Eur. J. Lipid. Sci. Technol. 2015, 117, 1370–1377. [Google Scholar] [CrossRef] [PubMed]
- Ioannidis, J.P.A. The Challenge of Reforming Nutritional Epidemiologic Research. JAMA. 2018, 320, 969–970. [Google Scholar] [CrossRef]
- Petersen, E.W. , Carey A.L., Sacchetti M, et al. Acute IL-6 treatment increases fatty acid turnover in elderly humans in vivo and in tissue culture in vitro. Am. J. Physiol. Endocrinol. Metab. 2005, 288, E155–62. [Google Scholar] [CrossRef] [PubMed]
- Gubert, C. , Hannan A.J. Exercise mimetics: harnessing the therapeutic effects of physical activity. Nat. Rev. Drug Discov. 2021, 20, 862–879. [Google Scholar] [CrossRef]
- Hochachka, P.W. , Dressendorfer R.H. Succinate accumulation in man during exercise. Eur. J. Appl. Physiol. Occup. Physiol. 1976, 35, 235–242. [Google Scholar] [CrossRef]
- Mills, E.L. , Pierce K.A., Jedrychowski M.P., et al. Accumulation of succinate controls activation of adipose tissue thermogenesis. Nature 2018, 560, 7716–102. [Google Scholar] [CrossRef] [PubMed]
- Wu, K.K. Extracellular Succinate: A Physiological Messenger and a Pathological Trigger. Int. J. Mol. Sci. 2023, 24, 11165. [Google Scholar] [CrossRef] [PubMed]
- Yuan, Y. , Xu Y., Xu J. et al. Succinate promotes skeletal muscle protein synthesis via Erk1/2 signaling pathway. Mol. Med. Rep. 2017, 16, 7361–7366. [Google Scholar] [CrossRef]
- Reddy, A. , Bozi L.H.M., Yaghi O.K. et al. pH-Gated Succinate Secretion Regulates Muscle Remodeling in Response to Exercise. Cell. 2020, 183, 62–75. [Google Scholar] [CrossRef]
- Kvedaras, M. , Minderis P., Krusnauskas R., Lionikas A., Ratkevicius A.. Myostatin dysfunction is associated with lower physical activity and reduced improvements in glucose tolerance in response to caloric restriction in Berlin high mice. Exp. Gerontol. 2019, 128, 110751. [Google Scholar] [CrossRef]
- Minderis, P. , Fokin A., Dirmontas M., Kvedaras M., Ratkevicius A. Caloric Restriction per se Rather Than Dietary Macronutrient Distribution Plays a Primary Role in Metabolic Health and Body Composition Improvements in Obese Mice. Nutrients 2021, 13, 3004. [Google Scholar] [CrossRef]
- Swaminathan, A. , Fokin A., Venckūnas T., Degens H. Methionine restriction plus overload improves skeletal muscle and metabolic health in old mice on a high fat diet. Sci. Rep. 2021, 11, 1260. [Google Scholar] [CrossRef]
- Gao, L. , Hu S., Yang D. et al. The hedonic overdrive model best explains high-fat diet-induced obesity in C57BL/6 mice. Obesity (Silver Spring). 2024, 32, 733–742. [Google Scholar] [CrossRef] [PubMed]
- Hu, S. , Wang L., Yang D. et al. Dietary Fat, but Not Protein or Carbohydrate, Regulates Energy Intake and Causes Adiposity in Mice. Cell Metab. 2018, 28, 3–415. [Google Scholar] [CrossRef]
- McDougle, M. , de Araujo A., Singh A., et al. Separate gut-brain circuits for fat and sugar reinforcement combine to promote overeating. Cell Metab. 2024, 36, 393–407. [Google Scholar] [CrossRef]
- Roberts, M.N. , Wallace M.A., Tomilov A.A., et al. A Ketogenic Diet Extends Longevity and Healthspan in Adult Mice. Cell Metab. 2017, 26, 539–546. [Google Scholar] [CrossRef] [PubMed]
- Hatori, M. , Vollmers C., Zarrinpar A. et al. Time-restricted feeding without reducing caloric intake prevents metabolic diseases in mice fed a high-fat diet. Cell Metab. 2012, 15, 848–860. [Google Scholar] [CrossRef] [PubMed]
- Roberts, M.D. , McCarthy J.J., Hornberger T.A. et al. Mechanisms of mechanical overload-induced skeletal muscle hypertrophy: current understanding and future directions. Physiol. Rev. 2023, 103, 2679–2757. [Google Scholar] [CrossRef] [PubMed]
- Roy, R.R. , Hutchison D.L., Pierotti D.J., Hodgson J.A., Edgerton V.R. EMG patterns of rat ankle extensors and flexors during treadmill locomotion and swimming. J. Appl. Physiol. (1985). 1991, 70, 2522–2529. [Google Scholar] [CrossRef] [PubMed]
- Sitnick, M. , Bodine S.C., Rutledge J.C. Chronic high fat feeding attenuates load-induced hypertrophy in mice. J. Physiol. 2009, 587 Pt 23, 5753–5765. [Google Scholar] [CrossRef]
- Jensen, B.A. , Nielsen T.S., Fritzen A.M. et al. Dietary fat drives whole-body insulin resistance and promotes intestinal inflammation independent of body weight gain. Metabolism 2016, 65, 1706–1719. [Google Scholar] [CrossRef] [PubMed]
- Pinel, A. , Guillet C., Capel F. et al. Identification of factors associated with sarcopenic obesity development: Literature review and expert panel voting. Clin. Nutr. 2024, 43, 1414–1424. [Google Scholar] [CrossRef]
- Wu, Y. , Li B., Li L., Mitchell S.E. et al. Very-low-protein diets lead to reduced food intake and weight loss, linked to inhibition of hypothalamic mTOR signaling, in mice. Cell Metab. 2021, 33, 1264–1266. [Google Scholar] [CrossRef]
Figure 1.
Energy intake and body mass in C57BL/6J mice were measured under three dietary conditions: regular diet (RD, a and b, respectively), high-fat diet (HFD, c and d, respectively), and ketogenic diet (KD, e and f, respectively) over a period of 12 weeks. The mice were provided with either 2% succinate supplements in their drinking water (SUS) or no supplements (CON). Data on energy intake and body mass for the 3 weeks preceding the dietary transition are also included. The initial 2-week transition period to the different diets is highlighted by rectangles. Results are presented as mean ± SD. The effects of SUS were analyzed using two-way repeated measures ANOVA with Bonferroni’s post hoc test. *** p < 0.001 indicates a significant interaction between time and SUS.
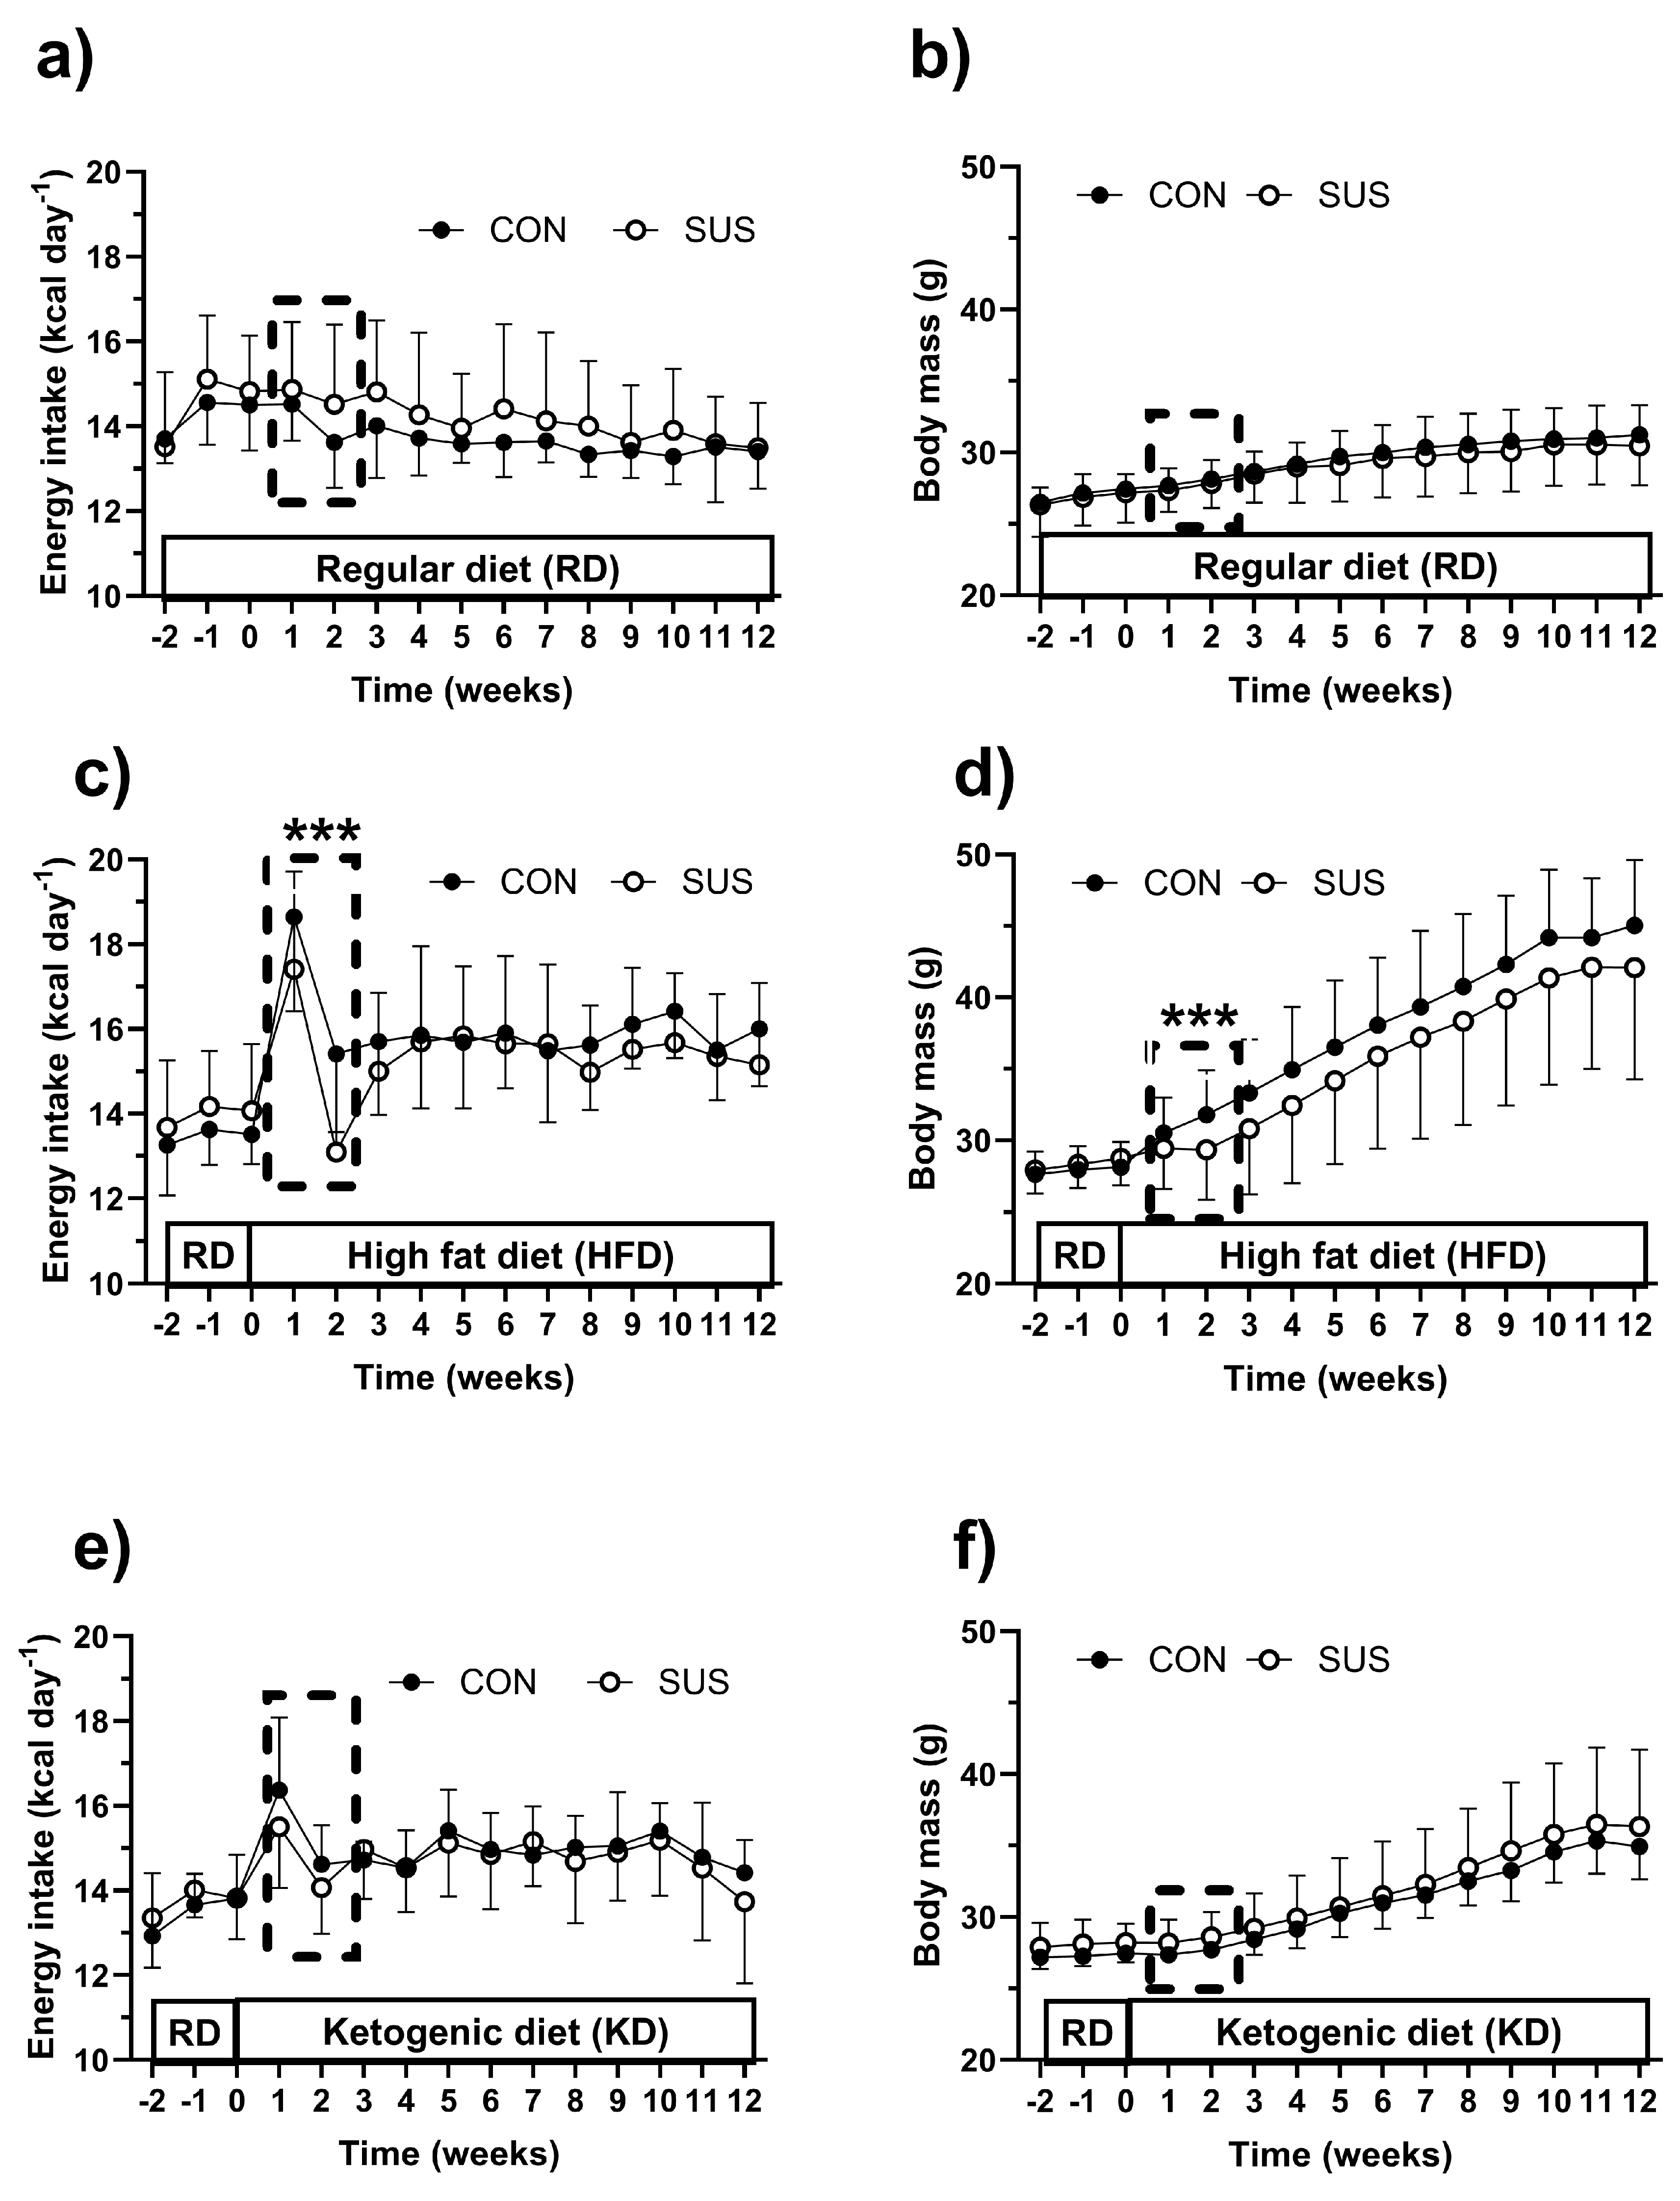
Figure 2.
Muscle mass index (a), heart mass (b), liver mass (c), total white adipose tissue mass (tWAT, d), interscapular brown adipose tissue mass (iBAT, e), and blood β-hydroxybutyrate (HB, f) levels in C57BL/6J mice fed a regular chow diet (RD), high-fat diet (HFD), or ketogenic diet (KD) for 12 weeks. The mice received either a 2% succinate supplement in their drinking water (SUS) or no supplement (CON). Data are presented as mean ± SD. Statistical analysis was conducted using two-way ANOVA followed by Bonferroni’s post hoc test; * p < 0.05, *** p < 0.001 indicate significant differences from RD, while # p < 0.05, ### p < 0.001 indicate significant differences from HFD.
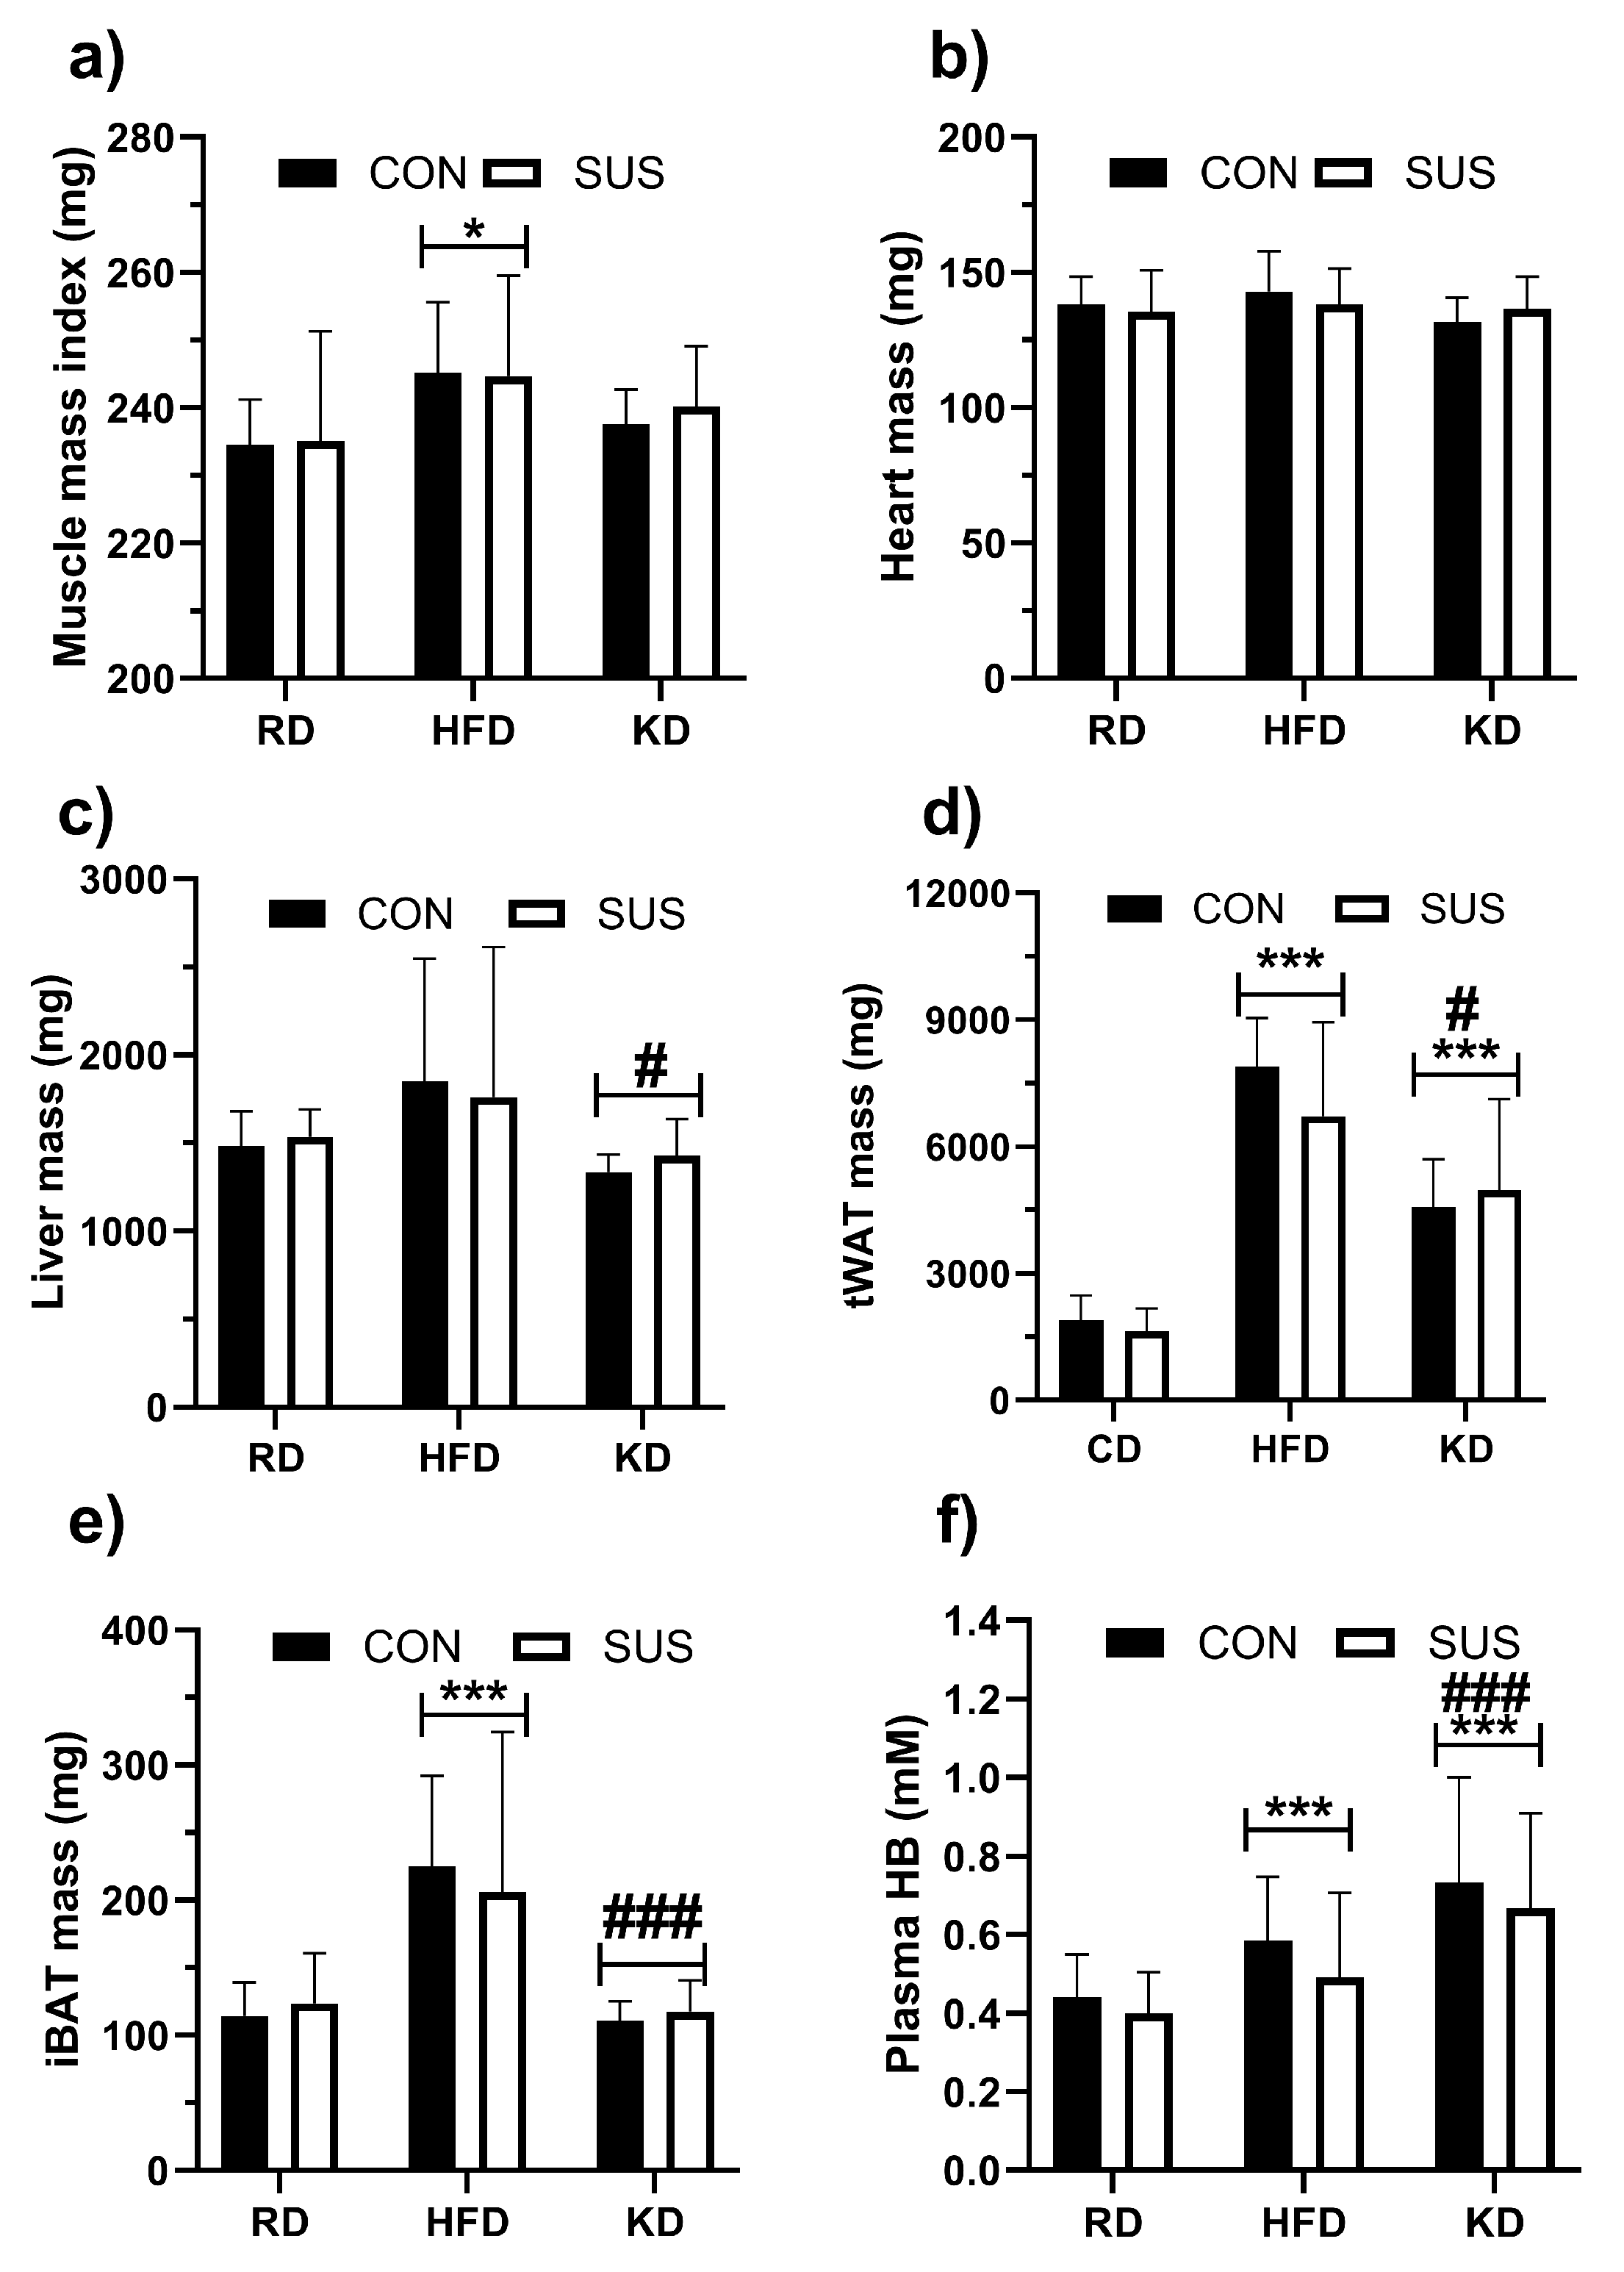
Figure 3.
Energy expenditure (EE), respiratory exchange ratio (RER), physical activity and rearing measures in C57BL/6J mice fed regular chow diet (RD), high fat diet (HFD) or ketogenic diet (KD) for 12 weeks with 2% succinate added to drinking water (SUS) and without SUCC in the water (CON). Data are shown as mean with SD. Two-way ANOVA with Bonferroni’s post hoc testing was performed; *** p < 0.001 for difference from RD, ### p < 0.001 for difference from HFD, respectively.
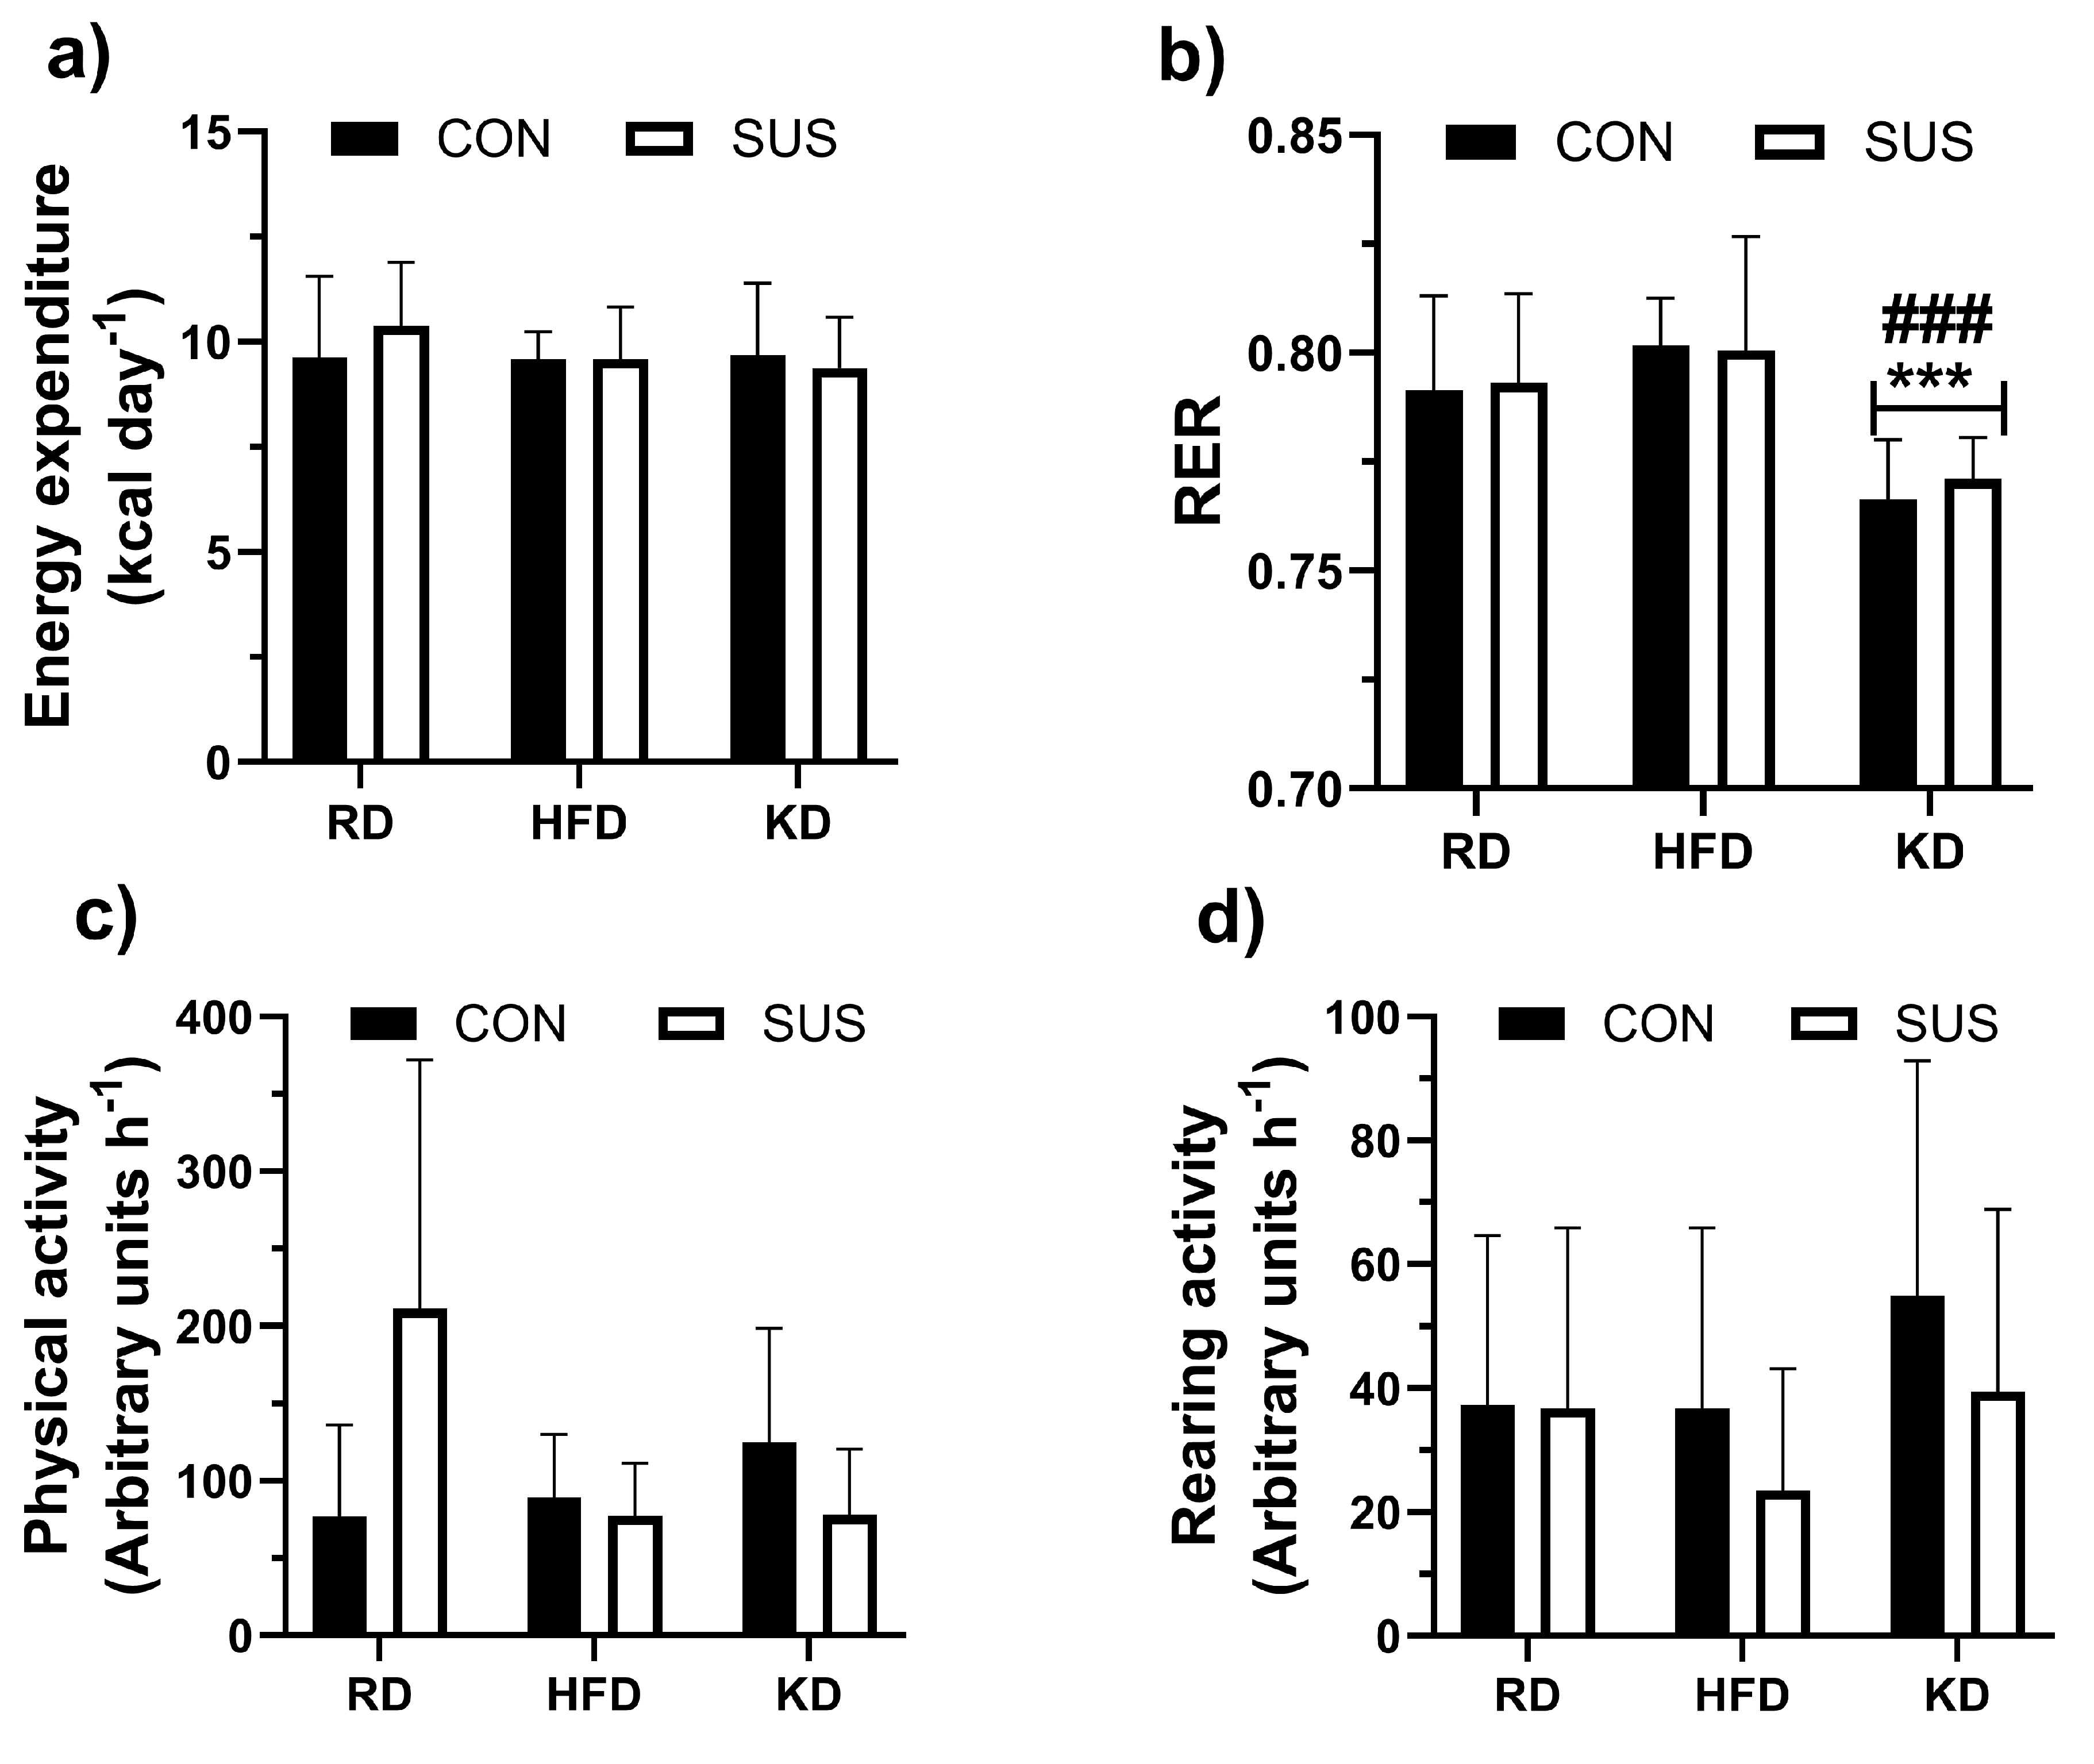
Figure 4.
Blood glucose levels during glucose tolerance tests in C57BL/6J mice fed a regular chow diet (RD, a), high-fat diet (HFD, b), and ketogenic diet (KD, c) for 12 weeks are shown, with comparisons between those given 2% succinate supplements in drinking water (SUS) and those without supplements (CON). The glucose area under the curve (Glucose AUC) is also presented (d). Data are shown as mean ± SD. Two-way ANOVA with Bonferroni’s post hoc test was used to assess the effects of diet and SUS on Glucose AUC. ** p < 0.01, *** p < 0.001 indicate significant differences from RD, and † p < 0.05 indicates a significant difference from peak glucose at 30 min of the glucose tolerance test.
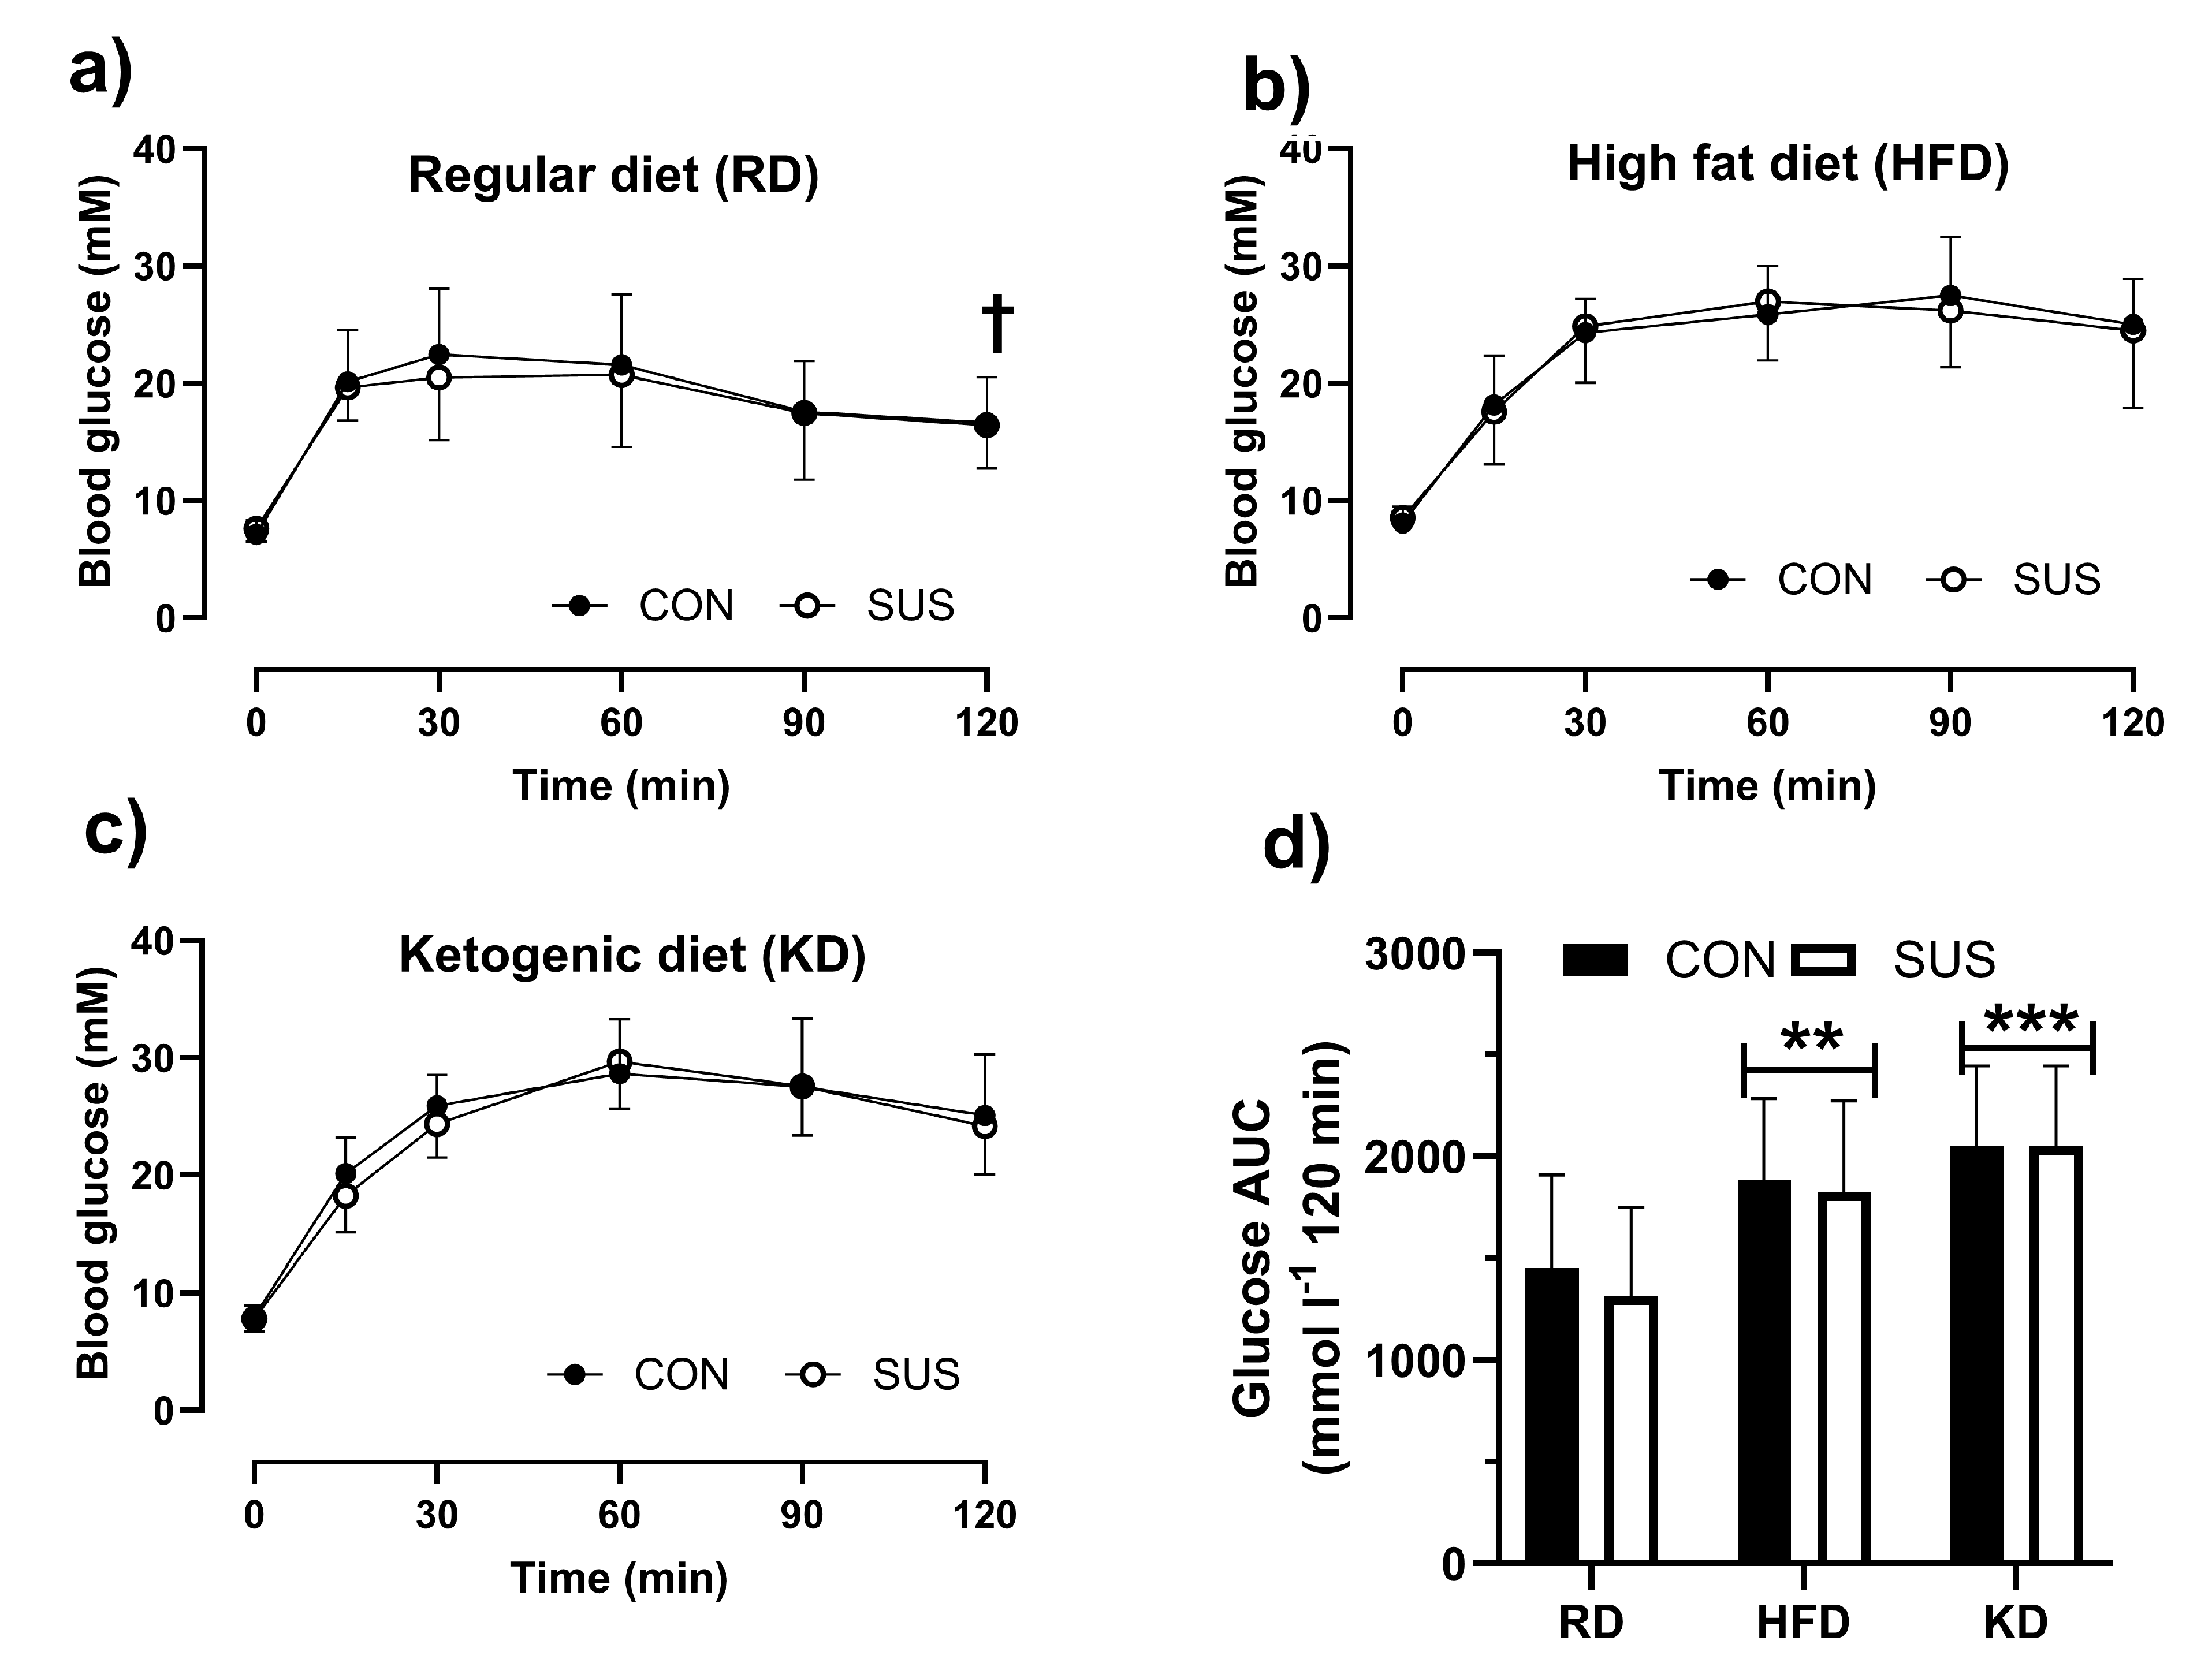
Figure 5.
percentage changes in muscle mass of the treated hindlimb compared to the control limb for the gastrocnemius (GAS), soleus (SOL), and plantaris (PL) muscles in C57BL/6J mice under three different diet conditions: regular diet (RD, a), high fat diet (HFD, b), and ketogenic diet (KD, c). The data is presented for mice that were either exposed to 2% succinate in their drinking water (SUS) or not exposed (CON). Mean values with standard deviation (SD) are displayed. A two-way ANOVA with Bonferroni’s post hoc test was conducted, with *** indicating p < 0.001 for differences from GAS. Additionally, scatter plots demonstrate the association between the glucose area under the curve (AUC) in glucose tolerance tests and the percentage hypertrophy of the PL muscle (panel D), as well as the atrophy of the GAS (panel E) and SOL (panel F) muscles. The figures also present Pearson’s correlation coefficients and their significance (p values).
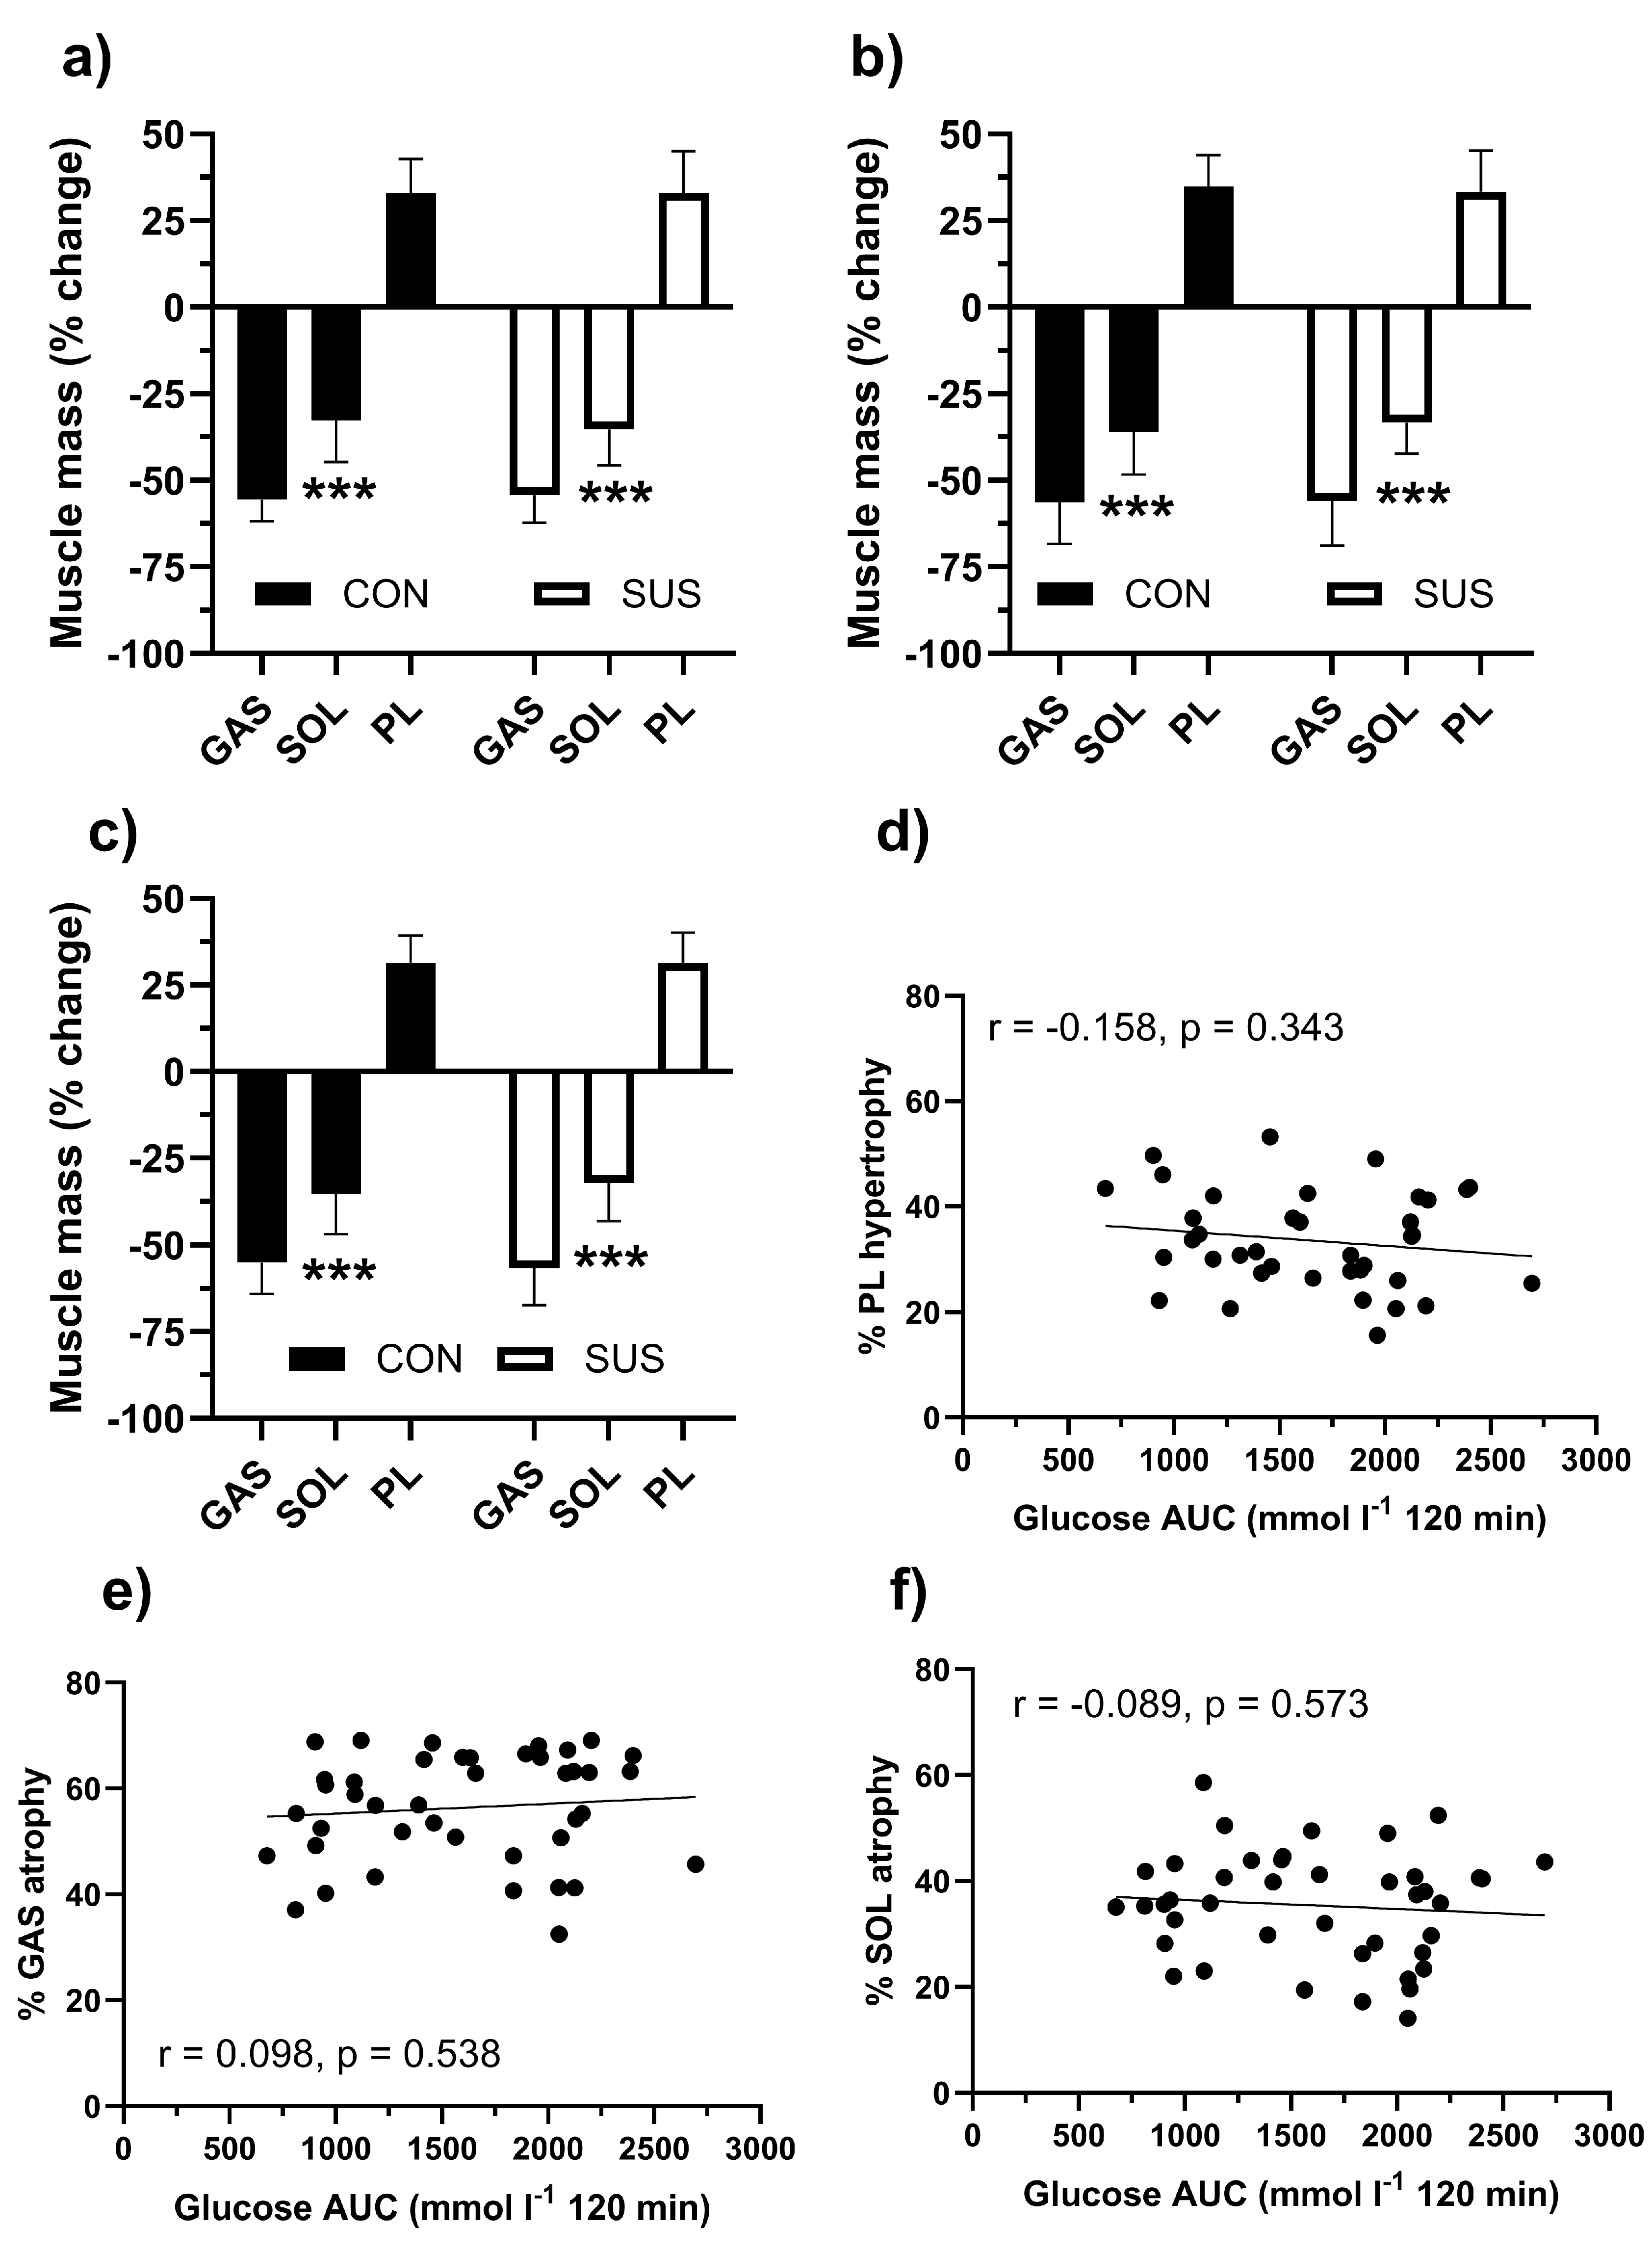

Table 1.
Muscle mass of plantaris (PL), gastrocnemius (GAS) and soleus (SOL) muscles in mice fed regular diet (RD), high fat diet (HFD or ketogenic diet (KD) either a 2% succinate supplement in their drinking water (SUS) or no supplement (CON)..
Table 1.
Muscle mass of plantaris (PL), gastrocnemius (GAS) and soleus (SOL) muscles in mice fed regular diet (RD), high fat diet (HFD or ketogenic diet (KD) either a 2% succinate supplement in their drinking water (SUS) or no supplement (CON)..
| RD | HFD | KD | |||||
|---|---|---|---|---|---|---|---|
| CON | SUS | CON | SUS | CON | SUS | ||
|
PL ††† |
CON | 17.4 ± 1.4 | 17.6 ± 2.1 | 19.1 ± 0.9 | 19.7 ± 1.1 | 19.6 ± 1.7 | 19.9 ± 1.9 |
| FO ### | 23.2 ± 2.3 | 23.3 ± 3.1 | 25.8 ± 2.3 | 26.3 ± 2.9 | 25.6 ± 1.3 | 26.1 ± 2.6 | |
| *** | *** | ||||||
|
GAS † |
CON | 136.6 ± 7.6 | 136.4 ± 9.0 | 145.3 ± 5.7 | 148.0 ± 7.7 | 140.4 ± 8.0 | 140.6 ± 10.2 |
| DEN ### | 60.5 ± 6.8 | 62.1 ± 10.7 | 63.5 ± 17.3 | 64.8 ± 17.7 | 63.3 ± 13.9 | 60.3 ± 12.5 | |
| * | |||||||
|
SOL †† |
CON | 9.0 ± 0.9 | 9.3 ± 0.7 | 10.5 ± 0.9 | 10.3 ± 0.8 | 10.1 ± 1.0 | 10.3 ± 0.8 |
| DEN ### | 6.0 ± 1.1 | 6.0 ± 0.7 | 6.7 ± 1.3 | 6.9 ± 1.1 | 6.5 ± 0.9 | 7.0 ± 1.3 | |
| *** | *** | ||||||
Two-way repeated measures ANOVA with Bonferroni’s post hoc testing was performed to assess effects of diet, succinate supplementation (SUS) and effects functional overloading (FO) or denervation (DEN), respectively. Values are presented as mean ± SD. † p < 0.05, †† p < 0.01, ††† p < 0.001 for effects of diet, * p < 0.05, *** p < 0.001 compared to RD, ### p < 0.001 versus CON.
Disclaimer/Publisher’s Note: The statements, opinions and data contained in all publications are solely those of the individual author(s) and contributor(s) and not of MDPI and/or the editor(s). MDPI and/or the editor(s) disclaim responsibility for any injury to people or property resulting from any ideas, methods, instructions or products referred to in the content. |
© 2024 by the authors. Licensee MDPI, Basel, Switzerland. This article is an open access article distributed under the terms and conditions of the Creative Commons Attribution (CC BY) license (http://creativecommons.org/licenses/by/4.0/).
Copyright: This open access article is published under a Creative Commons CC BY 4.0 license, which permit the free download, distribution, and reuse, provided that the author and preprint are cited in any reuse.


