
Submitted:
25 June 2025
Posted:
26 June 2025
You are already at the latest version
Abstract
The shift from manual to conditionally automated driving, supported by Advanced Driving Assistance Systems (ADAS), introduces challenges, particularly increased crash risks due to human factors like cognitive overload. Driving simulators provide a safe and controlled setting to study these human factors under complex conditions. This study leverages Functional Near-Infrared Spectroscopy (fNIRS) to dynamically assess cognitive load in a realistic driving simulator during a challenging nighttime-rain scenario. Thirty-eight participants performed an auditory n-back task (0-, 1-, and 2-back) while driving, simulating multitasking demands. A sliding window approach was applied to the time-series fNIRS data to capture short-term fluctuations in brain activation. The data were analyzed using EEGNet, a deep learning model, with both overlapping and non-overlapping temporal segmentation strategies. Results revealed that classification performance is significantly influenced by learning rate and windowing method. Notably, a learning rate of 0.001 yielded the highest performance, with 100% accuracy using overlapping windows and 97% accuracy with non-overlapping windows. These findings highlight the potential of combining fNIRS and deep learning for real-time cognitive load monitoring in simulated driving scenarios and demonstrate the importance of temporal modeling in physiological signal analysis.
Keywords:
cognitive load
; fNIRS
; driving simulator
; EEGNet
; deep learning model
1. Introduction
Driver inattention remains one of the primary contributing factors to road traffic accidents worldwide. A critical subset of inattention is driver distraction, which specifically refers to the diversion of attention from tasks essential for safe driving to non-driving-related activities. These distractions can stem from both internal sources (e.g., using infotainment systems, texting, eating, or conversing with passengers) and external sources (e.g., looking at billboards or roadside events). Such distractions compromise the driver’s situational awareness, reaction time, and overall ability to maintain safe control of the vehicle. Although the advancement of automated driving technologies is expected to significantly reduce road traffic accidents potentially eliminating up to 90% of incidents caused by human error driver monitoring remains crucial [1]. Even in partially automated vehicles, drivers are often required to maintain situational awareness and resume control under certain conditions. Hence, understanding and detecting driver cognitive workload and distraction is vital for the design of safer and more adaptive driver-assistance systems.
Despite these limitations, driving simulators remain the safest and most controlled method for exposing participants to challenging or hazardous driving scenarios without placing them at risk of physical harm, collisions, or property damage [2]. Simulators offer a highly customizable environment in which various factors such as traffic density, road geometry, weather conditions, time of day, and distraction-inducing elements can be manipulated to replicate real-world driving challenges. This enables researchers to systematically investigate human behaviour and physiological responses under controlled but realistic conditions that would otherwise be unsafe or impractical to study on actual roads [3]. In this study, the elevated levels of cognitive workload observed during the experiments were intentionally induced through a combination of environmental stressors (e.g., nighttime driving and heavy rainfall) and secondary task demands, such as the auditory n-back task. These stressors were designed to replicate real-world multitasking demands and increase mental effort, thereby simulating complex driving situations that require increased attention, decision making, and working memory.
Previous neuroimaging studies utilizing techniques such as Functional Near-Infrared Spectroscopy (fNIRS) have extensively investigated the relationship between cognitive workload and brain activity, with a particular focus on task-induced activation in specific cortical regions [4,5]. These studies consistently show that increased cognitive demands often manipulated through working memory tasks lead to heightened activation in areas such as the prefrontal cortex and parietal lobe, which are key regions involved in attention, executive function, and memory processing [6].
fNIRS-based studies have frequently reported load-dependent increases in Oxygenated (HbO2) levels in the frontal cortex as n increases, typically showing a pattern where 2-back tasks elicit stronger activation than 1-back, which in turn elicit more than 0-back [7,8]. However, this relationship is not always linear. In several studies, a non-linear activation pattern has been observed, where frontal activation may plateau or even decrease at the highest task difficulty, contrary to the expected trend [9]. This has been attributed to task disengagement, where participants may mentally give up when the cognitive demands exceed their processing capacity. Another explanation is that cortical activation may saturate, reaching a physiological ceiling beyond which no further activation is possible, regardless of task difficulty. To analyse the complex neural patterns captured in fNIRS data, a wide range of machine learning (ML) and deep learning (DL) algorithms have been employed. Traditional ML techniques such as Support Vector Machines (SVMs), Linear Discriminant Analysis (LDA), k-Nearest Neighbours (k-NN), and Random Forests have been widely used for classification of workload levels [4,10]. More recently, deep learning approaches including Convolutional Neural Networks (CNNs), Long Short-Term Memory (LSTM) networks, and Gated Recurrent Units (GRUs) have gained traction due to their ability to automatically extract and model temporal and spatial features from high-dimensional fNIRS signals [11,12]. These models are particularly useful in capturing subtle, non-linear patterns that traditional models might miss, offering new opportunities for robust and real-time workload classification.
The primary objective of this study is to investigate the impact of cognitive load on drivers within a controlled, high-fidelity simulated driving environment, specifically under challenging conditions such as night-time driving and heavy rainfall. These environmental stressors were chosen to closely replicate real-world situations where drivers often experience heightened mental demands due to reduced visibility, increased vigilance, and complex decision-making requirements. Unlike many previous studies that have primarily focused on only two levels of cognitive workload typically low and high, this research introduces a three levels of workload paradigm using an auditory-modified n-back task (0-back, 1-back, and 2-back). This approach demonstrates how incremental increases in cognitive demand affect driver performance and brain activity. A key aim of this study is also to examine whether these increasing levels of cognitive workload are associated with corresponding changes in cerebral blood oxygenation, as measured by fNIRS. Specifically, we investigate whether higher mental effort correlates with elevated levels of oxygenated HbO2 in the prefrontal cortex an area known to be involved in working memory, attention, and executive function.
2. Materials and Methods
A total of 38 drivers participated in this study. To ensure consistency in cognitive performance across participants, a set of specific inclusion criteria was established. All participants were required to possess a valid driver’s license, confirming their eligibility and basic driving competence. Additionally, individuals with any known history of mental health disorders, neurological conditions, or physical impairments that could potentially affect cognitive functioning were excluded from the study. This careful selection process was designed to reduce inter-individual variability in cognitive ability, thereby enhancing the reliability and comparability of the results obtained from the experimental tasks. By controlling for these factors, the study aimed to isolate the cognitive effects of the driving scenarios under investigation more effectively.
Driving Simulator
For this study, we utilized a driving simulator setup designed to deliver a realistic driving experience. At the core of the system was the Next Level Racing Motion Platform V3, securely mounted on the Traction Plus Platform. This combination was specifically chosen to enhance motion feedback, allowing participants to physically perceive vehicle dynamics such as acceleration, braking, and road vibrations, thereby improving the overall realism of the simulation. The visual interface of the simulator comprised three large 32-inch Samsung monitors, arranged in a panoramic configuration to provide a wide field of view. This setup was used in simulating peripheral vision and increasing participants’ situational awareness, both of which are critical for realistic driving behaviour. To further enrich the tactile experience, a Thrust master T300 steering wheel and pedal system was integrated into the simulator. This system offered accurate force feedback, allowing participants to experience real-time steering resistance, road texture, and vehicular control with high fidelity. A visual illustration of the complete simulator setup is presented in Figure 1.
To replicate the feel and functionality of a real vehicle, the simulator was configured to mirror the driving dynamics and interior layout of a Toyota Fortuner SUV. This vehicle model was selected to maintain consistency in participants’ perception of vehicle handling, cabin environment, and spatial awareness. For the driving scenarios, we employed Euro Truck Simulator 2 (ETS2) software, recognized for its realistic driving physics and extensive environmental conditions. ETS2 was selected for its capability to emulate a wide range of driving environments, including highway cruising, urban traffic navigation, and varying weather scenarios such as rain and fog. These features allowed us to construct diverse and cognitively demanding driving tasks representative of real-world conditions.
Secondary Cognitive Task
To simulate realistic multitasking demands and elevate cognitive load during the dual-task driving condition, an auditory-modified n-back task was employed in this study. This task was specifically designed to engage working memory and executive function while participants were simultaneously involved in a dynamic driving scenario. The cognitive load manipulation combined elements of the traditional n-back paradigm with a digit-span task, resulting in three graded levels of difficulty: 0-back, 1-back, and 2-back. The 0-back condition served as the baseline and required minimal cognitive effort, as participants simply identified a pre-specified target digit. In contrast, the 1-back and 2-back conditions progressively increased the memory load, requiring participants to continuously monitor and compare the current digit to the one presented one or two steps earlier in the sequence, respectively. Among these, the 2-back task was designed to impose the highest cognitive demand, thereby enabling assessment of participants’ ability to manage increased mental workload while driving. Auditory stimuli consisted of randomly selected spoken digits ranging from 0 to 9, delivered through the simulator’s speakers in a consistent male voice at fixed time intervals. This modality was chosen to prevent visual distraction and allow seamless integration with the visual demands of the driving task. Participants were instructed to provide their responses using two buttons red and green strategically mounted on the steering wheel for easy access as depicted in Figure 2. Green button indicated a match between the current and the target digit, while the red button indicated a non-match. This hands-on response method ensured minimal physical distraction from the driving task, while maintaining engagement with the cognitive task.
The auditory n-back tasks were developed and implemented using the PsychoPy library [13]. PsychoPy was also utilized to capture participant responses via the red and green buttons mounted on the steering wheel. To ensure a smooth and immersive dual-task experience, PsychoPy was configured to operate in parallel with the driving simulator. This integration was critical for maintaining the ecological validity of the experiment, as it allowed participants to remain fully engaged in the simulated driving environment while concurrently performing the cognitive task.
Functional Near-Infrared Spectroscopy (fNIRS)
The hemodynamic activity of the prefrontal cortex was recorded using a high-density functional near-infrared spectroscopy (fNIRS) device, NIRSIT (OBELAB Inc., South Korea). This wearable neuroimaging system is equipped with 24 light sources (laser diodes) and 32 photodetectors, operating at two near-infrared wavelengths 780 nm and 850 nm to measure changes in cerebral blood oxygenation. Data acquisition was performed at a sampling rate of 8.138 Hz, allowing for continuous monitoring of brain activity throughout the experimental sessions. The source-detector pairs were arranged to create a dense coverage of the prefrontal region, with a fixed inter optode distance of 1.5 cm, as illustrated in Figure 3.
The raw optical density signals collected from the fNIRS device were pre-processed using OBELAB’s built-in Digital Signal Processing (DSP) toolkit. This toolkit applied noise reduction and signal correction algorithms to enhance signal integrity. Following pre-processing, changes in blood oxygenation (HbO2) and deoxygenation (HbR) concentrations were computed using the modified Beer–Lambert Law [14], a standard approach for quantifying hemodynamic responses based on light absorption properties in biological tissues.
Experimental Procedure
The study will begin with the collection of written informed consent from all participants prior to their formal enrolment. Following consent, participants will attend a comprehensive briefing session. During this session, they will receive both verbal and written instructions detailing the study’s purpose, the structure of the experimental tasks, and relevant safety protocols. After the briefing, participants will undergo the sensor fitting procedure. They will be equipped with the necessary physiological and neuroimaging equipment, including a high-density fNIRS system to monitor cerebral hemodynamic. Next, participants will complete a simulator familiarization phase, during which they will spend several minutes interacting with the driving simulator.
The experimental phase will involve participants performing a series of structured driving tasks under controlled yet cognitively demanding conditions. The simulated environment will mimic real-world challenges, including night time driving at approximately 1:00 AM and heavy rainfall. These conditions are intended to increase visual and attentional demands, thereby simulating scenarios that elevate cognitive load and mental fatigue in actual driving situations. While navigating the simulated driving environment, participants will concurrently perform the auditory-modified n-back task at varying difficulty levels (0-back, 1-back, and 2-back). The steering wheel-mounted red and green buttons will reinforce dual-task coordination. This dual-task paradigm is designed to assess cognitive workload by requiring the allocation of attention and working memory resources across both the primary (driving) and secondary (n-back) tasks. Throughout the experimental session, fNIRS will be used to continuously monitor changes in cerebral oxygenation within the prefrontal cortex. Combined with measures of driving performance and task accuracy, the fNIRS data will provide insights into how cognitive load and environmental complexity interact to affect multitasking performance in safety-critical settings.
Research Methodology
fNIRS data is collected from the prefrontal cortex while participants engage in a driving simulator and perform auditory n-back tasks (0-back, 1-back, and 2-back) to induce varying levels of cognitive load. The raw signals undergo a pre-processing pipeline and are segmented into 10-second, 20-second, and 30-second windows using both overlapping and non-overlapping strategies, allowing for analysis of temporal resolution and classification performance. These segments are then fed into EEGNet, a compact convolutional neural network originally designed for EEG data, which is adapted here to classify cognitive workload based on hemodynamic patterns. An overview of the data processing and classification pipeline, including fNIRS acquisition, pre-processing, windowing strategies, and EEGNet classification, is illustrated in Figure 4.
Data Pre-Processing
First, to normalize the feature scales and mitigate the influence of varying baseline values across channels, the fNIRS signals were standardized using the Standard Scaler method as shown in Equation 1. This transformation was applied independently to each channel across the dataset.
In the above equation is the original feature value, is the mean, and is the standard deviation computed across the training dataset. This ensures that the data for each channel has zero mean and unit variance, which improves the convergence of learning algorithms and helps in comparing features on the same scale.
After standardization, the fNIRS time-series data was segmented into temporal windows to extract meaningful features that reflect short-term variations in cognitive load. This segmentation is a critical step in time-series analysis, particularly for physiological signals such as fNIRS, where brain activation patterns fluctuate over time. In this study, two types of segmentation strategies were adopted: overlapping windows and non-overlapping windows. The overlapping window method utilizes a sliding window approach, in which each new segment shares a portion of its data with the previous segment. This technique enhances the temporal resolution of the dataset, potentially capturing transient or transitional changes in cognitive states more effectively. In contrast, the non-overlapping window strategy divides the entire signal into consecutive, discrete segments with no repetition. This method reduces computational load and redundancy in the data but may risk missing subtle transitions between cognitive states.
To determine the most effective temporal resolution for cognitive load classification, we experimented with three different window lengths: 10 seconds, 20 seconds, and 30 seconds. We used the varying window sizes was to explore the trade-off between temporal sensitivity and contextual information. Shorter windows may capture fine-grained fluctuations but can be sensitive to noise, whereas longer windows may smooth out such noise but risk losing rapid cognitive transitions. By comparing the classification performance across these window lengths and segmentation types, we aim to identify the optimal temporal configuration that best represents the underlying patterns of cognitive load in fNIRS data. This systematic segmentation process allows for a robust analysis of how temporal framing affects the predictability and stability of machine learning models applied to cognitive workload detection.
EEGNet Model
To classify cognitive load across three levels (0-back, 1-back, and 2-back), this study employed the EEGNet model architecture [15], originally developed for EEG-based brain–computer interface applications. EEGNet was chosen for its compact design and proven ability to decode neurophysiological signals with relatively few parameters. The structure of EEGNet model is shown in Table 1. The model was trained using the Adam optimizer, which adapts the learning rate during training, and optimized with categorical cross-entropy loss an appropriate objective for multi-class classification. Training was conducted over 200 epochs to enable the model to learn discriminative spatiotemporal features from the input fNIRS data. The EEGNet architecture consists of three sequential blocks designed to progressively extract and integrate spatial and temporal features from the input signals.
Block 1: Spatial Feature Extraction
This block begins with an input layer followed by two key convolutional operations. A 2D convolution is first applied to extract low-level features across time and channels. This is followed by a depthwise convolution, which applies a separate filter to each channel individually. Unlike standard convolutions, this method significantly reduces the number of trainable parameters while still capturing meaningful spatial patterns. Batch normalization follows each convolutional operation, standardizing feature distributions and facilitating stable learning. The depthwise convolution specifically enhances training efficiency and mitigates overfitting, which is particularly valuable when working with relatively small neuroimaging datasets.
Block 2: Separable Convolution for Spatiotemporal Integration
Block 2 employs a separable convolution, which decouples the learning of temporal and spatial patterns. It starts with a depthwise convolution that independently processes each feature map over time, enabling the model to capture temporal dynamics within each channel. This is followed by a pointwise convolution (1×1), which combines the temporally filtered signals across channels, allowing the model to learn cross-channel dependencies. This two-stage approach reduces computational complexity while preserving the ability to represent brain activity patterns distributed across time and spatial locations. By explicitly separating the modeling of temporal and spatial structures, the model becomes better suited to detecting subtle changes in cognitive workload.
Block 3: Classification and Output
The final block of the EEGNet model maps the learned high-level features to class predictions. It begins with a flattening layer that transforms the multi-dimensional feature maps into a one-dimensional vector suitable for classification. This vector is then passed through a dense layer that projects the features onto three output nodes, each representing one of the cognitive load levels (0-back, 1-back, and 2-back). A SoftMax activation follows, generating a probability distribution over the three classes, which enables the model to produce confidence scores for each prediction. The model is trained using the categorical cross-entropy loss function, which compares the predicted probabilities to the true class labels.
Results and Discussions
Given that the dataset comprises 204 fNIRS channels, a feature selection step was necessary to reduce dimensionality and identify the most informative signals associated with cognitive load during simulated driving. To achieve this, we employed the Analysis of Variance (ANOVA) method, a statistical approach commonly used in neuroimaging to evaluate the significance of each feature with respect to class separation. Figure 5 presents the top 50 ranked features identified through ANOVA-based feature selection. As illustrated in the figure, a greater proportion of the selected features correspond to HbO2 channels rather than HbR. This observation suggests that changes in blood HbO2 are more strongly associated with variations in cognitive load than changes in HbR.
Figure 5.
Visualization of the top 50 most significant fNIRS channels identified through ANOVA analysis.
Figure 5.
Visualization of the top 50 most significant fNIRS channels identified through ANOVA analysis.
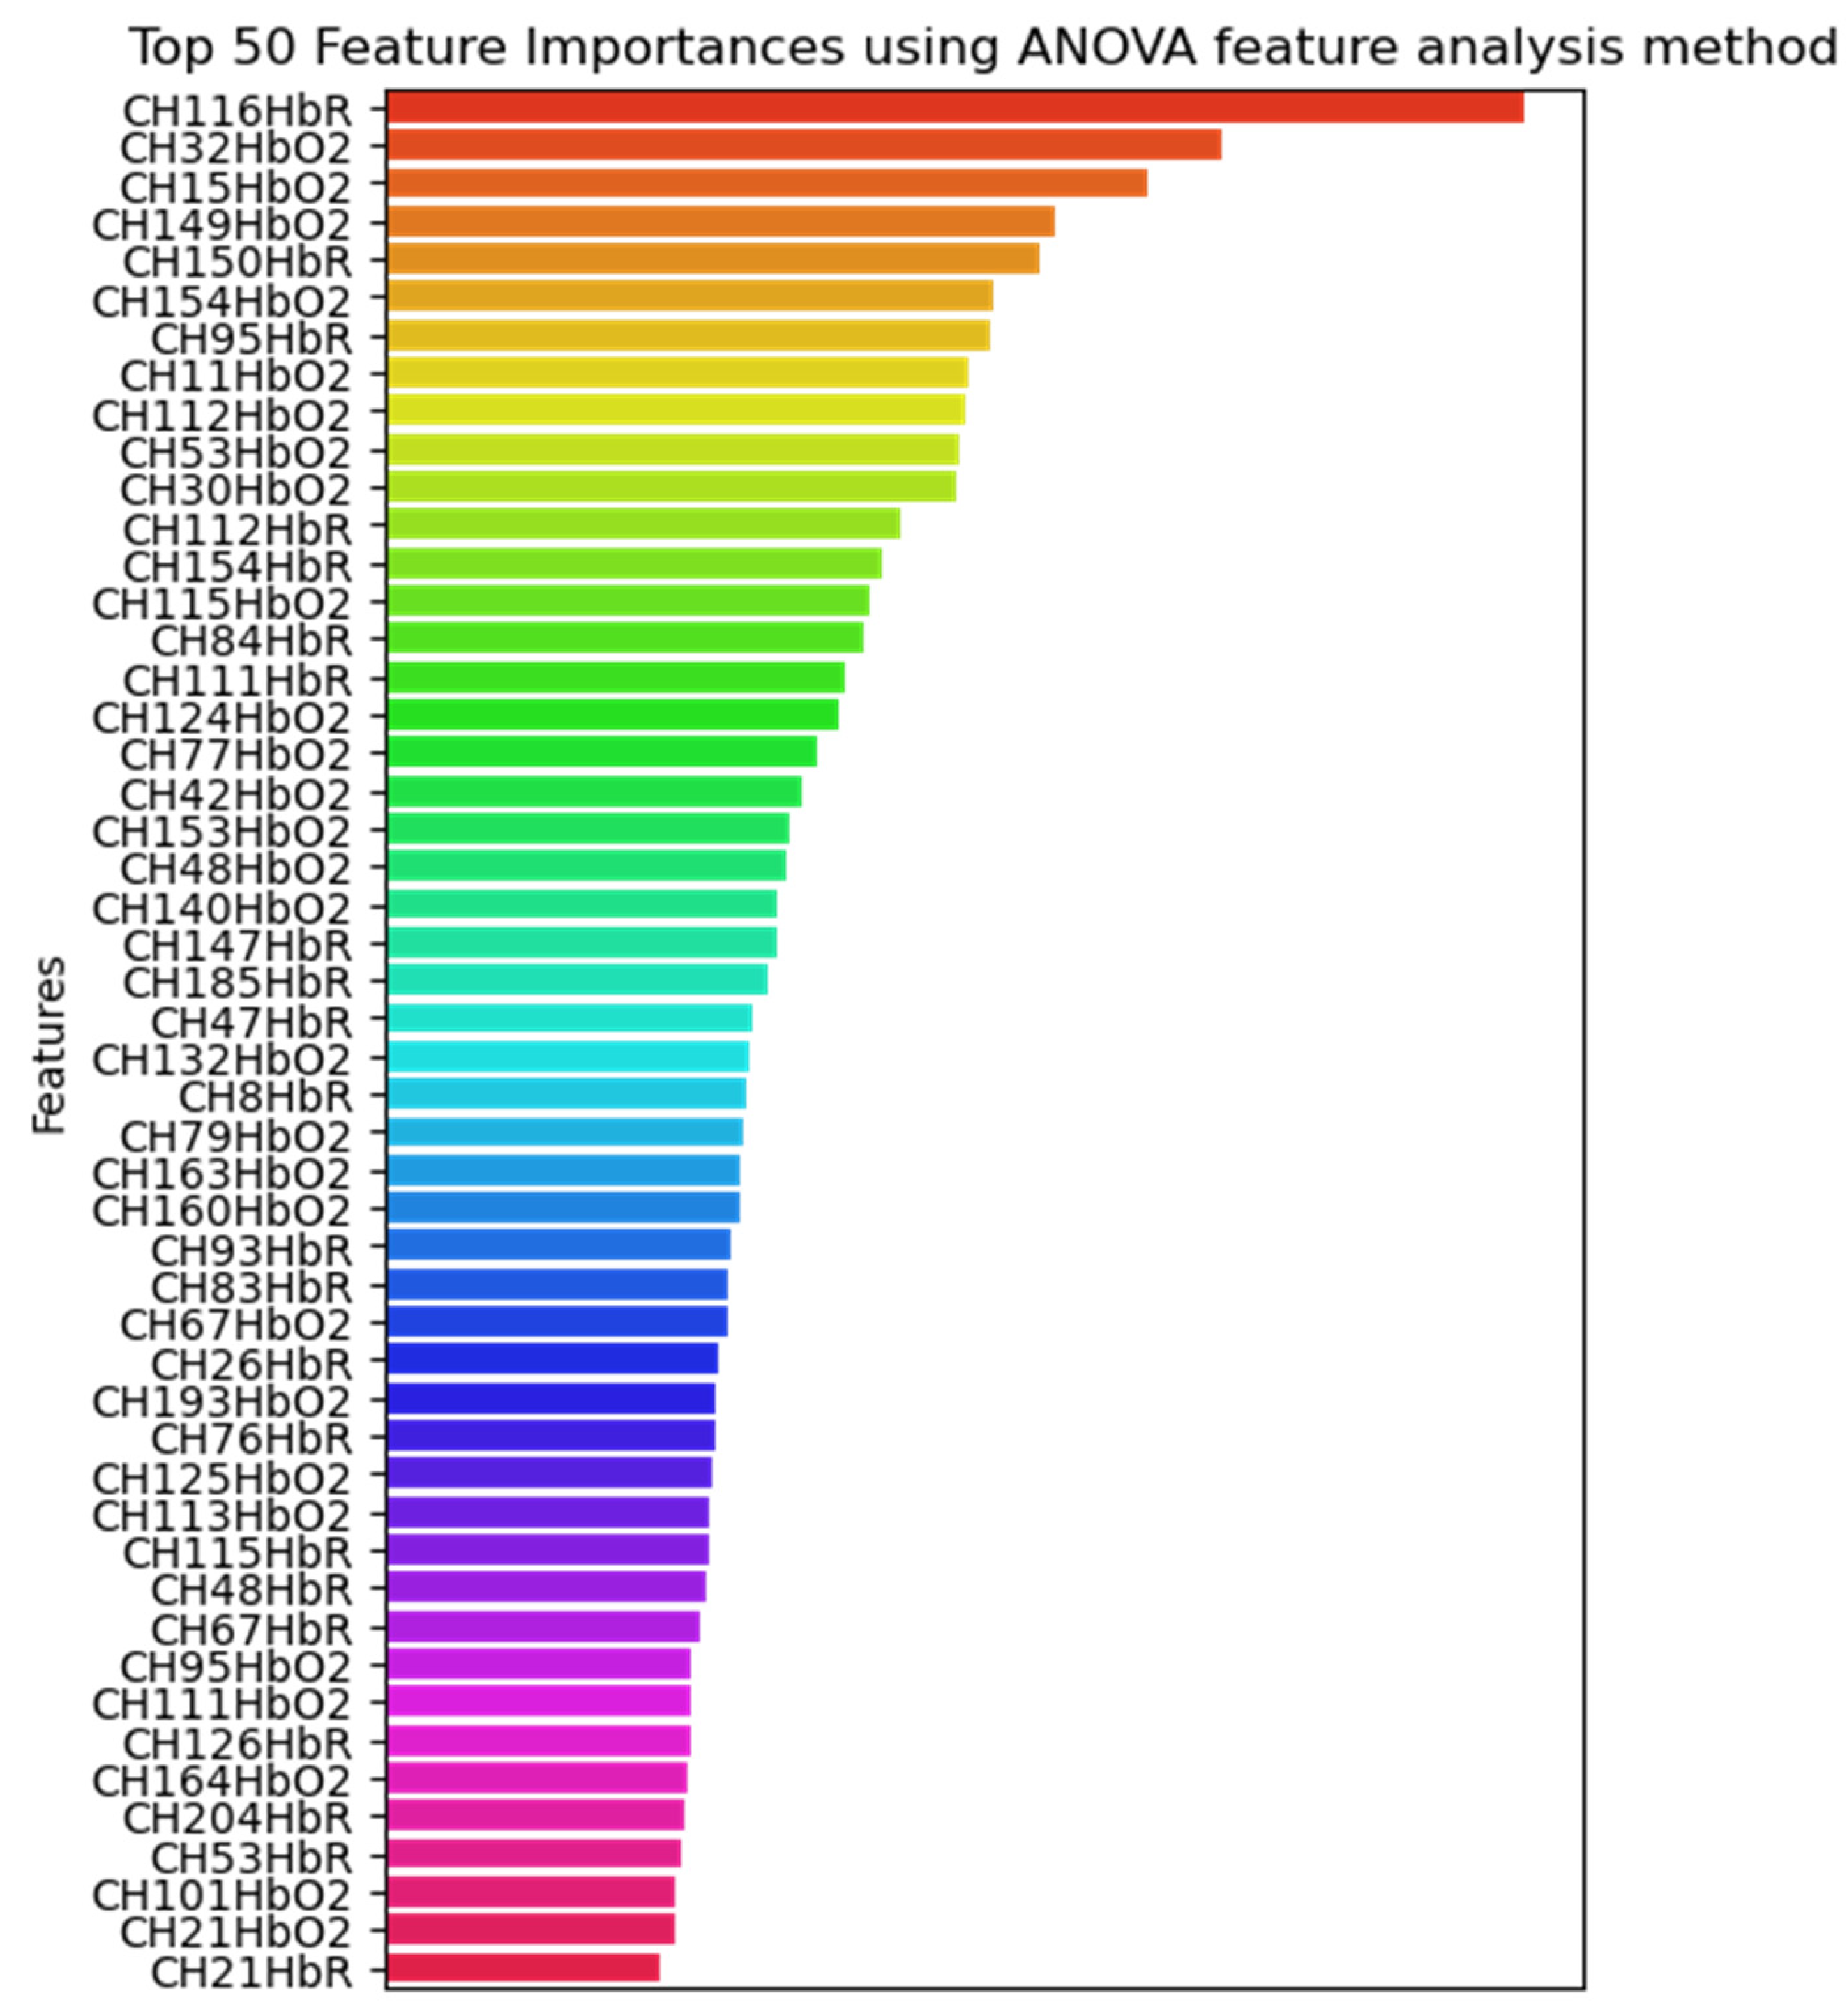
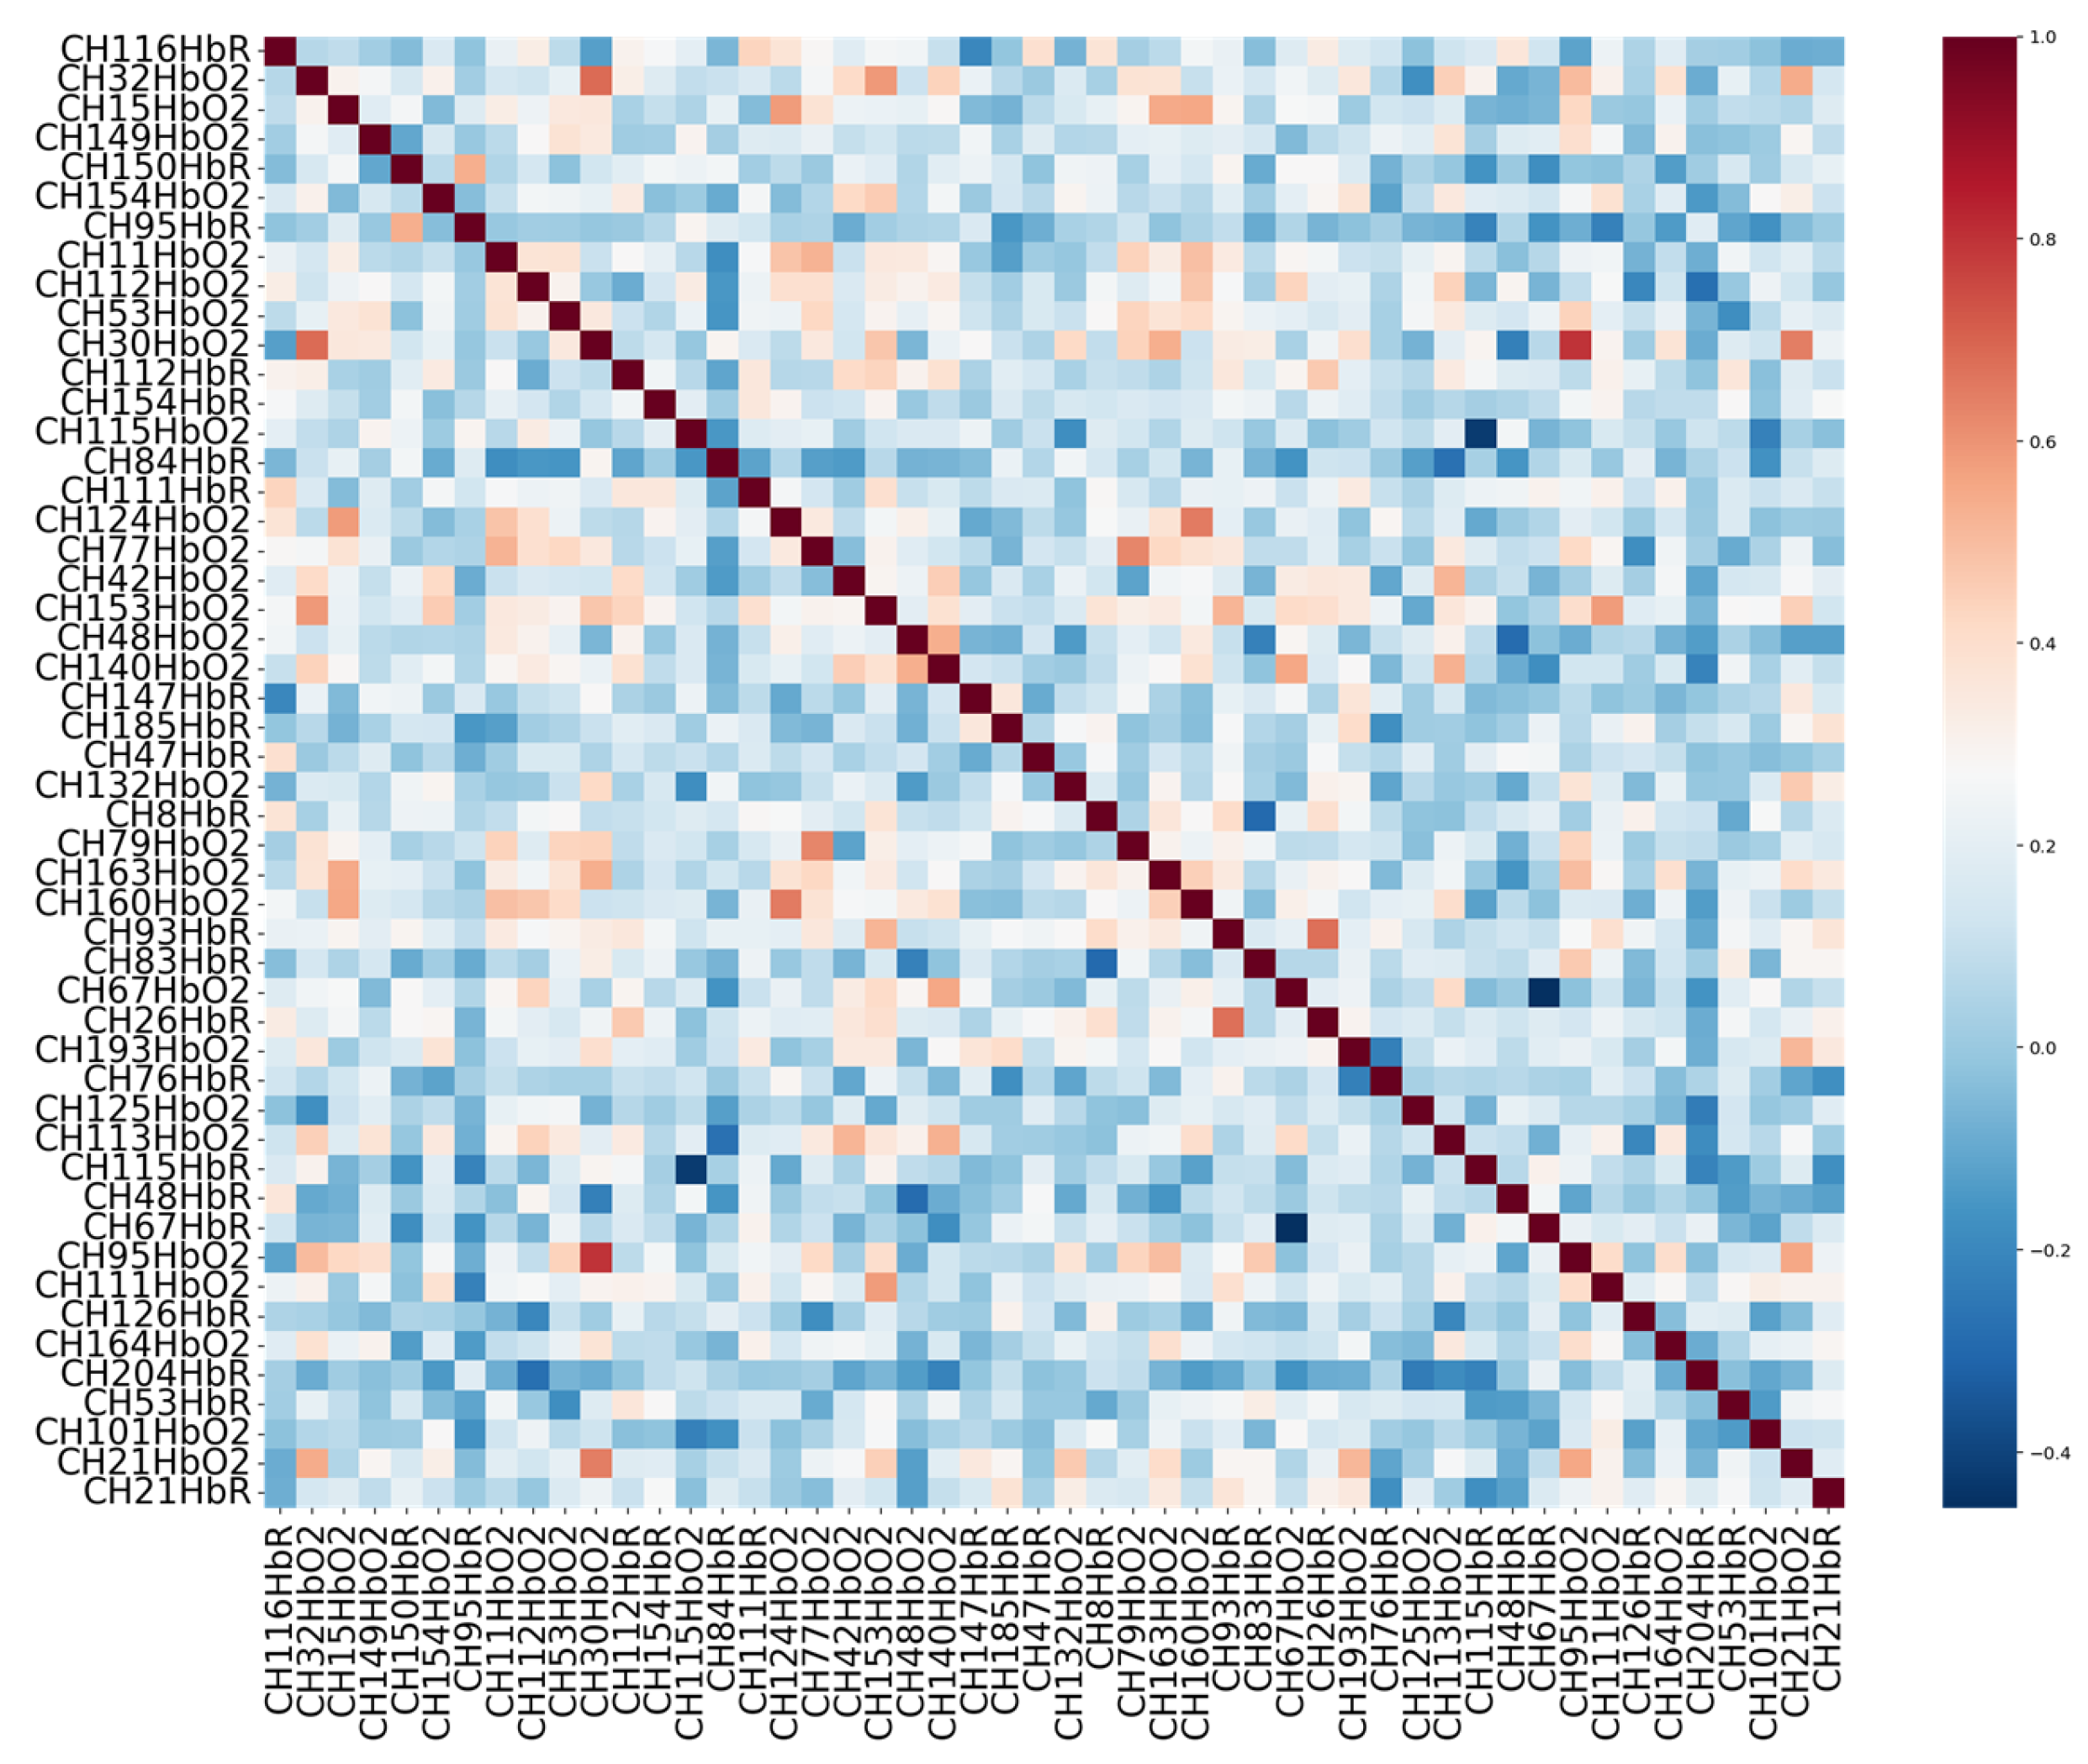
Figure 6.
Correlation heatmap of the top 50 selected fNIRS features, illustrating the pairwise relationships among features after feature selection.
Figure 6.
Correlation heatmap of the top 50 selected fNIRS features, illustrating the pairwise relationships among features after feature selection.
This finding aligns with prior research indicating that HbO2 signals tend to exhibit higher sensitivity to task-related neural activation, particularly within the prefrontal cortex, where cognitive processes such as working memory and attention are regulated. The predominance of HbO2 features among the top-ranked channels implies that blood oxygenation dynamics are more robust indicators of cognitive workload in dual-task conditions, such as driving while performing a secondary cognitive task (e.g., the n-back task).
After selecting the top 50 features from the fNIRS dataset based on their relevance to cognitive load classification further refinement was performed through correlation analysis. This step aimed to assess the degree of linear dependency between features to ensure that each selected feature contributes uniquely to the model, without redundancy. Highly correlated features can introduce multicollinearity, which may degrade the performance and interpretability of machine learning models by overemphasizing certain aspects of the signal while masking others.
To address this, a pairwise correlation matrix was computed across the selected features using Pearson’s correlation coefficient. This matrix quantifies the linear relationship between feature pairs, with values ranging from -1 (perfect negative correlation) to +1 (perfect positive correlation). The resulting correlation structure is visualized in Figure 3, which presents a heatmap of the correlation coefficients. This visualization highlights the relationships among features and provides insight into the overall redundancy or complementarity of the selected features. By ensuring a low degree of correlation among the input variables, the final dataset becomes more robust and informative for subsequent model training, reducing overfitting and improving generalization.
To train and evaluate the EEGNet model, we employed a 5-fold cross-validation strategy. This approach was chosen to ensure robust model performance and to minimize the potential for overfitting, particularly given the limited size and high dimensionality of the dataset. In each fold, the dataset was partitioned into five equal subsets: four were used for training, and one was used for validation. This process was repeated five times, with each subset serving as the validation set once, allowing for a more generalized assessment of model performance.
For model optimization, we utilized the Adam optimizer, known for its adaptive learning rate capabilities and efficiency in training deep neural networks. To examine the effect of learning rate on model performance, three different learning rates were tested: 0.1, 0.01, and 0.001. The model was trained over 200 epochs with a batch size of 63, which was selected to balance convergence stability and computational efficiency. In addition to model training, we also explored the impact of temporal segmentation strategies on classification performance. Specifically, we evaluated the model using both overlapping and non-overlapping time window segments of 10 seconds, 20 seconds, and 30 seconds. This segmentation was applied to the time-series input data to investigate how different windowing strategies affect the model’s ability to capture temporal patterns associated with cognitive load. The results for the overlapping segmentation evaluations are presented in Table 2, while the results for the non-overlapping segmentation are detailed in Table 3.
The evaluation results based on overlapping window segments reveal that a window size of 30 seconds, in combination with a learning rate of 0.001, yields the highest classification performance, achieving an accuracy of 100%. This suggests that longer overlapping windows allow the EEGNet model to capture more stable and comprehensive patterns of neural activity associated with cognitive load, leading to near-perfect model performance. The overlapping approach benefits from the redundancy introduced by the windowing technique, which may help in smoothing out transient noise and enhancing temporal context for the model. In contrast, for the non-overlapping segmentation, the highest accuracy of 97% is also achieved using a learning rate of 0.001, but in this case, the best performance is observed with a shorter window size of 10 seconds. Unlike the overlapping scenario, increasing the window size in the non-overlapping setup does not necessarily improve performance. This may be due to the fact that longer non-overlapping segments could introduce greater variability between segments or result in fewer training samples, thereby reducing the model’s generalizability. These findings demonstrate that while the learning rate of 0.001 consistently yields the best performance across both segmentation strategies, the optimal window size appears to be context dependent. Specifically, overlapping windows benefit more from longer durations, likely due to richer temporal information and redundancy, whereas non-overlapping windows may perform better at shorter durations, which offer more training samples and better granularity. Therefore, the highest classification performance is not solely determined by window size but rather by the interaction between the segmentation strategy and the temporal resolution used in pre-processing.
Despite the promising results, this study has several limitations that must be acknowledged. First, although the use of a high-fidelity driving simulator provides a controlled and safe environment, it cannot fully replicate the unpredictable dynamics and stressors of real-world driving, potentially limiting the ecological validity of the findings. Second, the participant sample, while sizeable (N = 38), may still not capture the diversity of the broader driving population in terms of age, experience, and cognitive abilities, which could influence the generalizability of the model across different user groups. Third, while the auditory n-back task effectively manipulates cognitive load, it may not fully encompass the range of multitasking scenarios encountered during real driving, such as emotional stress, decision-making under time pressure, or navigation-related distractions. Another limitation involves the use of only the prefrontal cortex for fNIRS recordings; although this region is central to executive function, other brain regions may also contribute meaningfully to cognitive workload and were not captured. Finally, although EEGNet achieved near-perfect accuracy under certain configurations, such high performance in a small and well-controlled dataset raises concerns about potential overfitting, particularly when overlapping windows increase sample redundancy.
Future research should aim to improve ecological validity by extending the study to real-world or mixed-reality driving conditions, where variables such as road unpredictability, fatigue, and external distractions can be more naturally embedded. Incorporating a more diverse participant cohort across different age groups, driving experiences, and cognitive profiles would also help to generalize the findings. Expanding the neuroimaging scope beyond the prefrontal cortex potentially integrating multi-region fNIRS or combining modalities such as EEG and eye-tracking could provide a more realistic view of cognitive load. Moreover, exploring more realistic secondary task paradigms (e.g., visual distractions, complex decision-making, or verbal interaction) would enhance the ecological relevance of workload modeling. Future studies could investigate transfer learning techniques to adapt trained models across individuals, as well as explore lightweight architectures suitable for real-time onboard implementation in driver assistance systems.
Conclusions
To systematically investigate varying levels of cognitive workload, we developed a dual-task experimental paradigm in which participants were required to perform a primary driving task concurrently with a secondary cognitive task—a modified version of the n-back task delivered through the auditory modality. This setup was carefully designed to replicate the cognitive demands encountered in real-world multitasking situations, such as managing complex navigation while processing verbal information. The n-back task was implemented at three distinct levels of difficulty: 0-back (representing low cognitive workload), 1-back (moderate workload), and 2-back (high workload). By systematically varying the task difficulty, we aimed to elicit clearly differentiated cognitive states that could be measured through physiological responses during the driving simulation.
This approach allows us to evaluate the sensitivity and effectiveness of fNIRS in detecting subtle changes in cognitive load under realistic conditions. While previous studies have primarily focused on two-level workload comparisons (e.g., low vs. high), our three-tiered workload design introduces a more granular framework for understanding how cognitive demand escalates across multiple task intensities offering richer insights into the brain’s adaptive response to increasing mental strain. In addition to the experimental design, we employed the EEGNet deep learning architecture to analyze the recorded fNIRS signals. EEGNet, originally developed for EEG data classification, has been adapted in our study to process and classify hemodynamic responses captured by fNIRS, enabling automated workload detection. Importantly, we explored the model’s performance using both overlapping and non-overlapping window segments of the fNIRS signal an aspect that has been rarely addressed in existing literature. Our results demonstrated that both learning rate and temporal segmentation strategy significantly impact classification performance. Notably, a learning rate of 0.001 consistently yielded the highest accuracy across all experimental setups. For overlapping window segments, a longer window duration of 30 seconds produced the best results, likely due to the redundancy and richer temporal information it provides. Conversely, in the non-overlapping segmentation strategy, shorter windows (10 seconds) proved more effective, possibly due to reduced variability.
References
- Mutzenich, C., et al., Situation awareness in remote operators of autonomous vehicles: developing a taxonomy of situation awareness in video-relays of driving scenes. Frontiers in psychology, 2021. 12: p. 727500. [CrossRef]
- Krasniuk, S., et al., The effectiveness of driving simulator training on driving skills and safety in young novice drivers: A systematic review of interventions. Journal of Safety Research, 2024. 91: p. 20-37. [CrossRef]
- Himmels, C., et al., Validating risk behavior in driving simulation using naturalistic driving data. Transportation Research Part F: Traffic Psychology and Behaviour, 2024. 107: p. 710-725. [CrossRef]
- Khan, M.A., et al., Application of artificial intelligence in cognitive load analysis using functional near-infrared spectroscopy: A systematic review. Expert Systems with Applications, 2024: p. 123717. [CrossRef]
- Boere, K., et al., Measuring cognitive load in multitasking using mobile fNIRS. NeuroImage: Reports, 2024. 4(4): p. 100228. [CrossRef]
- Fishburn, F.A., et al., Sensitivity of fNIRS to cognitive state and load. Frontiers in human neuroscience, 2014. 8: p. 76. [CrossRef]
- Keles, H.O., et al., High density optical neuroimaging predicts surgeons’s subjective experience and skill levels. PloS one, 2021. 16(2): p. e0247117. [CrossRef]
- Izzetoglu, M., X. Jiao, and S. Park. Understanding driving behavior using fNIRS and machine learning. in International Conference on Transportation and Development 2021. 2021.
- Sutoko, S., et al., Atypical dynamic-connectivity recruitment in attention-deficit/hyperactivity disorder children: an insight into task-based dynamic connectivity through an fNIRS study. Frontiers in Human Neuroscience, 2020. 14: p. 3. [CrossRef]
- Khan, M.A., et al. Measuring Cognitive Load: Leveraging fNIRS and Machine Learning for Classification of Workload Levels. in International Conference on Neural Information Processing. 2023. Springer.
- Khan, M.A., et al., Enhancing Cognitive Workload Classification Using Integrated LSTM Layers and CNNs for fNIRS Data Analysis. arXiv preprint. arXiv:2407.15901.2024.
- Khan, M.A., et al., Functional near-infrared spectroscopy (fNIRS) and Eye tracking for Cognitive Load classification in a Driving Simulator Using Deep Learning. arXiv preprint. arXiv:2408.06349.2024.
- Peirce, J., et al., PsychoPy2: Experiments in behavior made easy. Behavior research methods, 2019. 51: p. 195-203. [CrossRef]
- Baker, W.B., et al., Modified Beer-Lambert law for blood flow. Biomedical optics express, 2014. 5(11): p. 4053-4075. [CrossRef]
- Lawhern, V.J., et al., EEGNet: a compact convolutional neural network for EEG-based brain–computer interfaces. Journal of neural engineering, 2018. 15(5): p. 056013. [CrossRef]
Figure 1.
Driving simulator setup designed to replicate real-world vehicle dynamics and driving conditions using motion platforms and responsive control hardware.
Figure 1.
Driving simulator setup designed to replicate real-world vehicle dynamics and driving conditions using motion platforms and responsive control hardware.
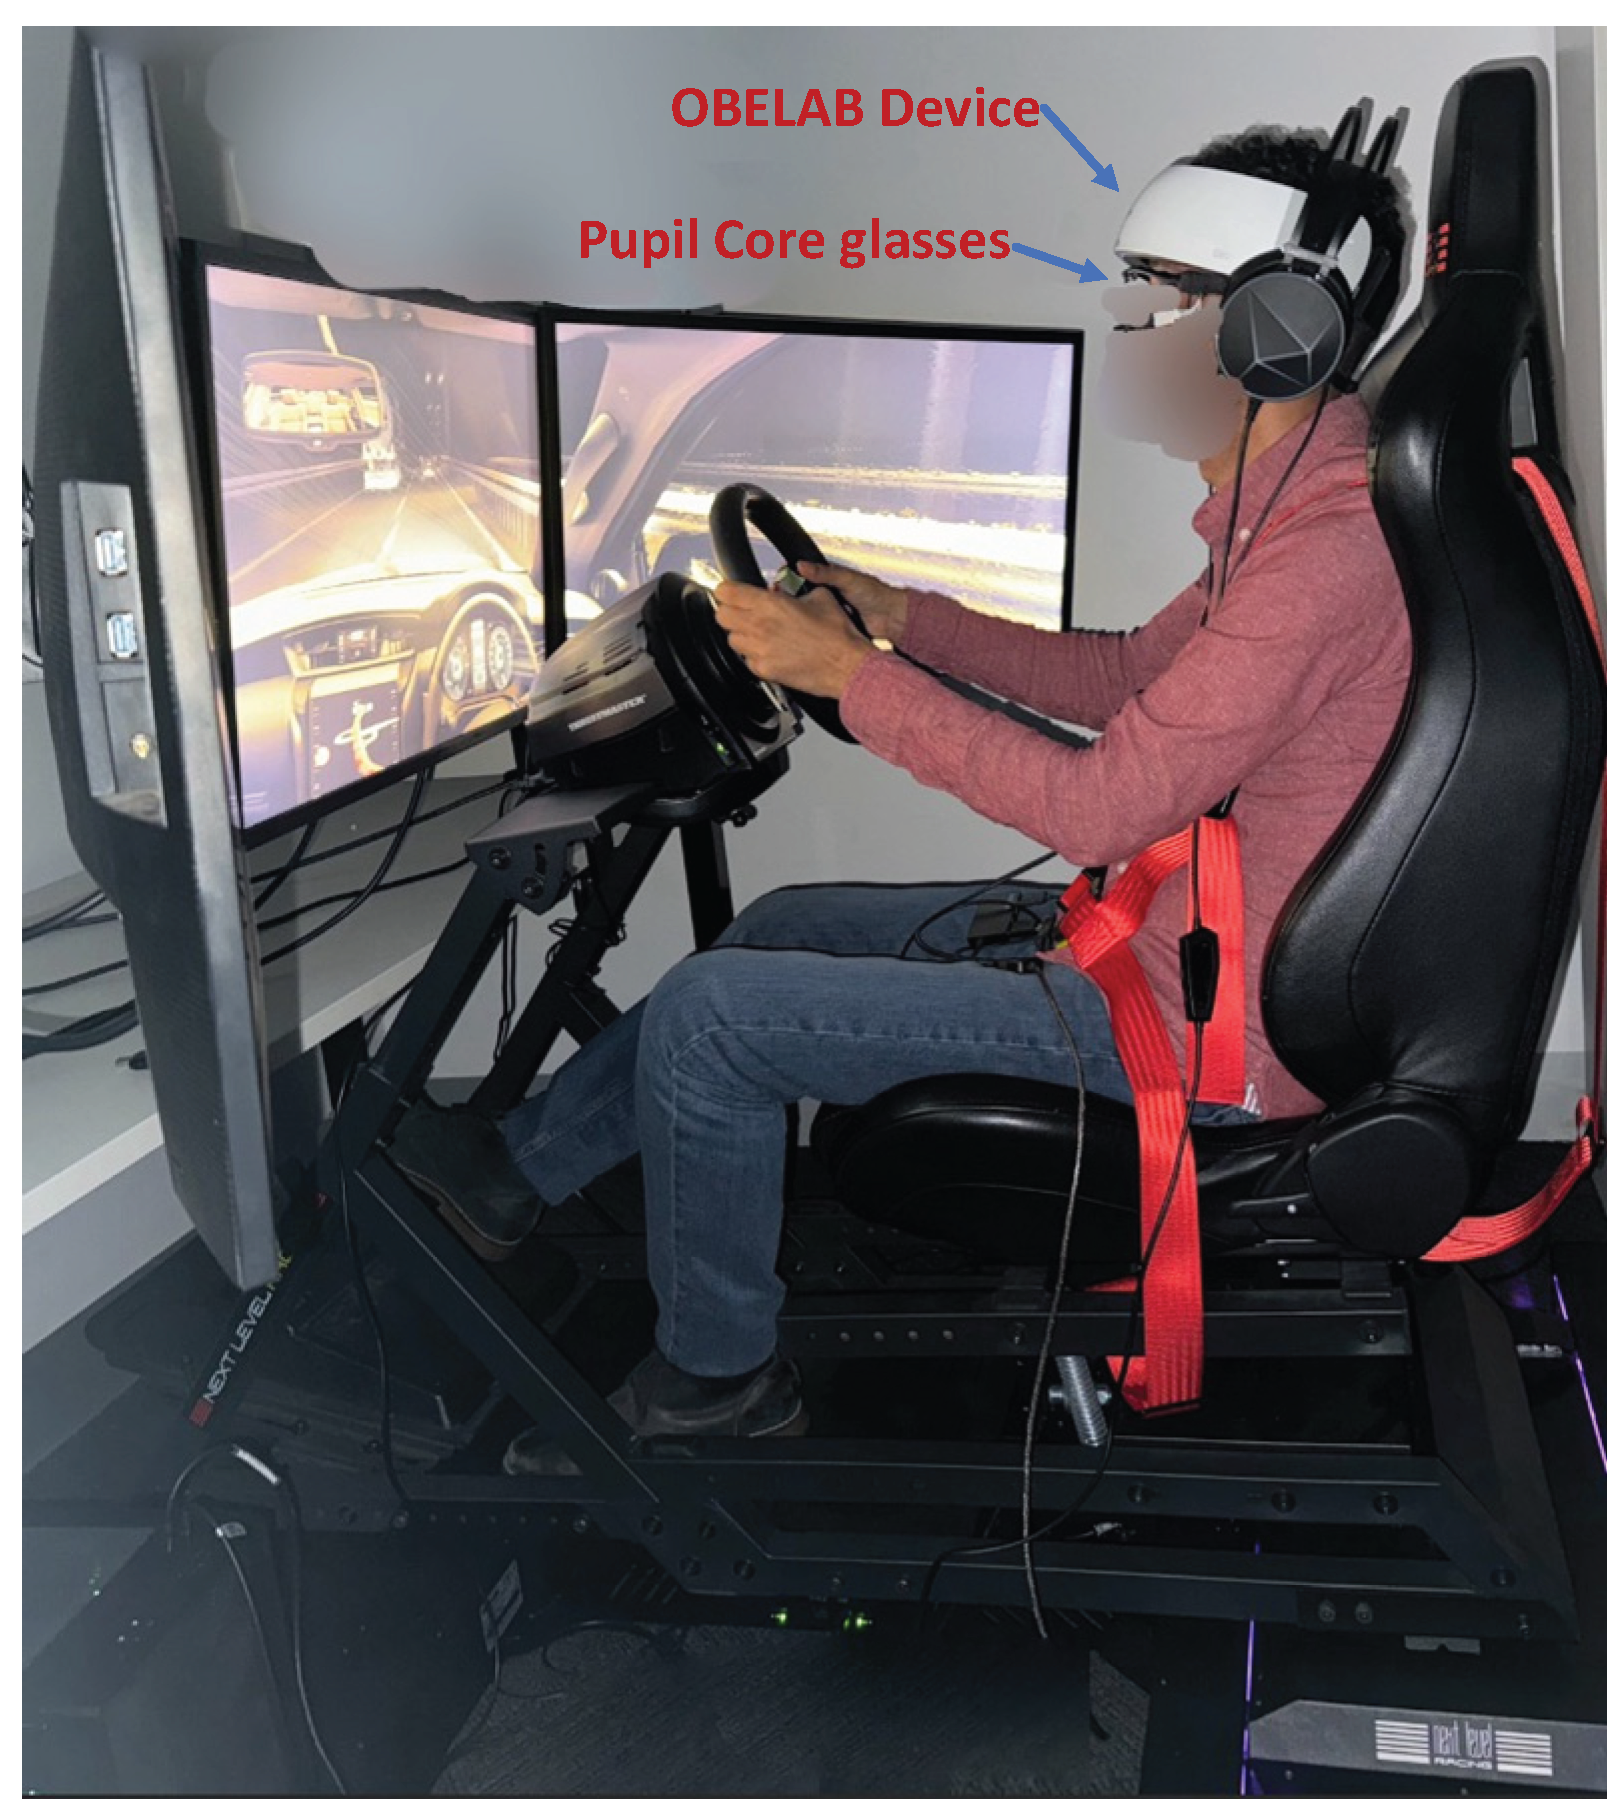
Figure 2.
Steering wheel interface used during the auditory modified n-back task.
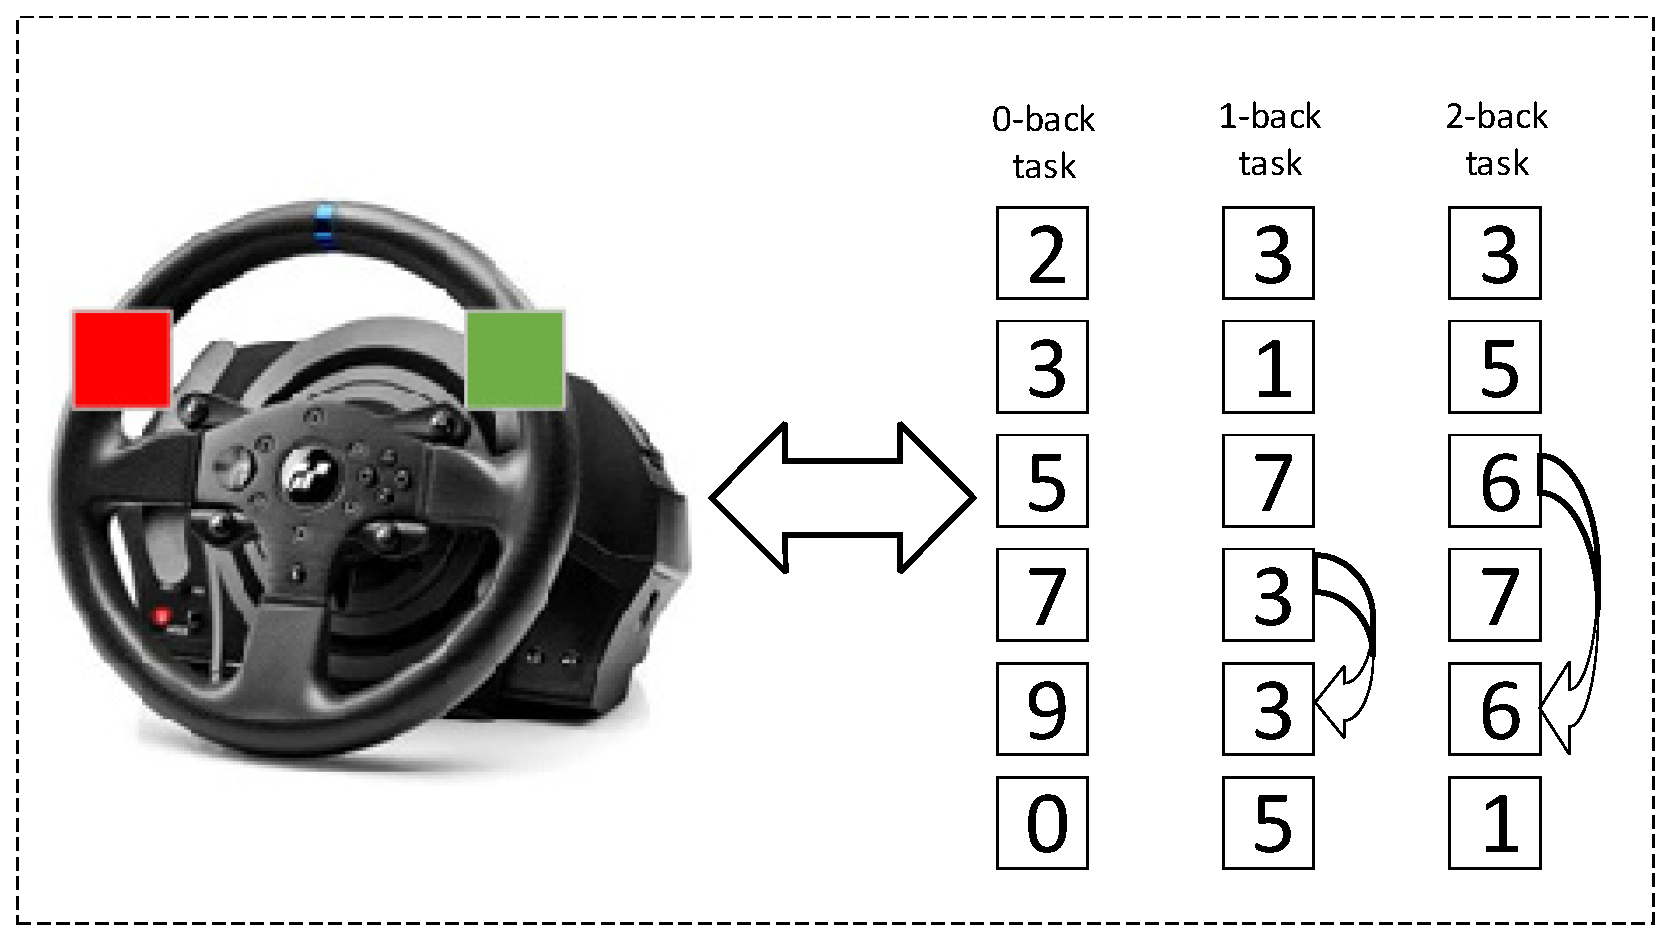
Figure 3.
Source-detector configuration of the NIRSIT device (OBELAB Inc.) used for fNIRS recording. The system consists of 24 laser diode sources and 32 photodetectors. (Image taken from OBELAB. NIRSIT Channel Information).
Figure 3.
Source-detector configuration of the NIRSIT device (OBELAB Inc.) used for fNIRS recording. The system consists of 24 laser diode sources and 32 photodetectors. (Image taken from OBELAB. NIRSIT Channel Information).
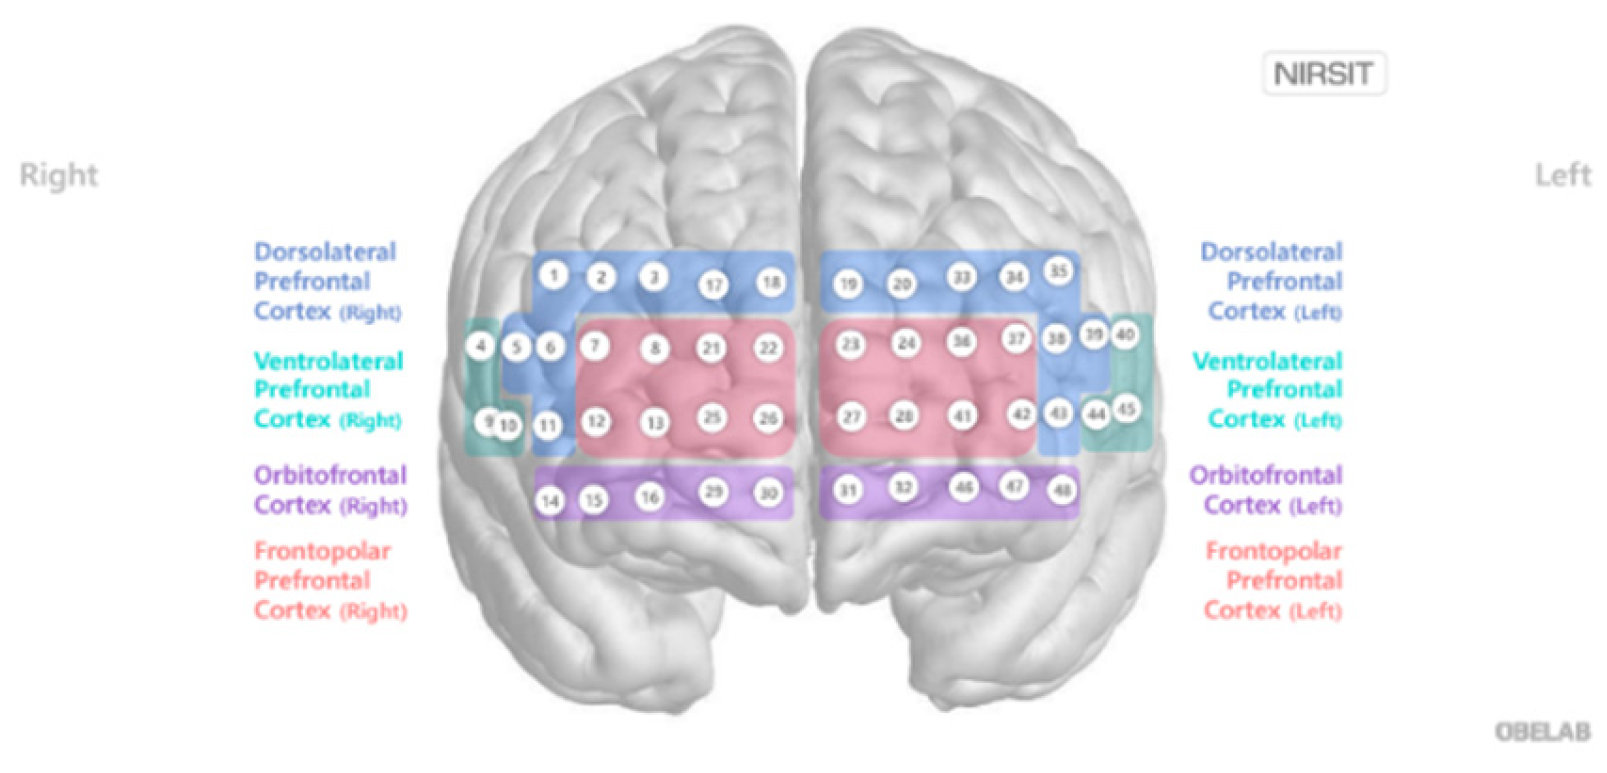
Figure 4.
Schematic representation of the fNIRS-based cognitive workload classification pipeline.
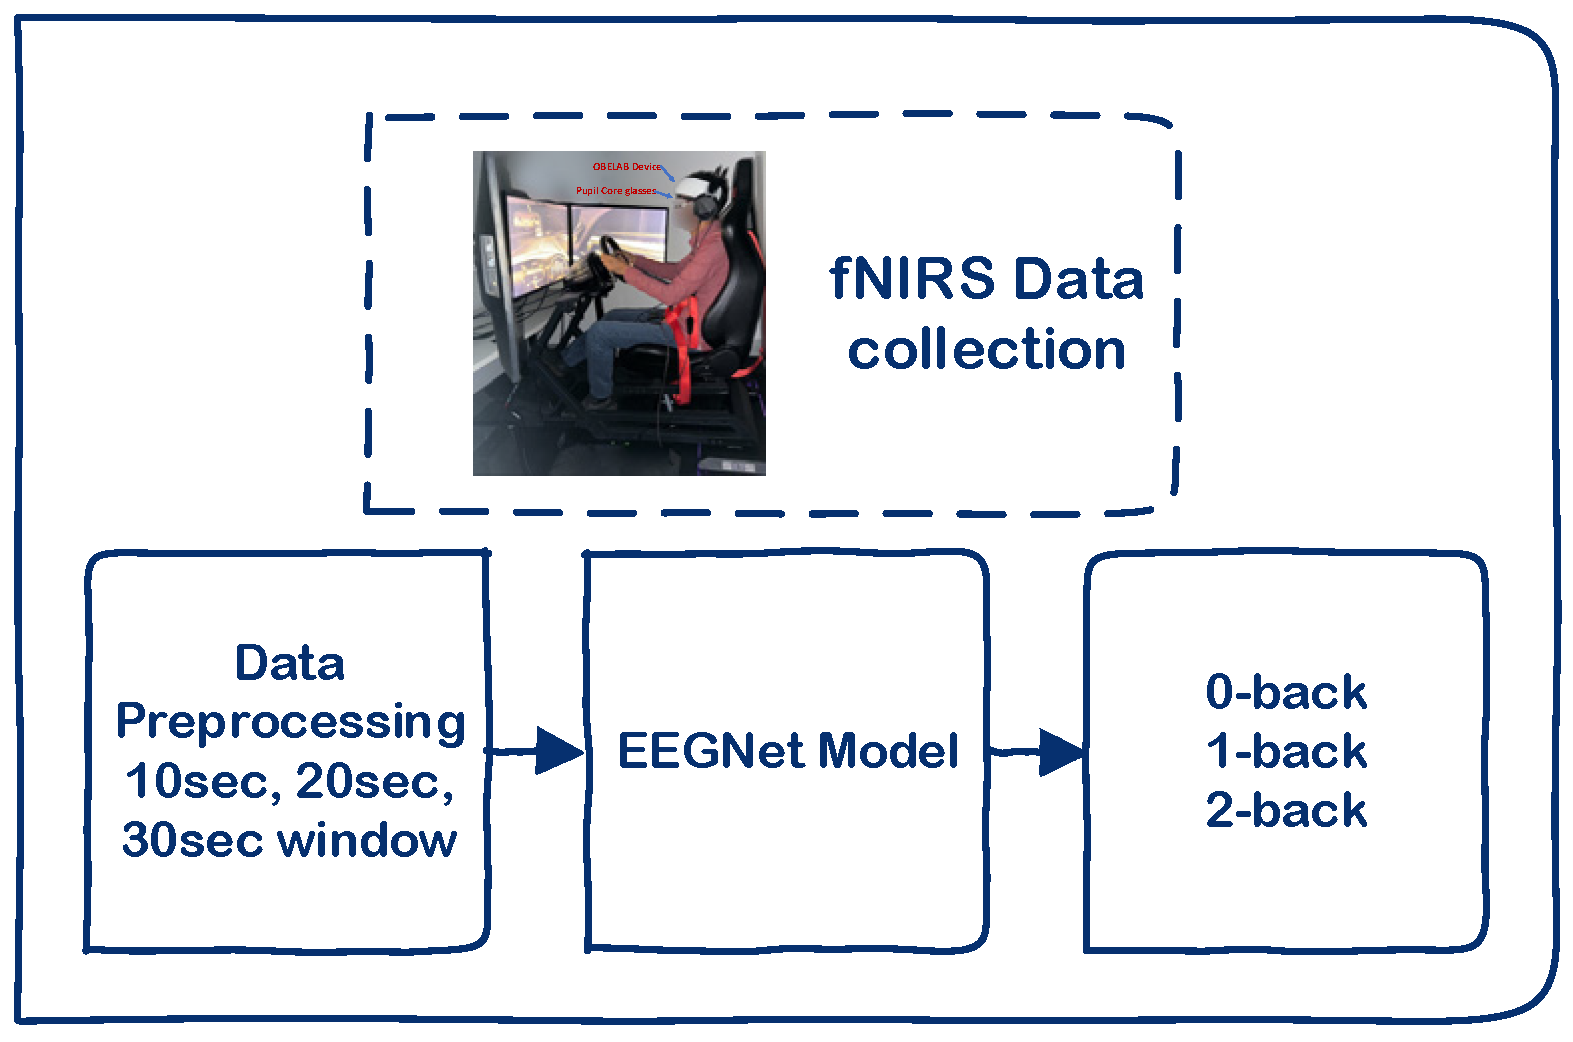

Table 1.
Layer-wise configuration of the EEGNet model, illustrating the sequence of operations used to extract discriminative spatiotemporel features from fNIRS input for multi-class classification.
Table 1.
Layer-wise configuration of the EEGNet model, illustrating the sequence of operations used to extract discriminative spatiotemporel features from fNIRS input for multi-class classification.
| Type | Parameters | Output Shape |
|---|---|---|
| Conv2D | Input channels = 1, Output channels = F1, Kernel size = (1, kernel length), Padding = (0, Kernel length//2), Bias = False | [Batch size, F1, Number of channels, Number of time samples] |
| BatchNorm2D | Number of features = F1 | [Batch size, F1, Number of channels, Number of time samples] |
| Conv2DWithConstraint | Input channels = F1, Output channels = F1·D, Kernel size = (Number of channels, 1), Maximum norm = 1, Bias = False | [Batch size, F1·D, 1, Number of time samples] |
| BatchNorm2D | Number of features = F1·D | [Batch size, F1·D, 1, Number of time samples] |
| ELU Activation | - | [Batch size, F1·D, 1, Number of time samples] |
| AvgPool2D or MaxPool2D | Kernel size = (1, 4), Stride = (1, 4) | [Batch size, F1·D, 1, Number of time samples/4] |
| Dropout | p = drop probability | [Batch size, F1·D, 1, Number of time samples/4] |
| Conv2D (Depthwise) | Input channels = F1·D, Output channels = F1·D, Kernel size = (1, 16), groups = F1·D | [Batch size, F1·D, 1, Number of time samples/4] |
| Padding = (0, 8), Bias = False | ||
| Conv2D (Pointwise) | Input channels = F1·D, Output channels = F2, Kernel size = (1, 1), Padding = (0, 0), Bias = False | [Batch size, F2, 1, Number of time samples/4] |
| BatchNorm2D | Number of features = F2 | [Batch size, F2, 1, Number of time samples/4] |
| ELU Activation | - | [Batch size, F2, 1, Number of time samples/4] |
| AvgPool2D or MaxPool2D | Kernel size = (1, 8), Stride = (1, 8) | [Batch size, F2, 1, Number of time samples/32] |
| Dropout | p = drop prob | [Batch size, F2, 1, Number of time samples/32] |
| Conv2D | Input channels = F2, Output channels = N (classes), Kernel = (1, Final conv length), Bias = True | [Batch size, N, 1, 1] |
| Log Softmax | Dimension = 1 | [Batch size, N, 1, 1] |
| Expression (squeeze) | - | [Batch size, N] |
Table 2.
Classification performance of EEGNet using overlapping time window segments (10s, 20s, 30s) across 5-fold cross-validation. Results are reported for various learning rates, illustrating the impact of window size and overlap on model accuracy.
Table 2.
Classification performance of EEGNet using overlapping time window segments (10s, 20s, 30s) across 5-fold cross-validation. Results are reported for various learning rates, illustrating the impact of window size and overlap on model accuracy.
| Window size | Learning rate | Accuracy | AUC | Recall | Precision | F1-score |
|---|---|---|---|---|---|---|
| 10s | 0.1 | 0.5929 ± 0.0491 | 0.7773 ± 0.0296 | 0.5929 ± 0.0491 | 0.6102 ± 0.0509 | 0.6102 ± 0.0509 |
| 20s | 0.1 | 0.5693 ± 0.0343 | 0.7737 ± 0.0348 | 0.5693 ± 0.0343 | 0.6345 ± 0.0260 | 0.6345 ± 0.0260 |
| 30s | 0.1 | 0.5610 ± 0.0267 | 0.7568 ± 0.0258 | 0.5610 ± 0.0267 | 0.5900 ± 0.0117 | 0.5900 ± 0.0117 |
| 10s | 0.01 | 0.9134 ± 0.0102 | 0.9651 ± 0.0064 | 0.9134 ± 0.0102 | 0.9138 ± 0.0106 | 0.9138 ± 0.0106 |
| 20s | 0.01 | 0.9418 ± 0.0157 | 0.9772 ± 0.0060 | 0.9418 ± 0.0157 | 0.9430 ± 0.0151 | 0.9430 ± 0.0151 |
| 30s | 0.01 | 0.8879 ± 0.0427 | 0.9485 ± 0.0179 | 0.8879 ± 0.0427 | 0.8932 ± 0.0384 | 0.8932 ± 0.0384 |
| 10s | 0.001 | 0.9995 ± 0.0002 | 0.9997 ± 0.0002 | 0.9995 ± 0.0002 | 0.9995 ± 0.0002 | 0.9995 ± 0.0002 |
| 20s | 0.001 | 0.9999 ± 0.0001 | 1.0000 ± 0.0000 | 0.9999 ± 0.0001 | 0.9999 ± 0.0001 | 0.9999 ± 0.0001 |
| 30s | 0.001 | 1.0000 ± 0.0000 | 1.0000 ± 0.0000 | 1.0000 ± 0.0000 | 1.0000 ± 0.0000 | 1.0000 ± 0.0000 |
Table 3.
Classification performance of EEGNet using non-overlapping time window segments (10s, 20s, 30s) across 5-fold cross-validation.
Table 3.
Classification performance of EEGNet using non-overlapping time window segments (10s, 20s, 30s) across 5-fold cross-validation.
| Window size | Learning rate | Accuracy | AUC | Recall | Precision | F1-score |
|---|---|---|---|---|---|---|
| 10s | 0.1 | 0.7020 ± 0.0219 | 0.8559 ± 0.0237 | 0.7020 ± 0.0219 | 0.7100 ± 0.0267 | 0.7100 ± 0.0267 |
| 20s | 0.1 | 0.6818 ± 0.0137 | 0.8233 ± 0.0331 | 0.6818 ± 0.0137 | 0.6838 ± 0.0199 | 0.6838 ± 0.0199 |
| 30s | 0.1 | 0.6547 ± 0.0257 | 0.7987 ± 0.0424 | 0.6547 ± 0.0257 | 0.6882 ± 0.0418 | 0.6882 ± 0.0418 |
| 10s | 0.01 | 0.9470 ± 0.0126 | 0.9759 ± 0.0077 | 0.9470 ± 0.0126 | 0.9486 ± 0.0117 | 0.9486 ± 0.0117 |
| 20s | 0.01 | 0.9444 ± 0.0081 | 0.9705 ± 0.0102 | 0.9444 ± 0.0081 | 0.9454 ± 0.0081 | 0.9454 ± 0.0081 |
| 30s | 0.01 | 0.9127 ± 0.0242 | 0.9378 ± 0.0427 | 0.9127 ± 0.0242 | 0.9179 ± 0.0245 | 0.9179 ± 0.0245 |
| 10s | 0.001 | 0.9731 ± 0.0021 | 0.9888 ± 0.0011 | 0.9731 ± 0.0021 | 0.9732 ± 0.0020 | 0.9732 ± 0.0020 |
| 20s | 0.001 | 0.9327 ± 0.0115 | 0.9678 ± 0.0036 | 0.9327 ± 0.0115 | 0.9346 ± 0.0106 | 0.9346 ± 0.0106 |
| 30s | 0.001 | 0.8478 ± 0.0190 | 0.9014 ± 0.0376 | 0.8478 ± 0.0190 | 0.8550 ± 0.0188 | 0.8550 ± 0.0188 |
Disclaimer/Publisher’s Note: The statements, opinions and data contained in all publications are solely those of the individual author(s) and contributor(s) and not of MDPI and/or the editor(s). MDPI and/or the editor(s) disclaim responsibility for any injury to people or property resulting from any ideas, methods, instructions or products referred to in the content. |
© 2025 by the authors. Licensee MDPI, Basel, Switzerland. This article is an open access article distributed under the terms and conditions of the Creative Commons Attribution (CC BY) license (http://creativecommons.org/licenses/by/4.0/).
Copyright: This open access article is published under a Creative Commons CC BY 4.0 license, which permit the free download, distribution, and reuse, provided that the author and preprint are cited in any reuse.


