Submitted:
25 June 2025
Posted:
26 June 2025
You are already at the latest version
Abstract
Black tea is a globally popular beverage, whose unique flavor and color are attributed to the fer-mentation process, during which polyphenols undergo enzymatic oxidation to form key pigments such as theaflavins (TFs), thearubigins (TRs), and theabrownins (TBs). This study investigated the effects of increased oxygen treatment during fermentation on the sensory and chemical qualities of Congou black tea. Fresh tea leaves (variety "Fuyun 6") were subjected to four oxygen treatments: 0 h (CK), 1 h (TY-1h), 2 h (TY-2h), and 3 h (TY-3h), with oxygen supplied at 8.0 L/min. Sensory evaluation revealed that oxygen-treated samples exhibited tighter and darker appearances, redder liquor, thicker taste, and sweeter aroma compared to CK. Chromatic analysis showed significant increases in redness (a*) and luminance (L*), alongside reduced yellowness (b*), indicating en-hanced liquor color. Chemical analyses demonstrated elevated levels of TFs, TRs, and TBs in oxygen treatments, with TRs showing the most pronounced increase. Non-targeted metabolomics identified 2318 non-volatile and 761 volatile metabolites, highlighting upregulated flavonoids, phenolic acids, and lipids, and downregulated catechins and tannins, which collectively contributed to improved taste and aroma. Optimal results were achieved with 2–3 h of oxygen treatment, balancing pigment formation and sensory quality. These findings can provide a scientific basis for optimizing oxygen conditions in black tea fermentation to improve product quality.
Keywords:
black tea
; oxygen treatment
; fermentation
; sensory quality
; metabolomics
1. Introduction
Black tea is a the world’s leading consumer consumed tea worldwide, with which has the functions of antioxidant, anti-hypertension, hypoglycemic and cardiovascular disease prevention functions [1]. The Black tea processing mainly includes the steps of withering, rolling, fermentation and drying, among which with fermentation as is a very important step due to the formation of the main taste substances and the accumulation of aroma substances at this stage [2]. During black tea fermentation, poly-phenolic compounds undergo enzymatic reactions under the action of polyphenol oxidase and peroxidase, leading to their transformation into a series of characteristic oxidation products, such as theaflavins (TFs), thearubigins (TRs), and theabrownins (TBs), which contribute to the formation of the unique color, aroma, taste and function of black tea [3,4].
The main factors affecting black tea fermentation are temperature, oxygen content, time, humidity, etc. When comparing the black teas fermented at different temperatures, Qu et al. found that fermentation at 30 °C to 32 °C was beneficial for improving the sensory quality of black tea, and fermentation of black tea at 25 °C to 28 °C contributed to improving its antioxidant capacity, inhibiting α-amylase and α-glucosidase activities, and suppressing glucose absorption in the intestine [5]. Chen et al. demonstrated that compared to the low and normal oxygen environment during fermentation, sufficient oxygen environment facilitated the oxidation of catechins, flavonoid glycosides and some phenolic acids as well as the accumulation of glutamic acid, thus reducing the bitterness and astringency and increasing the umami of black tea [6]. Wang et al. found that a fermentation time of 3 hours was beneficial to the retention of simple catechin, conversion of bitter and astringent substances, formation of soluble sugars, and accumulation of aroma compounds in Yunnan congou black tea [7]. Hua et al. illustrated that the fermentation time of 60 to 90 minutes and the fermentation temperature of 25 °C to 30 °C were the key conditions affecting the conversion rate of phenolic compounds and the direction of fermentation. The brightness of tea liquid decreased with the increase of fermentation time, and fermentation at appropriate low temperatures favored the retention of polyphenol oxidase activity and the formation of good liquid color [8]. Fermentation humidity generally refers to the relative humidity in the environment during tea fermentation, i.e., the degree of water vapor in the wet air apart from saturation. Moisture is a direct participant and essential solvent medium for the chemical reactions in the fermentation of black tea. Changes in the relative humidity of fermentation environment can affect the evaporation of water from the fermented leaves, thus changing their moisture content and affecting the chemical changes, the type and quantity of formed products in the fermentation process [9]. At present, except for the limited research on the fermentation humidity gradient, few systematic studies have been performed on the humidity of black tea fermentation at home and abroad [10]. In actual tea production, the fermentation humidity is usually determined based on experience, lacking a scientific and theoretical basis.
Black teas can be divided into two types according to their shape: congou black tea and broken black tea. The process difference between the two is mainly determined by the rolling and rolling-cutting methods, and the resulting changes during fermentation. After withering, congou black tea is rolled by a rolling machine and the leaves are in the form of strips, while the broken black tea is rolled and cut by a rolling-cutting machine after withering and the leaves are in the form of granules. Additionally, the rolling and cutting process of broken black tea results in heavier cell fragmentation, larger specific surface area, and full exposure of the inner components to air, thus speeding up the process of chemical reactions such as oxidation of polyphenols and hydrolysis of glycosides in the tea leaves, and completing the fermentation in a shorter period of time (1 to 2 hours) [11]. In contrast, the fermentation time of congou black tea is longer, generally 3 to 6 hours [12]. This suggested that increased oxygen treatment in the fermentation process has a much greater effect on congou black tea than broken black tea, but the relevant information is not clear yet. Against this background, the present study aimed to optimize increased oxygen conditions of congou black tea by setting different increased oxygen times and analyzing their effects on the taste and liquor color qualities, which may provide a theoretical basis for the quality improvement of congou black tea.
2. Materials and Methods
2.1. Tea Sample Processing
Clonal tea leaves of the “Fuyun 6” variety (one bud with two leaves) were harvested in early June, 2023 from the Ecological Tourist Tea Plantation Base of Jiangxi Cash Crops Research Institute (Nanchang, China). The fresh leaves were mixed well and spread evenly in a 6CWD-200 withering trough (Zhejiang SunYong Machinery Co., Ltd., Quzhou, China), and the withering was started with cold blast for 1 h, followed by hot blast withering at 32 °C until the moisture content reached 58%. After full rewetting, the leaves were rolled on a 6CR-45 rolling machine (Zhejiang SunYong Machinery Co., Ltd.) for 2 h in the order of light pressure, heavy pressure, and light pressure, followed by taking out the leaves, unblocking them and blending. Next, the tea leaves were fermented in an 6CHFJ-5B artificial climate chamber (Zhejiang Hong Wu Huan Tea Equipment Co., Ltd., Quzhou, China) at a temperature of 32 °C under four different oxygen conditions of 0h (CK), 1h (TY-1h), 2h (TY-2h) and 3h (TY-3h). Each treatment was performed with three replicates and each replicate contained 1 kg of rolled leaves. Fermentation lasted 210 min, and air circulation was maintained using a circulating ventilation system in the artificial climate chamber. After fermentation, the tea leaves were dried using a 6CTH-8.0 dryer machine (Zhejiang Zhu Feng Machinery Co., Ltd., Quzhou, China) at an initial drying time of 10 min at 110 °C, a redrying time of 30 min at 90 °C, and a final drying at 80 °C for 60 min, with sufficient cooling to room temperature and rewetting between each drying step(Figure 1). The resulting dried tea was stored in a -20 °C freezer for further analysis.
2.2. Oxygenation Treatment Method in Congou Black Tea Fermentation Process
A pre-designed oxygen-supplied fermentation device was designed as a hermetically sealed system. Industrial-grade oxygen cylinders were employed as the oxygen source, with oxygen was delivered from the bottom of the device, with an oxygen supply rate of 8.0 L/min. Rolled tea leaves were placed into the oxygen-supplied fermentation device, with the tea pile covered by a damp cloth. The entire oxygenated fermentation device was installed in a traditional fermentation chamber, maintained under the same ambient temperature and relative humidity conditions, the same as conventional fermentation processes.
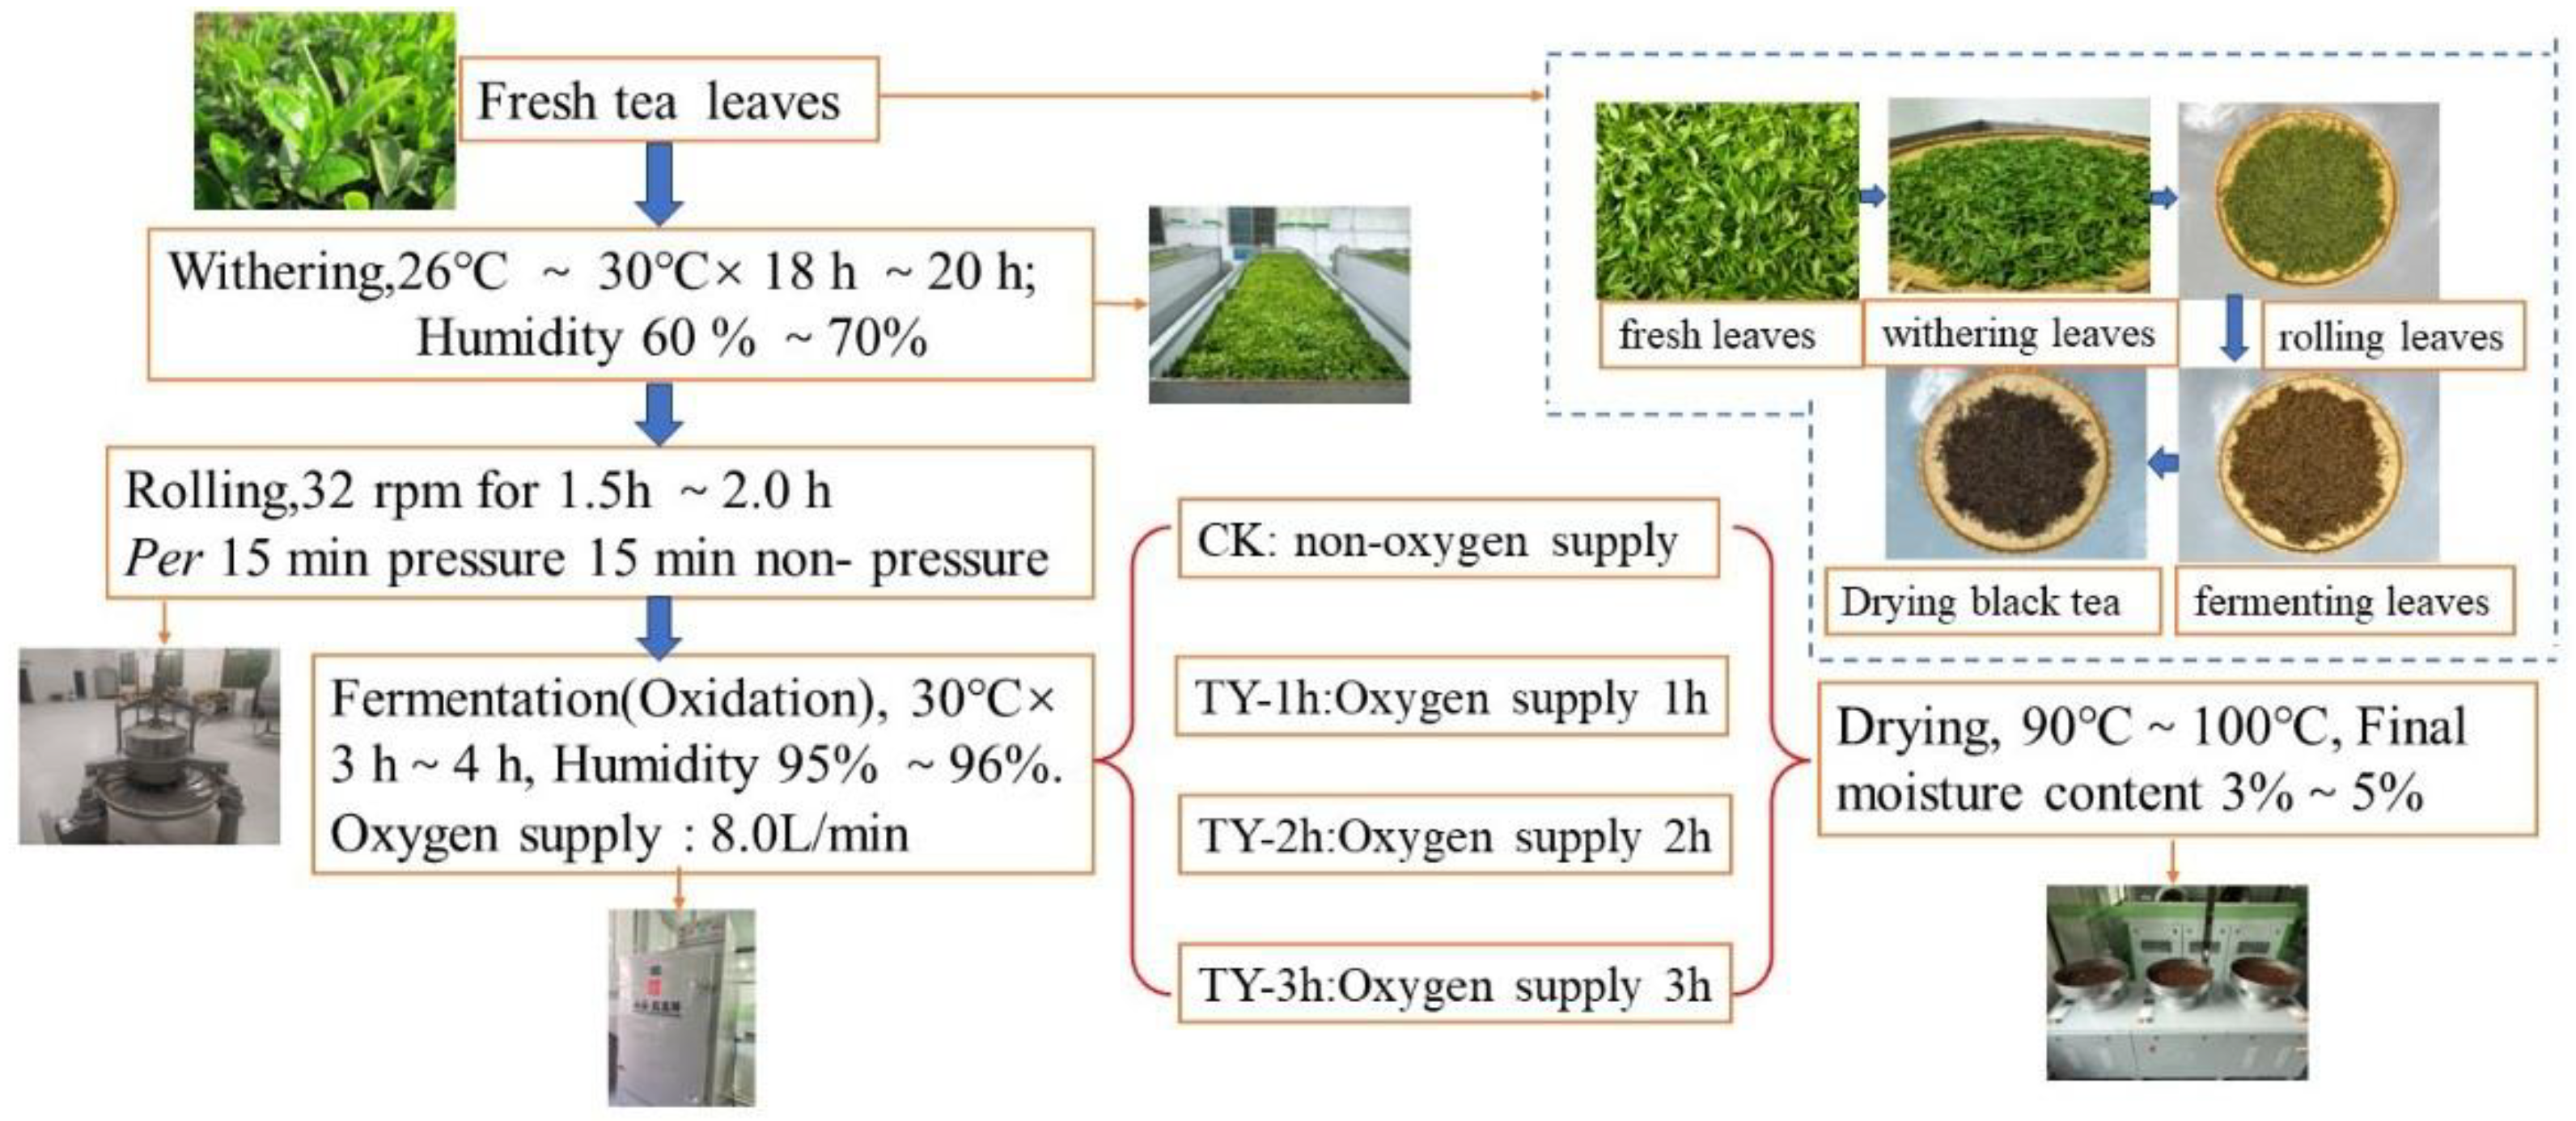
Figure 1.
The schematic diagram of black tea processing. Note: CK, Normal fermentation, non-oxygen supply. TY-1h, Increased oxygen treatment 1 h. TY-2h, Increased oxygen treatment 2 h. TY-3h, Increased oxygen treatment 3 h. The same as below.
Figure 1.
The schematic diagram of black tea processing. Note: CK, Normal fermentation, non-oxygen supply. TY-1h, Increased oxygen treatment 1 h. TY-2h, Increased oxygen treatment 2 h. TY-3h, Increased oxygen treatment 3 h. The same as below.
2.3. Chemical Reagents
Methanol, glacial acetic acid, formic acid and acetonitrile (HPLC) were purchased from Thermo Fisher (Thermo Scientific, Waltham, MA, USA). Theaflavins (standards), catechins (standards) were purchased from Shanghai Yuanye Biotechnology Co. Purified water (18.2 MX) was prepared in a Millipore Mill-Q Ultrapure Water System (Billerica, MA, USA). All other reagents and solvents were of analytical grade and purchased from China National Pharmaceutical Group Corporation (Beijing, China).
2.4. Sensory Evaluation
Sensory evaluation was carried out according to the Chinese national standard of “Methodology of sensory evaluation of tea” (GB/T 23376–2018) and “Tea vocabulary for sensory evaluation” (GB/T 14487–2017). Briefly, the congou black tea samples were mixed and placed in different sample trays for appearance evaluation. Next, the tea samples were blind coded by random numbers, 3 g of dry tea was weighed into an evaluation cup, followed by adding 150 mL of boiling water, covering the cup, steeping the tea for 5 min, and then pouring the tea infusion into separate white porcelain bowls. The tea tasters were asked to smell and drink the tea at 30 second intervals. The sensory quality of the black tea was independently scored by five professional tea tasters on a 100-point scale, with 25% for dry tea appearance, 10% for liquid color, 25% for aroma, 30% for taste, and 10% for infused leaves [13]. Afterwards, the appearance, aroma, liquor color, taste, and brewed leaves were evaluated by three experienced assessors authenticated by professional organizations.
2.5. Chemical Composition Determination
Determination of water extracts was carried out according to the Chinese national standard of “Determination of water extracts content” (GB/T 8305–2013). Accurate 2.0 g of tea powders were extracted using 500 mL boiling water at 100 °C for 45 min, shaking once 10 min. After wards, tea liquor was filtered to obtain tea residues. Tea residues were dried at 120 °C for 2 h and subsequently weighed. The content of water extract is 100 % minus the percentage of residue, which represents the weight proportion of water-soluble compounds in the tea.
Determination of total polyphenols was carried out according to the Chinese national standard of “Determination of total polyphenols and catechins content in tea” (GB/T 8313–2018). Accurate 0.2 g of tea powders were extracted using 5 mL 70 % (v/v) methanol at 70 °C for 10min. The solutions were then centrifuged at 3500 r/min (Centrifuge 5810R, Eppendorf; Hamburg, Germany) for 10 min and the supernatants were collected. The sediments were extracted again, and the supernatants were collected again and combined with the first supernatants together. After mixing well, the supernatants were diluted 100 times using distilled water. Next, accurate 1 mL diluted liquor was mixed with 5 mL 10 % (v/v) foline-phenol. After reacting for 8 min, 4 mL 7.5 % (w/v) Na2CO3 were added and mixed well. The solutions were subsequently equilibrated for 60 min before measuring the absorbance. The absorbance was measured using a UV/Vis spectrophotometer (Shimadzu UV 2550, Kyoto, Japan). The wavelength was 765 nm and the cuvette was 10 mm. Distilled water and gallic acid were used as a black and to construct calibration curve, respectively.
Determination of total amino acids was by the ninhydrin colorimetric method “Tea-Determination of free amino acids content” (GB/T 8314-2013). Accurate 3.0 g of tea powders were extracted using 450 mL boiling water at 100 °C for 45 min (shaking once 10 min). The filter liquor was collected and the residue was washed with a little hot water. After cooling to room temperature, the filter liquor was filled to 500 mL with distilled water. The reacting solution consisted of 1mL extraction liquor, 0.5 mL phosphate buffer (pH 8.0), and 0.5 mL 2 %(w/v) ninhydrin solution. After reacting for 15 min in boiling water, the solution was filled to 25 mL with distilled water and equilibrated for 10min. The determination wavelength was 570 nm and the cuvette was 10mm. Distilled water and theanine were used as a black and to construct calibration curve, respectively.
2.6. TFs, TRs and TBs Determination
The total amount of flavones in tea by the colorimetric method of aluminium trichloride. Theaflavins (TFs), thearubigins (TRs) and theabrownines (TBs) were extracted by organic reagents (ethyl acetate, n-butanol, ethanol) and the total content was determined by systematic analysis [13]. The chromatic aberration of the tea infusion was determined with a CS-820N spectrophotometer for color measurement (Hangzhou Caipu Technology Co., Ltd, Hangzhou, China) and the tea infusion was prepared as described for sensory evaluation.
Theaflavin and catechin components were determined by high performance liquid chromatography (HPLC) (1260 Infinity, Agilent, USA). Determination of the components of theaflavins was based on GB/T 31740.3-2015 under the following conditions: column, AgilentTC-C18 (250mm×4.6mm×5μm); flow rate, 0.7 mL/min; column temperature, 35 °C; injection volume, 5 μL; detection wavelength, 278 nm; mobile phase A, 90 mL acetonitrile with 20 mL glacial acetic acid and 2 mL EDTA-2Na (10 mg/mL), with ultrapure water fixed to 1000 mL; mobile phase B: 800 mL acetonitrile with 20 mL glacial acetic acid and 2 mL EDTA-2Na (10 mg/mL). Determination of catechin components was based on GB/T 8313-2018 under the following conditions: column: AgilentTC-C18 (250 mm×4.6 mm×5 μm); flow rate, 0.7 mL/min; column temperature, 35 °C; injection volume, 5 μL; detection wavelength, 278 nm; mobile phase A, ultrapure water (containing 0.1% formic acid); mobile phase B, methanol (containing 0.1% formic acid). The elution gradient of theaflavins and catechins was recorded as follows: 0-10 min, 100% A; 10-25 min, 68% A and 32% B; 25-35 min, 100% A.
2.7. Chromatic Aberration Analysis of Tea Liquors
Tea liquors were prepared according to above sensory evaluation method, and the CIELAB parameters of tea liquors were determined by a CR-400 chroma meter (Konica Minolta, Inc. Japan). The lightness (L*), red/green coordinates (a*), and yellow/blue coordinates (b*) were recorded for 20 measurement points per sample. Each sample was determined for three times.
2.8. Analysis of Non-Volatile Metabolites in Black Teas Using UPLCMS/MS
2.8.1. Extraction of Non-Volatiles
One hundred milligram of powder was dissolved with 1.2 mL 70% methanol solution and vortexed for 30 s every 30 min, six times. The samples were then placed in a refrigerator at 4 °C overnight. After centrifugation at 16,743 g for 10 min, the extracts were filtrated (SCAA-104, 0.22 μm pore size) (ANPEL, Shanghai, China) before ultraperformance liquid chromatograph-electro-spray ionization-tandem mass spectrometer (UPLC-ESI-MS/MS) analysis. All samples were analyzed in triplicate.
2.8.2. UPLC Conditions and ESI-MS/MS
The analysis was conducted by MetWare (Wuhan, China) [14]. The sample extracts were analyzed using UPLC-ESI-MS/MS system (UPLC, Shimadzu Nexera X2, Kyoto, Japan; MS, Applied Biosystems 4500 Q TRAP, Thermo Fisher Scientific, Waltham, USA). The analytical conditions were as follows: UPLC was performed on Agilent SB-C18 column (1.8 μm, 2.1 mm × 100 mm) using pure water with 0.1% formic acid as solvent A, and acetonitrile with 0.1% formic acid as solvent B. Sample measurements were performed with a gradient program that employed the starting conditions of 95% A, 5% B. Within 9 min, a linear gradient to 5% A, 95% B was programmed, and a composition of 5% A, 95% B was kept for 1 min. Subsequently, a composition of 95% A, 5% B was adjusted within 1.1 min and kept for 2.9 min. The flow velocity was set as 0.35 mL per minute; column oven of 40 °C; and injection volume of 4 μL. The effluent was alternatively connected to an ESI-triple quadrupole linear ion trap (QTRAP)-MS system. Linear ion trap (LIT) and triple quadrupole (QQQ) scans were acquired on a Q TRAP-MS, AB4500 Q TRAP UPLC/MS/MS system, equipped with an ESI turbo ion-spray interface, operating in positive and negative ion modes and controlled by Analyst 1.6.3 software (AB Sciex). The ESI source operation parameters were set as follows: ion source, turbo spray; source temperature, 550 °C; ion spray voltage, 5500 V positive ion mode/ -4500 V negative ion mode; ion source, gas I, gas II and curtain gas were set at 50, 60, and 25.0psi, respectively. The collision-activated dissociation was high. Instrument tuning and mass calibration were performed with 10 and 100 μmol/L polypropylene glycol solutions in QQQ and LIT modes, respectively. QQQ scans were acquired as multiple reaction monitoring (MRM) experiments with collision gas (nitrogen) set to medium. Declustering potential (DP) and collision energy (CE) for individual MRM transitions were determined with further DP and CE optimisations. A specific set of MRM transitions was monitored for each period according to the metabolites eluted within this period.
2.9. Analysis of Volatile Metabolites in Black Teas Using GC-MS
2.9.1. Extraction of Volatiles
The sample preparation method was modified based on a previous study[15]. Specifically, 600 mg of the sample, together with 500 mg of NaCl were weighed, and were placed in a 20 mL headspace bottle, and 10 mL of boiling water was then used for brewing. A polydimethylsiloxane (PDMS) twister (Gerstel, Germany)with a length of 10 mm, thickness of 1.0 mm, and capacity of 24 μL was immersed to extract volatiles components for 30 min at 80 °C and 1200rpm on a multiposition hotplate stirrer (SP200-2 T; Miu Instruments Co. LTD, Hangzhou, China). All samples were analyzed in triplicate.
2.9.2. Thermal Desorption
The parameters of the thermal desorption unit (TDU) were as follows: an initial temperature of 30 °C was held for 1 min, then increased by 100 °C/min to 240 °C, and held for 5 min. The cooling injection system (Gerstel CIS-4 PTV injector) was maintained at 100 °C for 1 min with liquid nitrogen (99.99%), then ramped to 280 °C and held for 3 min at a rate of 12 °C/s.
2.9.3. GC–MS Analysis
The identification and quantification of volatiles were conducted using an Agilent 7890B GC system coupled with an Agilent 5977B MSD mass spectrometer (Agilent, Santa Clara, CA, USA), equipped with a 30m × 0.25 mm × 0.25 μm HP-5MS capillary column. Helium (greater than99.99%) was used as the carrier gas at a linear velocity of 1.6 mL/min. The oven temperature was programmed from 50 °C for 2 min, increased at 4 °C/min to 170 °C for 5 min, at 10C/min to 265 °C, hold for 5 min. Mass spectra were recorded in electron impact (EI) ionization mode at 70 eV. The ion-source temperature was 220 °C. The interface temperature was set to 280 °C. The mass scan range was 30–600 AMU.
2.9.4. Qualitative and Quantitative Analysis of Volatiles
Compounds were identified based on the NIST 2014 database library. The retention indices (RIs) of the compounds obtained from the experiment were compared with the theoretical values of the n-alkane(C8-C40) series. In general, compounds can be confirmed if the difference between the two values is less than 20. The quantitative analysis was mainly based on their abundance in the GC–MS analysis.
2.10. Statistical Analysis
All experiments were repeated three times and the results were presented as the mean ± standard deviation (SD) (n=3). One-way Analysis of Variance (ANOVA) was used for data analysis. Statistical significance among different treatments was analyzed using the Fisher's Least Significant Difference (LSD) procedure, with p < 0.05 being considered significantly different. SPSS Statistics 26.0 software was used to analyze the data and Origin 2021 and Adobe Illustrator 2021 software were used to visualize the data.
3. Results and Discussion
3.1. Effects of Different Treatments on Sensory Quality of Black Tea
Sensory evaluation results of four black teas were shown in Table 1. The appearance, liquor, and brewed leaves of tea samples were photographed and shown in Figure 2 to display the differences more intuitively.
Compared to CK,TY-1h, TY-2h and TY-3h presented tighter and darker appearance, redder liquor, thicker taste, sweeter aroma, and redder brewed leaves. The score of taste for TY-1h, TY-2h and , TY-3h was 87.0, respectively, and the score of liquor color for TY-1h, TY-2h and , TY-3h was 91.0,respectively (Table 1). The results demonstrated that increased oxygen treatment(TY-1h, TY-2h, TY-3h) were beneficial to improve the taste and liquor color qualities of black tea.
3.2. Effects of Different Treatments on the Chromatic Aberration of Tea Liquor
As shown in Figure 3. The values of a* (representing red color) and L*(representing luminance) were significantly increased, while the value of b* (representing yellow color) was gradually decreased from CK to TY-3h. Comparing to CK, the values of a* TY-1h, TY-2h, TY-3h were further increased (20.88 % ,28.90%and 36.70 %, respectively) and the value of L* was further increased (1.27% ,2.18%and 2.50 %, respectively) (Figure 3). Some studies have shown that a* value, b* value and the total sensory score of black tea were significantly or very significantly positively correlated, indicating that the higher the degree of red and yellow color of black tea broth, the higher the sensory score, while the brightness of black tea broth L* was significantly negatively correlated with the total sensory score, that is, within a certain range of the black tea broth L* value is small, the red TBs and the yellow TFs of the broth are rich, and the sensory score of the tea broth is high[16].These results further proved that increased oxygen treatment was beneficial to improve the liquor color quality of black tea.
3.3. Effects of Different Treatments on the General Biochemistry Components
Tea taste and liquor color were closely related to non-volatile compounds. Thus, the general biochemistry components were determined. Water extracts was the total of all soluble components extracted by hot water and was positively correlated with taste thickness. The contents of water extracts in CK, TY-1h, TY-2h and TY-3h were 46.07%, 46.42%, 44.16%and 43.90%, respectively, and there was a significant difference (p<0.05) in the content of water extracts between CK,TY-1h black teas and TY-2h , TY-2h black teas (Figure 4). The contents of tea polyphenols in CK, TY-1h, TY-2h and TY-3h were 12.52%, 11.66%, 6.81%and 6.72%, respectively, and there was significant difference (p<0.05) in the content of tea polyphenols between CK,TY-1h black teas and TY-2h , TY-2h black teas (Figure 3). The content of total amino acids in CK, TY-1h, TY-2h and TY-3h were 3.03%, 2.90 %, 3.01%, and 2.97%, respectively (Figure 4). Compared to CK, TY-2h had significant lower content of total amino acids (Figure 4), which is due to that the content of total amino acids is negatively correlated with the increased oxygen treatment time in black teas [17]. Compared to TY-1h, the content of total amino acids in TY-2h, TY-3h were significantly increased and equal to that in CK (Figure 4). TFs, TRs, and TBs are the oxidative products of polyphenols catalyzed [18]. The contents of TFs, TRs, and TBs were significantly increased from CK to TY-3h, and the increase extent of TRs was larger than that of TFs and TBs (Figure 3). This means that the extension of increased oxygen treatment had the greatest effect on the formation of TRs, following by TFs and TBs.
The fermentation mechanism of black tea is mainly an enzyme-driven catechin oxidation polymerization reaction, and the oxidation rate of catechins reflects the formation of black tea quality. It was shown that the oxidation of catechin components in the fermentation process was a primary reaction, and the correlation coefficients of the oxidation kinetic curves were all greater than 0.95, and the catechin oxidation rate constants (k) were in the order of EGC>EGCG>ECG>EC. The oxidation power of the catechins in the natural fermentation process was lost by 89.73% after 6 h, and there was a lack of fermentation power, which showed that the 6~8 h was the preferred time for natural fermentation process of artisanal black tea. This indicates that 6~8 h is the ideal time for the natural fermentation of black tea. Therefore, 6~8 h was the ideal time for the natural fermentation process of black tea. In this experiment, the aerobic fermentation with controlled temperature and humidity was used, so 3~4 h was the ideal time for the fermentation process of black tea. The oxidation kinetics of the catechin components varied, the oxidation rate of simple catechin components (EGC, EC) showed an undulating pattern, while the oxidation rate of ester-type catechin components (EGCG, ECG) basically maintained a gradual decrease trend, which was mainly attributed to the different chemical properties of different components of the catechins as well as the different chemical reactions they were involved in[19]. This means that the extension of TY-3h treatment have the greatest effect on the formation of EGC, EGCG, ECG and EC.
3.4. Effect of Increased Oxygen Treatment on Non-Targeted Metabolomics Analysis Based on UPLC-MS
3.4.1. Composition and Variation Trend of Non-Volatile Metabolites Across Four Different Treatments
To further deeply understand the effect of increased oxygen treatment on black tea quality components, non-targeted metabolomics analysis was employed to compare the non-volatile and volatile compounds among four black tea samples. Based on authentic standards, MS2 spectra, metabolomics database, and previous studies[20,21], a total of 2318 metabolites from 12 classes were detected using the UPLC-MS/MS detection platform and the self-constructed database, including 549 flavonoids, 419 phenolic acids, 189 amino acids and derivatives, 187 lipids, 175 alkaloids, 119 terpenoids, 117 organic acids, and 110 lignans and coumarins. Furthermore, 80 Nucleotides and derivatives were identified, as well as 78 Tannins, 15 Quinones, and 280 other metabolites.
Furthermore, PCA were performed to explore differences in metabolites among black teas with different fermentation durations. The first two PCs altogether explained 44.84 of the total variance (PC1 32.87%, PC2 10.97%). In the PCA score plot, the TY tea samples formed different clusters within groups, signifying substantial changes in metabolites with fermentation duration (Figure 5A). Meanwhile, the samples of the four treatments were arranged in sequence in the PC1 direction, indicating that the differences among the sample groups were mainly affected by the oxygen supply time.
The results of OPLS-DA analysis indicated that the first two components explained 32.6% and 10.2% of the variances respectively, and there was obvious separation among the four tea samples, which was consistent with the results of PCA (Figure 5B). After 200 permutations, we obtain the vector values of R2Y = (0.0, 1) and Q2 = (0.0, 0.941). These results indicate that the model is not overfitted and shows a high level of reliability (Figure 5C).
3.4.2. Characterization of Differential Non-Volatile Metabolites of Four Different Treatments
To gain a deeper insight into the different treatments in non-volatile metabolic compounds with oxygen supply time, we compared the tea samples with different oxygen supply time with CK respectively. The VIP values were calculated by establishing between-group comparison of OPLS-DA models for comparison (the model scores and diagnostic results can be found in the supplementary materials), and screening was conducted in combination with the significance test (p value). The screening criteria were VIP≥1 and p<0.05.
After screening, 366, 528, and 695 differential metabolites were identified in the TY-1h_vs_CK, TY-2h_vs_CK, and TY-3h_vs_CK comparisons respectively. Interestingly, the types of differential metabolites increased with the increase of oxygen supply time. The difference in metabolites was most significant in TY-3h, indicating that among the four treatments, the improvement effect of TY-3h on quality was the most different from that of CK (Figure 5D). Venn diagram analysis of the three comparison groups further confirmed this observation result, with unique metabolites across comparisons following the order: TY-1h vs CK (61), TY-2h vs CK (67), and TY-3h vs CK (233). Furthermore, there were 223 differential metabolites identified in four groups.
These metabolites can reflect the impact of oxygen fermentation treatment on the metabolic profile of black tea. As shown in Figure 5D, flavonoids account for the largest proportion among differential metabolites across the four tea samples, accounting for 29.73% of the total. Phenolic acids represented the second major component (18.92%), followed by lipids (12.61%) and terpenoids (8.11%), with all remaining categories each contributing less than 5%.
The contents of 223 common differential metabolites in different treatments were subjected to HCA clustering and visualization, with visualization results presented in Figure 5F. The column-wise clustering pattern revealed that replicate samples from identical treatments consistently grouped together, demonstrating robust reproducibility of the metabolomic profiling. Interestingly, the changing trends of the contents of these substances can roughly be divided into two distinct clusters: upward or downward accumulation patterns in the TY group.
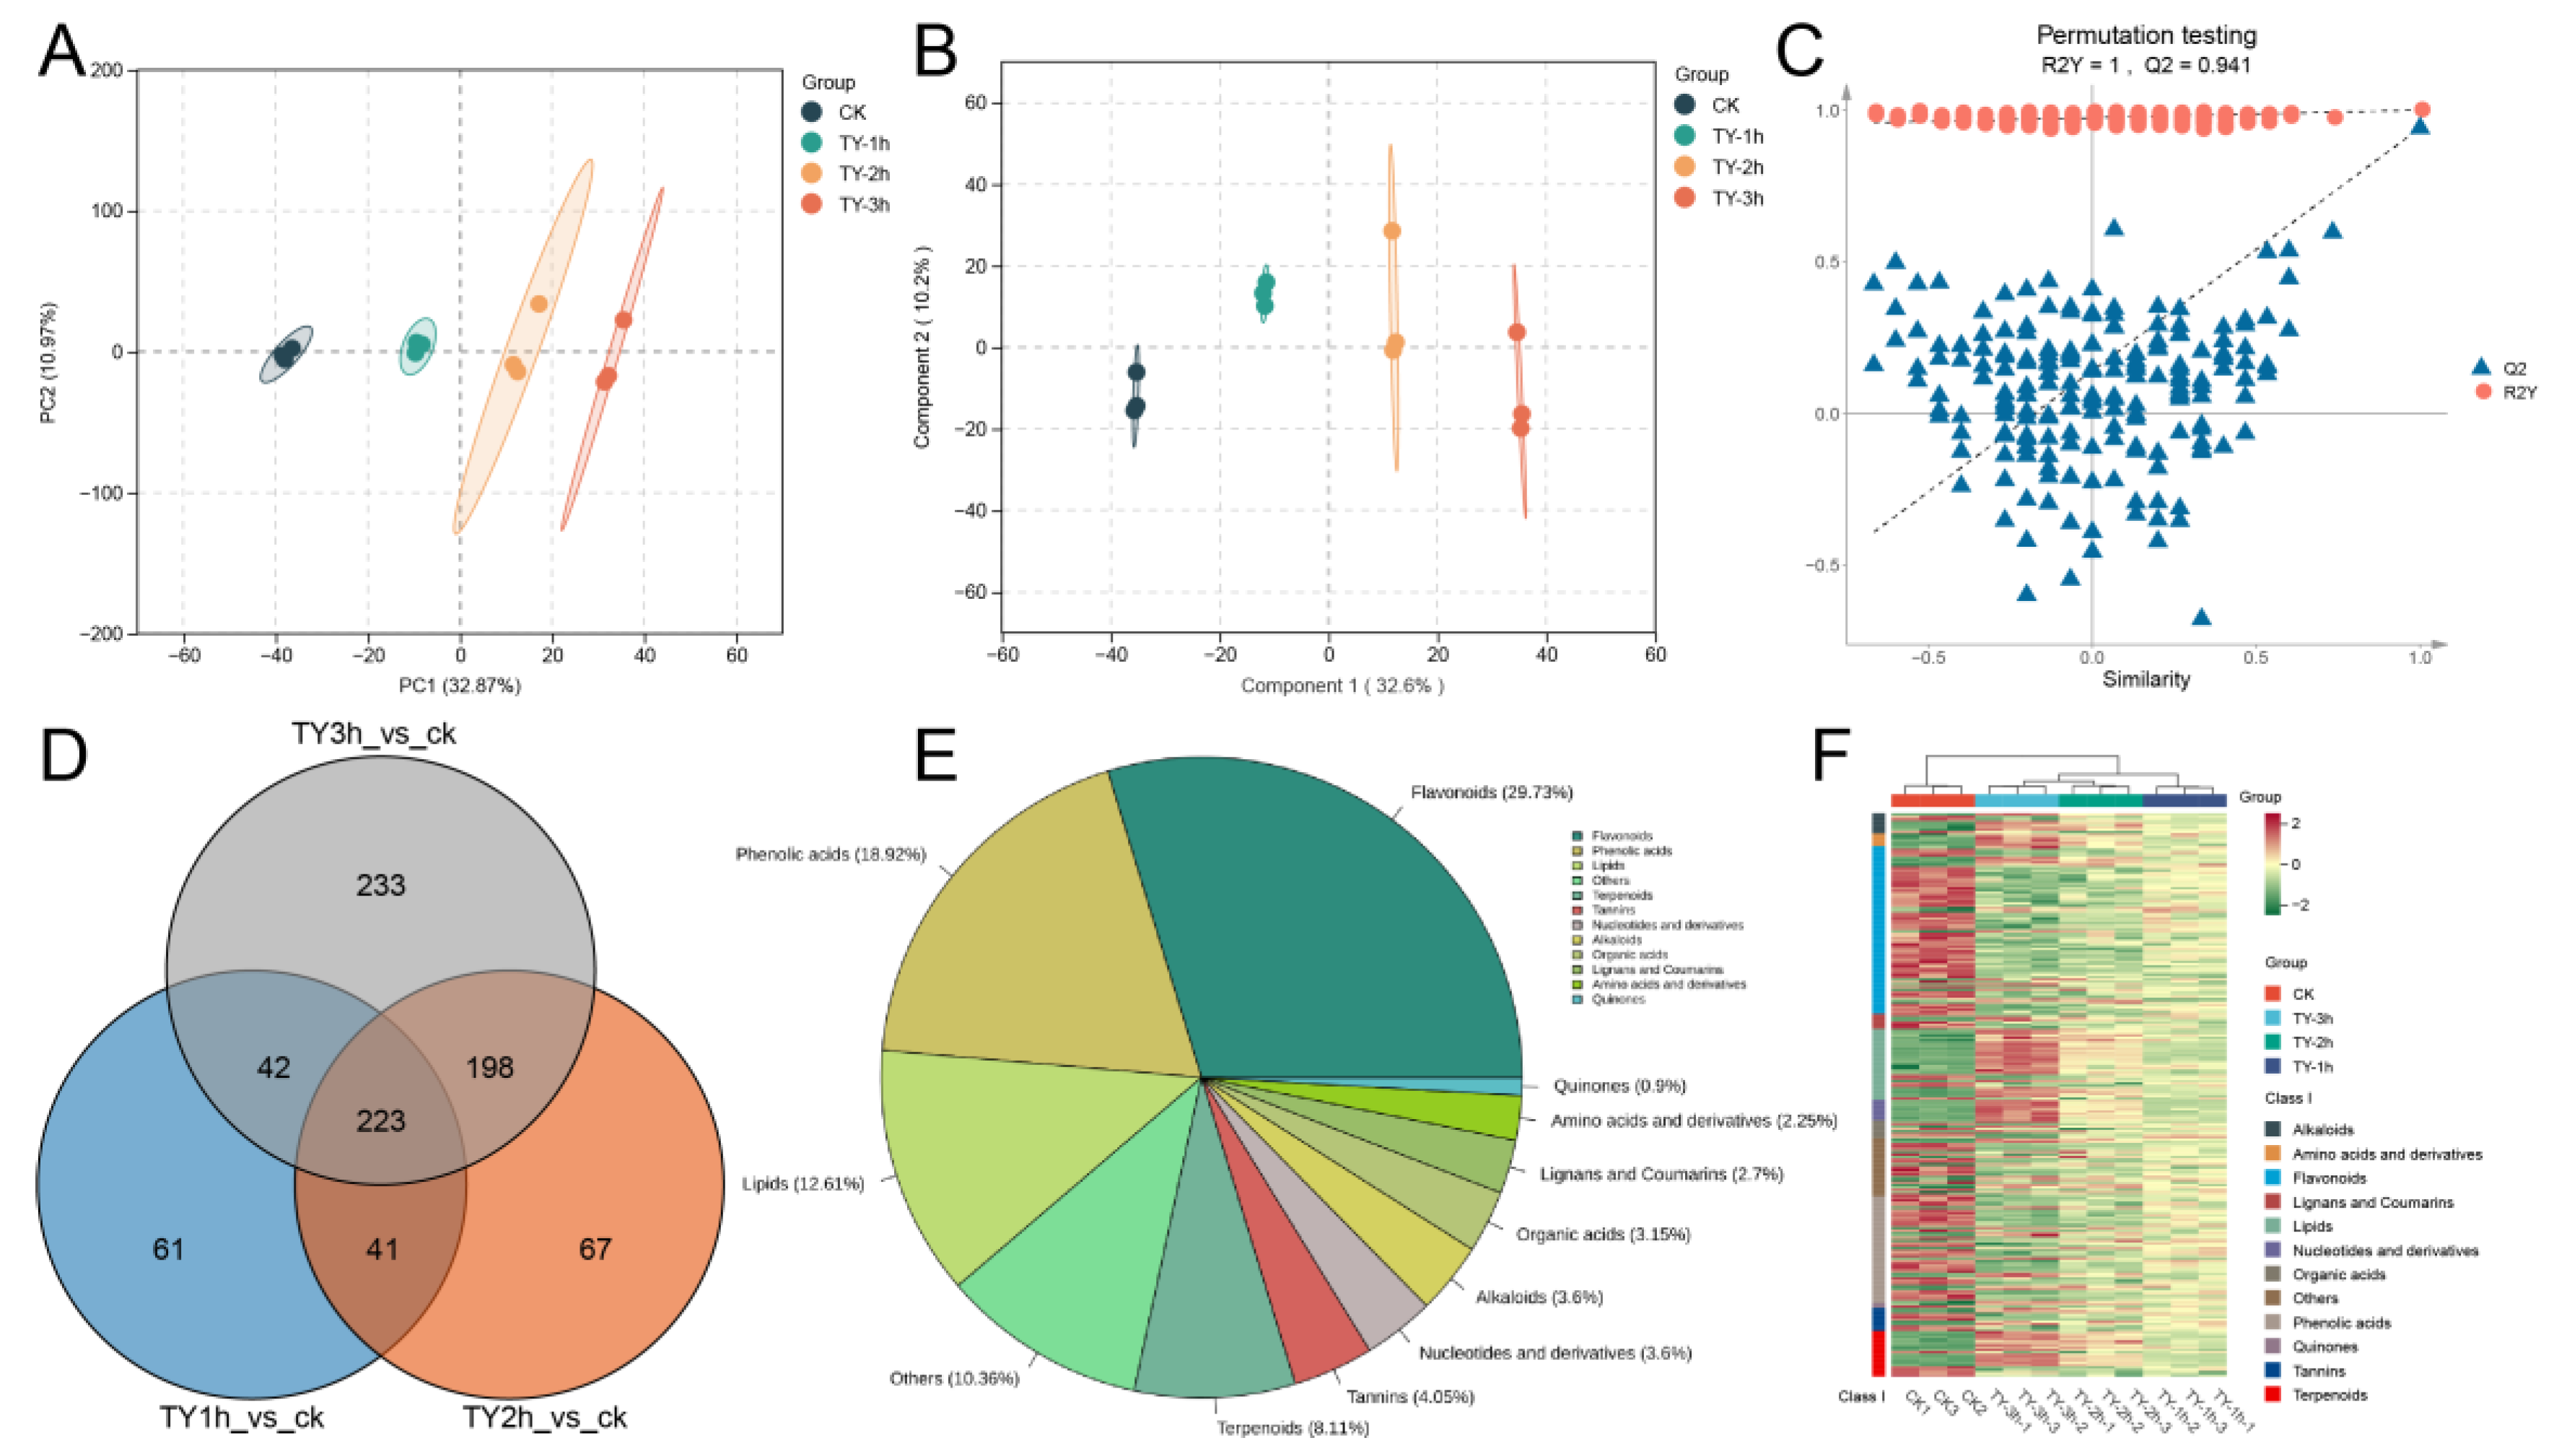
Figure 5.
Metabolomics analysis of non-volatile metabolites at different treatments. (A) PCA; (B) OPLS-DA; (C) OPLS-DA model validation; (D) Number of differential metabolites across CK and different oxygen supply time; (E) Classification of differential metabolites among different comparison groups; (F) Heatmap of the relative abundance of differential metabolites, with data standardized within rows and clustered in columns.
3.4.3. Key Differential Non-Volatile Metabolites of Four Different Treatments
Based on a fold change threshold of ≥5 or ≤0.2, a total of 524 non-volatiles and 77 volatiles with significant alterations were identified. These compounds are crucial for the characteristics of the tea and primarily belong to categories such as flavonoids, phenolic acids, flavonoids and Terpenoids metabolites (Figure 7). Notably, in phenolic acids metabolites, namely, Methyl Hydroxycinnamate, p-Coumaric acid methyl ester and Methyl caffeate displayed a higher content in four treatments.in nucleotides and derivatives metabolites, namely, 9-(Arabinosyl)hypoxanthine, Cyclic 3',5'-Adenylic acid and Guanosine 3',5'-cyclic monophosphate displayed a significant difference in changes.
The total of non-volatile differential metabolites were analyzed using K-means clustering with K=2 to identify the metabolites accumulated in the up-regulation and down-regulation of the TY groups, and two subclusters were obtained. Subcluster 1 contains 99 metabolites and is upregulated and accumulated in the TY treatment, while subcluster 2 contains 123 metabolites and is downregulated and accumulated in the TY treatment (Figure 6 A, B).
The upregulated metabolites in this study primarily encompass flavonoids, lipids, phenolic acids, terpenoids, amino acids and their derivatives, as well as nucleotides and related compounds. Flavonoid compounds are of paramount importance not only to the gustatory quality but also to the chromatic characteristics of tea leaves. Our investigation identified 13 upregulated flavonoid compounds in increased oxygen treatment, comprising chalcones (4), flavanones (1), flavones (5), and flavonols (3). Flavonols predominantly exist in glycosylated forms within tea leaves, including notable compounds such as Quercetin-4'-O-glucoside (Spiraeoside)*, Kaempferol-3-O-(2''-p-Coumaroyl)glucoside, and Quercetin-3-O-(2''-O-caffeoyl)glucoside-(1→2)-(6''-Malonyl)glucoside. These compounds impart a delicate, slightly astringent flavor profile while potentiating the inherent bitterness of caffeine in tea infusions. The TY treatment also induced significant accumulation of five flavones, including 6-Hydroxyluteolin 5-glucoside*, Apigenin (4',5,7-Trihydroxyflavone), Chrysoeriol-5-O-glucoside, Chrysoeriol-6-C-glucoside-7-O-glucoside, and Apigenin-4'-O-(2'',6''-di-O-p-coumaroyl)glucoside. The majority of these phytochemicals exhibit glycosylation patterns, a characteristic structural feature that enhances their solubility and bioavailability in aqueous infusion systems.
The upregulated lipid profile primarily consists of various free fatty acids alongside lysophosphatidylcholines (LPCs) and lysophosphatidylethanolamines (LPEs), compounds recognized for their roles in membrane remodeling and flavor precursor formation.
Phenolic acids, crucial enhancers of umami taste and architects of tea's characteristic flavor profile (Kaneko et al., 2006), demonstrated dynamic accumulation patterns. Notably, 4,6-(S)-Hexahydroxydiphenoyl-D-glucose and Chicoric Acid peaked in TY-2h samples, while other phenolic acids – including 3-Methylsalicylic Acid, 3-Hydroxycinnamic Acid*, Brevifolin carboxylic acid, Octyl gallate, Phenethyl caffeate, 1-O-rhamnose-3-O-Caffeoyl Quinic Acid, and 1,2,6-Tri-O-galloyl-β-D-glucose* – exhibited progressive accumulation proportional to aerobic fermentation duration.
Terpenoid metabolism featured upregulated diterpenoids and sesquiterpenoids, secondary metabolites known to contribute to tea's aromatic complexity. Amino acid derivatives manifested predominantly as dipeptides – Glycylphenylalanine*, Phe-Ser, Phe-Thr, Glu-Phe, and γ-Glutamylphenylalanine – likely hydrolysis products of proteolytic activity during fermentation. Concurrently, sustained upregulation of nucleotide derivatives, including 9-(Arabinosyl)hypoxanthine, cyclic 3',5'-adenylic acid, guanosine 3',5'-cyclic monophosphate, guanosine, hypoxanthine, and guanine, suggests potential associations with cellular structural disruption and macromolecular nucleic acid hydrolysis. These metabolic shifts collectively reflect the biochemical orchestration underlying tea fermentation's transformative effects.
The downregulated metabolites predominantly feature flavonoids, phenolic acids, tannins, and terpenoids. The diminished flavonoid profile encompasses various flavanols, anthocyanins, flavones, flavanones, flavonols, and dihydroflavonols. Notably, multiple catechin derivatives exhibited significant downregulation, including Catechin, Gallocatechin, Epicatechin gallate, Gallocatechin gallate, Epigallocatechin 3-O-(3-O-Methyl)gallate, Epigallocatechin 3-O-Cinnamate, Epigallocatechin 3,5-digallate, 3'-O-Methyl-6-hydroxygallocatechin 3-O-(N-Ethylglutamine ester) 3'-gallate, 4'-O-Methyl-6-hydroxygallocatechin 3-O-(N-Ethylglutamine ester) 3'-gallate, Catechin-catechin-catechin, and Gallocatechin-(4α→8)-Catechin-(4α→8)-Catechin. Tannin reduction manifested through decreased proanthocyanidins such as Procyanidin B2, Procyanidin B4, Procyanidin C1, and Procyanidin C2, concomitant with a marked reduction in sucrose content.
These metabolic changes indicate extensive polymerization of simple flavonoids during aerobic fermentation, generating darker-hued, organoleptically complex polymeric structures. This biochemical transformation critically contributes to the characteristic "red liquor and red leaves" quality parameters of black tea. The coordinated downregulation of phenolic acids and tannins further facilitates flavor refinement, reducing astringency while enhancing the mellow, full-bodied taste profile through selective molecular reorganization.
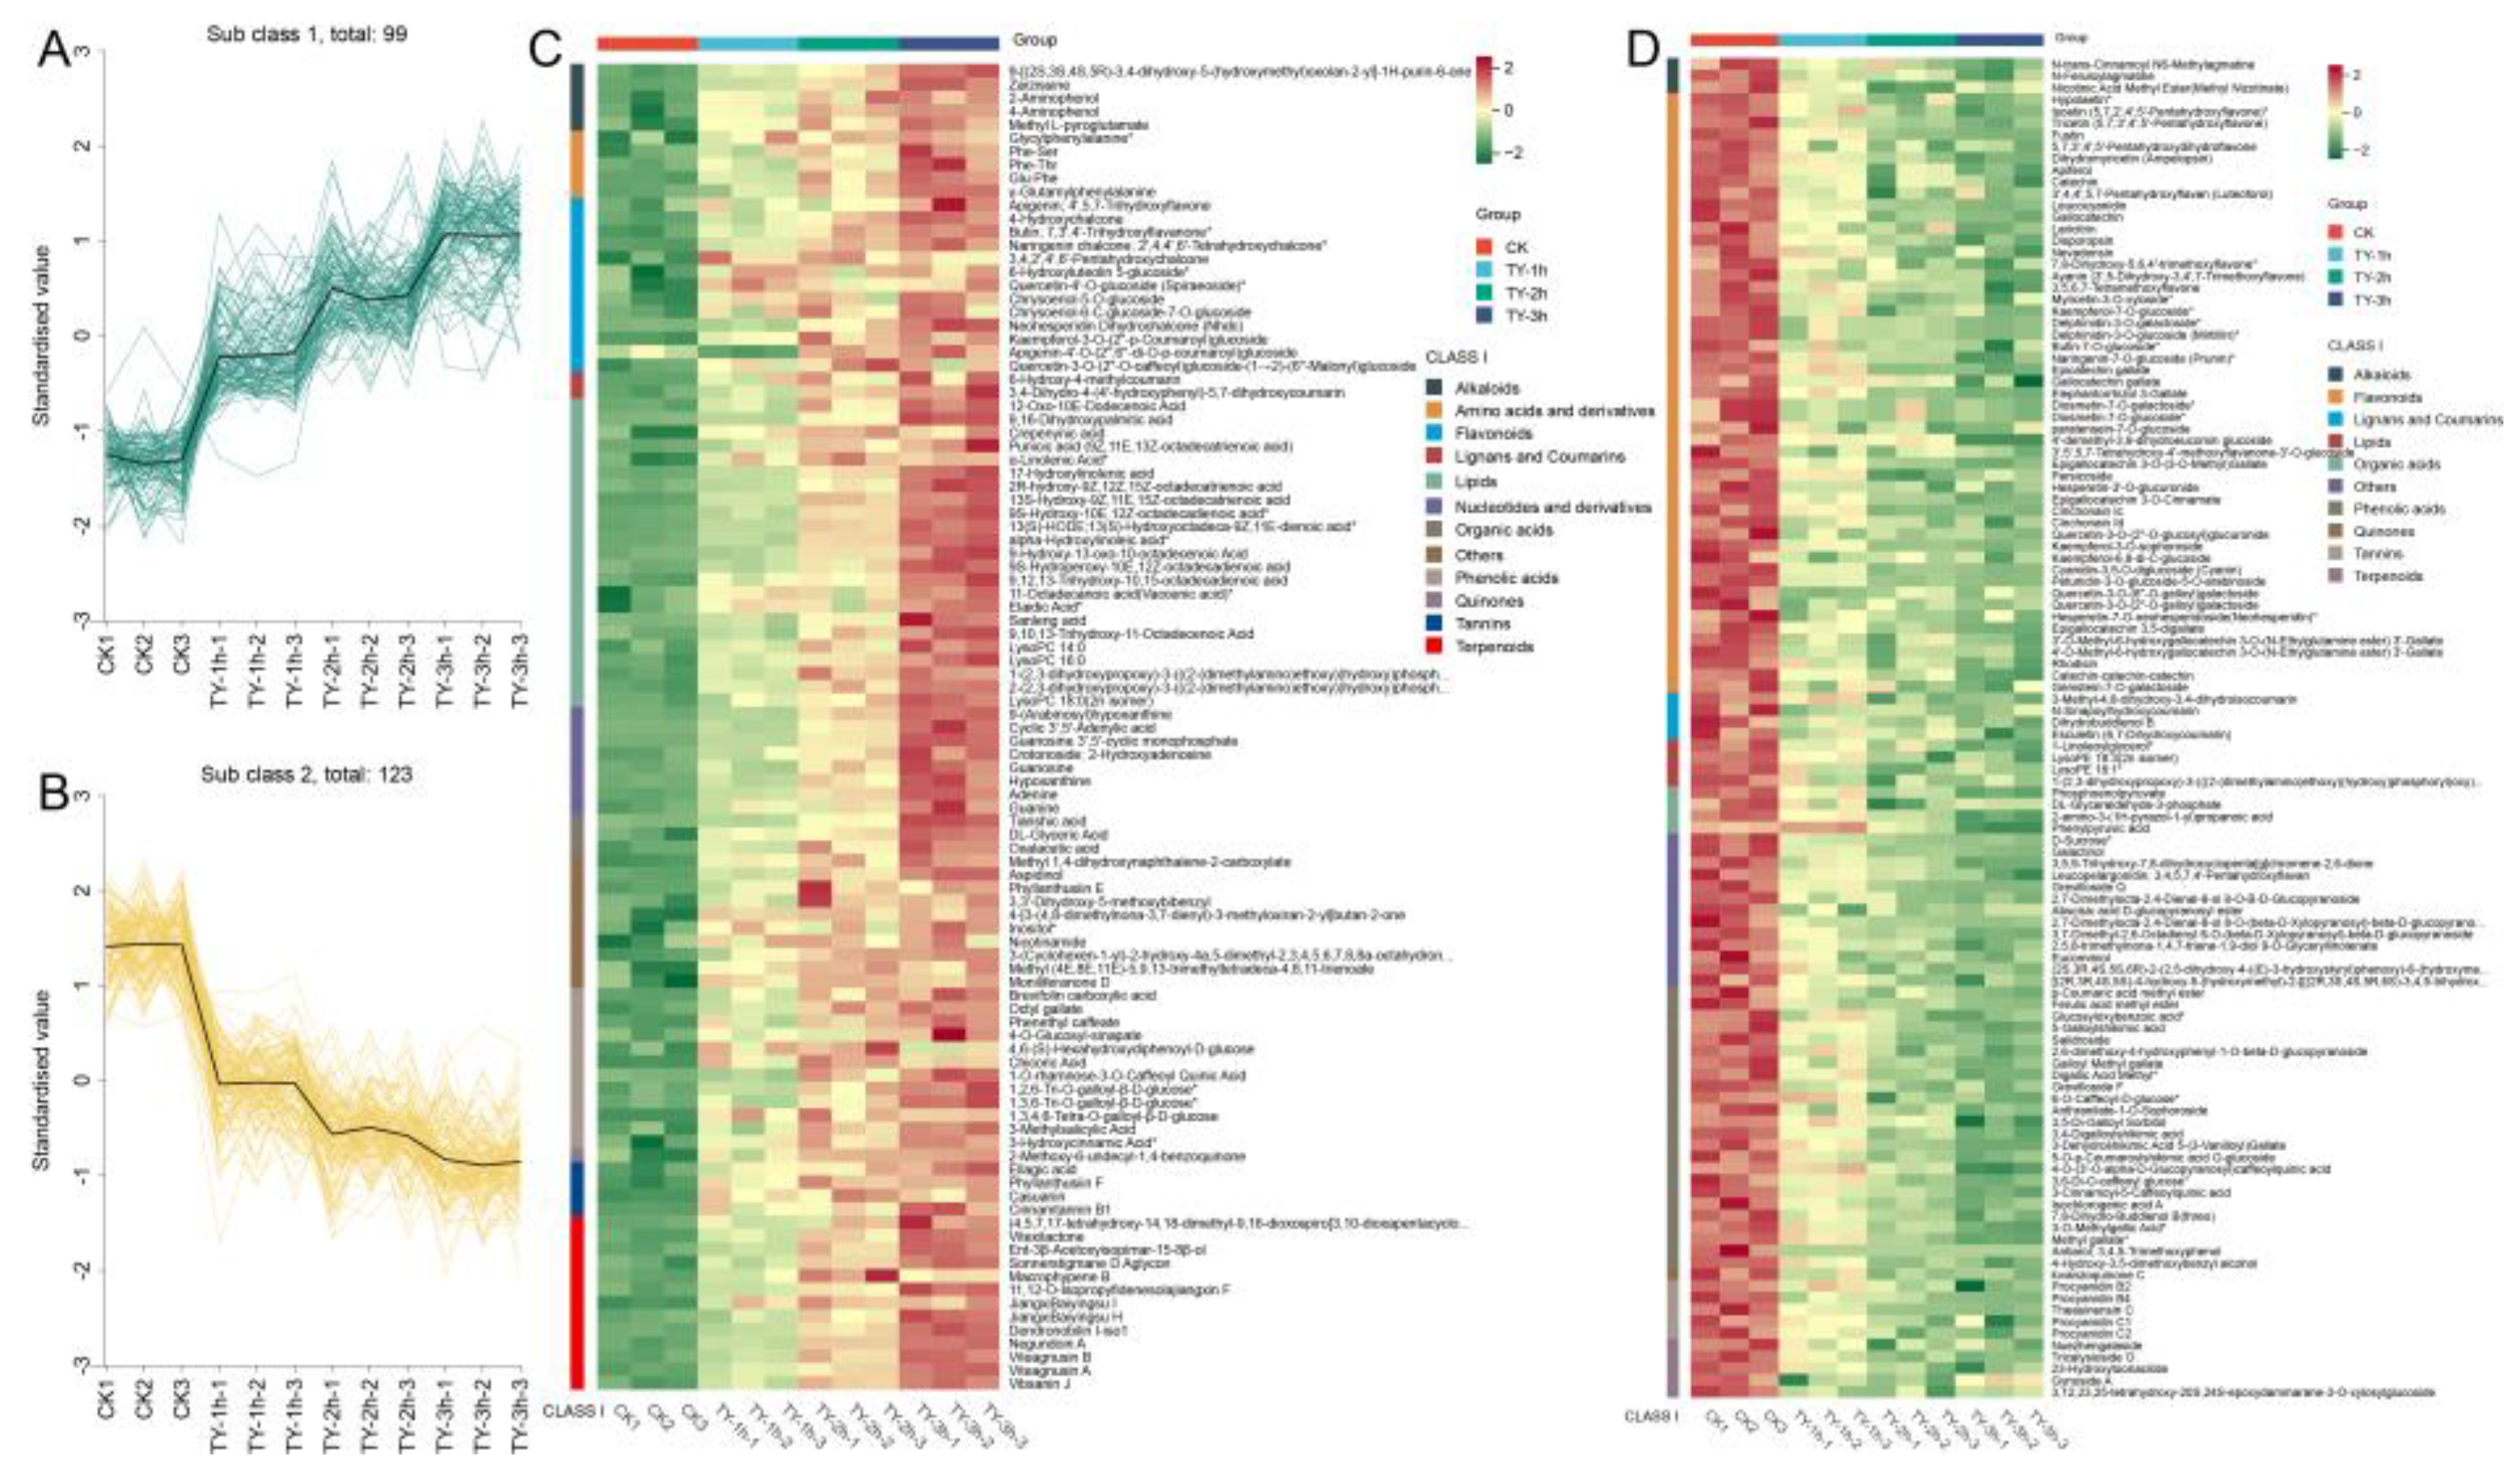
Figure 6.
K-means clustering and abundance dynamics of differentially expressed non-volatile metabolites. (A) Kmeans clustering 1 and (B) Clustering 2; (C) Heatmap of up regulated DEMs. (D) Heatmap of down regulated DEMs. Green and red segments denote the low and high abundance of metabolites respectively.
3.5. Effect of Increased Oxygen Treatment on Non-Targeted Metabolomics Analysis Based on GC-MS
3.5.1. Composition and Variation Trend of Volatile Metabolites of Four Different Treatments
Our investigation into oxygen-permeable fermentation's impact on black tea flavor profiles employed untargeted metabolomics to characterize volatile organic compounds (VOCs). The analysis identified 761 volatile metabolites spanning 16 categories, including 158 terpenoids, 130 esters, 113 heterocyclic compounds, 66 alcohols, 49 aldehydes, 45 aromatic hydrocarbons, and 7 aliphatic hydrocarbons, with remaining categories each constituting <5% of total detected VOCs.
Principal Component Analysis revealed two principal components accounting for 73.75% of total variance (PC1:56.83%, PC2:16.92%). Mirroring non-volatile metabolome findings, PCA score plots demonstrated distinct intra-group clustering of TY tea samples, with four experimental treatments forming sequential distribution along PC1 axis (Figure 7A). Orthogonal Partial Least Squares-Discriminant Analysis (OPLS-DA) showed components explaining 55.8% and 15.7% variance respectively. Permutation testing (200 iterations) validated model robustness with vector values R²Y=(0.0,0.989) and Q²=(0.0,0.977) (Figure 7B-C), indicating significant metabolic differentiation among experimental groups.
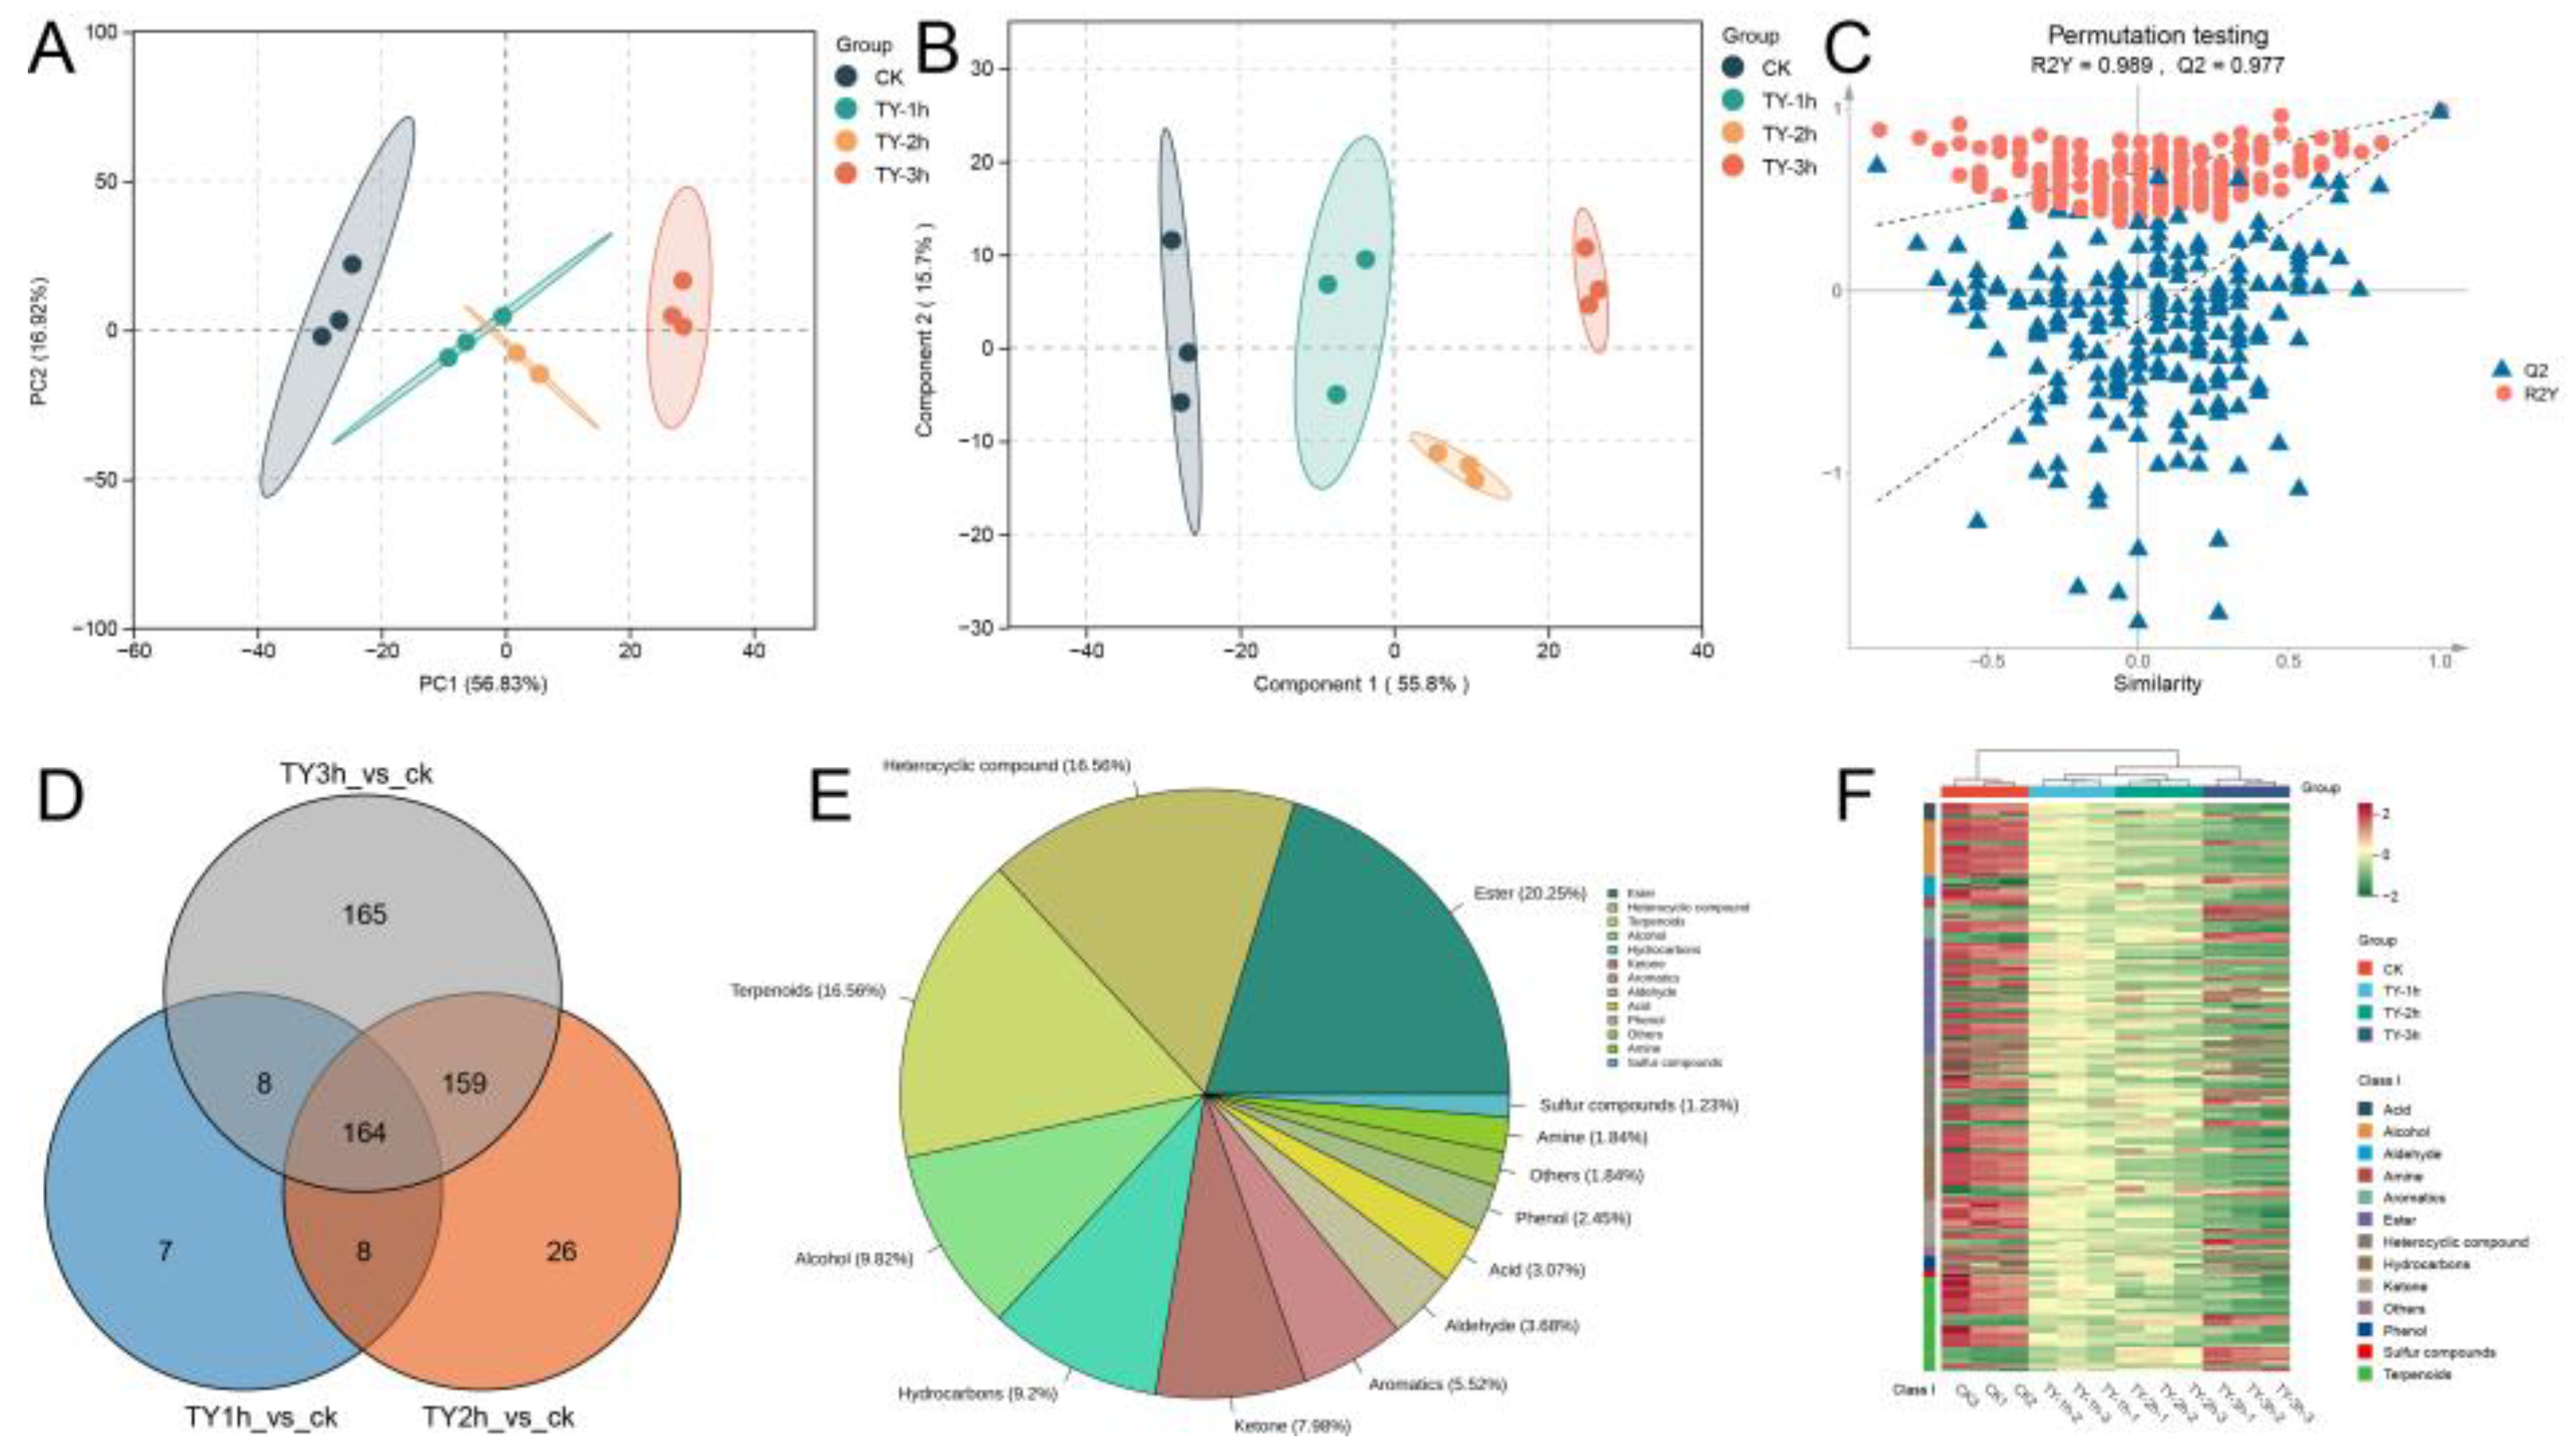
Figure 7.
Volatile profiling across oxygen exposure durations. (A) Principal Component Analysis (PCA) score plot; (B) Orthogonal Partial Least Squares-Discriminant Analysis (OPLS-DA) projection; (C) Diagnostic validation of OPLS-DA model through permutation testing; (D) Quantitative distribution of differential metabolites between experimental groups and control (CK); (E) Taxonomic classification of shared differential metabolites across comparison groups; (F) Hierarchically clustered heatmap depicting normalized relative abundance of consensus differential metabolites, with row-wise standardization and column-based clustering. Chromatic intensity reflects metabolite abundance gradients (green: reduced concentrations; red: elevated concentrations).
3.5.2. Key Differential Volatile Metabolites of Four Different Treatments
Following rigorous screening by variable importance projection (VIP>1) and statistical significance threshold (p<0.05), comparative analyses revealed 168, 356, and 496 differential volatile metabolites in TY-1h_vs_CK, TY-2h_vs_CK, and TY-3h_vs_CK respectively (Figure 7D), exhibiting a progressive increase corresponding to extended aeration duration. Unique metabolic signatures were identified across comparisons, comprising 7, 26, and 165 treatment-specific volatiles in respective groups, demonstrating substantial aromatic modification induced by TY-3h intervention.
Flavor profiling of differential volatile metabolites across comparative groups was systematically executed, prioritizing the top 10 organoleptic categories exhibiting maximal annotated compound diversity. As illustrated in Figure 8A, the TY-1h_vs_CK comparison revealed predominant organoleptic signatures of greenness, fruitiness, and apple-like notes, complemented by subsidiary sweet, banana, vinous, and fresh undertones. The TY-2h_vs_CK group demonstrated substantial expansion in both qualitative and quantitative dimensions, with reinforced green-sweet duality, intensified apple nuances, and diversified fruity complexity. Temporal progression to TY-3h_vs_CK manifested sensory recalibration toward sophisticated aroma spectra dominated by fruity-sweet convergence, floral prominence, and pear-apple synesthesia. This oxygenation-dependent phytochemical evolution illustrates a paradigm shift in black tea's aromatic architecture - transitioning from simple vegetative notes to multifaceted bouquet development characterized by escalating fruity esters, sacchariferous derivatives, and floral terpenoid synergies during prolonged fermentation.
Venn analysis further delineated 164 conserved differential metabolites across all three treatments. Detailed classification of these shared metabolites (Figure 7E) revealed predominant chemical families: Esters (20.25%), Heterocyclic compounds (16.56%), Terpenoids (16.56%), Alcohols (9.82%), Hydrocarbons (9.2%), Ketones (7.98%), and Aromatics (5.52%), with remaining categories collectively representing 13.21% of the total.
Hierarchical clustering analysis of pivotal volatile constituents revealed predominant downregulation patterns in alcohol, ester, heterocyclic compound, hydrocarbon, and terpenoid accumulation with prolonged aeration (Figure 7F). Notably, select aldehyde, ester, ketone, and terpenoid derivatives exhibited upregulated deposition profiles, potentially serving as critical contributors to the final black tea's signature aromatic bouquet through their distinctive accumulation dynamics.
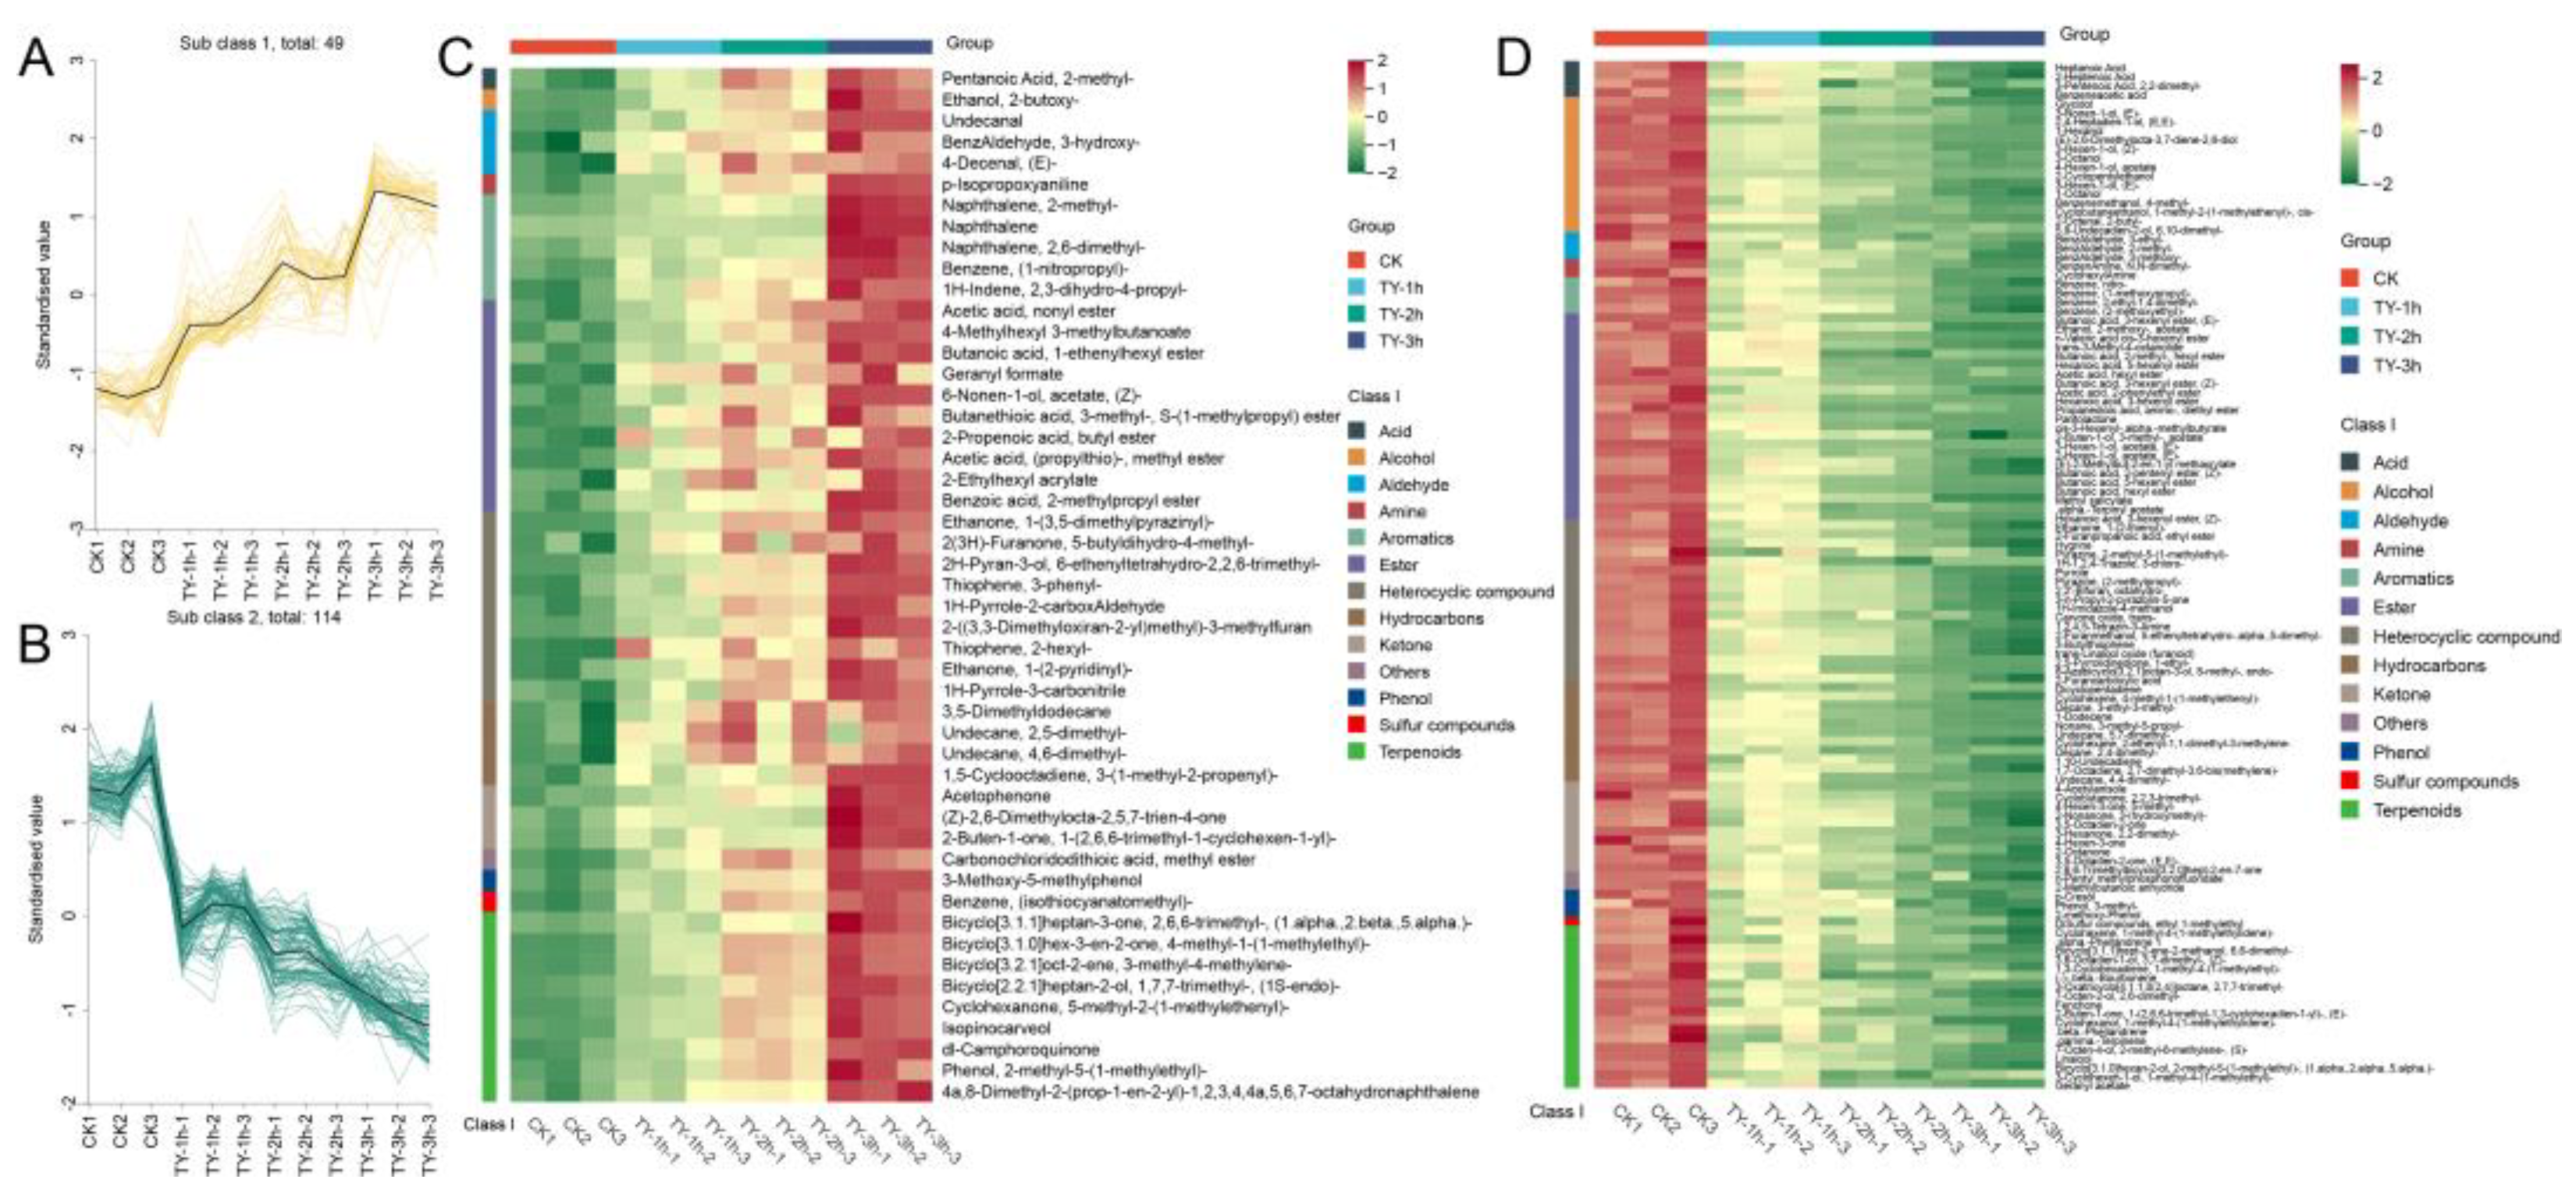
K-means clustering delineated 49 upregulated and 114 downregulated volatile metabolites (Figure 9A, 9B). Among the enriched constituents, we identified notable aromatic compounds including Butanoic acid, 1-ethenylhexyl ester; 2H-Pyran-3-ol, 6-ethenyltetrahydro-2,2,6-trimethyl-; Ethanone, 1-(3,5-dimethylpyrazinyl)-; 2-((3,3-Dimethyloxiran-2-yl)methyl)-3-methylfuran; and Bicyclo[2.2.1]heptan-2-ol, 1,7,7-trimethyl-, (1S-endo)-, which demonstrated progressive accumulation patterns positively correlated with oxygenation duration. These pharmacologically active volatiles collectively impart signature organoleptic properties to black tea, particularly enhancing floral nuances, fruity undertones, and roasted aromatic complexity through their synergistic biosynthetic regulation (Figure 9C).
Progressive oxygenation duration elicited marked depletion of herbaceous volatiles, including 3-Hexen-1-ol (Z)-, 3-Hexen-1-ol (E)-, Butanoic acid 3-hexenyl ester (Z)-, 3-Hexen-1-ol acetate (E)-, and Pantolactone. Concomitantly, citrus-associated aroma constituents α-terpinyl acetate and geranyl acetate demonstrated diminishing accumulation profiles. Intriguingly, signature black tea volatiles methyl salicylate and hexyl acetate showed significant depletion during aeration, presumably attributable to sensory quality recalibration favoring intensified saccharine and floral dominance in oxygen-fermented tea leaves (Figure 9C).
4. Conclusions
Comparative analysis revealed oxygenation treatment significantly accelerated enzymatic browning kinetics and chromatic transition toward characteristic russet pigmentation in Congou black tea fermentation, concurrently enhancing signature aroma development while abbreviating processing duration.
During initial phases, aerated fermentation achieves accelerated biosynthesis and supraoptimal accumulation of TFs and thearubigins TRs versus conventional anaerobic protocols. Paradoxically, sustained oxygenation beyond critical temporal thresholds induces accelerated TF/TR degradation kinetics exceeding natural metabolic clearance rates, compounded by disproportionate TB formation through oxidative polymerization. This dual-phase oxygenation effect culminated in detrimental effects on final product quality, manifesting as imbalanced astringency-modulation and compromised liquor brightness.
Quantitative analysis of theaflavins, catechins, caffeine, and amino acids in tea samples with different fermentation degrees (I, II, III) revealed that during fermentation, total theaflavin content slightly increased while catechin levels decreased drastically, though the rate of decrease gradually slowed. This phenomenon may result from the strong correlation between catechin reduction and theaflavin formation [23].
During black tea fermentation, catechins undergo enzymatic oxidation with polyphenol oxidase to yield substantial TFs [24]. As fermentation progresses, the diminished catalytic capacity of polyphenol oxidase coupled with diminishing phenolic substrates progressively attenuates the rate of catechin depletion.
The overall reduction in free amino acids likely stems from their transformation during fermentation through three primary pathways. First, enzymatic decarboxylation and deamination convert amino acids into aromatic compounds like aldehydes, alcohols, and acids. Second, they participate in condensation reactions with polyphenols and carbohydrates to form quinones, aldehydes, acids, and alcohols. Third, amino acids interact synergistically with theaflavins and thearubigins, yielding dark-colored, highly polymerized compounds [25,26].
Throughout the fermentation spectrum, distinct biochemical trajectories define tea quality. Samples subjected to light fermentation (I) retain elevated catechin levels, imparting an astringent and herbaceous infusion. Moderately fermented batches (II) exhibit diminished catechins alongside amplified theaflavin synthesis, culminating in a robust and refreshing character. Conversely, heavily fermented variants (III) demonstrate minimal catechin preservation with diminished infusion concentration, yet paradoxically achieve a mellow and harmonious flavor profile through advanced oxidative polymerization.
Our comprehensive metabolomic profiling identified 761 volatile compounds spanning 16 distinct classes, revealing dynamic aromatic evolution under progressive oxygenation. Prolonged oxygenation duration correlated positively with both quantitative expansion of differential volatile metabolites and qualitative diversification of fragrant constituents, orchestrating sensorial metamorphosis toward fruity-sweet-floral dominance. Notably, oxygenation-driven biosynthesis manifested in gradual elevation of signature aromatic compounds including Butanoic acid, 1-ethenylhexyl ester; 2H-Pyran-3-ol, 6-ethenyltetrahydro-2,2,6-trimethyl-; Ethanone, 1-(3,5-dimethylpyrazinyl)-; 2-((3,3-Dimethyloxiran-2-yl)methyl)-3-methylfuran; and Bicyclo[2.2.1]heptan-2-ol, 1,7,7-trimethyl-, (1S-endo)-. These oxygen-responsive phytochemicals demonstrated incremental elevation profiles, collectively contributing to the organoleptic evolution toward sophisticated fruity-floral bouquets characteristic of premium black teas.
Supplementary Materials
The following supporting information can be downloaded at the website of this paper posted on Preprints.org, Table S1: Sensory quality of congou black tea; Table S2: The color differences of congou black tea infusion; Table S3: Contents of non-volatile compounds in black tea under different oxygen supply conditions; Table S4: Contents of volatile compounds in black tea under different oxygen supply conditions.
Author Contributions
Conceptualization, X.J. and H.J.; Methodology, X.W., X.J., C.L. and L.W.; Software, X.L.; Validation, C.L. and X.J.; Formal Analysis, X.J.; Investigation, X.J., C.L., X.L. and H.J.; Resources, D.N. and Z.Y.; Data Curation, S.Z. and X.J.; Writing - Original Draft Preparation, S.Z.; Writing - Review & Editing, X.J., X.L. and X.W.; Visualization C.L. and L.W.; Supervision, X.L. and C.L.; Project Administration, X.J.; Funding Acquisition, X.J. All authors have read and agreed to the published version of the manuscript.
Funding
This research was funded by National Natural Science Foundation of China (32460785), Jiangxi Provincial Key Laboratory of Plantation and High Valued Utilization of Specialty Fruit Tree and Tea(20241ZDD02045), Modern Agricultural Industrial Technology System of Jiangxi Province (JXARS-06), and the Key Projects of Science and Technology Cooperation in Jiangxi Province (20212BDH80011).
Data Availability Statement
The original contributions presented in this study are included in the article/Supplementary Materials; further inquiries can be directed to the corresponding authors.
Conflicts of Interest
The authors declare no conflicts of interest.
References
- Chen, Y.; Zhang, Y.; Zhang, M.; Yang, H.; Wang, Y. Consumption of Coffee and Tea with All-Cause and Cause-Specific Mortality: A Prospective Cohort Study. BMC Med 2022, 20, 449. [Google Scholar] [CrossRef] [PubMed]
- Liu, Y.; Chen, Q.; Liu, D.; Yang, L.; Hu, W.; Kuang, L.; Huang, Y.; Teng, J.; Liu, Y. Multi-Omics and Enzyme Activity Analysis of Flavour Substances Formation: Major Metabolic Pathways Alteration during Congou Black Tea Processing. Food Chemistry 2023, 403, 134263. [Google Scholar] [CrossRef] [PubMed]
- Chen, Q.; Zhu, Y.; Liu, Y.; Liu, Y.; Dong, C.; Lin, Z.; Teng, J. Black Tea Aroma Formation during the Fermentation Period. Food Chemistry 2022, 374, 131640. [Google Scholar] [CrossRef]
- Nasir, N.F.; Mohamad, N.E.; Alitheen, N.B. Fermented Black Tea and Its Relationship with Gut Microbiota and Obesity: A Mini Review. Fermentation 2022, 8, 603. [Google Scholar] [CrossRef]
- Qu, F.; Zeng, W.; Tong, X.; Feng, W.; Chen, Y.; Ni, D. The New Insight into the Influence of Fermentation Temperature on Quality and Bioactivities of Black Tea. LWT 2020, 117, 108646. [Google Scholar] [CrossRef]
- Chen, L.; Liu, F.; Yang, Y.; Tu, Z.; Lin, J.; Ye, Y.; Xu, P. Oxygen-Enriched Fermentation Improves the Taste of Black Tea by Reducing the Bitter and Astringent Metabolites. Food Research International 2021, 148, 110613. [Google Scholar] [CrossRef] [PubMed]
- Wang, H.; Shen, S.; Wang, J.; Jiang, Y.; Li, J.; Yang, Y.; Hua, J.; Yuan, H. Novel Insight into the Effect of Fermentation Time on Quality of Yunnan Congou Black Tea. LWT 2022, 155, 112939. [Google Scholar] [CrossRef]
- Hua, J.; Wang, H.; Yuan, H.; Yin, P.; Wang, J.; Guo, G.; Jiang, Y. New Insights into the Effect of Fermentation Temperature and Duration on Catechins Conversion and Formation of Tea Pigments and Theasinensins in Black Tea. J Sci Food Agric 2022, 102, 2750–2760. [Google Scholar] [CrossRef]
- Vargas, R.; Vecchietti, A. Influence of Raw Material Moisture on the Synthesis of Black Tea Production Process. Journal of Food Engineering 2016, 173, 76–84. [Google Scholar] [CrossRef]
- Hossain, M.A.; Ahmed, T.; Hossain, Md.S.; Dey, P.; Ahmed, S.; Hossain, Md.M. Optimization of the Factors Affecting BT-2 Black Tea Fermentation by Observing Their Combined Effects on the Quality Parameters of Made Tea Using Response Surface Methodology (RSM). Heliyon 2022, 8, e08948. [Google Scholar] [CrossRef]
- Deka, H.; Pollov Sarmah, P.; Devi, A.; Tamuly, P.; Karak, T. Changes in Major Catechins, Caffeine, and Antioxidant Activity during CTC Processing of Black Tea from North East India. RSC Advances 2021, 11, 11457–11467. [Google Scholar] [CrossRef]
- Ntezimana, B.; Li, Y.; He, C.; Yu, X.; Zhou, J.; Chen, Y.; Yu, Z.; Ni, D. Different Withering Times Affect Sensory Qualities, Chemical Components, and Nutritional Characteristics of Black Tea. Foods 2021, 10, 2627. [Google Scholar] [CrossRef] [PubMed]
- Zhou, J.; Yu, X.; He, C.; Qiu, A.; Li, Y.; Shu, Q.; Chen, Y.; Ni, D. Withering Degree Affects Flavor and Biological Activity of Black Tea: A Non-Targeted Metabolomics Approach. LWT 2020, 130, 109535. [Google Scholar] [CrossRef]
- Chen, W.; Gong, L.; Guo, Z.; Wang, W.; Zhang, H.; Liu, X.; … Luo, J. A novel integrated method for large-scale detection, identification, and quantification of widely targeted metabolites: Application in the study of rice metabolomics. Molecular Plant 2013, 6(6), 1769–1780. [Google Scholar] [CrossRef]
- Wang, M.Q.; Ma, W.J.; Shi, J.; Zhu, Y.; Lin, Z.; Lv, H.P. Characterization of the key aroma compounds in Longjing tea using stir bar sorptive extraction (SBSE)combined with gas chromatography-mass spectrometry (GC–MS), gas chromatography-olfactometry (GC-O), odor activity value (OAV), and aroma recombination. Food Research International 2020, 130, 108908. [Google Scholar] [CrossRef] [PubMed]
- Lu, J.L.; Liang, Y.R.; Gong, S.Y.; Gu, Z.R.; Zhang, L.Y.; Xu, Y.R. Studies on Relationship between Liquor Chromaticity and Organoleptic Quality of Tea. Journal of Tea Science 2002, 22(1), 57–61. [Google Scholar]
- Wu, S.; Yu, Q.; Shen, S.; Shan, X.; Hua, J.; Zhu, J.; Li, J. Non-targeted metabolomics and electronic tongue analysis reveal the effect of rolling time on the sensory quality and nonvolatile metabolites of congou black tea. Lwt-Food Science and Technology 169, 113971. [CrossRef]
- Zhang, L.; Ho, C.T.; Zhou, J.; Santos, J.S.; Armstrong, L.; Granato, D. Chemistry and biological activities of processed Camellia sinensis teas: A comprehensive review. Comprehensive Reviews in Food Science and Food Safety 2019, 18(5), 1474–1495. [Google Scholar] [CrossRef]
- Huang, H.S.; Li, N.; Zhong, X.G. Analysis of quality formation and catechin oxidation kinetics of congou black tea through natural fermentation. Food and Fermentation Industries. Food and fermentation industry 2023, 49(08), 164–169. [Google Scholar] [CrossRef]
- Gao, J.; Wang, Z.; Chen, D.; Peng, J.; Xie, D.; Lin, Z.; Dai, W. Metabolomic characterization of the chemical compositions of Dracocephalum rupestre Hance. Food Research International 2022, 161, Article111871. [Google Scholar] [CrossRef]
- Zhao, F.; Qiu, X.; Ye, N.; Qian, J.; Wang, D.; Zhou, P.; Chen, M. Hydrophilic interaction liquid chromatography coupled with quadrupole-orbitrap ultra high resolution mass spectrometry to quantitate nucleobases, nucleosides, and nucleotides during white tea withering process. Food Chemistry 2018, 266, 343–349. [Google Scholar] [CrossRef] [PubMed]
- Xue, J.J.; Liu, P.P.; Yin, J.F.; Wang, W.W.; Zhang, J.Y.; Wang, W.; Le, T.; Ni, D.J.; Jiang, H.Y. Dynamic changes in volatile compounds of shaken black tea during its manufacture by GC x GC-TOFMS and multivariate data analysis. Foods 2022, 11(9). [Google Scholar] [CrossRef] [PubMed]
- Ning, J.M.; Fang, J.T.; Zhu, X.Y.; Sun, J.J.; Zhang, Z.Z.; Huang, C.W. Analysis of catechins and aromatic of Keemun black tea during processing based on metabolic spectrum technology[J]. Science and Technology of Food Industry 2016, (09), 127–133. [Google Scholar]
- Zhang, L.; Ho, C.T.; Zhou, J.; et al. Chemistry and biological activities of processed Camellia sinensis teas: a comprehensive review[J]. Comprehensive Reviews in Food Science and Food Safety 2019, 18(5), 1474–1495. [Google Scholar] [CrossRef]
- Chen, Y.; Zeng, L.; Liao, Y.; et al. Enzymatic reaction-related protein degradation and proteinaceous amino acid metabolism during the black tea (Camellia sinensis) manufacturing process[J]. Foods 2020, 9(1), 66. [Google Scholar] [CrossRef]
- Yu, Z.; Yang, Z. Understanding different regulatory mechanisms of proteinaceous and non-proteinaceous amino acid formation in tea (Camellia sinensis) provides new insights into the safe and effective alteration of tea flavor and function[J]. Critical Reviews in Food Science and Nutrition 2020, 60(5), 844–858. [Google Scholar] [CrossRef]
Figure 2.
Sensory evaluation wheel of four black teas with different treatment. Note: numbers indicate sensory evaluation scores.
Figure 2.
Sensory evaluation wheel of four black teas with different treatment. Note: numbers indicate sensory evaluation scores.
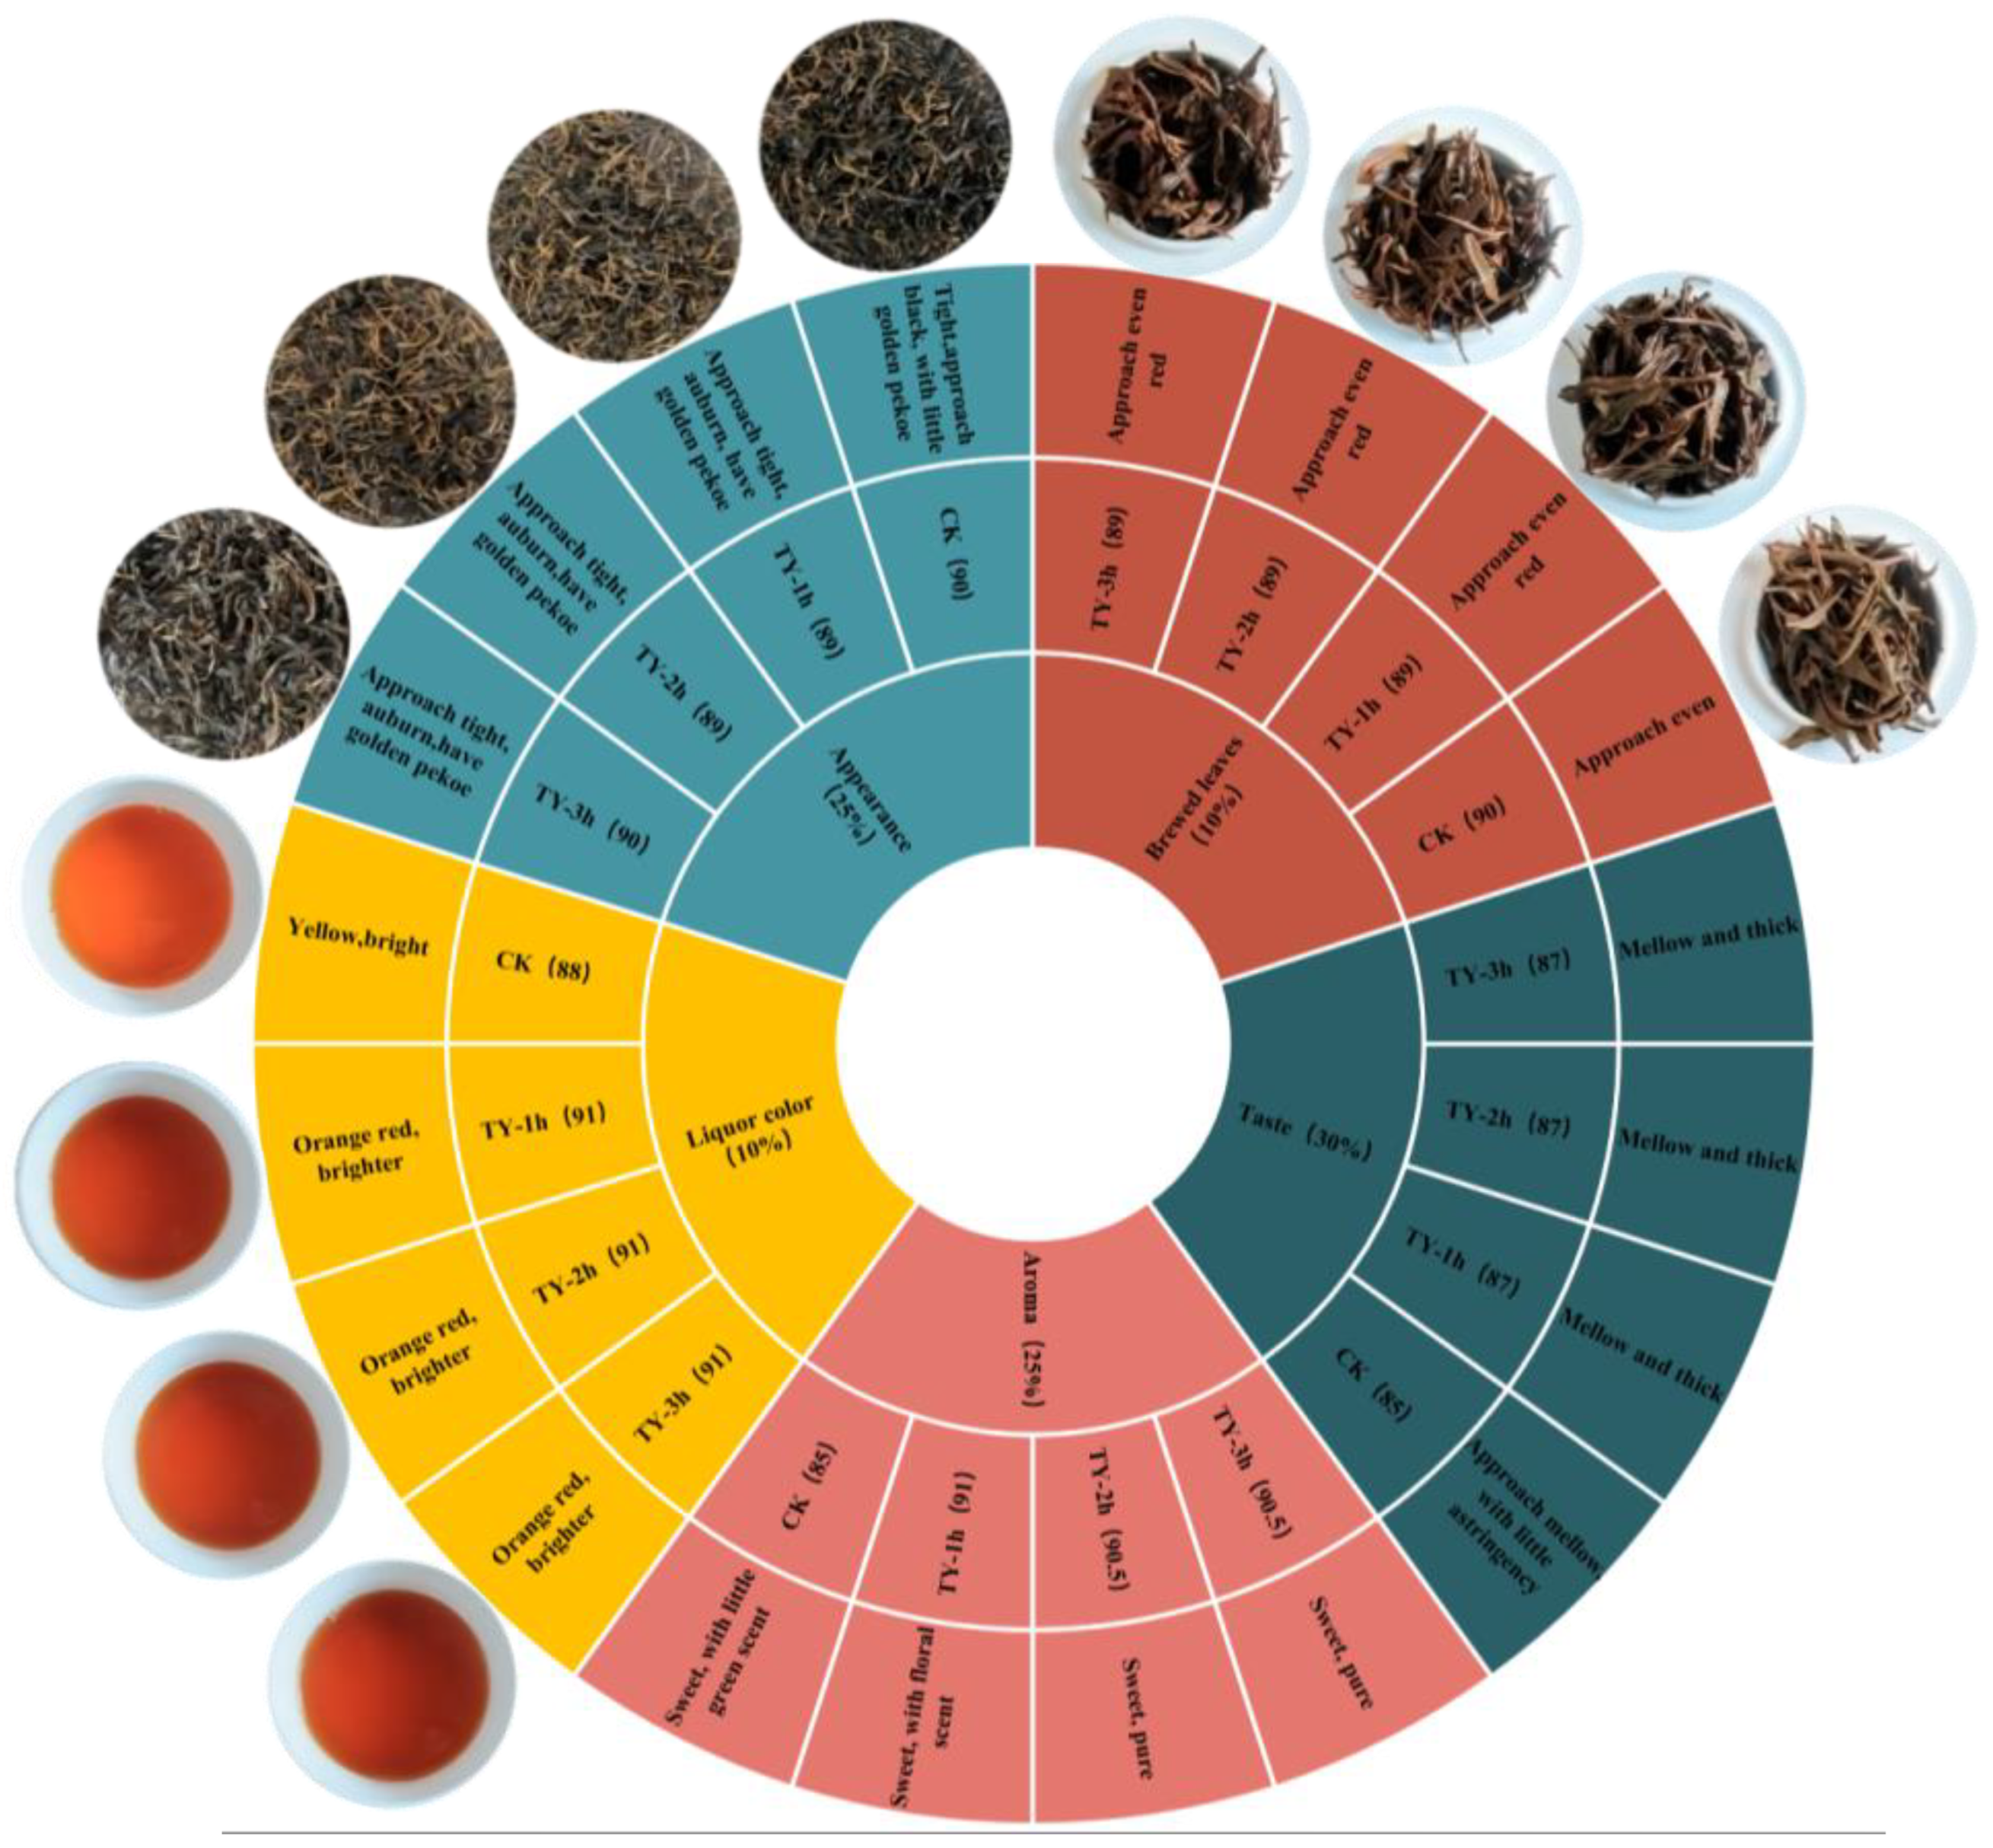
Figure 3.
Comparison of liquor color attributes and tea pigment content among four black teas with different treatment. (A) liquor color attributes; (B) tea pigment content. Data were presented as mean±SD from at least three independent experiments. Bars with different letters are significantly different at p < 0.05.
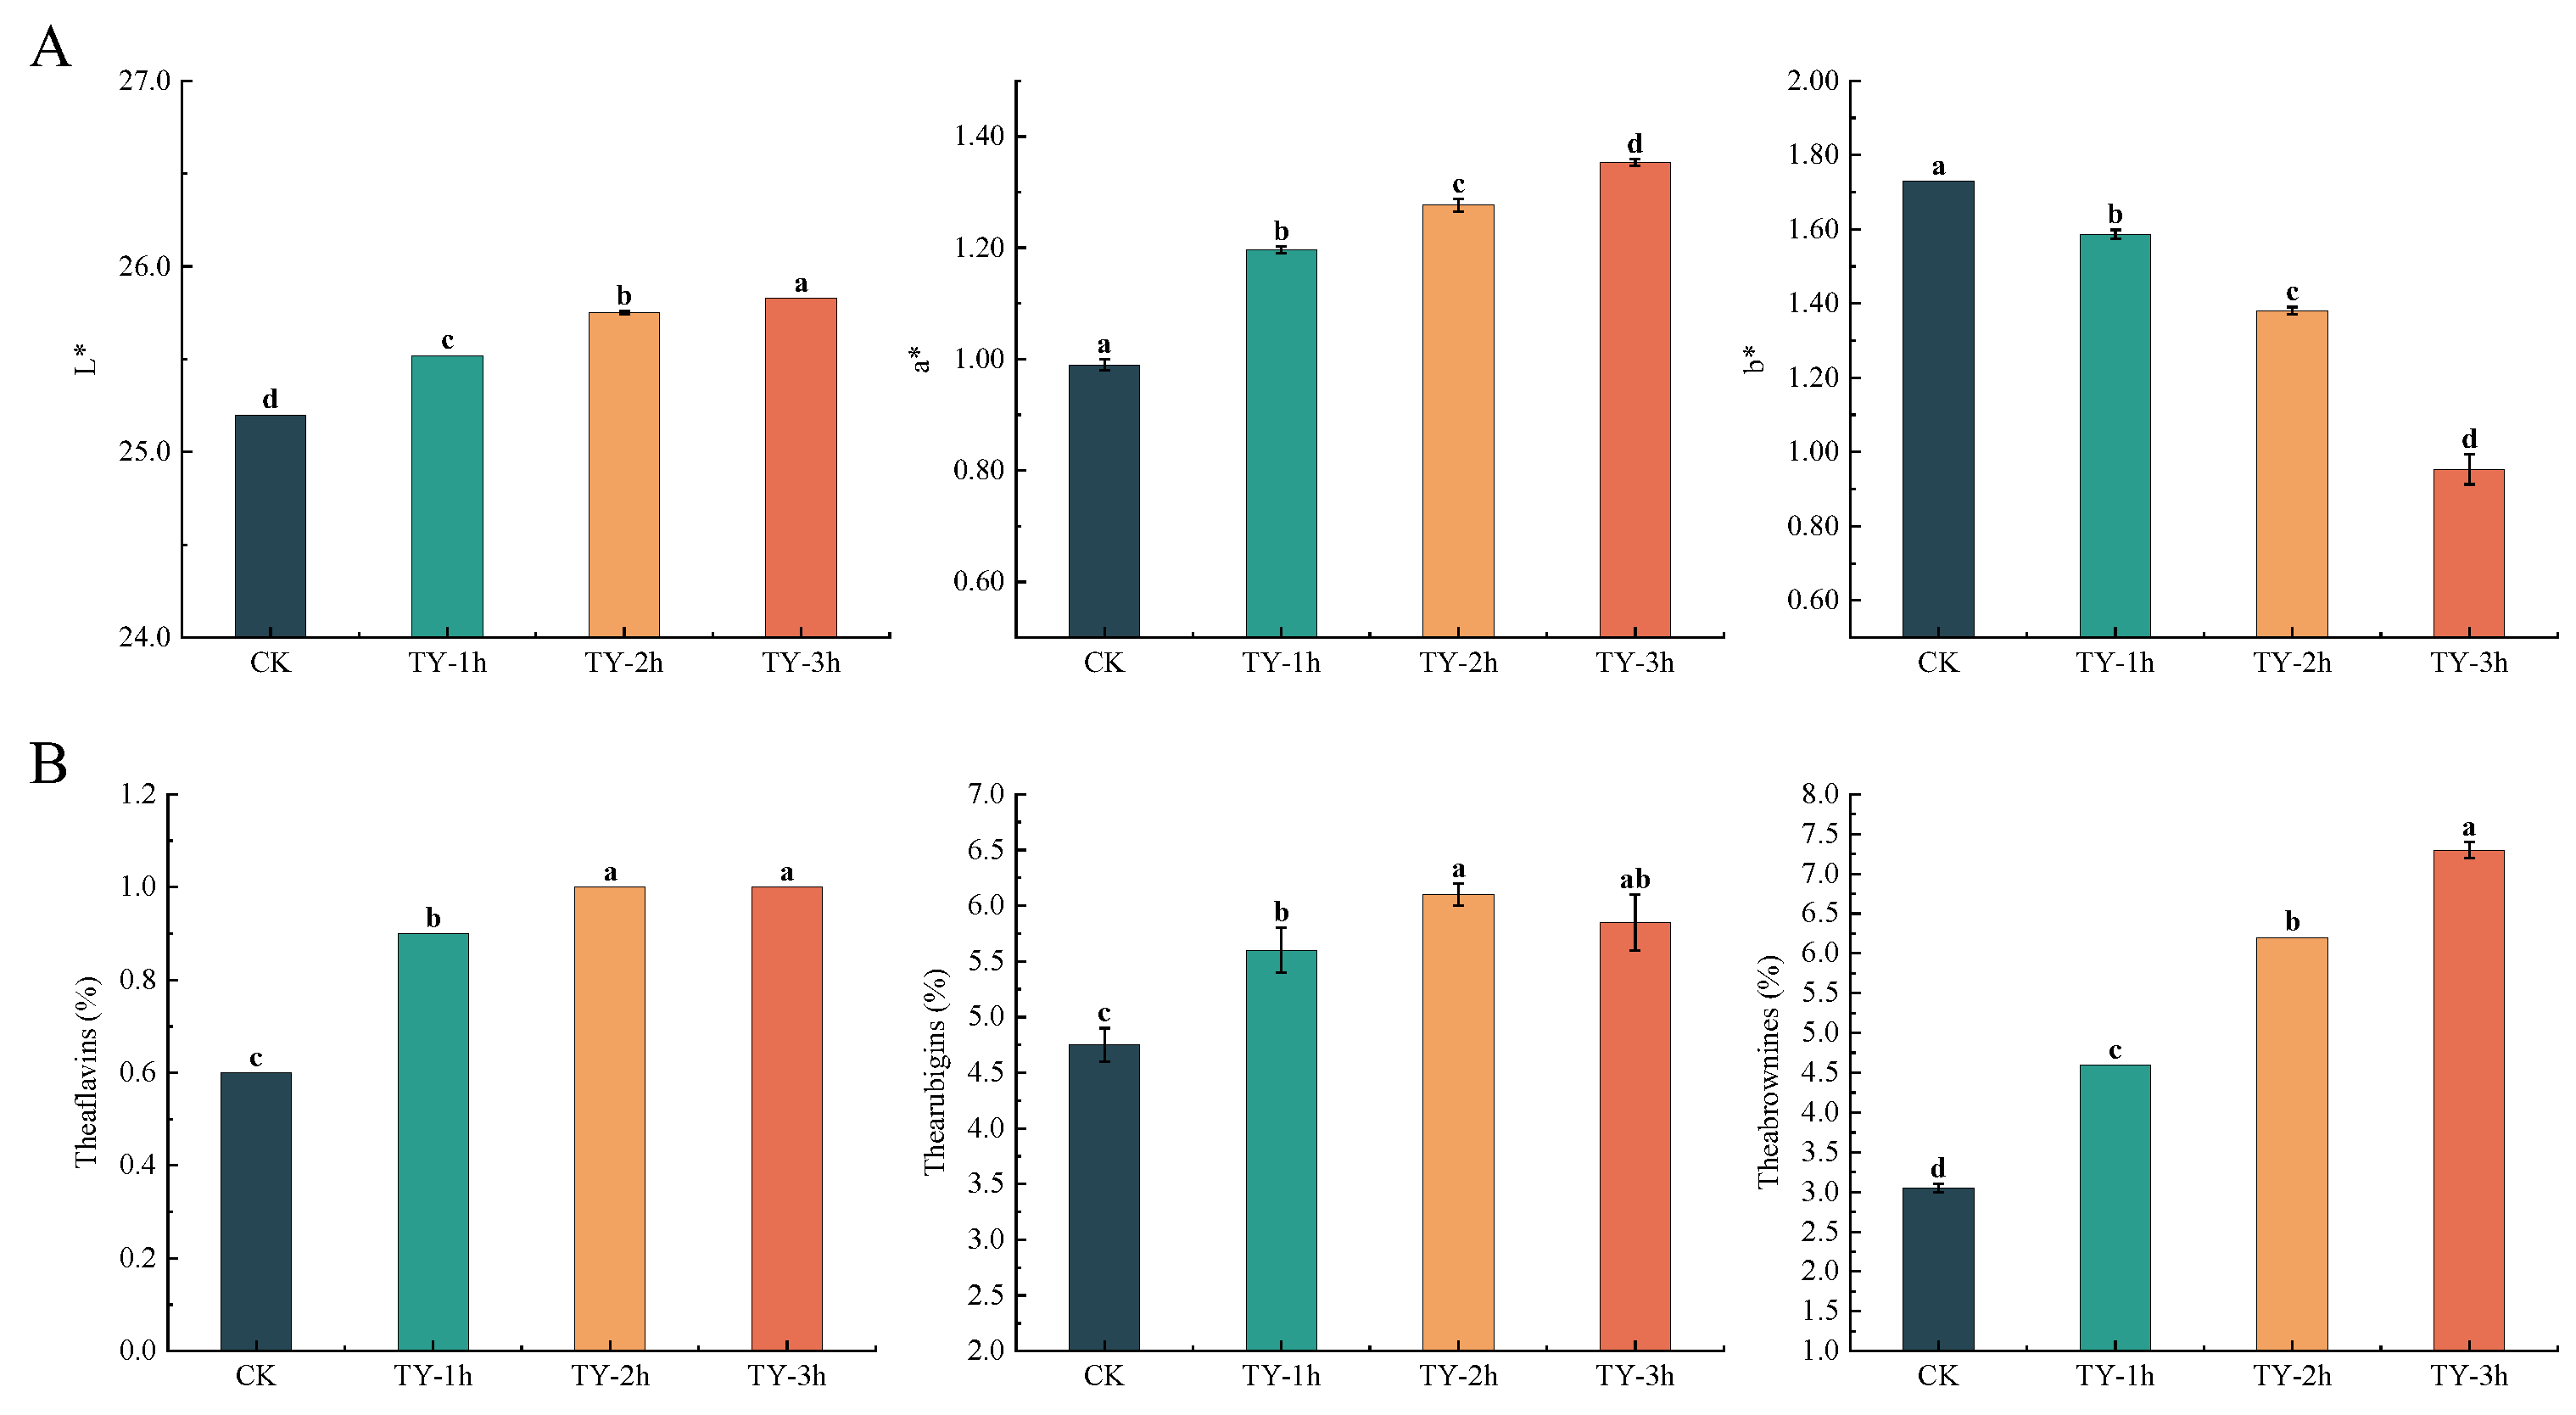
Figure 4.
Comparison of the general biochemistry components among four black teas with different treatment. Data were presented as mean±SD from at least three independent experiments. Bars with different letters are significantly different at p < 0.05.
Figure 4.
Comparison of the general biochemistry components among four black teas with different treatment. Data were presented as mean±SD from at least three independent experiments. Bars with different letters are significantly different at p < 0.05.
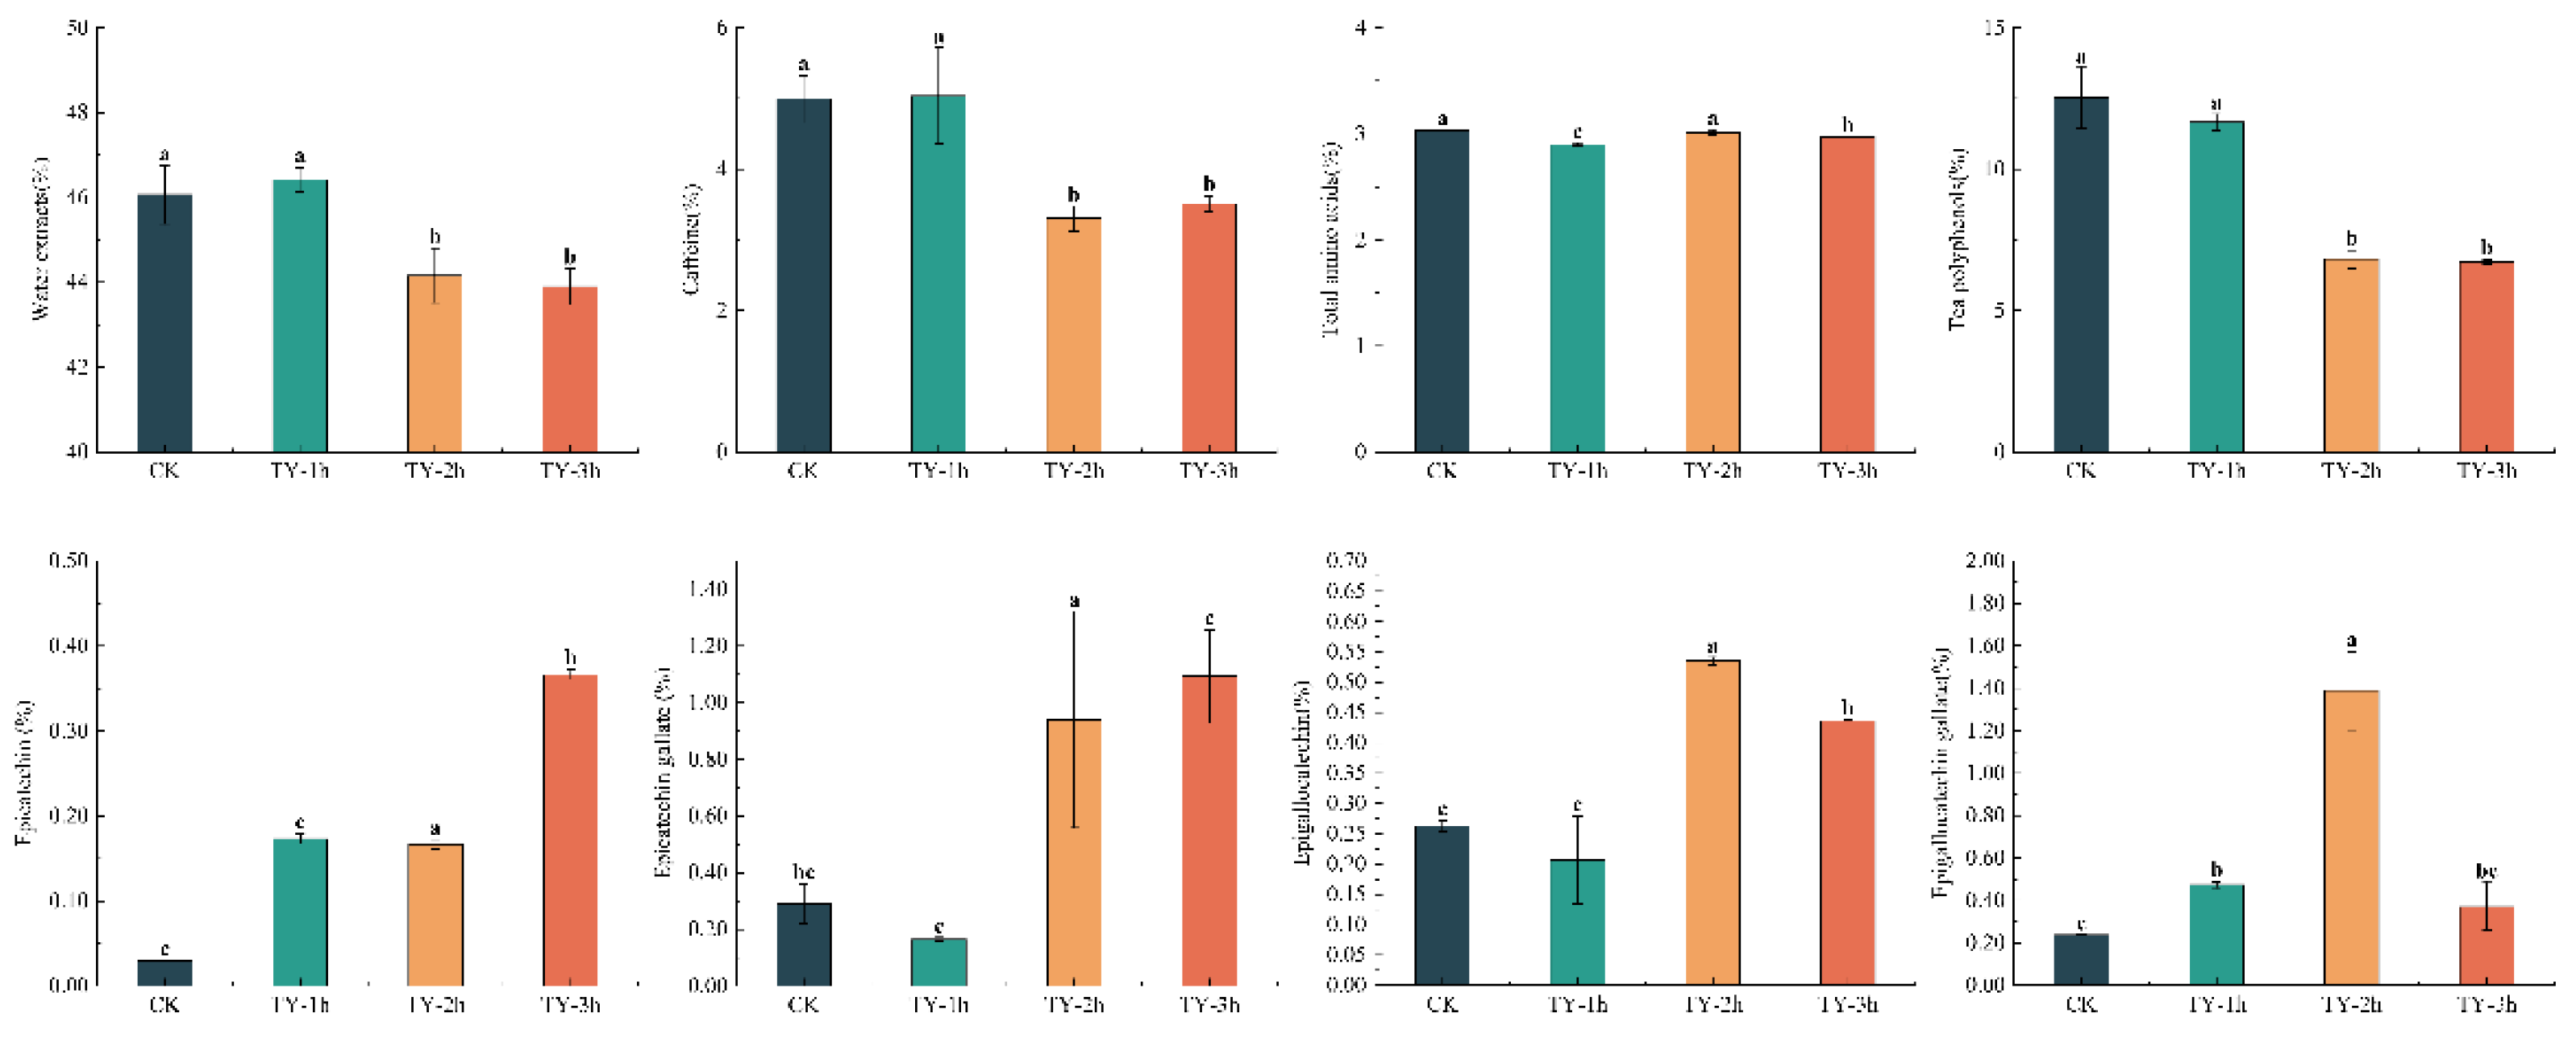
Figure 8.
Temporal modulation of aromatic signatures in different treatments. (A) Initial phase oxygenation (TY-1h); (B) Intermediate maturation stage (TY-2h); (C) Prolonged aromatic development (TY-3h).
Figure 8.
Temporal modulation of aromatic signatures in different treatments. (A) Initial phase oxygenation (TY-1h); (B) Intermediate maturation stage (TY-2h); (C) Prolonged aromatic development (TY-3h).
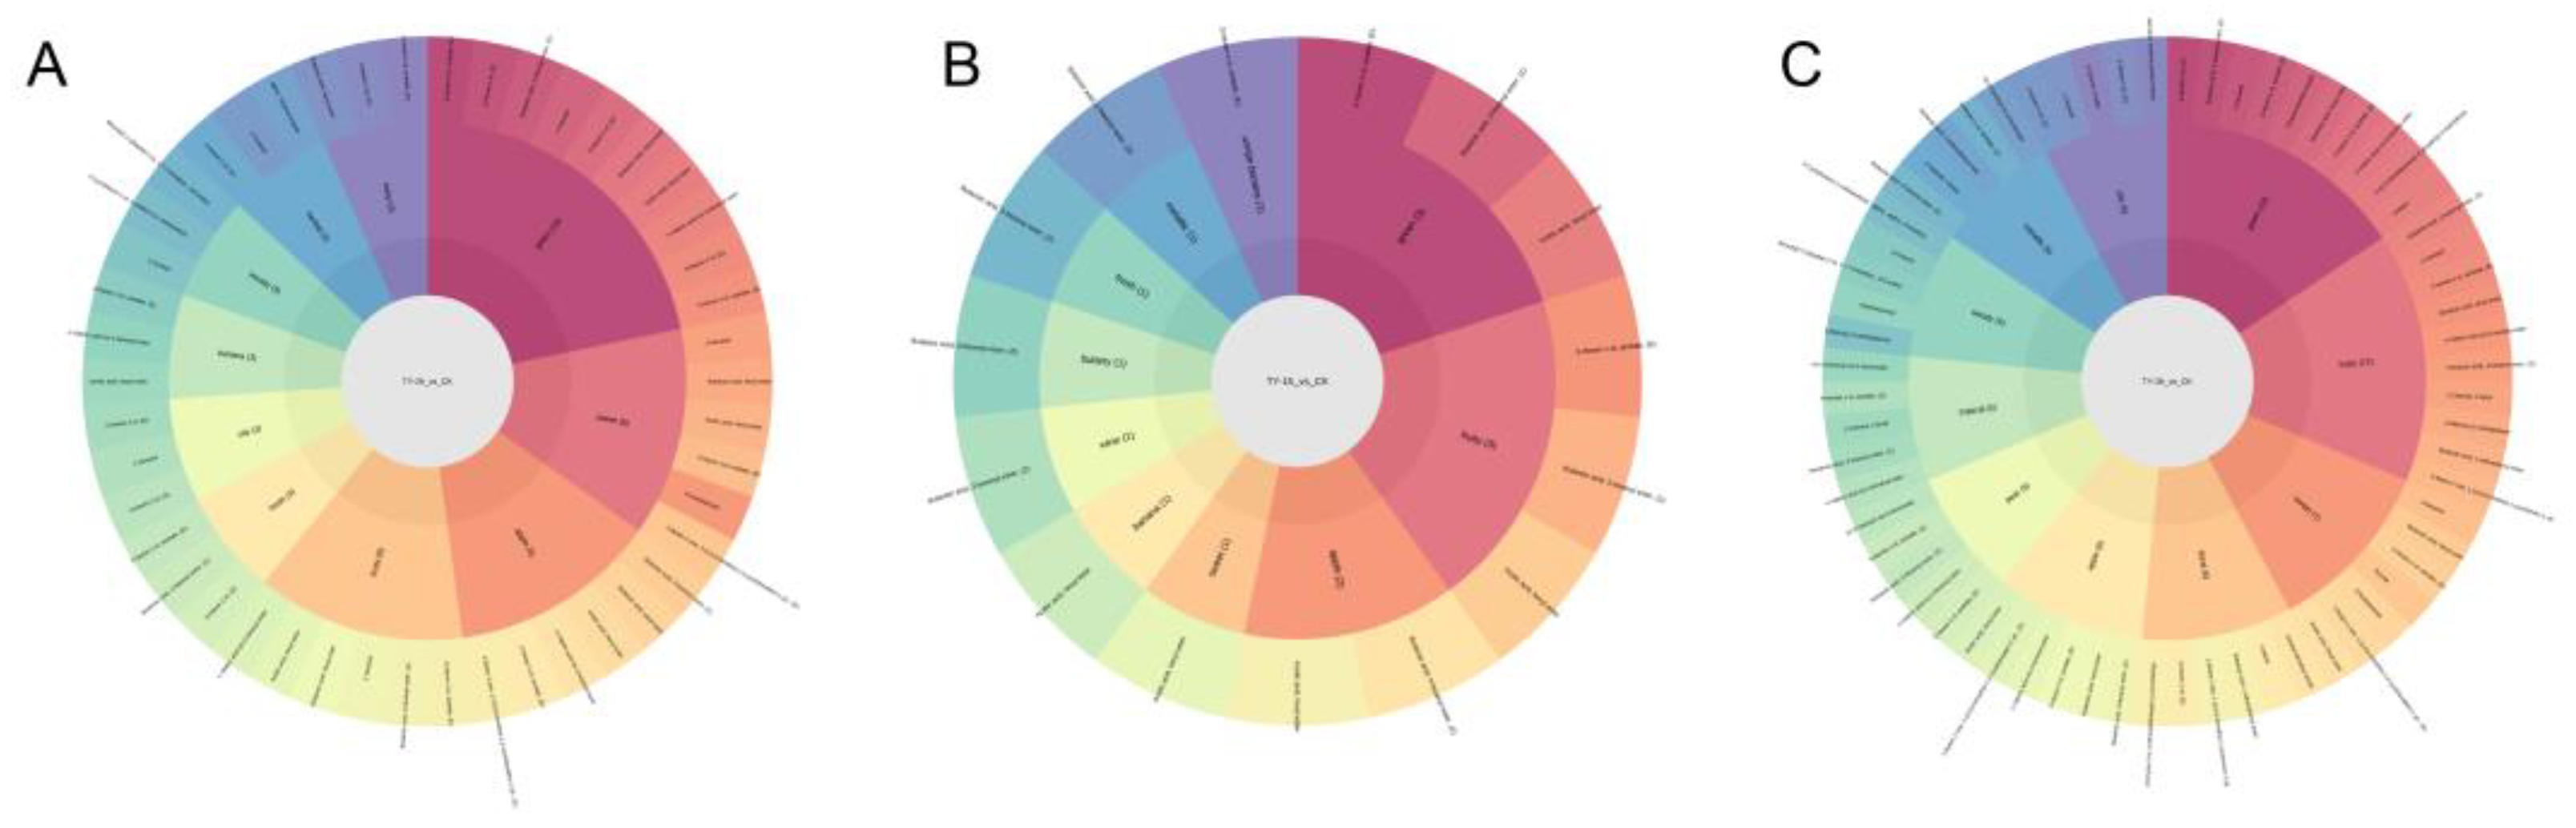
Figure 9.
K-means clustering and abundance dynamics of differentially expressed volatile metabolites. (A) Kmeans clustering 1 and (B) Clustering 2; (C) Heatmap of up regulated DEMs; (D) Heatmap of down regulated DEMs. Green and red segments denote the low and high abundance of metabolites respectively.
Disclaimer/Publisher’s Note: The statements, opinions and data contained in all publications are solely those of the individual author(s) and contributor(s) and not of MDPI and/or the editor(s). MDPI and/or the editor(s) disclaim responsibility for any injury to people or property resulting from any ideas, methods, instructions or products referred to in the content. |
© 2025 by the authors. Licensee MDPI, Basel, Switzerland. This article is an open access article distributed under the terms and conditions of the Creative Commons Attribution (CC BY) license (http://creativecommons.org/licenses/by/4.0/).
Copyright: This open access article is published under a Creative Commons CC BY 4.0 license, which permit the free download, distribution, and reuse, provided that the author and preprint are cited in any reuse.


