Submitted:
25 June 2025
Posted:
26 June 2025
You are already at the latest version
Abstract
Introduction. Acute myocardial infarction is caused by a lack of oxygen supply to the myocardium, which results in the loss of cardiomyocytes and replacement by fibrotic scar tissue, and this event is related to the development of heart failure. Regenerative medicine has emerged as an option to increase the effectiveness of treatment for severe cases of heart failure. Objectives. To evaluate the potential for myocardial regeneration after acute myocardial infarction, using biomaterial made from Mononuclear Stem Cells and Human Amniotic Membrane. Materials and Methods. For the study, 120 Wistar rats were submitted to experimental acute myocardial infarction. On the 7th day, rats with an ejection fraction of < 50% on echocardiography were randomized into four groups: 1- control; 2- stem cells; 3- amniotic membrane; 4- amniotic membrane associated with stem cells. On the 30th day, the surviving animals underwent echocardiography and were then euthanized. Results. There was a reduction in systolic and diastolic volume in the amniotic membrane associated with stem cells group. Histological analysis showed that the animals in this group had less fibrosis and a lower percentage of type I collagen. Conclusion. The animals in the stem cell-associated amniotic membrane group had reduced ventricular volumes and less fibrosis.
Keywords:
acute myocardial infarction
; heart failure
; mononuclear stem cells
; human amniotic membrane
; tissue regeneration
1. Introduction
Acute myocardial infarction (AMI) is recognized as the leading single cause of death from cardiovascular disease worldwide. Myocardial necrosis involves the death of cardiomyocytes and their subsequent replacement with fibrotic scar tissue—a process known as ventricular remodeling (Christman KL, Lee RJ, 2006; Giustino G, Redfors B, Brener SJ, Kirtane AJ, et al., 2017).
Chronic ventricular remodeling represents a maladaptive response and contributes significantly to ventricular dysfunction (Zornoff LA, Cicogna AC, Paiva SA, Spadaro J., 2002). This process alters the size and shape of the heart, leads to regions of myocardial dyskinesia or akinesia, and causes progressive deterioration of ventricular function—hallmarks that contribute to the development of heart failure (HF) (Wang JS, Shum-Tim D, Chedrawy E, Chiu RC., 2001).
Heart failure is a complex clinical syndrome that is difficult to manage. It significantly impairs quality of life and is associated with reduced life expectancy. Common symptoms include progressive dyspnea, orthopnea, paroxysmal nocturnal dyspnea, peripheral edema, and exercise intolerance (Yancy CW, Jessup M, Bozkurt B, et al., 2013; Yancy CW, Jessup M, Bozkurt B, et al., 2017).
Despite advances in medical management, HF remains a condition with high morbidity and mortality, particularly in advanced stages where treatment options are limited to mechanical circulatory support and heart transplantation (Miller L, Birks E, Guglin M, Lamba H, Frazier O., 2019). The limited effectiveness of existing therapies underscores the urgent need for novel approaches to mitigate the consequences of this disease.
One such approach involves the use of the human amniotic membrane (HAM) in infarcted hearts. HAM has gained attention due to its potential regenerative effects, not only through cellular transdifferentiation but also because of its anti-inflammatory, bacteriostatic, and antimicrobial properties (Blume GG, Machado-Júnior PAB, Paludo Bertinato G, Simeoni RB, Francisco JC, Guarita-Souza LC., 2021).
Research suggests that HAM benefits are largely mediated by the release of immunomodulatory and anti-inflammatory cytokines, such as interleukins 6 and 10 (Denison FC, Kelly RW, Calder AA, Riley SC., 1998). Additionally, tissue repair may be enhanced by the secretion of angiogenic factors, including vascular endothelial growth factor (VEGF), angiogenin, and platelet-derived growth factor (PDGF), which play key roles in tissue healing (Steed DL, Trumpower C, Duffy D, et al., 2008). However, larger translational studies are required to validate the cost-effectiveness and clinical applicability of this technique (Blume GG, Machado-Júnior PAB, et al., 2021).
Furthermore, mononuclear stem cells have emerged as a potential therapeutic tool for ischemic myocardial injury. In 2001, Orlic et al. proposed that human bone marrow cells could regenerate myocardial tissue following AMI. Since then, numerous studies have explored the use of various cell types, molecules, and genes to modulate local and systemic inflammation, reduce apoptosis, promote angiogenesis, and generate new contractile cardiomyocytes, while preserving the functional and structural integrity of the extracellular matrix.
The aim of this study was to evaluate the potential for myocardial regeneration following acute myocardial infarction, using a biomaterial composed of Mononuclear Stem Cells and Human Amniotic Membrane.
2. Materials and Methods
This study was approved by the Animal Use Ethics Committee (CEUA) of the Pontifical Catholic University of Paraná (PUCPR) under protocol number 02285. A total of 120 male Wistar rats (aged 2–3 months) were subjected to experimentally induced acute myocardial infarction (AMI) and randomly allocated into four groups. Following this procedure, 35 animals died.
On the seventh (7th) day post-infarction, the 85 surviving animals underwent transthoracic echocardiography to assess, among other parameters, left ventricular ejection fraction (LVEF). Of these, 43 rats were found eligible for the study, having an LVEF below 50%. These animals were randomly and evenly assigned to four experimental groups:
- Group I (Control): Injection of sterile saline solution (0.9% NaCl) into the infarcted myocardial region;
- Group II (Stem Cells - SC): Implantation of mononuclear stem cells into the infarcted myocardial region;
- Group III (Amniotic Membrane - AM): Implantation of human amniotic membrane into the infarcted myocardial region;
- Group IV (Stem Cells + Amniotic Membrane - SC + AM): Combined implantation of mononuclear stem cells and human amniotic membrane into the infarcted myocardial region.
On the 30th day, all surviving animals underwent a second transthoracic echocardiogram and were subsequently euthanized. Myocardial tissue samples were collected for histopathological and immunohistochemical analysis.
2.1. Human Amniotic Membrane (HAM) Acquisition
Umbilical cords were obtained from two consenting mothers (gestational age: 36–40 weeks), who signed informed consent forms according to a protocol approved by the Research Ethics Committee of Pequeno Príncipe Hospital (approval numbers 659.204/2014 and 0948-11).
HAM was collected under sterile conditions immediately after placental expulsion in the surgical setting. The samples included segments of the umbilical cord, chorionic plate, and chorionic villi. Decellularization of the membranes and umbilical cord, cell culture, and phenotypic characterization of mesenchymal stem cells were performed at the Tissue Regeneration Center of PUCPR.
All material handling was carried out under a laminar flow hood. After removal of residual tissue, HAM was immersed in phosphate-buffered solution containing chlorine dioxide (ClO₂) stabilized in 8% aqueous solution at a final concentration of 100 ppm and agitated at room temperature for 20 minutes. The solution was then replaced with phosphate-buffered saline (PBS, pH 7.2).
2.2. Decellularization of Umbilical Cords
The decellularization process followed the protocol described by Blume et al. (2021), which involves mechanical agitation and treatment with sodium dodecyl sulfate (SDS) in a BioSAFE Class II biological safety cabinet (Veco®).
Initially, the membranes were thoroughly rinsed with PBS to remove blood and debris. They were then treated with 0.01% SDS and sodium deoxycholate (SD) for 24 hours at 37°C using a mechanical shaker (Shaking Table 109 M, Nova Ética Ltd., Lemesos, Cyprus). After treatment, the membranes were stored in PBS at 4°C. To confirm successful decellularization, microscopic analyses under phase contrast and fluorescence using Hoechst staining were conducted, confirming the absence of cellular nuclei.
HAM is known to have naturally low immunogenicity, making it a biocompatible material. Additionally, it exhibits anti-inflammatory, antifibrotic, antibacterial, and site-specific angiogenic properties, which support tissue regeneration (Kafili G, et al., 2024).
2.3. Isolation of Bone Marrow Mononuclear Cells
Bone marrow was collected seven days after AMI via autologous aspiration under general anesthesia. Anesthesia was induced by intramuscular injection of 5% ketamine (Vetanarcol®, König do Brasil Ltda.) at a dose of 50 mg/kg combined with 2% xylazine hydrochloride (Rompun®, Bayer S.A., Brazil) at 10 mg/kg.
The animals were placed in lateral decubitus with the upper hind limb flexed and the lower extended. A 5 mL syringe (BD-Plastipak®) containing 0.2 mL of heparin (5,000 IU/mL) was used to aspirate approximately 1 mL of bone marrow from the posterior iliac crest of the femur using a 25×8 21 mm G1 needle (BD PrecisionGlide®). The syringes were then labeled for identification.
Mononuclear cells were isolated by density gradient centrifugation (d = 1.077 g/cm³) using Ficoll-Hypaque reagent (Sigma, St. Louis, MO).
2.4. Characterization and Viability of Stem Cells
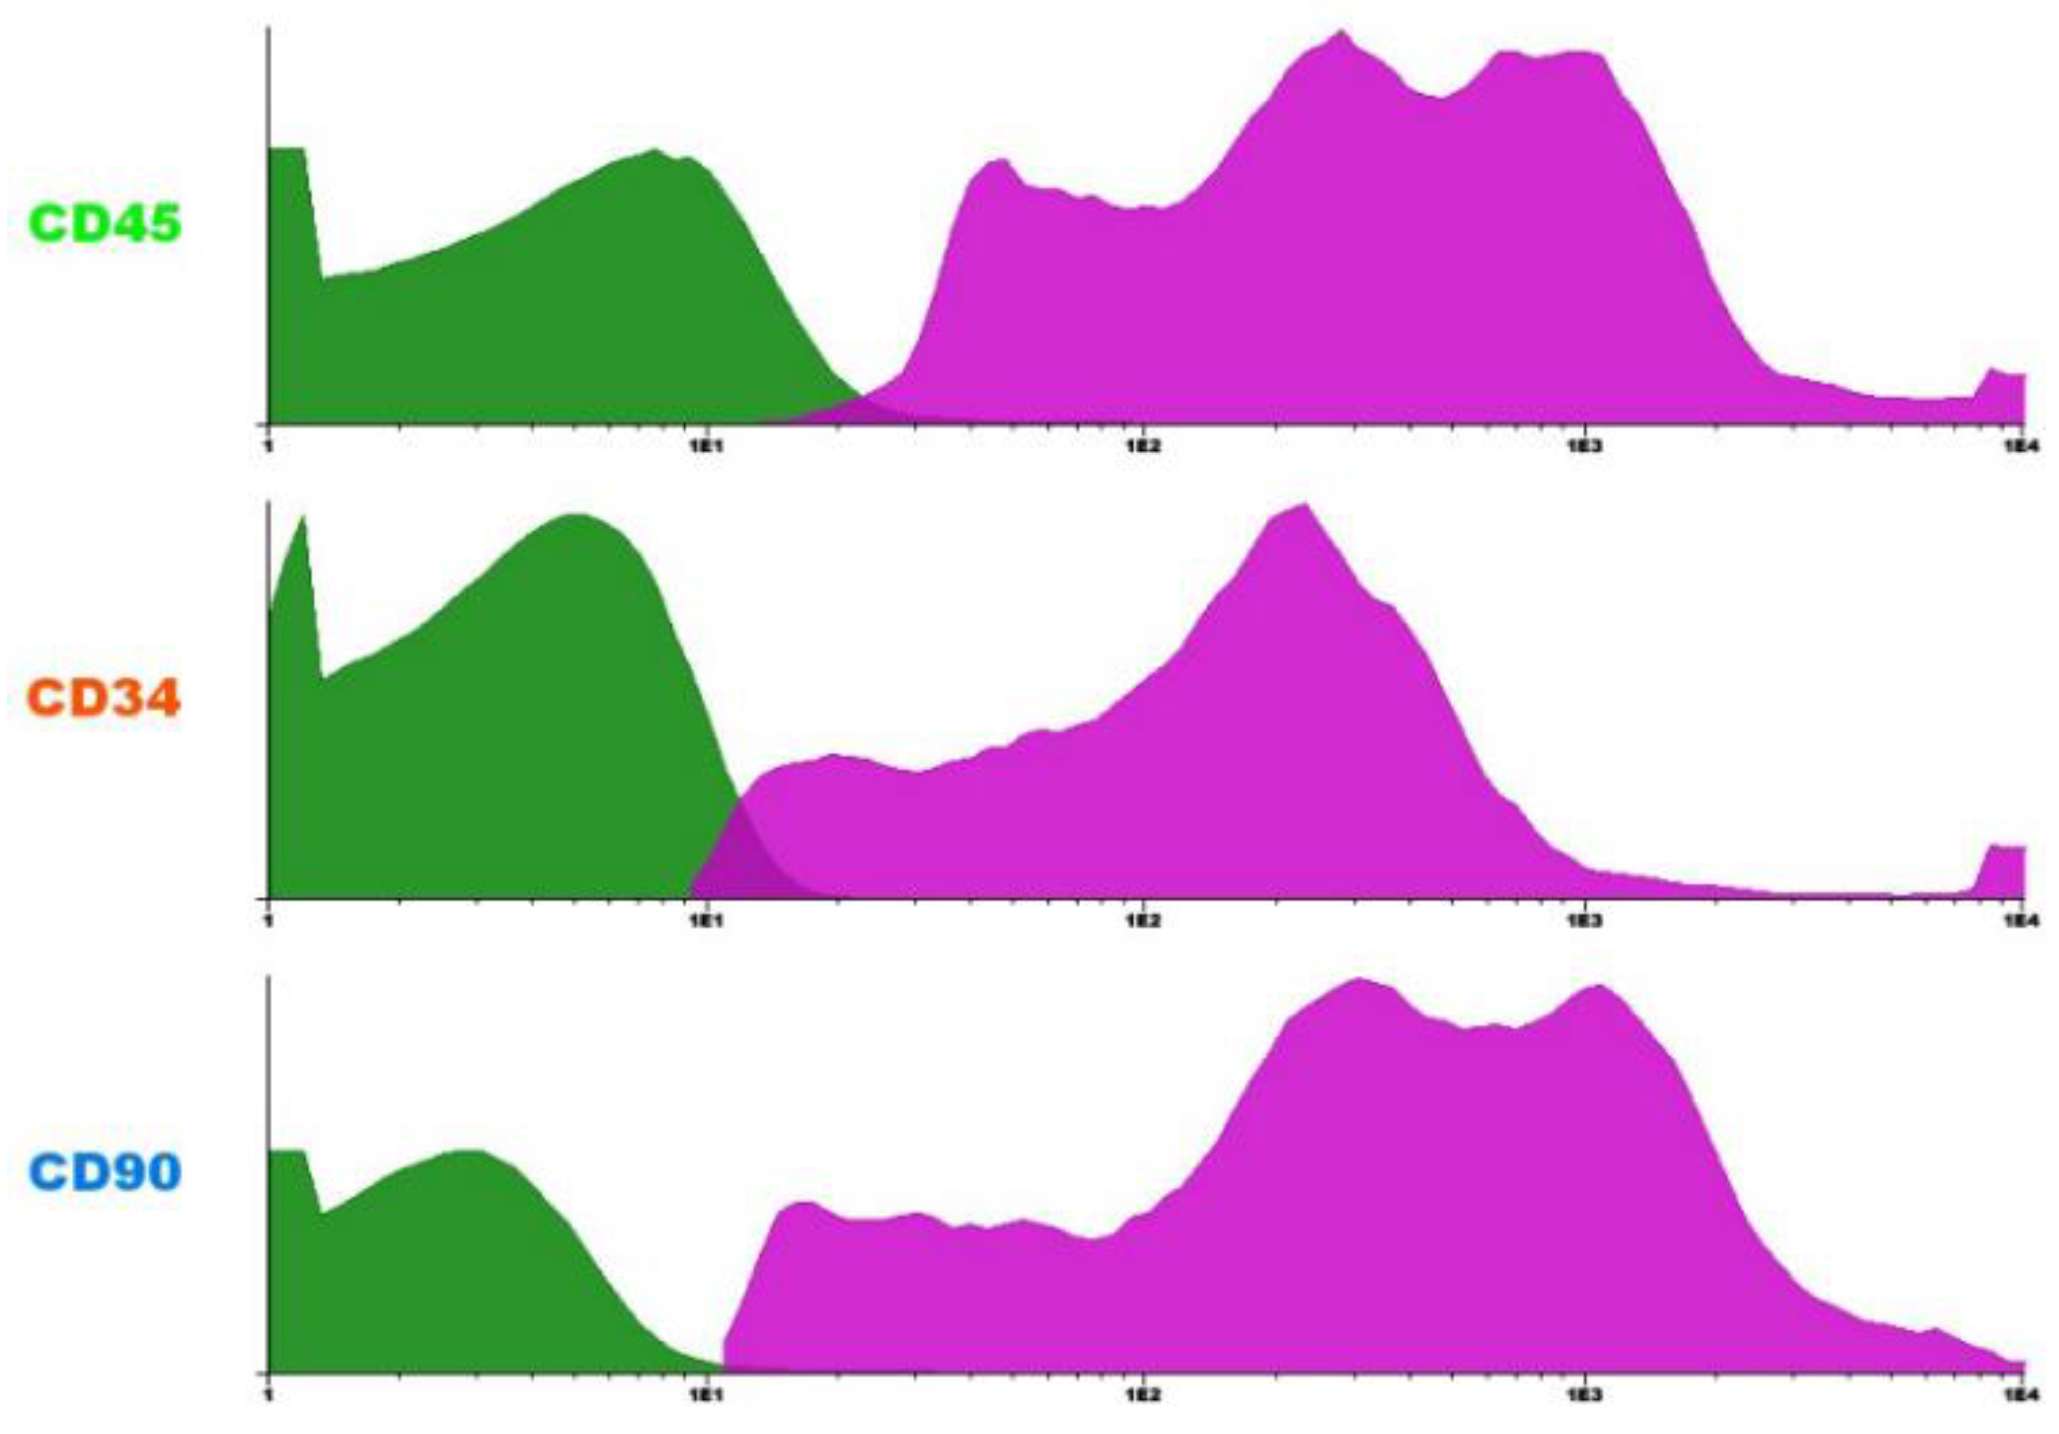
Flow cytometry analysis revealed a predominance of CD45+ cells, indicating hematopoietic origin. A CD34+ subpopulation was also observed, consistent with hematopoietic stem or progenitor cells. Additionally, the presence of CD90+ cells suggests the existence of mesenchymal stem cells in the sample. This phenotypic profile is compatible with the expected cellular heterogeneity of the bone marrow mononuclear fraction.
Figure 1.
FLOW CYTOMETRY HISTOGRAMS SHOWING THE EXPRESSION OF SURFACE MARKERS CD45, CD34, AND CD90 IN BONE MARROW MONONUCLEAR CELLS. CD45+ CELLS INDICATE HEMATOPOIETIC LINEAGE; CD34+ CELLS REPRESENT HEMATOPOIETIC STEM AND PROGENITOR CELLS; AND CD90+ CELLS SUGGEST THE PRESENCE OF MESENCHYMAL STEM CELLS. THE MAGENTA PEAKS REPRESENT MARKER-POSITIVE POPULATIONS, WHILE THE GREEN PEAKS REPRESENT MARKER-NEGATIVE POPULATIONS. SOURCE: AUTHOR'S COLLECTION (2025).
2.5. Experimental Induction of Acute Myocardial Infarction
The thoracic region was aseptically prepared using povidone-iodine, and a left lateral thoracotomy was performed through the third intercostal space (Figure 2a). After opening the pleura, the animal was connected to a mechanical ventilator (Harvard® model 683, Massachusetts, USA) using room air (21% O₂).
The pericardium was opened to allow visualization of the heart. The heart was exteriorized, and the left atrium was mobilized to expose the left coronary artery, which was ligated with a 7-0 non-absorbable polypropylene suture between the pulmonary artery outflow tract and the left atrium. Successful infarction was confirmed by the immediate discoloration of the ischemic area (Figure 2b).
The heart was repositioned, the lungs were hyperinflated, and the chest wall was closed in layers using 4-0 non-absorbable monofilament nylon sutures. After anesthesia recovery, the rats were housed in groups of four per cage and provided with standard chow and water ad libitum.
2.6. Biomaterial Transplant
The biomaterial transplant took place 7 days after the occurrence of AMI, which was confirmed by echocardiography. The procedure was carried out on 43 animals considered eligible for the study, i.e. with LVEF <50%. Anesthesia was performed with Ketamine 5% (Vetanarcolâ, Konig do Brasil Ltda.) at a dose of 50mg/kg associated with Xylazine hydrochloride 2% (Rompunâ, Bayer S.A, Brazil) at a dose of 10mg/kg, antisepsis of the chest with topical povidone-iodine, median sternotomy and the animals were reconnected to the mechanical ventilation system. Volume respirators (Harvard®, Inc., model 683 respirator, Massachusetts, USA) were used for small animals, with 21% oxygen (room air). Afterwards, asepsis was carried out with povidone-iodine.
- Control Group: three intramyocardial injections were made into the infarcted area with sterile saline solution (0.9% NaCl). After reviewing hemostasis and insufflating the lungs, the chest wall was sutured in planes with 4.0 non-absorbable monofilament mononylon suture.
- SC implantation: approximately 5 x 10⁶ bone marrow cells diluted in 100 µl of sterile saline solution (0.9% NaCl) were injected per animal, divided into three intramyocardial injections in the peri-infarct region (Figure 3a). After reviewing hemostasis and insufflating the lungs, the chest wall was sutured in planes with 4.0 non-absorbable monofilament mononylon suture.
- AM implantation: a 7 x 7 mm segment of the AM was implanted over the ischemic area. The grafts were fixed using prolene 6.0 sutures (Ethicon®, Inc., Somerville, NJ) at each end, with the aim of completely covering the infarcted area (Figure 3b). After reviewing hemostasis and insulating the lungs, the chest wall was sutured in planes with 4.0 non-absorbable monofilament mononylon suture.
- SC + AM implantation: approximately 5 x 10⁶ bone marrow cells diluted in 100 µl of sterile saline solution (0.9% NaCl) were injected per animal, divided into three intramyocardial injections in the peri-infarct region. Next, a 7 x 7 mm segment of the AM obtained by a scaffold was implanted over the ischemic area. The grafts were fixed using prolene 6.0 sutures (Ethicon®, Inc., Somerville, NJ) at each end, with the aim of completely covering the infarcted area. After reviewing hemostasis and insulating the lungs, the chest wall was sutured in planes with 4.0 non-absorbable mononylon suture.
2.7. Echocardiographic Examination
The two-dimensional echocardiographic evaluation used an ultrasound system with S12 (5-12 mHz) and 15L6 (7-15mHz) sector transducers, which allows an analysis of up to 160Hz and is specifically designed for ultrasound studies in small animals. The analysis parameters acquired included: end-systolic and end-diastolic surface area, end-systolic and end-diastolic length of the left ventricle and heart rate for calculating end-systolic (SV, ml) and end-diastolic (DV, ml) volumes and left ventricular ejection fraction (LVEF) using Simpson's method. All the measurements were carried out by the same observer (a cardiologist specializing in echocardiography), three times, and then the average of each parameter was calculated in a “blinded” manner, i.e. the examiner was unaware of the phase of the study and which group the animal belonged to.
2.8. Histological and Immunohistochemical Analysis
In order to assess possible microscopic myocardial alterations, after euthanasia and collection of the material for histological preparation, the hearts were analyzed using Gomori trichrome (Figure 4) and Sirius-red (Figure 5) stains. Items such as the general appearance of the tissue, delimitations, signs of fibrosis in the infarcted region and the amount of type I and III collagen were assessed. In addition, the following markers were used for immunohistochemical analysis: alpha-actin, sarcomeric actin, desmin, CD31 and CD68. The data for the histological and immunohistochemical analysis was obtained after direct observation, via an optical microscope, of cross-sections of myocardial tissue. Several images of the slides were captured, with 10 chosen as expected to be analyzed by the ImagePro Plus software. These data were recorded on digital photos and later analyzed using ImagePro Plus software. The analysis was carried out by 5 independent researchers - maintaining scientific validity).
2.9. Euthanasia
All the animals were euthanized with intravenous sodium pentobarbital at a dose of 200 to 250 mg/kg. With a view to animal welfare, if there were clinical manifestations of the disease such as: signs of respiratory depression, abnormal breathing, wheezing and nasal secretion; acute lung edema; factors associated with cardiac pump failure such as decreased peripheral circulation, blue and cold extremities; jaundice and secretions in the eyes; the animals would be euthanized before the period stipulated by the research.
2.10. Statistical Analysis
The results of the EF (%), SV (ml) and DV (ml) variables were described by mean, standard deviation, median, minimum and maximum. The analysis of variance (ANOVA) model with one factor was used to compare the groups in terms of the results of the assessment on day 7 and the differences between the assessments on days 7 and 30 in terms of the variables ejection fraction, systolic volume and diastolic volume. The groups were compared with regard to the results on day 30 using the one-factor analysis of covariance (ANCOVA) model, including the results of the 7-day assessment as a covariate. The Bonferroni post-hoc test was used for multiple comparisons after ANOVA and ANCOVA. Student's t-test for paired samples was used to compare the results on day 7 with the results on day 30 within each group. The Kruskal-Wallis non-parametric test was used to compare the groups in terms of the percentage of collagen (type I and type III) and Gomori trichrome. Dunn's test with Bonferroni adjustment was used for multiple comparisons between groups. The normality of the variables was assessed using the Kolmogorov-Smirnov test. Values of p<0.05 indicated statistical significance. The data was analyzed using the computer program IBM SPSS Statistics v.20.0. Armonk, NY: IBM Corp.
The post-hoc analyses (i.e., pairwise comparisons performed after a global test such as ANOVA or Kruskal-Wallis indicates a significant difference) were conducted with multiple comparisons corrections — Bonferroni adjustment following ANOVA, and Dunn's test with Bonferroni correction following Kruskal-Wallis. These corrections multiply the unadjusted p-values by the number of pairwise comparisons, which can result in adjusted p-values exceeding 1. In such cases, it is standard practice to report p = 1, as this is the maximum possible value for a p-value.
For example, when comparing 4 groups, there are 6 possible pairwise comparisons (group 1 vs 2, 1 vs 3, 1 vs 4, 2 vs 3, 2 vs 4, and 3 vs 4). If the unadjusted p-value for a given comparison is 0.007, the Bonferroni-adjusted p-value would be 0.007 × 6 = 0.042, which remains statistically significant at the 0.05 level. Conversely, if the unadjusted p-value is 0.25, the adjusted p-value becomes 0.25 × 6 = 1.5. Since p-values cannot exceed 1, this is conventionally reported as p = 1. We have reviewed the calculations and confirm that the p-values reported as 1 are accurate and result directly from the correction procedures.
3. Results
3.1. Functional Analysis
The analysis presented below was based on data from 43 rats with EF<50%, randomized to one of 4 groups according to treatment: Control group (n=12), CT group (n=9), AM group (n=10) and AM + S group (n=12). All the animals were assessed at two points in time: day 7 and day 30.
Table 1 shows the homogeneity of the data when comparing the groups on day 7 of the study, as no significant differences were found for the variables EF (%; p=0.349), SV (ml; p=0.349) and DV (ml; p=0.533). For the results obtained on the 30th day of the study, the analysis of EF (%) revealed no statistical difference when comparing the groups (p=0.072). Statistical differences were found for SV (ml) and DV (ml), with p=0.023 and p=0.05, respectively.
In the analysis between day 7 and day 30 of the study, there was a reduction in mean EF values (%) in the Control [(37.3±5.6 → 36.5±5.7); p=0.656] and SC [(38.9±6.5 → 33.3±7.1); p=0.096] and an increase in the AM [(35.1±5.9 → 37.8±9.3; p=0.126] and AM+SC [(37.9±6 → 42.2±9); p=0.258] groups, but there was no statistical significance for any of the values described.
With regard to the variable Systolic Volume (ml), there was an increase in the mean values in the Control [(0.159±0.046 → 0.194±0.07); p=0.101] and AM [(0.143±0.067 → 0.194±0.071; p=0.067), as well as a reduction in the TC [(0.191±0.066 → 0.156±0.075); p=0.348] and AM+SC [(0.177±0.067 → 0.118±0.068); p=0.034] groups, with significant values found only for the AM+SC group (p=0.034).
For the DV (ml) variable, there was an increase in the mean values between day 7 and 30 in the Control [(0.257±0.065 → 0.301±0.079); p=0.086] and AM [(0.257±0.142 → 0.313±0.077); p=0.228], as well as a reduction in the SC [(0.315±0.098 → 0,229±0.105); p=0.161] and AM+SC [(0.287±0.096 → 0.197±0.084); p=0.013] groups, with significant values found only for the AM+SC group (p=0.013).
Analysis of the SV (ml) and DV (ml) variables on the 30th day of the study found significant differences between the study groups, with a p-value of 0.023 and 0.005, respectively. The groups were therefore compared two by two for these variables, as shown in Table 2.
According to the results in Table 2, significant differences were found when comparing the Control x (AM+SC) groups for the DV (ml; p= 0.031) and SV (ml; p=0.05) variables. In addition, there was also statistical significance when comparing the AM x (AM+SC) groups for the DV (ml; p=0.019) variables.
3.2. Histological Analysis
Table 3 and Figure 6 show the results of the comparison between the study groups for the variables Gomori trichrome (µm²), type I collagen (%) and type III collagen (%).
According to Table 3, the values obtained from the Gomori Trichrome analysis indicate that the mean infarct areas for the Control (15585072µm² ± 7997958) and SC (12810354µm² ± 2452308) groups were higher than the means for the AM (8890165 µm² ± 5613027) and AM+SC (8961009µm² ± 5283955) groups, and statistical significance was found for this analysis (p=0.033).
With regard to the results obtained from the Sirius-red analysis, it can be inferred that the mean percentages of type I collagen for the Control (91% ± 9.9) and SC (74.6% ± 23.9) groups were higher than the values for the AM (66.7% ± 25.7) and AM+SC (63.1% ± 32.3) groups. A different pattern was found with the type III collagen averages (%), as the values found for the AM (33.3% ± 25.7) and AM+SC (36.9% ± 32.3) groups were higher compared to the Control and SC groups. There was statistical significance for the values obtained for both the percentages of type I collagen (p=0.034) and type III collagen (p=0.034).
For the groups analyzed, significant differences were found in the analysis of the variables Gomori trichrome (µm²; p=0.033), and type I collagen (%; p=0.034) and type III collagen (%; p=0.034). The groups were then compared two by two. Table 4 shows the p-values for these comparisons.
The results in Table 4 indicate that significant differences were found when comparing the Control and (AM+SC) groups for the variables Gomori trichrome (µm²; p= 0.05), type I collagen (%, p=0.05) and type III collagen (%, p=0.05).
3.3. Immunohistochemical Analysis
The markers used for immunohistochemical analysis of the myocardial slides were: SMA (α-actin), CD31, CD68, desmin and sarcomeric actin. Table 5 and Figure 7 show the results obtained from the analysis of these markers.
- α-ACTIN (SMA)
Table 5 and Figure 7 show the results obtained from the analysis of the SMA(%) variable. The mean values obtained for the (AM+SC) group (13.32% ± 10.21) were higher than those for the Control (1.97% ± 1.61), SC (2.38% ± 2.2) and AM (3.49% ± 2.19) groups, and statistical significance was found for the results (p<0.001).
Significant differences were found between the groups for the SMA variable (%) (p<0.001). The study groups were therefore compared two by two. Table 6 shows that the comparison:
Table 6 shows that there was a significant difference when comparing the SMA variable (%) for the following groups: Control x (AM+SC) [p=0.001], SC x (AM+SC) [p=0.003] and AM x (AM+SC) [p=0.066].
- CD31
Analysis of the results obtained for the CD31 variable (%) in Table 5 and Figure 7 shows that the median values obtained for the Control (0.44±0.43) and AM+SC (0.55±0.67) groups were higher than those found for the AM (0.32±0.25) and SC (0.24±0.23) groups, where there was no statistical significance to the results obtained (p=0.743).
- CD68
Analysis of CD68 indicated that the mean values obtained for the AM+SC group (1.09 ± 0.89) were higher than those found for the Control (0.37 ± 0.40), SC (0.94 ± 1.30) and AM (0.36 ± 0.66) groups, where there was no statistical significance for the values found (p=0.061), as shown in Table 5 and Figure 7.
- DESMIN
Table 5 and Figure 7 show the values obtained from the analysis of the desmin marker (%), which indicate that the average obtained for the AM group (2.37 ± 3.71) was higher than that obtained in the AM+SC (0.91 ± 1.51), Control (0.80 ± 0.71) and SC (1.77 ± 2.83) groups, where there was no statistical significance for the values found (p=0.264).
- SARCOMERIC ACTIN
The analysis of sarcomeric actin indicated that the mean values obtained for the SC group (4.02 ± 5.43) were higher than those of the AM (3.55 ± 2.30), Control (2.58 ± 2.02) and AM+SC (3.28 ± 3.15) groups, in which there was no statistical significance for the values found (p=0.755), as shown in Table 5 and Figure 7.
4. Discussion
This study aimed to carry out a functional and histological analysis of the implantation of mononuclear stem cells and human amniotic membrane after acute myocardial infarction with left ventricular dysfunction.
With regard to the functional analysis, the results obtained on the 30th day of the study for the EF variable (%) showed no statistical significance when comparing the groups (p 0.072). Statistical differences were found for the SV (ml) and DV (ml) variables, with p=0.023 and p=0.05, respectively (Table 1).
In the analysis between day 7 and day 30 of the study, there was a reduction in mean EF values (%) in the Control [(37.3±5.6 → 36.5±5.7); p=0.656] and SC [(38.9±6.5 →33.3±7.1); p=0.096] groups and an increase in the AM [(35.1±5.9 → 37.8±9.3; p=0.126] and AM+SC [(37.9±6 → 42.2±9); p=0.258] groups.
With regard to the variable Systolic Volume (ml), there was an increase in the mean values in the Control [(0.159±0.046 → 0.194±0.07); p=0.101] and AM [(0.143±0.067 → 0.194±0.071; p=0.067), as well as a reduction in the TC [(0.191±0.066 → 0.156±0.075); p=0.348] and AM+SC [(0.177±0.067 → 0.118±0.068); p=0.034] groups, with significant values found only for the AM+SC group (p=0.034).
The analysis of the SV variable (ml) on day 30 found significant differences between the study groups, with p-values of 0.023. The groups were then compared two by two for this variable. Significant differences were found when comparing the Control and (AM+SC) groups, with a p-value of 0.005.
For the DV (ml) variable, there was an increase in the mean values between day 7 and 30 in the Control [(0.257±0.065 → 0.301±0.079); p=0.086] and AM [(0.257±0.142 →0.313±0.077); p=0.228], as well as a reduction in the TC [(0.315±0.098 0,229±0.105); p=0.161] and AM+SC [(0.287±0.096 → 0.197±0.084); p=0.013] groups, with significant values found only for the AM+SC group (p=0.013). In the analysis of the DV (ml) variable on day 30, significant differences were found between the study groups, with a p-value of 0.005. The groups were therefore compared two by two for these variables. Significant differences were found when comparing the Control x (AM+SC) and AM x (AM+SC) groups, with p-values = 0.031 and 0.019, respectively.
According to the results in Table 1, significant differences were found when comparing the Control x (AM+SC) groups for the DV (ml; p= 0.031) and SV (ml; p=0.05) variables. In addition, there was also statistical significance when comparing the AM x (AM+SC) groups for the DV (ml; p=0.019) variables. However, the result obtained for SV (ml) may have been interfered with by the increase in DV (ml), since the analysis of end-systolic volume is directly related to end-diastolic volume. As a result, the reduction in the mean SV value obtained in the AM+SC and SC groups on the 30th day of the study may have been influenced by the reduced mean DV value for these groups. This was also observed in the study by Blume et al, which analyzed the use of human amniotic membrane and isolated stem cells after myocardial ischemia, in which there was a reduction in the mean value of both SV and DV in the AM and SC groups (Blume, GG, Machado-Junior, PAB, Simeoni, BR.; et al. 2021).
Histological analysis of the myocardial tissue slides was carried out using Gomori trichrome and Sirius-red stains, which made it possible to measure the extent of myocardial fibrosis and the specification of the collagen present in these areas, respectively. This analysis made it possible to correlate the histological and functional results, since the fibrosis area can be delimited by collagen expression and is associated with deterioration in ventricular function. This is because after myocardial necrosis occurs, fibrosis is established in areas previously occupied by cardiomyocytes (Weber KT, Sun Y, Guntaka RV, et al. 1999).
The results obtained from the analysis of the Gomori trichrome variable were statistically significant (p = 0.033). It is therefore possible to state that the Control and SC groups showed greater extensions of fibrosis compared to the AM and AM+SC groups, according to Table 3. In addition, the analysis of the groups two by two indicated that statistical significance occurred when comparing the Control and AM+SC groups (p = 0.05), as shown in Table 4. As a result, it can be inferred that the use of the biomaterial consisting of amniotic membrane and stem cells led to a reduction in the scar area compared to the Control group, as observed in previous studies (Blume, GG, Machado-Junior, PAB, Simeoni, BR. et al. 2021; Lee SH, Wolf PL, Escudero R, et al. 2000).
As for the analysis of type I and type III collagen (%), the results were statistically significant, with a p-value of 0.34 for both. The AM (66.7%±25.7) and AM+SC groups had lower percentages of type I collagen - 66.7%±25.7 and 63.1%±32.3, respectively - compared to the Control (91.0%±9.9) and SC (74.6%±23.9) groups.
The data obtained from type III collagen already indicates an inverse result, with the AM (33.3%±25.7) and AM+SC (36.9%±32.3) groups showing the highest percentages compared to the Control (9%±9.9) and SC (25.4%±23.9) groups, as shown in Table 3. In the two-by-two comparison of type I and III collagen variables, statistical significance was found when comparing the Control and AM+SC groups, with a p-value of 0.05 for both variables, as shown in Table 4.
Type III collagen is the immature form of type I collagen and has greater elasticity properties (Jugdutt, B.1987; Yang, Y.; Ma, Y.; et al. 2008). Previous studies have shown that higher levels of type III collagen are related to better cardiac performance in patients with diastolic dysfunction (Soufen, H.N.; Salemi, V.M.C.; et al. 2008). The difference in the proportion of type I and III collagen in the groups in the areas of infarction is extremely important, as it may indicate different levels of tissue repair. Thus, the higher percentage of type III collagen and lower percentage of type I collagen in the AM and AM+SC groups may indicate higher levels of tissue fibrosis reversal than in the Control and SC groups.
Based on the results obtained from the histological analysis, it can be said that the AM+SC group showed a higher level of tissue repair compared to the Control group. This result indicates greater efficiency of the biomaterial constructed from stem cells and amniotic membrane in reversing tissue fibrosis.
The following markers were used for immunohistochemical analysis: sarcomeric actin, CD31, CD68, desmin and α-actin. α-actin identifies the expression of vascular smooth muscle cells and endothelial cells, and is thus involved in the formation of new vessels (Wu, K.H., Zhou, B., et al. 2007; Wu, K.H., Zhou, B., et al. 2006; Martinez, E.C., Vu, D.T., et al. 2013). Similarly, the CD31 marker is related to neoangiogenesis, being highly expressed in endothelial cells, as it constitutes the inter-cellular junction of these cells (Muller WA, Weigl SA, et al. 1993). The expression detected by CD68 reflects the infiltration of macrophages into tissues, generally related to the inflammatory response and tissue remodeling processes (Potapov, E., Wassilew, K., et al. 2013). Sarcomeric actin and desmin are related to the striated muscle present in the sample. Desmin is considered the main component of the intermediate filament protein expressed in striated and smooth muscle (Brodehl A, Gaertner-Rommel A, et al. 2018).
In this analysis, only the α-actin marker showed statistically significant results (p<0.001). Thus, the AM and AM+SC groups showed the highest percentages of marker expression compared to the Control and SC groups, as shown in Table 5. When comparing the groups two by two for this variable, a statistically significant result was obtained when comparing Control x AM+SC (p=0.001) and SC x AM+SC (p=0.003), according to Table 6. As a result, it can be said that both in comparison with the Control group and the SC group, there is a higher percentage of myofibroblasts and smooth muscle tissue in the AM+SC group.
Like the α-actin marker, CD31 is also related to the formation of new blood vessels. In the analysis of the results, the results obtained were not statistically significant (p=0.743), but they did point to a greater predominance of this marker in the AM+SC group compared to the other Control, SC and AM groups, as shown in Table 5.
These findings may be related to the potential induction of angiogenesis, myogenesis and neovascularization by the growth factors present in the constructed biomaterial. In turn, these may result in increased tissue repair capacity and therefore improved tissue perfusion, which would be extremely important for the recovery of cardiac function (Ziegler M, Wang X, et al. 2017; Machado-Júnior PAB, Blume GG et al. 2020; Guarita-Souza LC, Carvalho KA, et al. 2006). In relation to the markers of quantitative expression of striated muscle, desmin and sarcomeric actin, there were similar results between the study groups, with no statistical significance in the data for both variables. In the case of desmin, the AM and SC groups had the highest percentages of the marker compared to the Control and AM+SC groups, with a p-value of 0.264 (Table 6). In the case of sarcomeric actin, there was greater detection of this marker in the SC and AM groups compared to the AM+SC and Control groups, with a p-value of 0.755.
In addition, this study analyzed macrophage infiltration in myocardial tissue samples through the expression of CD68. In the study by Ryabov et al, a higher percentage of macrophages was detected in the regenerative phase after myocardial ischemia (Ryabov V, Gombozhapova A, et al. 2018). Thus, in our study, the analysis of CD68 indicated that the mean values obtained for the AM+SC group were higher than those found for the Control, SC and AM groups, in which there was no statistical significance for the values found (p=0.061), as shown in TABLE 5.
Pro-inflammatory factors and activated cytokines play crucial roles in the post-myocardial infarction inflammatory response. Previous evidence indicates that macrophages, marked by the expression of CD68, accumulate in injured myocardial tissue, where they actively act in the repair process. This cellular mobilization can significantly influence cardiac remodelling, contributing to the structural and functional recovery of the heart (Steffens S, Van Linthout S, et al. 2020).
Although our results were not statistically significant, the trend towards greater CD68 expression in the AM+SC group may suggest a more intense mobilization of macrophages in this group. This response may reflect a more active acute or controlled inflammatory process, compatible with an early-stage regenerative environment. This immune activation may be associated with the combined action of the extracellular matrix of the amniotic membrane and the paracrine effects of the stem cells, potentiating the tissue response to the injury.
5. Conclusion
It is suggested that the use of the biomaterial constructed from stem cells and human amniotic membrane showed better cardiac performance, due to the reduction in end-diastolic and end-systolic volumes, which shows a trend towards reversal of tissue remodeling, evidenced by the lower extent of fibrosis, as well as the lower percentage of mature collagen. In addition, the use of this biomaterial may have led to higher levels of neoangiogenesis, demonstrated by the increased expression of alpha-actin, which probably contributed to improved cardiac perfusion and reversal of tissue remodeling.
Acknowledgments
The authors would like to thank the Pontifical Catholic University of Paraná, National Council for Scientific and Technological Development (CNPq) and all the members involved in the study. In order to carry out the research, financial support was received by the Pontifical Catholic University of Paraná from the authors.
Disclosure statement:
The authors report there are no competing interests to declare.
References
- Christman KL, Lee RJ. Biomaterials for the treatment of myocardial infarction. J Am Coll Cardiol. 2006;48(5):907-13. [CrossRef]
- Giustino G, Redfors B, Brener SJ, Kirtane AJ, et al. Correlates and prognostic impact of new-onset heart failure after ST-segment elevation myocardial infarction treated with primary percutaneous coronary intervention: insights from the INFUSE-AMI trial. Eur Heart J Acute Cardiovasc Care. 2018 Jun;7(4):339-347. Epub 2017 Aug 22. [CrossRef] [PubMed]
- Zornoff LA, Cicogna AC, Paiva SA, Spadaro J. Remodelamento e seu impacto na progressão da disfunção ventricular. Rev Soc Cardiol Estado de São Paulo. 2002;12(3):371-8. [CrossRef]
- Wang JS, Shum-Tim D, Chedrawy E, Chiu RC. The coronary delivery of marrow stromal cells for myocardial regeneration: Pathophysiologic and therapeutic implications. J Thorac Cardiovasc Surg 2001; 122(4): 699-705. [CrossRef]
- Yancy CW, Jessup M, Bozkurt B, al. 2013 ACCF/AHA guideline for the management of heart failure: a report of the American College of Cardiology Foundation/American Heart Association Task Force on Practice Guidelines. J Am Coll Cardiol. 2013;62:e147– e239. [CrossRef]
- Yancy CW, Jessup M, Bozkurt B, et al. 2017 ACC/AHA/HFSA focused update of the 2013 ACCF/AHA Guideline for the Management of Heart Failure: a report of the American College of Cardiology/American Heart Association Task Force on Clinical Practice Guidelines and the Heart Failure Society of America. Circulation. 2017;136(6):e137-e161. [CrossRef]
- Miller, L.; Birks, E.; Guglin, M.; Lamba, H.; Frazier, O. Use of Ventricular Assist Devices and Heart Transplantation for Advanced Heart Failure. Circ. Res. 2019, 124, 1658-1678. [CrossRef]
- Blume GG, Machado-Júnior PAB, Paludo Bertinato G, Simeoni RB, Francisco JC, Guarita-Souza LC. Tissue-engineered amniotic membrane in the treatment of myocardial infarction: a systematic review of experimental studies. Am J Cardiovasc Dis. 2021;11(1):1–11. [PubMed]
- Denison FC, Kelly RW, Calder AA, Riley SC. Cytokine secretion by human fetal membranes, decídua and placenta at term. Hum. Reprod. 13:3560–3565; 1998. [CrossRef]
- Steed DL, Trumpower C, Duffy D, et al. Amnion-derived cellular cytokine solution: A physiological combination of cytokines for wound healing. Eplasty 8:157–165; 2008. [PubMed]
- Orlic D, Kajstura J, Chimenti S, Jakoniuk I, Anderson SM, Li B, et al. Bone marrow cells regenerate infarcted myocardium. Nature. 2001 Apr;410(6829):701–5. [CrossRef]
- Weber KT, Sun Y, Guntaka RV, et al. Rebuilding and remodeling following myocardial infarction: the good, the bad, and the ugly of tissue repair. Dialogues in Cardiovascular Medicine. 1999; 4: 3-19.
- Lee SH, Wolf PL, Escudero R, et al. Early expression of angiogenesis factors in acute myocardial ischemia and infarction. N Engl J Med. 2000; 342(9):626-33.
- Jugdutt, B.I. Left ventricular rupture threshold during the healing phase after myocardial infarction in the dog. Can. J. Physiol. Pharmacol. 1987, 65, 307–316.
- Yang, Y.; Ma, Y.; Han, W.; Li, J.; Xiang, Y.; Liu, F.; Ma, X.; Zhang, J.; Fu, Z.; Su, Y.-D.; et al. Age-related differences in postinfarct left ventricular rupture and remodeling. Am. J. Physiol. Heart Circ. Physiol. 2008, 294, H1815–H1822.
- Wu, K.H., Zhou, B., Lu, S.H., Feng, B., Yang, S.G., Du, W.T., Gu, D.S., Han, Z.C., Liu, Y.L., 2007a. In vitro and in vivo differentiation of human umbilical cord derived stem cells into endothelial cells. J. Cell. Biochem. 100, 608–616. [CrossRef]
- Wu, K.H., Zhou, B., Yu, C.T., Cui, B., Lu, S.H., Han, Z.C., Liu, Y.L., 2007b. Therapeutic potential of human umbilical cord derived stem cells in a rat myocardial infarction model. Ann. Thorac. Surg. 83, 1491–1498. [CrossRef]
- Martinez, E.C., Vu, D.T., Wang, J., Lilyanna, S., Ling, L.H., Gan, S.U., Tan, A.L., Phan, T.T., Lee, C.N., Kofidis, T., 2013. Grafts enriched with subamnion-cord-lining me senchymal stem cell angiogenic spheroids induce post-ischemic myocardial re vascularization and preserve cardiac function in failing rat hearts. Stem Cells Dev. 22, 3087–3099. [CrossRef]
- Muller WA, Weigl SA, Deng X, Phillips DM. PECAM-1 is required for transendothelial migration of leukocytes. Journal of Experimental Medicine. 1993;178(2):449–460. [CrossRef]
- Potapov, E., Wassilew, K., Krabatsch, T., Dandel, M., Song, B., Mickley, A., Schmuttermaier, C., Gratchev, A., Hetzer, R., Kzhyshkowska, J., 2013. Association of alternatively activated macrophages with unbalanced immune reactions and fibrosis in myocardium of dilatative cardiomyopathy patients with left ventricular assist device implantation. Eur. Heart J. P4198. abstract:p4198. [CrossRef]
- Brodehl A, Gaertner-Rommel A, Milting H. Molecular insights into cardiomyopathies associated with desmin (DES) mutations. Biophys Rev 2018; 10: 983–1006.
- Ziegler M, Wang X, Lim B, Leitner E, et al. Platelet-Targeted Delivery of Peripheral Blood Mononuclear Cells to the Ischemic Heart Restores Cardiac Function after Ischemia-Reperfusion Injury. Theranostics. 2017 Jul 22;7(13):3192-3206. [CrossRef] [PubMed] [PubMed Central]
- Machado-Júnior PAB, Blume GG, Francisco JC, Guarita-Souza LC. Cell-Based Therapies for Myocardial Regeneration in Heart Failure: 20 Years of Debate. Brazilian J Cardiovasc Surg. 2020; 35(4):VIII–XI. [CrossRef]
- Guarita-Souza LC, Carvalho KA, Rebelatto C, et al. Cell transplantation: differential effects of myoblasts and mesenchymal stem cells. Int J Cardiol. 2006; 111(3):423-9.
- Ryabov V, Gombozhapova A, Rogovskaya Y, Kzhyshkowska J, Rebenkova M, Karpov R. Cardiac CD68+ and stabilin-1+ macrophages in wound healing following myocardial infarction: From experiment to clinic. Immunobiology. 2018 Apr-May;223(4-5):413-421. Epub 2017 Nov 22. [CrossRef] [PubMed]
- Steffens S, Van Linthout S, Sluijter JPG, Tocchetti CG, Thum T, Madonna R. Stimulating pro-reparative immune responses to prevent adverse cardiac remodelling: consensus document from the joint 2019 meeting of the ESC Working Groups of cellular biology of the heart and myocardial function. Cardiovasc Res. 2020 Sep 1;116(11):1850-1862. [CrossRef] [PubMed]
Figure 2.
A- LATERAL THORACOTOMY FOR MYOCARDIAL ACCESS IN AN ANIMAL MODEL; B- MYOCARDIAL ISCHEMIA RESULTING FROM LIGATION OF THE LEFT CORONARY ARTERY. SOURCE: AUTHOR'S COLLECTION (2024).
Figure 2.
A- LATERAL THORACOTOMY FOR MYOCARDIAL ACCESS IN AN ANIMAL MODEL; B- MYOCARDIAL ISCHEMIA RESULTING FROM LIGATION OF THE LEFT CORONARY ARTERY. SOURCE: AUTHOR'S COLLECTION (2024).
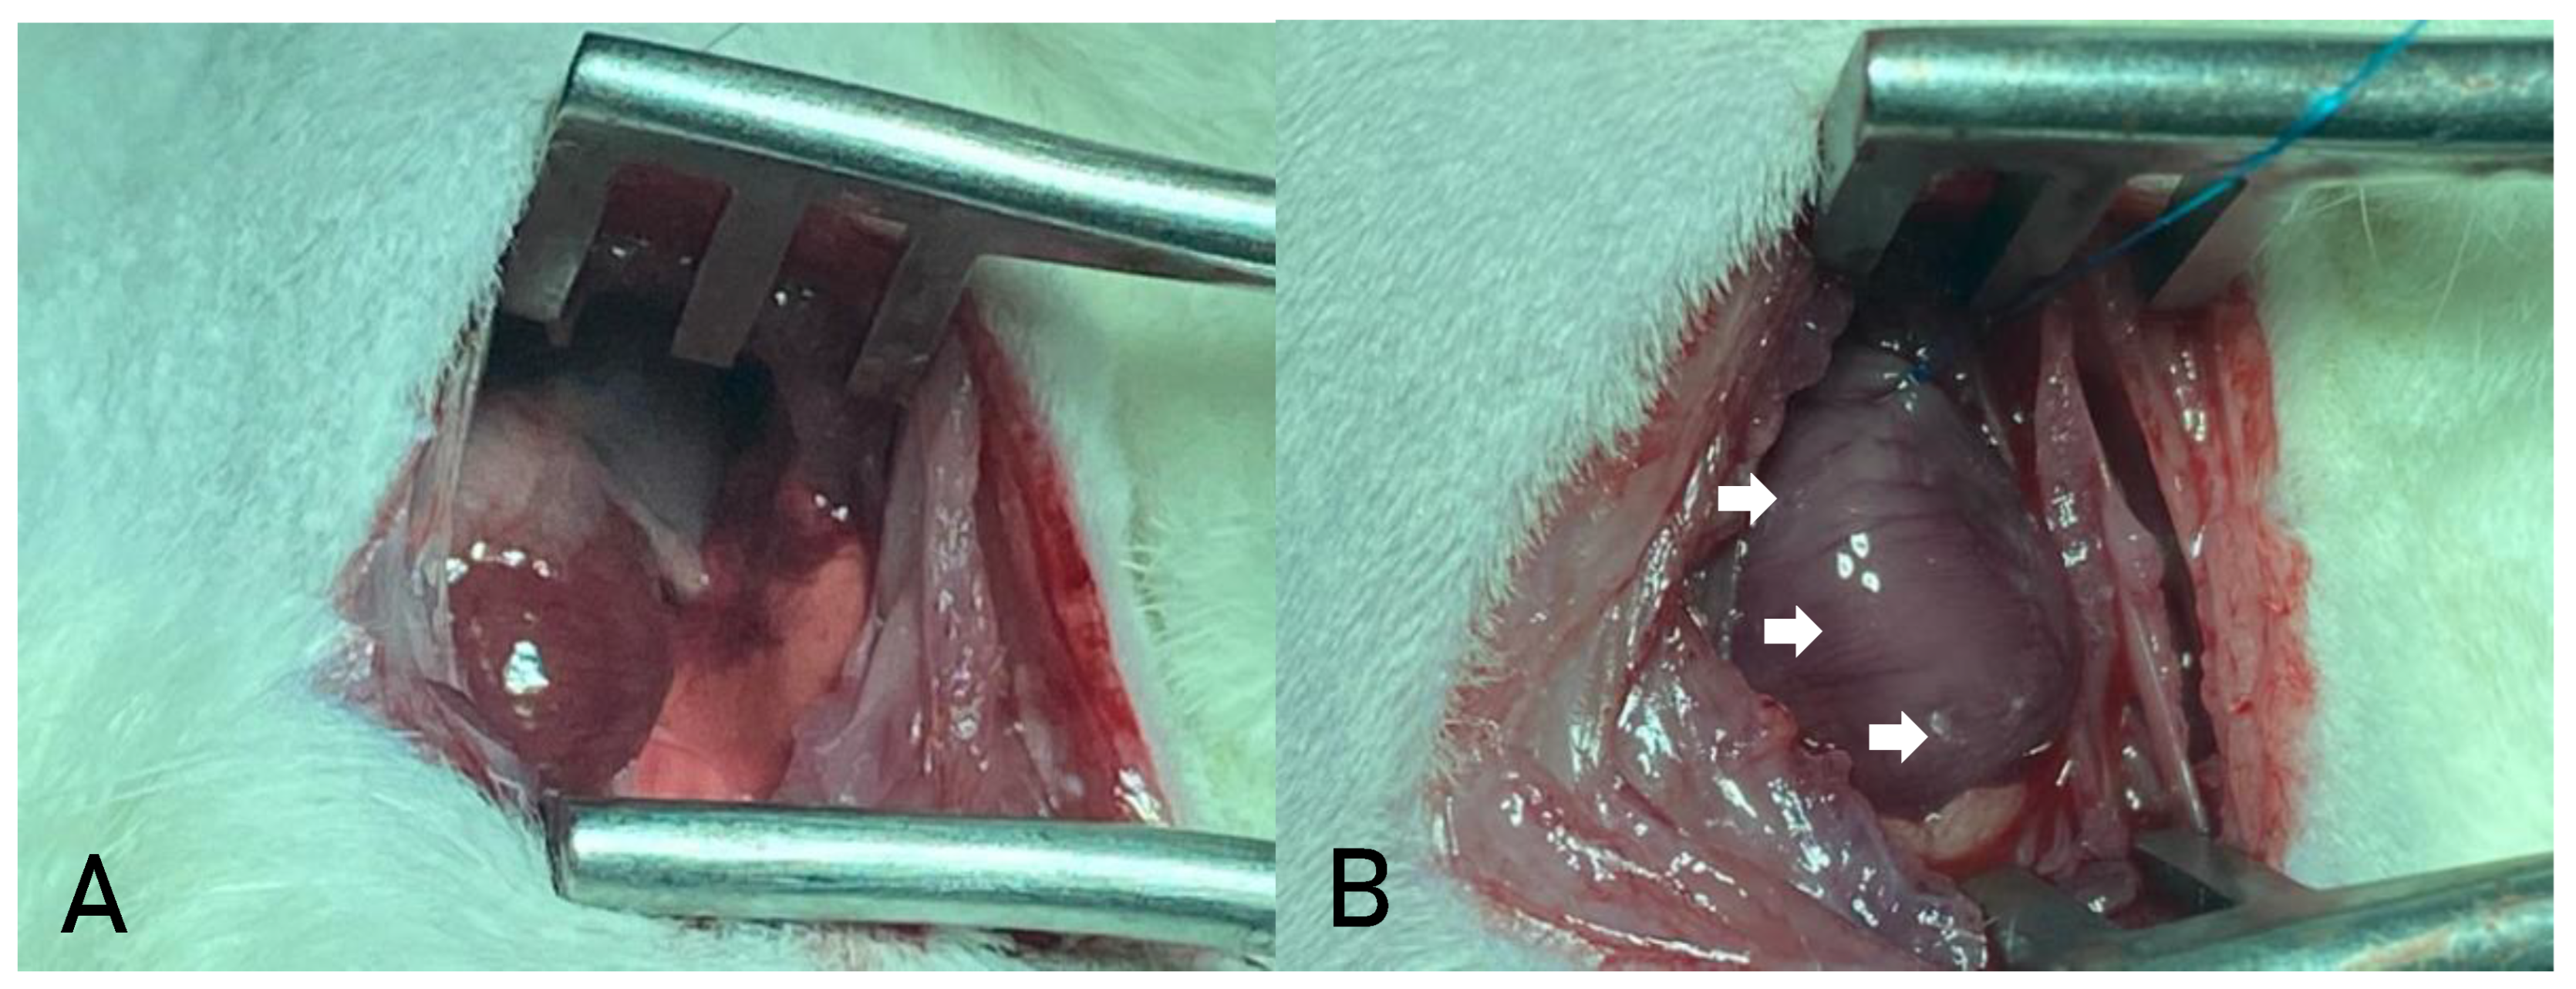
Figure 3.
A- IMPLANTATION OF STEM CELLS IN THE MYOCARDIUM OF AN ANIMAL MODEL. B- HUMAN AMNIOTIC MEMBRANE IMPLANT IN THE MYOCARDIUM OF AN ANIMAL MODEL. SOURCE: AUTHOR'S COLLECTION (2024).
Figure 3.
A- IMPLANTATION OF STEM CELLS IN THE MYOCARDIUM OF AN ANIMAL MODEL. B- HUMAN AMNIOTIC MEMBRANE IMPLANT IN THE MYOCARDIUM OF AN ANIMAL MODEL. SOURCE: AUTHOR'S COLLECTION (2024).
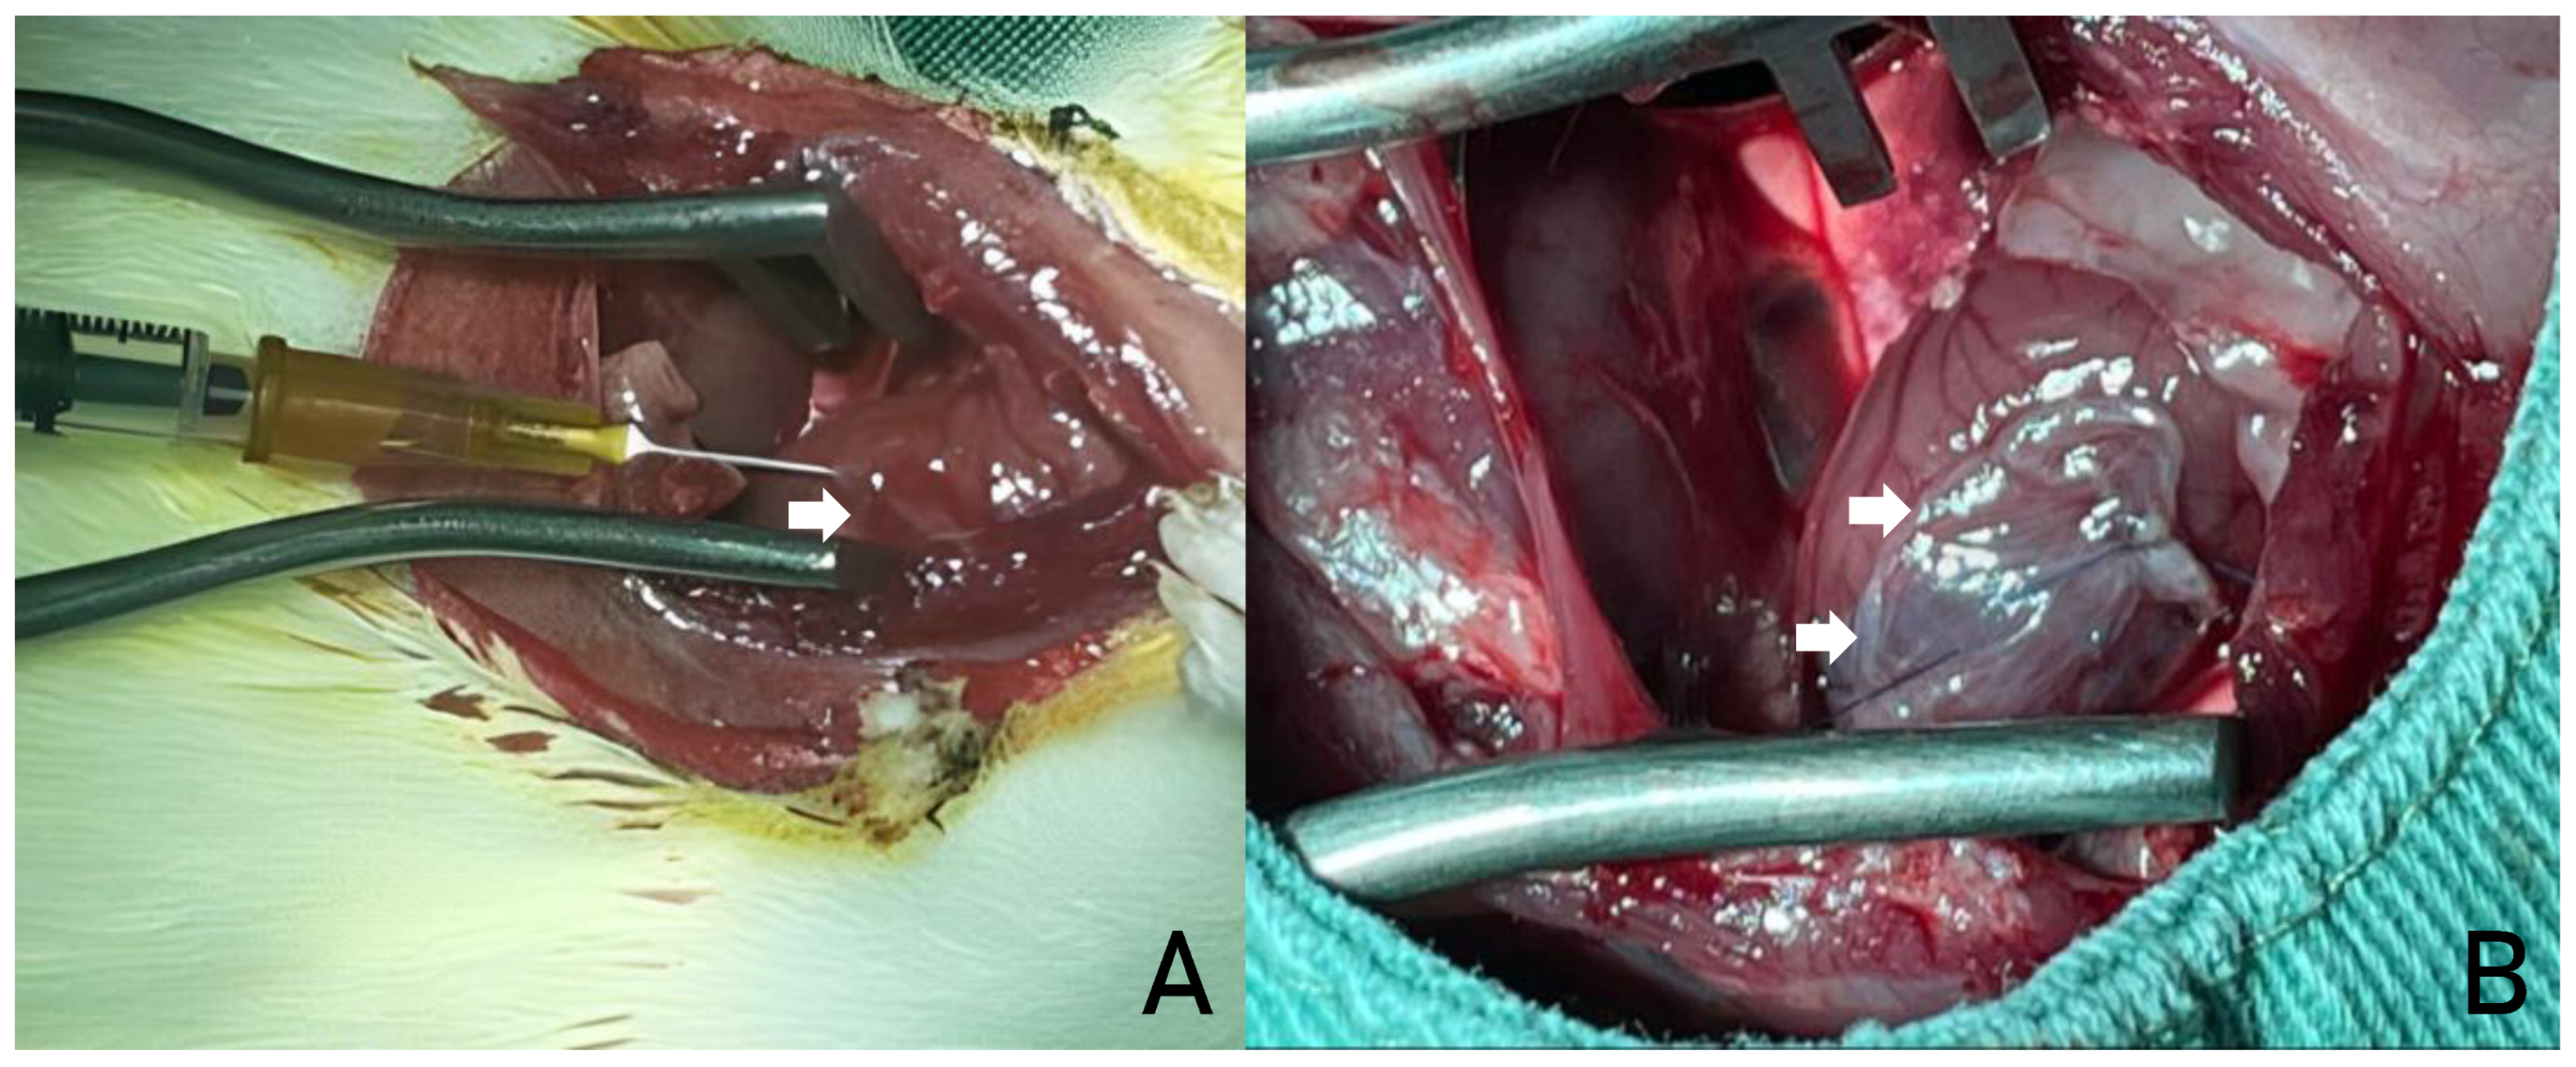
Figure 4.
VISUALIZATION OF THE EXTENT OF FIBROSIS IN OPTICAL MICROSCOPY OF MYOCARDIAL TISSUE SLIDE USING GOMORI TRICHROME STAINING. SOURCE: AUTHOR'S COLLECTION (2024).
Figure 4.
VISUALIZATION OF THE EXTENT OF FIBROSIS IN OPTICAL MICROSCOPY OF MYOCARDIAL TISSUE SLIDE USING GOMORI TRICHROME STAINING. SOURCE: AUTHOR'S COLLECTION (2024).
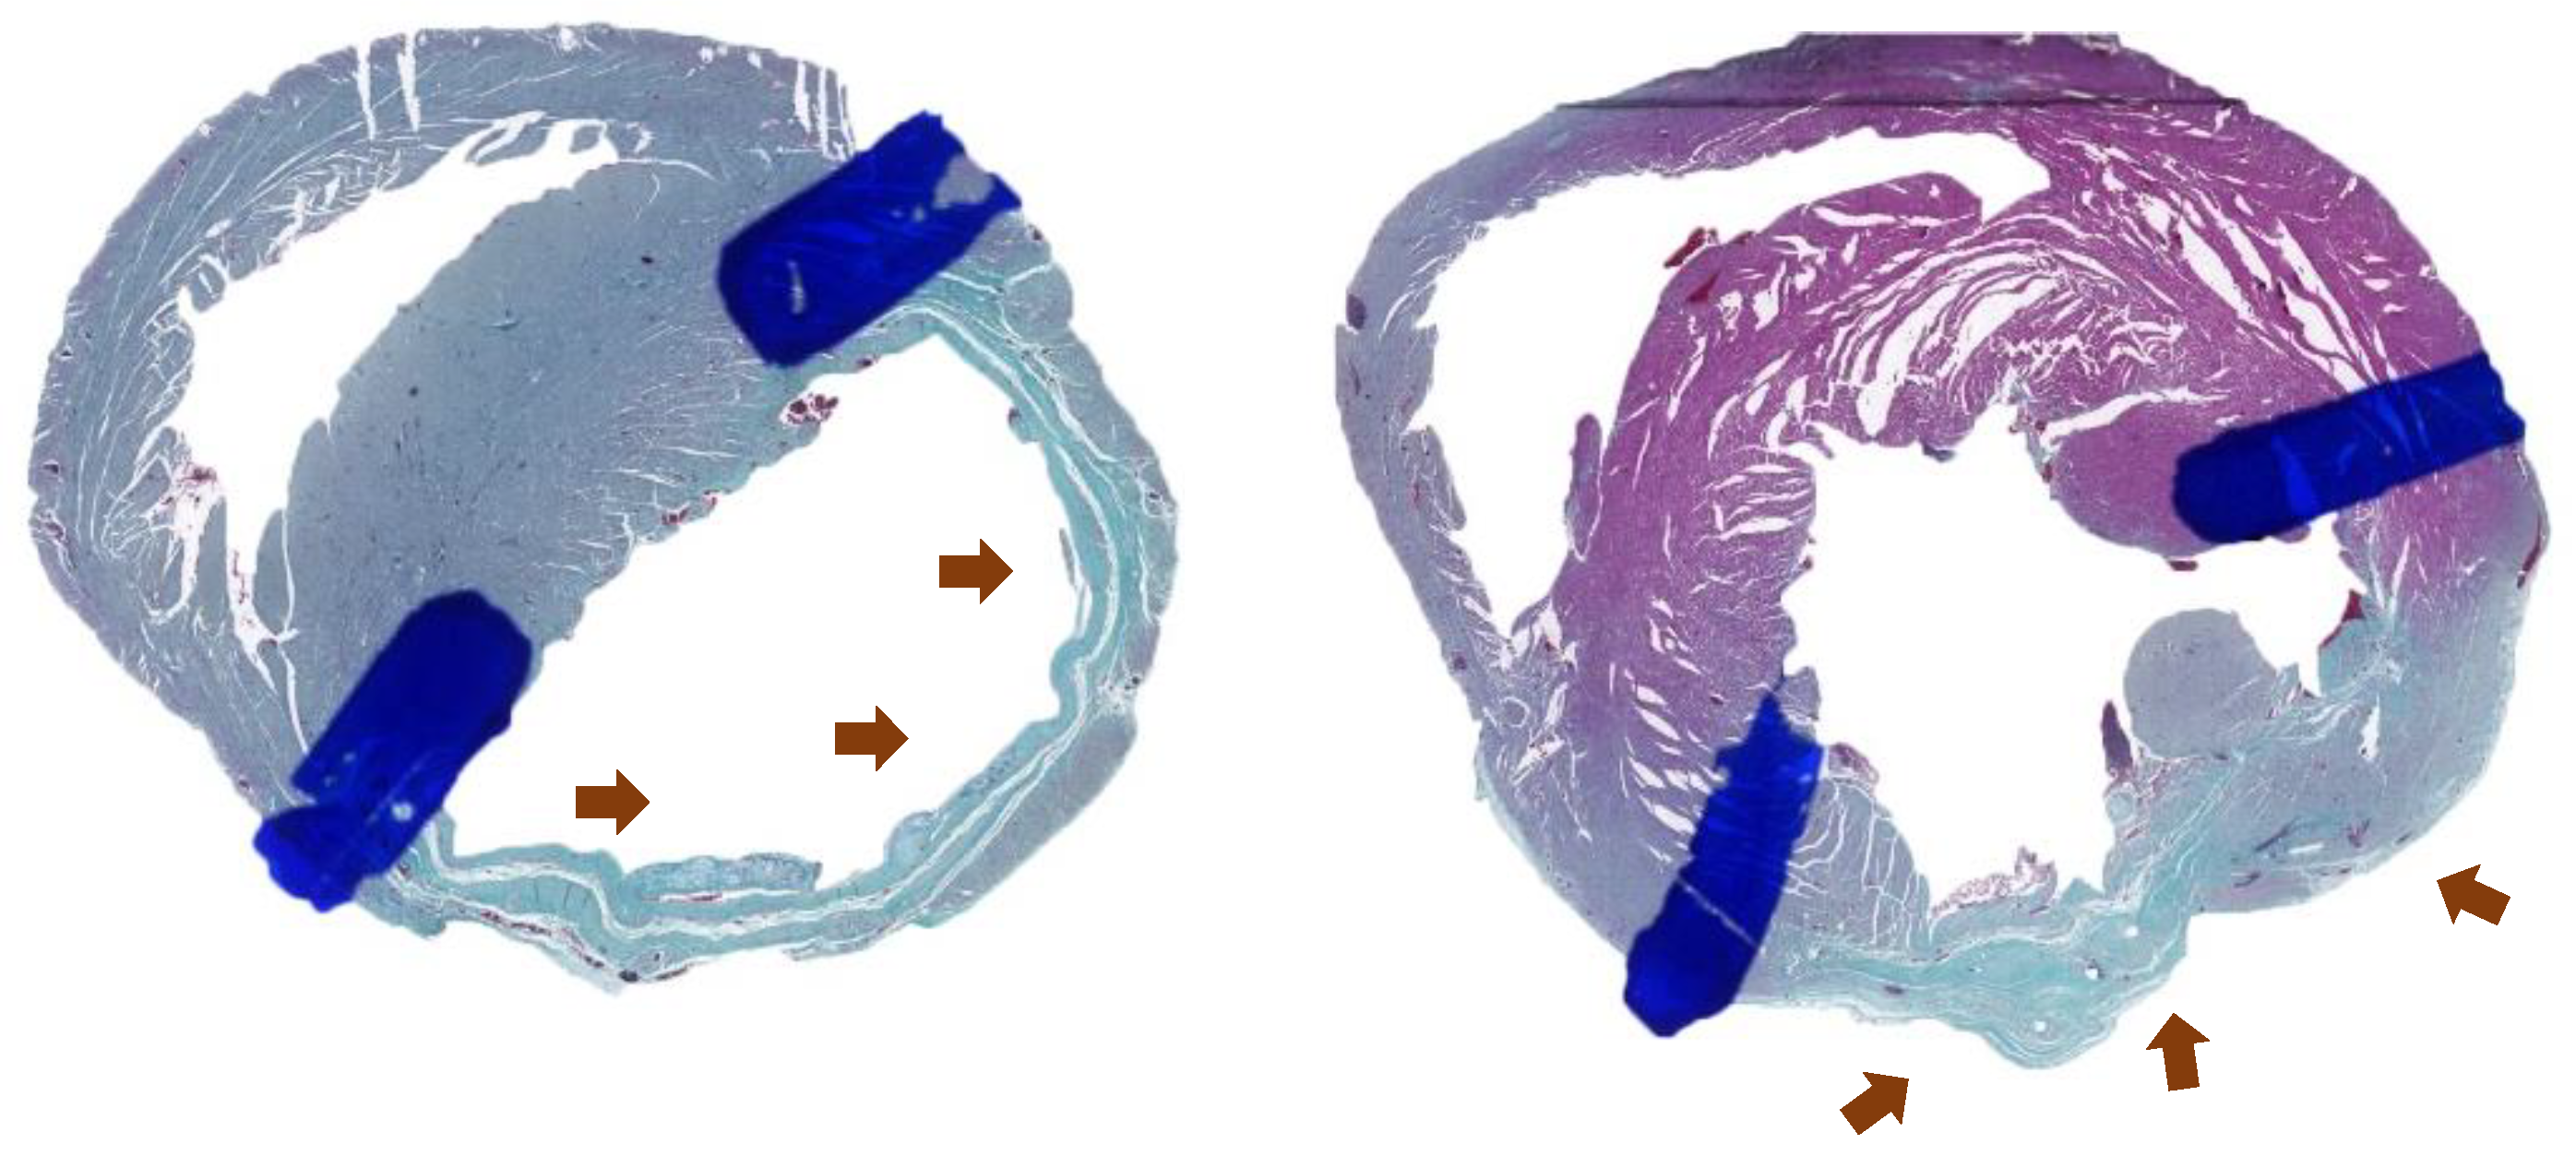
Figure 5.
VISUALIZATION OF TYPE I COLLAGEN (WHITE ARROW IN IMAGE A) AND TYPE III COLLAGEN (WHITE ARROW IN IMAGE B) IN OPTICAL MICROSCOPY OF MYOCARDIAL TISSUE SLIDE USING SIRIUS-RED STAINING. SOURCE: AUTHOR'S COLLECTION (2024).
Figure 5.
VISUALIZATION OF TYPE I COLLAGEN (WHITE ARROW IN IMAGE A) AND TYPE III COLLAGEN (WHITE ARROW IN IMAGE B) IN OPTICAL MICROSCOPY OF MYOCARDIAL TISSUE SLIDE USING SIRIUS-RED STAINING. SOURCE: AUTHOR'S COLLECTION (2024).
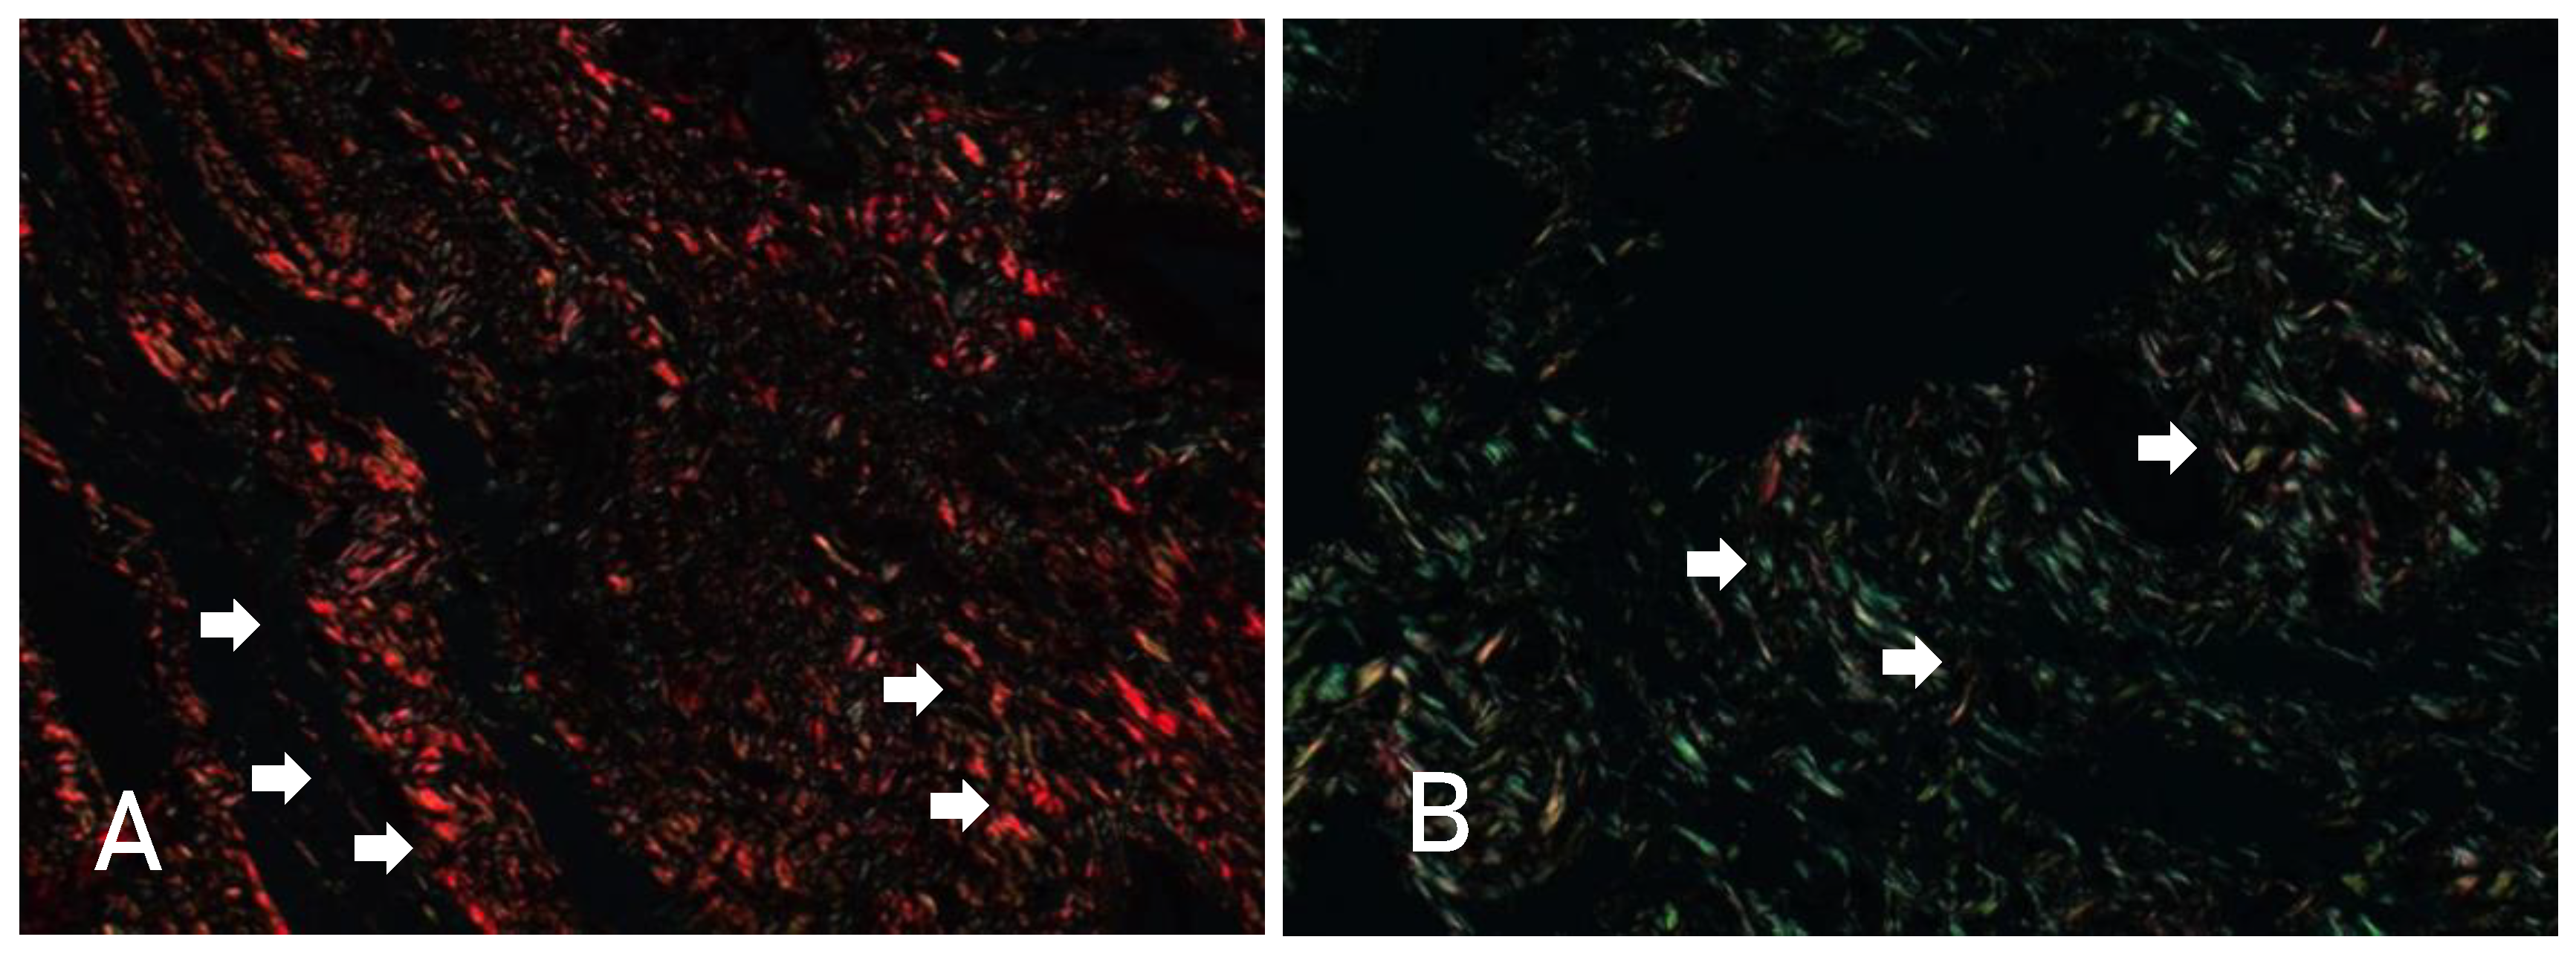
Figure 6.
BOX-PLOT REPRESENTING THE ANALYSIS OF THE VARIABLES GOMORI TRICHROME (A), COLLAGEN TYPE I (B) AND III (C). SOURCE: THE AUTHOR (2024). LEGEND: AM: AMNIOTIC MEMBRANE; SC: STEM CELLS.
Figure 6.
BOX-PLOT REPRESENTING THE ANALYSIS OF THE VARIABLES GOMORI TRICHROME (A), COLLAGEN TYPE I (B) AND III (C). SOURCE: THE AUTHOR (2024). LEGEND: AM: AMNIOTIC MEMBRANE; SC: STEM CELLS.
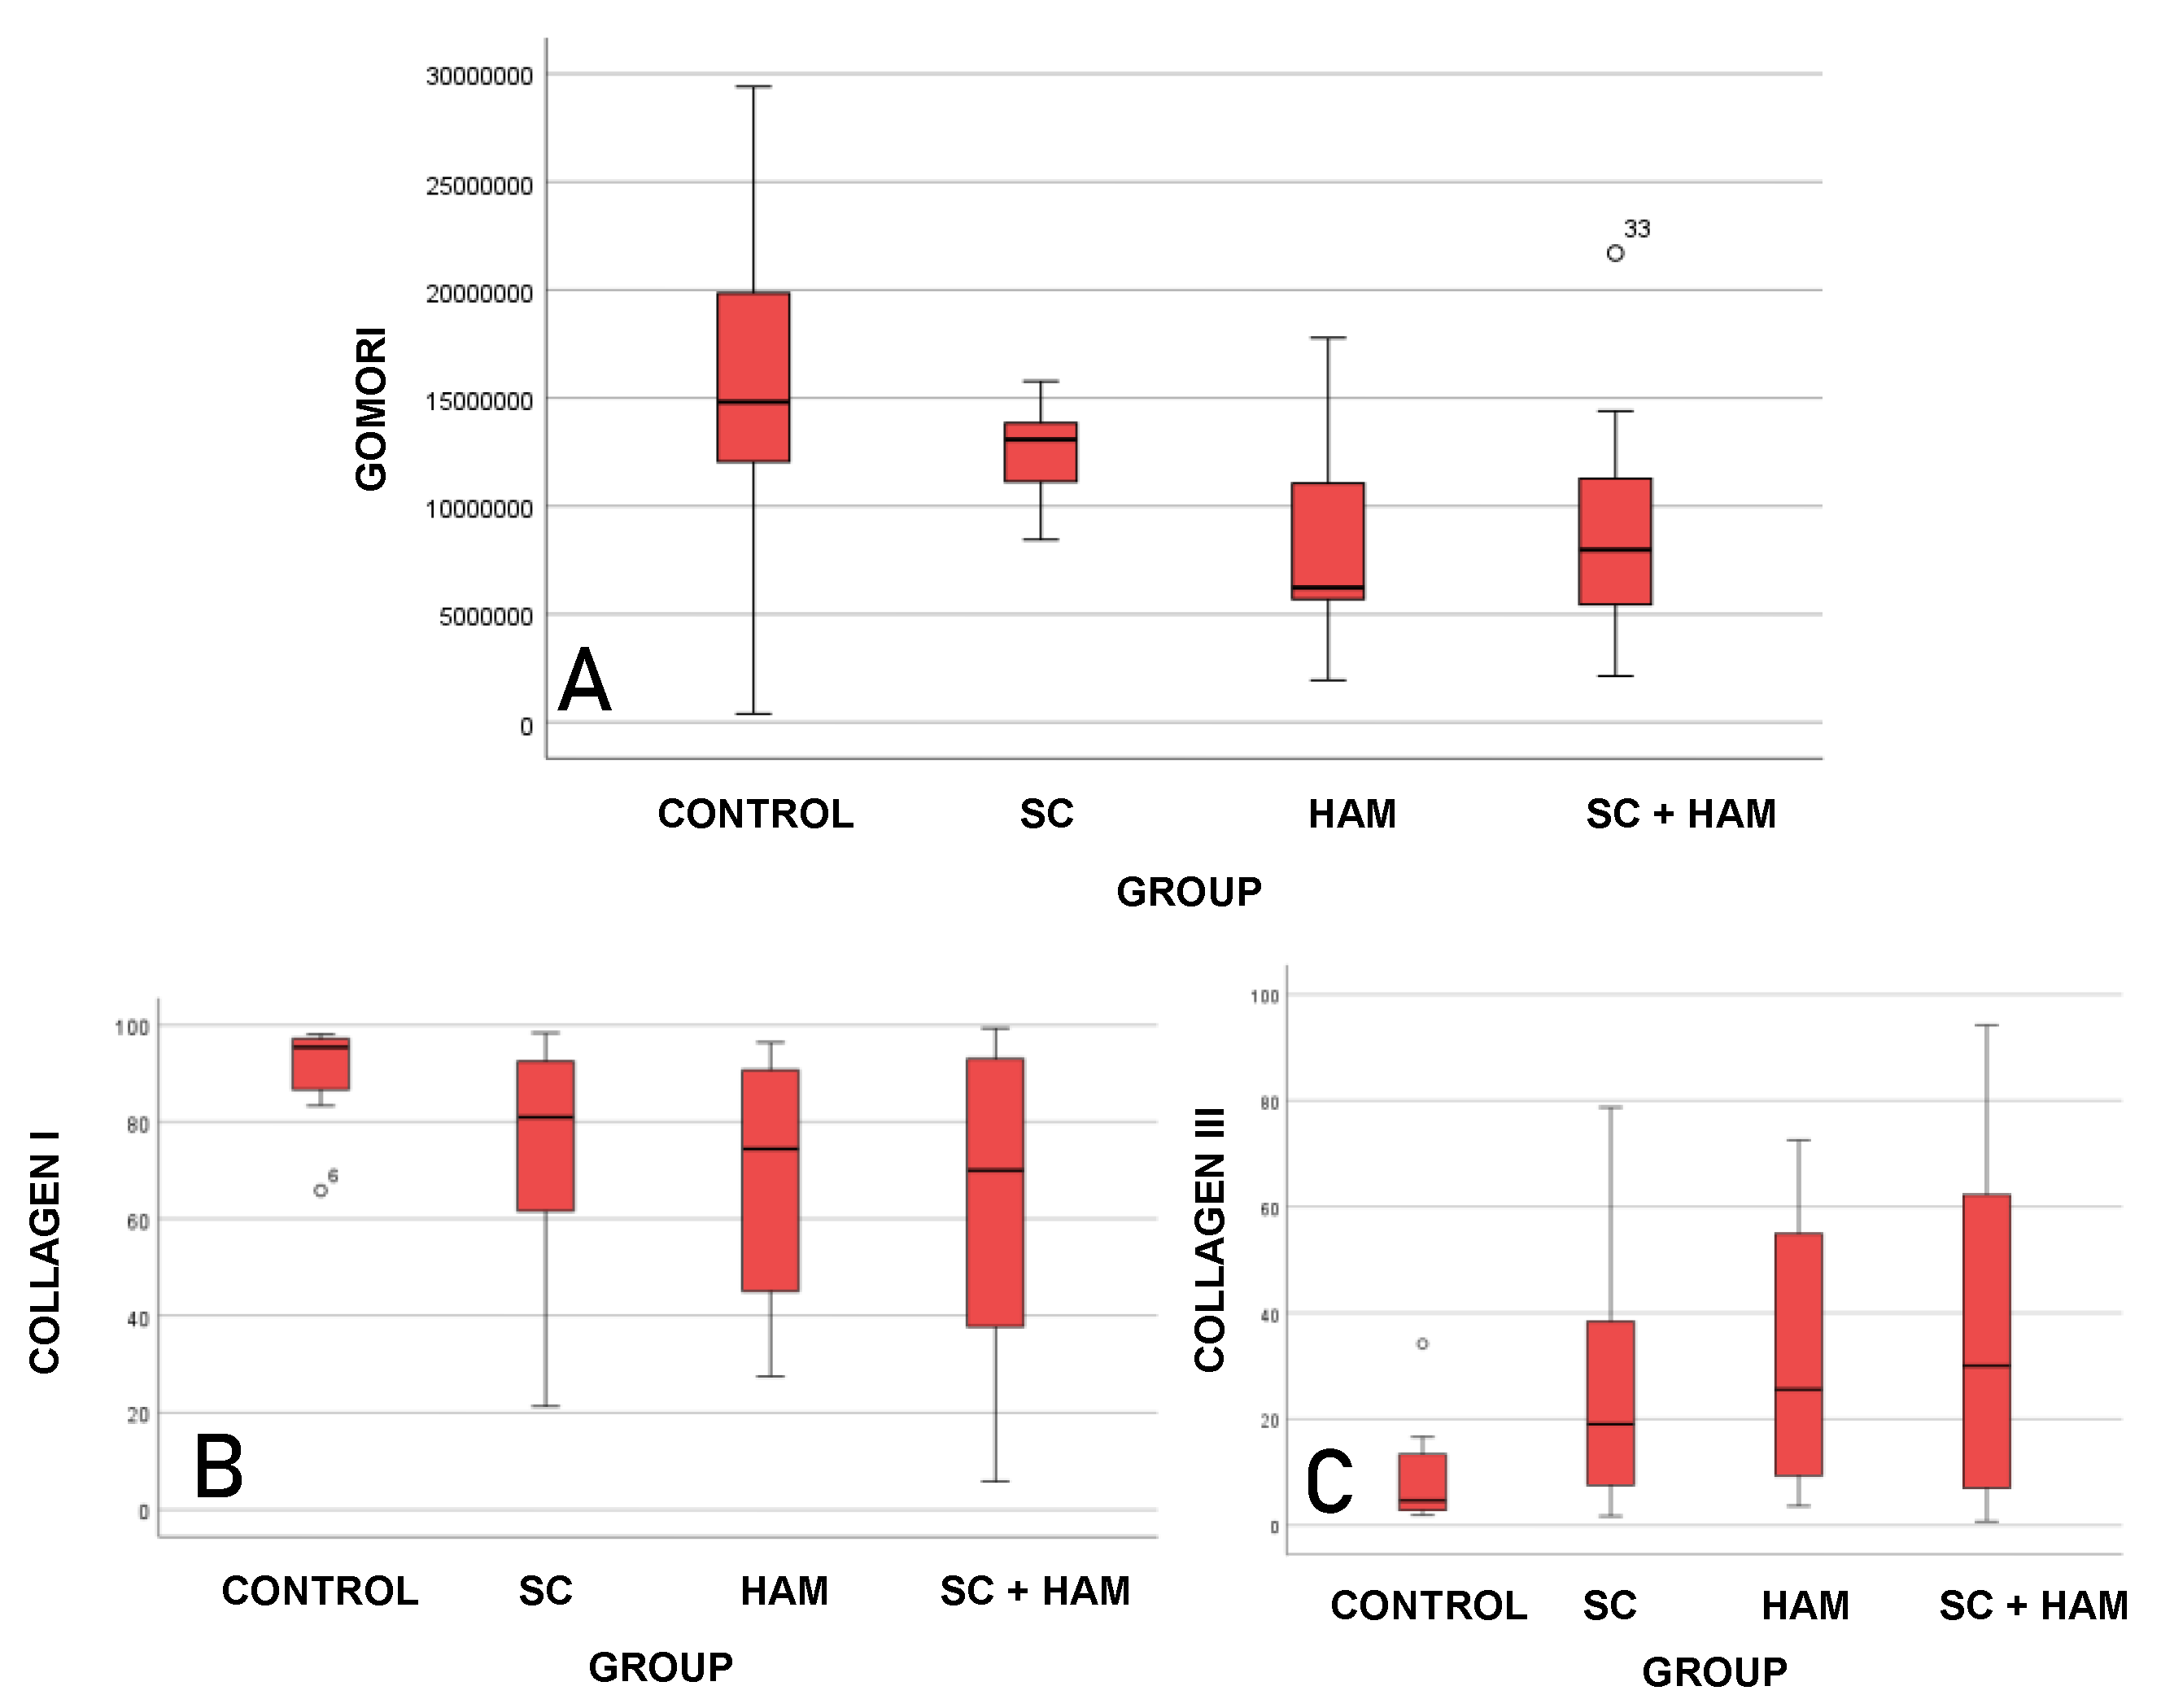
Figure 7.
BOX-PLOT REPRESENTING THE ANALYSIS OF THE VARIABLES ANALYSIS OF THE VARIABLES α-ACTIN (A), CD31 (B), CD68 (C), DESMINE (D) AND SARCOMERIC ACTIN (E) BETWEEN THE STUDY GROUPS. SOURCE: THE AUTHOR (2024). LEGEND: AM: AMNIOTIC MEMBRANE; SC: STEM CELLS.
Figure 7.
BOX-PLOT REPRESENTING THE ANALYSIS OF THE VARIABLES ANALYSIS OF THE VARIABLES α-ACTIN (A), CD31 (B), CD68 (C), DESMINE (D) AND SARCOMERIC ACTIN (E) BETWEEN THE STUDY GROUPS. SOURCE: THE AUTHOR (2024). LEGEND: AM: AMNIOTIC MEMBRANE; SC: STEM CELLS.
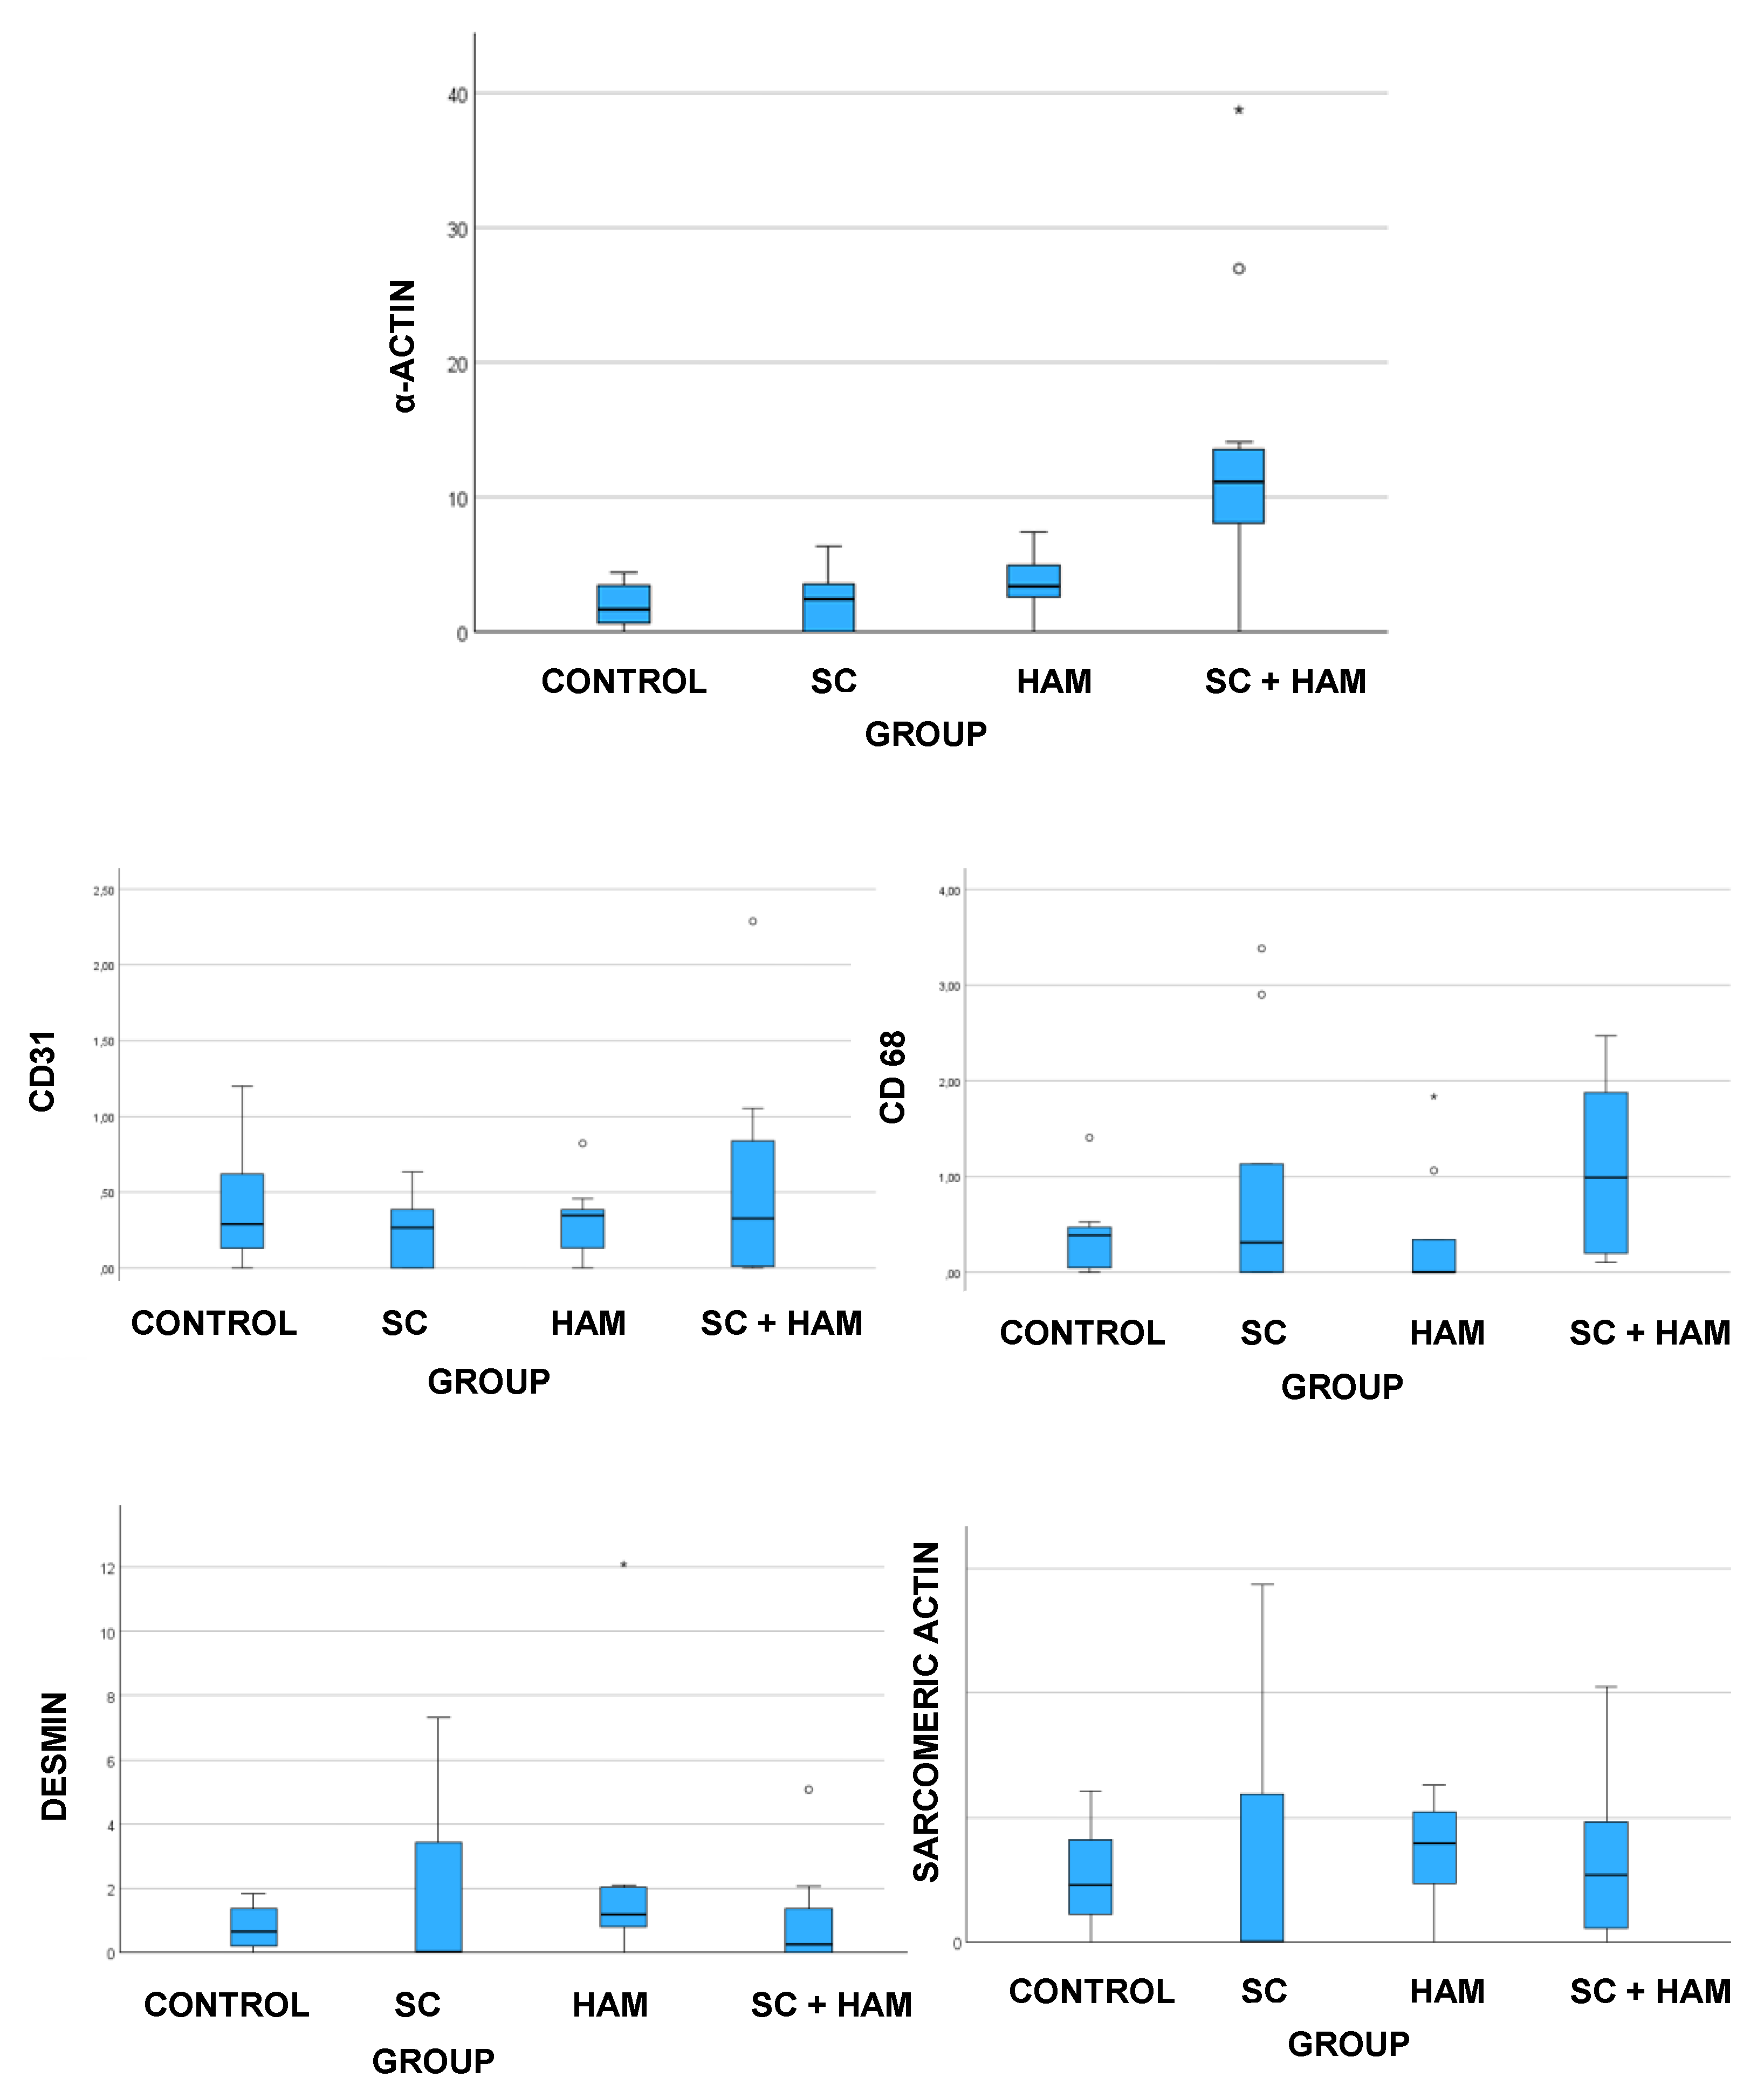

Table 1.
ANALYSIS OF THE FE (%), VS (ML) AND VD (ML) VARIABLES BETWEEN THE STUDY GROUPS.
| Variable | Group (n) | Average±SD | p* (comparison of the 4 groups) |
|---|---|---|---|
| EF (%) DAY 7 | CONTROL (12) | 37,3 ±5 ,6 | 0,349 |
| HTAM (10) | 35,1 ± 5,9 | ||
| SC (9) | 38,9 ± 6,5 | ||
| HAM+SC (12) | 37,9 ± 6 | ||
| EF (%) DAY 30 | CONTROL (12) | 36,5 ± 5,7 | 0,072 |
| HAM (10) | 37,8 ± 9,3 | ||
| SC (9) | 33,3 ± 7,1 | ||
| HAM+SC (12) | 42,2 ± 9 | ||
| SV (ml) DAY 7 | CONTROL (12) | 0,159 ± 0,046 | 0,349 |
| HAM (10) | 0,143 ± 0,067 | ||
| SC (9) | 0,191 ± 0,066 | ||
| HAM+SC (12) | 0,177 ± 0,067 | ||
| SV (ml) DAY 30 | CONTROL (12) | 0,194 ± 0,07 | 0,023 |
| HAM (10) | 0,194 ± 0,071 | ||
| SC (9) | 0,156 ± 0,075 | ||
| HAM+SC (12) | 0,118 ± 0,068 | ||
| DV (ml) DAY 7 | CONTROL (12) | 0,257 ± 0,065 | 0,533 |
| HAM (10) | 0,257 ± 0,142 | ||
| SC (9) | 0,315 ± 0,098 | ||
| HAM+SC (12) | 0,287 ± 0,096 | ||
| DV (ml) DAY 30 | CONTROL (12) | 0,301 ± 0,079 | 0,005 |
| HAM (10) | 0,313 ± 0,077 | ||
| SC (9) | 0,229 ± 0,105 | ||
| HAM+SC (12) | 0,197 ± 0,084 |
*ANOVA with one factor (D7 and Difer); ANCOVA with one factor including D7 as a covariate; p<0.05. Legend: EF: Ejection Fraction; SV: Systolic Volume; DV: Diastolic Volume; SD: Standard Deviation; AM: Amniotic Membrane; SC: Stem Cells.
Table 2.
ANALYSIS OF THE TWO BY TWO GROUPS FOR THE VARIABLES SV (ml) AND DV (ml).
| Compared groups | p* | |
|---|---|---|
| VD (ml) D30 | VS (ml) D30 | |
| CONTROL X HAM | 1 | 1 |
| CONTROL X SC | 0,378 | 1 |
| CONTROL X (HAM + SC) | 0,031 | 0,050 |
| AM x SC | 0,235 | 1 |
| HAM x (HAM+SC) | 0,019 | 0,093 |
| SC x (HAM+SC) | 1 | 1 |
*Student's t-test for paired samples, p<0,05. Adjusted p-values using Bonferroni correction. Values greater than 1 were reported as 1. Legend: AM: Amniotic Membrane; SC: Stem Cells.
Table 3.
ANALYSIS OF THE VARIABLES GOMORI TRICHROME (µM²), COLLAGEN TYPE I (%) AND TYPE III (%) BETWEEN THE STUDY GROUPS.
Table 3.
ANALYSIS OF THE VARIABLES GOMORI TRICHROME (µM²), COLLAGEN TYPE I (%) AND TYPE III (%) BETWEEN THE STUDY GROUPS.
| Variable | Group (n) | Average±SD | p* (comparação dos 4 grupos) |
|---|---|---|---|
| GOMORI TRICHROME (µm²) | CONTROL (11) | 15585072 ± 7997958 | |
| SC (9) | 12810354 ± 2452308 | ||
| HAM (9) | 8890165 ± 5613027 | ||
| HAM+SC (12) | 8961009 ± 5283955 | 0,033 | |
| TYPE I COLLAGEN (%) | CONTROL (11) | 91,0 ± 9,9 | |
| SC (9) | 74,6 ± 23,9 | ||
| HAM (9) | 66,7 ± 25,7 | ||
| HAM+SC (12) | 63,1 ± 32,3 | 0,034 | |
| TYPE III COLLAGEN (%) | CONTROL (11) | 9 ± 9,9 | |
| SC (9) | 25,4 ± 23,9 | ||
| HAM (9) | 33,3 ± 25,7 | ||
| HAM+SC (12) | 36,9 ± 32,3 | 0,034 |
*ANOVA with one factor or Kruskal-Wallis non-parametric test; p<0.05. Legend: SD: Standard Deviation. Legend: SD: Standard Deviation; AM: Amniotic Membrane; SC: Stem Cells;.
Table 4.
ANALYSIS OF THE TWO BY TWO GROUPS FOR THE VARIABLES GOMORI TRICRONIC (µm²), COLLAGEN TYPE I (%) AND TYPE III (%).
Table 4.
ANALYSIS OF THE TWO BY TWO GROUPS FOR THE VARIABLES GOMORI TRICRONIC (µm²), COLLAGEN TYPE I (%) AND TYPE III (%).
| Compared groups | p* | ||
|---|---|---|---|
| Gomori | Type I collagen |
Type III collagen |
|
| CONTROL X SC | 1 | 0,428 | 0,428 |
| CONTROLE X HAM | 0,093 | 0,083 | 0,083 |
| CONTROLE X (HAM+SC) | 0,050 | 0,050 | 0,050 |
| SC X AM | 0,933 | 1 | 1 |
| SC X (HAM+SC) | 0,819 | 1 | 1 |
| AM X (HAM+SC) | 1 | 1 | 1 |
*Bonferroni post-hoc test or Dunn test, p<0.05. Adjusted p-values using Bonferroni correction. Legend: AM: Amniotic Membrane; SC: Stem Cells.
Table 5.
ANALYSIS OF THE VARIABLES α-ACTIN (%), CD31 (%), CD68 (%), DESMINE (%) AND SARCOMERIC ACTIN (%) BETWEEN THE STUDY GROUPS.
Table 5.
ANALYSIS OF THE VARIABLES α-ACTIN (%), CD31 (%), CD68 (%), DESMINE (%) AND SARCOMERIC ACTIN (%) BETWEEN THE STUDY GROUPS.
| Variable | Group | Average±SD | p* (comparação dos 4 grupos) |
|---|---|---|---|
| α-ACTIN (%) | CONTROL (11) SC (9) HAM (9) HAM+SC (12) |
1,97±1,61 2,38±2,20 3,49±2,19 13,32±10,21 |
<0,001 |
| CD31 (%) | CONTROL (11) SC (9) HTAM (9) HAM+SC (12) |
0,44±0,43 0,24±0,23 0,32±0,25 0,55±0,67 |
0,743 |
| CD68 (%) | CONTROL (11) SC (9) HAM (9) HAM+SC (12) |
0,37±0,40 0,94±1,30 0,36±0,66 1,09±0,89 |
0,061 |
| DESMIN (%) | CONTROL (11) SC (9) HAM (9) HAM+SC (12) |
0,80±0,71 1,77±2,83 2,37±3,71 0,91±1,51 |
0,264 |
| ACTIN SARCOMERIC (%) | CONTROL (11) SC (9) HHAM (9) HAM+SC (12) |
2,58±2,02 4,02±5,43 3,55±2,30 3,28±3,15 |
0,755 |
*Teste não-paramétrico de Kruskal-Wallis; p<0,05. Legend: SD: Standard Deviation; AM: Amniotic Membrane; SC: Stem Cells.
Table 6.
ANALYSIS OF THE TWO BY TWO GROUPS FOR THE VARIABLE α-ACTIN(%).
| Compared groups | p* |
|---|---|
| α-ACTIN (%) | |
| CONTROL X SC | 1 |
| CONTROL X HAM | 1 |
| CONTROL X (HAM+SC) | 0,001 |
| SC X AM | 1 |
| SC X (HAM+SC) | 0,003 |
| HAM X (HAM+SC) | 0,066 |
*Bonferroni post-hoc test or Dunn test, p<0.05. Adjusted p-values using Bonferroni correction. Legend: AM: Amniotic Membrane; SC: Stem Cells.
Disclaimer/Publisher’s Note: The statements, opinions and data contained in all publications are solely those of the individual author(s) and contributor(s) and not of MDPI and/or the editor(s). MDPI and/or the editor(s) disclaim responsibility for any injury to people or property resulting from any ideas, methods, instructions or products referred to in the content. |
© 2025 by the authors. Licensee MDPI, Basel, Switzerland. This article is an open access article distributed under the terms and conditions of the Creative Commons Attribution (CC BY) license (http://creativecommons.org/licenses/by/4.0/).
Copyright: This open access article is published under a Creative Commons CC BY 4.0 license, which permit the free download, distribution, and reuse, provided that the author and preprint are cited in any reuse.


