
Submitted:
24 June 2025
Posted:
25 June 2025
You are already at the latest version
Abstract
This paper proposes a machine learning (ML) based energy optimization framework for 5G New Radio (5G NR) utilizing a Classification and Regression Tree (CART) algorithm. The methodology implements dynamic cell resource reconfiguration through predictive load forecasting, achieving a 42.3% reduction of energy consumption, while maintaining QoS parameters within 3GPP-specified thresholds. A case study with a network layout made up of an inter-band NR-NR Dual Connectivity (NR-DC) was simulated to quantitatively validate our model.
Keywords:
5G RAN
; energy efficiency
; resource allocation
; RRC
; machine learning
1. Introduction
The next generation of 5G wireless networks is expected to provide massive capacity with ultra-high data rates, ultra-low latency and extremely high reliability [1]. While consumer applications dominate public perception, 5G is equally transformative for industrial verticals, including healthcare, education, energy, mining, agriculture, and advanced manufacturing [2]. However, this technological leap comes at an energy cost. The exponential growth in 5G data traffic and the introduction of new use cases are driving to an unsustainable increase in energy consumption, significantly raising the energy bill for Communication Service Providers (CSP) [3]. And what is even more critical, this energy demand translates directly into higher carbon dioxide (CO2) emissions [4] which cause, in turn, harmful effects to the environment. It is informed that about 2-4% of global carbon emissions are caused by Information and Communications Technologies (ICT) [5].
Such a combination of rising operational costs and binding net-zero commitments has elevated energy efficiency to a strategic imperative for telecom operators [6]. According to the ‘Green Communications’ study in [4], the Radio Access Network (RAN) accounts for the largest share of power consumption in mobile communications, making intelligent resource allocation in 5G a critical challenge for achieving sustainable network operations.
In this paper, we present a power saving scheme based on an Artificial Intelligence (AI) Decision Tree Machine Learning (ML) model with a Classification and Regression Tree (CART) algorithm, to shut off unnecessary radio cell resources when they are not required. Our AI is trained to dynamically determine the expected number of Data Radio Bearers (DRBs) required in a cell to satisfy the demand without degrading the user experience. Based on the prediction, the RAN orchestrator can decide in advance what radio resources should be activated or deactivated to optimize energy utilization.
To validate that scheme, we have developed a simple User Equipment (UE) stochastic traffic model by using a Radio Resource Control State Diagram (RRC-SD), to perform the dynamic behavior of one single user. Based on that, we have aggregated a number of UEs camped on a cell to estimate the probability density function (PDF) of required Data Radio Bearers (DRBs). This estimation identifies the necessary radio resources which must be kept and, consequently, provides a valuable input to decide what radio resources could be shut off. The estimated number of necessary DRBs so obtained is then compared to the real number of DRBs assigned by the RAN orchestrator for the AI to validate the model and reinforce its learning. Figure 1 represents the operational principle of our model.
This paper is organized as follows. In Section 2, main strategies for energy optimization on 5G New Radio (NR) is reviewed, paying a particular attention to shutdown techniques. In Section 3, the testbed of a generic inter-band NR-NR Dual Connectivity (NR-DC) architecture is described. Such a testbed represents our case of study and will serve to simulate the daily operation of a 5G network. In Section 4, a set of sleep states for every cell in the 5G testbed is introduced to later quantify the energy saving. In Section 5, we set up a dataset to firstly train the AI and later proceed with the validation. Due to the lack of real data, such a dataset was made up from scratch by simulating a broad variety of on-cell camping cases with a data traffic generated through our RRC-SD stochastic model. In Section 6, the previous dataset is employed to check the accuracy of five different ML algorithms, resulting the Decision Tree model with CART the best option among them. This model is then analyzed in Section 7 to assess the energy saving performance in our particular use case. Finally, main conclusions are drawn in section 8.
2. Background
Multiple energy-saving schemes have been developed for 5G NR to optimize power consumption without compromising network performance or connectivity requirements. A primary approach involves the dynamic deactivation of underutilized resources, which is commonly referred as “sleep-mode” operation [7]. This technique can be implemented across multiple domains, including time, frequency, antenna and power dimensions, to enhance energy efficiency [8].
In 5G NR, time-domain sleep mode, also known as symbol shutdown, enables gNBs to completely deactivate transmission during idle time slots when no user data traffic exists. This can be achieved by periodically reducing the transmission rate of common signals, such as synchronization signal blocks (SSB), which facilitates deeper sleep states and significantly enhances network energy efficiency [9]. Consequently, this approach effectively eliminates wasteful power consumption from non-essential control signaling.
In frequency domain, carriers and bandwidth parts (BWP) can also be shut down dynamically according to real-time traffic [10]. Additionally, 3GPP has introduced the use of capacity booster cells to improve the energy efficiency of the RAN. When a candidate cell is turned off to conserve energy, the capacity booster cell is activated to provide alternative service and coverage, ensuring a seamless user experience [11].
For antenna domain, Multiple-Input Multiple-Output (MIMO) techniques play a crucial role in 5G to optimizing spectral efficiency and network capacity through spatial diversity and multiplexing. However, full MIMO capacity is not always required, so unnecessary subset of antennas can be turned off to save energy [12]. Similarly, in the power domain, transmission power can be intelligently adjusted based on traffic conditions and channel quality [13] to further reduce energy consumption.
By simply shutting off radio resources, the power consumed by a base station can be reduced significantly [14]. However, this approach may lead to a performance degradation. To mitigate that issue, ML/AI algorithms have been proposed to dynamically adjust network operations and resource allocations according to the real-time demand and the quality of service (QoS) required, reducing both the energy consumption and the carbon footprint [14,15].
Reinforcement learning (RL) has proven to be an effective approach for optimizing network energy consumption by learning control policies through interaction with dynamic environments [16], such as making decisions on the activation or deactivation of radio resources in response to varying traffic patterns. refine according to the paper: For example, [17] combines Q-learning with advanced sleep mode (ASM), proposing a time domain energy saving technique to gradually putting BS into different level of sleep. The Q-learning model intelligently decides how long to remain in different sleep mode to get better energy saving results without explicitly predicting traffic. This approach results in a 57% reduction in energy consumption. Similarly, for frequency domain, [18] introduces a RL agent to predict user traffic behavior and proactively activates just enough carriers to meet data demand, hence minimizing unnecessary energy use while preserving QoS. What’s more, Supervised learning can also be very useful in energy saving. In [19], a Neural Antenna Muting (NAM) is introduced to supervised a learning-based neural network able to predict the antenna configuration based on per-user channel and beamforming information, muting unnecessary antenna elements to minimize the energy consumption.
Building on the discussion of energy efficiency in 5G, this paper further explores a multi-domain radio resource shut-off scheme, integrating supervised learning models to dynamically adjust resource allocation for optimized energy savings.
3. 5G NR Testbed Model
3.1. Network Layout
In order to test our energy saving scheme, we have set up a 5G NR use-case model, with a NR-DC layout, through a master gNB utilizing carrier aggregation (CA), along with a secondary gNB for dual connectivity (DC). The master gNB controls a primary cell (PCell) using the n78 frequency band for both signaling and data traffic, while aggregating a secondary cell (SCell) using the n28 frequency band to provide extensive coverage for data traffic only. The n78 band is divided into three sectors, each covering a 120-degree arc to provide a complete coverage of the entire area. Meanwhile, the primary cell of the secondary gNB operates over a smaller area with higher capacity and lower latency, utilizing the mm-wave band n258. Need to mention that, the selected layout and network features are specific to our testbed setup. It is representative of practical and commonly used in 5G NR deployments, combining 5G low-band, mid-band and high-band frequency bands. This configuration allows us to evaluate the proposed energy-saving model in a realistic yet controlled scenario, with the methodology being extensible to other deployment variations. The network layout is depicted in Figure 2.
The main features for each cell in our layout are shown in Table 1.
3.1. Network Resource Feature
As for the simulation of our model, we have taken 2 frames, which equals to 20 milliseconds, to represent the time-frequency resource grid allocation within the 5G network. We have configured 4800 resource elements (REs) per DRB. In this paper, DRB is used as a key figure to evaluate the network traffic in a cell. It represents a data pipe in the RAN which transports data packets over a defined route. In subsequent sections, the number of DRBs will be an essential indicator for the QoS that the network can provide and the UE can demand. Based on that, both the cell throughput and the UE throughput figures can be estimated.
We have divided the n78 cell into 3 sectors to balance the coverage and capacity as mentioned above. Additionally, we have divided the n258 cell into 5 different BWPs (n258-1, n258-2, n258-3, n258-4 and n258-5). For a more efficient allocation of spectrum, each BWP can be dynamically assigned to users based on real-time traffic demands, ensuring that high-priority services receive the necessary resources while maintaining robust connectivity for all users.
Furthermore, we use the multi-layer antenna system to enhance network capacity and performance. It is implemented through Massive MIMO (Multiple Input Multiple Output) configurations, which enable better spatial multiplexing and improved signal quality. The detailed features for all resources in our network layout is summarized in Table 2.
4. Resources Allocation for Different Sleep Scheme
4.1. Resources Definition
Other contributions mainly focus on only one domain to deploy the sleep-mode scheme by shutting off unnecessary resources [9]-[13]. However, in our configuration, radio resources across time, frequency and antenna domain are all considered together. We combine different resource shutdown from different domains to configure the sleep-mode operation in each cell. The following radio resources were considered:
- Slot: Slot is a time domain resource. The duration of a slot can vary based on the subcarrier spacing, which ranges from 15 kHz to 240 kHz. To describe the scheme of our sleep states clearer, we have considered 10 slots as the scheduling time.
- Physical Channel: Synchronization Signal Block (SSB) is essential for communication and must be enabled in all cells. The Physical Data Shared Channel (PDSCH), Demodulation Reference Signal (DM-RS) and Phase Tracking Reference Signal (PT-RS) are all enabled in every cell to transfer data. However, the Physical Downlink Control Channel (PDCCH) is only enabled in cell n78 for signaling, while disabled in both n28 and n258 cause these two cells are only used for data traffic.
- Carrier: Carrier resources belong to the frequency domain. We have defined three different carriers in our network model, as shown in Table 2.
- Layer: In antenna domain, we configured that all cells use two antenna layers, except for the n78-2 cell, which utilizes four layers.
4.2. Resources Allocation in Each Cell
We have defined 7 sleep-states per layer for each cell, with different resources allocated for downlink and uplink data transmission. It is important to note again that the different resource allocation schemes for each sleep-state in this section are arbitrarily designed to simulate our 5G deployment scenario.
The n28 frequency band uses FDD, allowing all slots to be used for downlink transmission. Sleep-states of one layer in the n28 cell are shown in Table 3.
Differently, the n78 frequency band uses TDD, thus we use the first 6 slots for downlink data transmission while the rest 4 slots are employed for uplink. We have allocated different numbers of slots in different states. Sleep-states of the n78-x cell for one layer are shown in Table 4.
In n258 cell, we allocate different BWPs and slots in different states, while putting the rest into sleep. The n258 sleep states for one layer are shown in Table 5.
A view of resource grids for two frames under different sleep states configurations are depicted in Figure 3. In the resource grids, the green parts labeling PDSCH are the resources allocated in the sleep state used for downlink data transmission. The dark blue parts without labeling are the deactivated resources.
Figure 3 (a) shows the case of the resource grid at sleep state 3 in n258 cell. It can be observed that only the first 3 BWPs are carrying data while the 4th and 5th BWPs are put into sleep. Also, only 4 slots are activated and carrying data traffic in PDSCH, while the rest are put into sleep without using. There are SSBurst signals at the first slots of the grid while the PDCCH and CSI-RS are disabled. Figure 3 (b) shows the resource grid of the sleep state 4 in n78-2 cells. The n78-2 cell uses the 2nd BWP of the whole n78 frequency band (middle BWP in the grid). Only 4 slots in the 2nd BWP are activated and carrying data traffic in PDSCH while the rest are put into sleep without using. Since the n78 cells are used for signaling, the PDCCH and CSI-RS are enabled.
4.3. Sleep States Performance
According to the resource allocation scheme defined before, we compute the performance in every sleep state for each cell. The performance for each sleep state presented in this section is based on computational analysis using the selected layout and resource configurations, rather than derived from field measurements. Once again, we emphasize that the sleep states were arbitrarily defined to simulate a realistic deployment scenario. The goal is to estimate the potential energy savings associated with each sleep state under the assumptions made in our 5G NR model. Here, we just show the n258 cell as an example.
The power in Table 6 represents the relative power compared to the full-on downlink transmission power consumption in one layer. According to the network model, the n258 cell has two antenna layers. Thus, in layer 1 state 4, which is labelled as L1S4, the maximum number of DRBs that can be used in the simulated time interval is 635.
We consider that every layer has the same sleep-states and configurations. Thus, the relative downlink power for layer x and state y (labelled as LxSy) can be computed as:
5. UE Demand
To train and validate the AI-based energy optimization model, a dataset reflecting the UE traffic demand is required. However, in the absence of real-world traffic data from a live 5G network, we generated a synthetic dataset to model UE traffic demand. For this purpose, we developed a UE traffic model referred to as Radio Resource Control State Diagram (RRC-SD), allowing us to simulate realistic UE behavior under varying network load conditions. The resulting dataset quantifies UE demand in terms of the number of Data Radio Bearers (DRBs), as discussed in Section 3.
The DRB usage figures presented in this section reflect hypothetical—but realistic—traffic patterns, and are intended to be treated as real by the AI model. This synthetic approach allows us to evaluate the potential of the proposed energy-saving scheme in a controlled, yet practically meaningful, environment.
5.1. UE Model Using RRC Diagram
To provide a dataset for training and validation for our AI model, a UE traffic model was developed as shown in Figure 4.
When any user enters the 5G network in our model, i.e. it is switched on, it is firstly moved to the RRC-Idle state, where not any dedicated DRBs is established. We consider that every UE can have a transition action in a time interval, δ. Once connected, the UE can be in various RRC-Connected states depending on the number of established DRBs and signaling radio bearers (SRBs). In these states, every UE can progress from 1 to a number “n” of DRBs depending on REs required. Furthermore, UE can also transit back to RRC-Idle state, meaning RRC release, or can also transit to RRC-Inactive state, meaning RRC suspend. In RRC-Inactive state, the UE is in a low power mode with minimal signaling.
Once a UE enters the network, it initially resides in the RRC_ Idle state. After a random period of time, it changes to connected and begin moving between all RRC states with different transition probabilities. When there are a number of camped users on a cell high enough, according to the theory of Markov chains, the total demand of DRBs in the cell will tend to be stable over time.
According to the general RRC-SD scheme depicted in Figure 4, we define the next 6 different RRC states:
- RRC state1: RRC-Idle;
- RRC state2: RRC-Inactive;
- RRC state3: RRC-Connected with 1 DRB;
- RRC state4: RRC-Connected with 2 DRBs;
- RRC state5: RRC-Connected with 3 DRBs;
- RRC state6: RRC-Connected with 4 DRBs.
Thus, the RRC states diagram can be mathematically modelled as a transition matrix for every user which shows the probabilities of transitioning from one state to another. Each row represents a current state, and each column represents a possible next state.
To provide more realistic user traffic data, it is necessary to simulate UE with different activity patterns. As for convenience, we have created three types of users with different transition probabilities: 30% of type A users, which represent a type of hungry-data consuming user with more frequent transitions between high data transmission states (RRC-connected with 3 or 4 DRBs); 50% of type B users, which represent a type of normal-data consuming user with a moderate data transmission and occasional transitions to high data states; and a 20% of type C users, which represent light-data consuming users, mostly in RRC-Idle or RRC-Inactive states, with occasional low data transmission. Table 7 summarizes different transition probabilities for each user type.
Building on the previous general description, we specify the configurations for each cell in our network model layout. In n78-1 and n78-3 cells, we arbitrarily define three different states for RRC_CONNECTED. That is, we set the last connected state to void in the general RRC-SD of Figure 3. To achieve that, we set λ3 and μ3 to 0 in Table 7. In the n78-2 cell, we arbitrarily define two different states for RRC_CONNECTED. That is, we set the last two connected states to void in the general RRC states diagram, while we set λ2, λ3 and μ2, μ3 to 0. And, finally, in n258 cell, we define four different states for RRC_CONNECTED, just the same as the general RRC states diagram.
The DRB usage in different RRC connected states also vary from different cell areas as shown in Table 8. Network operators can easily modify these configurations to offer a varied quality of service (QoS) to UEs in its corresponding service area.
5.2. UE Distribution
To proceed with the simulation, we configured the distribution of UE populations across various cell areas based on the geographical layout of our network model. We incremented the user count by steps of 50. In the n78-1 and n78-3 cell areas, the number of users ranges from 50 to 400, while in the n78-2 cell area, the UE population ranges from 50 to 600. The n258 cell offers high capacity, so we can consider it as a densely populated area, with the number of users varying between 50 and 1,400.
5.3. UE Demand Results
We set the total simulation time to 500 time-units, with one time-unit equals to one frame (10ms). Every simulation was run for every distribution scenario, and the UE demand traffic data was stored for each one. All our results show that the DRB usage, in each cell, tends to be stable over time in all scenarios, so verifying that out RRC-SD model represents a Markov chain. In addition, we checked that the DRB usage in each cell approaches quite well to a normal statistical distribution.
Figure 5 below shows the particular result obtained for the most crowded scenario, where the UE distribution is [400,600,400,1400] users in each cell. That is, 400 in n78-1, 600 in n78-2, 400 in n78-3 and 1400 in n258. We refer this as the “worst scenario”. As shown in Figure 5, the DRB usage tend to be stable after a short period. Thus, we selected the [50, 500] time interval to present the statistical results.
Since the volume of information is too huge, we have just chosen the traffic forecasted in the n258 cell for the worst (most crowded) scenario as an example. The probability density function (PDF) and cumulative distribution function (CDF) for this case are shown in Figures 6 (a) and (b), respectively. We can observe how the DRB usage distribution approaches to a normal distribution. We have also marked the 99th-percentile value of the distribution, which represents the number of DRBs required to satisfy the traffic demand of at least 99% of users.
5.4. UE Demand Detaset
Following the simulation, we recorded the mean and standard deviation of next figures: DRB Usage, Cell Throughput, and UE Throughput for each cell across all distribution scenarios within our demand dataset. These data can be used in future works for the reproduction of the required UE demand distribution. Additionally, we stored the 99th-percentile value of these metrics, which indicates that 99 percent of user demands can be satisfied, for subsequent decision-making purposes.
In our dataset, the 99th-percentile value of the DRB usage is an important indicator. With this data, we can determine the number of DRBs that the RAN orchestrator should allocate as shown in Figure 1, and then determine the sleep state that our RAN testbed should be in. We stochastically select 70% of the dataset for training the AI model, which is designed to predict the appropriate sleep states as output for the 5G RAN under varying user distribution scenarios. The remaining 30% of the data is reserved for validation, where the model’s predicted sleep states are compared against the reference sleep states determined by the RAN orchestrator.
6. ML Model and Evaluation
6.1. Data Process
Starting from the 99th-percentile value of the UE DRB demand in each cell as the main feature in the entire dataset, along with the corresponding user number vector, a post-processed dataset in the format of [UserNum1, UserNum2, UserNum3, UserNum4, 99-percentile of DRB demand in n28, 99-percentile of DRB demand in n78-1, 99-percentile of DRB demand in n78-2, 99-percentile of DRB demand in n78-3, 99-percentile of DRB demand in n258] was setup as a baseline.
Then we matched the DRB usage data to their corresponding sleep states using the matching method explained in section IV to obtain the layer and sleep-mode for the n28, n78-1, n78-2, n78-3, and n258 cells. As a result, we got the dataset for the Machine Learning model with the format: [UserNum1, UserNum2, UserNum3, UserNum4, LxSy in n28, LxSy in n78-1, LxSy in n78-2, LxSy in n78-3, LxSy in n258].
According to the geographical layout of our 5G RAN model, the usage of DRBs in each cell is affected by the UE population in different cell areas. The DRB usage in the n28 cell is affected by the number of users in cells n78-1, n78-2, and n78-3. The DRB usage in the n78-2 cell is affected by the population in n78-2 and n258 cell areas. The DRB usages in n78-1, n78-3 and n258 cells are affected by their own cell area. Therefore, we set a ML model for each cell with their corresponding input features to predict their DRB usage.
Finally, we used the holdout validation method, reserving 30% of data in the dataset for validation, while using the remaining 70% of data to train the model.
6.2. ML Model Selection for Our Case
Since our data was labeled based on the expected sleep states with different UE population, we tested commonly used supervised learning models. Given the multi-class nature of our classification task, it was crucial to ensure that the selected ML models were well-suited for this specific scenario.
Another key consideration was computational efficiency. With a sampling interval of 500 time-units (equivalent to one unit per frame or 5 seconds in total) we needed to ensure that the chosen model could operate efficiently within this time constraint. Therefore, we evaluated five different classic ML models, as shown in Table 9, and we analyzed their performance independently.
Considering both accuracy and computation time obtained in training and validation, the ML model with best performance indicators among all five was the decision tree (DT) model with Classification and Regression Tree (CART) algorithm. Consequently, this model was the selected candidate for the AI to be integrated into the original 5G RAN scheme, in Figure 1, for energy optimization.
7. Results
7.1. ML Model Accuracy Results
In our simulation, the n258 cell has the best performance with a validation accuracy of 97.7 % while the rest of cells have results around 80 % of validation accuracy. Taking the average of the 5 cells’ accuracy results, we got an overall training accuracy for our decision tree model of 85.1 %, and an overall validation accuracy of 84.7 %.

Table 10.
Accuracy of our ML model in each cell.
| n258 | n78-1 | n78-2 | n78-3 | n28 | |
|---|---|---|---|---|---|
| Training Accuracy | 97.33% | 87.19% | 77.33% | 86.77% | 76.67% |
| Validation Accuracy | 97.66% | 87.37% | 76.53% | 87.07% | 75.03% |
7.2. Energy Saving Results
Due to the lack of real UE population data to test our ML-based energy saving scheme, we have selected two user scenarios from our validation dataset to illustrate the energy saving achieved. These are the UE distributions: [250, 300, 200, 800] and [400, 600, 400, 1400]. They represent, respectively, an average case, named as “normal scenario”, and a crowded case, named as “worst scenario”. Using the formula shown in Section IV to compute relative power consumption, the power saving results for the normal and the worst scenarios were computed. We took power figures for every cell as defined in Section III before.
Final results achieved with our Decision Tree CART algorithm resource allocation scheme for energy saving were quite promising. The normal scenario consumes 57.7% of the full-on downlink transmission power consumption, thus saving 42.3% power. While the worst scenario saves 6.69% of the full-on downlink transmission power consumption.
8. Conclusions
This paper proposes an energy consumption optimization scheme based on a decision tree ML model with CART algorithm. A generic 5G inter-band NR-DC architecture was introduced as a testbed to validate the approach. On top of that, we defined a sleep-mode scheme, considering multi-domain radio resource shut off for the 5G NR. Then, we configured a UE profile and generated UE demand dataset in every cell through a newly proposed RRC-SD stochastic model. Using the dataset, we trained five ML models, getting a validation accuracy of 84.7% to dynamically predict the corresponding RAN sleep states based on different UE demand. Our ML-based multi-domain resource allocation scheme achieved 42.3 % energy consumption reduction in the normal UE demand scenario.
Compare to previous studies that primarily focus on ML-based single-domain radio resource management, our work considers multi-domain radio resource coordination, offering a more comprehensive approach to energy saving. In addition, we address the limitation of lacking real-environment data by proposing a novel RRC-SD model to generate a synthetic UE traffic dataset. While this dataset effectively enables training and evaluation of our scheme, it is not as variant as the UE traffic observed in real-world scenarios. As future work, we plan to incorporate real-environment UE traffic data to further validate our proposed sleep scheme in real 5G RAN deployments. Furthermore, we can explore the use of reinforcement learning models for our proposed energy saving scheme in the more diverse and dynamic real-world environments.
Supplementary Materials
The following supporting information can be downloaded at the website of this paper posted on Preprints.org, Table S1: Energy saving performance for n28 cell; Table S2: Energy saving performance for n78-1/3 cell; Table S3: Energy saving performance for n78-2 cell; Figure S1: Overall Accuracy for KNN model with different k values; Figure S2: Distribution of DRB usage by different user types in worst scenario.
Author Contributions
Conceptualization, X.Y. and A.P.-Y.; methodology, X.Y. and A.P.-Y.; software, X.Y. and A.P.-Y.; validation, X.Y.; formal analysis, X.Y. and A.P.-Y.; investigation, X.Y. and A.P.-Y.; resources, X.Y. and A.P.-Y.; data curation, X.Y.; writing—original draft preparation, X.Y.; writing—review and editing, X.Y. and A.P.-Y.; visualization, X.Y. and A.P.-Y.; supervision, A.P.-Y.; project administration, X.Y. All authors have read and agreed to the published version of the manuscript.
Funding
This work was funded by the Spanish Ministry for Digital Transformation and the Civil Service under a State competitive program to support the acquisition of research infrastructure and promote research projects on 5G advanced in the framework of the “Programa UNICO I+D 6G 2023”, grant number TSI-064100-2023-0006.
Institutional Review Board Statement
Not applicable.
Informed Consent Statement
Not applicable.
Data Availability Statement
Data is contained within the article or supplementary materials.
Conflicts of Interest
The authors declare no conflicts of interest.
References
- M. J. Shehab, I. Kassem, A. A. Kutty, M. Kucukvar, N. Onat and T. Khattab. 5G Networks Towards Smart and Sustainable Cities: A Review of Recent Developments, Applications and Future Perspectives. In IEEE Access, vol. 10, pp. 2987-3006, 2022. [CrossRef]
- L. Banda, M. Mzyece and F. Mekuria. 5G Business Models for Mobile Network Operators—A Survey. In IEEE Access, vol. 10, pp. 94851-94886, 2022. [CrossRef]
- Ericsson Breaking the Energy Curve Report 2022: 5G network success can be achieved in an energy efficient way. Oct. 2022, [Online]. Available: https://www.ericsson.com/en/news /2022/10/ericsson-publishes-breaking-the-energy-curve-report-2022 [Last access date: 22 Feb 2025].
- A. Fehske, G. Fettweis, J. Malmodin and G. Biczok. The global footprint of mobile communications: The ecological and economic perspective. In IEEE Communications Magazine, vol. 49, no. 8, pp. 55-62, August 2011. [CrossRef]
- R. Tan, Y. Shi, Y. Fan, W. Zhu and T. Wu. Energy Saving Technologies and Best Practices for 5G Radio Access Network.In IEEE Access, vol. 10, pp. 51747-51756, 2022. [CrossRef]
- X. Yao. Energy Consumption Optimization in 5G RAN: A Dual Perespective from BS to UE. M.S. Thesis, Dept. ETSIST, UPM, Madrid, Spain, 2024.
- D. López-Pérez et al. A Survey on 5G Radio Access Network Energy Efficiency: Massive MIMO, Lean Carrier Design, Sleep Modes, and Machine Learning. IEEE Communications Surveys & Tutorials, vol. 24, (1), pp. 653-697, 2022. [CrossRef]
- 3GPP. Study on network energy savings for NR (Release 18), 3GPP TR 38.864 V18.1.0. Mar. 2023. [Online]. Available: http://www.3gpp.org.
- F. E. Salem, T. Chahed, Z. Altman and A. Gati. Traffic-aware Advanced Sleep Modes management in 5G networks. 2019 IEEE Wireless Communications and Networking Conference (WCNC), Marrakesh, Morocco, 2019, pp. 1-6. [CrossRef]
- T. Islam, D. Lee and S. S. Lim. Enabling Network Power Savings in 5G-Advanced and Beyond. In IEEE Journal on Selected Areas in Communications, vol. 41, no. 6, pp. 1888-1899, June 2023. [CrossRef]
- 3GPP. Management and orchestration; Energy efficiency of 5G, 3GPP TS 28.310 V18.5.0. July 2024. [Online]. Available: http://www.3gpp.org.
- D. Laselva, S. Hakimi, M. Lauridsen, B. Khan, D. Kumar and P. Mogensen. On the Potential of Radio Adaptations for 6G Network Energy Saving. 2024 Joint European Conference on Networks and Communications & 6G Summit (EuCNC/6G Summit), Antwerp, Belgium, 2024, pp. 1157-1162. [CrossRef]
- V. Khodamoradi, A. Sali, A. A. Salah, B. M. Ali, R. S. A. R. Abdullah and I. Krikidis. Energy Efficient Base Station Transmit Power Adaptation for Green 5G Massive MIMO Systems. 2019 IEEE 89th Vehicular Technology Conference (VTC2019-Spring), Kuala Lumpur, Malaysia, 2019, pp. 1-6. [CrossRef]
- D. Ghosh and S. H. Bharathi. Energy consumption saving in 5G network based on artificial intelligence. 2023 International Conference for Advancement in Technology (ICONAT), 2023,. [CrossRef]
- ITU. Environmental Efficiency of AI-based Systems. 2021. [Online]. Available: https://www.itu.int/en/ITU-T/focusgroups/ai4ee/Documents/T-FG-AI4EE-2021-D.WG3.02-PDF-E.pdf. [Accessed: 30-Jun-2024].
- D. Wu et al., “Energy Saving in Cellular Wireless Networks via Transfer Deep Reinforcement Learning,” GLOBECOM 2023 - 2023 IEEE Global Communications Conference, Kuala Lumpur, Malaysia, 2023, pp. 7019-7024. [CrossRef]
- F. E. Salem, Z. Altman, A. Gati, T. Chahed and E. Altman, “Reinforcement Learning Approach for Advanced Sleep Modes Management in 5G Networks,” 2018 IEEE 88th Vehicular Technology Conference (VTC-Fall), Chicago, IL, USA, 2018, pp. 1-5. [CrossRef]
- M. Elsayed et al., “Reinforcement Learning Based Energy-Efficient Component Carrier Activation-Deactivation in 5G,” 2021 IEEE Global Communications Conference (GLOBECOM), Madrid, Spain, 2021, pp. 1-6. [CrossRef]
- N. Rajapaksha, J. Mohammadi, S. Wesemann, T. Wild and N. Rajatheva. Minimizing Energy Consumption in MU-MIMO via Antenna Muting by Neural Networks with Asymmetric Loss. in IEEE Transactions on Vehicular Technology, 2024, vol. 73, no. 5, pp. 6600-6613. [CrossRef]
Figure 1.
Operational principle of the proposed model.
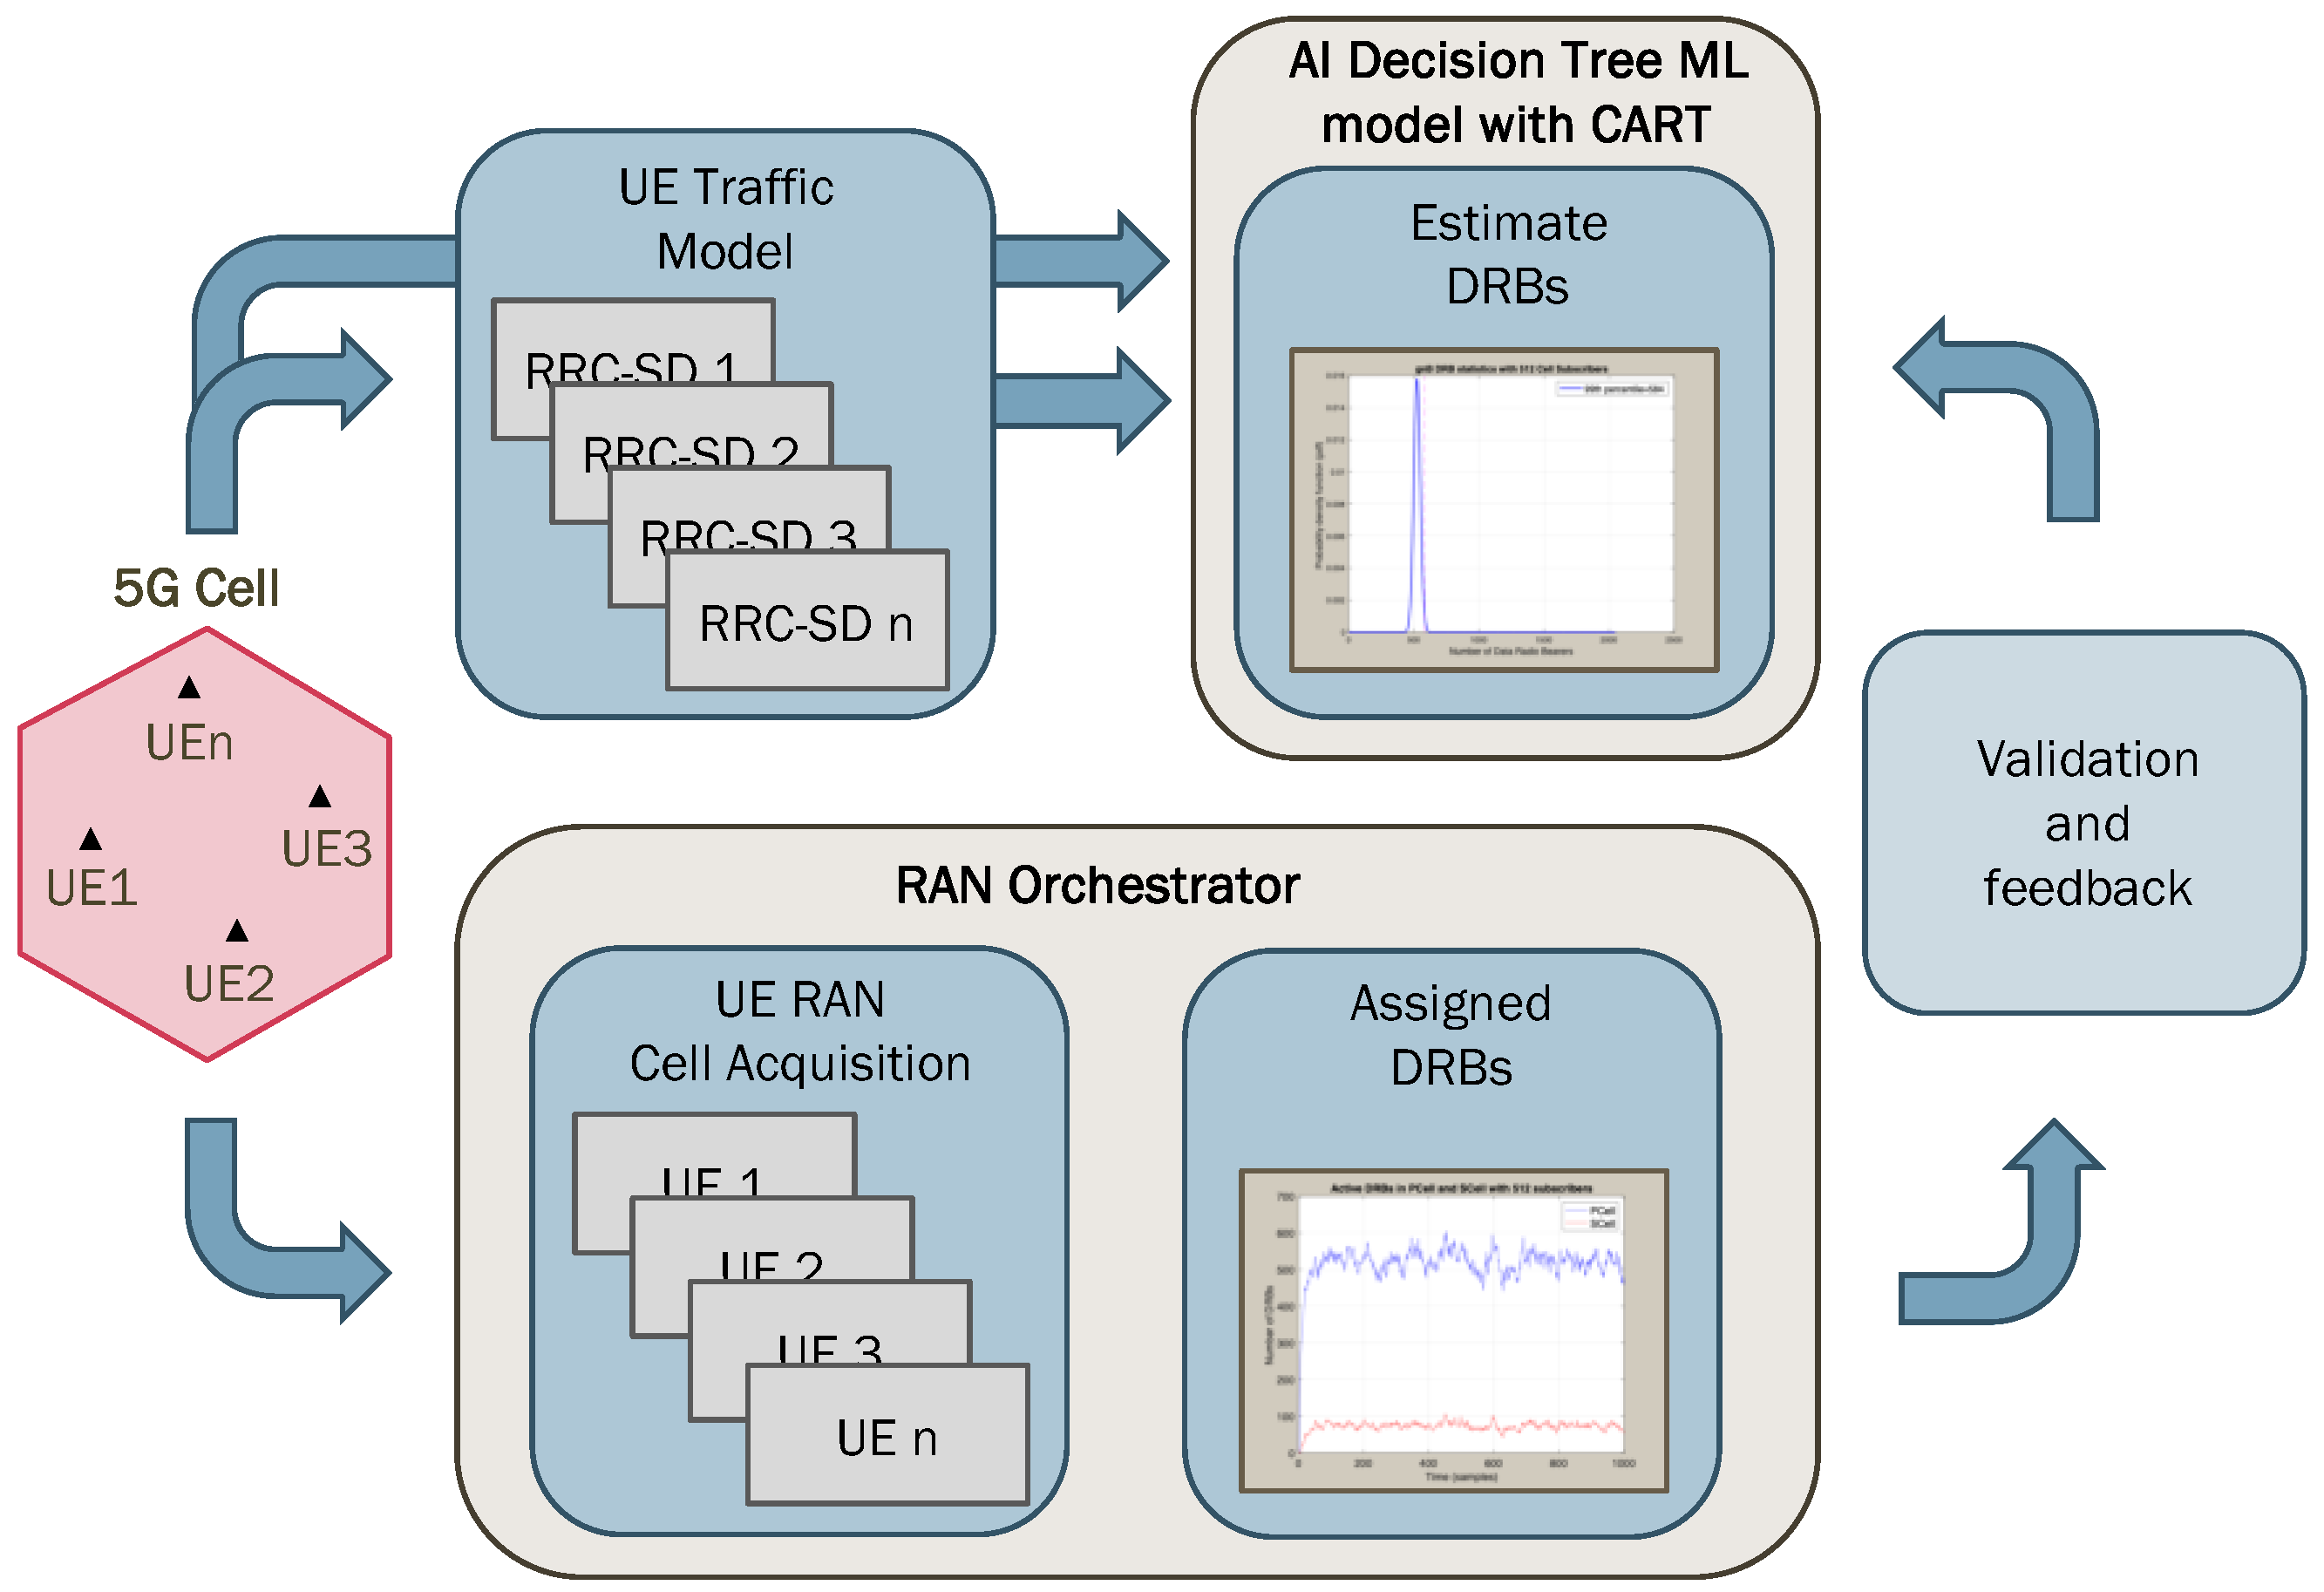
Figure 2.
5G NR network model layout.
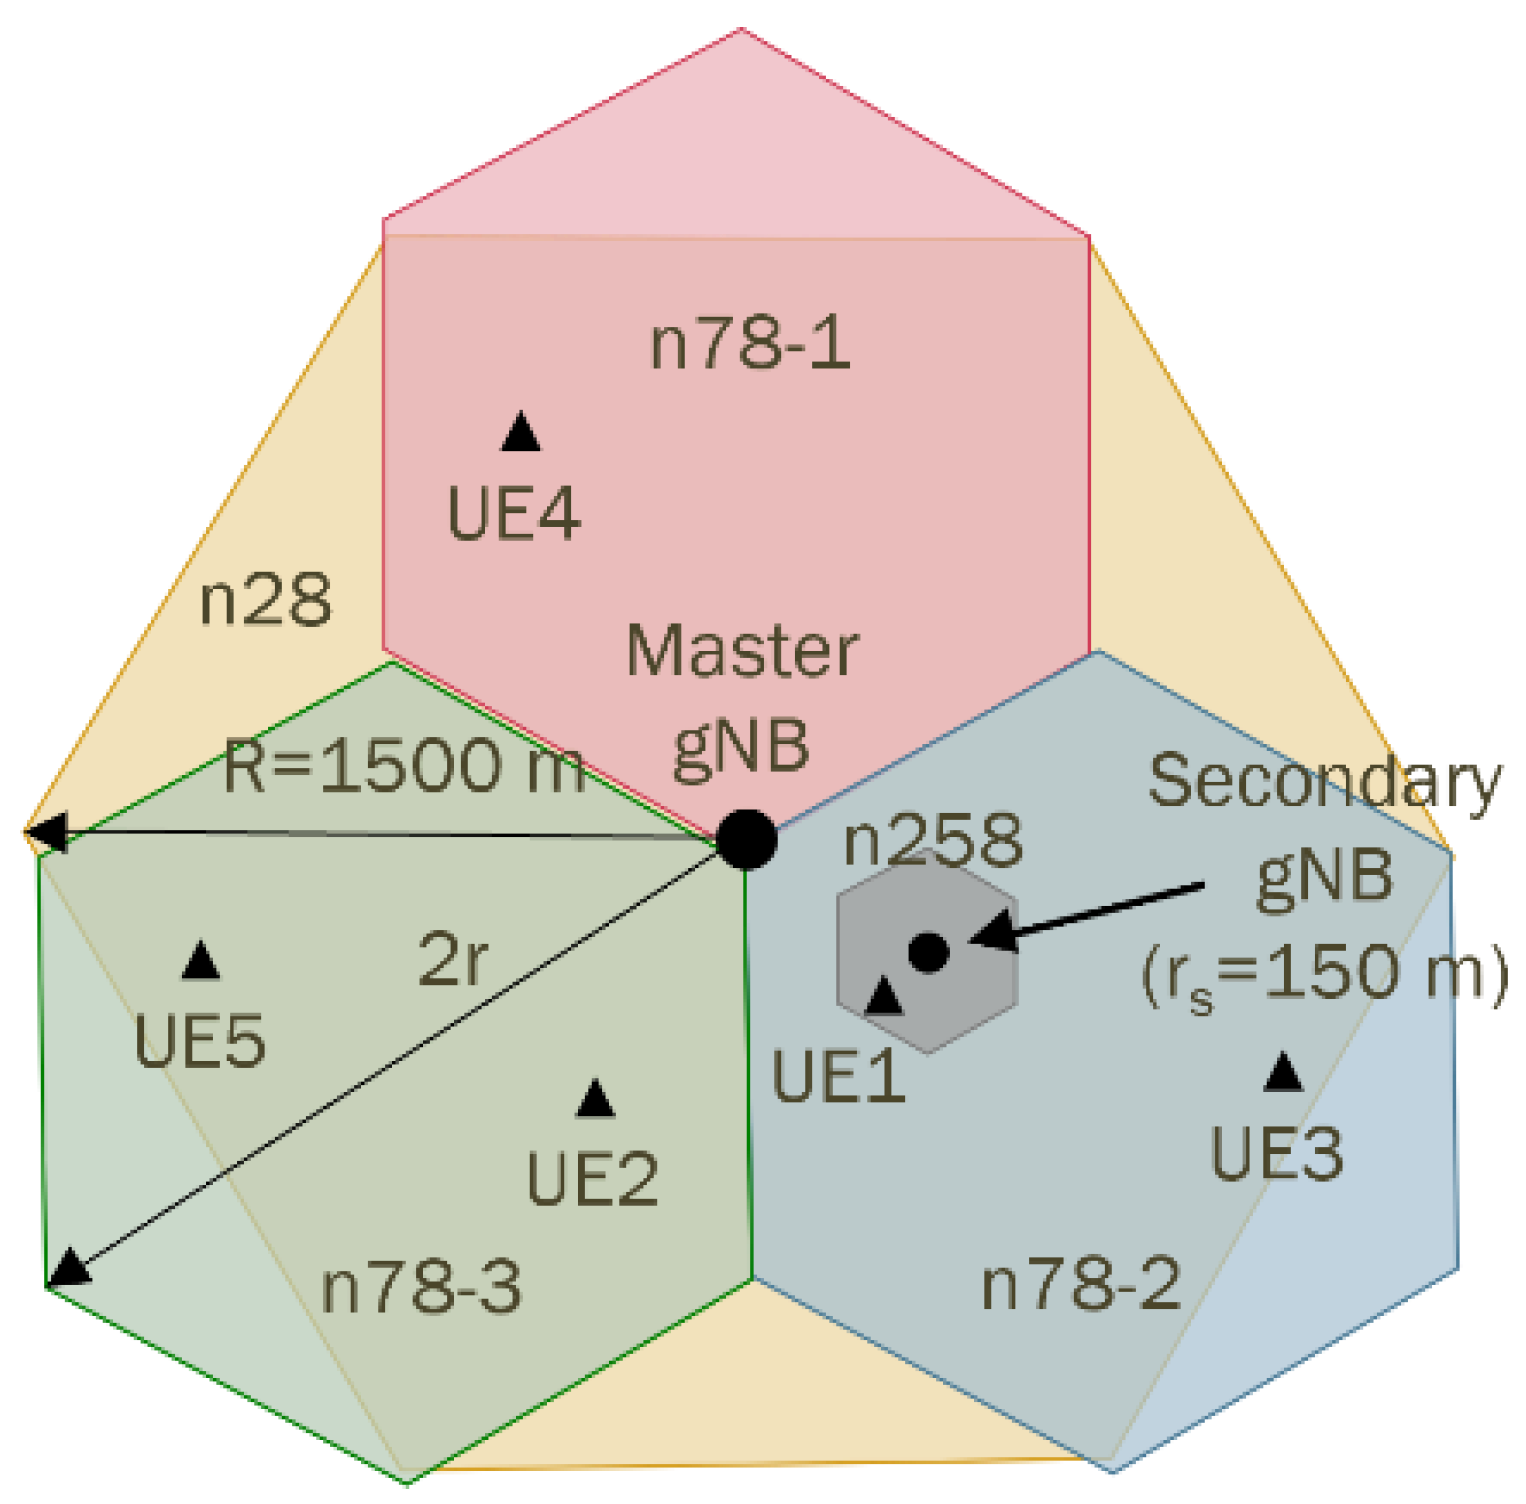
Figure 3.
Examples of resource grid using our proposed sleep schemes: (a) Sleep state 3 in n258 cell; (b) Sleep state in n78-2 cell.
Figure 3.
Examples of resource grid using our proposed sleep schemes: (a) Sleep state 3 in n258 cell; (b) Sleep state in n78-2 cell.
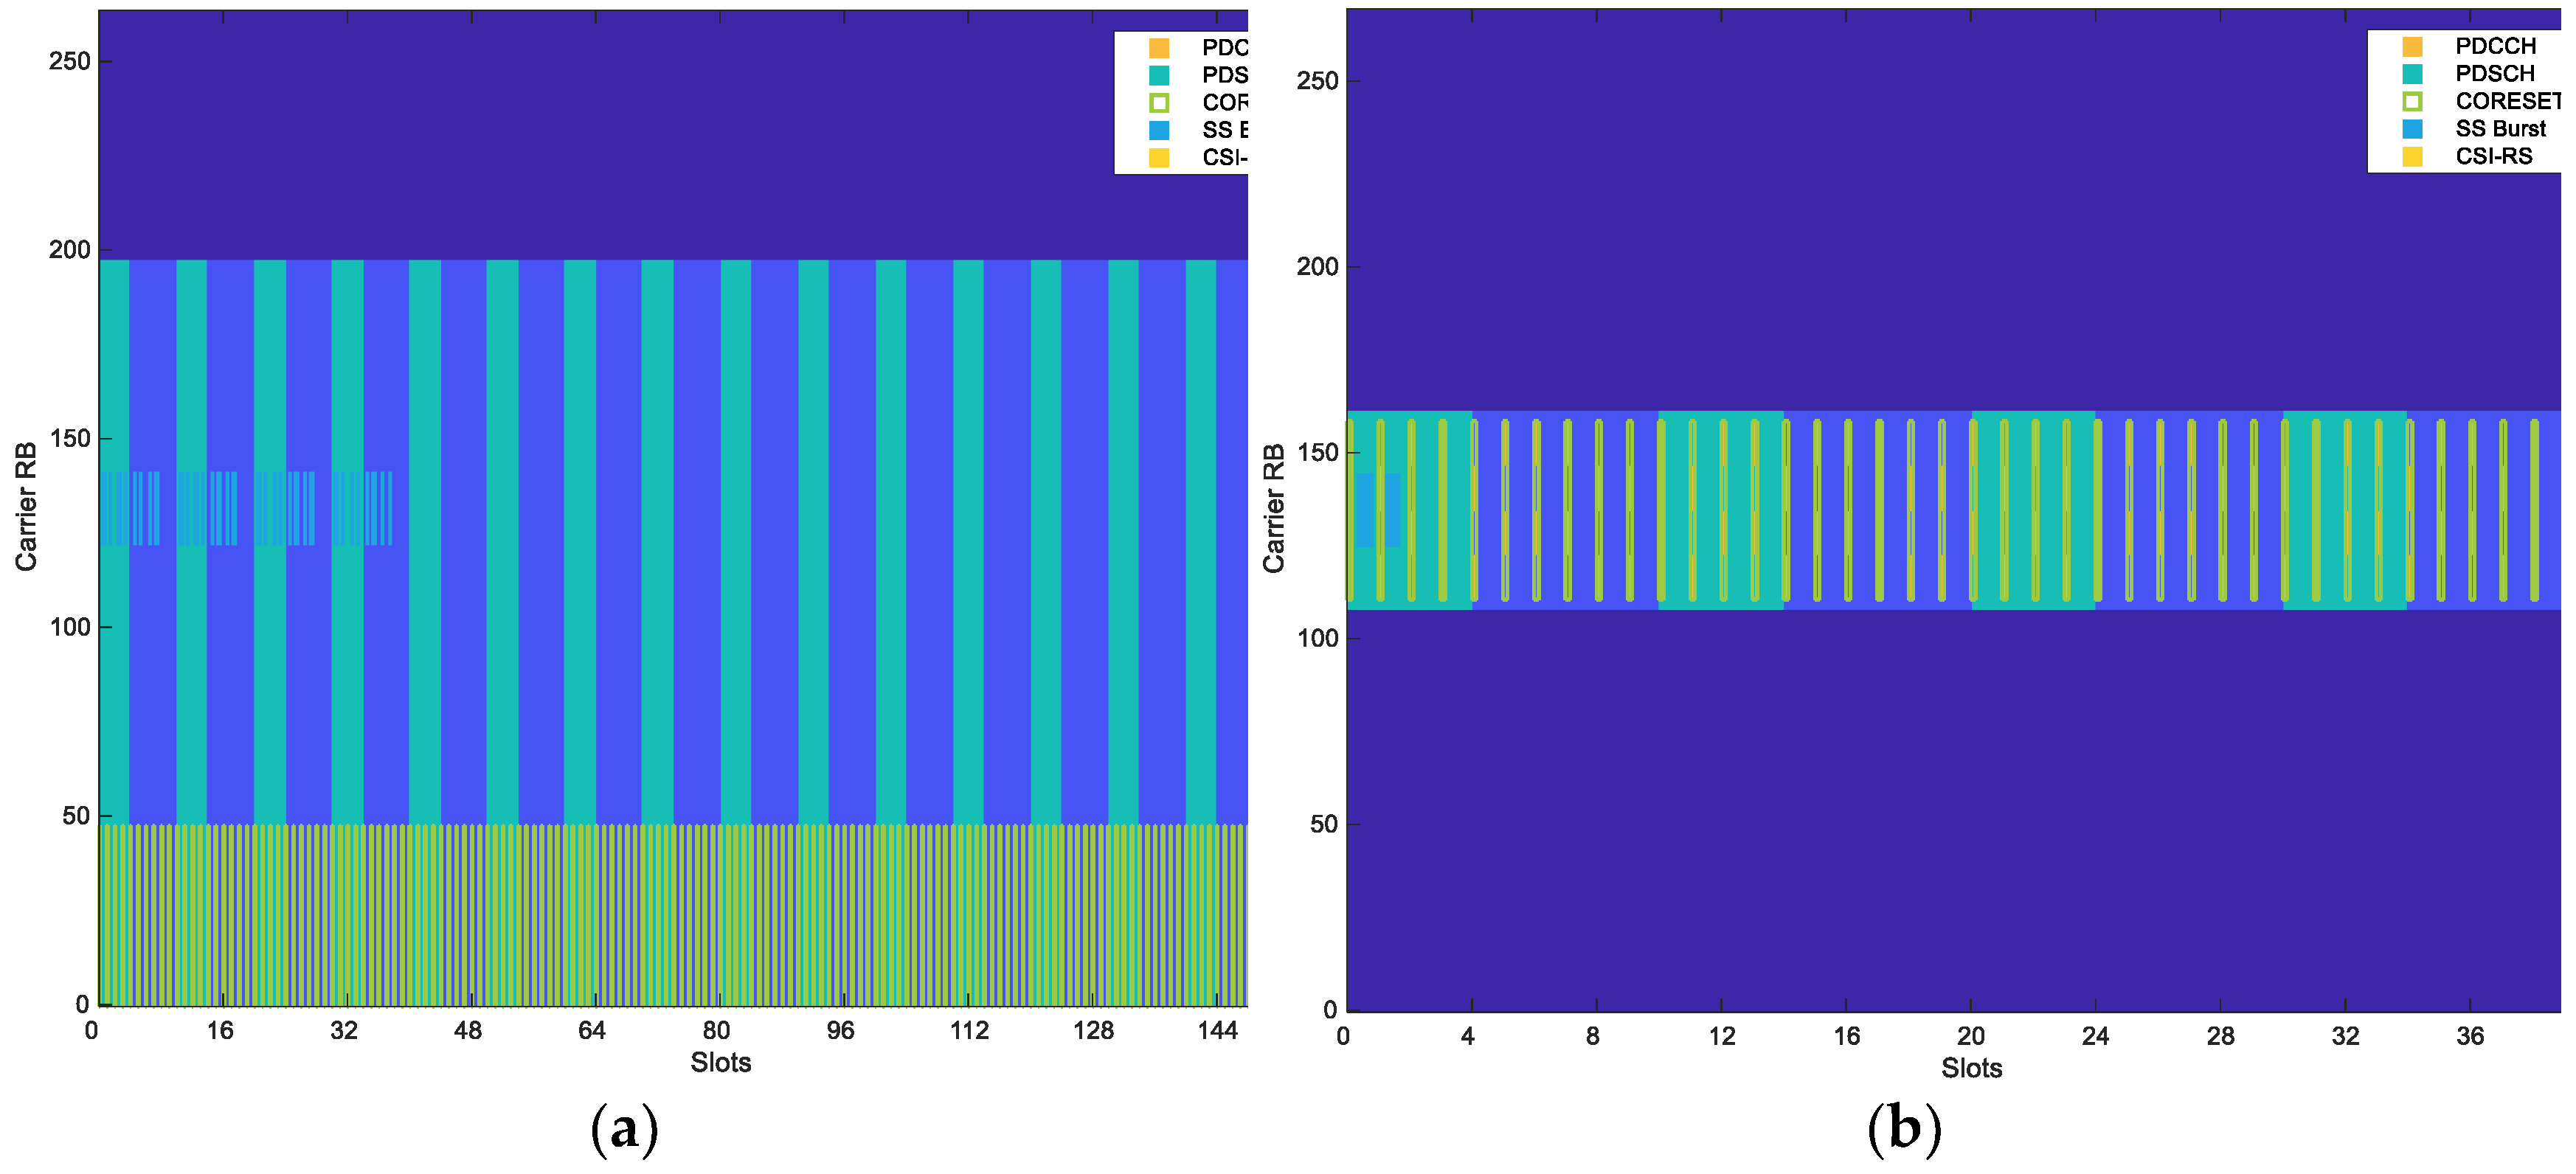
Figure 4.
The general RRC States Diagram (RRC-SD) for our UE model.
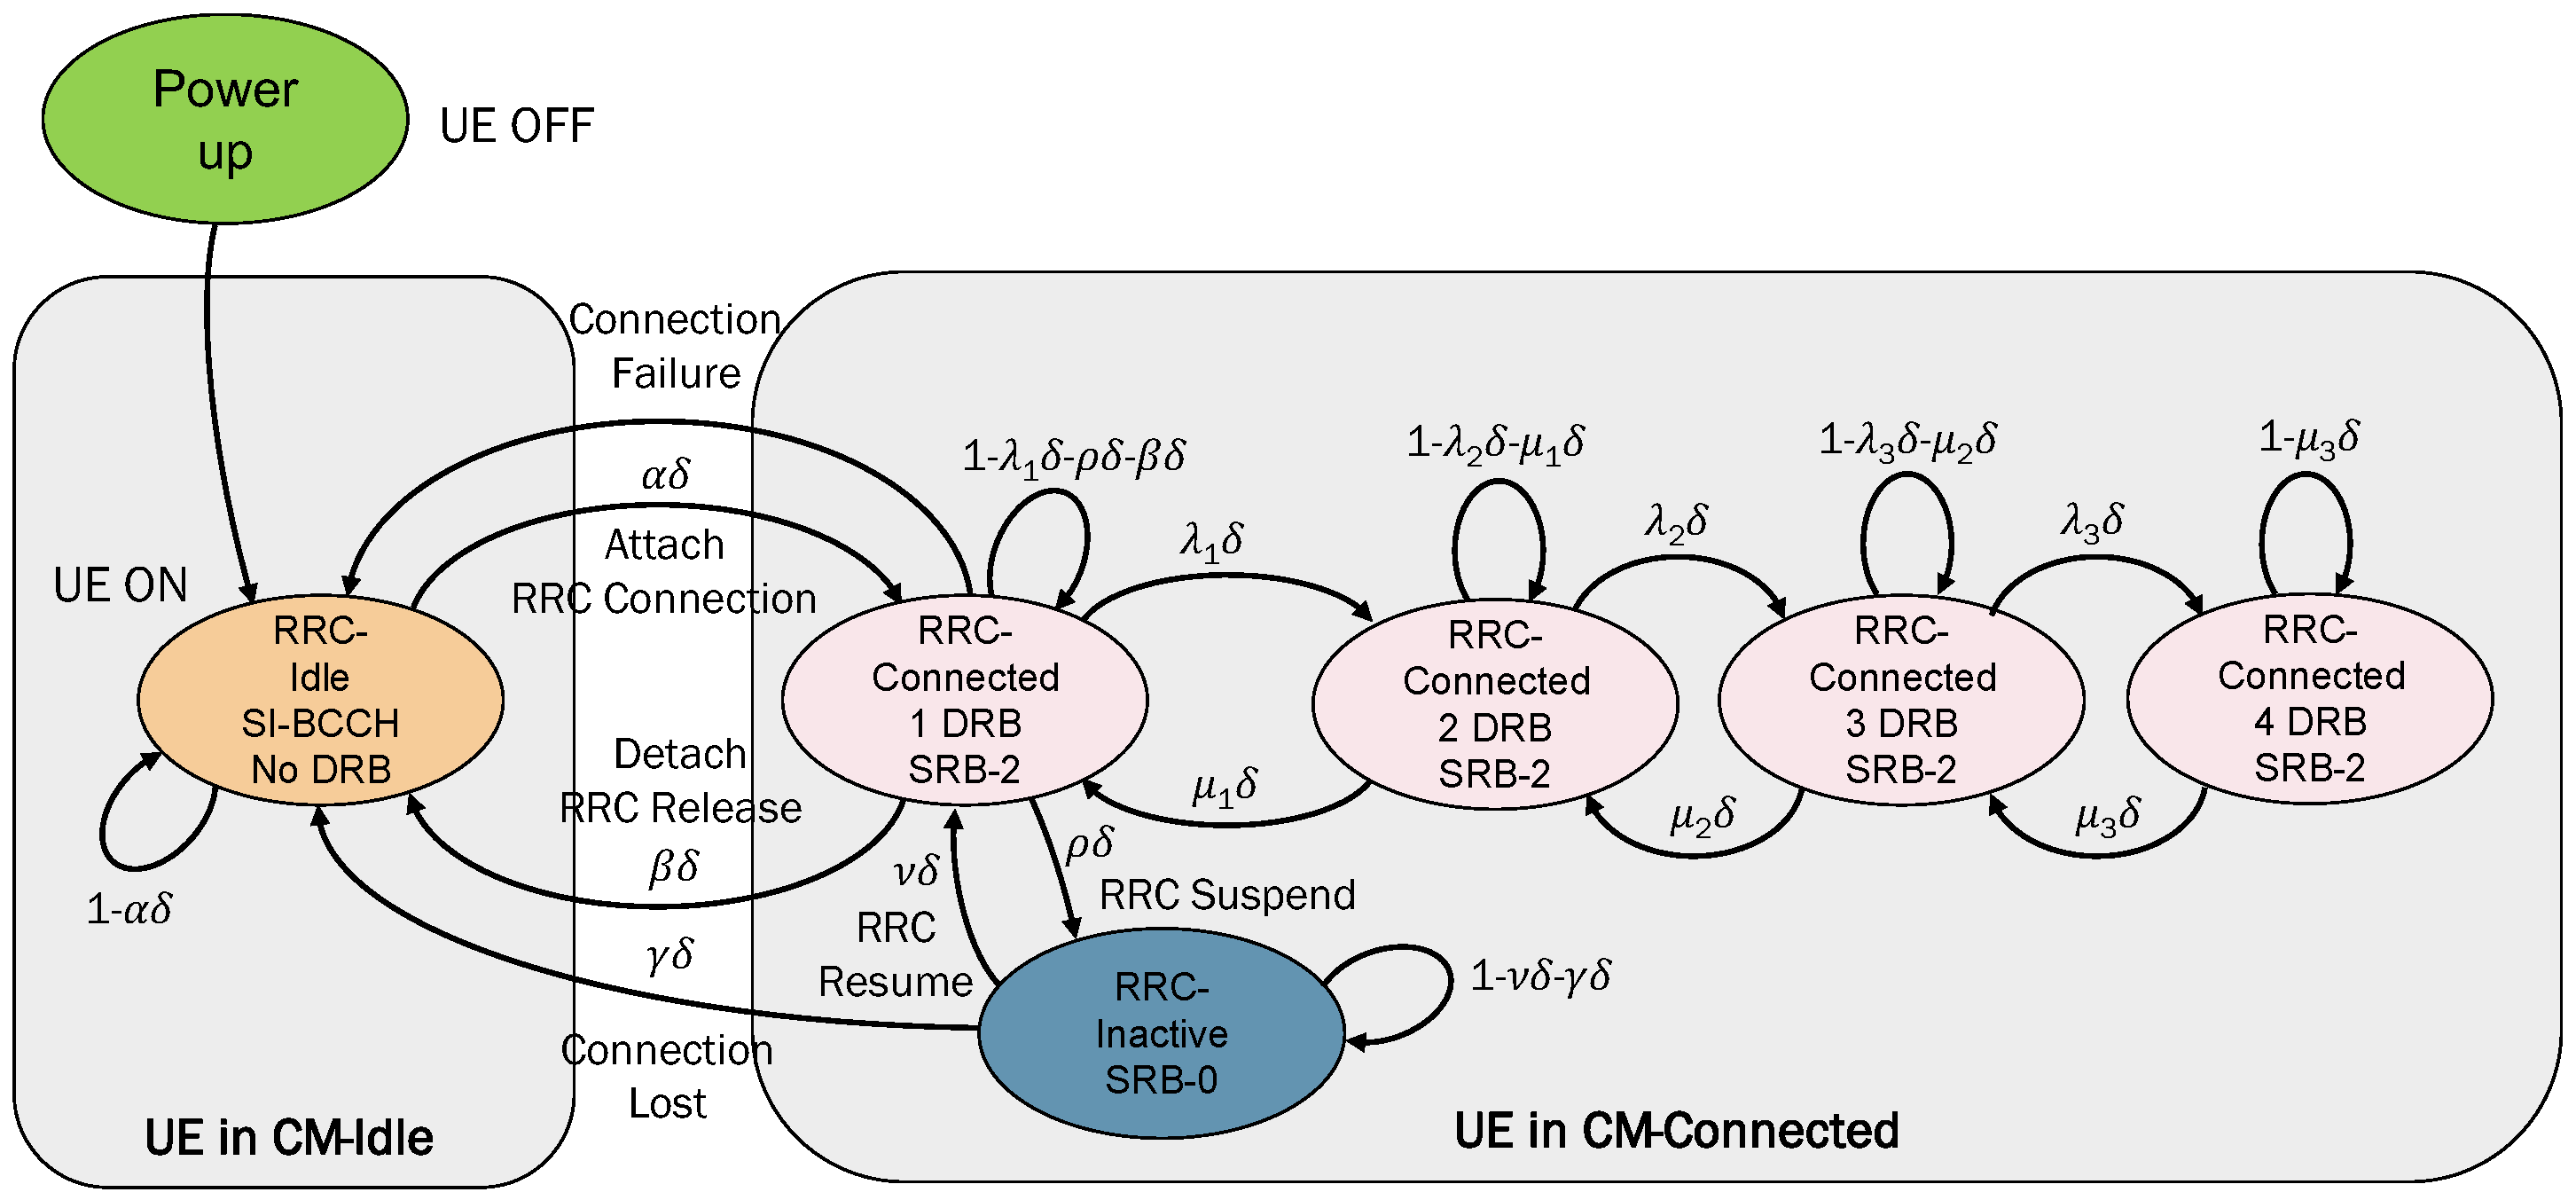
Figure 5.
DRB usage of the n258 cell along time.
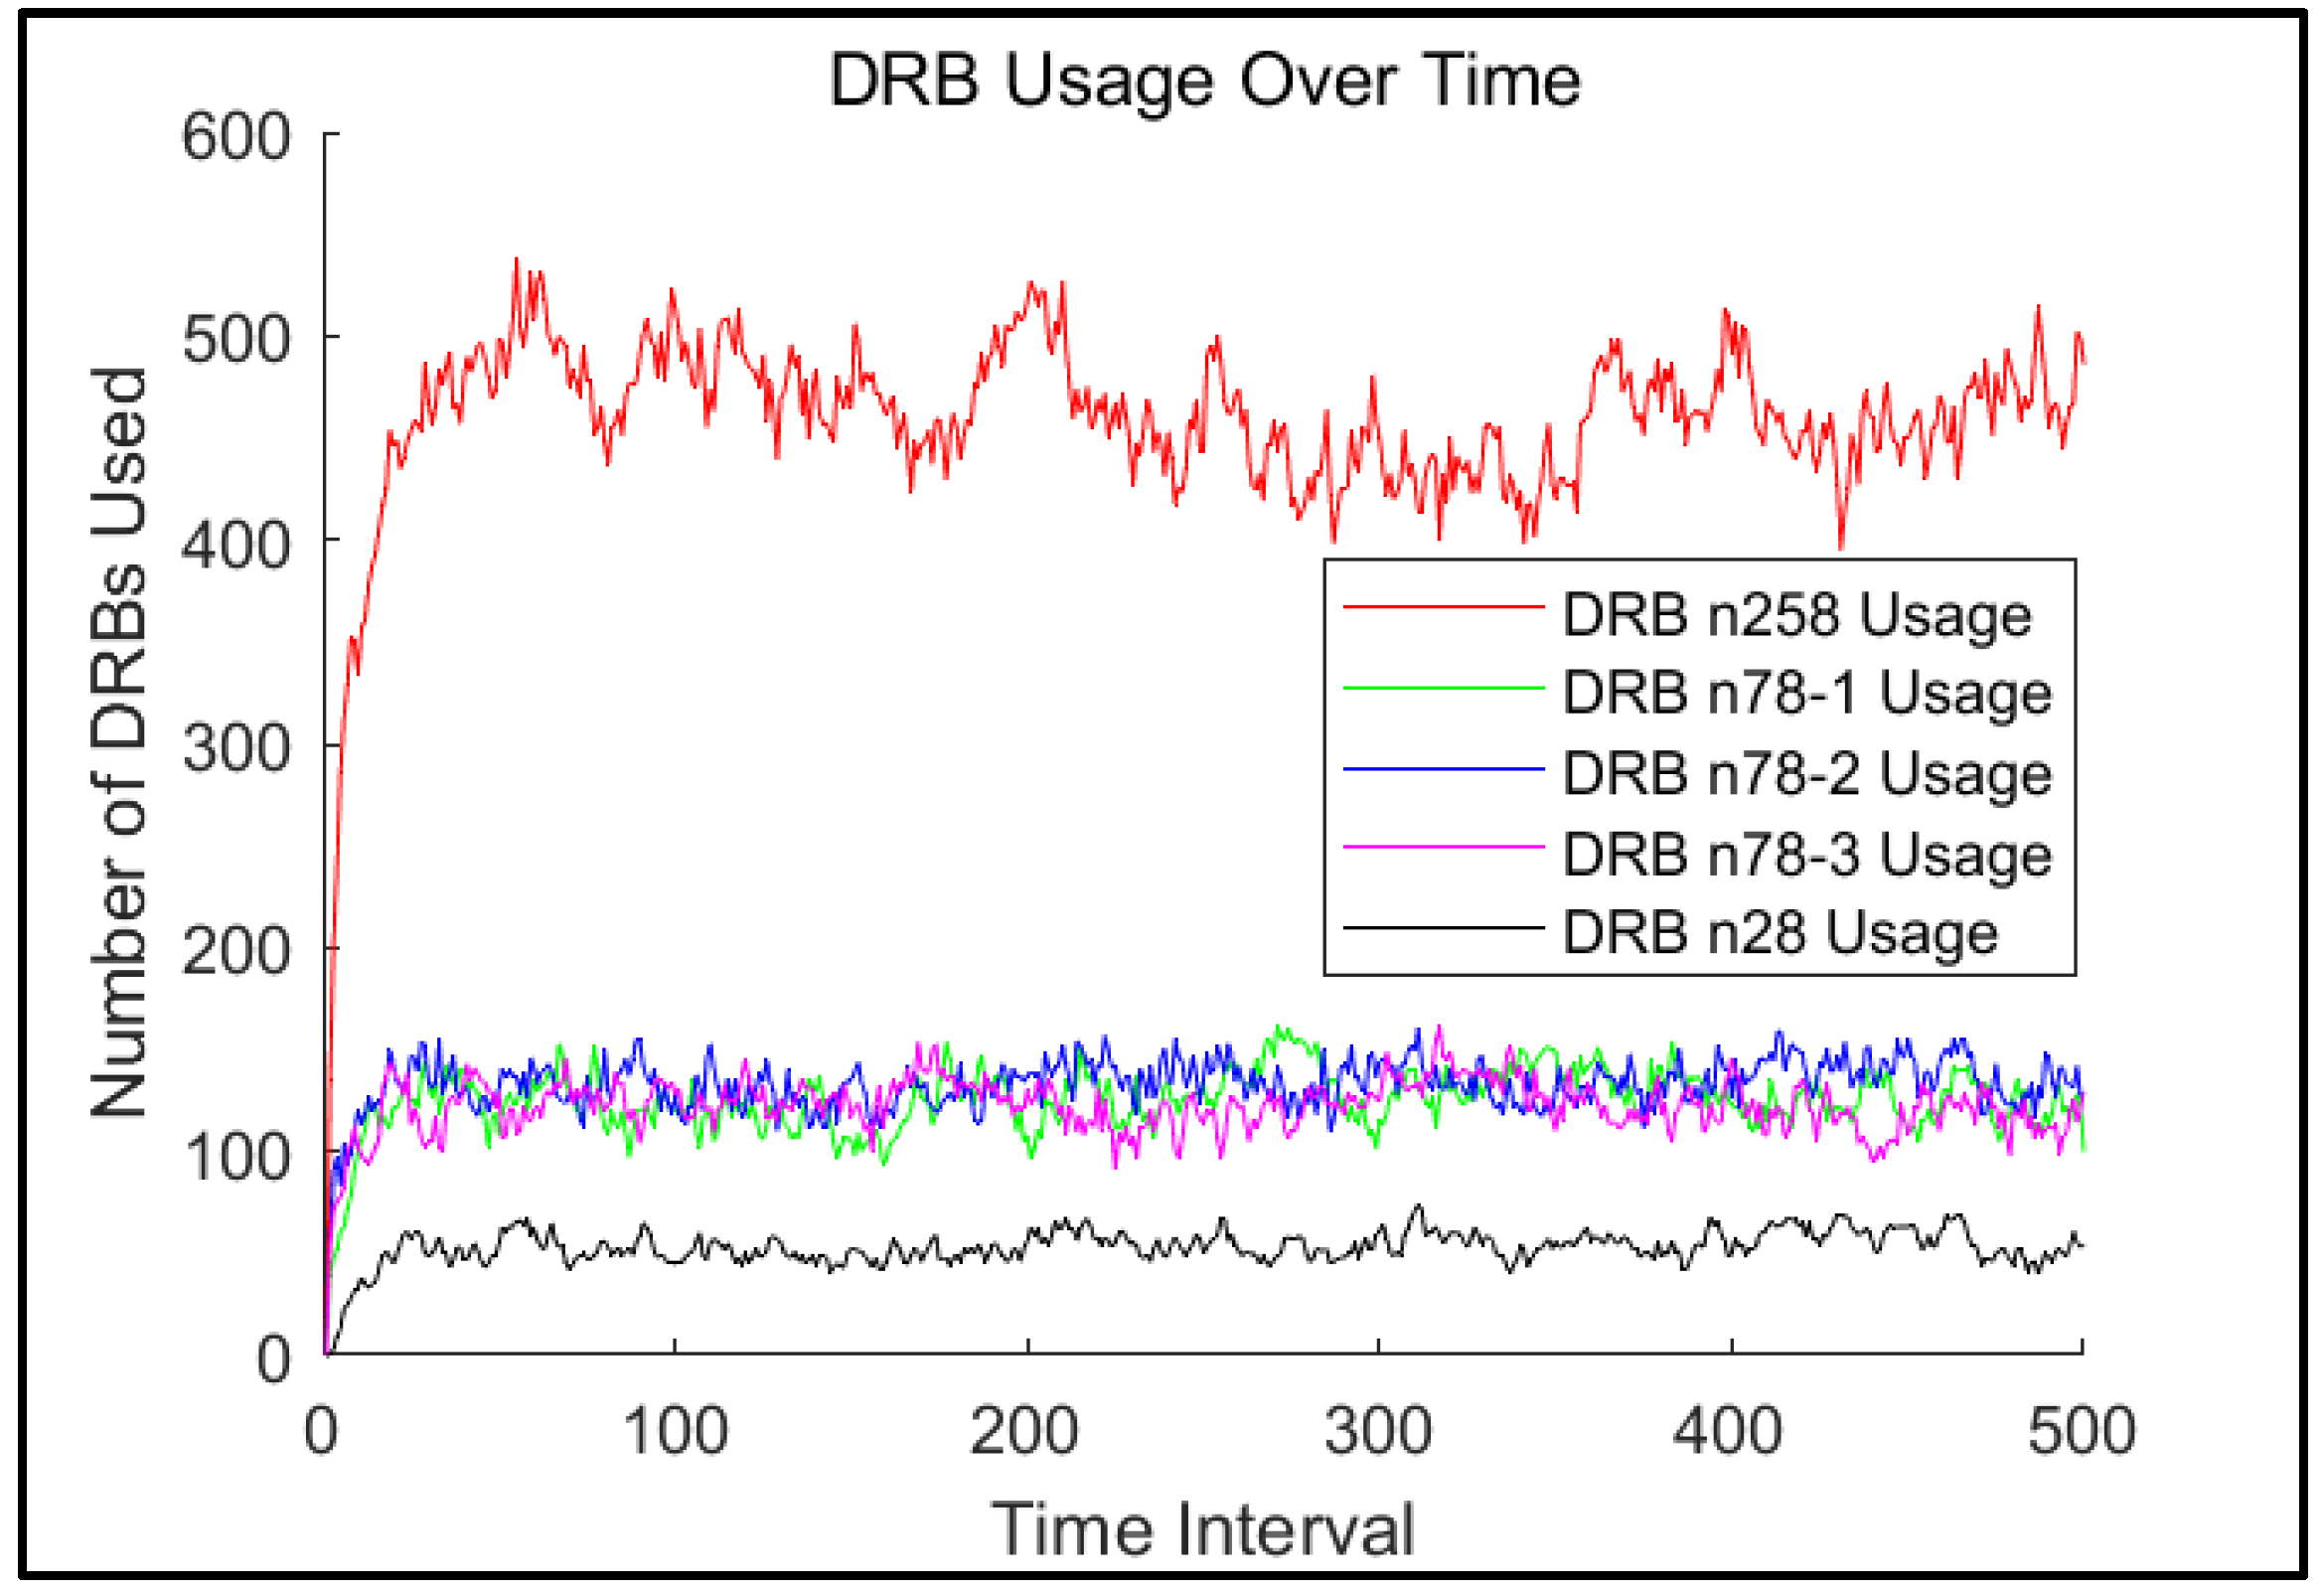
Figure 6.
DRB usage distribution of the n258 cell in worst scenario: (a) PDF distribution; (b) CDF distribution.
Figure 6.
DRB usage distribution of the n258 cell in worst scenario: (a) PDF distribution; (b) CDF distribution.
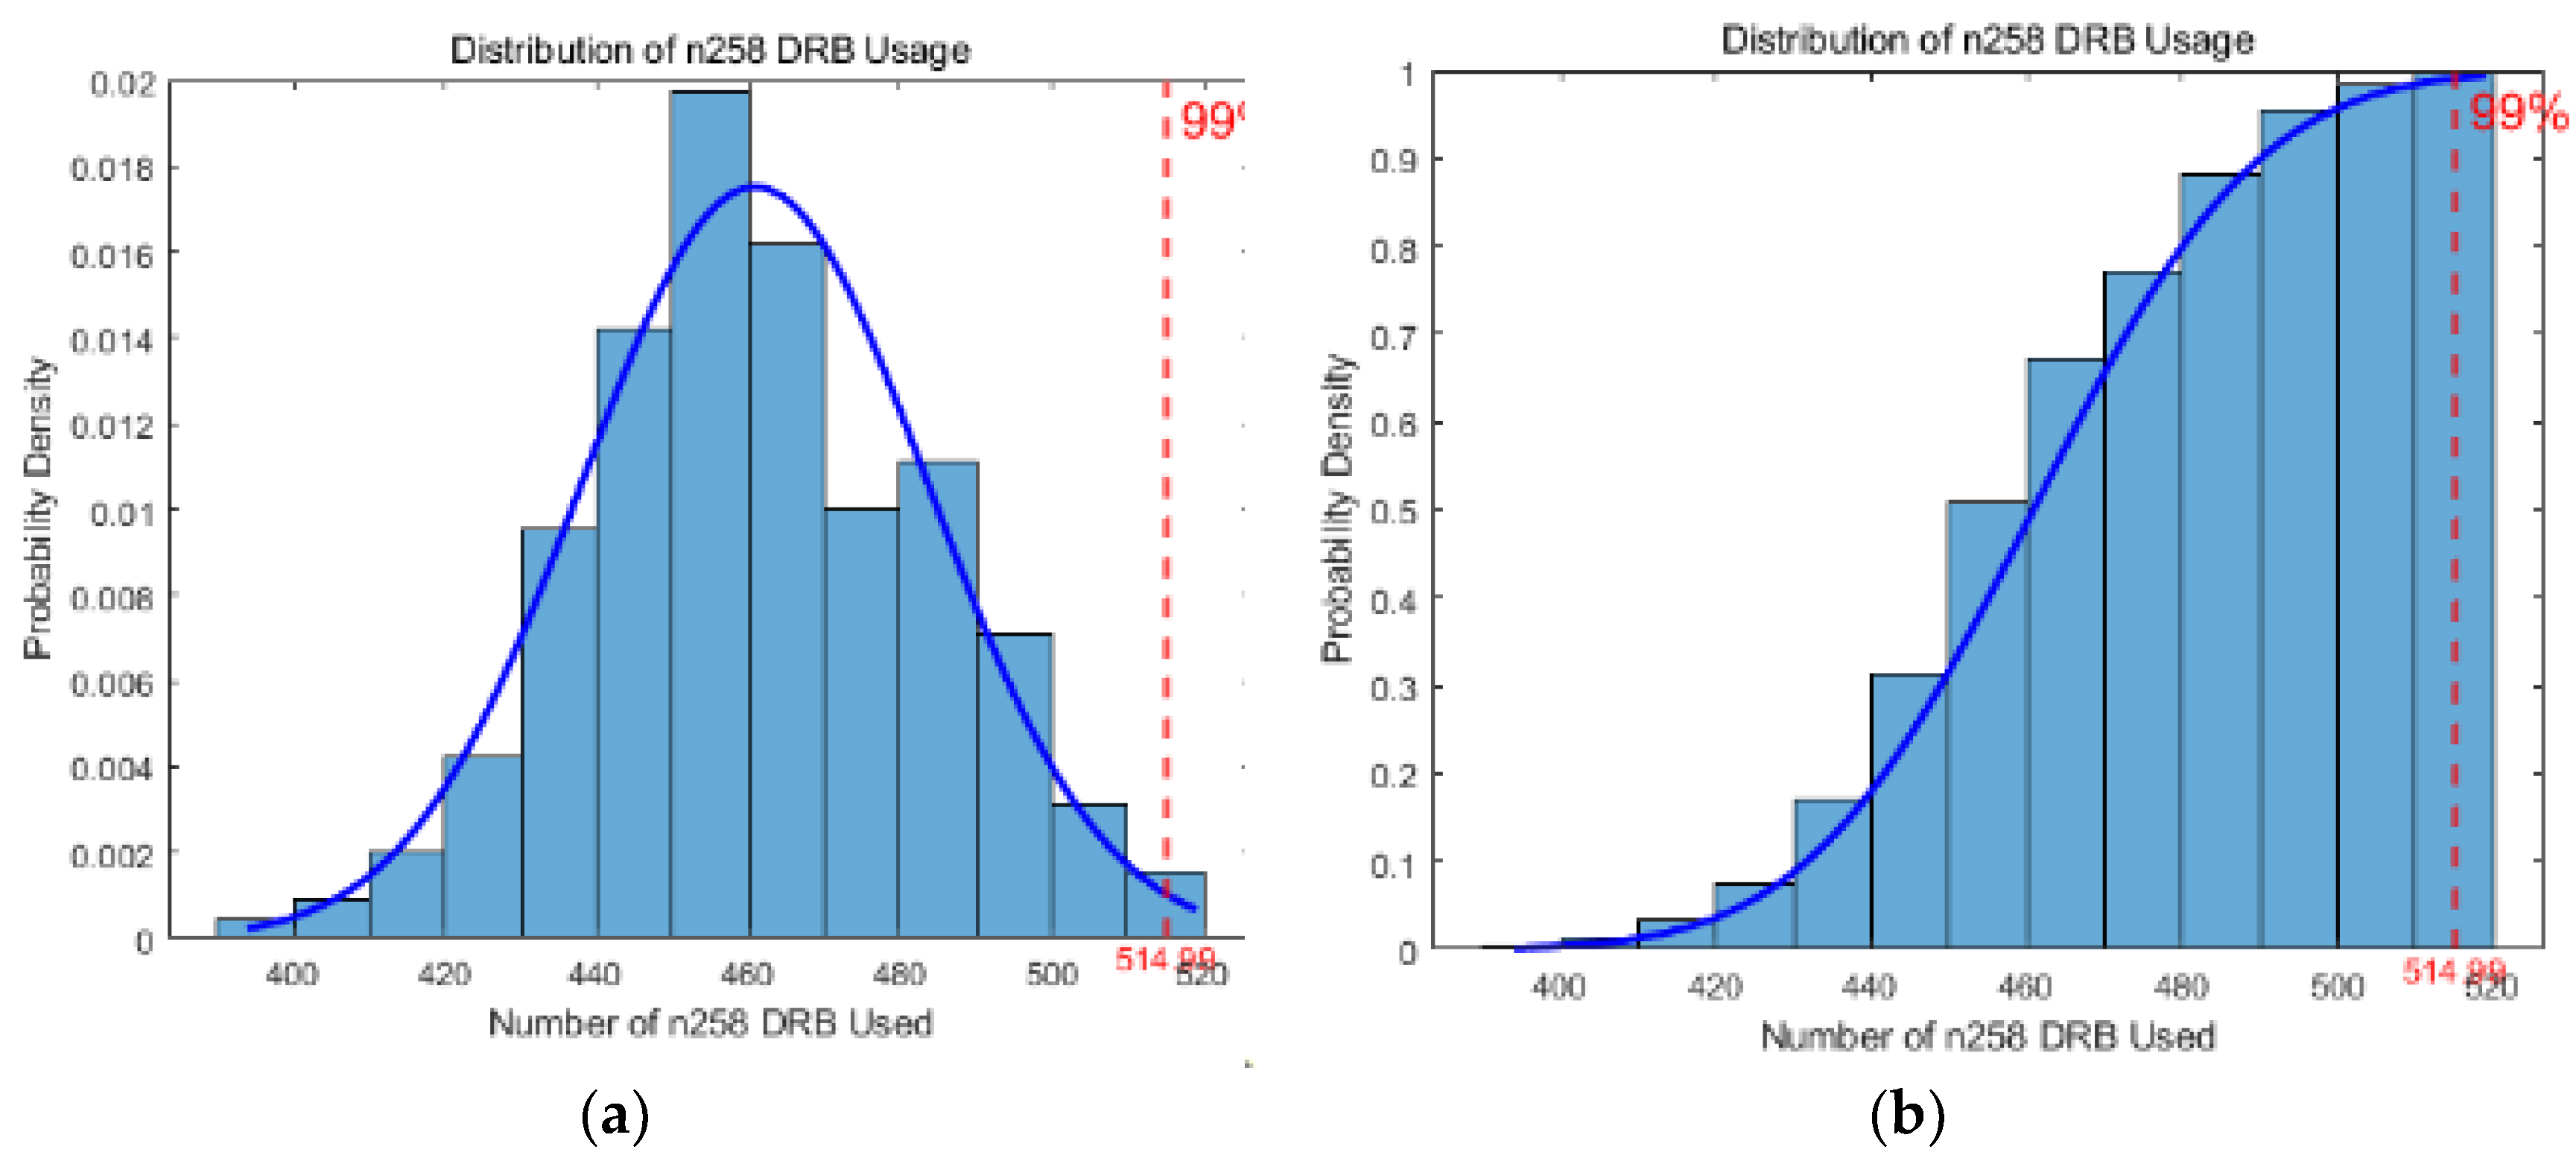
Table 1.
Features of every cell in the 5G RAN testbed.
| Frequency band |
BW (MHz) |
TDD/FDD | SCS (kHz) |
μ | Slots/ frame |
RBs | Antenna |
|---|---|---|---|---|---|---|---|
| n28 | 10 | FDD | 15 | 0 | 10 | 52 | omni |
| n78 | 100 | TDD | 30 | 1 | 20 | 273 | sector |
| n258 | 400 | TDD | 120 | 3 | 80 | 264 | omni |
Table 2.
Features of resources in the 5G NR testbed.
| Resources | BW (MHz) |
BWP | RBs | Slots/ frame |
Layers | Antenna | Power (W)1 |
|---|---|---|---|---|---|---|---|
| n28 | 10 | 1 | 52 | 10 | 2 | Omni | 5 |
| n78-1 | 40 | 1 | 109 | 20 | 2 | Sector | 5 |
| n78-2 | 20 | 2 | 55 | 20 | 4 | Sector | 5 |
| n78-3 | 40 | 3 | 109 | 20 | 2 | Sector | 5 |
| n258-1 | 120 | 1 | 79 | 80 | 2 | Omni | 3 |
| n258-2 | 100 | 2 | 66 | 80 | 2 | Omni | |
| n258-3 | 80 | 3 | 53 | 80 | 2 | Omni | |
| n258-4 | 60 | 4 | 40 | 80 | 2 | Omni | |
| n258-5 | 40 | 5 | 26 | 80 | 2 | Omni |
1 The power values listed are derived from empirical configurations and practical deployment experience in our testbed. They are intended to reflect realistic operational parameters but not standardized.
Table 3.
Sleep scheme for n28 cell.
| State | Slot | |||||||||
|---|---|---|---|---|---|---|---|---|---|---|
| 0 | 1 | 2 | 3 | 4 | 5 | 6 | 7 | 8 | 9 | |
| 0 | ||||||||||
| 1 | DL | |||||||||
| 2 | DL | DL | ||||||||
| 3 | DL | DL | DL | DL | ||||||
| 4 | DL | DL | DL | DL | DL | DL | ||||
| 5 | DL | DL | DL | DL | DL | DL | DL | DL | ||
| 6 | DL | DL | DL | DL | DL | DL | DL | DL | DL | DL |
Table 4.
Sleep scheme for n78-x cell.
| State | Slot | |||||||||
|---|---|---|---|---|---|---|---|---|---|---|
| 0 | 1 | 2 | 3 | 4 | 5 | 6 | 7 | 8 | 9 | |
| 0 | ||||||||||
| 1 | DL | UL | ||||||||
| 2 | DL | DL | UL | |||||||
| 3 | DL | DL | DL | UL | UL | |||||
| 4 | DL | DL | DL | DL | UL | UL | ||||
| 5 | DL | DL | DL | DL | DL | UL | UL | UL | ||
| 6 | DL | DL | DL | DL | DL | DL | UL | UL | UL | UL |
Table 5.
Sleep scheme for n258 cell.
| State | BWP | Slot | ||||||||
|---|---|---|---|---|---|---|---|---|---|---|
| 1 | 2 | 3 | 4 | 5 | 0 | 1 | 2 | 3 | 4 | |
| 0 | ||||||||||
| 1 | DL | DL | DL | |||||||
| 2 | DL | DL | DL | DL | DL | |||||
| 3 | DL | DL | DL | DL | DL | DL | DL | |||
| 4 | DL | DL | DL | DL | DL | DL | DL | DL | DL | |
| 5 | DL | DL | DL | DL | DL | DL | DL | DL | DL | DL |
| 6 | DL | DL | DL | DL | DL | DL | DL | DL | DL | DL |
Table 6.
Energy saving performance for n258 cell.
| State | BW (MHz) | DL slots | UL slots | Relat. Power | PDSCH (kREs/s) |
PDCCH (kREs/s)2 |
DRB (bearer/s) | DRB in grid |
|---|---|---|---|---|---|---|---|---|
| 0 | 28.90 | 0 | 0 | 0.02 | 0 | 0 | 0 | 0 |
| 1 | 113.88 | 2 | 2 | 0.12 | 20476.8 | 0 | 4266 | 85 |
| 2 | 208.92 | 3 | 3 | 0.28 | 55248.0 | 0 | 11510 | 230 |
| 3 | 285.48 | 4 | 4 | 0.50 | 101155.2 | 0 | 21075 | 422 |
| 4 | 343.20 | 5 | 5 | 0.75 | 152352.0 | 0 | 31740 | 635 |
| 5 | 380.76 | 5 | 5 | 0.83 | 169200.0 | 0 | 35250 | 705 |
| 6 | 380.76 | 6 | 6 | 1 | 203054.4 | 0 | 42303 | 846 |
2 PDCCH throughput in n258 cell is always 0, because in our network model definition, this cell is just used for data traffic, so we disabled the PDCCH signal. Similarly, we defined in n28 cell.
Table 7.
Transition probabilities of UE.
| Transition | RRC Action | Type A (30%) | Type B (50%) | Type C (20%) |
|---|---|---|---|---|
| α | Attach | 0.14 | 0.08 | 0.06 |
| β | Detach | 0.18 | 0.18 | 0.18 |
| λ1 | DRB+ | 0.10 | 0.06 | 0.03 |
| λ2 | DRB+ | 0.04 | 0.03 | 0.02 |
| λ3 | DRB+ | 0.02 | 0.02 | 0.01 |
| μ1 | DRB- | 0.14 | 0.16 | 0.18 |
| μ2 | DRB- | 0.16 | 0.18 | 0.20 |
| μ3 | DRB- | 0.18 | 0.20 | 0.22 |
| ρ | Suspend | 0.30 | 0.30 | 0.30 |
| γ | Release | 0.04 | 0.04 | 0.04 |
| υ | Resume | 0.14 | 0.08 | 0.06 |
Table 8.
DRB usage in each cell area.
| Cell | Connected State 1 |
Connected State 2 |
Connected State 3 |
Connected State 4 |
|---|---|---|---|---|
| n78-1 | 1 n78-1 DRB | 2 n78-1 DRB | 2 n78-1 DRB 1 n28 DRB |
Void |
| n78-2 | 1 n78-2 DRB | 1 n78-2 DRB 1 n28 DRB |
Void | Void |
| n78-3 | 1 n78-3 DRB | 2 n78-3 DRB | 2 n78-3 DRB 1 n28 DRB |
Void |
| n258 | 1 n258 DRB | 2 n258 DRB | 3 n258 DRB | 3 n258 DRB 1 n28 DRB |
Table 9.
Comparison of ML models.
| ML model | Training accuracy |
Validation accuracy |
Computation time (s) |
|---|---|---|---|
| Decision tree (CART) | 85.06% | 84.73% | 0.22 |
| Decision tree (ID3) | 85.06% | 84.73% | 1.20 |
| KNN (k=4)3 | 84.17% | 84.01% | 0.53 |
| Random forest | 85.04% | 84.72% | 6.60 |
| RBF SVM | 85.06% | 84.74% | 13.84 |
3 The reason to choose k factor as 4 can be seen in supplementary material.
Disclaimer/Publisher’s Note: The statements, opinions and data contained in all publications are solely those of the individual author(s) and contributor(s) and not of MDPI and/or the editor(s). MDPI and/or the editor(s) disclaim responsibility for any injury to people or property resulting from any ideas, methods, instructions or products referred to in the content. |
© 2025 by the authors. Licensee MDPI, Basel, Switzerland. This article is an open access article distributed under the terms and conditions of the Creative Commons Attribution (CC BY) license (http://creativecommons.org/licenses/by/4.0/).
Copyright: This open access article is published under a Creative Commons CC BY 4.0 license, which permit the free download, distribution, and reuse, provided that the author and preprint are cited in any reuse.


