
Submitted:
23 June 2025
Posted:
25 June 2025
You are already at the latest version
Abstract
The air injection for brine drainage affects the thermodynamic characteristics of the salt cavern in the operation of a compressed air energy storage (CAES). To investigate the impact of air injection and brine drainage on the thermodynamic characteristics of salt cavern air storage, this study develops a thermodynamic model for predicting temperature and pressure variations in salt caverns during the air injection for brine drainage process and operational cycles. Results show that the air injection flow rate and the cross-sectional area of the brine drainage pipeline significantly influence the thermodynamic characteristics and duration of each stage in the air injection and brine drainage process. Moreover, they have an impact on the upper and lower limits of temperature and pressure, particularly during the initial operational cycles. This research offers insights for optimizing the design and operation of the CAES system with salt cavern air storage.
Keywords:
compressed air energy storage
; salt cavern air storage
; brine drainage
; thermodynamic characteristics
1. Introduction
Renewable energy sources, including solar, wind, and tidal energy, are occupying a growing share within the energy structure. Nevertheless, their reliance on weather conditions leads to issues of intermittency and instability, preventing these renewable energy sources from being seamlessly incorporated into the power grid. Large-scale energy storage plays a crucial role in stabilizing and ensuring the reliability of intermittent energy sources [1]. Among various technologies, the compressed air energy storage stands out as a promising large-scale solution with significant commercial potential [2]. In recent years, CAES has garnered considerable attention due to its advantages, including a long operational lifespan, rapid response capabilities, and site flexibility [3]. Figure 1 depicts a typical adiabatic compressed air energy storage (ACAES) system. In the off-peak hours, surplus electricity or renewable energy is utilized to power the compressor for compressing air. After heat storage and cooling, the compressed air is stored in the air storage. During peak hours, the compressed air is released from the cavern for heating purposes. The heated air then expands within the air turbine, driving the generator to generate electricity.
Research on ACAES mainly focuses on the thermodynamic performance of the system and experimental studies of its key components. Courtois et al. [4] concentrated on the variation of cycle efficiency with system parameters (such as temperature and compression/expansion ratio). They delved deeply into the calculation method of system performance, enabling it to be applicable to various ACAES systems. Amir et al.[5] incorporated wind power assessment into the system for thermodynamic analysis. This study proposed an ACAES operation scheme based on the actual wind speed of a real wind farm. Chen et al. [6] proposed a novel isobaric ACAES system containing a volatile fluid. This volatile liquid (carbon dioxide is recommended) has two functions: discharging air from the storage container and evaporating in the heat exchanger to generate cooling energy. Volker et al.[7] further improved the system’s dynamics and flexibility through an additional auxiliary heating element. Such P2H elements offer an alternative enhancement solution for ACAES, improving the actual energy utilization rate and reducing the comprehensive cost. The above research mainly focuses on the system performance of ACAES, such as efficiency analysis, design/non-design condition analysis, and parameter analysis. In addition, some researchers have conducted in-depth studies on its core component, the thermal energy storage. Shadi et al. [8] investigated a novel, efficient, and green adiabatic compressed air energy storage system. This system is based on heat storage using a cascaded packed bed filled with encapsulated phase change materials. Sciacovelli et al. [9] studied the dynamic performance of a specific ACAES power plant with TES. They established a comprehensive system model composed of hybrid dynamic sub-models of each part, which detailed described the transient characteristics of the heat storage, cavern, and compression/expansion stages. A number of investigations within the field of CAES have concentrated on the development the enhancement of existing equipment, such as compressors, expanders and heat exchangers to elevate overall system efficiency [10,11,12,13,14,15].
The gas storage is a crucial component of large-scale CAES power plants and an important factor restricting its development. The construction of artificial gas storage facilities incurs prohibitively high costs. Salt mine resources are abundant, and salt caverns are widely distributed. These caverns exhibit characteristics such as low porosity, low permeability, and strong plastic deformation resistance. Utilizing abandoned salt caverns as gas storage facilities for CAES has emerged as the most economically viable option in the development of CAES technologies[16]. Zhou et al. [17] put forward analytical and numerical solutions regarding the stability of a lined rock cavern used for CAES when subjected to temperature and pressure variations. Li et al. [18], developed an analytical solution based on metamorphic thermodynamics to predict these variations during operational cycles and validated it against field tests, enabling subsequent thermo-mechanical simulations to assess stress evolution and optimize operational parameters. Wu et al. [19] put forward a coupled thermo-hydro-mechanical model for evaluating the thermodynamic performance of the cavern with air leakage taken into account. Li et al. [20] introduced a coupled thermal-mechanical framework that integrates creep mechanics, demonstrating that long-term stability depends more on salt rheology than cyclic loading amplitude. Their findings—stress maxima at the cavern roof, confined ~10 m of thermal impact, and negligible bulk expansion risk—serve as benchmarks for risk assessment models. Han et al. [21] introduced a coupled explicit finite difference model that captures these effects, revealing a non-linear relationship where injection mass rate dictates temperature/pressure spikes while inner diameter/roughness show minimal influence.
There are two main construction schemes for salt cavern underground gas storage: the first scheme involves drilling engineering to drive casings into the underground salt layer and then using the water dissolution method to dissolve the salt layer, thereby forming an artificial dissolved cavity with a stable shape. After decades of research, this method has become relatively mature[22]. The second scheme is to screen and conduct stability evaluations according to the conditions suitable for construction of the gas storage. For the existing underground dissolved cavities, they are designed and reconstructed in accordance with the normal operating requirements of gas storage to adapt to the storage of air and natural gas. The gas injection for brine drainage process is a necessary step in the development of underground salt cavern gas storage using the water dissolution method. Compared with underground salt cavern gas storage designed for long-term natural gas storage, compressed air energy storage facilities experience more frequent injection and discharge operations. Consequently, the thermodynamic characteristics of air within CAES facilities have garnered greater attention. The air injection for brine drainage process induces significant thermodynamic property variations of the stored air. These variations, in turn, exert a profound impact on the operational characteristics of the CAES’s operational cycles. The impact of the brine drainage process on the operational characteristics of salt cavern gas storage and efficiency of CAES power plant remains largely unelucidated.
Against this background, we developed a thermodynamic model for predicting temperature and pressure variations in salt caverns during the air injection for brine drainage process and operational cycles. The model includes governing equations for air flow in the injection/extraction well pipeline (I/EWP) and thermodynamic changes in the cavern, validated with published data.
2. Models and Governing Equations
2.1. Assumptions
We established a thermodynamic model to calculate the thermodynamic characteristics of air inside the salt cavern air storage. The model depicts the air injection for brine drainage process during the development of the storage and the operational cycles during the operation of the CAES plant. The model is composed of two components: the airflow within the I/EWP and the thermodynamic characteristics of air inside the cavern. Parts of the model are referenced from Reference[21]. The following assumptions are adopted during the modeling process:
(1) Air leakage is not considered.
(2) The volume of the cavern stays constant.
(3) The air density, temperature, and pressure are uniform throughout the cavern space.
(4) The density of brine is constant.
(5) The airflow in the I/EWP and flow of brine in the brine drainage pipe is assumed to be in a steady state.
(6) The cross-sectional area of the I/EWP remains unchanged, and the airflow through the I/EWP is regarded as one-dimensional single-phase flow.
(7) The radius of the air injection pipe is twice that of the brine drainage pipe (BDP). The impact on thermodynamic properties by equivalently replacing multiple BDPs with the same total cross-sectional area with a single BDP’s cross-sectional area.
(8) The vaporization and condensation processes of brine are not considered.
The physical properties of real gas are determined by the data fitted using the Peng-Robinson equation, which is stored in the database.
2.2. Cavern Thermodynamics
When the gas flows into the cavern, the energy conservation equation is:
where m is the gas mass, u is the internal energy, t is the time, hin is the specific enthalpy of injected air. hca is the average heat transfer coefficient, Aca is the cavern surface area, and Trw is the cavern surface temperature, T is the compressed air temperature in the cavern.
The specific enthalpy and internal energy are expressed as:
where Tcin and Pcin denote the temperature and pressure at the outlet of the I/EWP during injection process, Z denotes the compressibility factor, and Tc and Pc denote the critical temperature and critical pressure.
The mass conservation equation is:
To calculate the air temperature, the heat conduction equation of the surrounding salt rock needs to be solved. The heat conduction in the surrounding salt rock is considered as one-dimensional and radial, and the equation describing the temperature of the rock is:
where r is the radial distance from the cavern center. The subscript r denotes the surrounding salt rock, where ρr, Cpr, and κr are the rock density, rock specific heat, and rock thermal conductivity. Tr is the temperature of the salt rock.
The boundary conditions are:
where rw is the cavern radius.
During the shut-in period, the mass of cavern gas is constant, and the temperature and pressure are only influenced by the heat transfer from the cavern walls. The energy and mass conservation equations are:
During the extraction period, the mass of gas in the cavern is reduced. The energy and mass conservation equations are:
where hout is the specific enthalpy of withdrawn air; qmout is the withdrawn air mass rate.
2.3. Model of I/EWP Flow
In actual engineering, the length-to-diameter ratio of the I/EWP can reach 1000~5000. Therefore, the I/EWP air flow can be considered a one-dimensional flow in the length direction [23]. According to the momentum equation within a microsegment, we obtain the following equation:
where P is the air pressure; z is the depth below surface; ρ is the gas density; g is the acceleration of gravity; f is the friction coefficient; v is the gas flow rate; D is the inner diameter of the I/EWP.
The friction coefficient is calculated according to Colebrook-White equation as[24]:
where ε is the roughness of the I/EWP wall; Re denotes Reynolds number, which can be calculated as:
where μ is the viscosity of air.
The air temperature is computed by the energy equation, which is:
ΔQr is the heat transferred from the tubing to gas in the radial direction, as Eq. (13) shows [25]:
where Ut is the overall heat transfer coefficient; f(t) is the dimensionless time function to help calculate transferred heat. kr donates the thermal conductivity of the surrounding salt rock; Te=az+b denotes the initial temperature of the salt rock, where a is the temperature gradient of the formation; b is the surface temperature.
The dimensionless time function f(t) is [26]:
where , denotes the dimensionless time; α is the thermal diffusivity of the salt rock. t is the injection or extraction time.
2.4. Model of Air Injection for Brine Drainage
A dynamic model is established for simulating the initial air injection for brine drainage process in a salt cavern gas storage. The model iteratively calculates the thermodynamic state changes within the storage cavern, including pressure, temperature, and velocity, to evaluate the operational characteristics of the gas storage cavern during different stages. The primary objective of the model is to determine the end time of the brine drainage process, the termination conditions of the air injection process, and key parameters in the dynamic changes of the system.
The schematic diagram of the salt cavern in the process of air injection for brine drainage is illustrated in Figure 2. In the figure, Ha represents the height of the air within the salt cavern, Hb represents the height of the brine, Hc represents the height of the salt cavern, Hwell represents the height of the I/EWP, DBDP represents the diameter of the BDP, and DI/EWP represents the diameter of the I/EWP.
The air injection process can be divided into the following three stages, and the flow chart of air injection process is showed in Figure 3.
2.4.1. Air Injection and Pressure Increase Stage (AIPIS)
When the air pressure within the cavern is insufficient to drainage the brine, the system is in AIPIS. During this stage, the volume of air within the cavern remains constant, and the air undergoes isochoric pressure increase upon air injection. The energy and mass conservation equations are:
where hb is the average heat transfer coefficient between the compressed air and the brine, Ab is the interfacial area between the brine and air, Tb is the brine temperature, and vb is the velocity of the brine in the BDP.
2.4.2. Pressure Increase and Brine Drainage Stage (PIBDS)
When the air pressure inside the salt cavern reaches the brine drainage pressure (Pbd), the continuous injection of air leads to the sustained discharge of brine, and the air pressure continues to rise. Pbd is defined as follows:
where ρb is the density of brine, Hwell is the height of the I/EWP, and P0 is the atmospheric pressure.
The flow velocity of brine within the brine drainage pipe is calculated based on the following governing equations:
where Pa is the pressure of the air in salt cavern, and f is the friction factor, which is calculated according to the Baldamus equation as:
2.4.3. Halt Injection and Brine Drainage Stage (HIBDS)
When the internal air pressure within the salt cavern reaches the upper limit of its bearing capacity, the air injection into the cavern is terminated, and the residual pressure is utilized to continue draining the brine. The governing equation in this stage is as follows:
As the brine is continuously drained, the air space within the salt cavern gradually expands, resulting in a progressive decrease in air pressure. When the air pressure drops to the lower limit of the cavern’s bearing capacity, the system re-enters the AIPIS. At any stage mentioned above, the air injection and brine drainage process are completed when the brine level height Hb in the cavern drops below Hmin. The parameter settings for the air injection and brine drainage process are presented in Table 1. The parameter settings are referenced from an under-construction CAES power plant in China.
3. Results and Discussion
3.1. Verification of Time Step Independence
Six models with different time steps are set for one operational cycle of the CAES system, and the pressure and temperature of the compressed air is selected as the basis for judging the time step independence. The curve is shown in Figure 4. The figure implies that when dt is below 100 s, the pressure and temperature of the compressed air remain relatively close throughout the entire cycle. However, when dt exceeds 100 s, a noticeable difference in pressure and temperature occurs during the standby phase.
The pressure and temperature at the end of the energy release stage were compiled as criteria for time-step independence verification, with the corresponding curves plotted in Figure 5. It can be seen from the figure that the difference of pressure and temperature is less than 0.2% after decreasing the time steps below 60s. As a result, a time step of 60 s meets the calculation requirements.
3.2. Validation of Cavern Thermodynamics
To validate the thermodynamic model, experimental data from the Huntorf plant is utilized for comparative analysis [27]. The simulation parameters are detailed in Table 2. The cavern’s air mass variation during a 24-hour operational cycle is presented in Figure 6, with pressure and temperature results visualized in subplots 7a and 7b. The data reveals synchronized pressure and temperature fluctuations corresponding to air mass variations. Both parameters exhibit increases during air injection phases and decreases during withdrawal periods, except during the shut-in phase where air mass remains constant. During this phase, temperature variations occur due to heat transfer with surrounding salt rock formations, subsequently influencing pressure dynamics. Heat transfer effects are governed by temperature differentials, which inherently produce nonlinear temperature responses. Comparative analysis demonstrates that the proposed model’s calculated pressure and temperature values align closely with Huntorf plant operational data, despite minor discrepancies. These deviations likely stem from uncertainties in cavern surface area measurements and approximations in calculating known prior-state values.
This study investigates the influence of air injection mass flow rate and inner diameter of the BDP on the thermodynamic characteristics of air within the storage cavern during the air injection for brine drainage process and the operational cycles of CAES plants.
3.3. Influence of the Injection Flow Rates
Figure 8 illustrates the inverse relationship between air mass flow rate (80~120 kg/s) and temporal characteristics of three stages in the air injection for brine drainage process. As air flow rate increases, the time for brine drainage commencement decreases, indicating a more efficient displacement process, while the cessation of air injection shifts towards higher flow rates and earlier times. The observed trends are rooted in the physics of fluid displacement and pressure accumulation within enclosed spaces. During air injection, the incoming compressed air exerts pressure on the brine, forcing it out of the cavern. The rate at which this displacement occurs is directly influenced by the mass flow rate of the injected air. Higher flow rates result in faster pressure buildup and more rapid brine displacement, thereby reducing the overall time required for each stage of the process. However, physical limitations such as the geometry of the salt cavern, the viscosity and density of the brine, and the maximum operable pressure of the system impose constraints on the achievable displacement rate. Consequently, beyond a certain air flow rate, the marginal benefit in terms of time reduction diminishes.
Figure 9 illustrates the intricate relationship between the maximum temperature achieved and the timing of its occurrence during the air injection and brine drainage process, as these variables fluctuate across different air mass flow rates. The maximum temperature encountered during the process exhibits a discernible upward trend, indicating that higher air mass flow rates result in elevated maximum temperatures within the salt cavern. This positive correlation can be attributed to the increased heat generation caused by the friction and compression of air during injection. Conversely, the second curve, depicting the timing of maximum temperature occurrence, reveals an inverse relationship with the air mass flow rate. As the flow rate increases, the time at which the maximum temperature is recorded shifts earlier, suggesting that higher air flow rates accelerate the temperature build-up within the salt cavern.
Figure 10 presents the relationship between the mass flow rate of air and the internal air pressure and temperature within a salt cavern air storage reservoir at the completion of brine drainage. The decrease in pressure with increasing mass flow rate can be attributed to the fact that when the mass flow rate of the injected air increases, the rate of increase in air pressure accelerates. This leads to a higher velocity of the brine during the drainage process. Simultaneously, the air expands at a faster rate. As a result, at the end of the brine-drainage process, the pressure is lower. The decrease in temperature with increasing mass flow rate is mainly due to the air expansion and the heat exchange between the injected air and the salt rock wall of the cavern. On one hand, a larger mass flow rate of the injected air results in a faster expansion rate of the air. On the other hand, with a higher mass flow rate of the injected gas, the brine drainage process is completed in a shorter time. This means that the air in the salt cavern has less time to exchange heat with the surrounding salt rock. Therefore, although the temperature still decreases due to air expansion, the rate of temperature decrease with increasing mass flow rate is slower than that of pressure because of the reduced heat-exchange time during the shorter brine drainage process.
Figure 11 illustrates the pressure variation of air in a salt cavern during air injection for brine drainage process under different injection rates. The pressure rises rapidly in the AIPIS, with higher injection rates leading to steeper pressure increases. As the process moves to the PIBDS, the brine begins to be discharged from the salt cavern, resulting in an increase in the volume available for air within the cavern. As air continues to be injected, the rate of pressure increase inside the salt cavern gradually slows down. As a result, all pressures continue to rise but at a more moderate rate, yet the differences between rates become less pronounced. Eventually, during the HIBDS, the brine continues to be discharged from the salt cavern, further increasing the available volume for air within the cavity. Once the air injection is halted, the entrapped air within the salt cavern gradually expands. This expansive behavior leads to a progressive decline in air pressure within the cavern. Moreover, it is observed that as the injection rate increases, the durations of both the AIPIS and PIBDS significantly shorten. This phenomenon arises because higher injection rates introduce greater air volumes into the salt cavern within a shorter timeframe, thereby accelerating the pressure buildup that initiates or expedites the brine drainage process. Counterintuitively, however, the HIBDS exhibits prolonged duration at elevated injection rates. This phenomenon can be attributed to the following mechanisms: the increased air injection flow rate accelerates the air expansion rate during the HIBDS. This more rapid air expansion leads to a swifter decline in air pressure, which in turn reduces the driving force for brine drainage. Consequently, the brine velocity experiences a faster attenuation rate as the pressure differential diminishes more quickly. Under the condition of constant total brine volume, these combined effects result in a proportionally longer duration for the HIBDS phase. Notably, despite the lengthier HIBDS duration at higher injection rates, the overall brine drainage time throughout the entire air injection process demonstrates a net reduction. This outcome stems from the disproportionately greater time savings achieved in the AIPIS and PIBDS, which more than offset the incremental extension in the HIBDS.
Figure 12 illustrates the temperature variation of air in a salt cavern during air injection and brine drainage for compressed air energy storage under different injection rates. All curves show an initial increase in temperature during the AIPIS, where air is compressed and injected into the cavern. Higher injection rates lead to steeper temperature rises and higher peak temperatures due to reduced heat dissipation time. During the PIBDS, the displacement of brine leads to an augmentation in the volumetric capacity of the salt cavern, thereby facilitating air expansion. Distinct from the pressure variation, the continuous air injection notwithstanding, the air temperature within the cavern exhibits a trend of initial increase followed by a subsequent decrease when accounting for the heat transfer interactions with the surrounding salt rock formation. Eventually, during the HIBDS, the temperature decline steeper as injection stops and the residual pressure continues to displace brine. Lower injection rates generally result in more gradual temperature changes and less pronounced peaks compared to higher rates.
Figure 13 presents the brine discharge velocity variation during the air injection for brine drainage process in a salt cavern under different air injection rates. During the AIPIS, the velocity remains zero as air is injected to build up pressure within the cavern, but insufficient to initiate brine discharge. The greater the gas injection flow rate, the earlier the air pressure inside the cavern reaches the brine drainage pressure, thereby initiating the PIBDS. Once the air pressure reaches the brine drainage pressure and enters the PIBDS, the velocity increases rapidly, with higher injection rates leading to steeper rises and higher peak velocities due to greater pressure differentials driving the brine discharge. The peak velocities occur earlier for higher injection rates. In the HIBDS, air injection stops, and the velocity further declines as the remaining pressure continues to push out the brine at a decelerating rate until the process concludes. Lower injection rates generally result in more gradual velocity changes and less pronounced peaks compared to higher rates.
3.4. Influence of the BDP Cross-Sectional Area
Since air injection flow rates remains the same and the cross-sectional area of the BDP does not influence the AIPIS, Figure 14 presents the relationship between the area of the BDP and the time required for two stages in the air injection and brine drainage process of a salt cavern. As the cross-sectional area of the BDP increases, the brine discharge velocity escalates, thereby enhancing the brine drainage efficiency. Consequently, the time required to complete the brine drainage process progressively diminishes. As the BDP area increases from 3.0 to 7.8 m2, the time for ceasing air injection shows a linear increasing trend, rising from 25.2 h to 41.3 h. When the cross-sectional area of the BDP exceeds 7.8 m2, the brine is completely drained before the air in the salt cavern reaches its maximum allowable pressure. Consequently, the HIBDS is eliminated from the air injection for brine drainage process. In this scenario, the time for ceasing air injection coincides precisely with the completion time of brine drainage. Moreover, as the BDP cross-sectional area continues to increase, the time for ceasing air injection demonstrates a consistent decreasing trend.
Figure 15 presents the relationship between the area of the BDP and the maximum temperature of air as well as the time when this maximum temperature occurs during the air injection and brine drainage process in a salt cavern. The highest air temperature during the air injection and brine drainage process occurs in the early stage of the PIBDS. At this moment, the brine drainage volume is relatively small; therefore, the cross-sectional area of the BDP has minimal influence on both the maximum temperature value and its occurrence timing. Specifically, as the BDP cross-sectional area increases, the peak temperature decreases slightly, while the timing of peak temperature occurrence advances marginally.
Figure 16 presents the relationship between the area of the BDP and the pressure and temperature at the end of the air injection and brine drainage process in a salt cavern. As the BDP area increases from 3.0 to 7.8 m2, both the pressure and temperature exhibit a general upward trend, reaching peak values of approximately 17.38 MPa and 332.5 K, respectively. This phenomenon can be attributed to the enhanced brine drainage velocity induced by a larger BDP cross-sectional area. Consequently, during the HIBDS, both the air expansion duration and the heat transfer period with the surrounding salt rock are substantially reduced. As a result, the air temperature and pressure at the end of the brine drainage process exhibit a positive correlation with the BDP cross-sectional area, demonstrating an upward trend with increasing BDP size. When the cross-sectional area of the BDP exceeds 7.8 m2, the air injection and brine drainage process is completed during the PIBDS. An increase in the BDP cross-sectional area results in a shorter pressurization duration, leading to a lower air pressure at the end of the brine drainage process. However, since the air temperature has already entered a slow decline phase during the PIBDS, a larger BDP cross-sectional area conversely leads to a higher air temperature at the termination of the brine drainage process.
Figure 17 presents the pressure variation during the air injection and brine drainage process in a salt cavern, with curves corresponding to different BDP areas. During the AIPIS, all curves show the same rapid pressure increase as air is injected into the cavern. As the process transitions to the PIBDS, pressure continues to rise but at a decreasing rate. Larger BDPs display more efficient brine displacement, leading to a more moderate pressure increase. When the cross-sectional area of the BDP exceeds 7.8 m2, the air injection and brine drainage process is completed during this stage. The HIBDS sees pressure slightly drop as injection stops and residual pressure continues to displace brine. As the cross-sectional area of the BDP increases, the duration of the PIBDS progressively elongates, while the HIBDS exhibits a progressively diminishing duration that ultimately reduces to zero.
Figure 18 illustrates the temperature variation during the air injection and brine drainage process, with curves corresponding to different BDP cross-sectional areas. During the PIBDS which begins at 20.1 h, the air temperature initially continues to rise slightly with ongoing air injection until reaching a peak value, after which it begins to decline as brine expulsion occurs and the entrapped air undergoes expansion. Notably, a larger cross-sectional area of the BDP results in a shorter temperature ascent duration and a reduced peak temperature value. Meanwhile, during the PIDBS, a larger cross-sectional area of the BDP results in an accelerated brine discharge velocity. This enhanced expulsion rate intensifies the air expansion process within the cavern, thereby accelerating the rate of air temperature decline.
Figure 19 presents the brine discharge velocity variation during the air injection for brine drainage process in a salt cavern for compressed air energy storage, with curves corresponding to different BDP cross-sectional areas. During the AIPIS, the brine drainage rate remains at 0. In the PIDBS, as air is injected, the pressure rises, and the brine drainage velocity increases dramatically. Subsequently, as the volume of air in the salt cavern expands, the rate of pressure increase slows down or even decreases, and the brine drainage rate also changes accordingly. The larger the BDP cross-sectional area, the greater the change rate of the brine drainage rate, and the higher the peak value of the rate. During the HIBDS, air injection stops, and the velocity further declines as the remaining pressure continues to push out the brine at a decelerating rate until the process concludes. Smaller BDP shows more significant velocity fluctuations and higher peak velocities during the initial stages due to restricted flow and greater pressure differentials.
3.5. Effects on Operational Cycles
Figure 19 delineates the pressure dynamics during the air injection for brine drainage process and subsequent operational cycles in an underground salt cavern gas storage system. The variable qm specifically denotes the air injection flow rate during the air injection for brine drainage process. All parameters of subsequent operational cycle, including the injection and withdrawal air flow rates, remain consistent. Five curves corresponding to injection flow rate of 80~120 kg/s exhibit a shared temporal pattern: initial rapid pressure ascent, and sustained equilibrium with minor oscillations over the remaining operational cycles. During the air injection for brine drainage process, higher qm values induce steeper pressure gradients, achieving 85~90% of the maximum pressure within 30 hours, whereas lower qm requires about 45 hours to reach comparable levels. In the first operational cycle after the gas injection and brine drainage process, the air pressure inside the salt cavern immediately enters a stable periodic fluctuation state in response to the operational status variations of the CAES power plant. The air pressure at the end of the gas injection and brine drainage process determines the upper and lower limits of the periodic fluctuations. The maximum difference during the operational cycles is 691.5 kPa.
Figure 20 delineates the temperature dynamics of compressed air across multiple operational cycles under different air injection rates. The larger the gas injection flow rate during the gas injection for brine drainage process, the shorter the time required to complete this process. Meanwhile, the temperature fluctuations inside the cavern will exhibit higher peaks and greater amplitudes. After the completion of the gas injection for brine drainage process, the air inside the cavern does not enter the periodic fluctuation stage during the first operational cycle. The observed flow-rate-dependent temperature separation persists throughout operational cycles, though inter-cycle hysteresis diminishes gradually as the system approaches thermodynamic equilibrium due to the sufficient heat exchange between the air and the surrounding salt rock. The temperature at the end of the gas injection for brine drainage process affects the amplitude of subsequent operational-cycle fluctuations as well as the peak temperature. The higher the temperature at the end of the process, the greater the fluctuation amplitude and the higher the peak temperature of the working cycles. Under different gas injection flow rates, the difference between the maximum peak value and the minimum peak value is 4.90 K.
4. Conclusion
To investigate the impact of air injection and brine drainage on the thermodynamic characteristics of salt cavern air storage, this study develops a thermodynamic model for predicting temperature and pressure variations in salt caverns during the air injection for brine drainage process and operational cycles. Results show that the air injection flow rate and the cross-sectional area of the brine drainage pipeline significantly influence the thermodynamic characteristics and duration of each stage in the air injection and brine drainage process. Moreover, they have an impact on the upper and lower limits of temperature and pressure, particularly during the initial operational cycle. This research offers insights for optimizing the design and operation of the CAES system with salt cavern air storage.
Author Contributions
Conceptualization, Bin.Wu.; methodology, Shizhong.Sun.; software, Chen.Ling; validation, Xiaofeng.Jiang.; formal analysis, Shizhong.Sun; investigation, Xiaodong.Huo.; resources, Yu.Sun; data curation, Yonggao.Yin.; writing—original draft preparation, Shizhong.Sun.; writing—review and editing, Yu.Sun.; visualization, Shizhong.Sun.; supervision, Rui.Li. and Liang Shao; project administration, Rui.Li.; funding acquisition, Bin.Wu. All authors have read and agreed to the published version of the manuscript.
Funding
This research was funded by Jiangsu Provincial Department of Science and Technology of China, grant number BT2024005.
Acknowledgments
During the preparation of this manuscript, the author(s) used Deepseek-V3 for the purposes of polish. The authors have reviewed and edited the output and take full responsibility for the content of this publication.
Conflicts of Interest
The authors declare no conflicts of interest.
Abbreviations
The following abbreviations are used in this manuscript:
| CAES | Compressed air energy storage |
| ACAES | Adiabatic compressed air energy storage |
| BDP | Brine drainage pipeline |
| I/EWP | Injection/extraction well pipeline |
| AIPIS | Air injection and pressure increase stage |
| PIBDS | Pressure increase and brine drainage stage |
| HIBDS | Halt injection and brine drainage stage |
References
- Nabat, M.H.; Habibzadeh, M.; Alsagri, A.S.; Arabkoohsar, A. An investigation and multi-criteria optimization of an innovative compressed air energy storage. Journal of Energy Storage 2024, 76. [Google Scholar] [CrossRef]
- Baniamerian, Z.; Garvey, S.; Rouse, J.; Cárdenas, B.; Pottie, D.L.; Barbour, E.R.; Bagdanavicius, A. How pressure affects costs of power conversion machinery in compressed air energy storage; Part I: Compressors and expanders. Journal of Energy Storage 2024, 89. [Google Scholar] [CrossRef]
- Bazdar, E.; Sameti, M.; Nasiri, F.; Haghighat, F. Compressed air energy storage in integrated energy systems: A review. Renewable and Sustainable Energy Reviews 2022, 167, 112701. [Google Scholar] [CrossRef]
- Courtois, N.; Najafiyazdi, M.; Lotfalian, R.; Boudreault, R.; Picard, M. Analytical expression for the evaluation of multi-stage adiabatic-compressed air energy storage (A-CAES) systems cycle efficiency; 2021; Volume 288.
- Razmi, A.R.; Soltani, M.; Ardehali, A.; Gharali, K.; Dusseault, M.B.; Nathwani, J. Design, thermodynamic, and wind assessments of a compressed air energy storage (CAES) integrated with two adjacent wind farms: A case study at Abhar and Kahak sites, Iran. Energy 2021, 221, 119902. [Google Scholar] [CrossRef]
- Chen, L.; Wang, Y.; Xie, M.; Ye, K.; Mohtaram, S. Energy and exergy analysis of two modified adiabatic compressed air energy storage (A-CAES) system for cogeneration of power and cooling on the base of volatile fluid. Journal of Energy Storage 2021, 42, 103009. [Google Scholar] [CrossRef]
- Dreißigacker, V.; Belik, S. System Configurations and Operational Concepts for Highly Efficient Utilization of Power-to-Heat in A-CAES. Applied Sciences 2019, 9, 1317. [Google Scholar] [CrossRef]
- Bashiri Mousavi, S.; Adib, M.; Soltani, M.; Razmi, A.R.; Nathwani, J. Transient thermodynamic modeling and economic analysis of an adiabatic compressed air energy storage (A-CAES) based on cascade packed bed thermal energy storage with encapsulated phase change materials. Energy Conversion and Management 2021, 243, 114379. [Google Scholar] [CrossRef]
- Sciacovelli, A.; Li, Y.; Chen, H.; Wu, Y.; Wang, J.; Garvey, S.; Ding, Y. Dynamic simulation of Adiabatic Compressed Air Energy Storage (A-CAES) plant with integrated thermal storage – Link between components performance and plant performance. Applied Energy 2017, 185, 16–28. [Google Scholar] [CrossRef]
- Saadat, M.; Shirazi, F.A.; Li, P.Y. Modeling and control of an open accumulator Compressed Air Energy Storage (CAES) system for wind turbines. Applied Energy 2015, 137, 603–616. [Google Scholar] [CrossRef]
- Barbour, E.; Mignard, D.; Ding, Y.; Li, Y. Adiabatic Compressed Air Energy Storage with packed bed thermal energy storage. Applied Energy 2015, 155, 804–815. [Google Scholar] [CrossRef]
- Zhang, Y.; Yang, K.; Li, X.; Xu, J. The thermodynamic effect of thermal energy storage on compressed air energy storage system. Renewable Energy 2013, 50, 227–235. [Google Scholar] [CrossRef]
- Zhang, C.; Yan, B.; Wieberdink, J.; Li, P.Y.; Van de Ven, J.D.; Loth, E.; Simon, T.W. Thermal analysis of a compressor for application to Compressed Air Energy Storage. Applied Thermal Engineering 2014, 73, 1402–1411. [Google Scholar] [CrossRef]
- She, X.; Peng, X.; Nie, B.; Leng, G.; Zhang, X.; Weng, L.; Tong, L.; Zheng, L.; Wang, L.; Ding, Y. Enhancement of round trip efficiency of liquid air energy storage through effective utilization of heat of compression. Applied Energy 2017, 206, 1632–1642. [Google Scholar] [CrossRef]
- Zhao, P.; Gao, L.; Wang, J.; Dai, Y. Energy efficiency analysis and off-design analysis of two different discharge modes for compressed air energy storage system using axial turbines. Renewable Energy 2016, 85, 1164–1177. [Google Scholar] [CrossRef]
- Zhou, S.-W.; Xia, C.-C.; Du, S.-G.; Zhang, P.-Y.; Zhou, Y. An Analytical Solution for Mechanical Responses Induced by Temperature and Air Pressure in a Lined Rock Cavern for Underground Compressed Air Energy Storage; 2015; Volume 48.
- Zhou, S.-W.; Xia, C.-C.; Zhao, H.-B.; Mei, S.-H.; Zhou, Y. Numerical simulation for the coupled thermo-mechanical performance of a lined rock cavern for underground compressed air energy storage. Journal of Geophysics and Engineering 2017, 14, 1382–1398. [Google Scholar] [CrossRef]
- Li, W.; Zhu, C.; Han, J.; Yang, C. Thermodynamic response of gas injection-and-withdrawal process in salt cavern for underground gas storage. Applied Thermal Engineering 2019, 163, 114380. [Google Scholar] [CrossRef]
- Wu, D.; Wang, J.G.; Hu, B.; Yang, S.-Q. A coupled thermo-hydro-mechanical model for evaluating air leakage from an unlined compressed air energy storage cavern. Renewable Energy 2020, 146, 907–920. [Google Scholar] [CrossRef]
- Li, W.; Miao, X.; Yang, C. Failure analysis for gas storage salt cavern by thermo-mechanical modelling considering rock salt creep. Journal of Energy Storage 2020, 32, 102004. [Google Scholar] [CrossRef]
- Han, Y.; Cui, H.; Ma, H.; Chen, J.; Liu, N. Temperature and pressure variations in salt compressed air energy storage (CAES) caverns considering the air flow in the underground wellbore. Journal of Energy Storage 2022, 52, 104846. [Google Scholar] [CrossRef]
- Hagoort; Jacques. Simulation of Production and Injection Performance of Gas Storage Caverns in Salt Formations. Spe Reservoir Engineering 1994, 9, 278–282. [Google Scholar] [CrossRef]
- Ge, X.; Li, Y.; Shi, X.; Chen, X.; Ma, H.; Yang, C.; Shu, C.; Liu, Y. Experimental device for the study of Liquid–Solid coupled flutter instability of salt cavern leaching tubing. Journal of Natural Gas Science and Engineering 2019, 66, 168–179. [Google Scholar] [CrossRef]
- Hafsi, Z. Accurate explicit analytical solution for Colebrook-White equation. Mechanics Research Communications 2021, 111, 103646. [Google Scholar] [CrossRef]
- Wu, H.; Bai, B.; Li, X.; Liu, M.; He, Y. An explicit finite difference model for prediction of wellbore pressure and temperature distribution in CO2 geological sequestration. Greenhouse Gases: Science and Technology 2017, 7, 353–369. [Google Scholar] [CrossRef]
- Hasan, A.R.; Kabir, C.S. Heat Transfer During Two-Phase Flow in Wellbores: Part I—Formation Temperature. In Proceedings of the SPE Annual Technical Conference and Exhibition; 1991. [Google Scholar]
- Crotogino, F.; Mohmeyer, K.-U.; Scharf, R. Huntorf CAES: More than 20 years of successful operation. Orlando, Florida, USA, 2001. [Google Scholar]
Figure 1.
A typical adiabatic CAES system.
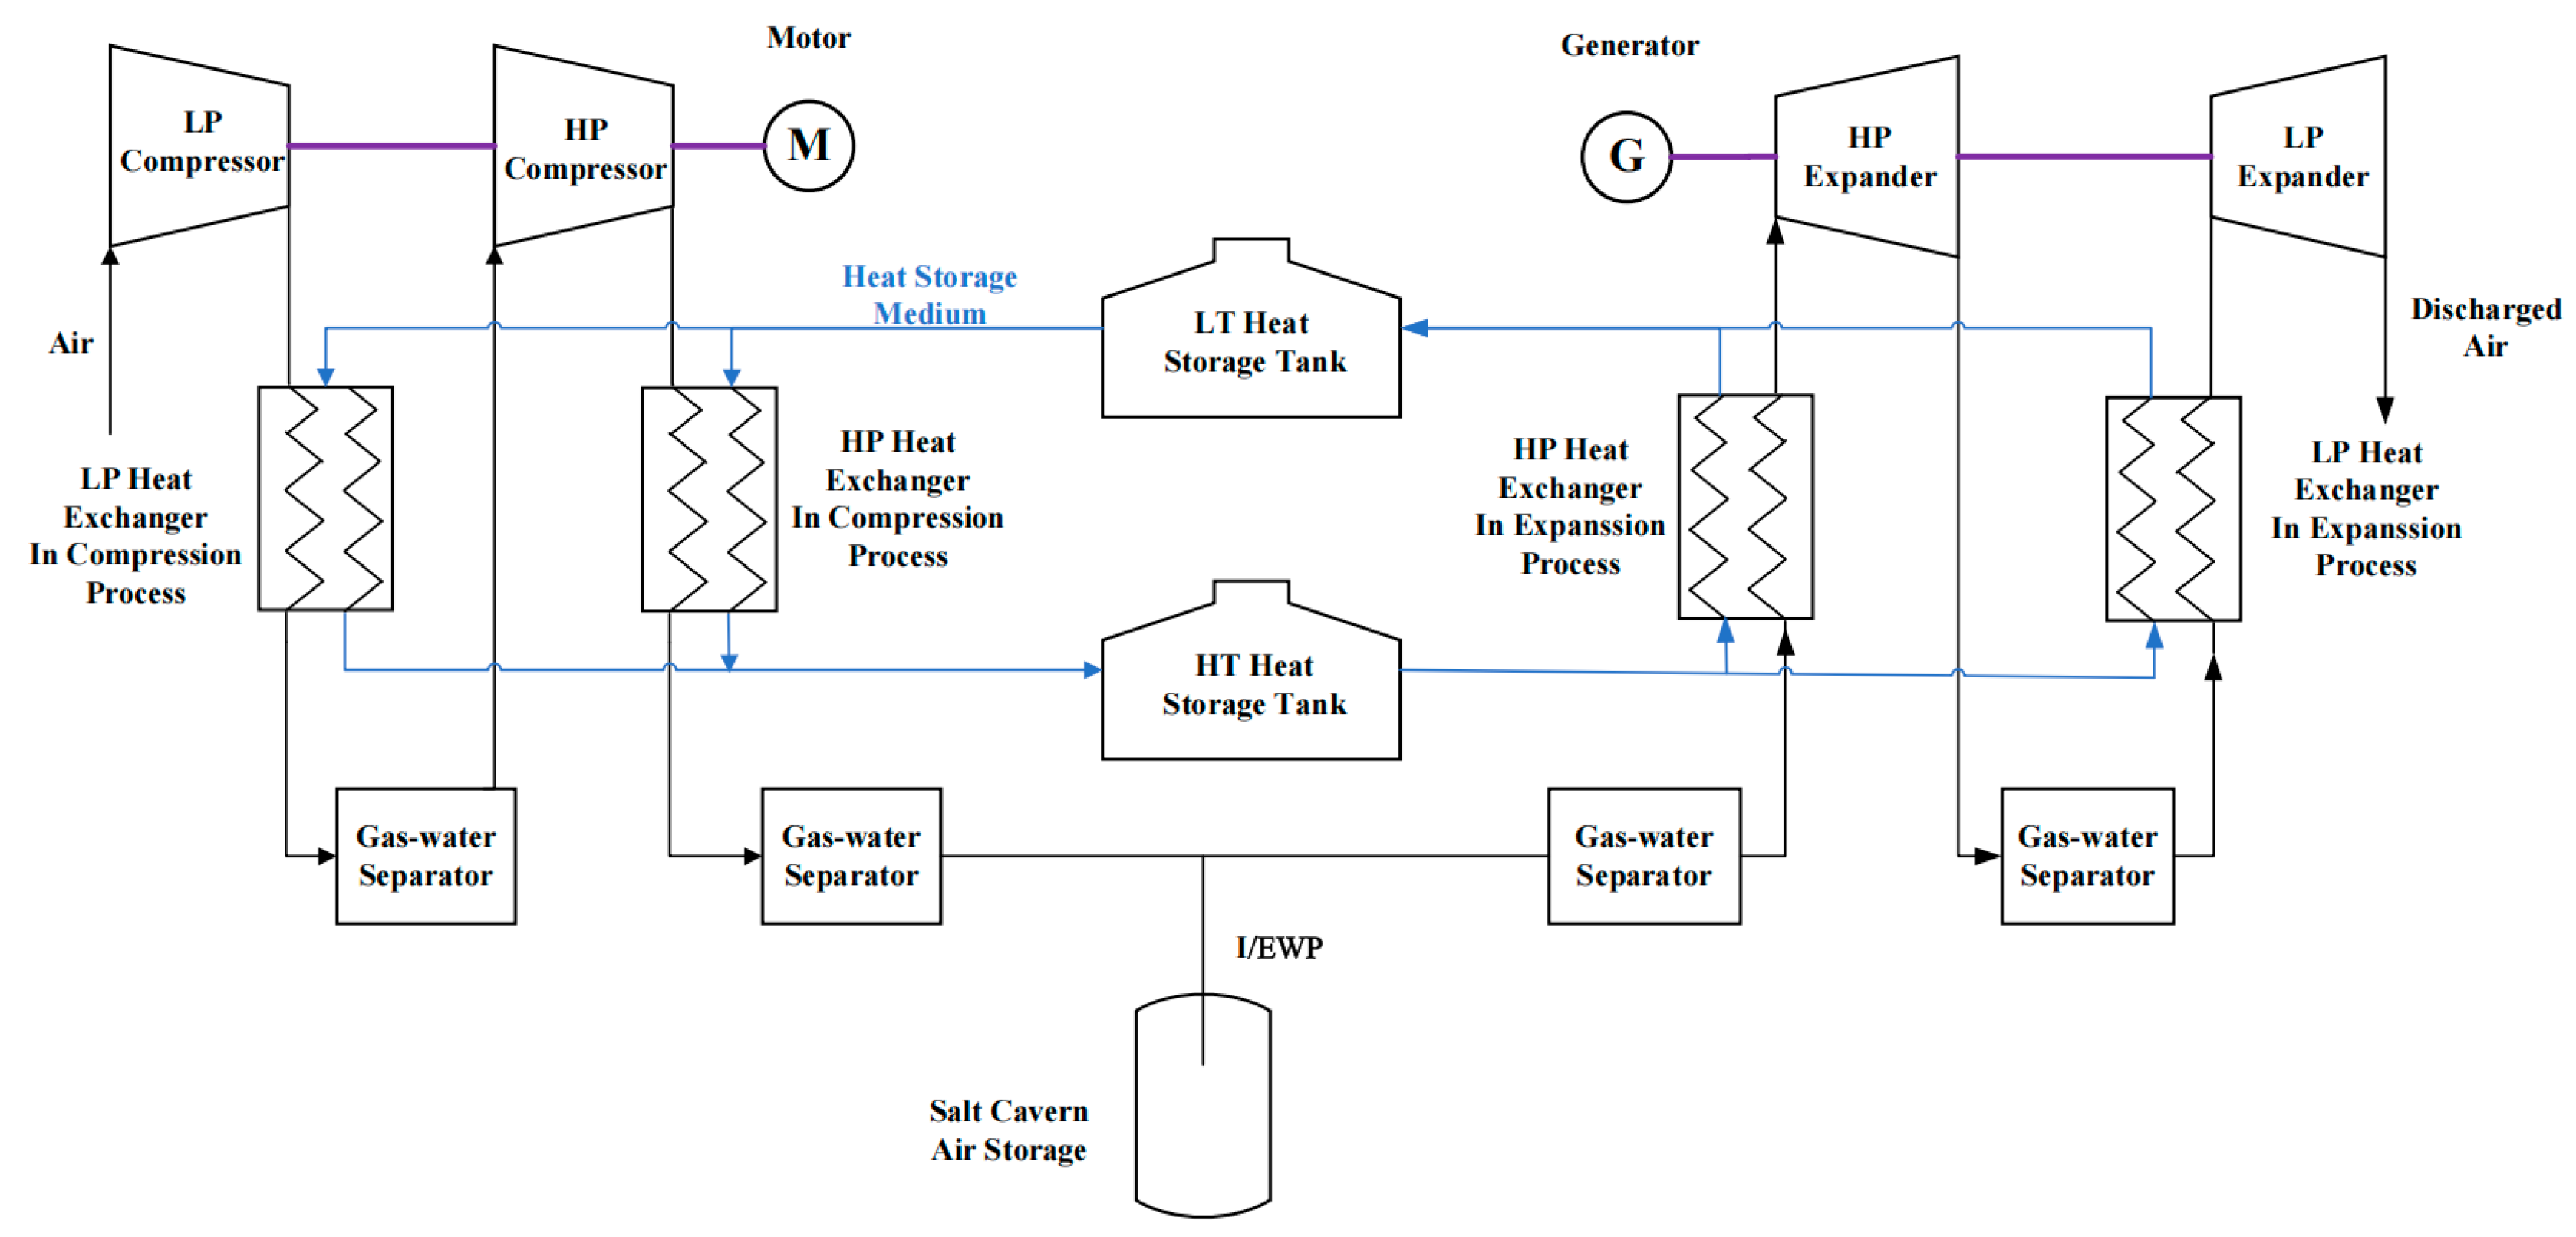
Figure 2.
Schematic diagram of the salt cavern in the process of air injection for brine drainage.
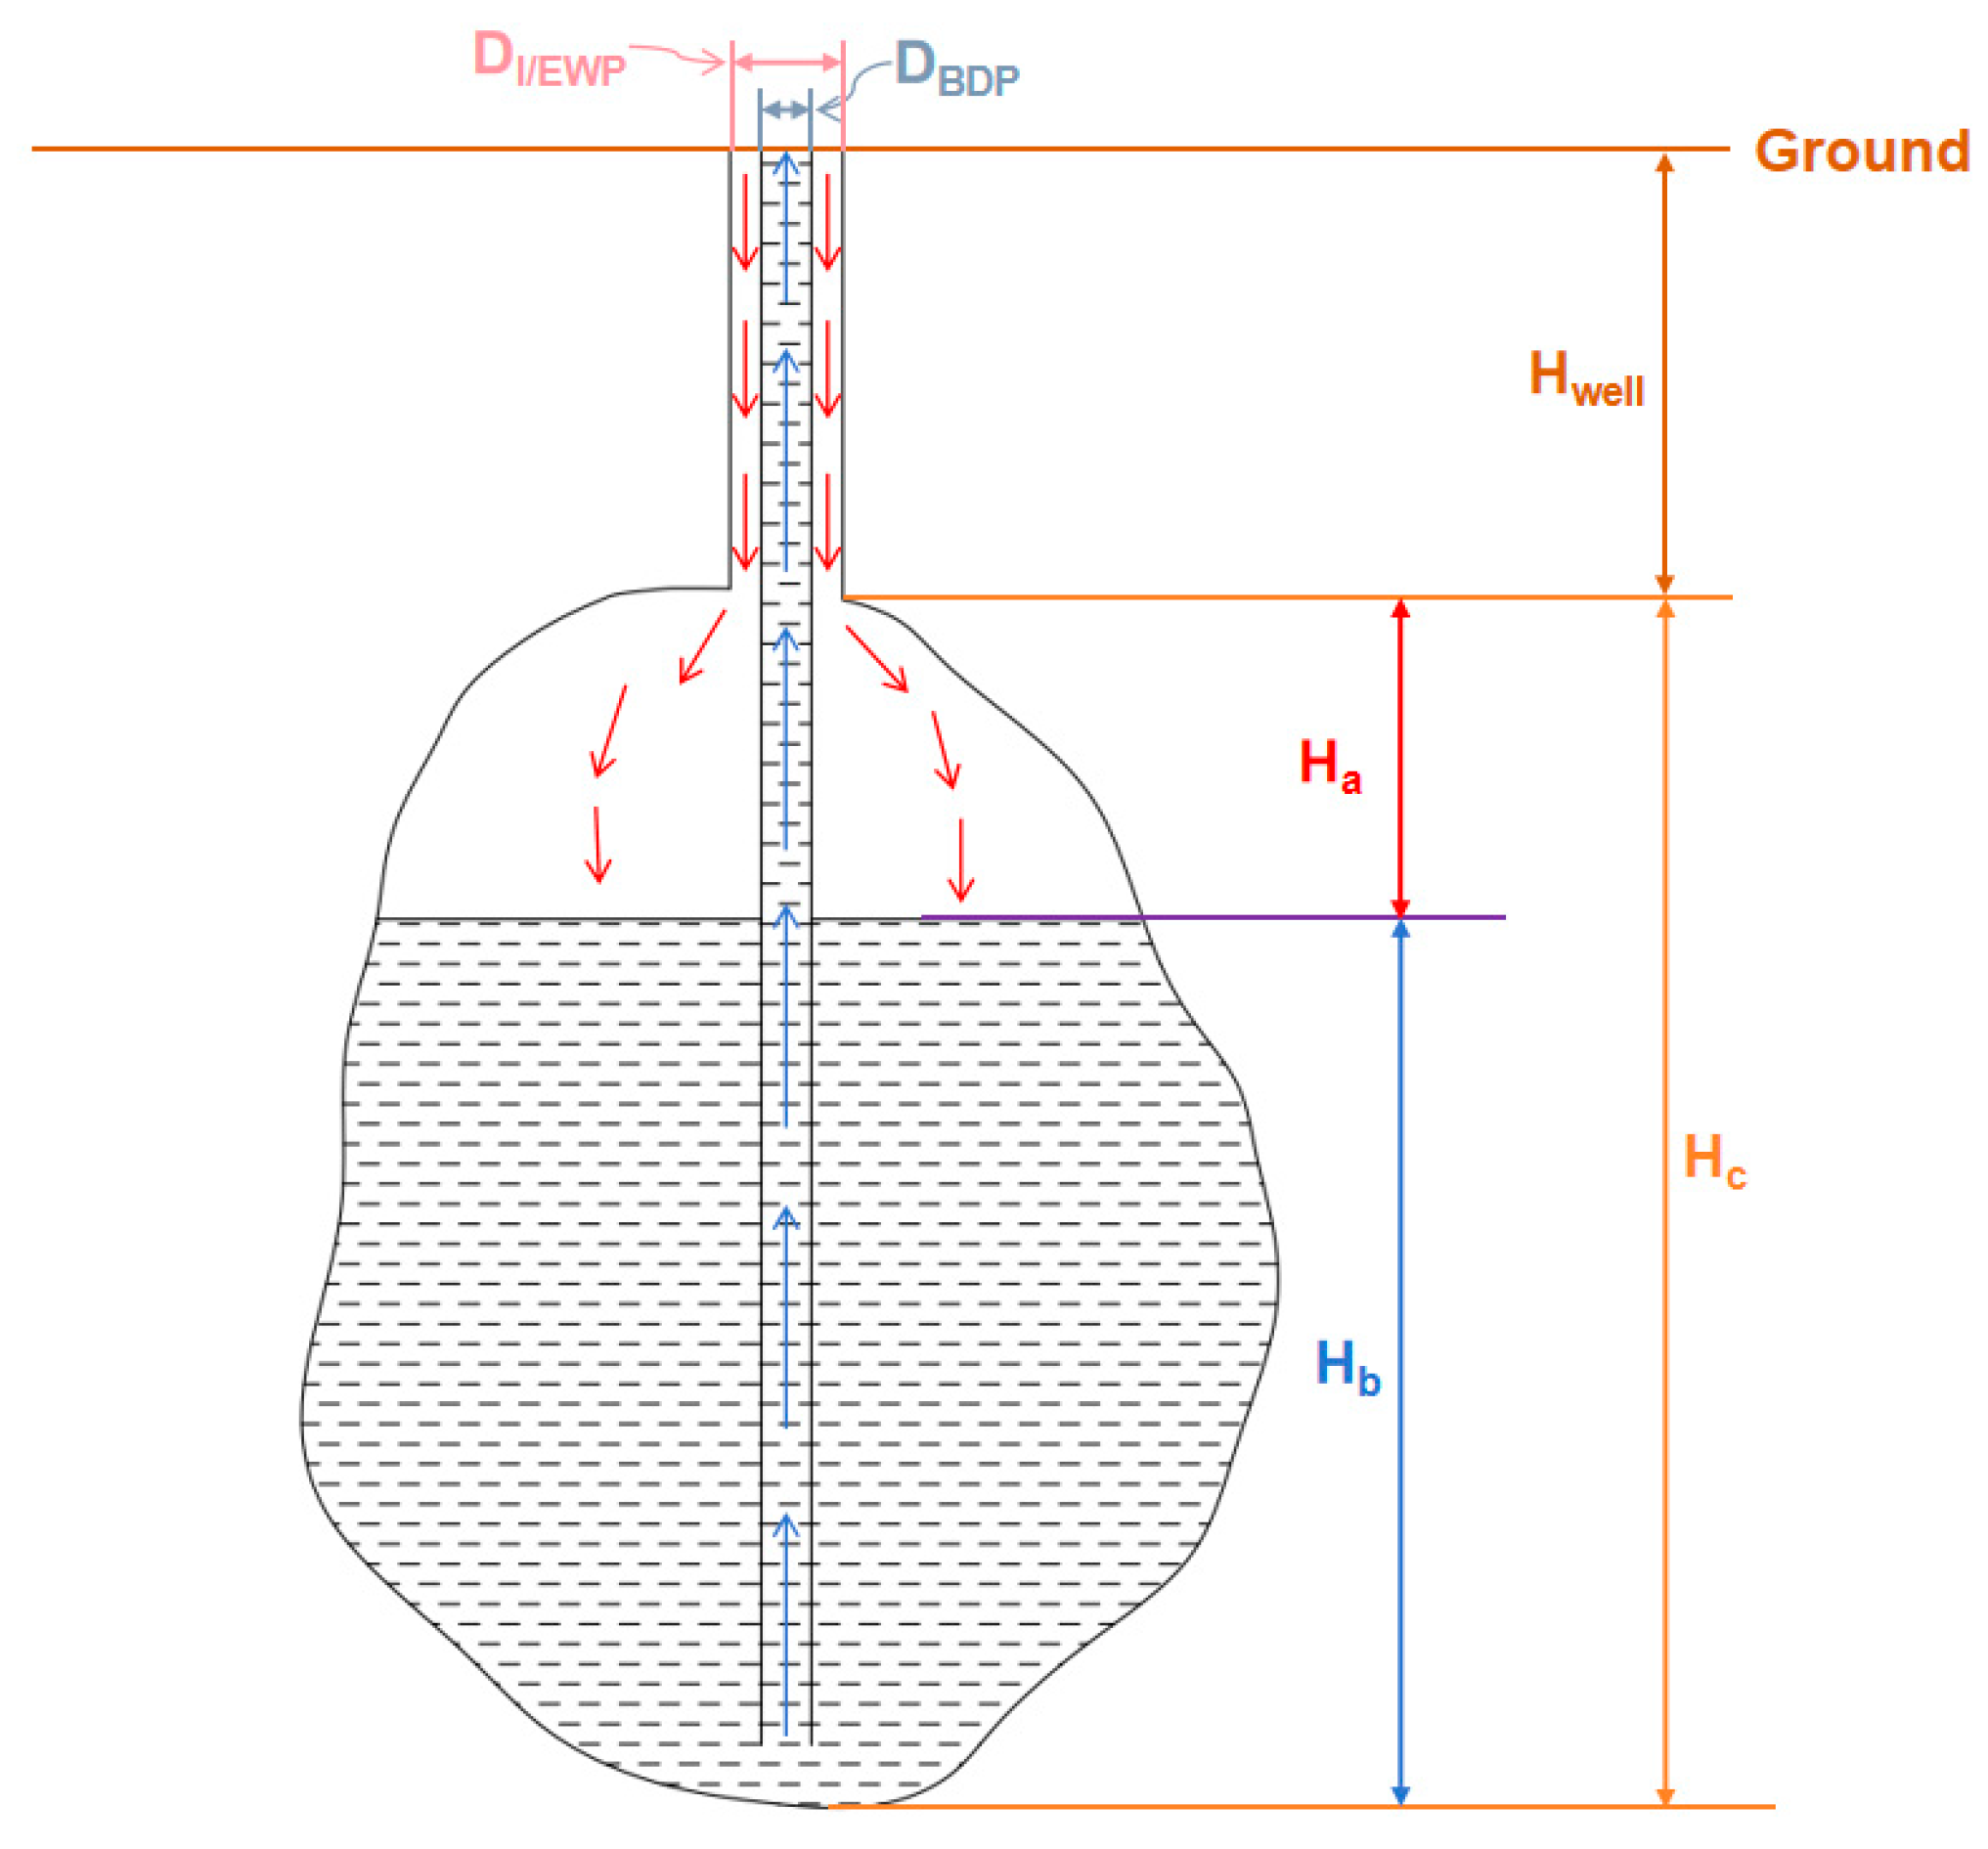
Figure 3.
Flow chart of air injection for brine drainage.

Figure 4.
Pressure and temperature variation under different time steps: (a) Pressure variation under different time steps; (b) Temperature variation under different time steps.
Figure 4.
Pressure and temperature variation under different time steps: (a) Pressure variation under different time steps; (b) Temperature variation under different time steps.
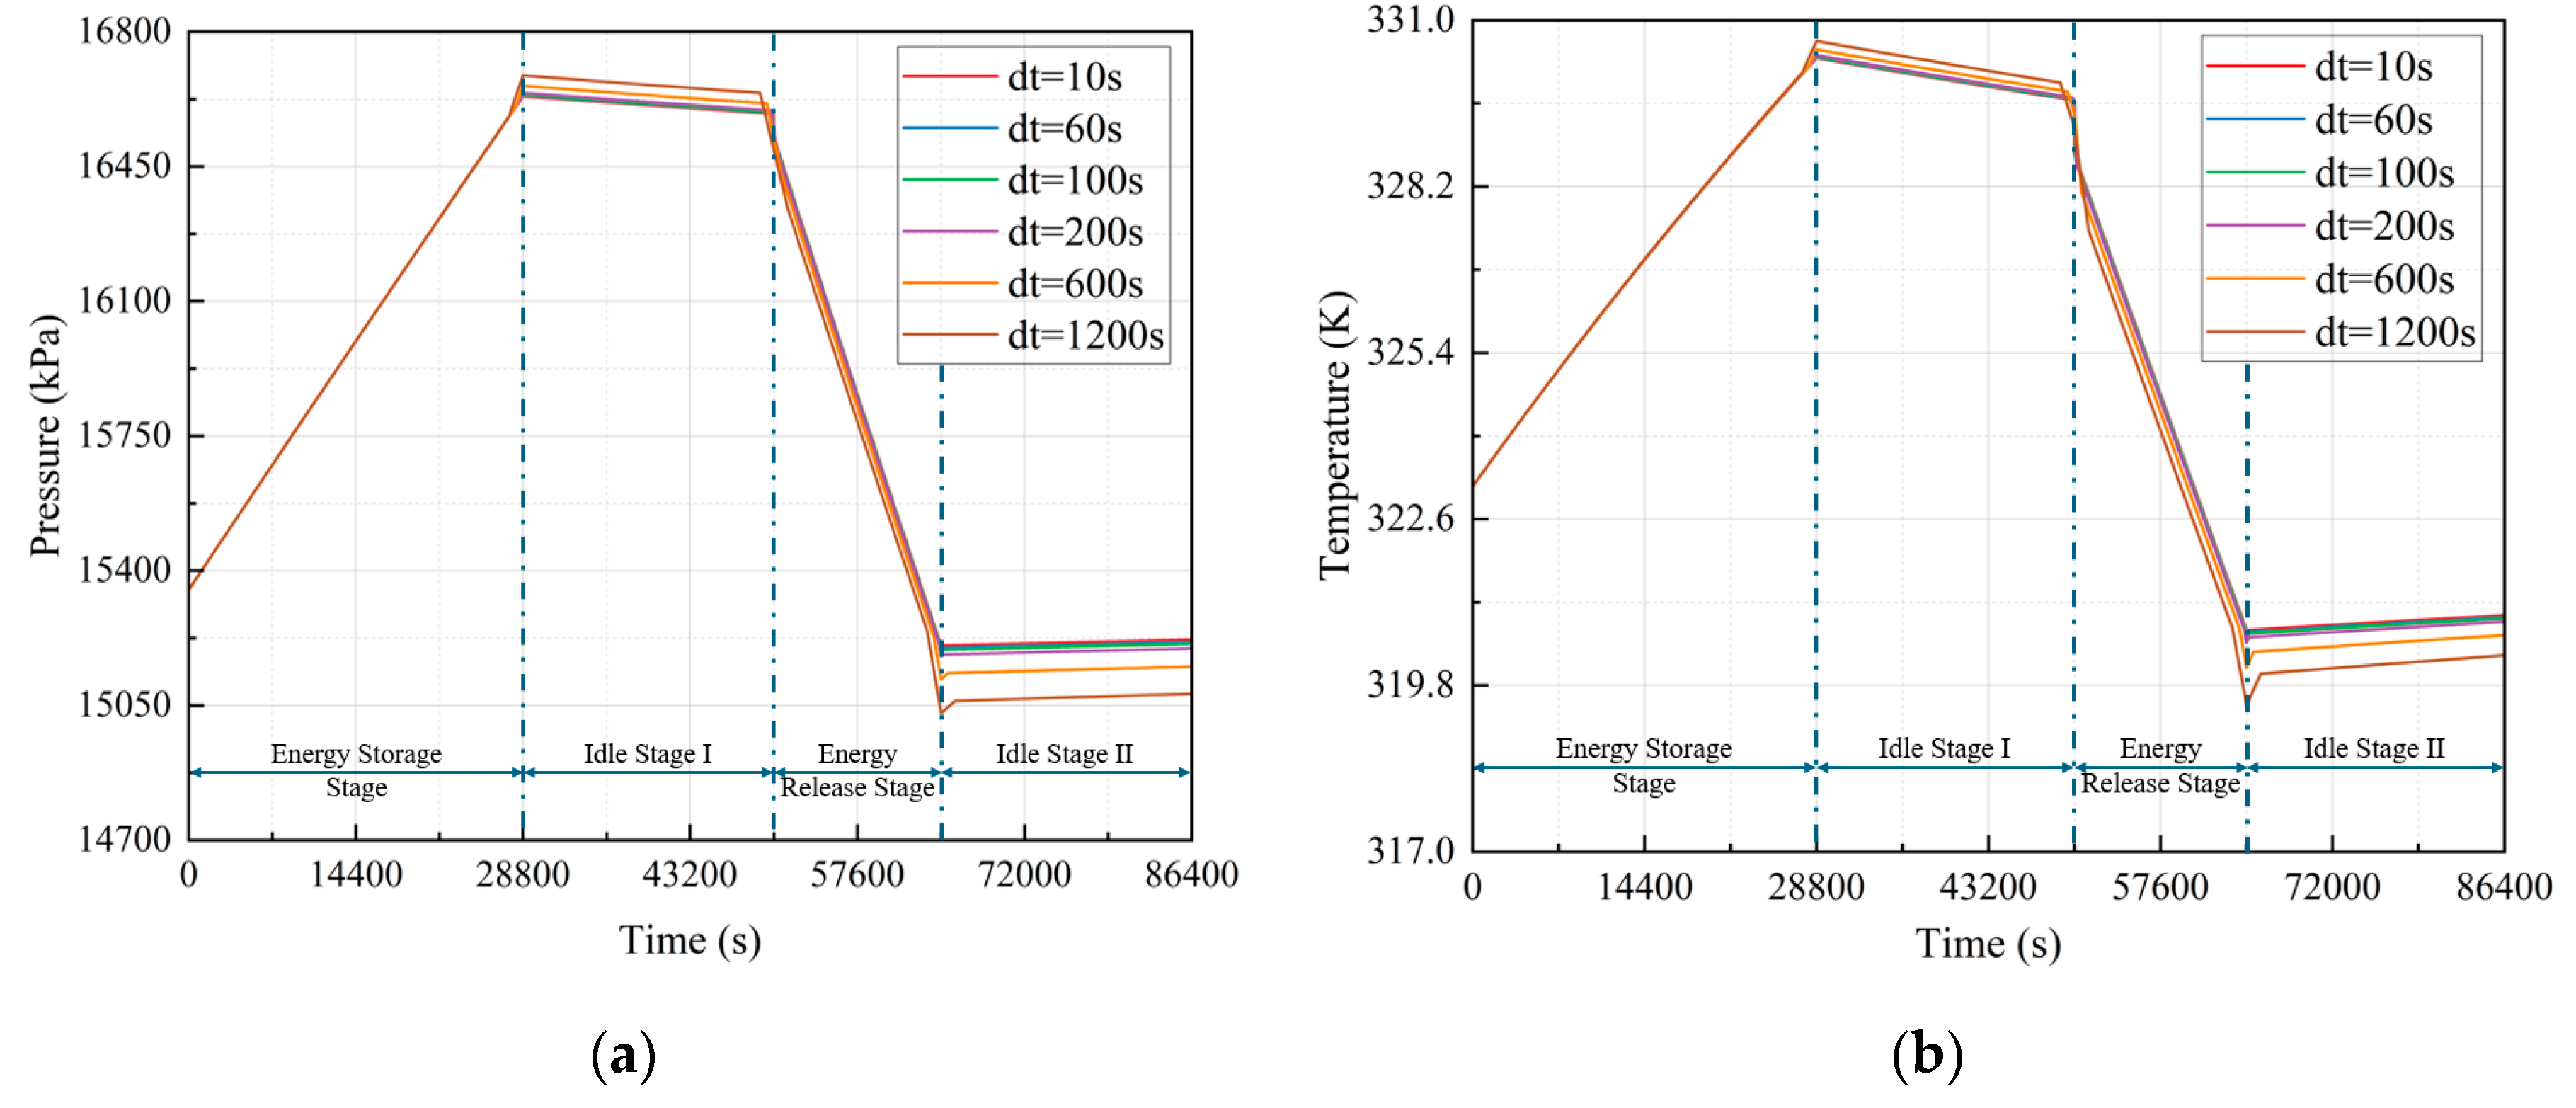
Figure 5.
Verification of time step independence.
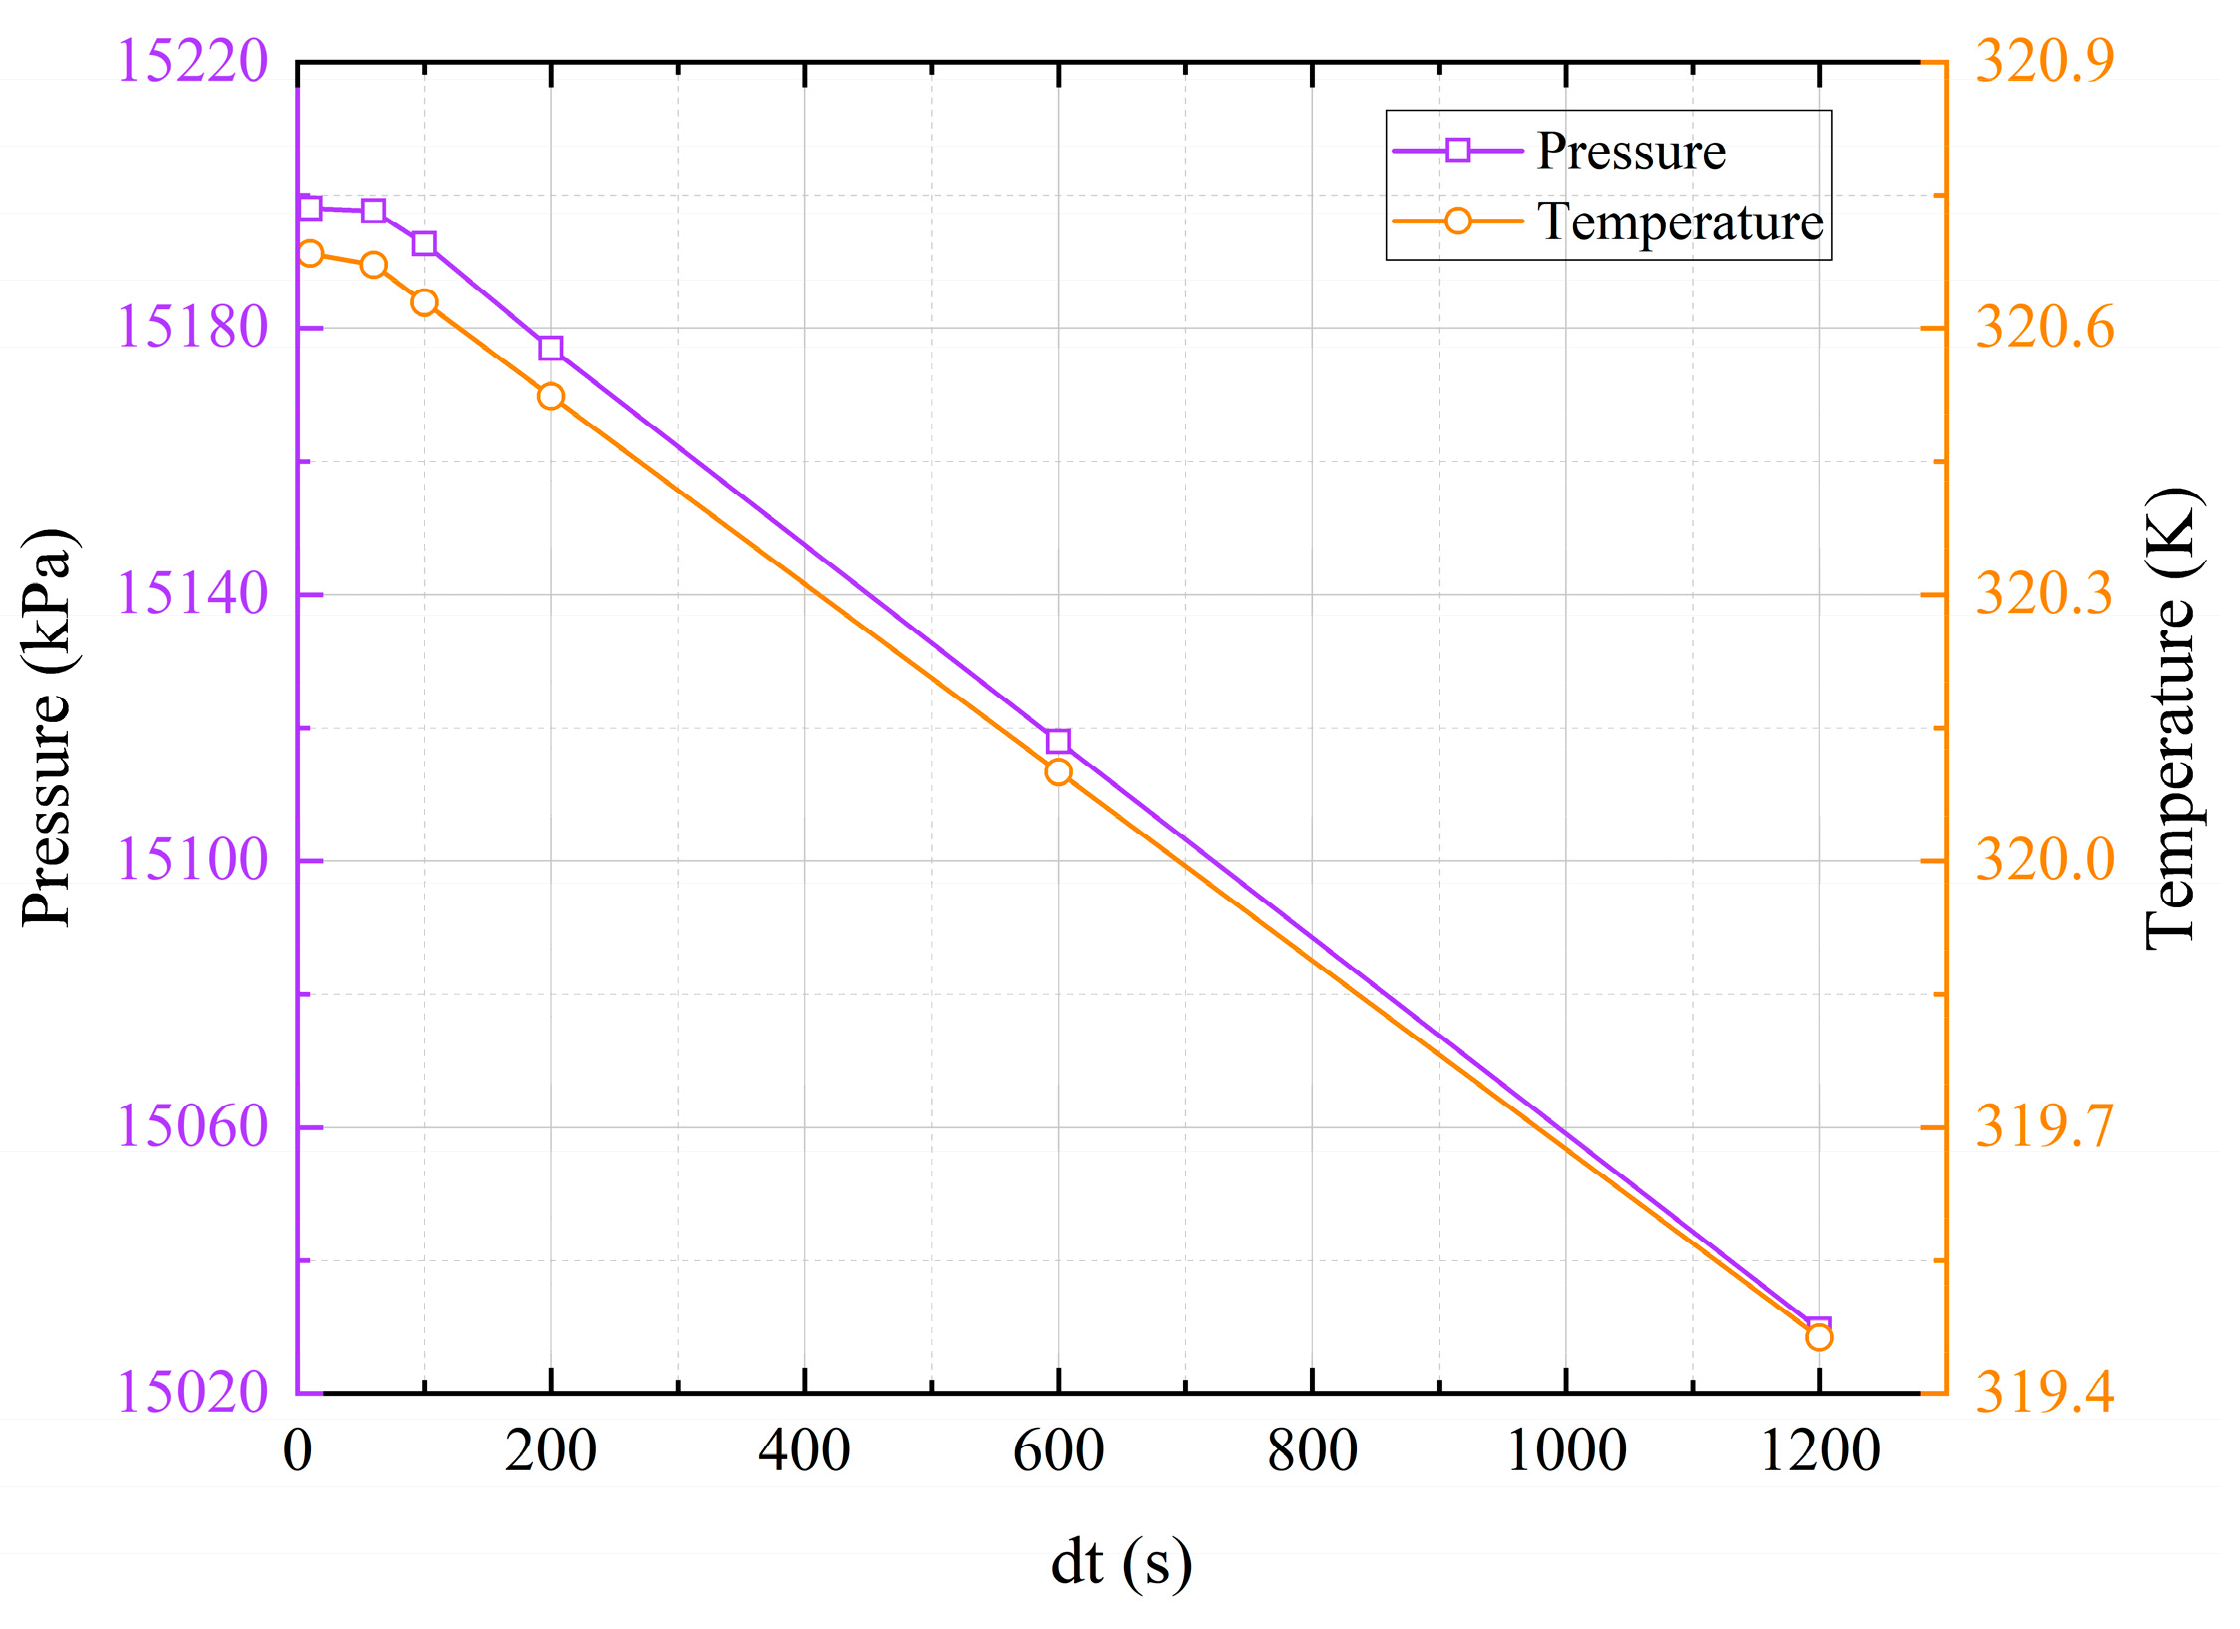
Figure 6.
Variation of air mass in the cavern
Figure 7.
Comparison of simulation results and test data for Huntorf plant: (a) Pressure variation in the cavern; (b) Temperature variation in the cavern.
Figure 7.
Comparison of simulation results and test data for Huntorf plant: (a) Pressure variation in the cavern; (b) Temperature variation in the cavern.
Figure 8.
Duration at various stages under different injection flow rates.
Figure 9.
Maximum temperature of air under different injection flow rates.
Figure 10.
Pressure and temperature of air when completing of brine drainage.
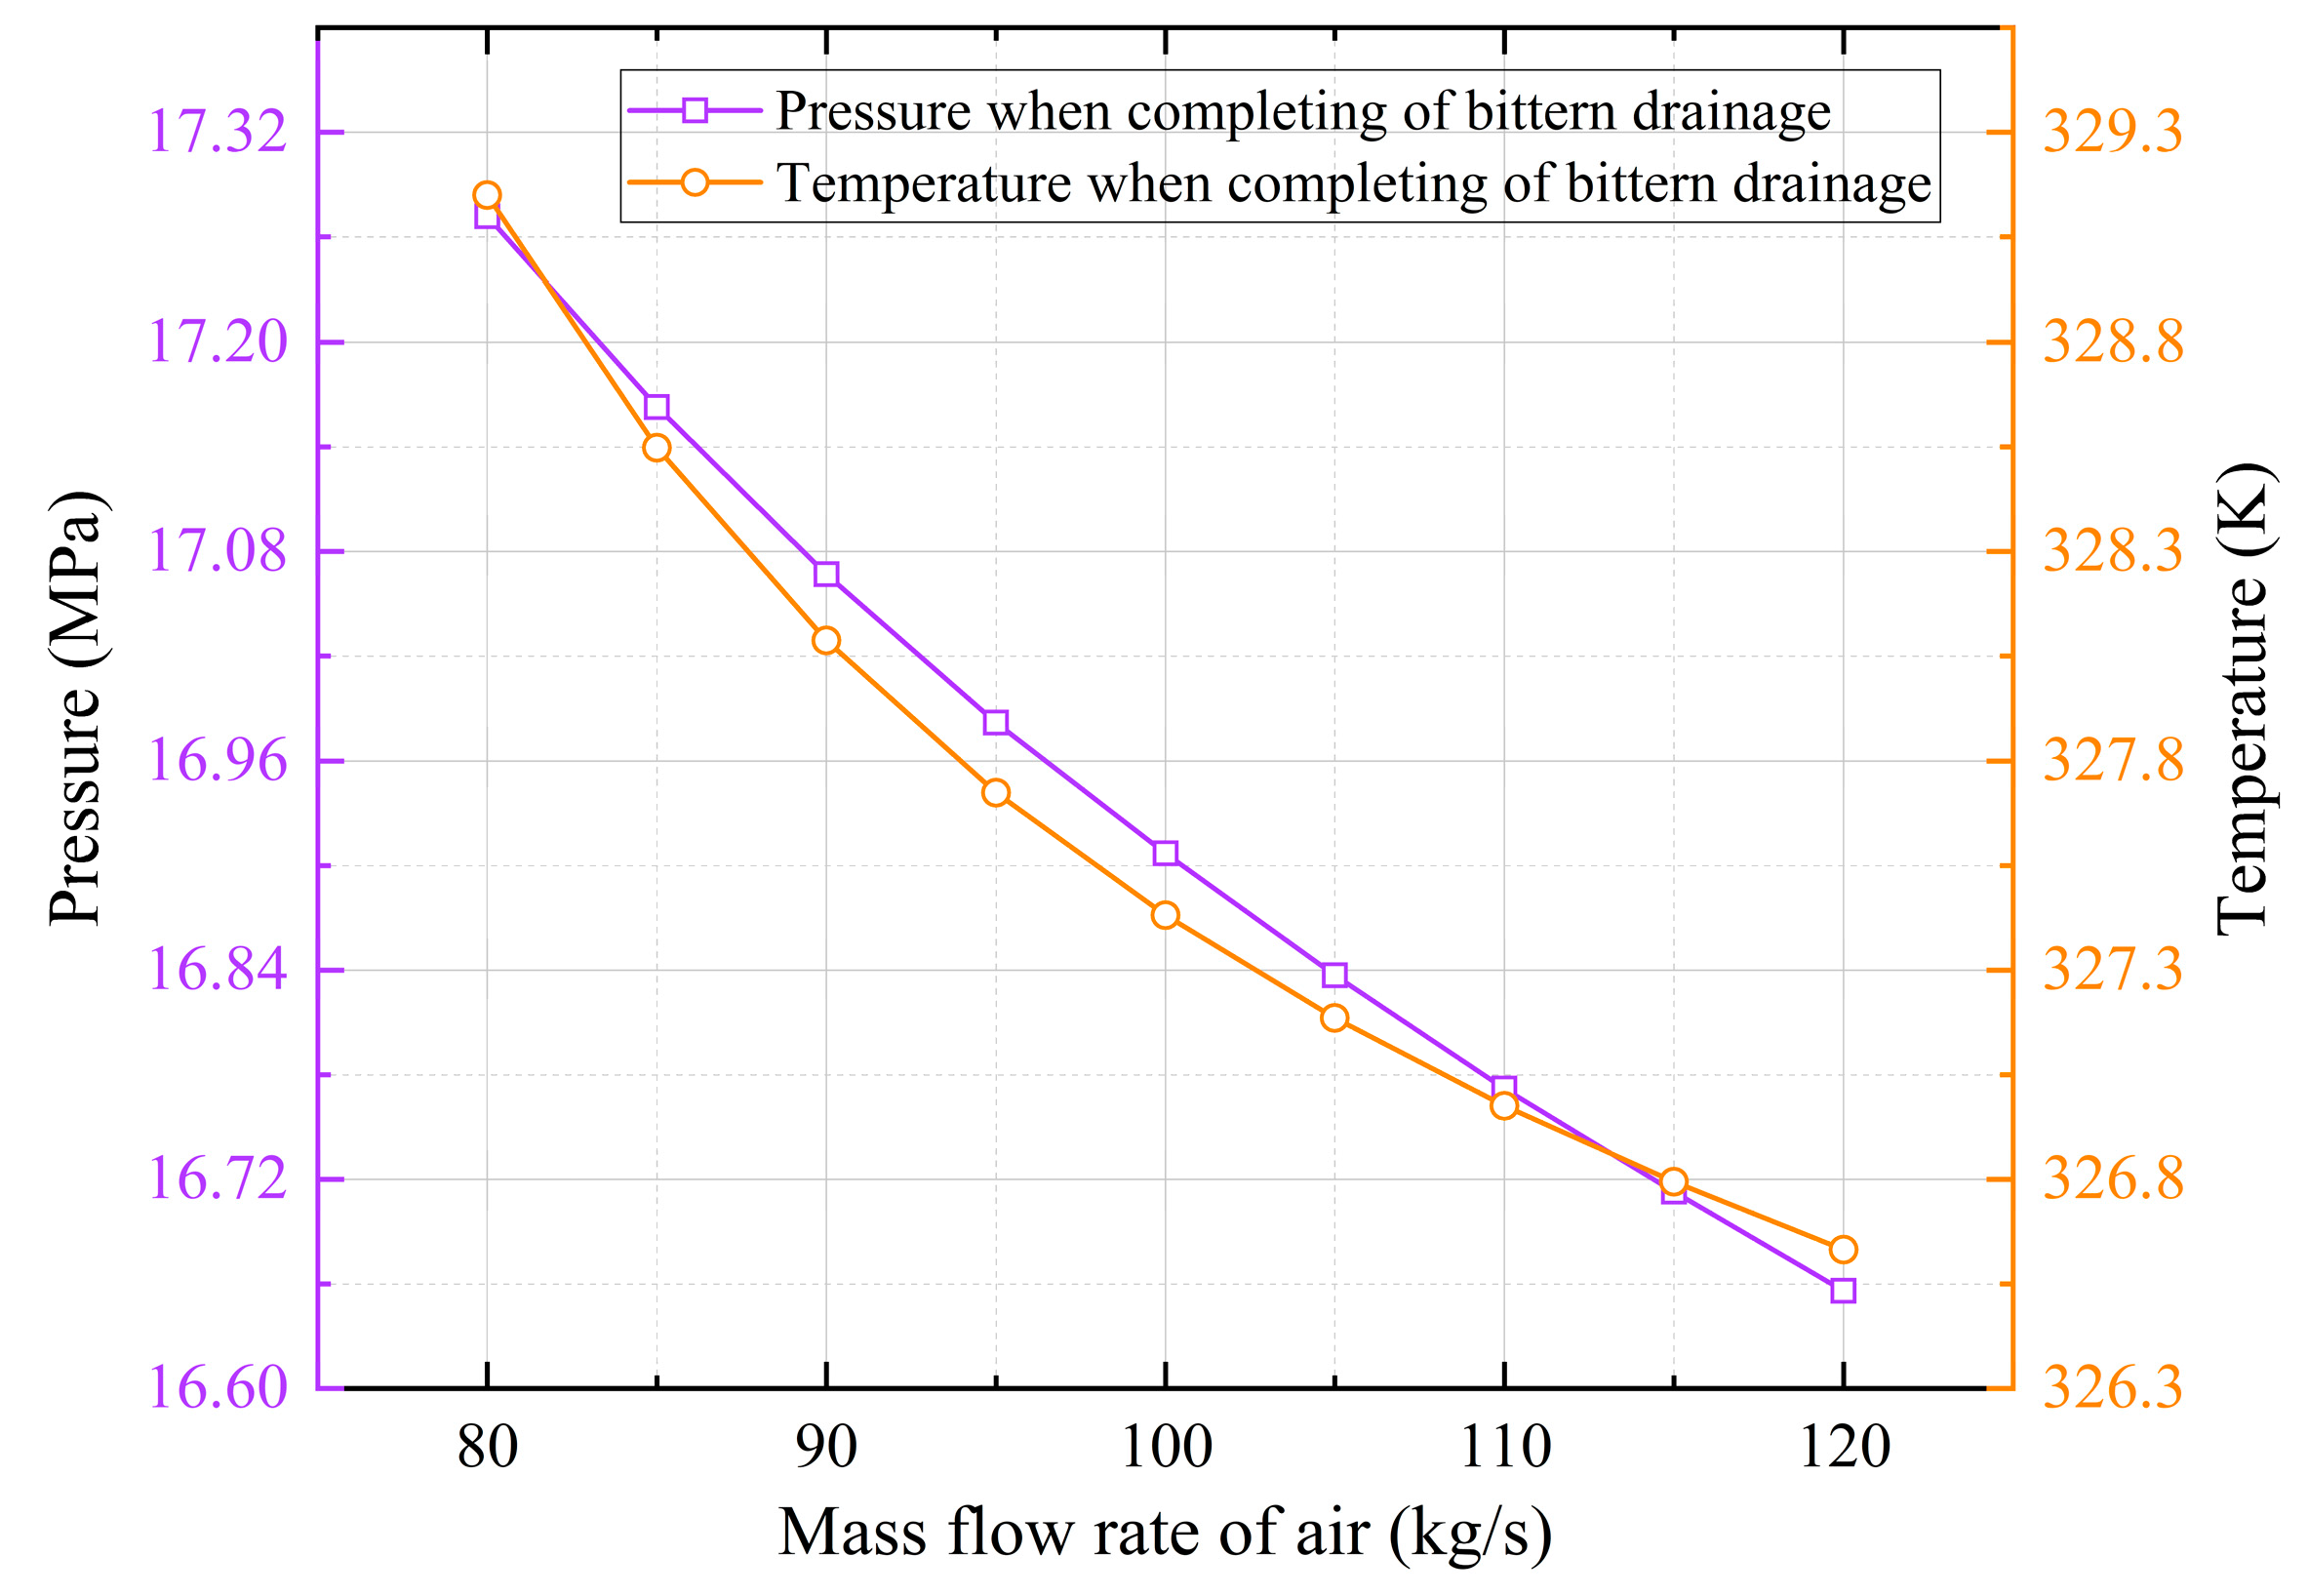
Figure 11.
Pressure variation of air under different injection flow rates.
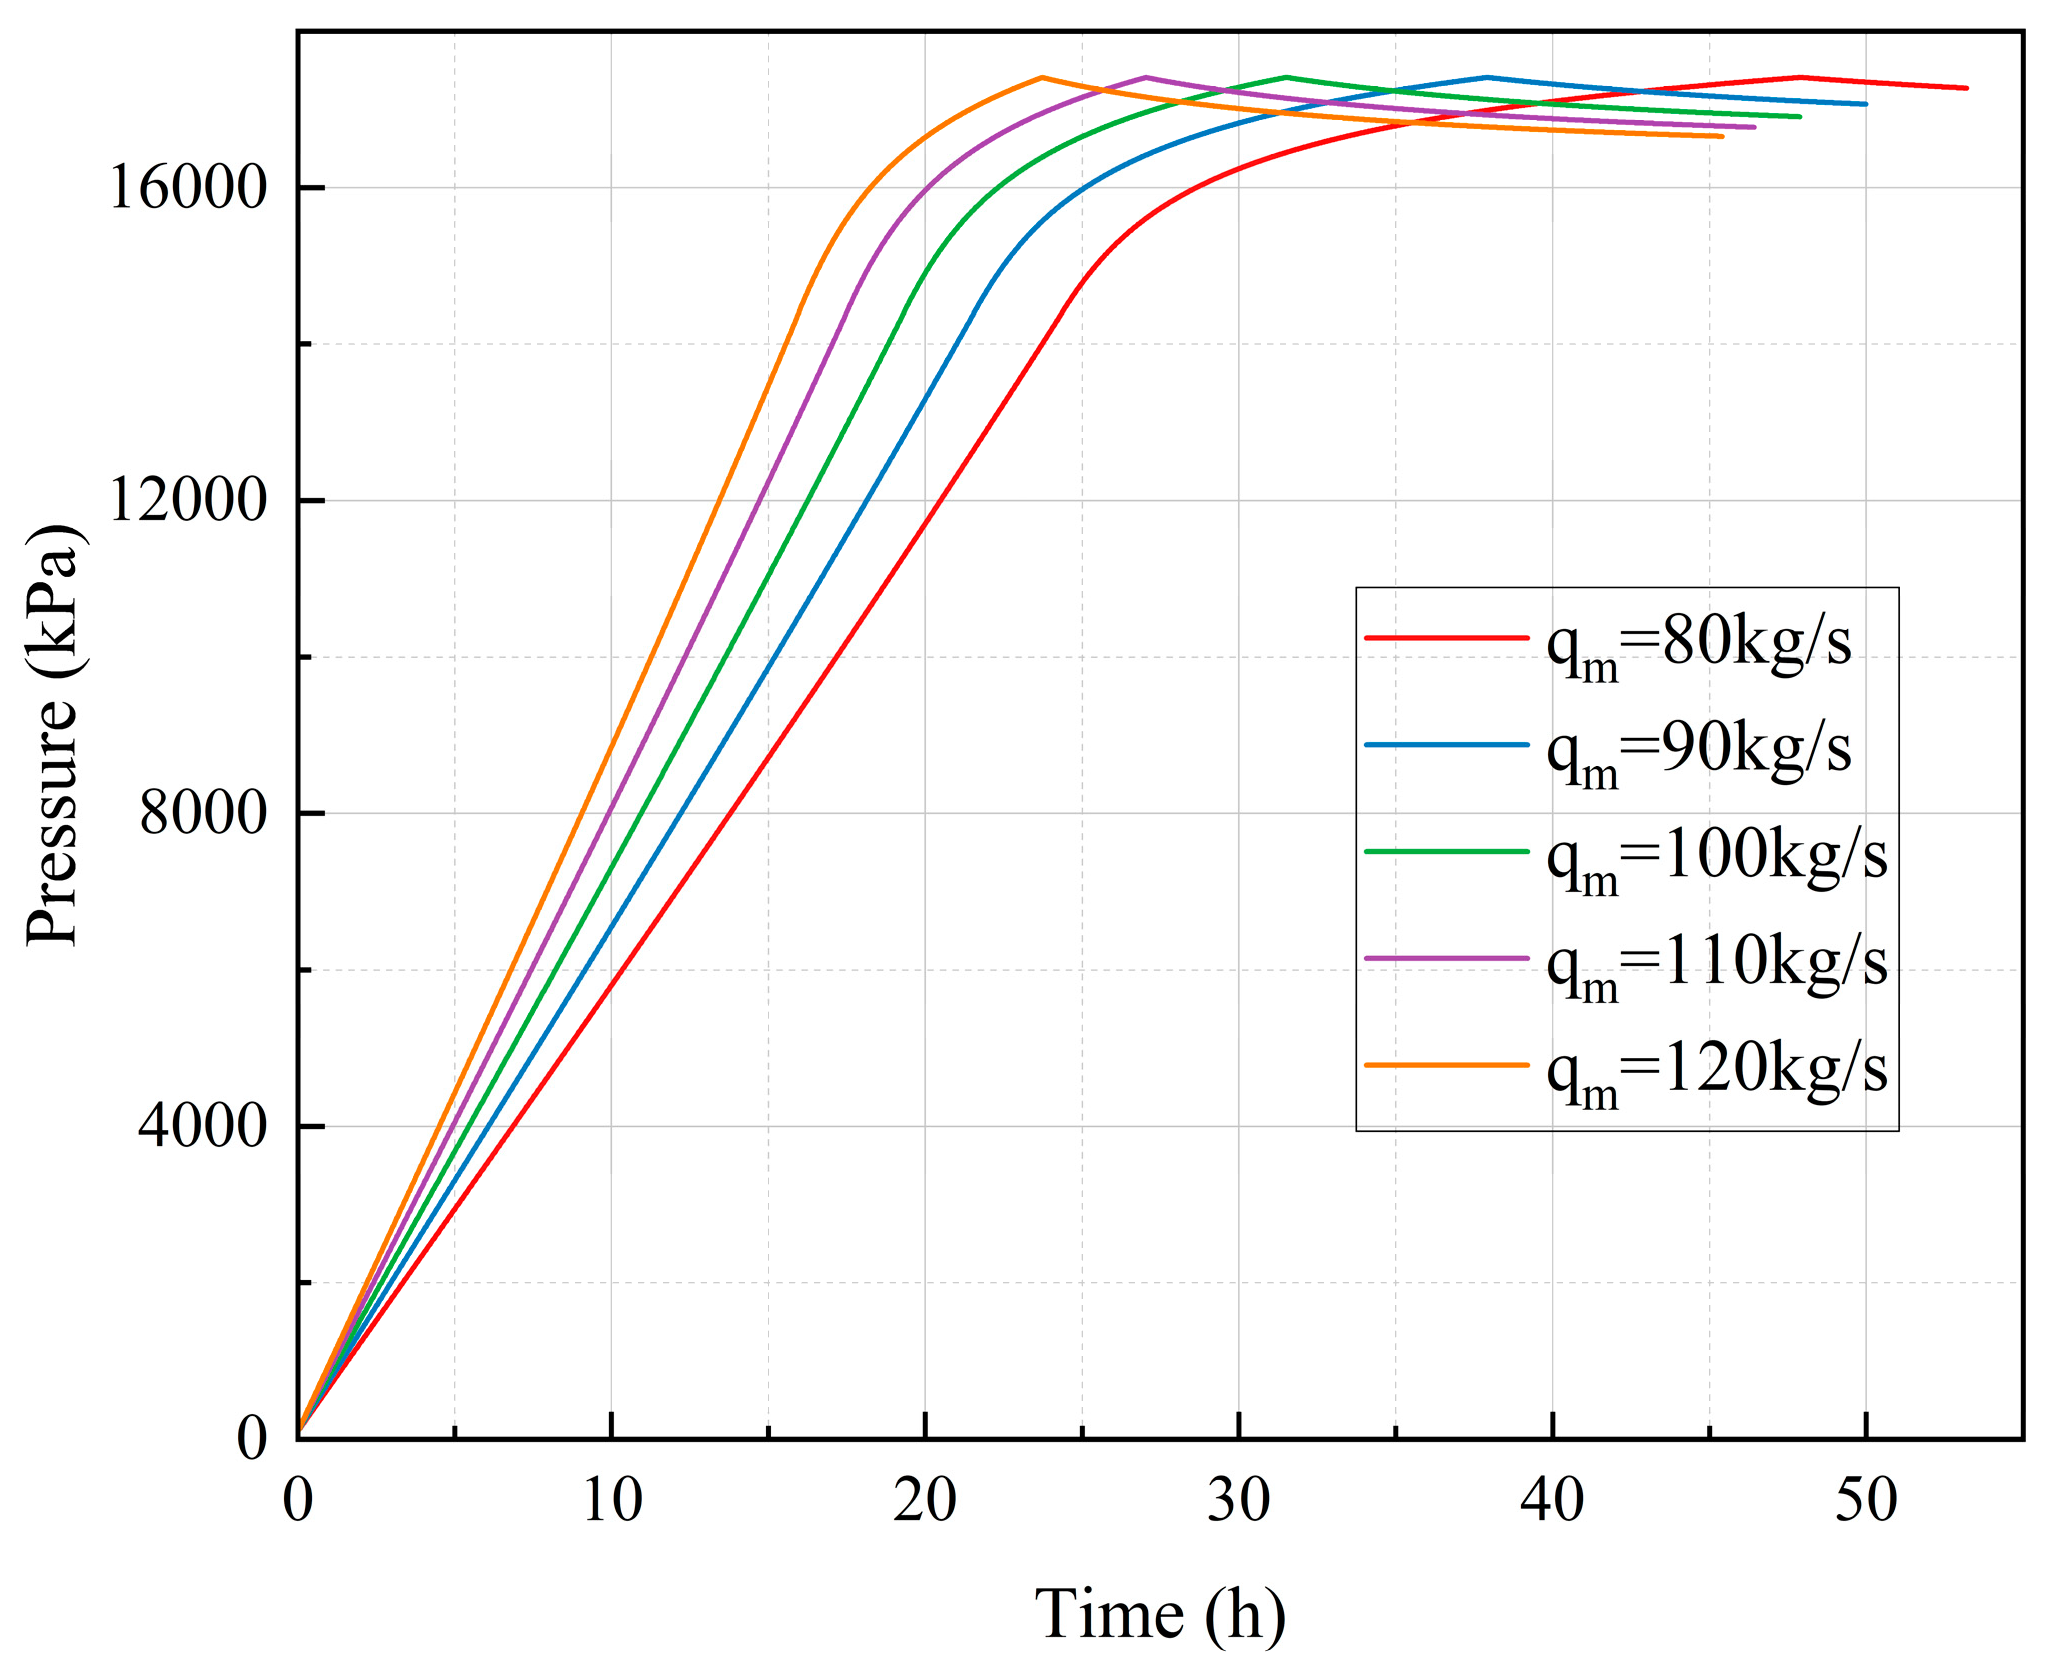
Figure 12.
Temperature variation of air under different injection flow rates.
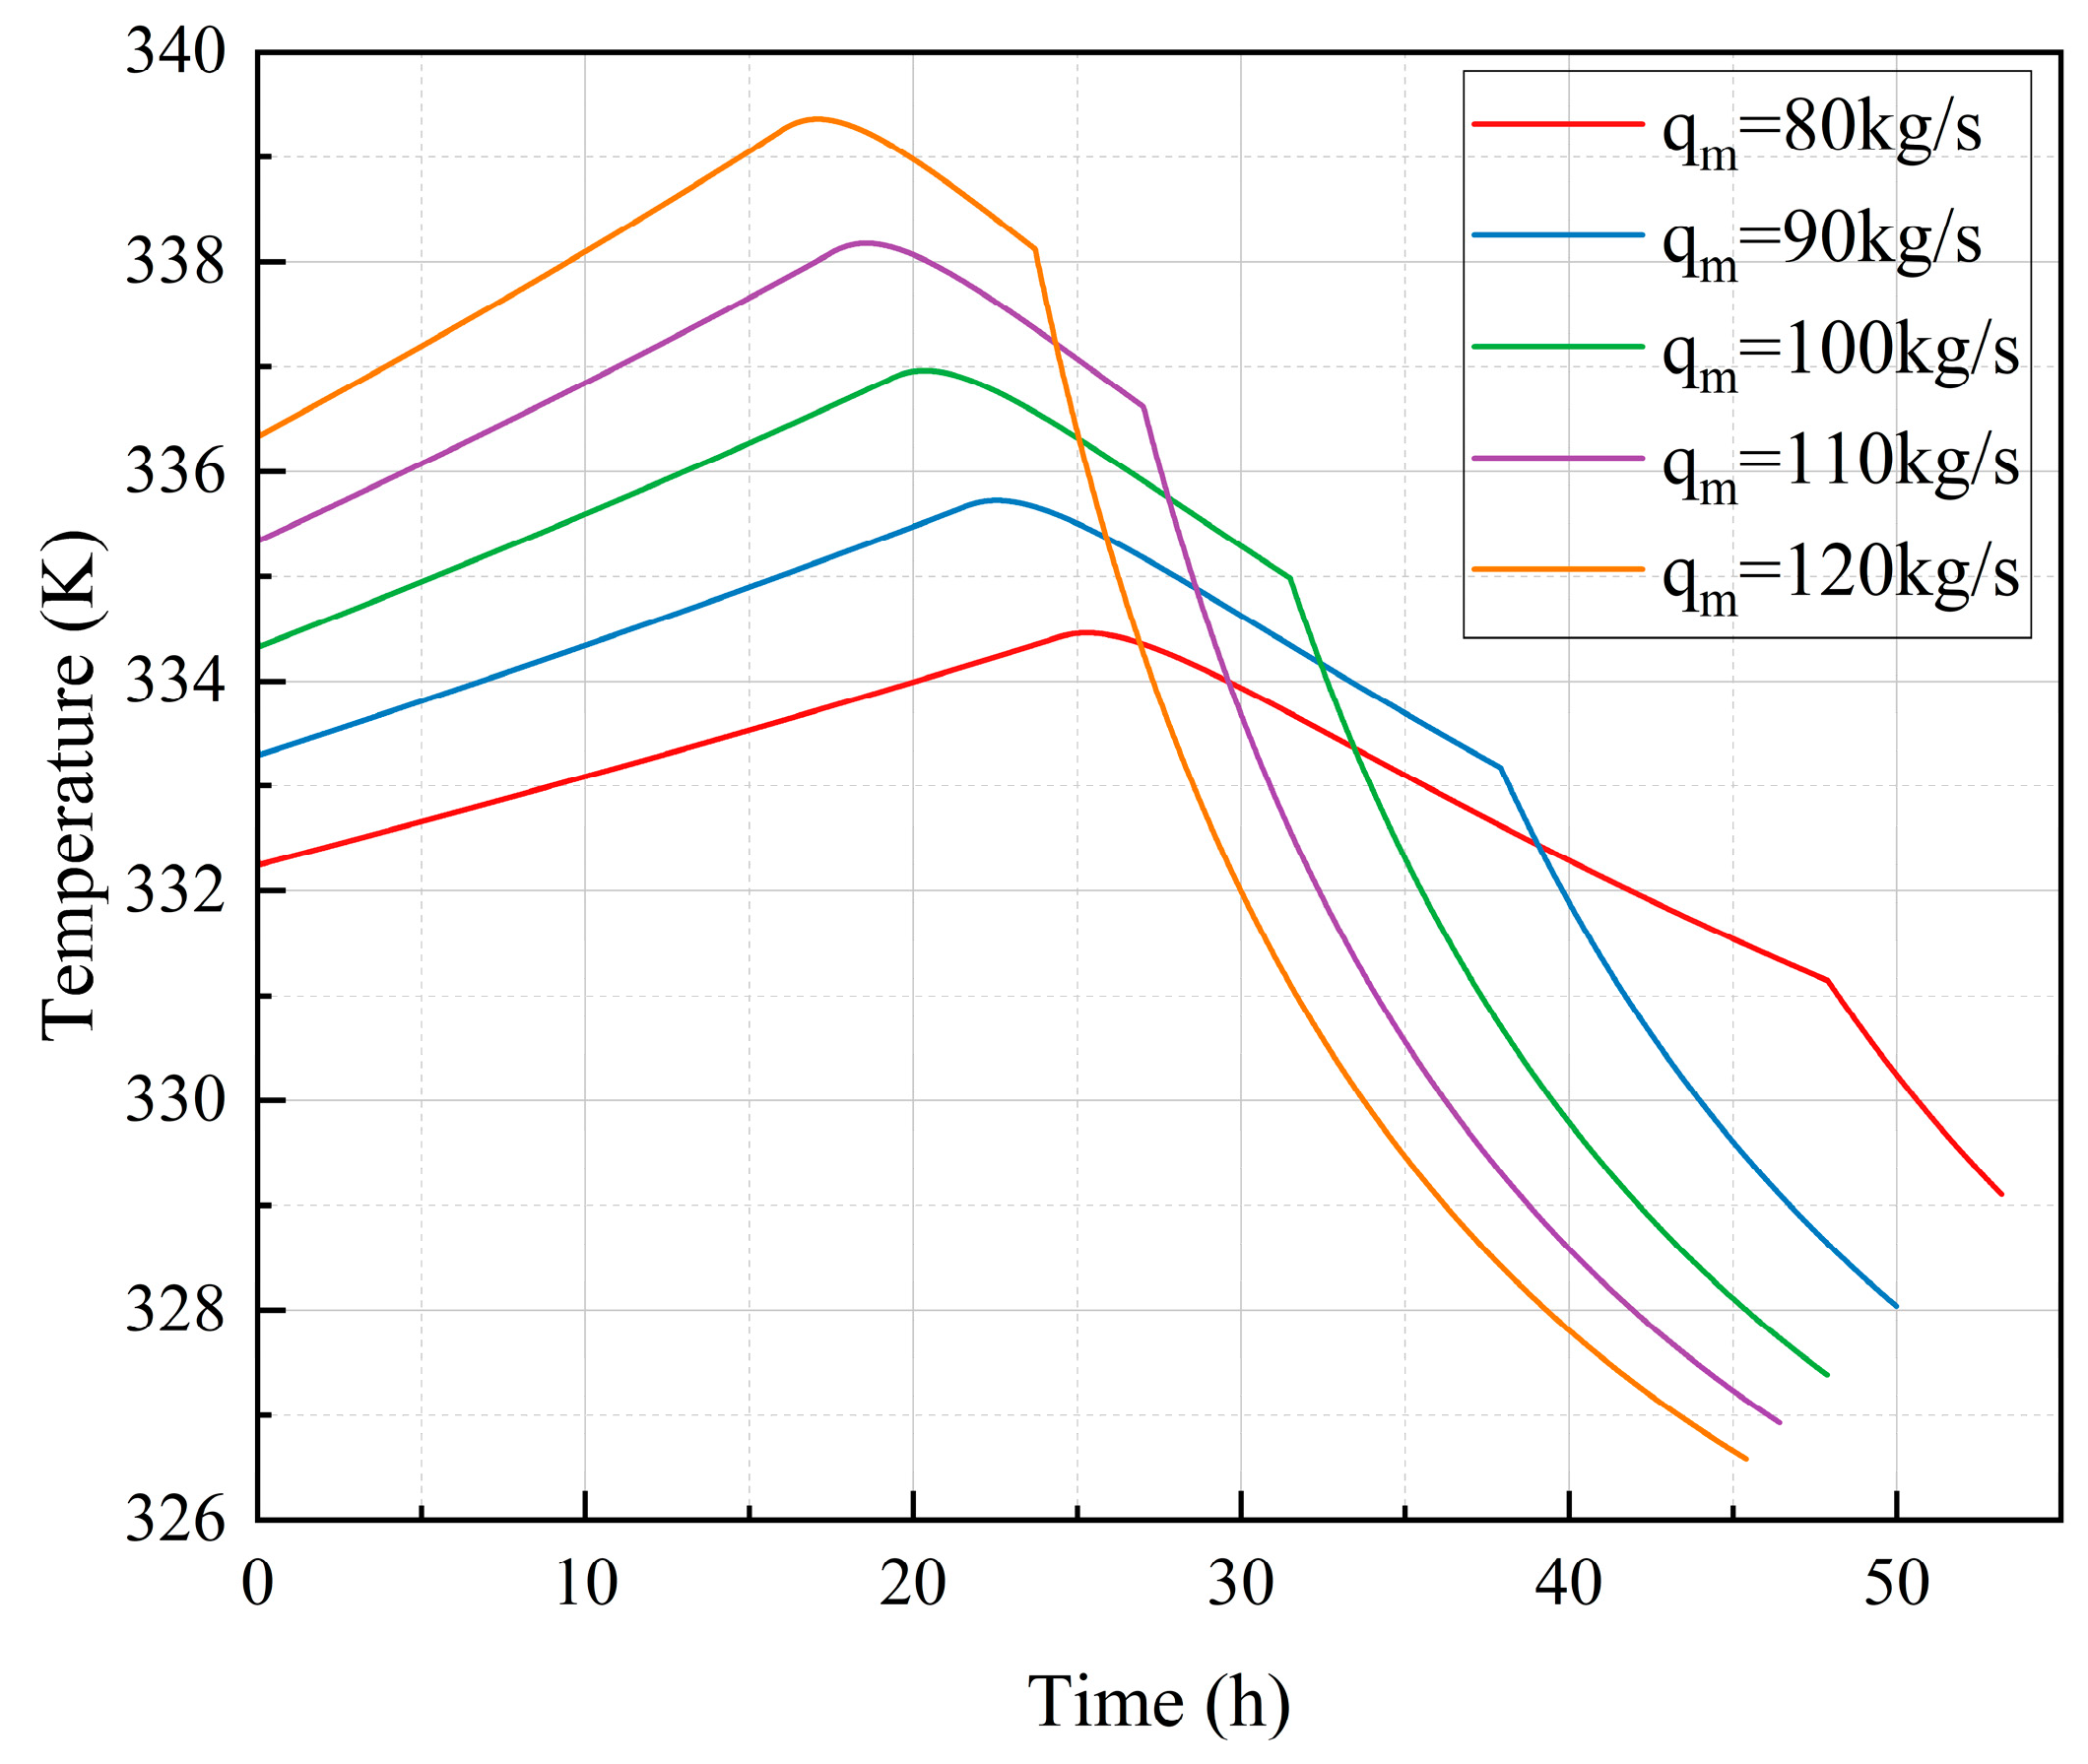
Figure 13.
Velocity variation of brine under different injection flow rates.
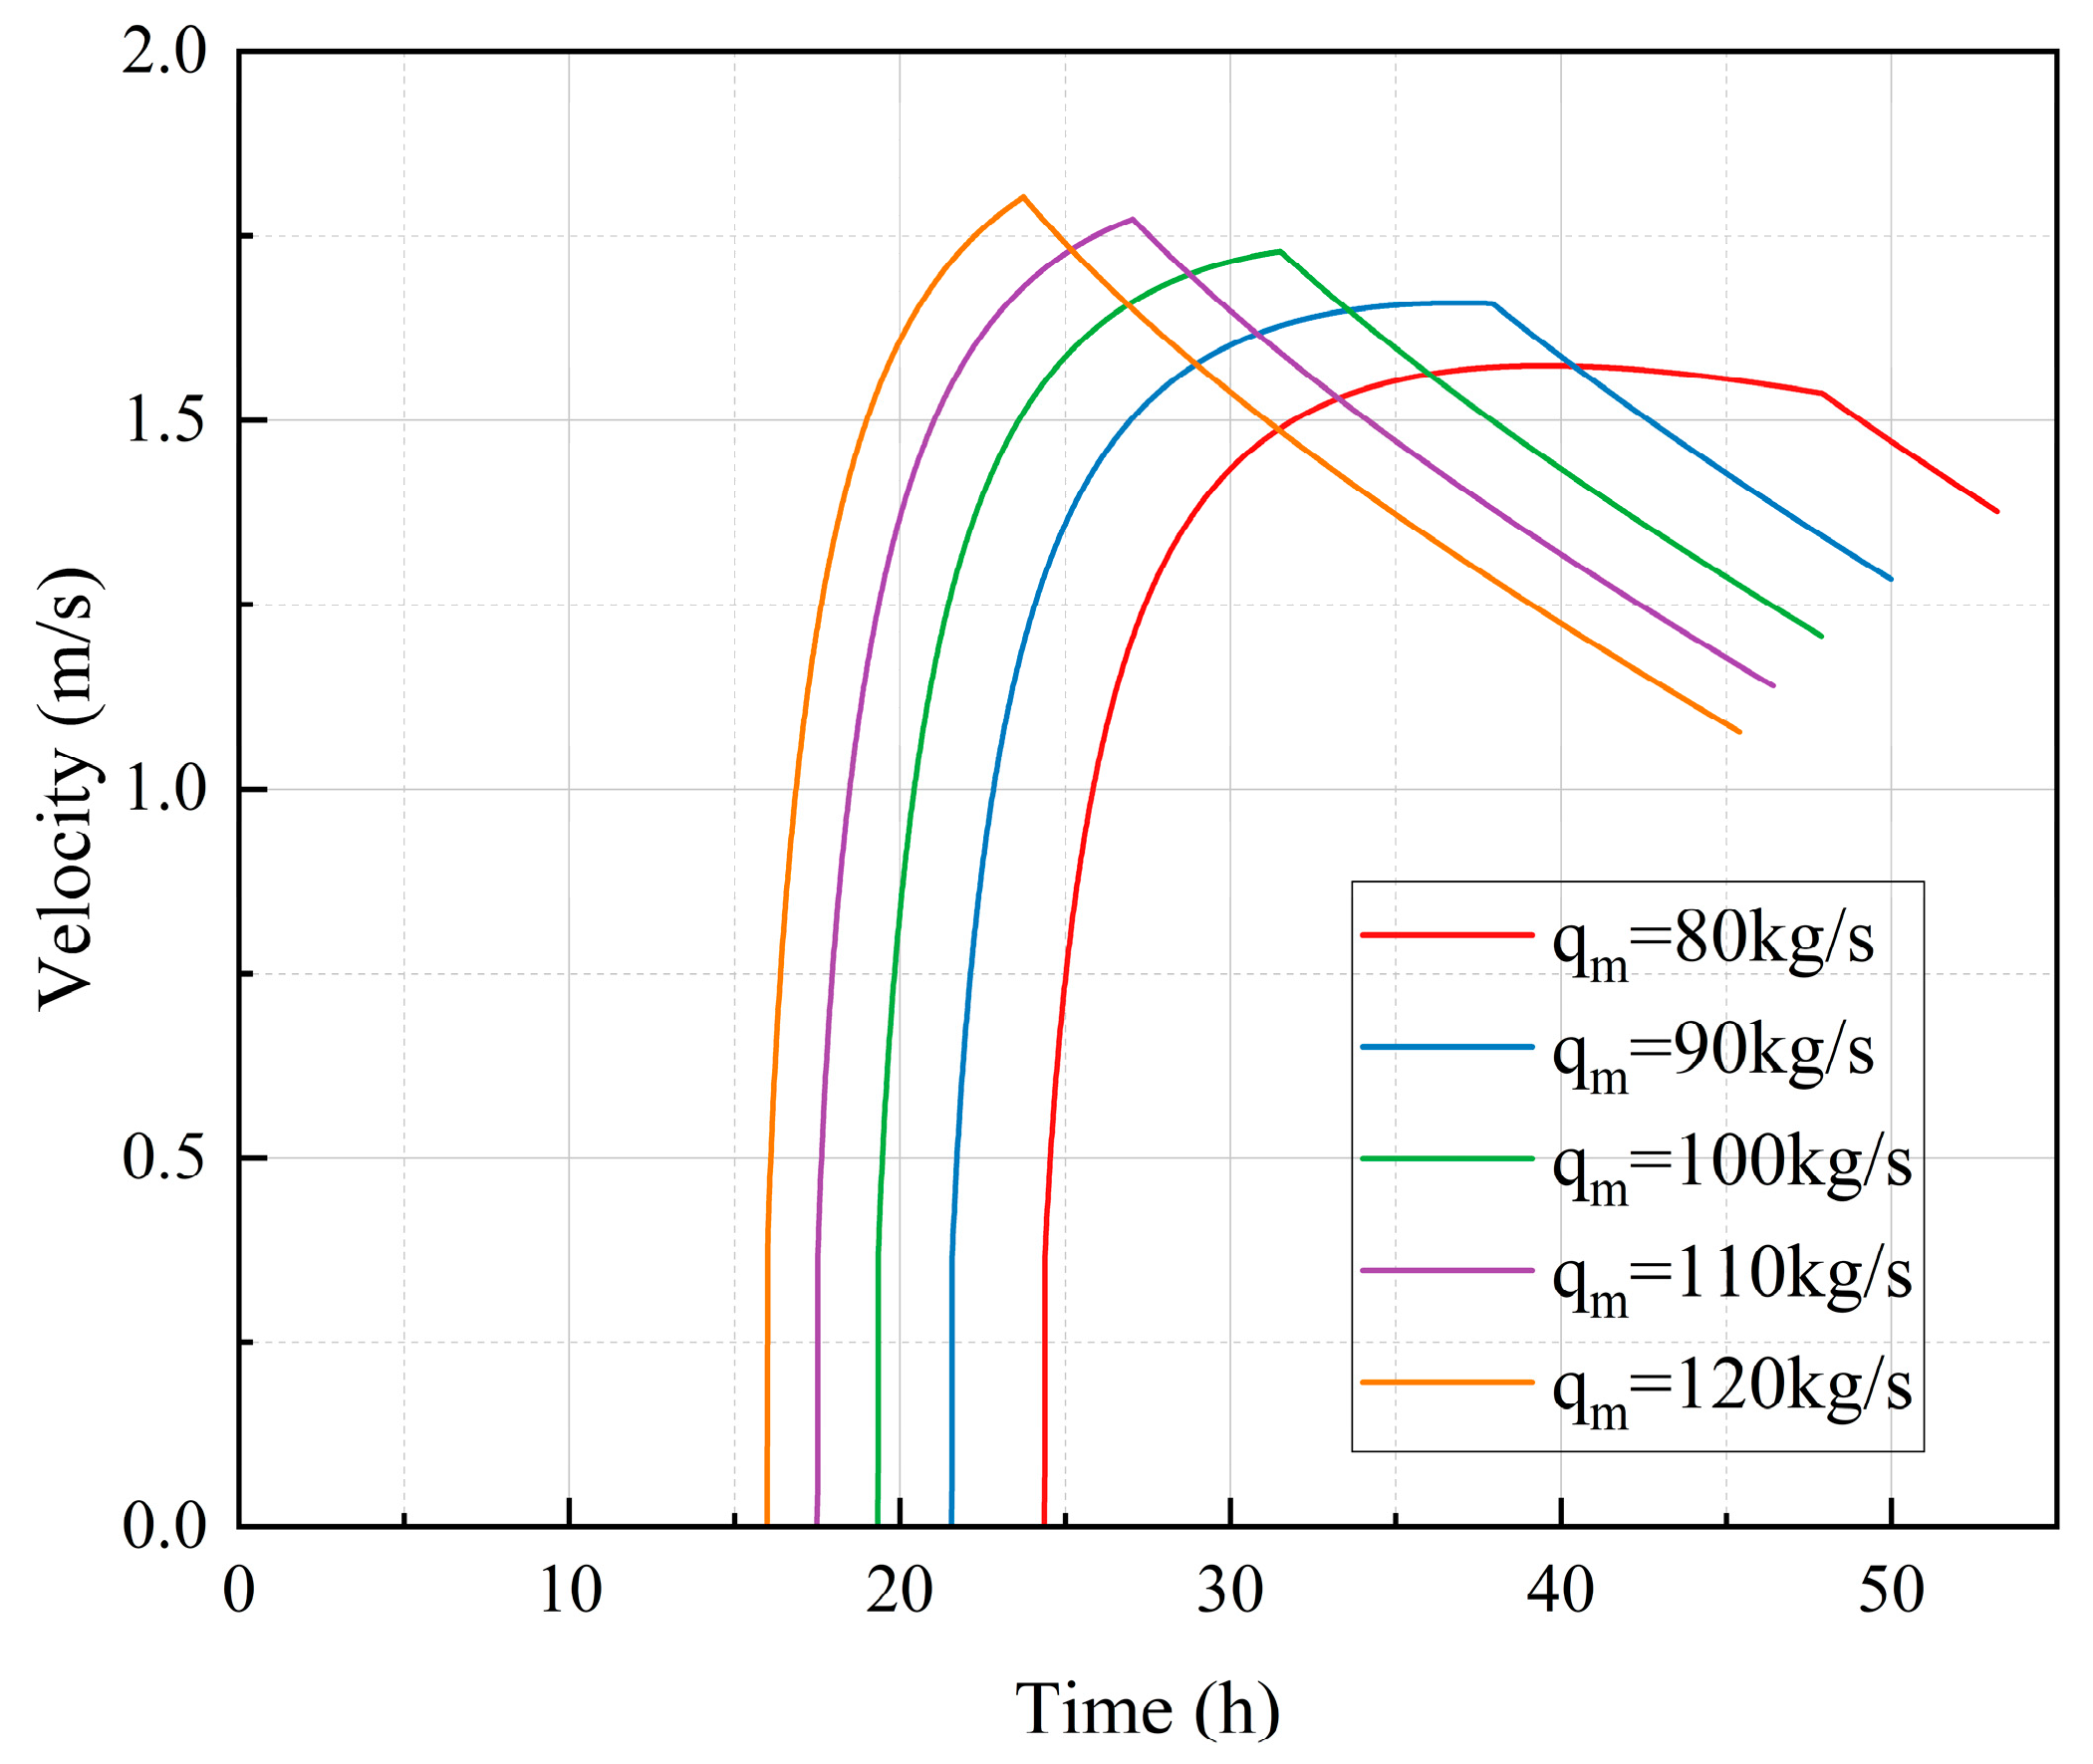
Figure 14.
Duration at various stages under different BDP cross-sectional area.
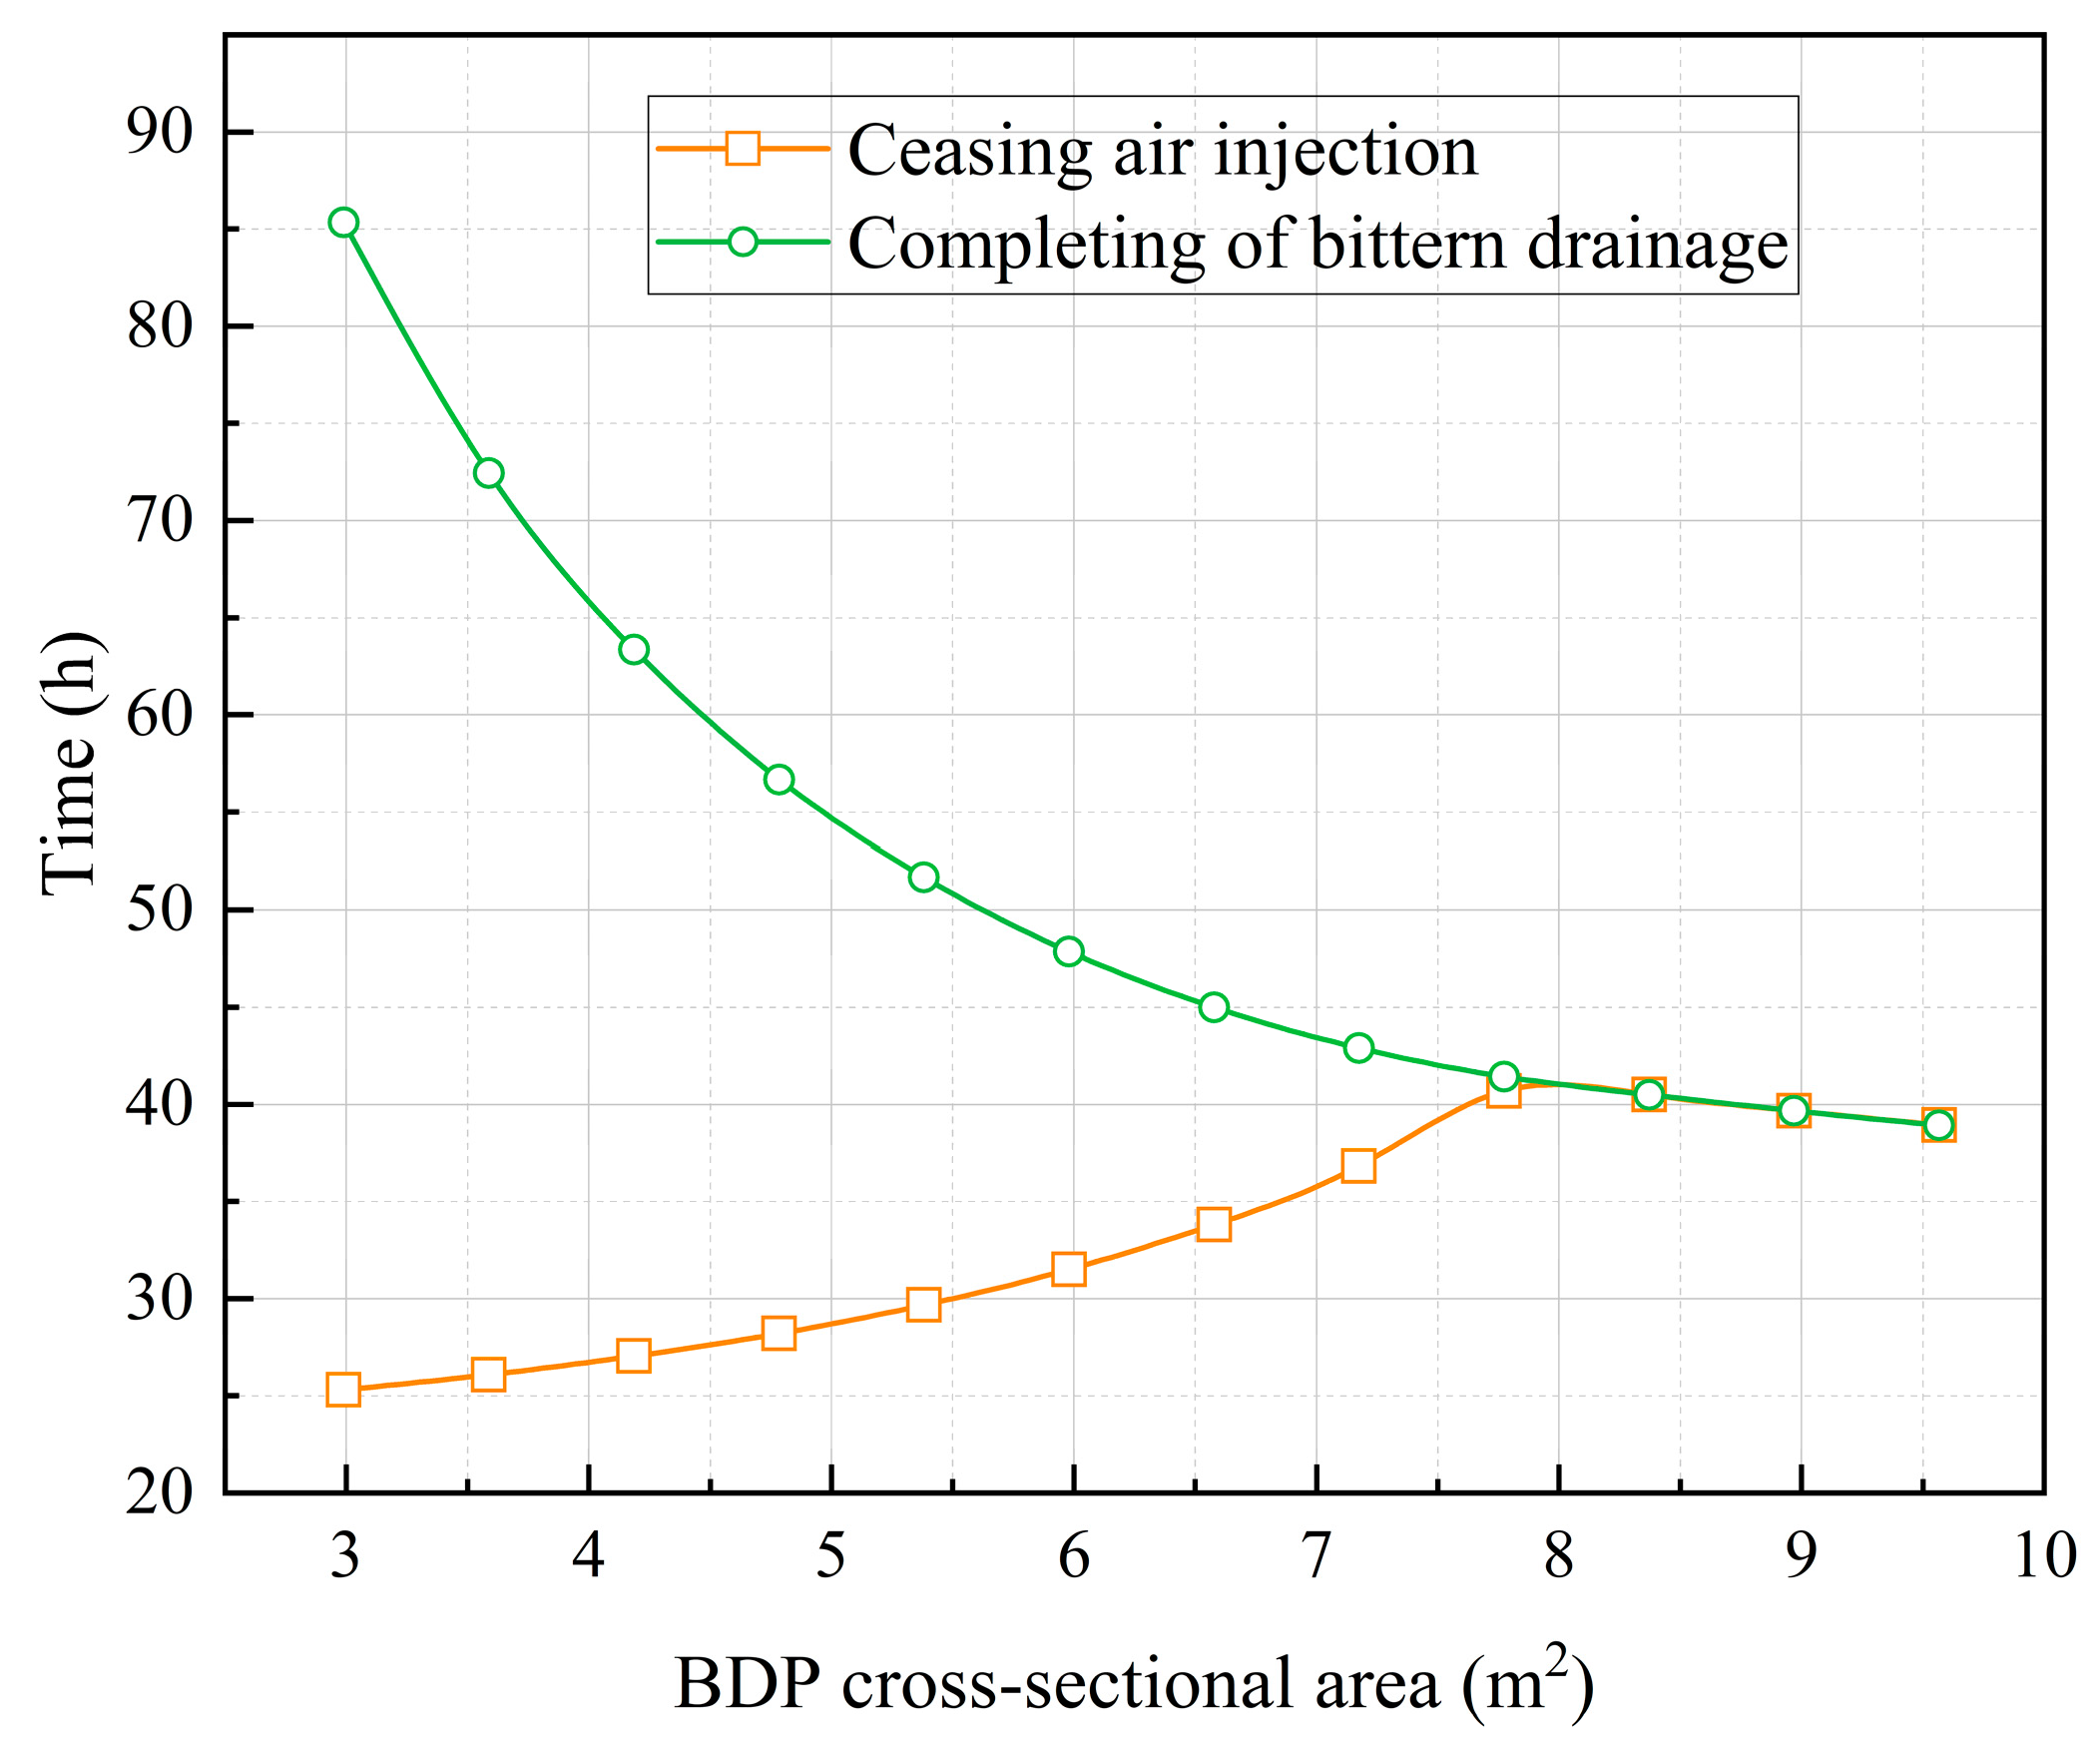
Figure 15.
Maximum temperature of air under different BDP cross-sectional area.
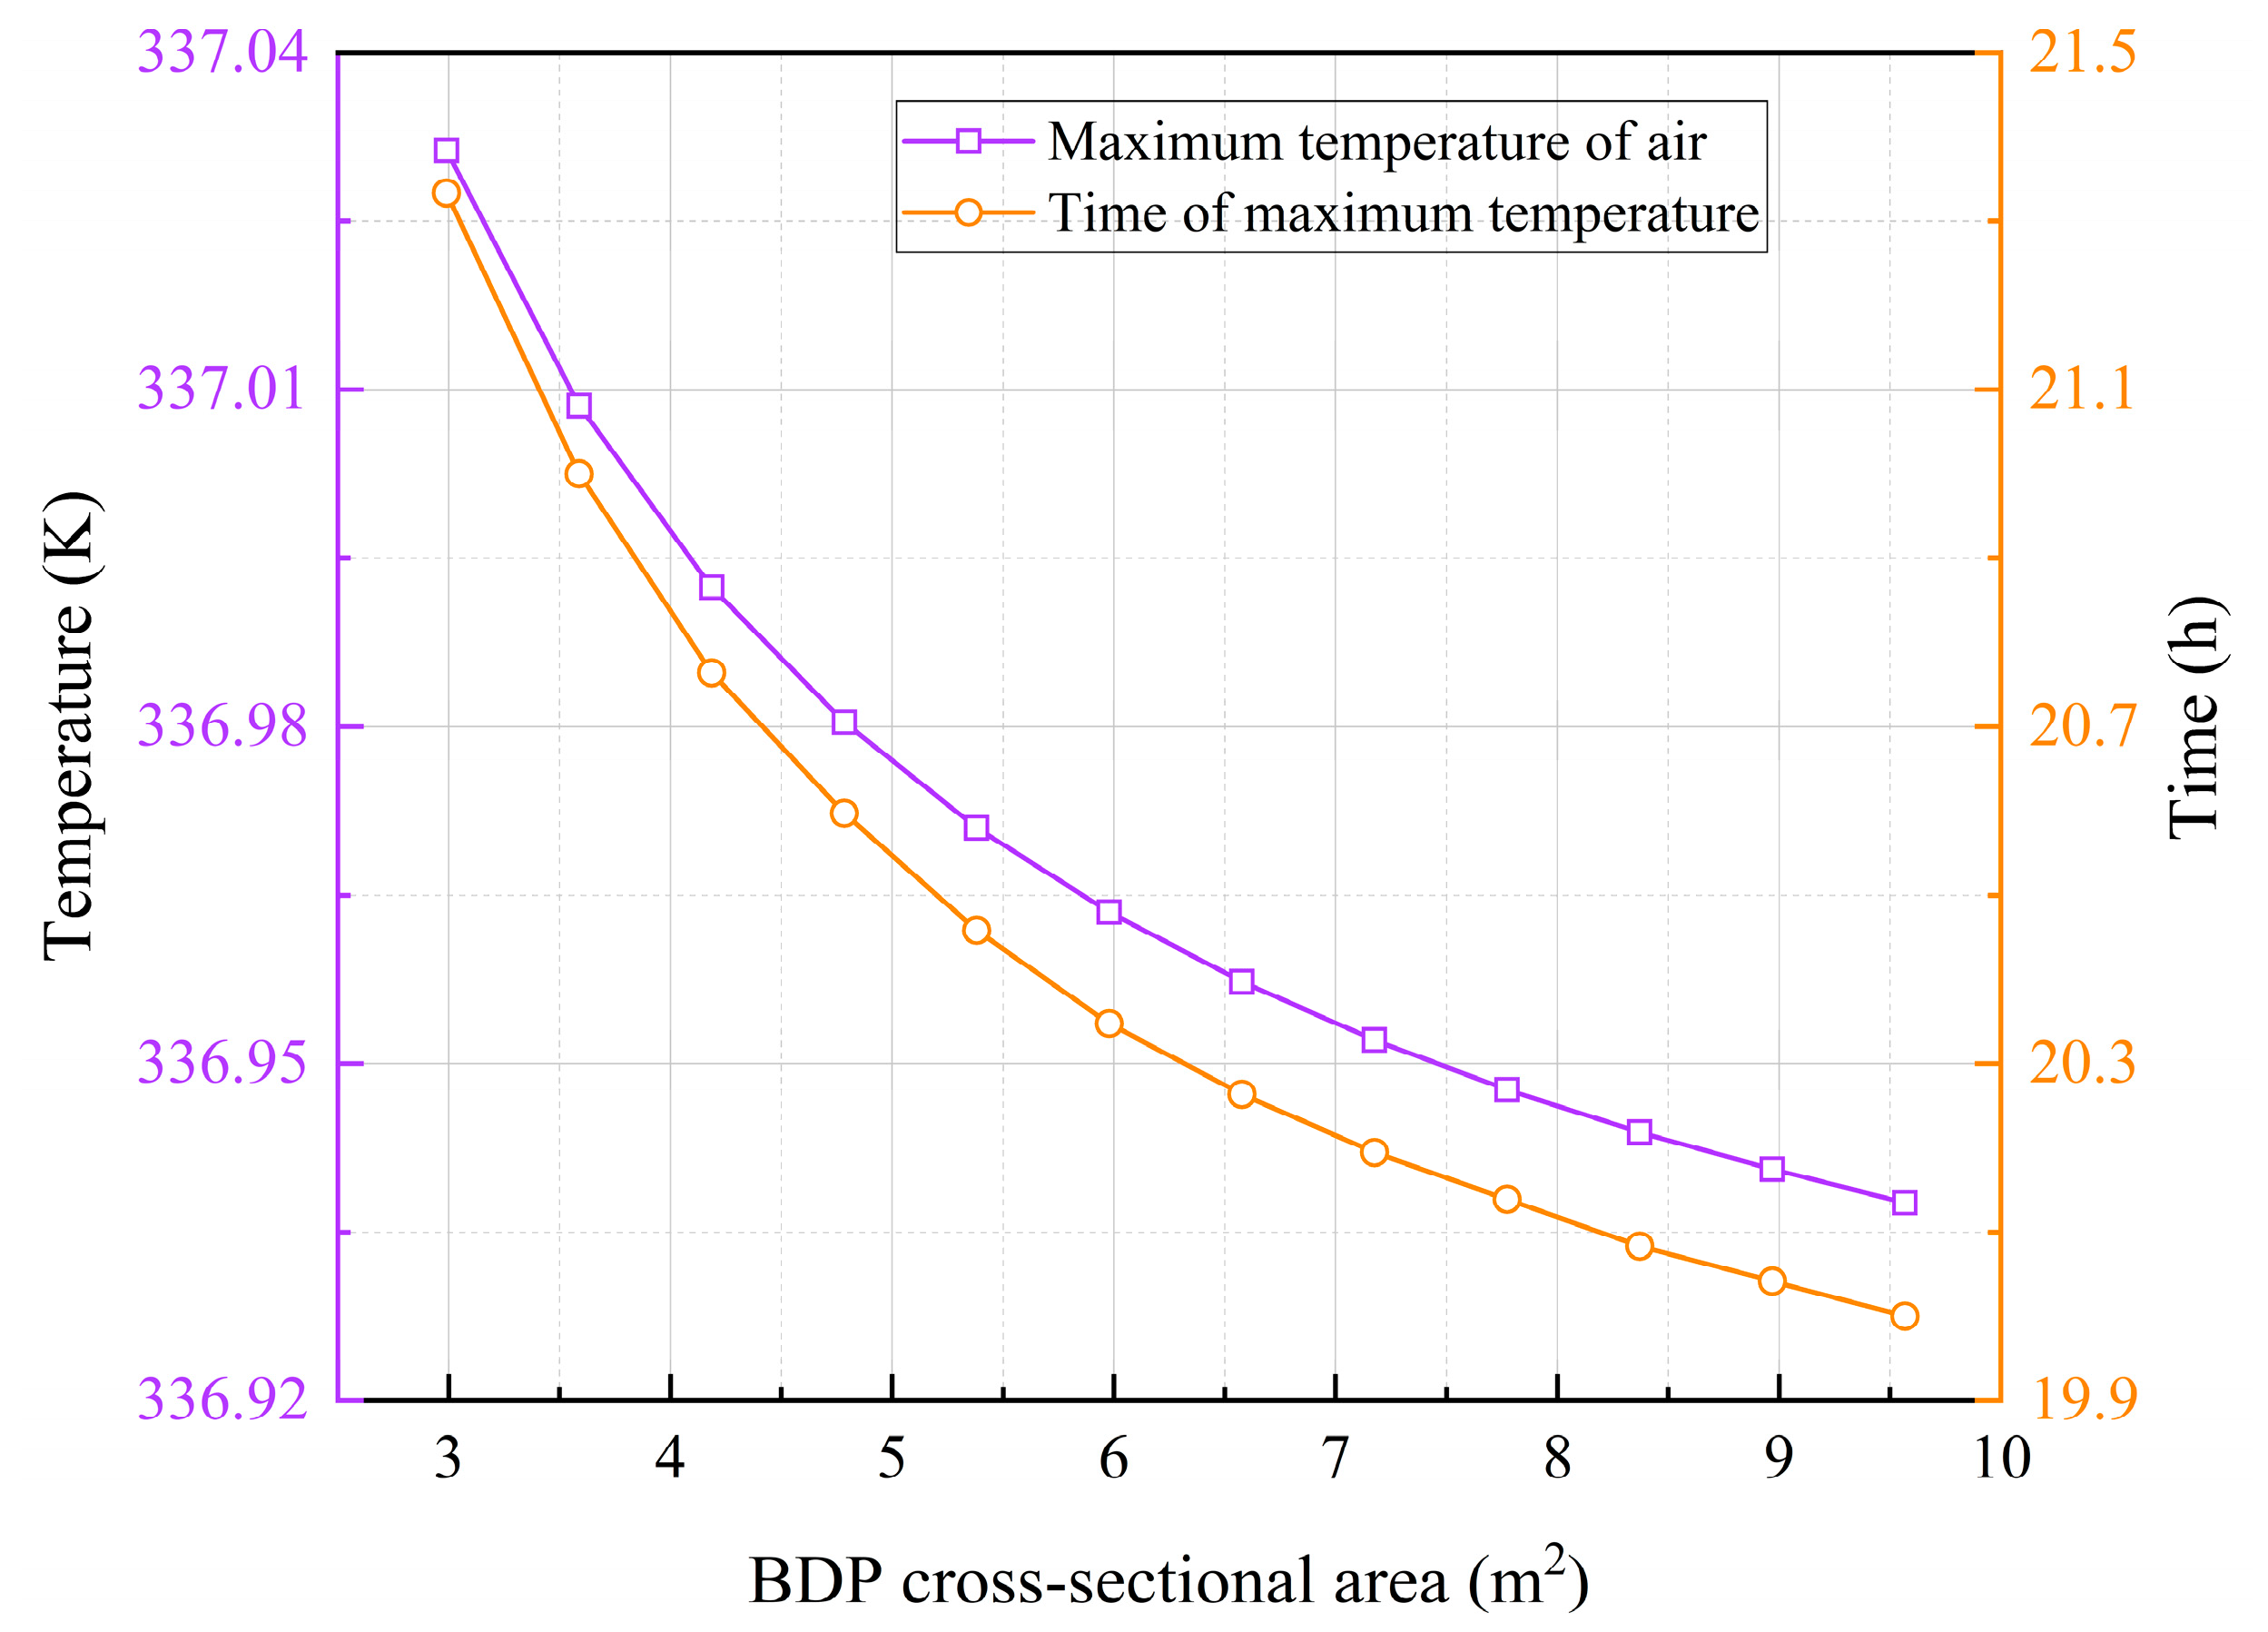
Figure 16.
Pressure and temperature of air when completing of brine drainage.
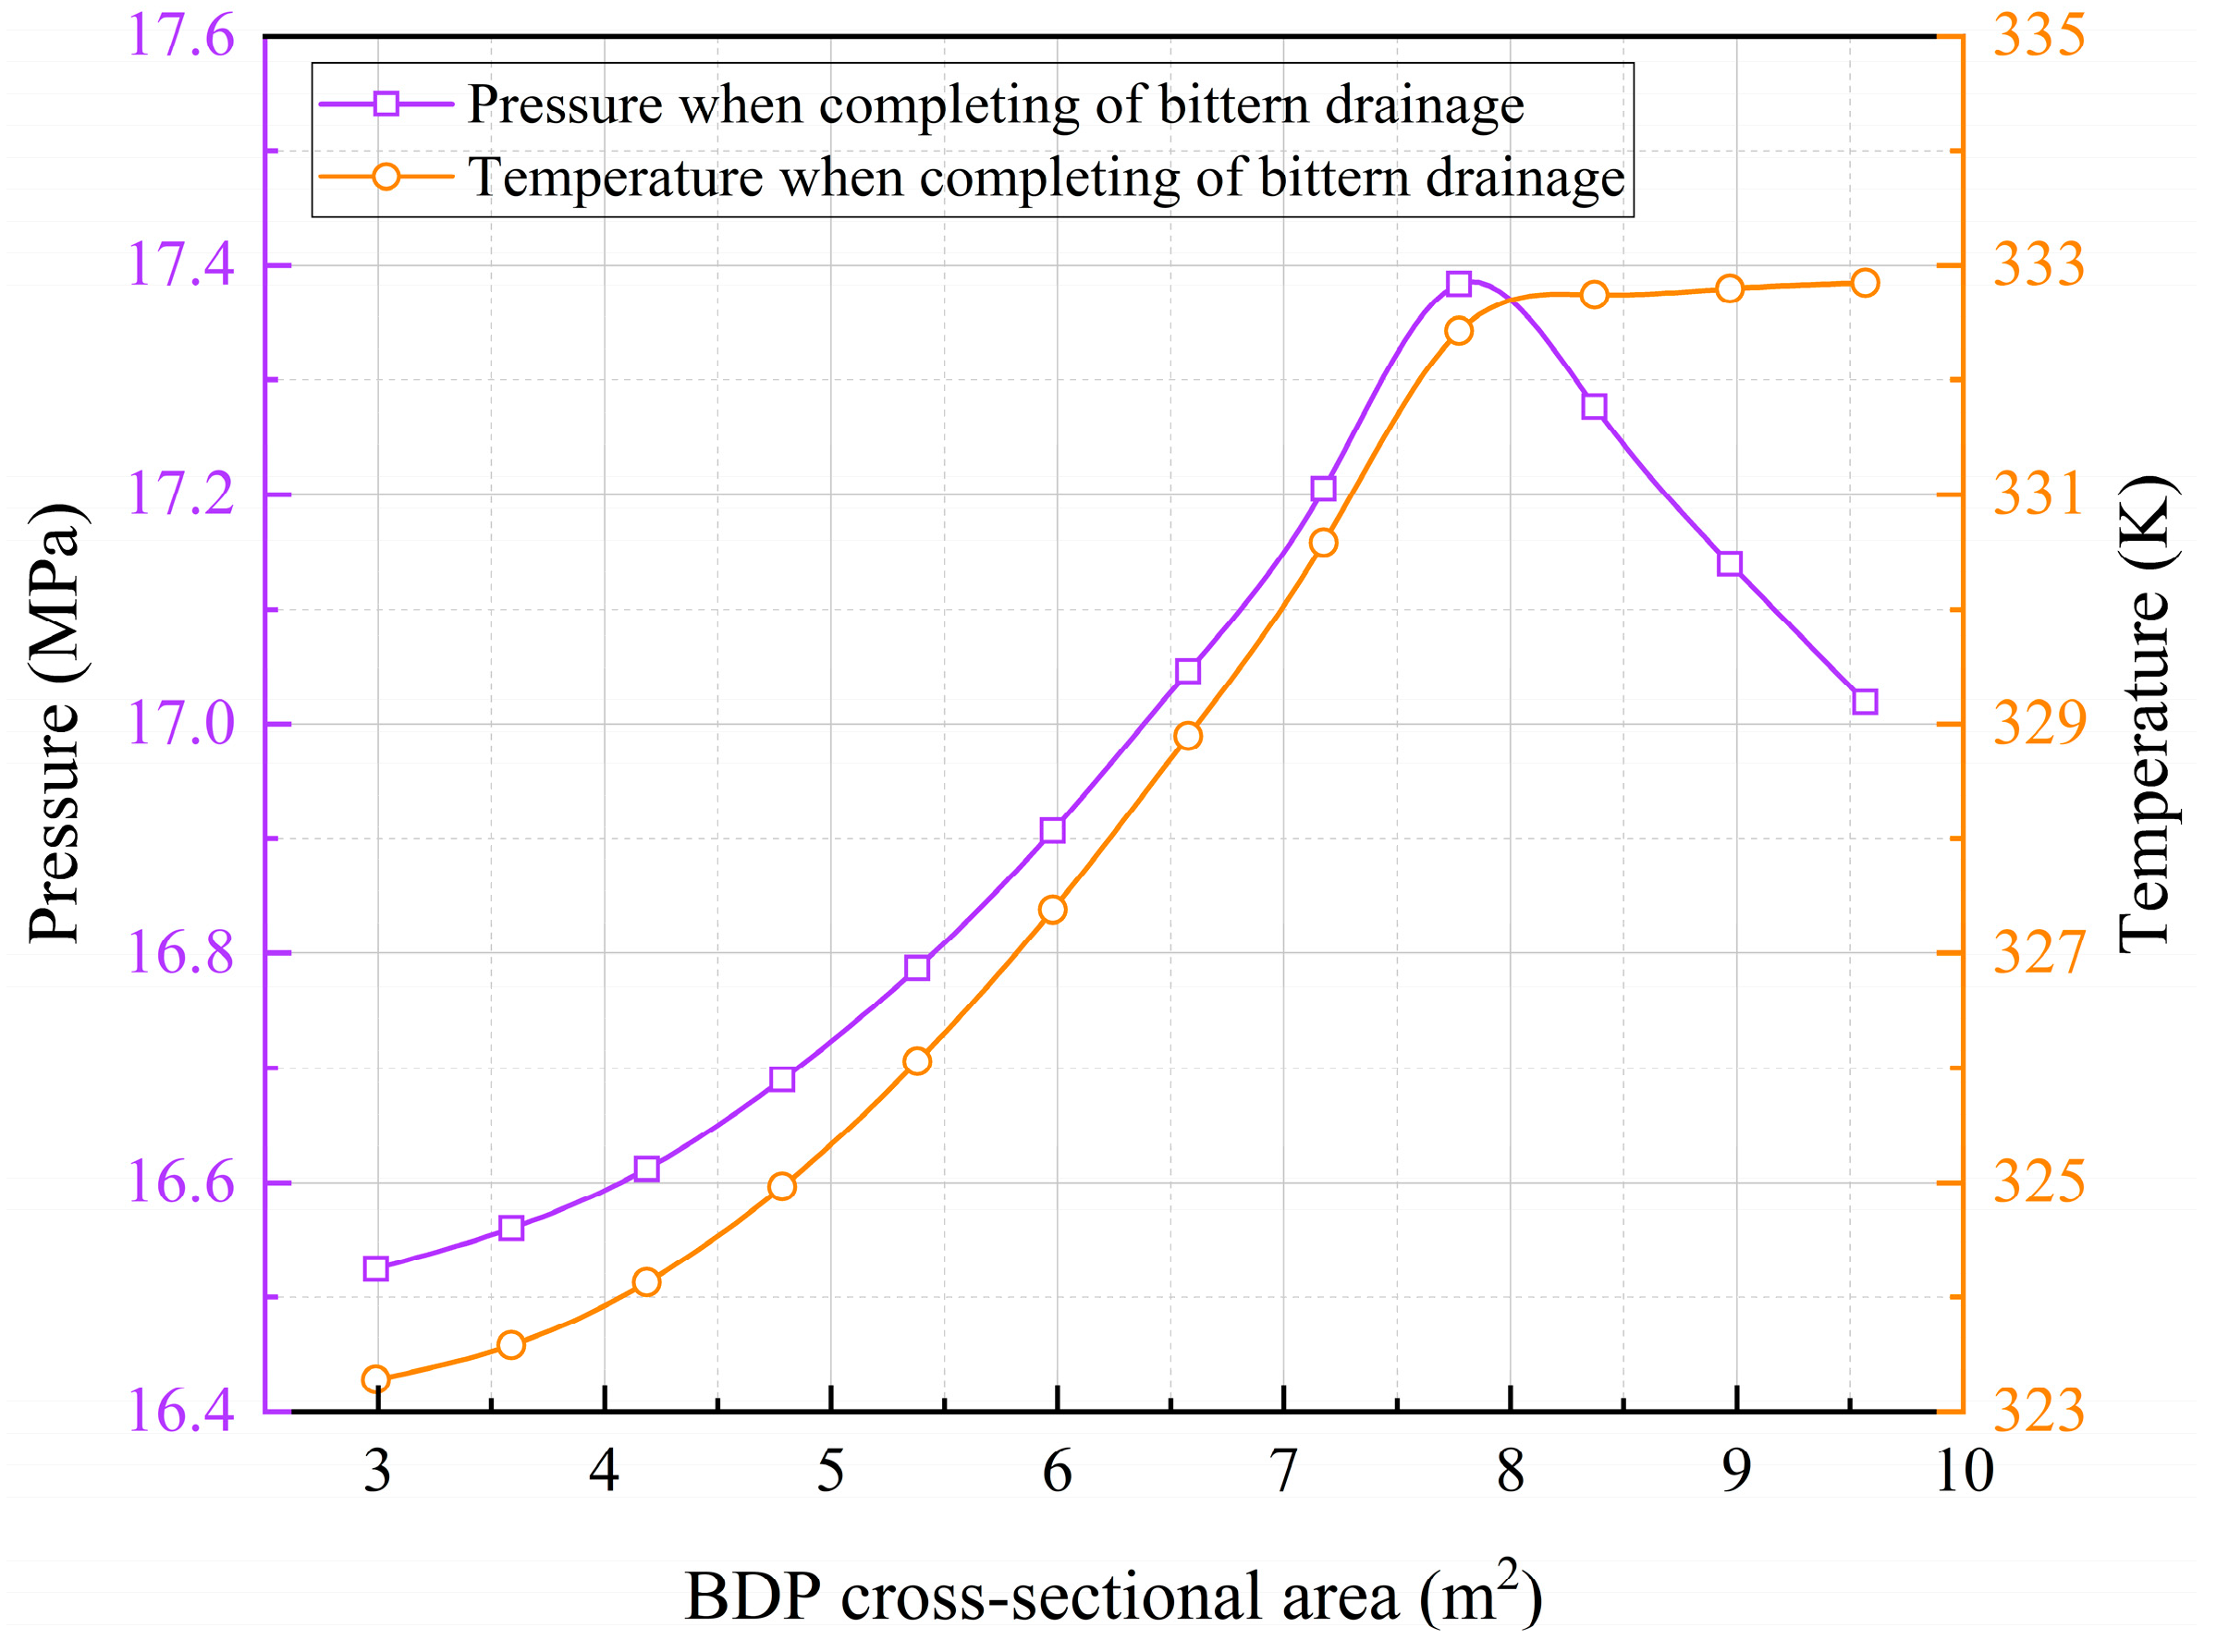
Figure 17.
Pressure variation of air under different BDP cross-sectional area.
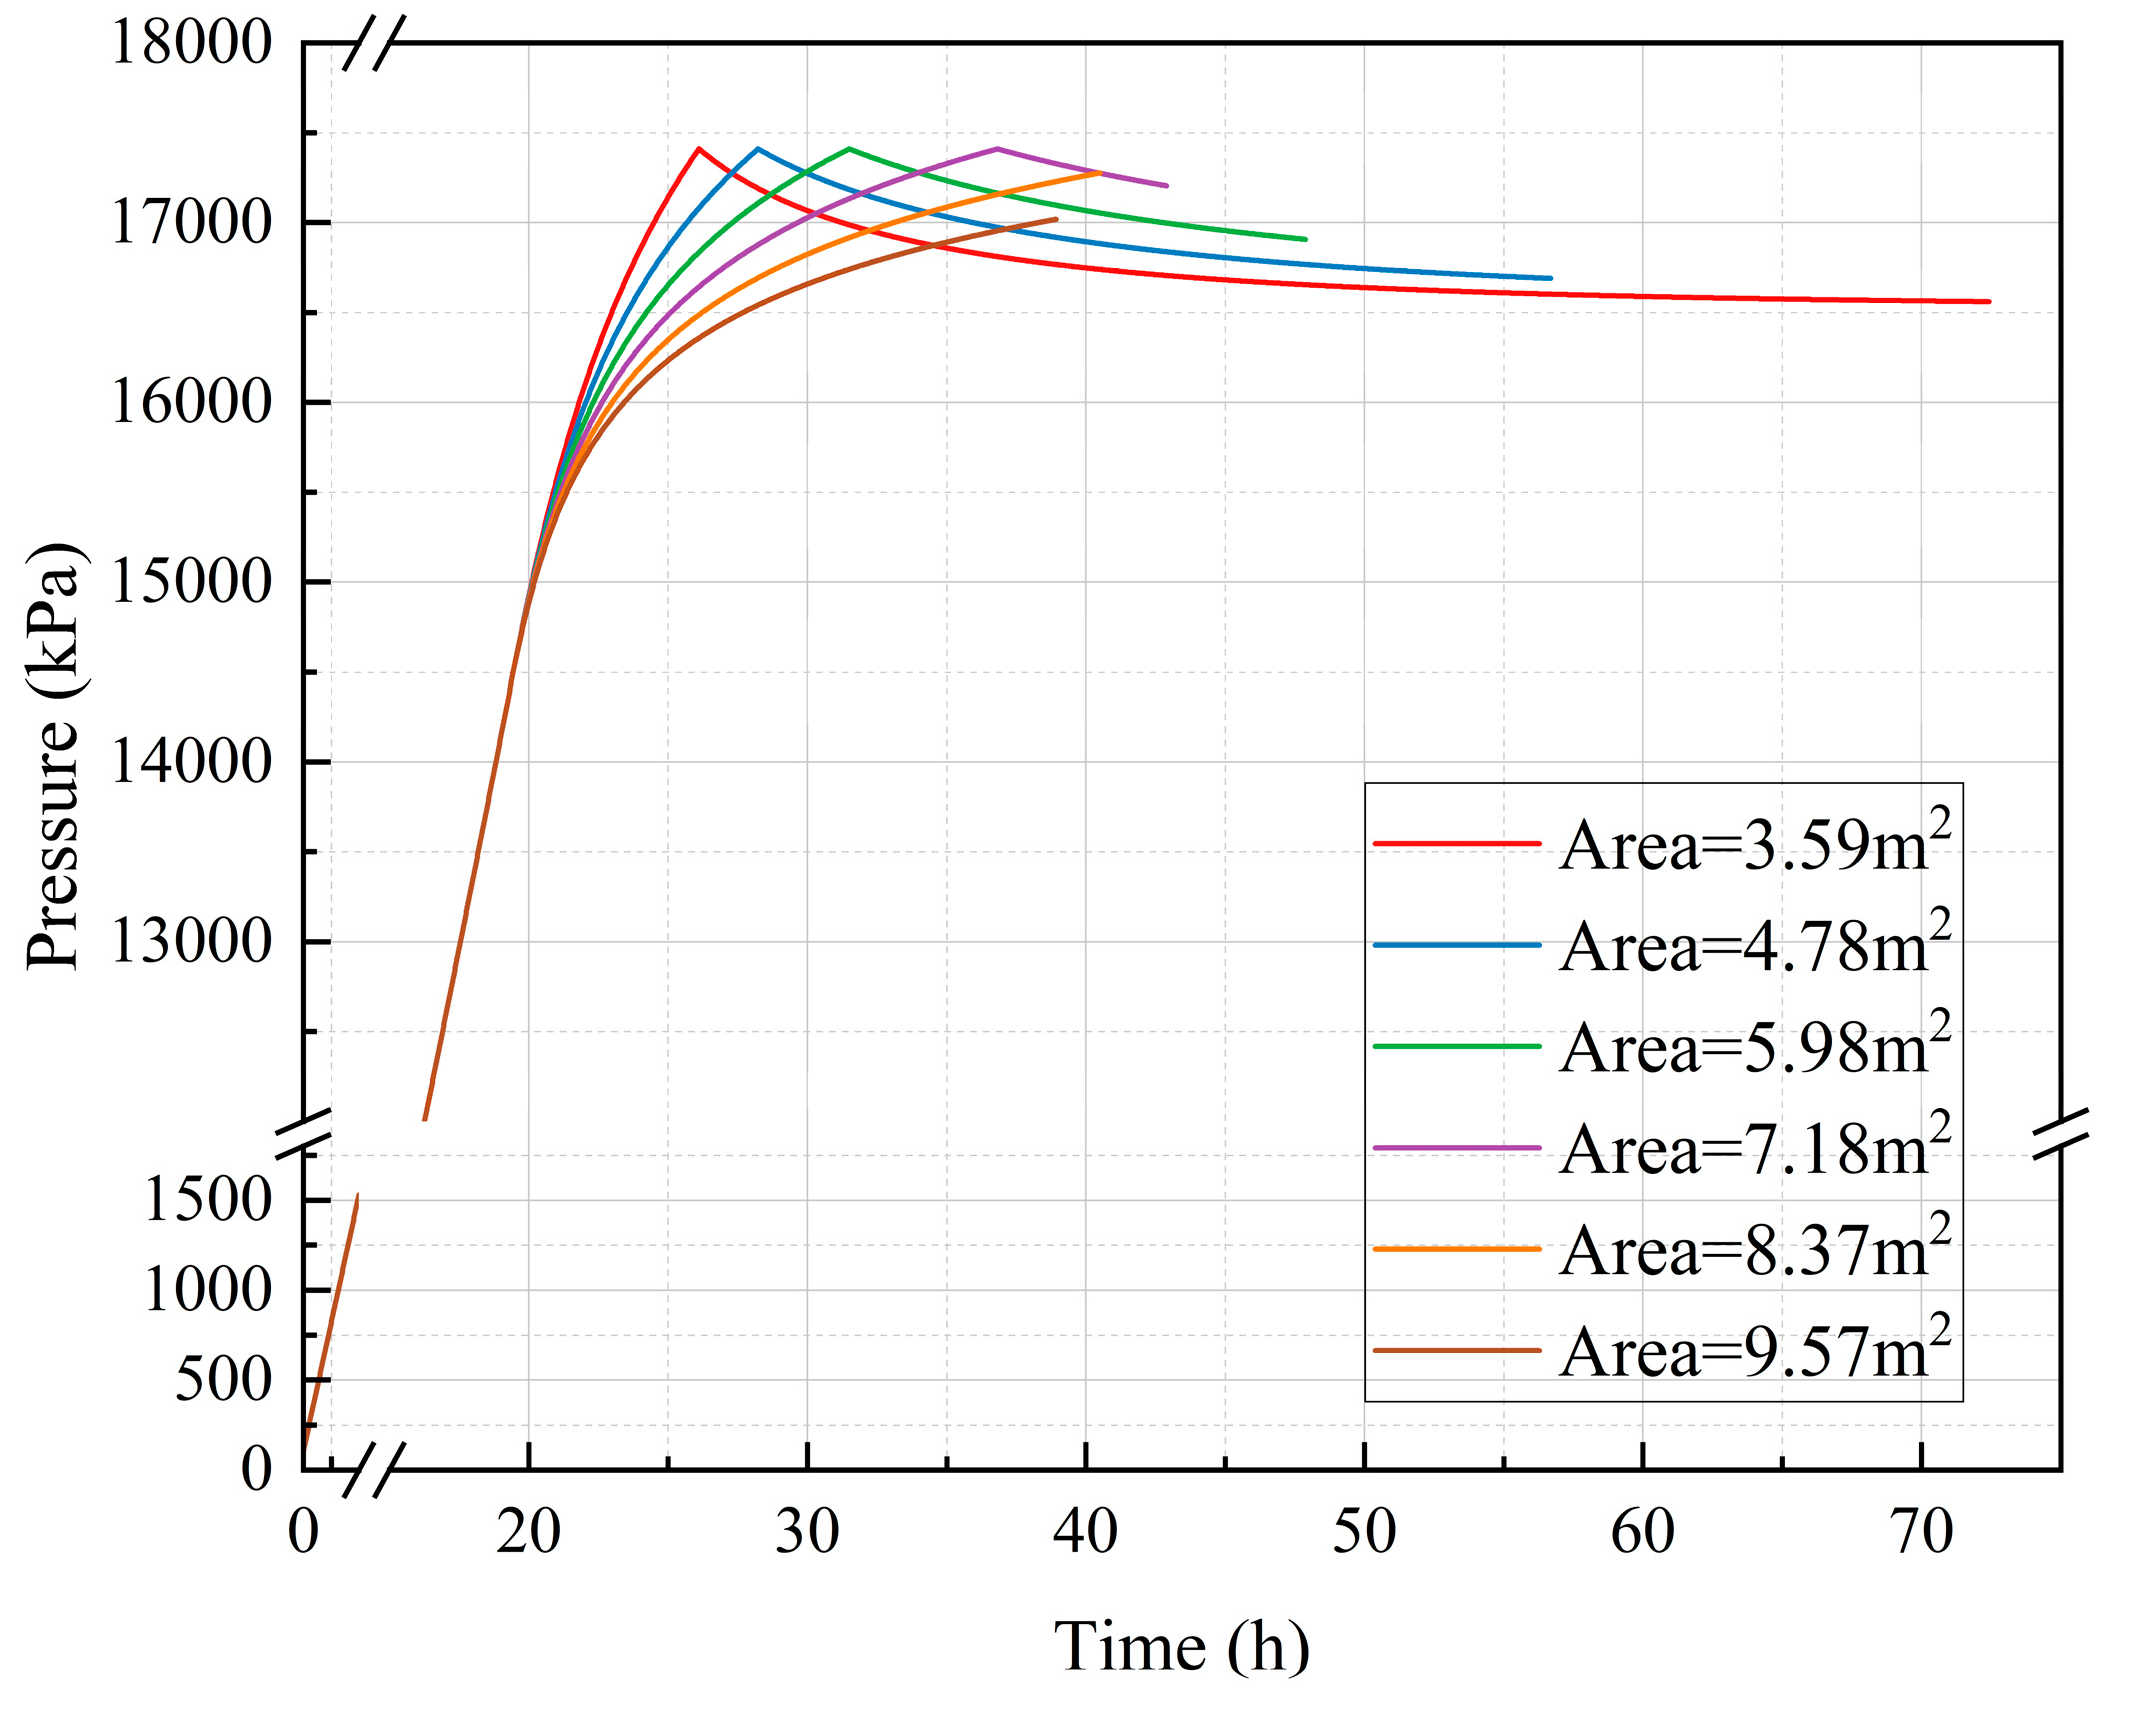
Figure 18.
Temperature variation of air under different BDP cross-sectional area.
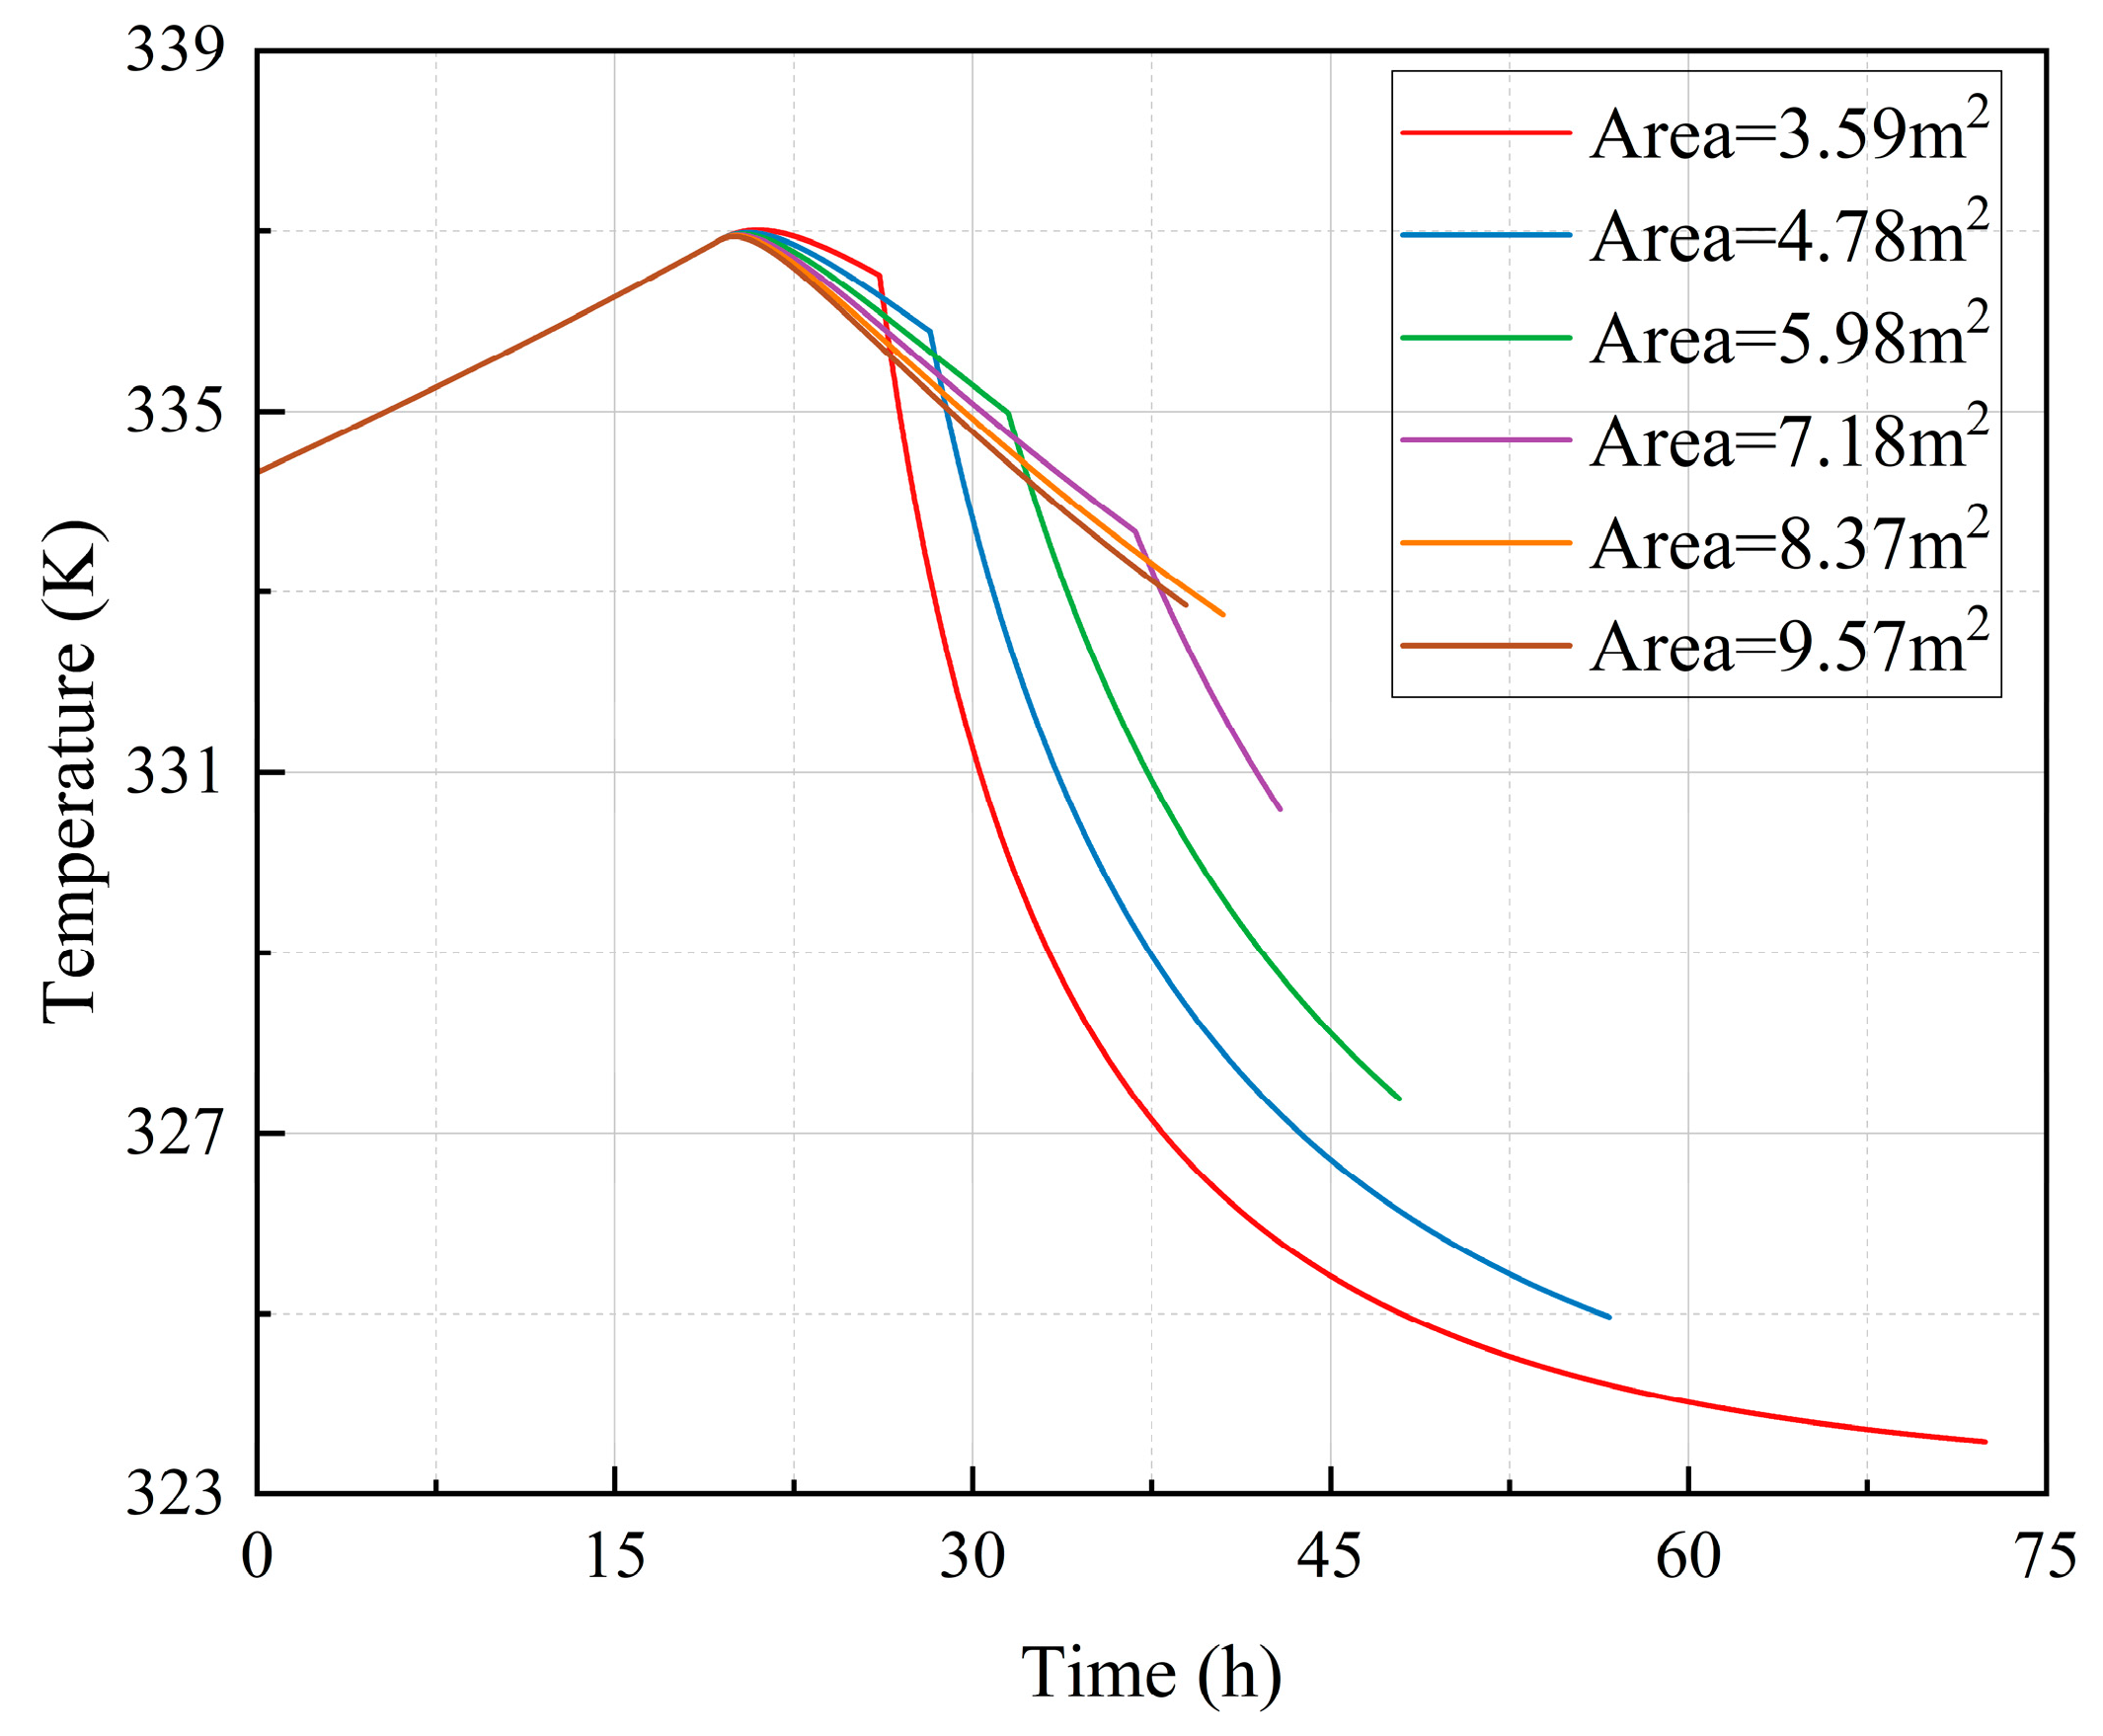
Figure 19.
Velocity variation of brine under different BDP cross-sectional area.
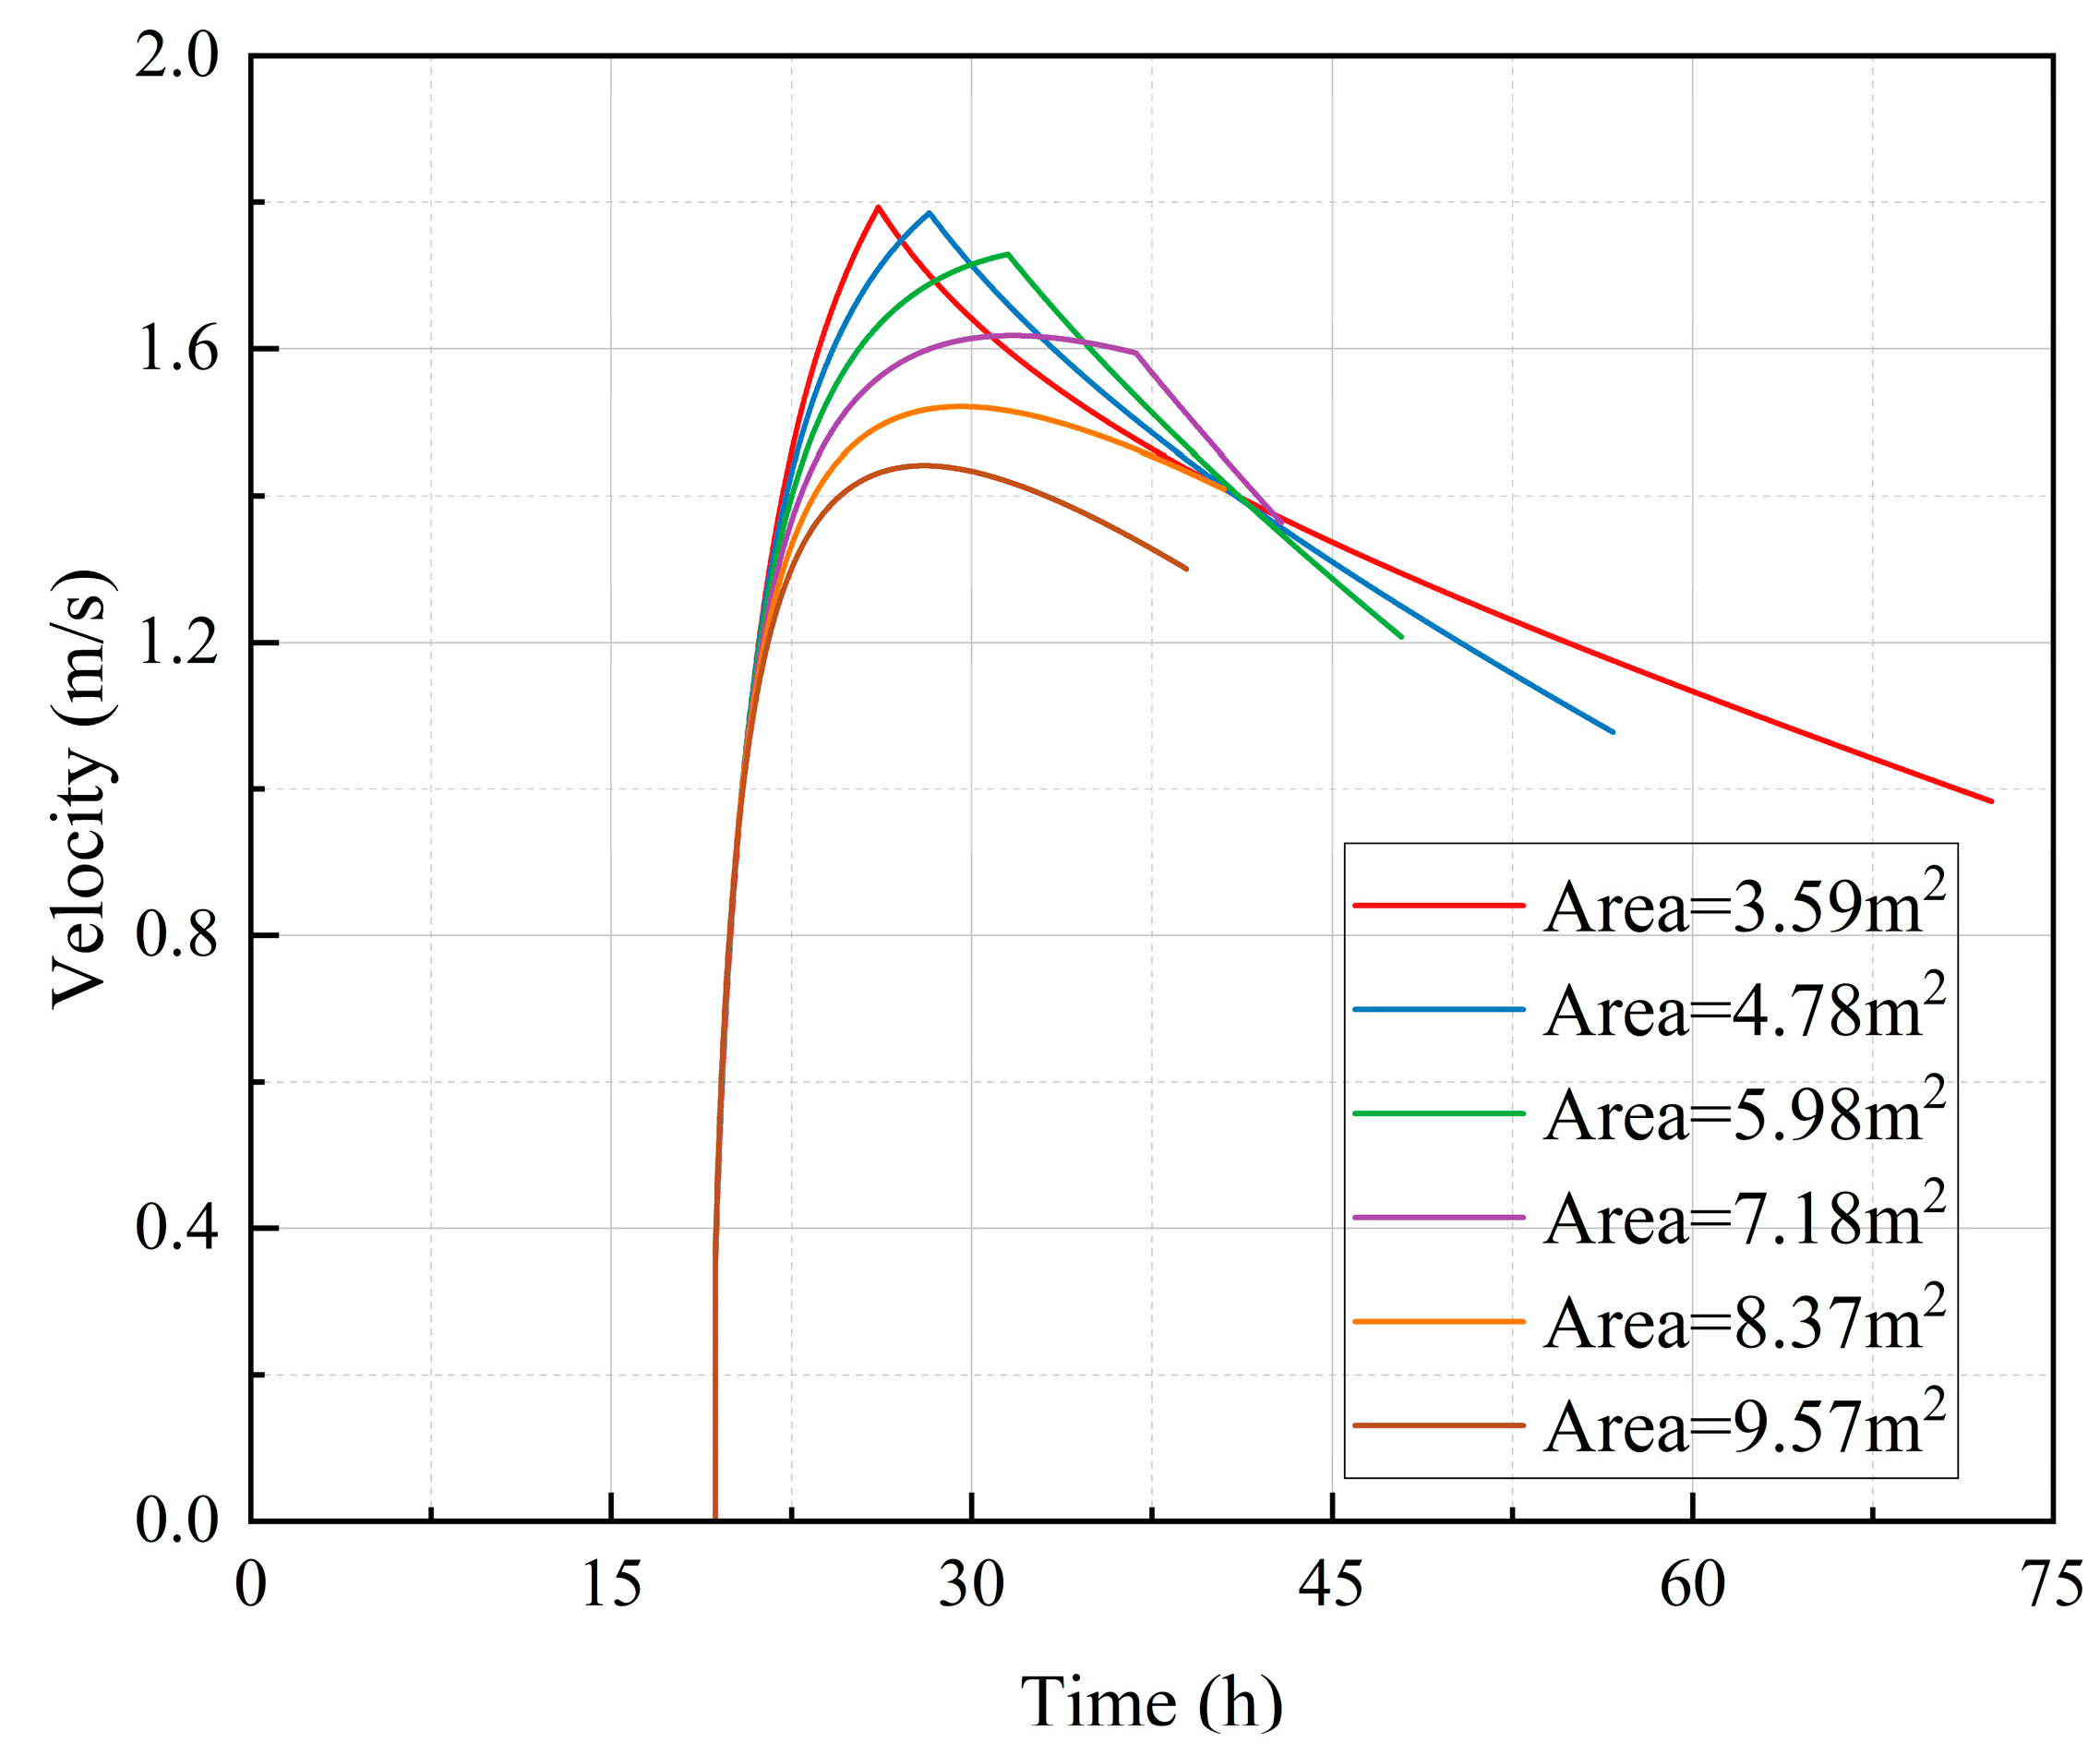
Figure 19.
Pressure variation of air under different injection flow rates.
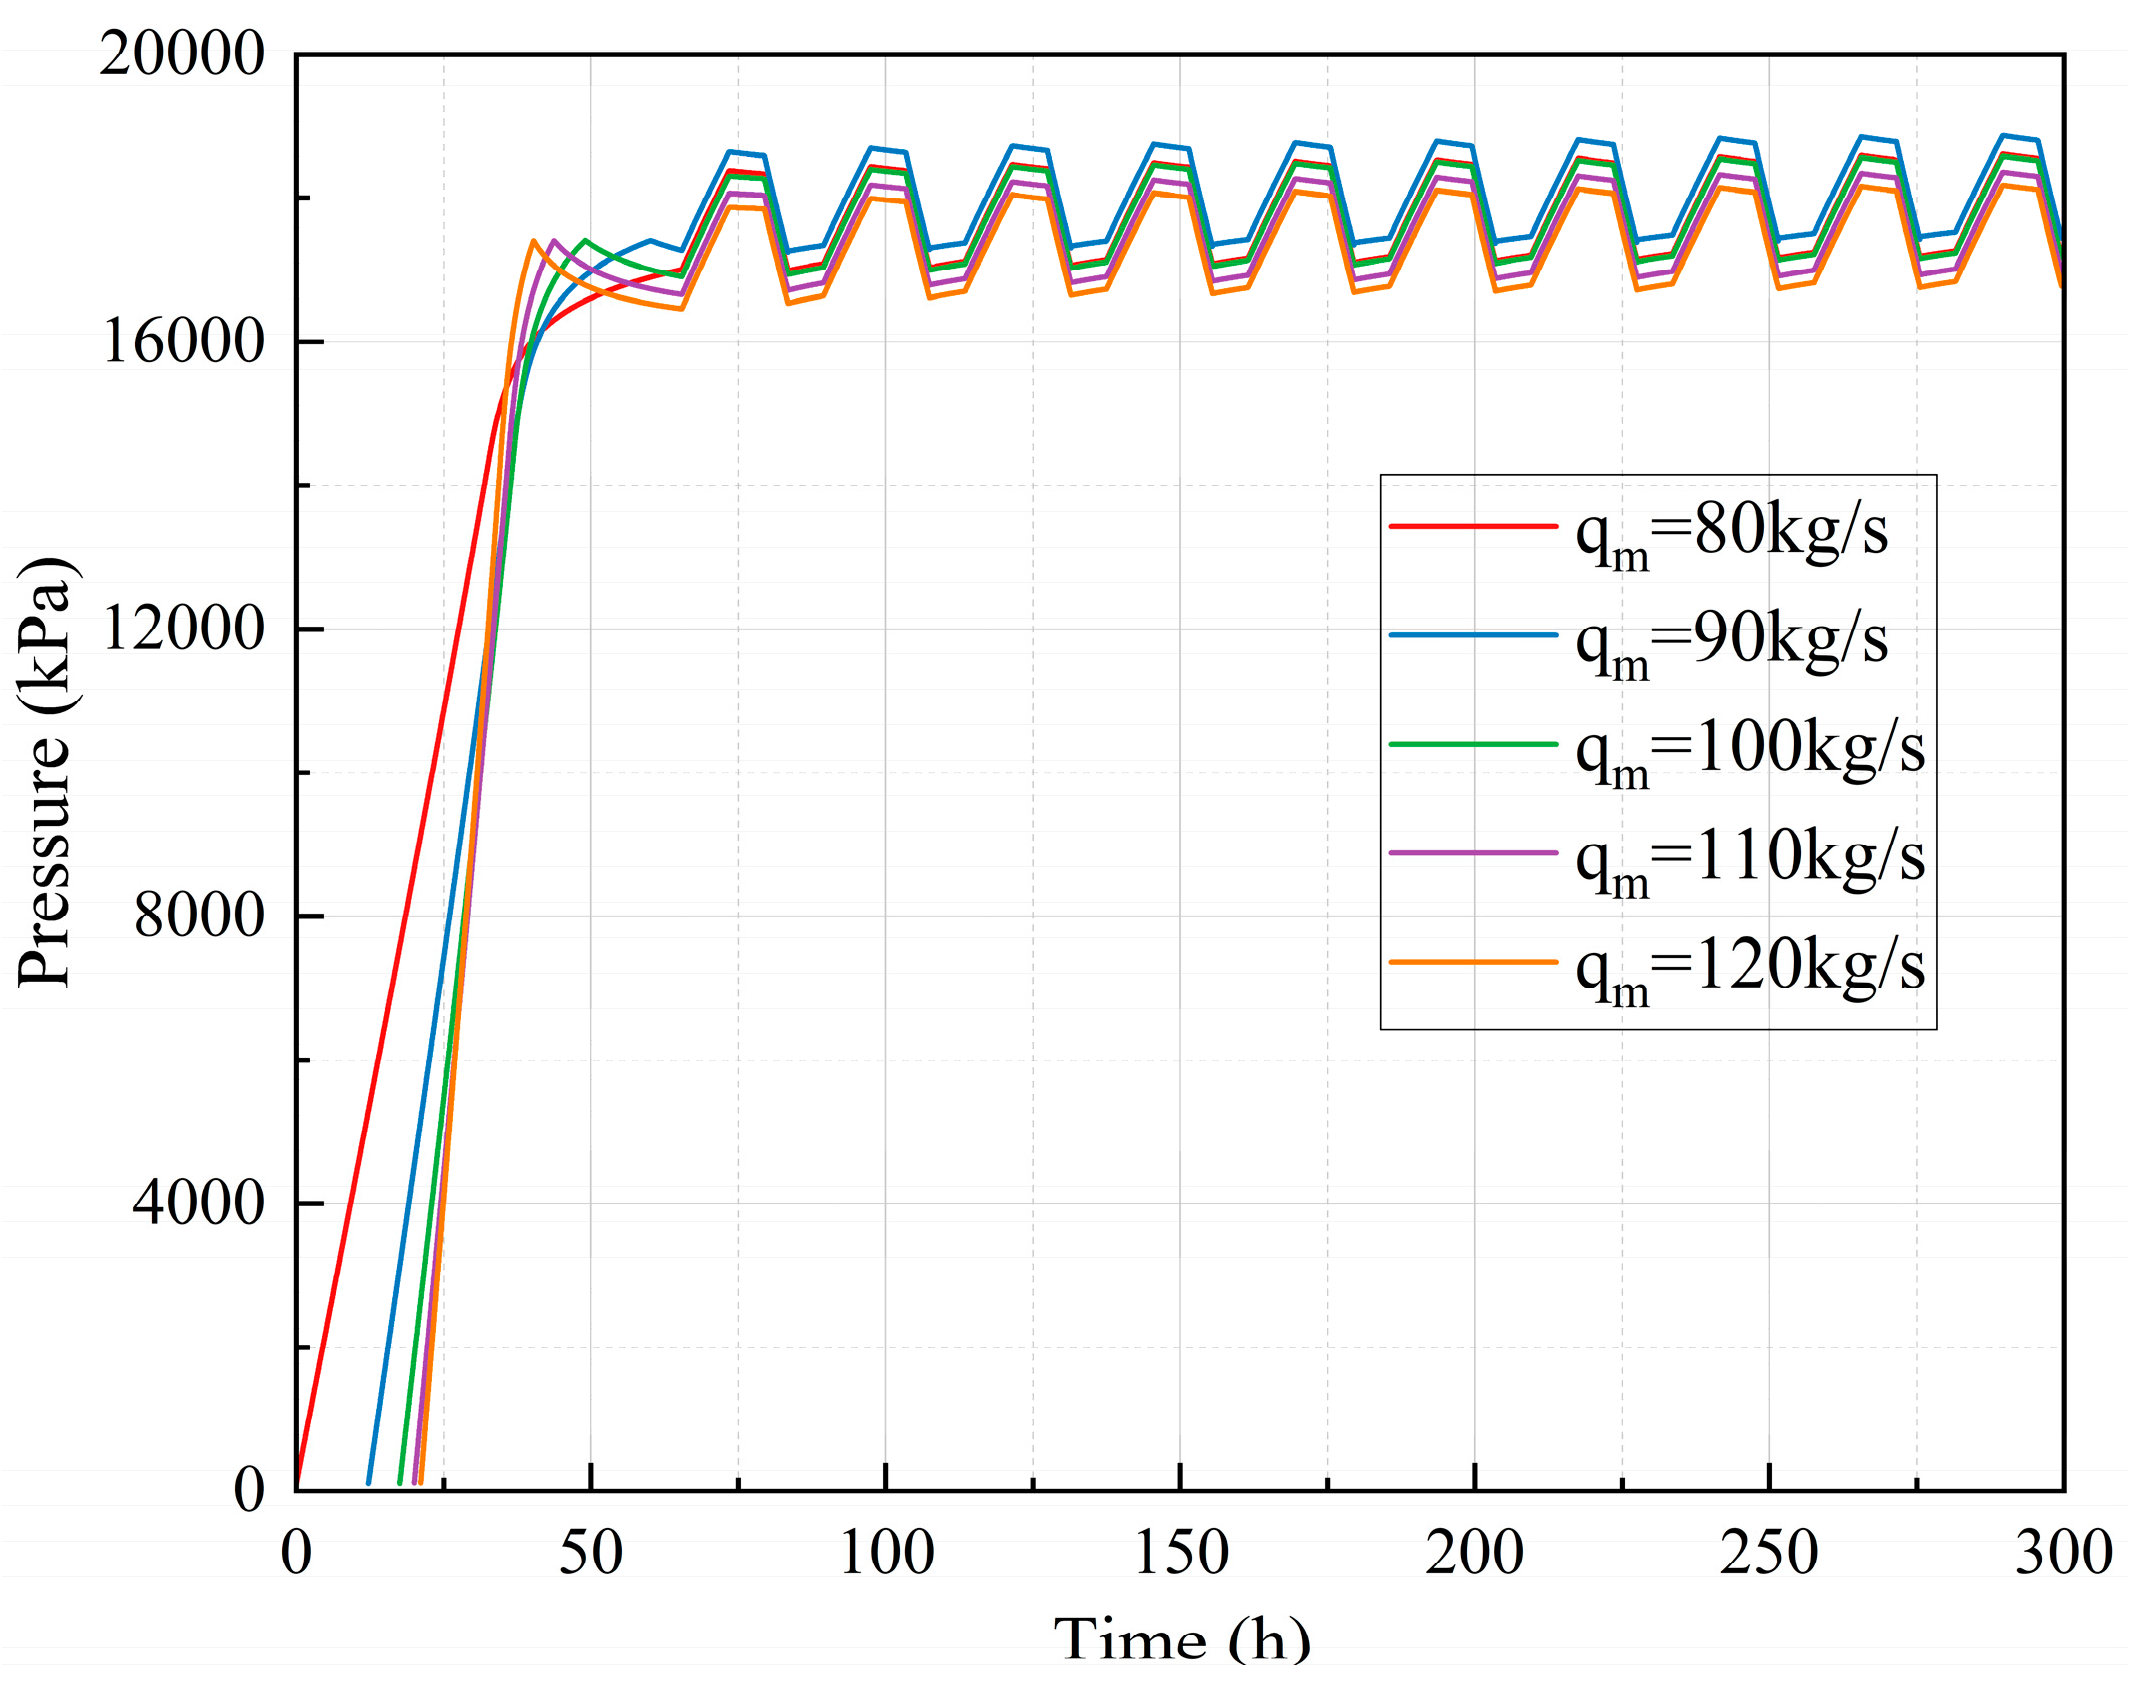
Figure 20.
Temperature variation of air under different injection flow rates.
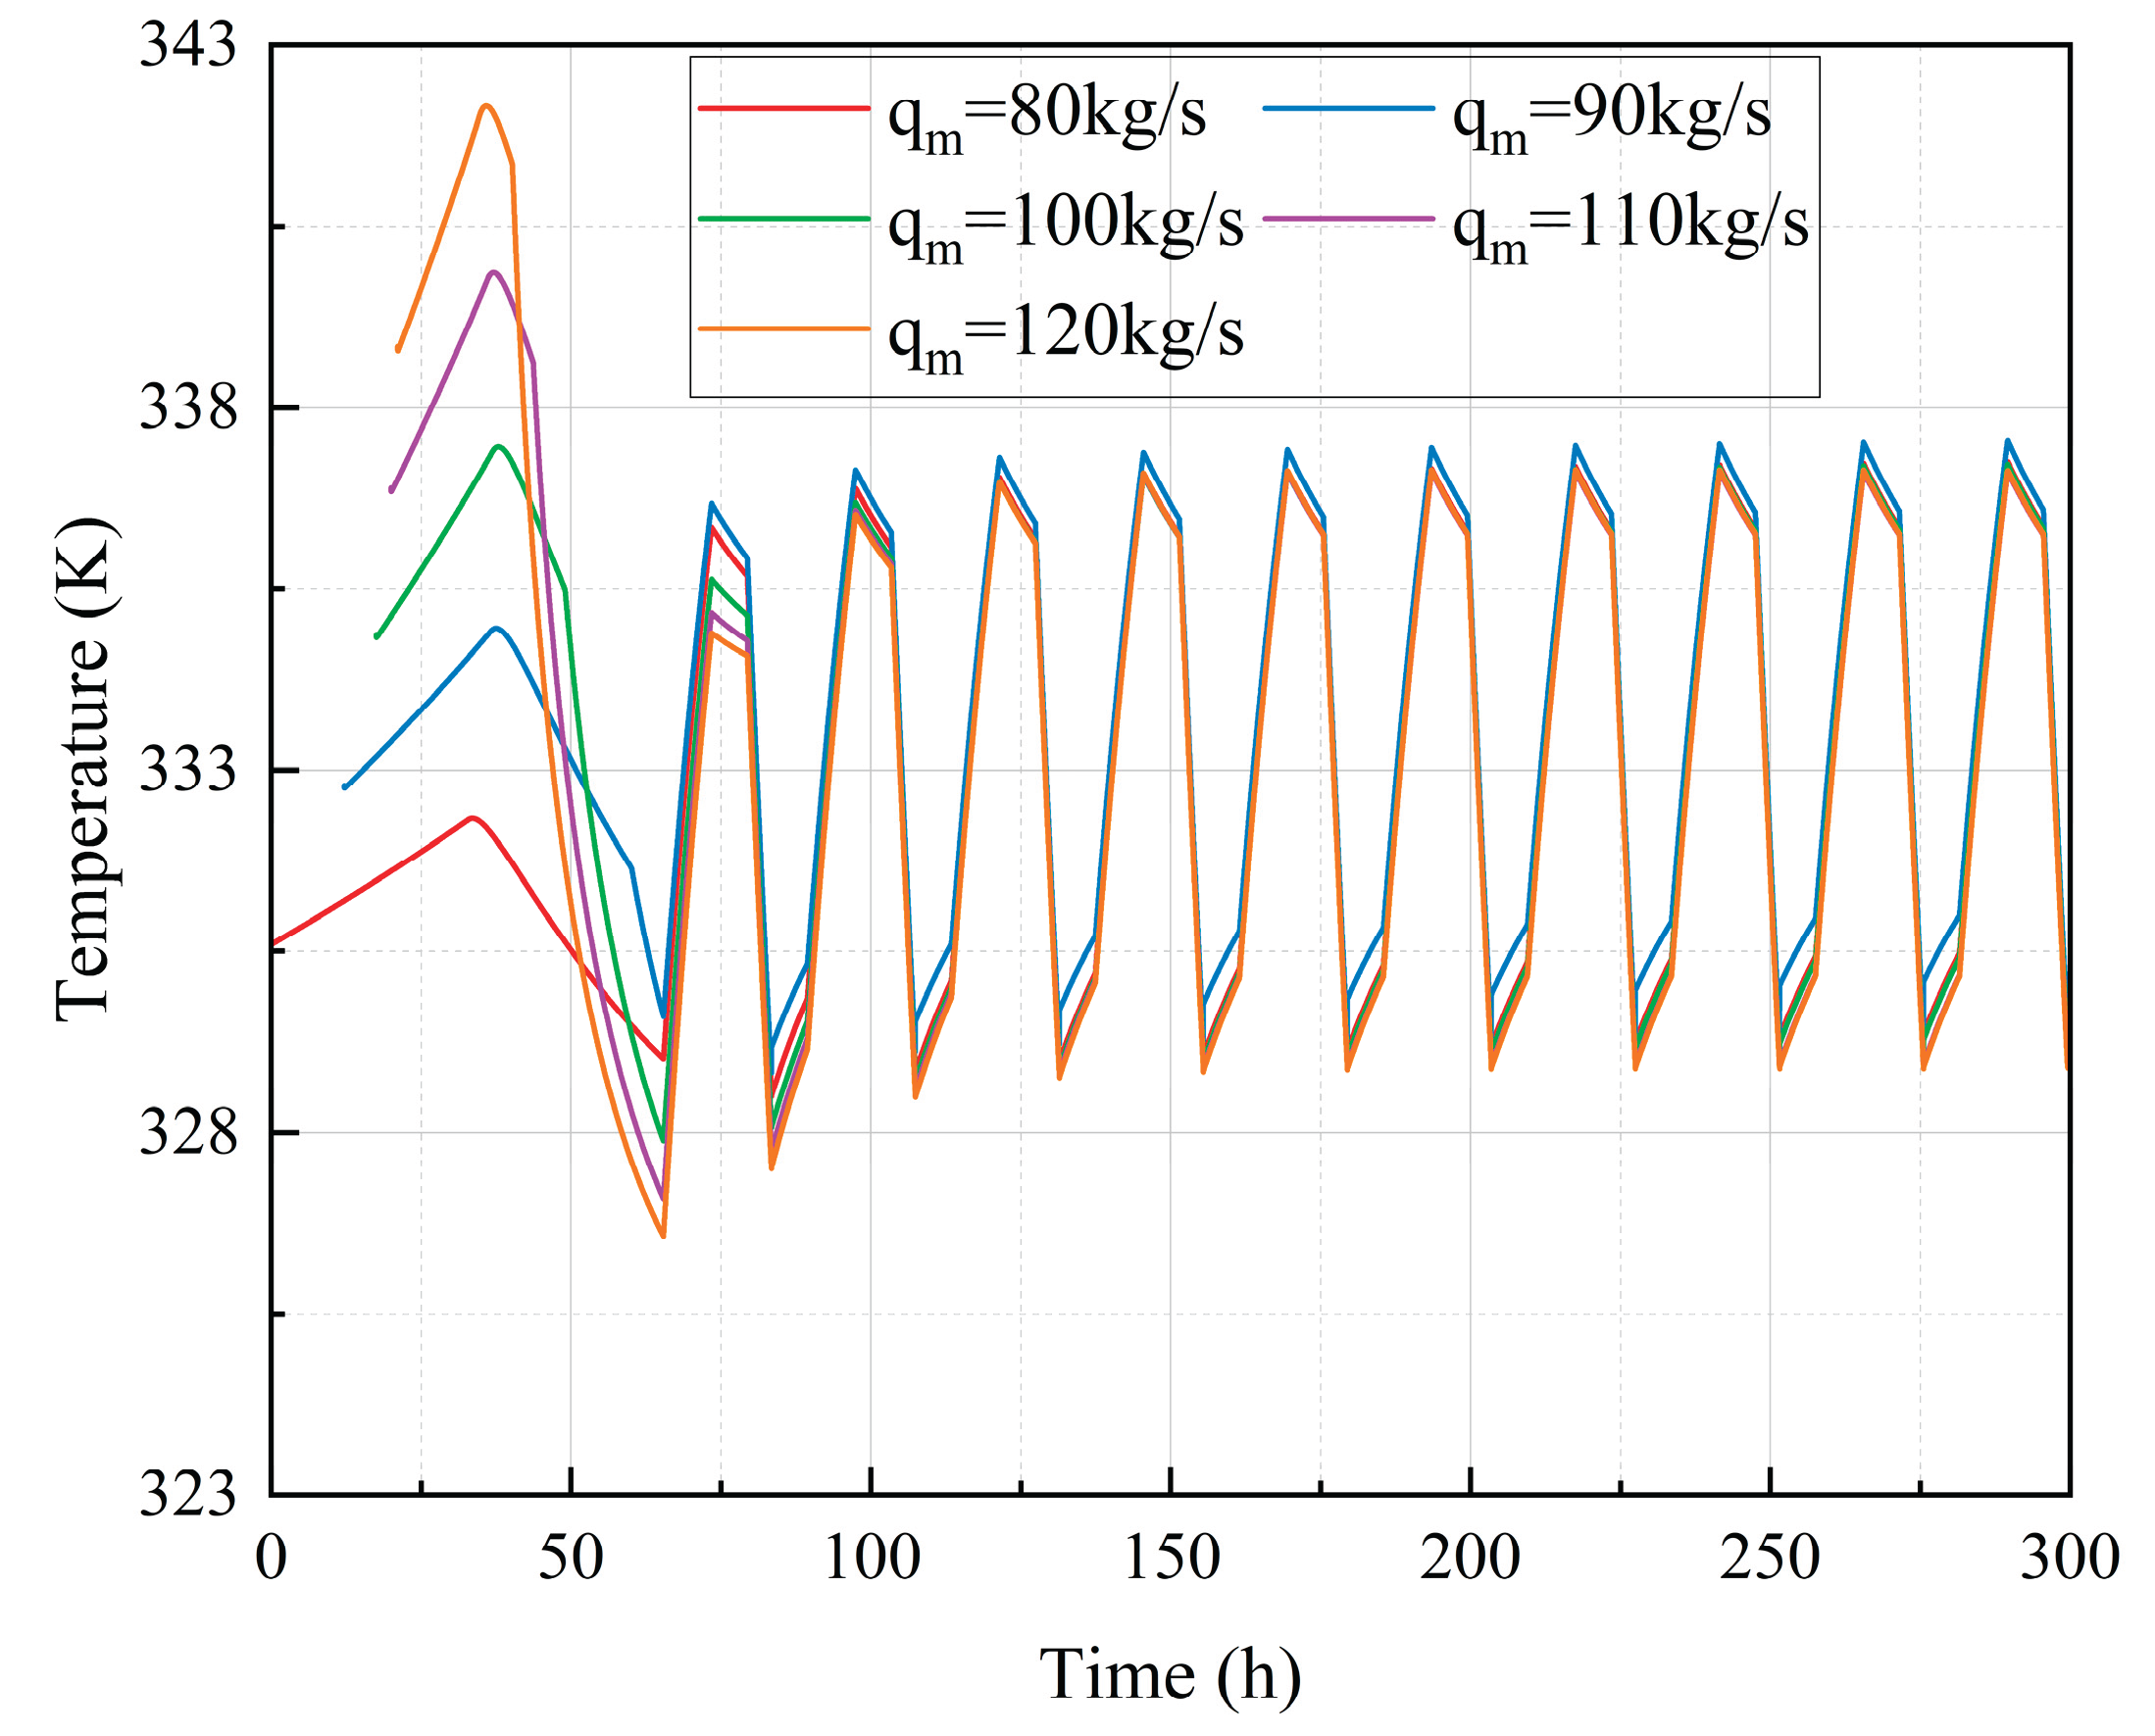

Table 1.
Parameter settings for the air injection and brine drainage process.
| Parameters | Unit | Value |
| Average cavern radius, r | m | 50 |
| Cavern volume, Vca | m3 | 968800 |
| Height of the cavern, Hca | m | 125 |
| Initial height of the brine, Hmax | m | 120 |
| Terminal height of the brine, Hmin | m | 2.5 |
| Height of the I/EWP, Hwell | m | 1200 |
| Heat transfer coefficient of cavern, hca | W/(m2·K) | 30 |
| Heat transfer coefficient at the gas-liquid interface, hb | W/(m2·K) | 45 |
| Initial air temperature in the cavern, T0 | K | 313.15 |
Table 2.
Parameter settings of the thermodynamic in the cavern for validation.
| Parameters | Unit | Value of Huntorf[27] |
| Average cavern radius, r | m | 20 |
| Cavern volume, Vca | m3 | 141000 |
| Cavern surface area, Aca | m3 | 25000 |
| Heat transfer coefficient of cavern, hca | W/(m2·K) | 30 |
| Initial air temperature in the cavern, T0 | K | 313.15 |
| Initial air pressure in the cavern, P0 | MPa | 5.9 |
| Injection temperature, Tin | K | 323.15 |
| Injection pressure, Pin | MPa | 7.2 |
| Injection mass rate, qmin | kg/s | 50 |
| Withdrawal mass rate, qmout | kg/s | 190 |
Disclaimer/Publisher’s Note: The statements, opinions and data contained in all publications are solely those of the individual author(s) and contributor(s) and not of MDPI and/or the editor(s). MDPI and/or the editor(s) disclaim responsibility for any injury to people or property resulting from any ideas, methods, instructions or products referred to in the content. |
© 2025 by the authors. Licensee MDPI, Basel, Switzerland. This article is an open access article distributed under the terms and conditions of the Creative Commons Attribution (CC BY) license (http://creativecommons.org/licenses/by/4.0/).
Copyright: This open access article is published under a Creative Commons CC BY 4.0 license, which permit the free download, distribution, and reuse, provided that the author and preprint are cited in any reuse.


