
Submitted:
23 June 2025
Posted:
24 June 2025
You are already at the latest version
Abstract
The increasing popularity of “superseeds” such as flax, sesame, amaranth and quinoa as functional foods raises the need of robust analytical methods for authentication purpose. In this work, a standardized workflow for the extraction, characterization and identification of unique peptide that may be used as markers to distinguish superseed species was investigated. Ammonium bicarbonate/urea (Ambi/urea) extraction, sodium dodecyl sulfate (SDS) buffer and trichloroacetic acid (TCA) precipitation were initially implemented and based on the level and composition of the extracted proteins, SDS buffer protocol was selected. Electrophoresis analysis revealed consistent protein profiles between biological replicates from each of the eleven seed species, confirming the reproducibility of the SDS buffer protocol. Targeted mass spectrometry successfully identified species-specific peptide markers for six of eleven superseeds investigated, including peptides from conlinins in flaxseed (WVQQAK), 11S globulins in sesame (LVYIER), oleosin in quinoa (DVGQTIESK), agglutin-like lectins in amaranth (CAGVSVIR), as well as cupin-like proteins in poppy seeds (INIVNSQK) and edestins in hemp seeds (FLQLSAER). Moreover, proteomes cross-analysis allowed disqualifying isomeric peptide LTALEPTNR from 11S globulins present in amaranth and quinoa. However, no reliable markers were identified for chia, canihua, basil, black cumin, and psyllium seeds under current conditions. While this targeted proteomics approach shows promise for superseed authentication, comprehensive method validation and alternative strategies for marker-deficient species are required before routine implementation.
Keywords:
superfoods
; superseeds
; authentication
; protein extraction
; marker peptide
; targeted mass spectrometry
1. Introduction
In recent years, dietary habits have undergone a marked transformation, with growing consumer interest in health-promoting and organic foods. Among these, so-called “superfoods”, the nutrient-rich plant-based products, have gained substantial popularity. Between 2011 and 2015, global product launches featuring superfoods, superfruits, and ancient grains increased by over 200% [1]. In particular, edible superseeds are attracting increasing attention, not only for their nutritional and therapeutic properties, but also for their rich composition in macronutrients and micronutrients, including proteins, dietary fibers, lipids (notably unsaturated fatty acids), and various vitamins and minerals [2,3,4,5].
Several examples highlight this nutritional diversity: poppy and black cumin seeds contain 21–27% protein and 33–40% fat, mainly composed of linoleic and oleic acids [4,6,7]. Flaxseed is valued for its high content of α-linolenic acid (omega-3), soluble fiber, and proteins [8,9,10]. Hemp seed, traditionally consumed in human diets, provides 25–32% protein and up to 35% fat, particularly rich in polyunsaturated fatty acids [11,12]. Seeds from the Lamiaceae family, such as chia, basil, sesame, and psyllium, are also known for their high nutritional density, offering omega-3 fatty acids, high-quality proteins, dietary fiber, polyphenols, and essential micronutrients [2,13]. Sesame seeds contain 40–65% fat and 19–35% protein [14,15,16], while psyllium is particularly appreciated for its high dietary fiber content [17]. Finally, pseudo-cereals such as quinoa, amaranth, and canihua are gluten-free and exhibit well-balanced amino acid profiles, making them attractive alternatives for individuals with celiac disease [18,19,20,21].
However, with their growing attractiveness and ever-increasing market value, superseeds as the most important and high-valued plant-based foods are vulnerable to food fraud and adulteration. These adulterations generally involve the replacement of high-value, high-quality ingredients with equivalents of inferior value and quality [22,23,24,25,26]. To prevent these frauds, a variety of analytical techniques are generally developed and applied for food authentication, including PCR Method, ELISA, Raman spectrometer, ICP-MS, SNIF-NMR, MALDI-TOF-MS, liquid and gas mass spectrometry [26,27,28,29,30]. Initiatives have also been implemented for superseeds. Machine learning algorithms such as Random Forest have been employed to discover untargeted metabolic markers distinguishing seeds like chia from flax and sesame [31]. Targeted analysis has confirmed the presence of seed-specific polyphenols [32] and more recently, metabolomics approaches based on NMR spectroscopy have identified potential authenticity markers in flax, sesame, and chia, including polyphenols and cyanogenic glycosides [3].
Despite these advances, protein-based authentication of superseeds remains largely unexplored. A survey of the UniProt database (as of January 2024) shows that most superseed proteins remain unreviewed, and only a few have been fully characterized, limiting the availability of reliable protein biomarkers. Moreover, while certain seeds (e.g., sesame, chia, flax, quinoa) have been the subject of proteomic studies, others such as basil, psyllium, and amaranth seeds remain poorly documented. Peptides derived from tryptic digestion of storage proteins primarily 11–12S and 7–8S globulins, as well as 2S albumins, which together represent more than 70% of total seed proteins, are promising candidates for authentication. These proteins are known to vary with genotype, geographical origin, farming practices (organic vs. conventional), and processing conditions (e.g., freezing, heating, fermentation) [33,34], and can therefore be good candidates for the search of markers enabling the traceability and authentication of superseeds.
In light of the information above, this study aimed to develop a standardized workflow for the discovery of robust specific peptide markers that can be used for authentication of some selected superseeds based on the targeted mass spectrometry analysis. To ensure reproducibility and analytical reliability, three different extraction protocols were initially investigated and their efficiency compared, including ammonium bicarbonate (Ambi)/urea extraction, sodium dodecylsulfate (SDS) buffer, and trichloroacetic acid (TCA) precipitation. The profiles of extracted proteins were then analyzed by sodium dodecyl sulfate polyacrylamide gel electrophoresis (SDS-PAGE) and further subjected to targeted mass spectrometry analysis to identify potential peptide markers. The selected peptide markers were subsequently monitored by multiple reaction monitoring (MRM) in 81 seed samples from 11 superseed species, including flax, chia, sesame, amaranth, hemp, quinoa, canihua, poppy, basil, black cumin, and psyllium seeds.
2. Results
2.1. Sample characterization
2.1.1. Crude protein
Prior to targeted analysis, one representative sample per seed species was selected and analyzed for total protein content. The Kjeldahl method was used to determine total nitrogen, which was subsequently converted to protein content. Among the samples, flaxseed S43 (20.3 g/100 g dry mass), sesame S62 (25.2 g/100 g dry mass), hemp S201 (23.3 g/100 g dry mass), and poppy seed S500 (21.9 g/100 g dry mass) exhibited relatively high protein levels. In contrast, amaranth S101 and quinoa S302 showed lower protein contents, with 14.9 and 13.0 g/100 g dry mass, respectively.
The protein content of flaxseed S43 (20.3% dry mass) aligned with literature values, which typically range from 18.3% to 22% dry mass [9,35]. Similarly, sesame S62 (25.2% dry mass) was situated at the upper end of the reported range of 17–25% dry mass [16,36]. Amaranth S101 (14.9% dry mass) also fell within its expected range of 13.6–15% dry mass [37]. Hemp S201 exhibited a slightly lower protein content (23.3%) compared to the literature (25–31.6% dry mass) [2]. The protein content of quinoa S302 (13.0% dry mass) was within the lower end of the wide range reported in literature (10–22% dry mass) [38]. Lastly, the poppy seed sample S500 yielded a protein content of 21.9%, also consistent with the reported range of 21–27% dry mass [39,40].
2.1.2. Fat content
To prevent interference with subsequent analyses, seed lipids were removed prior to protein extraction. For this purpose, ground seed samples were extracted twice with hexane; fat content was calculated based on the weight difference before and after defatting, and the results expressed in percentage are shown in Figures S1 and S2 (supplementary data). These figures highlight considerable variability in fat content within each seed type, reflecting differences that may stem from varietal genetics, geographical origin, or processing conditions. While quinoa and amaranth consistently exhibited low fat levels all below 6% (Figures S2C & S2E), chia, basil, and hemp seeds displayed moderate fat contents ranging from 14% to 22%, and black cumin, flaxseed, poppy seed, and sesame demonstrated the highest overall fat levels, between 26% and 37%. On average, the measured fat contents were lower than those typically reported in the literature; 42–48 g/100 g for flaxseed and 30–33 g/100 g for chia [41], 17.7–25 g/100 g for sesame, 7.0 g/100 g for amaranth, and 35–48.8 g/100 g for hemp. Reported values for quinoa are around 6.1 g/100 g, for canihua 6–8 g/100 g, for poppy seeds 33–41.6 g/100 g, for basil 9.7–33 g/100 g, and for black cumin 35–41 g/100 g. This observed variability is critical when standardizing protein extraction protocols, as lipid content can influence both extraction efficiency and matrix behavior.
2.2. Protein Extraction
Figure 1 presents the extraction efficiencies obtained using three distinct methods, (1) Ambi/urea buffer, (2) SDS-based extraction, and (3) TCA precipitation, applied to a selected sample of each superseed type. The efficiency of protein extraction varied substantially depending on both the seed matrix and the method employed. Overall, the Ambi/urea buffer method provided the highest protein recoveries across most seed types, with yields exceeding 80% in psyllium seed (S1000), and surpassing 60% in poppy seed (S500), black cumin (S900), and sesame (S60). These results indicate a broad compatibility of the Ambi/urea approach with diverse seed compositions, likely owing to its strong solubilizing capacity for various protein classes. Nevertheless, the Ambi/urea method also exhibited clear limitations in several cases. In specific samples such as flaxseed (S40), chia (S48) and basil (S600), the extraction mixture developed a viscous, gel-like consistency during the procedure, rendering pipetting of the supernatant difficult and drastically reducing the recoverable volume. This phenomenon likely results from the presence of polysaccharides capable of gel formation even at low concentrations, as is well documented for chia seed hydrocolloids [42] and flaxseed mucilage [43,44].
SDS-based extraction also showed strong performance, particularly with Flax (S40) chia (S48), sesame (S60), amaranth (S100), basil (S600) and hemp (S200), yielding protein quantities comparable to those obtained via the Ambi/urea method (Figure 1). This suggests that SDS is especially effective at solubilizing hydrophobic proteins, which are abundant in oil-rich seeds. In contrast, TCA precipitation consistently produced the lowest yields across all seed types, often below 25%. Notably, basil seed (S600) exhibited low extraction efficiency (<5%) across. Although commonly used for protein precipitation and cleanup, the strong denaturing conditions and limited solubilization associated with TCA likely contributed to its reduced extraction efficiency in this study.
Statistical analysis revealed significant differences (p < 0.05) among extraction methods within each seed type, as denoted by the letter groupings in Figure 1. These findings underscore the critical importance of method selection for optimizing protein extraction, and they demonstrate the broad applicability of both the Ambi/urea and SDS methods in superseed matrices. In fact, SDS and urea are commonly used in protein extraction processes for their denaturing and solubilizing properties. While urea is known as a chaotropic agent which disrupts hydrogen bonds and hydrophobic interactions within proteins, leading to their denaturation and solubilization, SDS is a powerful anionic detergent which denatures proteins by coating them with negatively charged molecules, causing them to unfold and become soluble. However, due to the practical limitations discussed above, the Ambi/urea method was excluded from further analyses. The SDS-based method was thus retained for its robustness and compatibility across all tested species.
A modified SDS protocol incorporating reducing (TCEP) and alkylating (IAA) treatments was also tested but did not yield further improvements in extraction efficiency (Figure S5, supplementary data). Consequently, the original SDS protocol was selected as the standardized protein extraction method; applied to all seed samples, and the results are presented in Figure 2. On average, an amount of extracted protein of 8, 15, 11, 17, 9, and 13 mg per 100 mg defatted sample were obtained for flaxseed, sesame, amaranth, hemp, quinoa, and poppy seed, respectively (Figure 2A). Corresponding extraction yields (Figure 2B) exceeded 50% for most samples across species, except for flaxseed samples, which consistently exhibited lower yields around 40%.
2.3. Profile of the Extracted proteins
The protein profiles of eleven selected superseed samples extracted using Ambi/urea buffer, SDS buffer, and TCA precipitation were evaluated by SDS-PAGE, and the results are shown in Figure 3. The gel images reveal clear differences in protein band patterns and intensities across extraction methods, reflecting variations in protein solubility and recovery efficiency, as discussed previously. The Ambi/urea (Figure 3A) and SDS-based extractions (Figure 3B) produced more distinct and diverse banding profiles than TCA precipitation (Figure 3C). Using the Ambi/urea buffer, distinct protein bands were visible in the 10–15 kDa range across all eleven seed species analyzed: flaxseed (1), sesame (2), chia (3), amaranth (4), hemp (5), quinoa (6), canihua (7), poppy (8), basil (9), black cumin (10), and psyllium (11). Additionally, well-defined bands in the 35–55 kDa range were observed in flaxseed, sesame, chia, amaranth, hemp, black cumin, and psyllium. By contrast, SDS-based extractions yielded a different banding pattern, characterized by a prominent band around 55 kDa in amaranth and intense bands between 15 and 35 kDa in flaxseed, sesame, chia, amaranth, hemp, quinoa, canihua, and poppy. TCA-based extraction resulted in a distinct profile as well, showing strong bands in the 35–55 kDa range for hemp, poppy, and black cumin, and bands between 15–35 kDa for most other species. No discernible bands were detected in basil seed extracts (Figure 3C). These findings further emphasize the significant impact of extraction methodology on protein solubilization and recovery.
To assess intra-species variability, the SDS extracts of all sample replicates for flaxseed, sesame, amaranth, hemp, quinoa, and poppy were also analyzed by SDS-PAGE. The corresponding gel images are provided in Figures S5–S9 (supplementary data). Overall, the most intense bands particularly those around 20 and 35–40 kDa likely correspond to storage proteins such as globulins, which are composed of α- and β-subunits within these molecular weight ranges [34]. In flaxseed (Figure S5), prominent bands at ~20 and ~35 kDa probably represent the α- and β-chains of globulins, which constitute approximately 18.6% of total protein content, or alternatively albumins, which account for around 17.7% [9,34,45]. Sesame seed extracts (Figure S6) showed strong bands between 25–35 kDa and around 20 kDa, likely also corresponding to globulins, the predominant protein fraction (67.3%) [46]. Amaranth (Figure S7A) exhibited a similar banding profile, with additional strong bands around 70 kDa that may correspond to vicilin-like or embryonic DC-8-like proteins [47]. Hemp extracts (Figure S7B) showed pronounced bands at ~20 and ~35 kDa, characteristic of edestin, a hexameric 11S globulin [48]. Quinoa samples (Figure S8) displayed faint but consistent bands at ~20 and ~32 kDa, likely corresponding to 11S-type seed storage proteins. In poppy seed (Figure S9), the observed bands at ~20 and ~35 kDa may reflect globulins, while a band around 55 kDa may represent a phosphatase known to be specific to poppy seeds.
Overall, despite minor differences in band intensity, the SDS-PAGE profiles were highly consistent among samples of the same species, confirming the reproducibility and robustness of the standardized SDS extraction protocol across biological replicates.
2.4. Identification of Species-Specific Peptide Markers Across Superseeds
In order to establish a robust approach to the differentiation and authentication of superseeds, a targeted mass spectrometry strategy was implemented to identify species-specific peptide markers. These peptides were selected on the basis of (1) their uniqueness in complete seed proteomes, (2) both robustness (stability and minimal interference) and a strong signal (high abundance) for accurate and reliable detection in experimental samples, (3) and their association with taxonomically or functionally relevant proteins. Protein extracts from nine superseed species were analyzed: flax, sesame, amaranth, hemp, quinoa, poppy seeds, basil seed, cumin and psyllium seeds. All samples were processed according to the standardized protocol described above. The selected biomarker peptides for each successfully characterized seed are summarized in Table 1, including their parental proteins, peptide sequences and observed signal intensity ranges. In flaxseed, peptides derived from 2S albumins (conlinin 1 and 2) showed particularly strong signals. Among them, the tryptic peptide WVQQAK (derived from conlinin 2) was systematically detected with high intensity over several replicates (values ranging from 675,000 to 2,100,000 peak area/mg defatted flour) and was therefore selected as a potential main marker (Figure 4a). Other specific peptides such as DLPGQCGTQPSR and QIQEQDYLR were also identified and could be used as qualifiers for additional confirmatory assessments. In sesame extracts, eight specific target peptides from 11S, 2S and 7S globulins (Table 1) were successfully identified. The LVYIER peptide, derived from 11S globulin (Q9XHP0), showed the most robust and stable signal (10,170,000-12,958,000 peak area/mg defatted flour) and was selected as the main marker (Figure 4b). Complementary peptides were also successfully detected, including the 2S albumin peptide DCCQQLR (Q9AUD1) and the 11S globulin peptide VHVVDR (Q9XHP0), allowing further reinforcement of the species specificity.
In amaranth, the LTALEPTNR specific peptide derived from 11S globulin (Q38712) showed a high intensity in all samples analyzed, ranging from 2,139,000-3,134,000 peak area/mg defatted flour (Figure 4c), while additional sequences including CAGVSVIR and SSGQGEYR from agglutinin-like lectin (Q38719) were also successfully detected, contributing further specificity. In hemp, several edestine isoforms (11S globulin-like proteins) produced strong signals, especially the peptides FLQLSAER and GTLDLVSPLR from edestine 1 (A0A090DLH8) and FLQLTAER from edestine 2 (A0A090CXP8) with signals ranging from 9,657,000 to 13,279,000; 4,987,000 to 7,015,000; and 11,128,000 to 15,372,000 peak area/mg defatted flour, respectively (Figure 4d). These peptides were therefore selected as potential co-markers due to their complementary sequence variation and consistent detection. Among the many proteins examined in quinoa, three were able to produce specific peptides that were successfully detected in all eleven samples analyzed (S301-S303, S320-S323, S340-S343). These included the peptide LTALEPTNR from 11S globulin (Q6Q385), which showed the highest intensity (98,000-269,000 peak area/mg defatted flour), as well as the peptides DVGQTIESK from oleosin (A0A803M3Q4) and CCDDLK from AAI protein (A0A803LYI9) (Figure 4e). In fact, although these last peptides showed more moderate intensities (in the range 12,000-43,000), they were but still significant and were consequently selected as supporting peptides, contributing to the further distinction of quinoa. In the case of poppy seeds, where classical storage proteins did not yield specific peptides in the detectable range, it was still possible to identify and successfully measure specific peptides from other protein types in samples S500-S503 and S510-S513 (Figure 4f). The peptide INIVNSQK, specific to a cupin domain protein (A0A4Y7K3R5), for example, showed high intensity signals (ranging from 3,473,000 to 5,527,000 peak areas/mg defatted flour), thereby emerging as the most promising marker candidate for poppy seed authentication.
In addition to their specificity, the potential marker peptides selected are also required to have good chemical stability for robust quantification, both in a wide variety of samples from different regions and cultivation conditions, as well as in complex mixed matrices or even processed products. For example, the peptide LVYIER derived from sesame 11S globulin not only provided excellent signal intensity, but also excellent stability compared with other peptides which, although specific, contained cysteine or tryptophan residues in their sequences that are more prone to oxidative modification. The observed variability in peptide marker intensities across samples (Table 1) likely reflects the inherent biological diversity among commercial seed samples, including differences in variety, growing conditions, maturity, and processing history. Additionally, matrix effects during LC-MS/MS analysis and the varying protein compositions between samples may contribute to this variability. While this variability is expected for authentic samples, it highlights the importance of establishing acceptance ranges for each marker during method validation. Another important parameter in the selection of potential biomarkers was the consideration of potential protein isoforms. In fact, isoform inferences tend to be noisy and may lead to the false detection of the targeted peptides [49,50]. It is well known that seed storage proteins may share similar amino acid sequences. For example, the isomeric peptides WVQQAK (Colinin 1) and WIQQAK (Colinin 2), and FLQLSAER (Edestin 1) and FLQLTAER (Edestin 2) were identified as potential markers in flaxseed and hemp, respectively. But as those isoforms are only present in the same species, there seems to be no inherent concern about using them to identify or authenticate the corresponding seeds. More interesting, the recurrence of the peptide LTALEPTNR identified as markers in amaranth and quinoa, two phylogenetically related pseudocereals, may raise important questions regarding the uniqueness of the peptides when taking into account the whole proteome of all investigated as one. This peptide is derived from the trypsin digestion of homologous 11S globulin proteins in both seed species, with a precursor mass of 507.7826++ and corresponding product ions of 800.4261+, 729.3890+, 616.3049+ and 487.2623. The peptide LTALEPTNR was then no more considered as principal potential marker for both seed species. Further cross-analysis from all seed species were performed and no interference was observed which means that all other peptides were found to be clearly distinguishable in the current analytical context (data not shown) and were thus ultimately validated as potential peptide markers for the respective seed species.
Overall, if seed storage proteins and especially 2S and 11S were found as sources of peptide markers for most seeds, poppy seeds represented a special case as no storage proteins here was found suitable to provide specific peptide. Nevertheless, the identification of potential stable and reliable peptide markers from other protein groups, including proteins containing a cupin domain indicated the possibility to adapt the strategy by targeting less conventional proteins. This provides an interesting basis for extending the methodology to other seed species whose potential marker peptides where not successfully identified. In fact, chia, canihua, basil, black cumin and psyllium seeds were also investigated in the context of the present study but due to the lack of storage proteins fully annotated, the results obtained were not sufficient to allow the detection of reliable and reproducible peptide markers for these species. Another potential limitation could have been the levels or even the composition of the extracted proteins. For example, it can be seen from the electrophoresis gels (Figure 3) that samples S600 basil seed and S1000 psyllium seed exhibited very few or even no band, irrespective of the extraction strategy. In this respect, further investigations on methodological optimizations in order to improve the protein extractability of the above-mentioned species need to be addressed, this in order to achieve more in-depth proteomic coverage for their peptide markers identification. In this respect, untargeted approach with independent data acquisition (DIA) could also be an interesting pathway together with the targeted approach, this to broaden the spectrum of marker discovery for these species. The present study was designed as a proof-of-concept to establish the methodological framework using commercially available samples, which inherently limited sample diversity and numbers for some species. Future validation studies should incorporate larger sample sets with clearly defined biological replicates from diverse geographical origins and cultivation conditions to better characterize natural variability ranges and establish robust acceptance criteria for authentication purposes.
3. Materials and Methods
3.1. Biological samples
In total, 81 commercially available superseeds were analyzed in this study, sourced from the Max Planck Institute of Molecular Plant Physiology (Potsdam, Germany). These different commercially available samples included eight flaxseeds (Linum usitatissimum L.), thirteen chia samples (Salvia hispanica L.), eight sesame samples (Sesamum indicum L.), five amaranth seeds (Amaranthus ssp.), four hemp samples (Cannabis sativa L.), eleven quinoa samples (Chenopodium quinoa Willd), four canihua samples (Chenopodium pallidicaule Aellen), eight poppy seeds (Papaver somniferum L.), four basil seeds (Ocimum basilicum L.), four cumin samples (Nigella sativa L.), and twelve psyllium seeds including four samples from Plantago Afra L. (black), four samples from Plantago Indica L. (black), and four samples from Plantago ovata F. (brown). Table S1 (see supplementary data) provides an overview of the plant material information, and Figure S1 (supplementary data) shows representative images of selected seeds, presented in both whole and ground forms. Visual comparison illustrates differences in seed morphology, color, and texture, which may influence protein extraction efficiency and analytical profiling.
3.2. Chemicals
Ammonium bicarbonate (AMBI), dithiothreitol (DTT), n-hexane, trichloroacetic acid (TCA), Tris(hydroxymethyl)aminomethane (Tris base), and Tris(2-carboxyethyl)phosphine hydrochloride (TCEP) were obtained from Carl Roth GmbH, Karlsruhe, Germany. Iodoacetamide (IAA) and urea were purchased from Sigma-Aldrich, Steinheim, Germany. Bovine serum albumin (BSA), used as a standard for protein quantification, was procured from Fluka Chemie AG, Buchs, Switzerland. Proteomics-grade trypsin for protein digestion was obtained from Amresco, Solon, OH, USA. Eluents used for mass spectrometry analysis were of LC-MS grade, and all other chemicals used in this study were of analytical grade, with a purity of 95% or higher.
3.3. Sample Preparation and Protein Extraction
All biological replicates of each seed type were first placed in Petri dishes and visually inspected for potential contamination. Due to the structural differences (shape and size) between the seeds investigated, several procedures were employed to obtain the seed flours. Milling of samples S40, S48, S60, S100, S200, S304, S400, S500, S600, and S900 (details are presented in Table S1) was performed at room temperature (RT) using an A10 analytical mill (IKA-Werke GmbH & CO. KG, Staufen, Germany). Amaranth samples (S101–S104) were ground with a Red Ruby coffee grinder using dry ice. All other samples were milled using a mortar and pestle under liquid nitrogen. The ground samples were stored at 4°C throughout the testing period.
Before protein extraction, the samples were defatted by mixing 1g of flour with 2 mL of n-hexane containing 0.05% butylhydroxytoluene. The mixture was shaken for 15 minutes at 60 rpm at room temperature and centrifuged at 10,000 × g for 5 minutes at 4°C. The supernatant was discarded, and this defatting step was repeated once. The samples were then air-dried under a fume hood. Fat content was calculated based on the difference in sample mass before and after defatting. The defatted samples were subsequently used for protein extraction.
Given the broad diversity of seed types and the known influence of buffer composition on protein solubility and extractability, three extraction methods were tested: (i) Ambi/urea buffer extraction, (ii) SDS buffer extraction, and (iii) TCA extraction. For this procedure, one sample from each of the seed types was randomly selected (not all samples could be used to optimize the sample preparation procedure) and initially used and each extraction method was performed in triplicates. Subsequently, the method yielding the best protein recovery was selected as standard method for all samples.
3.3.1. Protein extraction using the Ambi/Urea method
Protein extraction using the Ambi/urea method involved mixing 100 mg of defatted sample material with 1 mL of extraction buffer (100 mM ammonium hydrogen carbonate, 4 M urea). The mixture was shaken for one hour at room temperature (80 rpm), followed by centrifugation at 10,000 × g for 10 minutes at 4°C. The resulting supernatant was carefully collected and transferred to fresh 1.5mL reaction tubes. To further clarify the extract, the supernatant was incubated at -20°C for 20 minutes and centrifuged again at the same conditions. The resulting clear supernatant containing the extracted proteins was transferred to new 1.5mL tubes and stored at -20°C until further use.
3.3.2. SDS Buffer Extraction Method
For the SDS extraction method, 100 mg of defatted sample material were mixed with 1 mL of SDS extraction buffer (130mM SDS, 50mM Tris-base, 130mM DTT, pH 6.8) and incubated in a thermomixer at 50°C with shaking at 1000 rpm for 1 hour. Following incubation, the samples were cooled and centrifuged at 10,000 × g for 5 minutes at 4°C. The supernatant was transferred to fresh 2mL reaction tubes, mixed with 1 mL of ice-cold acetone, and incubated at -20°C for 20 minutes to precipitate proteins. After centrifugation, the supernatant was discarded, and the washing step was repeated using acetone. The protein pellet was air-dried and resuspended in 1 mL of Ambi/urea buffer. After an additional centrifugation step, the clear supernatants were collected and stored at -20°C for subsequent analysis.
3.3.3. TCA Extraction Method
The trichloroacetic acid (TCA) extraction method was performed following our previously descriebed procedure with some modifications [51]. Briefly, 100 mg of defatted sample material were mixed with 1 mL of extraction buffer (50 mM Tris-HCl, 25 mM sucrose, 0.1 M EDTA, 1% Triton X-100, 10% glycerol, 10 mM DTT, pH 8) and incubated at room temperature for 1 hour under gentle shaking (70 rpm). After centrifugation, the supernatants were mixed with cold 10% TCA in acetone and incubated at -20°C for 1 hour to precipitate the proteins. After a second centrifugation, the pellets were air-dried, resuspended in Ambi/urea buffer, and stored at -20°C for further analysis.
3.4. Sample characterization
3.4.1. Protein content
The crude protein content of some selected seed samples was determined using the Kjeldahl method, applying a nitrogen-to-protein conversion factor of 6.25 [52]. The concentration of extracted proteins in solution was measured using the Lowry method [53], with bovine serum albumin (BSA) used as a standard for calibration.
3.4.2. Electrophoretic Characterization
Protein profiling was performed using SDS-PAGE under reducing conditions. Separation was carried out on 10% bis-tris polyacrylamide gels prepared in-house [54,55]. For sample preparation, protein extracts were mixed in a 1:1 (v/v) ratio with 1× sample buffer containing 2% SDS, 5% β-mercaptoethanol, 10% glycerol, 0.01% bromophenol blue, and Tris buffer. The mixtures were heated at 100°C for 5 minutes, cooled, and loaded onto gels alongside a protein marker using ~25µg of protein per slot (PageRuler Plus Prestained Protein Marker, Thermo Fisher Scientific, Carlsbad, CA, USA). Electrophoresis was performed at 30 mA per gel for approximatively 90 minutes using a Criterion™ Vertical Electrophoresis Cell (Bio-Rad Laboratories, Singapore). After separation, gels were stained overnight in Coomassie Brilliant Blue R-250 solution followed by destaining in 10% acetic acid. The gels were then scanned (Bio-Professional VIS scanner, SERVA Electrophoresis GmbH, Heidelberg, Germany), and band profiles were analyzed using ImageLab software, version 6.01 (Bio-Rad Laboratories Ltd., Hertfordshire, United Kingdom).
3.5. Targeted mass spectrometry for peptide markers search
3.5.1. Sample preparation
The samples were first subjected to trypsin digestion before mass spectrometry analysis. For this, the samples were diluted to 5 mg/mL protein and 400 µL were transferred into 1.5 mL reaction tubes. Reduction was achieved by adding 10 µL of 250 mM TCEP, followed by incubation at 50°C for 20 minutes while shaking at 300 rpm. For alkylation, 10 µL of 250 mM IAA was added, vortexed, and incubated for an additional 20 minutes at 50°C in the dark with shaking. Subsequently, 135 µL of digestion buffer (100 mM ammonium bicarbonate) and 20 µL of 4 mg/mL proteomics grade trypsin were added resulting in a protein-to-enzyme ratio of 25:1 (w/w). The mixture was vortexed briefly and incubated overnight at 37 °C with shaking at 300 rpm. The digestion process was stopped by adding 15 µL of 40% formic acid (FA).
Following digestion, solid-phase extraction (SPE) was performed for sample cleanup. For this purpose, C18 columns were used, containing 300 mg of material each. The columns were activated with 6 mL of SPE buffer A (acetonitrile/water/formic acid in a 50:50:0.1, v/v/v ratio) and conditioned with 6 mL of 0.1% formic acid (FA). The digested proteins were then applied to the columns, washed with 6 mL of 0.1% FA, and finally eluted with 2 mL of SPE buffer B (acetonitrile/FA in a 100:0.1, v/v ratio), followed by 3 mL of 0.1% FA. The eluted samples were collected and transferred into glass vials for further analysis.
3.5.2. Mass spectrometric analysis
A targeted mass spectrometric approach was employed to detect and relatively quantify potential peptide biomarkers specific to each superseed species. This strategy aimed to identify storage proteins and their corresponding tryptic peptides that could serve as analytical markers for species differentiation and potential quality control applications.
Multiple reaction monitoring (MRM) methods were developed for selected peptides based on their relevance, specificity, and detectability. The overall workflow followed the protocols previously described [56,57,58,59], adapted to the proteins of interest from each seed matrix.
The process started with a curated search in the online UniProt database to retrieve proteins representative of each superseed species. As only very few superseed proteins are reviewed or well-annotated, unreviewed entries with annotation score ≥ 2/5 were considered. The amino acid sequences were imported into Skyline software (MacCoss Lab, University of Washington, WA, USA) in FASTA format. In-silico tryptic digestion was performed then with the following parameters: no missed cleavages, fixed carbamidomethylation, peptide length of 5–30 amino acids, and precursor charge state of +2. Transitions corresponding to singly charged b- and y-ions were selected for targeted monitoring. Whole proteomes of the respective species were used as background databases to assess peptide uniqueness via BLAST alignment, thus ensuring marker specificity.
Initially, 8–10 transitions with m/z values ranging from 200 to 1200 were defined per candidate peptide. After empirical evaluation, the four most intense and stable transitions per peptide were retained. Collision energies were further optimized to enhance signal sensitivity. Peptide markers were prioritized based on three key criteria: (1) high and reproducible signal intensity, (2) Good distribution among selected transitions, (3) chromatographic and spectral stability, and (3) minimal cysteine content to reduce variability due to oxidation. Two or three potential peptide markers per protein were then selected (one later used as quantifier and the other as qualifiers for confirmation).
The MRM method was applied using an Agilent Infinity 1260 LC system coupled to an Agilent G6470A Triple Quadrupole mass spectrometer operating in positive ionization mode. Peptide separation was performed on a Kinetex® C8 reversed-phase column (Phenomenex, Torrance, CA, USA) at a flow rate of 0.5 mL/min, using 0.1% formic acid in water (solvent A) and 100% acetonitrile (solvent B). The gradient profile used for separation is summarized in Table S2 (See supplementary data). Method validation included assessment of linearity, accuracy, and reproducibility for each potential peptide marker using control samples. Skyline was used for raw data processing and peak area integration, and relative quantification of protein content across the seed extracts were expressed as peak area per mg defatted flour. The final protein selected are presented in Table S3 while the panel of the corresponding potential marker peptides, including sequences, their transitions, and retention times, is detailed in Tables S4-S8 (supplementary data).
3.6. Statistical analysis
All experiments were conducted in triplicate, and the results are expressed as the mean ± standard deviation. Statistical analysis was performed using GraphPad Prism 8 (GraphPad Software, Inc., San Diego, CA, USA), with significance assessed using two-way ANOVA followed by Tukey’s post-hoc test. A p-value of < 0.05 (two-sided) was considered as significant.
4. Conclusions
The aim of this study was to develop and implement a standardized workflow for the extraction, electrophoretic profiling and targeted mass spectrometric identification of specific peptide markers from a selection of nutrient-rich seeds, often referred to as “superseeds”. Comparative evaluation of different protein extraction protocols led to the development of an optimized method based on SDS buffer, enabling high-yield recovery of seed proteins for most of the seed species analyzed. SDS-PAGE profiling confirmed the reproducibility and efficiency of the extraction procedure. The identification of species-specific peptide markers was successfully achieved for 6 of the 11 superseeds investigated using a targeted HPLC-MS/MS strategy. With focus on the abundant seed storage proteins, including peptides derived from conlinins in flaxseed, globulins in sesame, amaranth, quinoa and hemp, and cupin-like proteins in poppy seed. These results validate the potential of targeted proteomics to support the identification of unique peptide signatures for superseed authentication and traceability. However, the current strategy has shown limitations when applied chia, canihua, basil, black cumin and psyllium seeds under the current experimental conditions. These challenges underline the need for further research, in particular to improve proteomic coverage for these species. Before these peptide markers can be implemented for routine superseed authentication, comprehensive in-house method validation must be conducted to establish analytical performance parameters (precision, accuracy, detection limits) and demonstrate specificity against interferents and related species. Furthermore, validation in real-world applications including processed foods and commercial products is essential to confirm the practical utility of this approach. Ultimately, this targeted proteomic approach lays the foundations for a robust analytical approach supporting the authentication and traceability of superseeds and high-value products derived from superseeds.
Supplementary Materials
The following supporting information can be downloaded at the website of this paper posted on Preprints.org, Figure S1: Fat content in representative samples of eleven selected superfoods; Figure S2: Distribution of fat content across all analyzed samples from (A) flaxseed, (B) sesame, (C) amaranth, (D) hemp, (E) quinoa, and (F) poppy seed, highlighting intra-species variability; Figure S3: Comparison between the protein content obtained from representative samples of eleven superfoods and corresponding values reported in the literature; Figure S4: Comparative analysis of protein concentration and extracted protein yield from the modified SDS extraction protocol, with and without the addition of TCEP and IAA, across flaxseed, sesame, and black cumin samples; Figure S5: SDS-PAGE of flaxseed samples from the final standardized SDS extraction method; Figure S6: SDS-PAGE of sesame samples from the final standardized SDS extraction method; Figure S7: SDS-PAGE of (A) amaranth samples and (B) hemp samples from the final standardized SDS extraction method; Figure S8. SDS-PAGE of all quinoa samples from the final standardized SDS extraction method; Figure S9: SDS-PAGE of all poppy seed samples from the final standardized SDS extraction method; Figure S10: Visual representation of whole and ground forms of selected seed samples used in this study; Table S1: List of the sample materials used in this study, including the different superfoods, their corresponding sample codes, color, origin, and the commercial producers; Table S2: Flow gradient of the final LC-MS/MS method; Table S3: Overview of the final set of proteins selected for targeted HPLC-MS/MS analysis for each superfood, aiming to identify potential biomarkers; Table S4: Parameters of the applied MRM method for identifying and quantifying potential biomarker peptides derived from tryptic digestion of selected sesame proteins; Table S5: Parameters of the applied MRM method for identifying and quantifying potential biomarker peptides derived from tryptic digestion of selected amaranth proteins; Table S6: Parameters of the applied MRM method for identifying and quantifying potential biomarker peptides derived from tryptic digestion of selected hemp proteins; Table S7: Parameters of the applied MRM method for identifying and quantifying potential biomarker peptides derived from tryptic digestion of selected quinoa proteins; Table S8: Parameters of the applied MRM method for identifying and quantifying potential biomarker peptides derived from tryptic digestion of selected poppy seed proteins.
Author Contributions
Conceptualization, S.T.S., J.K., A.H., and H.M.R.; methodology, S.T.S., B.S., K.N., A.E., A.H., J.K. and H.M.R.; software, S.T.S., B.S., P.S. and K.N.; validation, S.T.S., B.S. and H.M.R.; formal analysis, B.S., S.T.S.; investigation, B.S. and P.S.; resources, K.N., A.E., A.H., J.K. and H.M.R.; data curation, B.S., S.T.S.; writing—original draft preparation, S.T.S.; writing—review and editing, S.T.S., B.S., P.S., K.N., A.E., A.H., J.K. and H.M.R.; visualization, B.S. and A.E.; supervision, S.T.S., J.K., A.H. and H.M.R.; project administration, A.H., J.K. and H.M.R. All authors have read and agreed to the published version of the manuscript.
Funding
This research received no external funding.
Data Availability Statement
The original contributions presented in this study are included in the article/supplementary material. Further inquiries can be directed to the corresponding author.
Conflicts of Interest
The authors declare no conflicts of interest.
References
- Mintel. Super growth for “super” foods: New product development shoots up 202% globally over the past five years. https://www.mintel.com/press-centre/super-growth-for-super-foods-new-product-development-shoots-up-202-globally-over-the-past-five-years/ (April 2025).
- Burton, R.A.; Andres, M.; Cole, M.; Cowley, J.M.; Augustin, M.A. Industrial hemp seed: From the field to value-added food ingredients. J Cannabis Res 2022, 4, 45. [Google Scholar] [CrossRef] [PubMed]
- Brigante, F.I.; Garcia, M.E.; Lopez Radcenco, A.; Moyna, G.; Wunderlin, D.A.; Baroni, M.V. Identification of chia, flax and sesame seeds authenticity markers by nmr-based untargeted metabolomics and their validation in bakery products containing them. Food Chem 2022, 387, 132925. [Google Scholar] [CrossRef] [PubMed]
- Hannan, M.A.; Rahman, M.A.; Sohag, A.A.M.; Uddin, M.J.; Dash, R.; Sikder, M.H.; Rahman, M.S.; Timalsina, B.; Munni, Y.A.; Sarker, P.P. , et al. Black cumin (nigella sativa l.): A comprehensive review on phytochemistry, health benefits, molecular pharmacology, and safety. Nutrients 2021, 13. [Google Scholar] [CrossRef]
- Calderon Bravo, H.; Vera Cespedes, N.; Zura-Bravo, L.; Munoz, L.A. Basil seeds as a novel food, source of nutrients and functional ingredients with beneficial properties: A review. Foods 2021, 10. [Google Scholar] [CrossRef] [PubMed]
- Singh, S.P.; Khanna, K.R.; Shukla, S.; Dixit, B.S.; Banerji, R. Prospects of breeding opium poppies (papaver somniferum l.) as a high-linoleic-acid crop. Plant Breeding 2006, 114, 89–91. [Google Scholar] [CrossRef]
- Tavakkoli, A.; Mahdian, V.; Razavi, B.M.; Hosseinzadeh, H. Review on clinical trials of black seed (nigella sativa ) and its active constituent, thymoquinone. J Pharmacopuncture 2017, 20, 179–193. [Google Scholar]
- Bozan, B.; Temelli, F. Chemical composition and oxidative stability of flax, safflower and poppy seed and seed oils. Bioresour Technol 2008, 99, 6354–6359. [Google Scholar] [CrossRef]
- Rubilar, M.; Gutiérrez, C.; Verdugo, M.; Shene, C.; Sineiro, J. Flaxseed as a source of functional ingredients. Journal of soil science and plant nutrition 2010, 10. [Google Scholar] [CrossRef]
- Coşkuner, Y.; Karababa, E. Some physical properties of flaxseed (linum usitatissimum l.). Journal of Food Engineering 2007, 78, 1067–1073. [Google Scholar] [CrossRef]
- Cerino, P.; Buonerba, C.; Cannazza, G.; D'Auria, J.; Ottoni, E.; Fulgione, A.; Di Stasio, A.; Pierri, B.; Gallo, A. A review of hemp as food and nutritional supplement. Cannabis Cannabinoid Res 2021, 6, 19–27. [Google Scholar] [CrossRef]
- Farinon, B.; Molinari, R.; Costantini, L.; Merendino, N. The seed of industrial hemp (cannabis sativa l.): Nutritional quality and potential functionality for human health and nutrition. Nutrients 2020, 12. [Google Scholar] [CrossRef] [PubMed]
- Nissen, L.; Zatta, A.; Stefanini, I.; Grandi, S.; Sgorbati, B.; Biavati, B.; Monti, A. Characterization and antimicrobial activity of essential oils of industrial hemp varieties (cannabis sativa l.). Fitoterapia 2010, 81, 413–419. [Google Scholar] [CrossRef]
- Ma, X.; Wang, Z.; Zheng, C.; Liu, C. A comprehensive review of bioactive compounds and processing technology of sesame seed. Oil Crop Science 2022, 7, 88–94. [Google Scholar] [CrossRef]
- Pathak, N.; Bhaduri, A.; Rai, A.K. Sesame: Bioactive compounds and health benefits. 2019, 181-200.
- Wei, P.; Zhao, F.; Wang, Z.; Wang, Q.; Chai, X.; Hou, G.; Meng, Q. Sesame (sesamum indicum l.): A comprehensive review of nutritional value, phytochemical composition, health benefits, development of food, and industrial applications. Nutrients 2022, 14. [Google Scholar] [CrossRef] [PubMed]
- Verma, A.; Mogra, R. Psyllium (plantago ovata) husk: A wonder food for good health. International Journal of Science and Research (IJSR) 2015, 4, 5. [Google Scholar]
- de la Barca, A.M.; Rojas-Martinez, M.E.; Islas-Rubio, A.R.; Cabrera-Chavez, F. Gluten-free breads and cookies of raw and popped amaranth flours with attractive technological and nutritional qualities. Plant Foods Hum Nutr 2010, 65, 241–246. [Google Scholar] [CrossRef]
- Nongonierma, A.B.; Le Maux, S.; Dubrulle, C.; Barre, C.; FitzGerald, R.J. Quinoa (chenopodium quinoa willd.) protein hydrolysates with in vitro dipeptidyl peptidase iv (dpp-iv) inhibitory and antioxidant properties. Journal of Cereal Science 2015, 65, 112–118. [Google Scholar] [CrossRef]
- Martínez, E.N.; Castellani, O.F.; Añón, M.C. Common molecular features among amaranth storage proteins. Journal of Agricultural and Food Chemistry 1997, 45, 3832–3839. [Google Scholar] [CrossRef]
- Penarrieta, J.M.; Alvarado, J.A.; Akesson, B.; Bergenstahl, B. Total antioxidant capacity and content of flavonoids and other phenolic compounds in canihua (chenopodium pallidicaule): An andean pseudocereal. Mol Nutr Food Res 2008, 52, 708–717. [Google Scholar] [CrossRef]
- Salo, H.M.; Nguyen, N.; Alakarppa, E.; Klavins, L.; Hykkerud, A.L.; Karppinen, K.; Jaakola, L.; Klavins, M.; Haggman, H. Authentication of berries and berry-based food products. Compr Rev Food Sci Food Saf 2021, 20, 5197–5225. [Google Scholar] [CrossRef]
- Dasenaki, M.E.; Drakopoulou, S.K.; Aalizadeh, R.; Thomaidis, N.S. Targeted and untargeted metabolomics as an enhanced tool for the detection of pomegranate juice adulteration. Foods 2019, 8. [Google Scholar] [CrossRef] [PubMed]
- Soni, K.; Frew, R.; Kebede, B. A review of conventional and rapid analytical techniques coupled with multivariate analysis for origin traceability of soybean. Crit Rev Food Sci Nutr 2024, 64, 6616–6635. [Google Scholar] [CrossRef]
- Mburu, M.; Komu, C.; Paquet-Durand, O.; Hitzmann, B.; Zettel, V. Chia oil adulteration detection based on spectroscopic measurements. Foods 2021, 10. [Google Scholar] [CrossRef] [PubMed]
- Dou, X.; Zhang, L.; Yang, R.; Wang, X.; Yu, L.; Yue, X.; Ma, F.; Mao, J.; Wang, X.; Li, P. Adulteration detection of essence in sesame oil based on headspace gas chromatography-ion mobility spectrometry. Food Chem 2022, 370, 131373. [Google Scholar] [CrossRef]
- Danezis, G.P.; Tsagkaris, A.S.; Camin, F.; Brusic, V.; Georgiou, C.A. Food authentication: Techniques, trends & emerging approaches. TrAC Trends in Analytical Chemistry 2016, 85, 123–132. [Google Scholar]
- Li, X.; Wang, D.; Ma, F.; Yu, L.; Mao, J.; Zhang, W.; Jiang, J.; Zhang, L.; Li, P. Rapid detection of sesame oil multiple adulteration using a portable raman spectrometer. Food Chem 2023, 405, 134884. [Google Scholar] [CrossRef]
- Hosseini, H.; Minaei, S.; Beheshti, B. A dedicated electronic nose combined with chemometric methods for detection of adulteration in sesame oil. J Food Sci Technol 2023, 60, 2681–2694. [Google Scholar] [CrossRef]
- Karppinen, K.; Avetisyan, A.; Hykkerud, A.L.; Jaakola, L. A dpcr method for quantitative authentication of wild lingonberry (vaccinium vitis-idaea) versus cultivated american cranberry (v. Macrocarpon). Foods 2022, 11. [Google Scholar] [CrossRef]
- Erban, A.; Fehrle, I.; Martinez-Seidel, F.; Brigante, F.; Mas, A.L.; Baroni, V.; Wunderlin, D.; Kopka, J. Discovery of food identity markers by metabolomics and machine learning technology. Sci Rep 2019, 9, 9697. [Google Scholar] [CrossRef]
- Brigante, F.I.; Lucini Mas, A.; Pigni, N.B.; Wunderlin, D.A.; Baroni, M.V. Targeted metabolomics to assess the authenticity of bakery products containing chia, sesame and flax seeds. Food Chem 2020, 312, 126059. [Google Scholar] [CrossRef]
- Kadereit, J.W.; Körner, C.; Nick, P.; Sonnewald, U. Strasburger − lehrbuch der pflanzenwissenschaften. 2021.
- Heldt, H.W.; Piechulla, B. Pflanzenbiochemie. 2015.
- Marambe, H.K.; Wanasundara, J.P.D. Protein from flaxseed (linum usitatissimum l.). 2017, 133-144.
- Sá, A.G.A.; Pacheco, M.T.B.; Moreno, Y.M.F.; Carciofi, B.A.M. Cold-pressed sesame seed meal as a protein source: Effect of processing on the protein digestibility, amino acid profile, and functional properties. Journal of Food Composition and Analysis 2022, 111, 104634. [Google Scholar] [CrossRef]
- Zhang, X.; Shi, J.; Fu, Y.; Zhang, T.; Jiang, L.; Sui, X. Structural, nutritional, and functional properties of amaranth protein and its application in the food industry: A review. Sustainable Food Proteins 2023, 1, 45–55. [Google Scholar] [CrossRef]
- Dakhili, S.; Abdolalizadeh, L.; Hosseini, S.M.; Shojaee-Aliabadi, S.; Mirmoghtadaie, L. Quinoa protein: Composition, structure and functional properties. Food Chem 2019, 299, 125161. [Google Scholar] [CrossRef]
- Melo, D.; Alvarez-Orti, M.; Nunes, M.A.; Espirito Santo, L.; Machado, S.; Pardo, J.E.; Oliveira, M. Nutritional and chemical characterization of poppy seeds, cold-pressed oil, and cake: Poppy cake as a high-fibre and high-protein ingredient for novel food production. Foods 2022, 11. [Google Scholar] [CrossRef]
- Koza, J.; Jurgonski, A. Partially defatted rather than native poppy seeds beneficially alter lipid metabolism in rats fed a high-fat diet. Sci Rep 2023, 13, 14171. [Google Scholar] [CrossRef]
- Ixtaina, V.Y.; Nolasco, S.M.; Tomás, M.C. Physical properties of chia (salvia hispanica l.) seeds. Industrial Crops and Products 2008, 28, 286–293. [Google Scholar] [CrossRef]
- Iglesias-Puig, E.; Haros, M. Evaluation of performance of dough and bread incorporating chia (salvia hispanica l.). European Food Research and Technology 2013, 237, 865–874. [Google Scholar] [CrossRef]
- Oomah, B.D.; Kenaschuk, E.O.; Cui, W.; Mazza, G. Variation in the composition of water-soluble polysaccharides in flaxseed. Journal of Agricultural and Food Chemistry 2002, 43, 1484–1488. [Google Scholar] [CrossRef]
- Liu, J.; Shim, Y.Y.; Tse, T.J.; Wang, Y.; Reaney, M.J.T. Flaxseed gum a versatile natural hydrocolloid for food and non-food applications. Trends in Food Science & Technology 2018, 75, 146–157. [Google Scholar]
- Chung, M.W.Y.; Lei, B.; Li-Chan, E.C.Y. Isolation and structural characterization of the major protein fraction from norman flaxseed (linum usitatissimum l.). Food Chemistry 2005, 90, 271–279. [Google Scholar] [CrossRef]
- Rivas R, N.; Dench, J.E.; Caygill, J.C. Nitrogen extractability of sesame (sesamum indicum l.) seed and the preparation of two protein isolates. Journal of the Science of Food and Agriculture 2006, 32, 565–571. [Google Scholar] [CrossRef]
- Bojorquez-Velazquez, E.; Barrera-Pacheco, A.; Espitia-Rangel, E.; Herrera-Estrella, A.; Barba de la Rosa, A.P. Protein analysis reveals differential accumulation of late embryogenesis abundant and storage proteins in seeds of wild and cultivated amaranth species. BMC Plant Biol 2019, 19, 59. [Google Scholar] [CrossRef] [PubMed]
- Sun, X.; Sun, Y.; Li, Y.; Wu, Q.; Wang, L. Identification and characterization of the seed storage proteins and related genes of cannabis sativa l. Front Nutr 2021, 8, 678421. Front Nutr 2021, 8, 678421. [Google Scholar] [CrossRef] [PubMed]
- Bensaddek, D.; Nicolas, A.; Lamond, A.I. Signal enhanced proteomics: A biological perspective on dissecting the functional organisation of cell proteomes. Curr Opin Chem Biol 2019, 48, 114–122. [Google Scholar] [CrossRef]
- Miller, R.M.; Jordan, B.T.; Mehlferber, M.M.; Jeffery, E.D.; Chatzipantsiou, C.; Kaur, S.; Millikin, R.J.; Dai, Y.; Tiberi, S.; Castaldi, P.J. , et al. Enhanced protein isoform characterization through long-read proteogenomics. Genome Biol 2022, 23, 69. [Google Scholar] [CrossRef]
- Sagu, S.T.; Huschek, G.; Homann, T.; Rawel, H.M. Effect of sample preparation on the detection and quantification of selected nuts allergenic proteins by lc-ms/ms. Molecules 2021, 26. [Google Scholar] [CrossRef]
- Pither, R.J. Food and nutritional analysis | vegetables and legumes. 2005, 320-328.
- Lowry, O.H.; Rosebrough, N.J.; Farr, A.L.; Randall, R.J. Protein measurement with the folin phenol reagent. The Journal of biological chemistry 1951, 193, 265–275. [Google Scholar] [CrossRef]
- Laemmli, U.K. Cleavage of structural proteins during the assembly of the head of bacteriophage t4. Nature 1970, 227, 680–685. [Google Scholar] [CrossRef]
- Sagu, S.T.; Wiedemann, L.T.; Nichani, K.; Henze, A.; Rawel, H.M. The optimization of the osborne extraction method for the fractionation and characterization of oat proteins. Separations 2024, 11, 271. [Google Scholar] [CrossRef]
- Sagu, S.T.; Landgraber, E.; Rackiewicz, M.; Huschek, G.; Rawel, H. Relative abundance of alpha-amylase/trypsin inhibitors in selected sorghum cultivars. Molecules 2020, 25. [Google Scholar] [CrossRef]
- Sagu, S.T.; Zimmermann, L.; Landgraber, E.; Homann, T.; Huschek, G.; Ozpinar, H.; Schweigert, F.J.; Rawel, H.M. Comprehensive characterization and relative quantification of alpha-amylase/trypsin inhibitors from wheat cultivars by targeted hplc-ms/ms. Foods 2020, 9. [Google Scholar] [CrossRef] [PubMed]
- Sagu, S.T.; Rawel, H.M.; Rohn, S. Targeted bottom-up mass spectrometry approach for the relative quantification of post-translational modification of bovine kappa-casein during milk fermentation. Molecules 2022, 27. [Google Scholar] [CrossRef] [PubMed]
- Sagu, S.T.; Ulbrich, N.; Morche, J.R.; Nichani, K.; Ozpinar, H.; Schwarz, S.; Henze, A.; Rohn, S.; Rawel, H.M. Formation of cysteine adducts with chlorogenic acid in coffee beans. Foods 2024, 13. [Google Scholar] [CrossRef] [PubMed]
Figure 1.
Protein extraction yields in comparison to total protein content determined by Kjehldahl (in %). Extraction was performed using Ambi/urea, SDS, and TCA-based protocols. One representative sample was analyzed for each of the eleven superfoods: S40 flaxseed, S48 chia, S60 sesame, S100 amaranth, S200 hemp, S301 quinoa, S400 canihua, S500 poppy seed, S600 basil seed, S900 cumin, and S1000 psyllium seed. Different letters indicate statistically significant differences between extraction methods (P < 0.05).
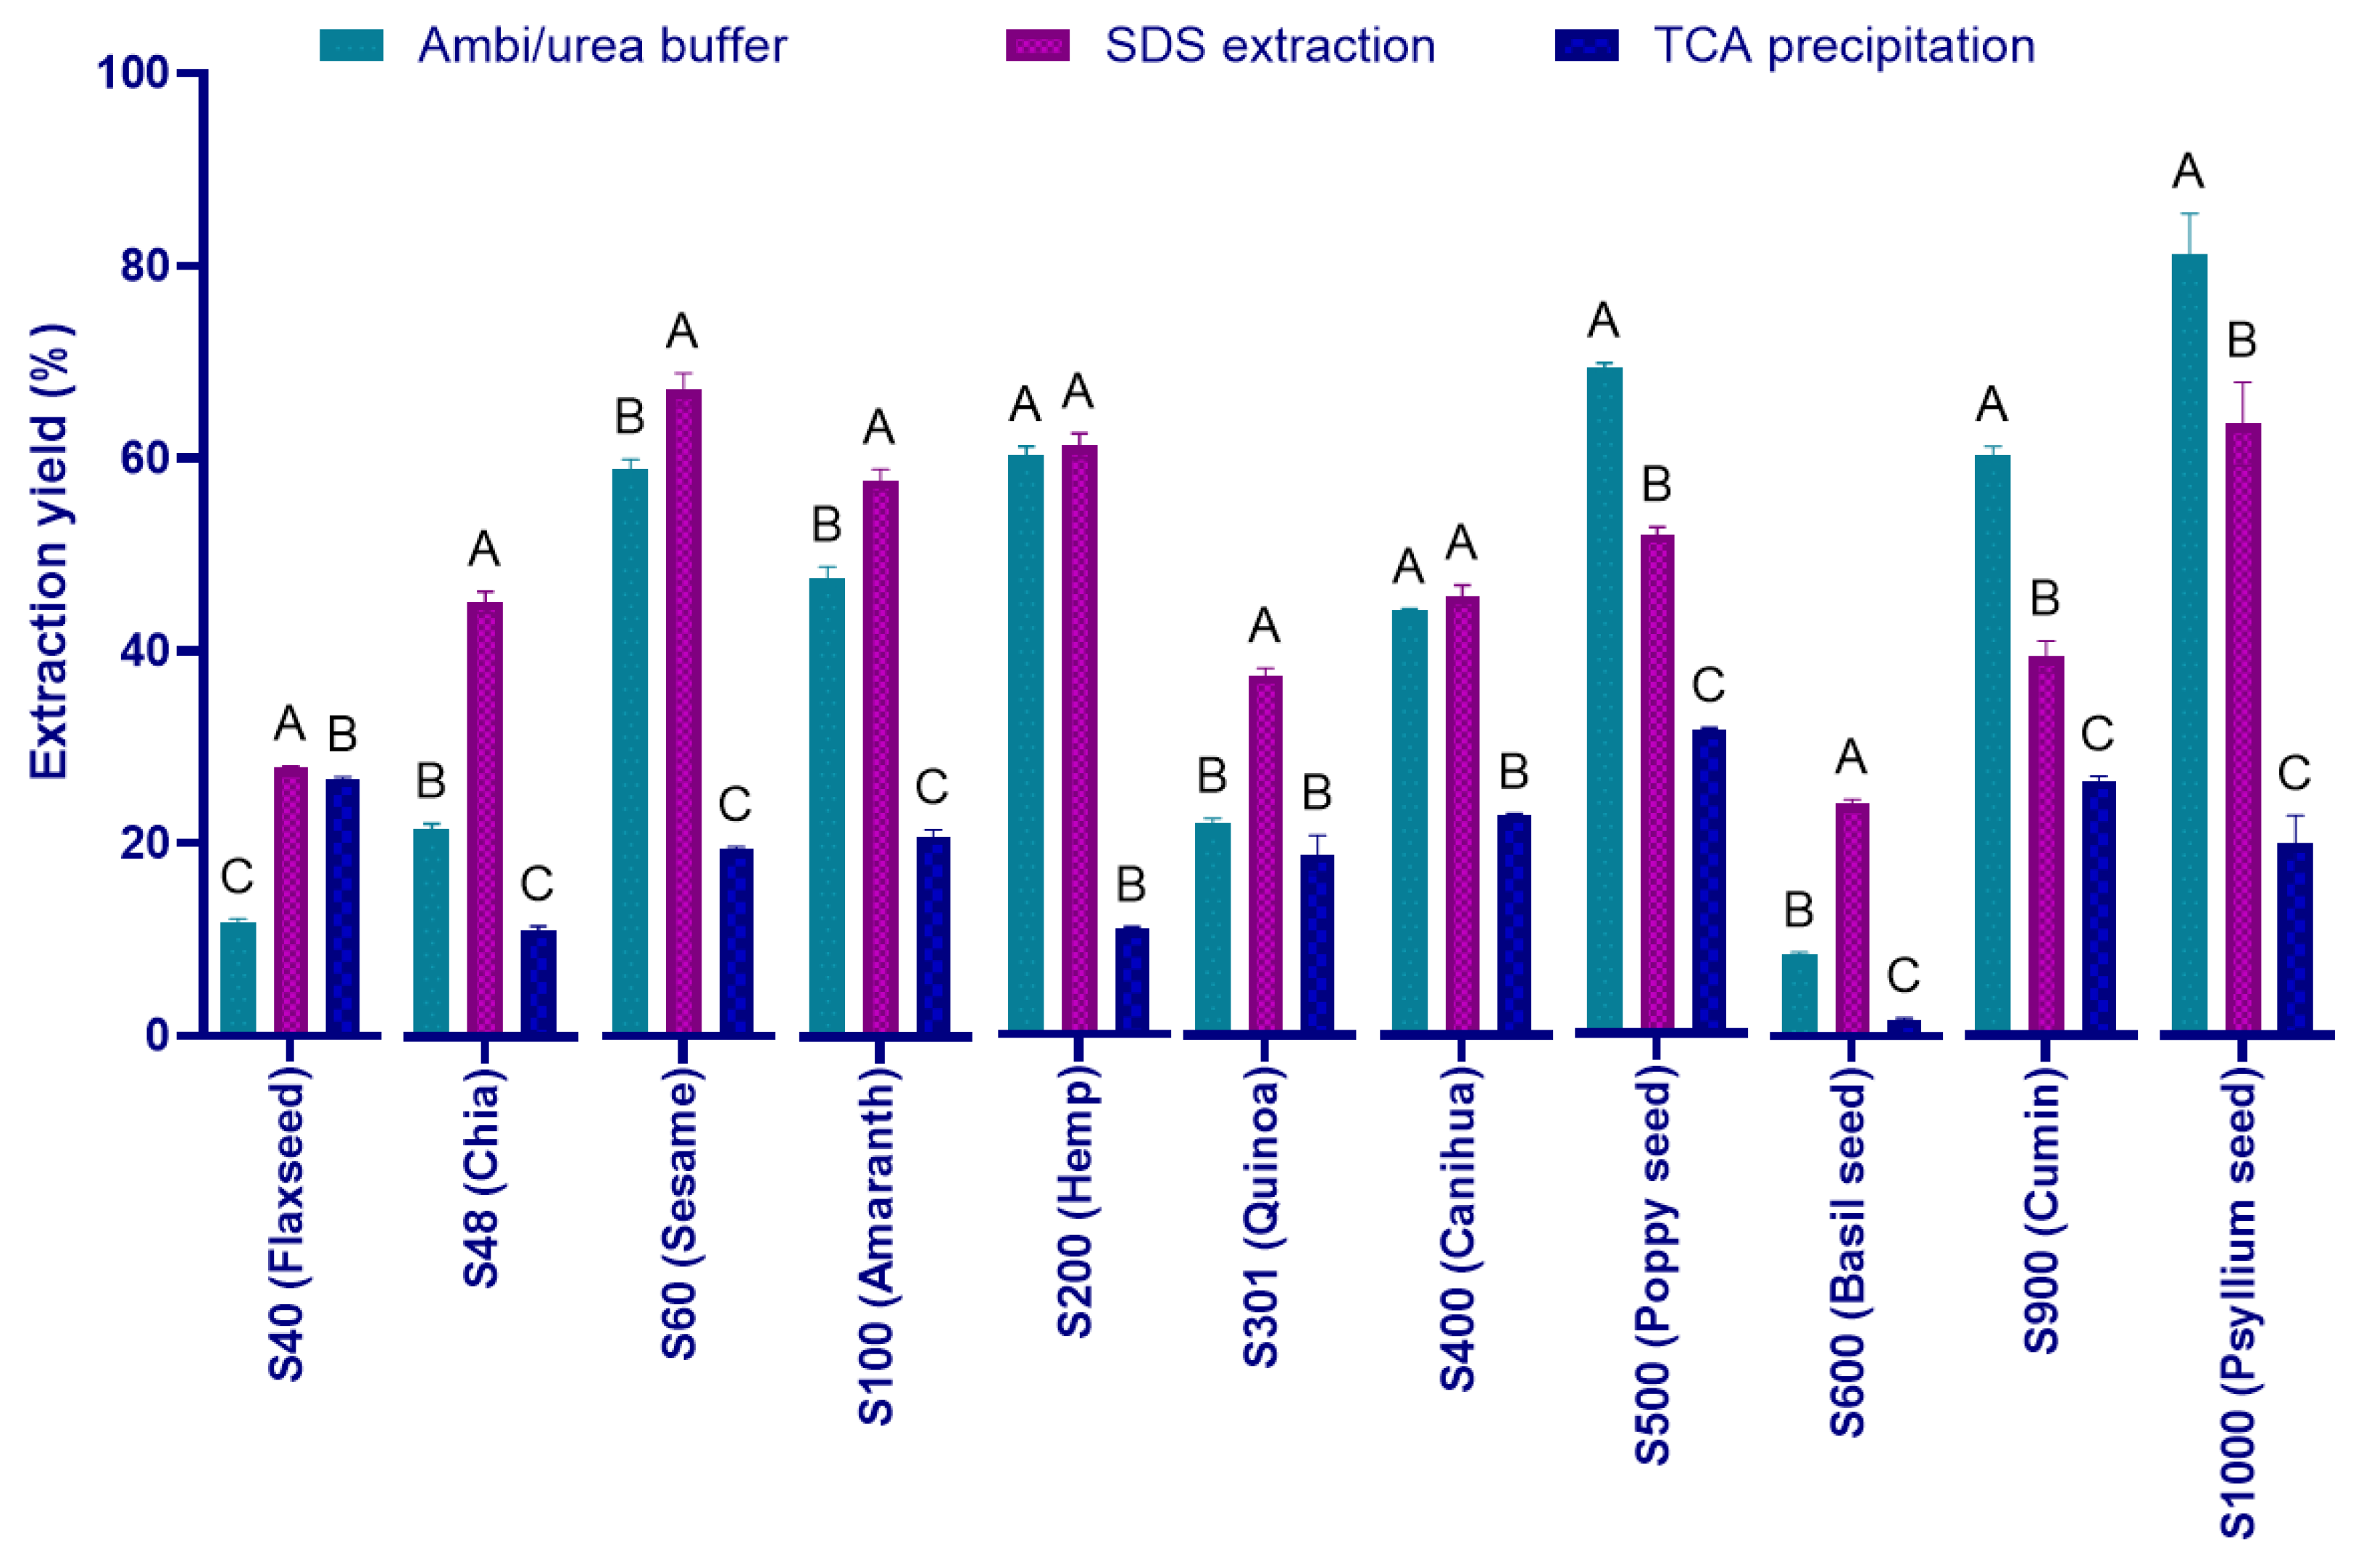
Figure 2.
Amount of (a) extracted protein and (a) protein extraction yield using the standardized final SDS extraction method for all samples from flaxseed, sesame, amaranth, hemp, quinoa, and poppy seed. Letters A, B, C and D express significant differences (p < 0.05) according to a one-way ANOVA.
Figure 2.
Amount of (a) extracted protein and (a) protein extraction yield using the standardized final SDS extraction method for all samples from flaxseed, sesame, amaranth, hemp, quinoa, and poppy seed. Letters A, B, C and D express significant differences (p < 0.05) according to a one-way ANOVA.
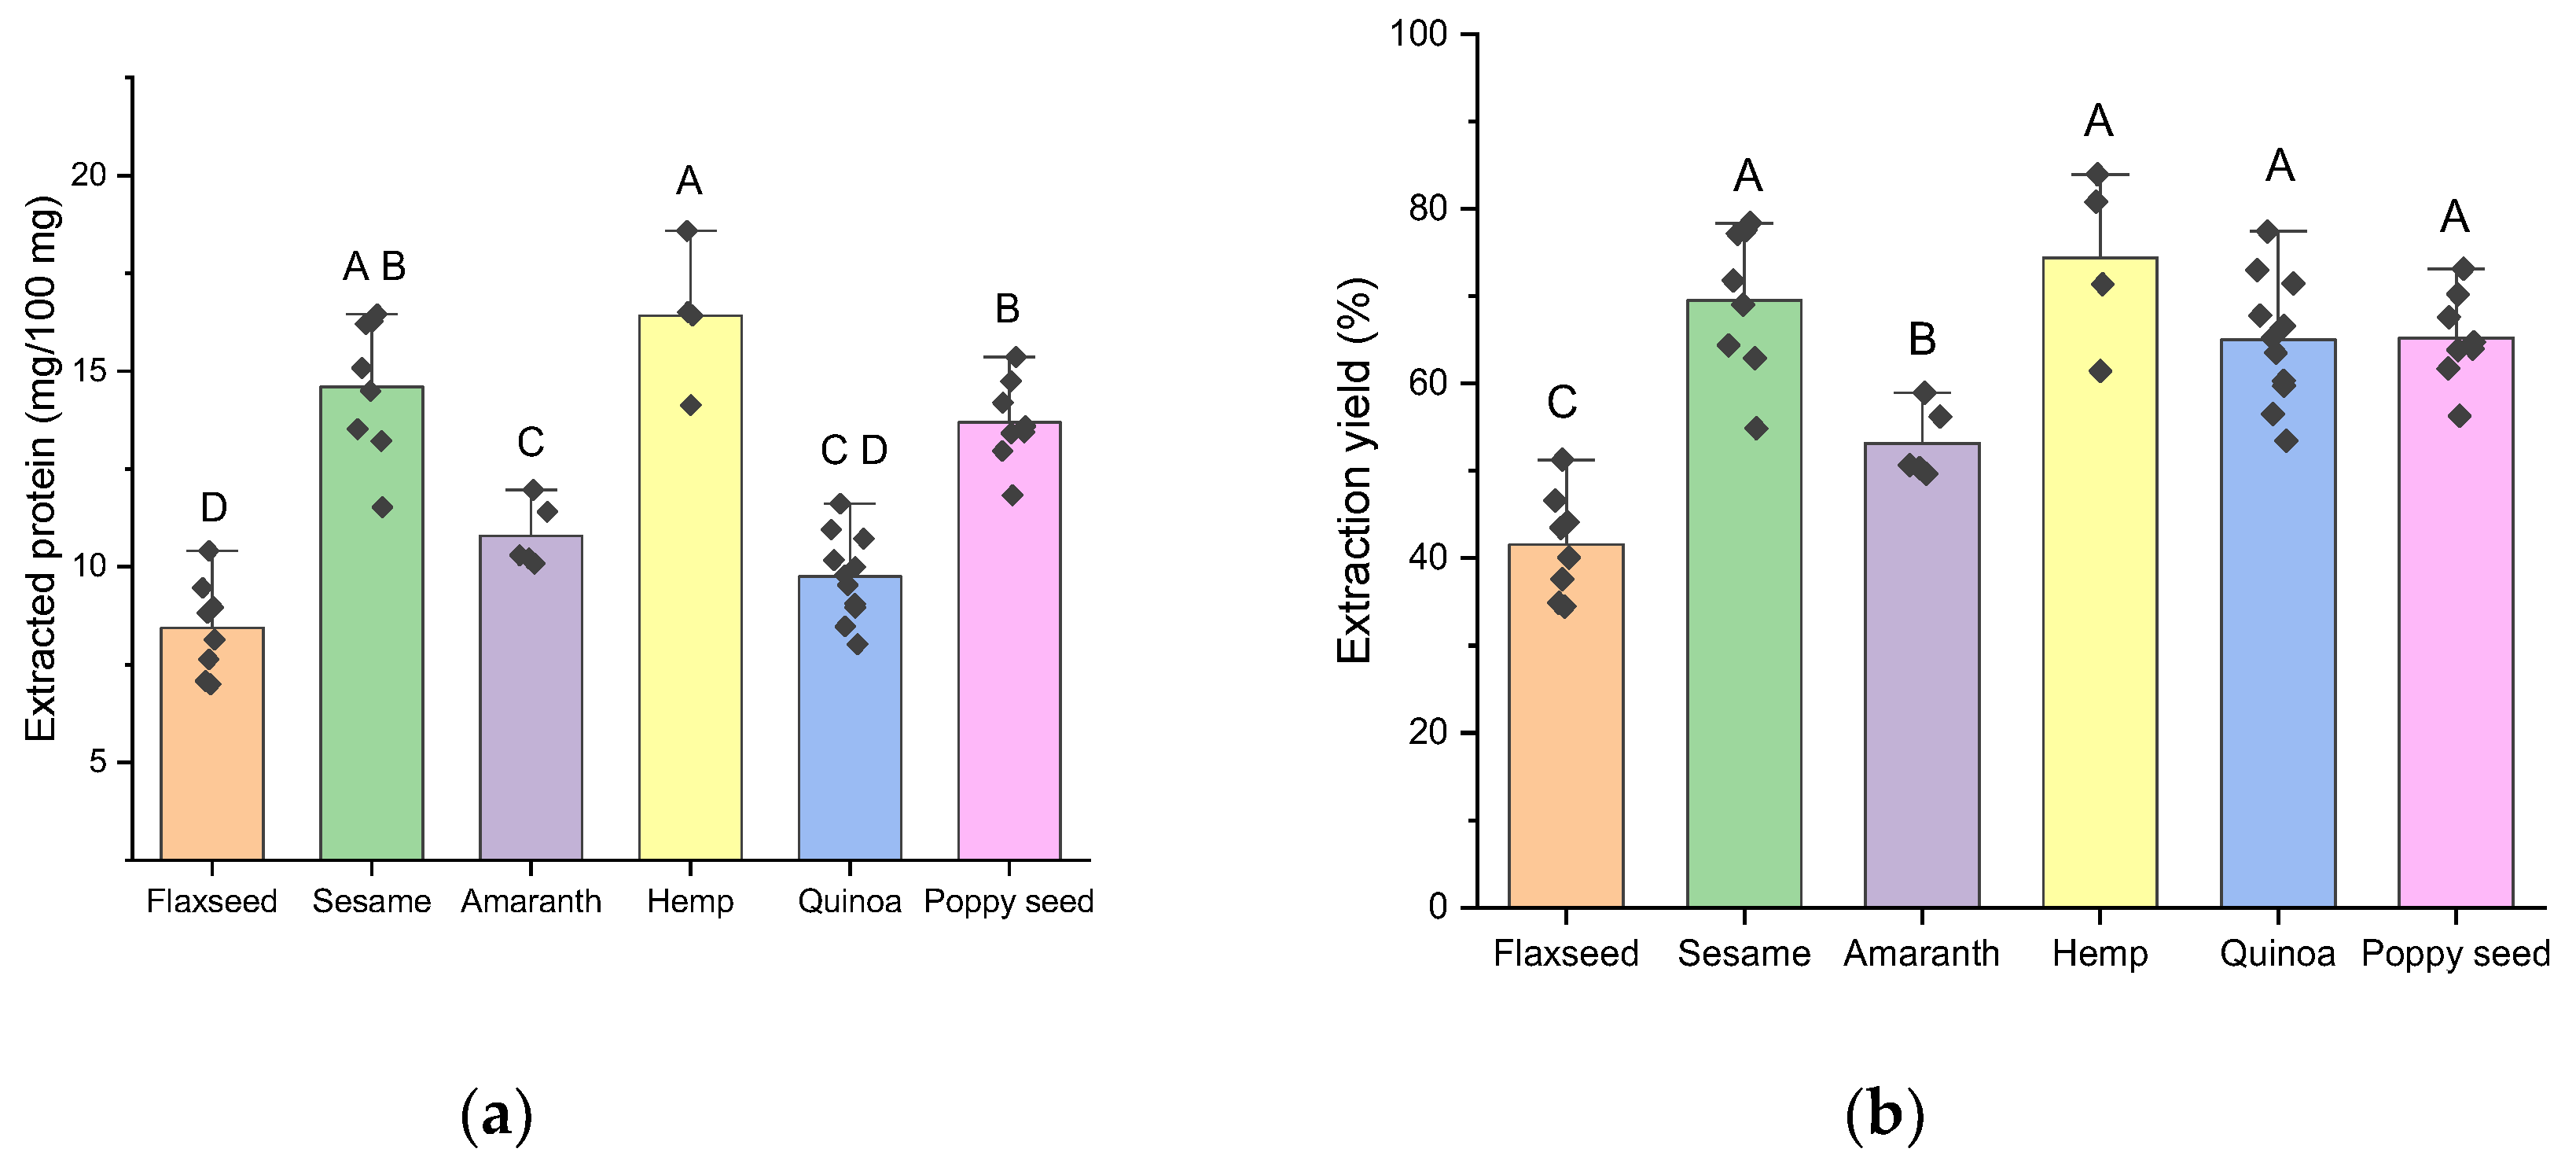
Figure 3.
SDS-PAGE analysis of protein extracts obtained using three different methods: (A) Ambi/urea buffer extraction, (B) SDS extraction, and (C) TCA precipitation. Lane M: molecular weight marker; Lanes 1–11 correspond to the selected superfood samples: 1 – S40 flaxseed, 2 – S48 chia, 3 – S60 sesame, 4 – S100 amaranth, 5 – S200 hemp, 6 – S301 quinoa, 7 – S400 canihua, 8 – S500 poppy seed, 9 – S600 basil seed, 10 – S900 black cumin, 11 – S1000 psyllium seed.
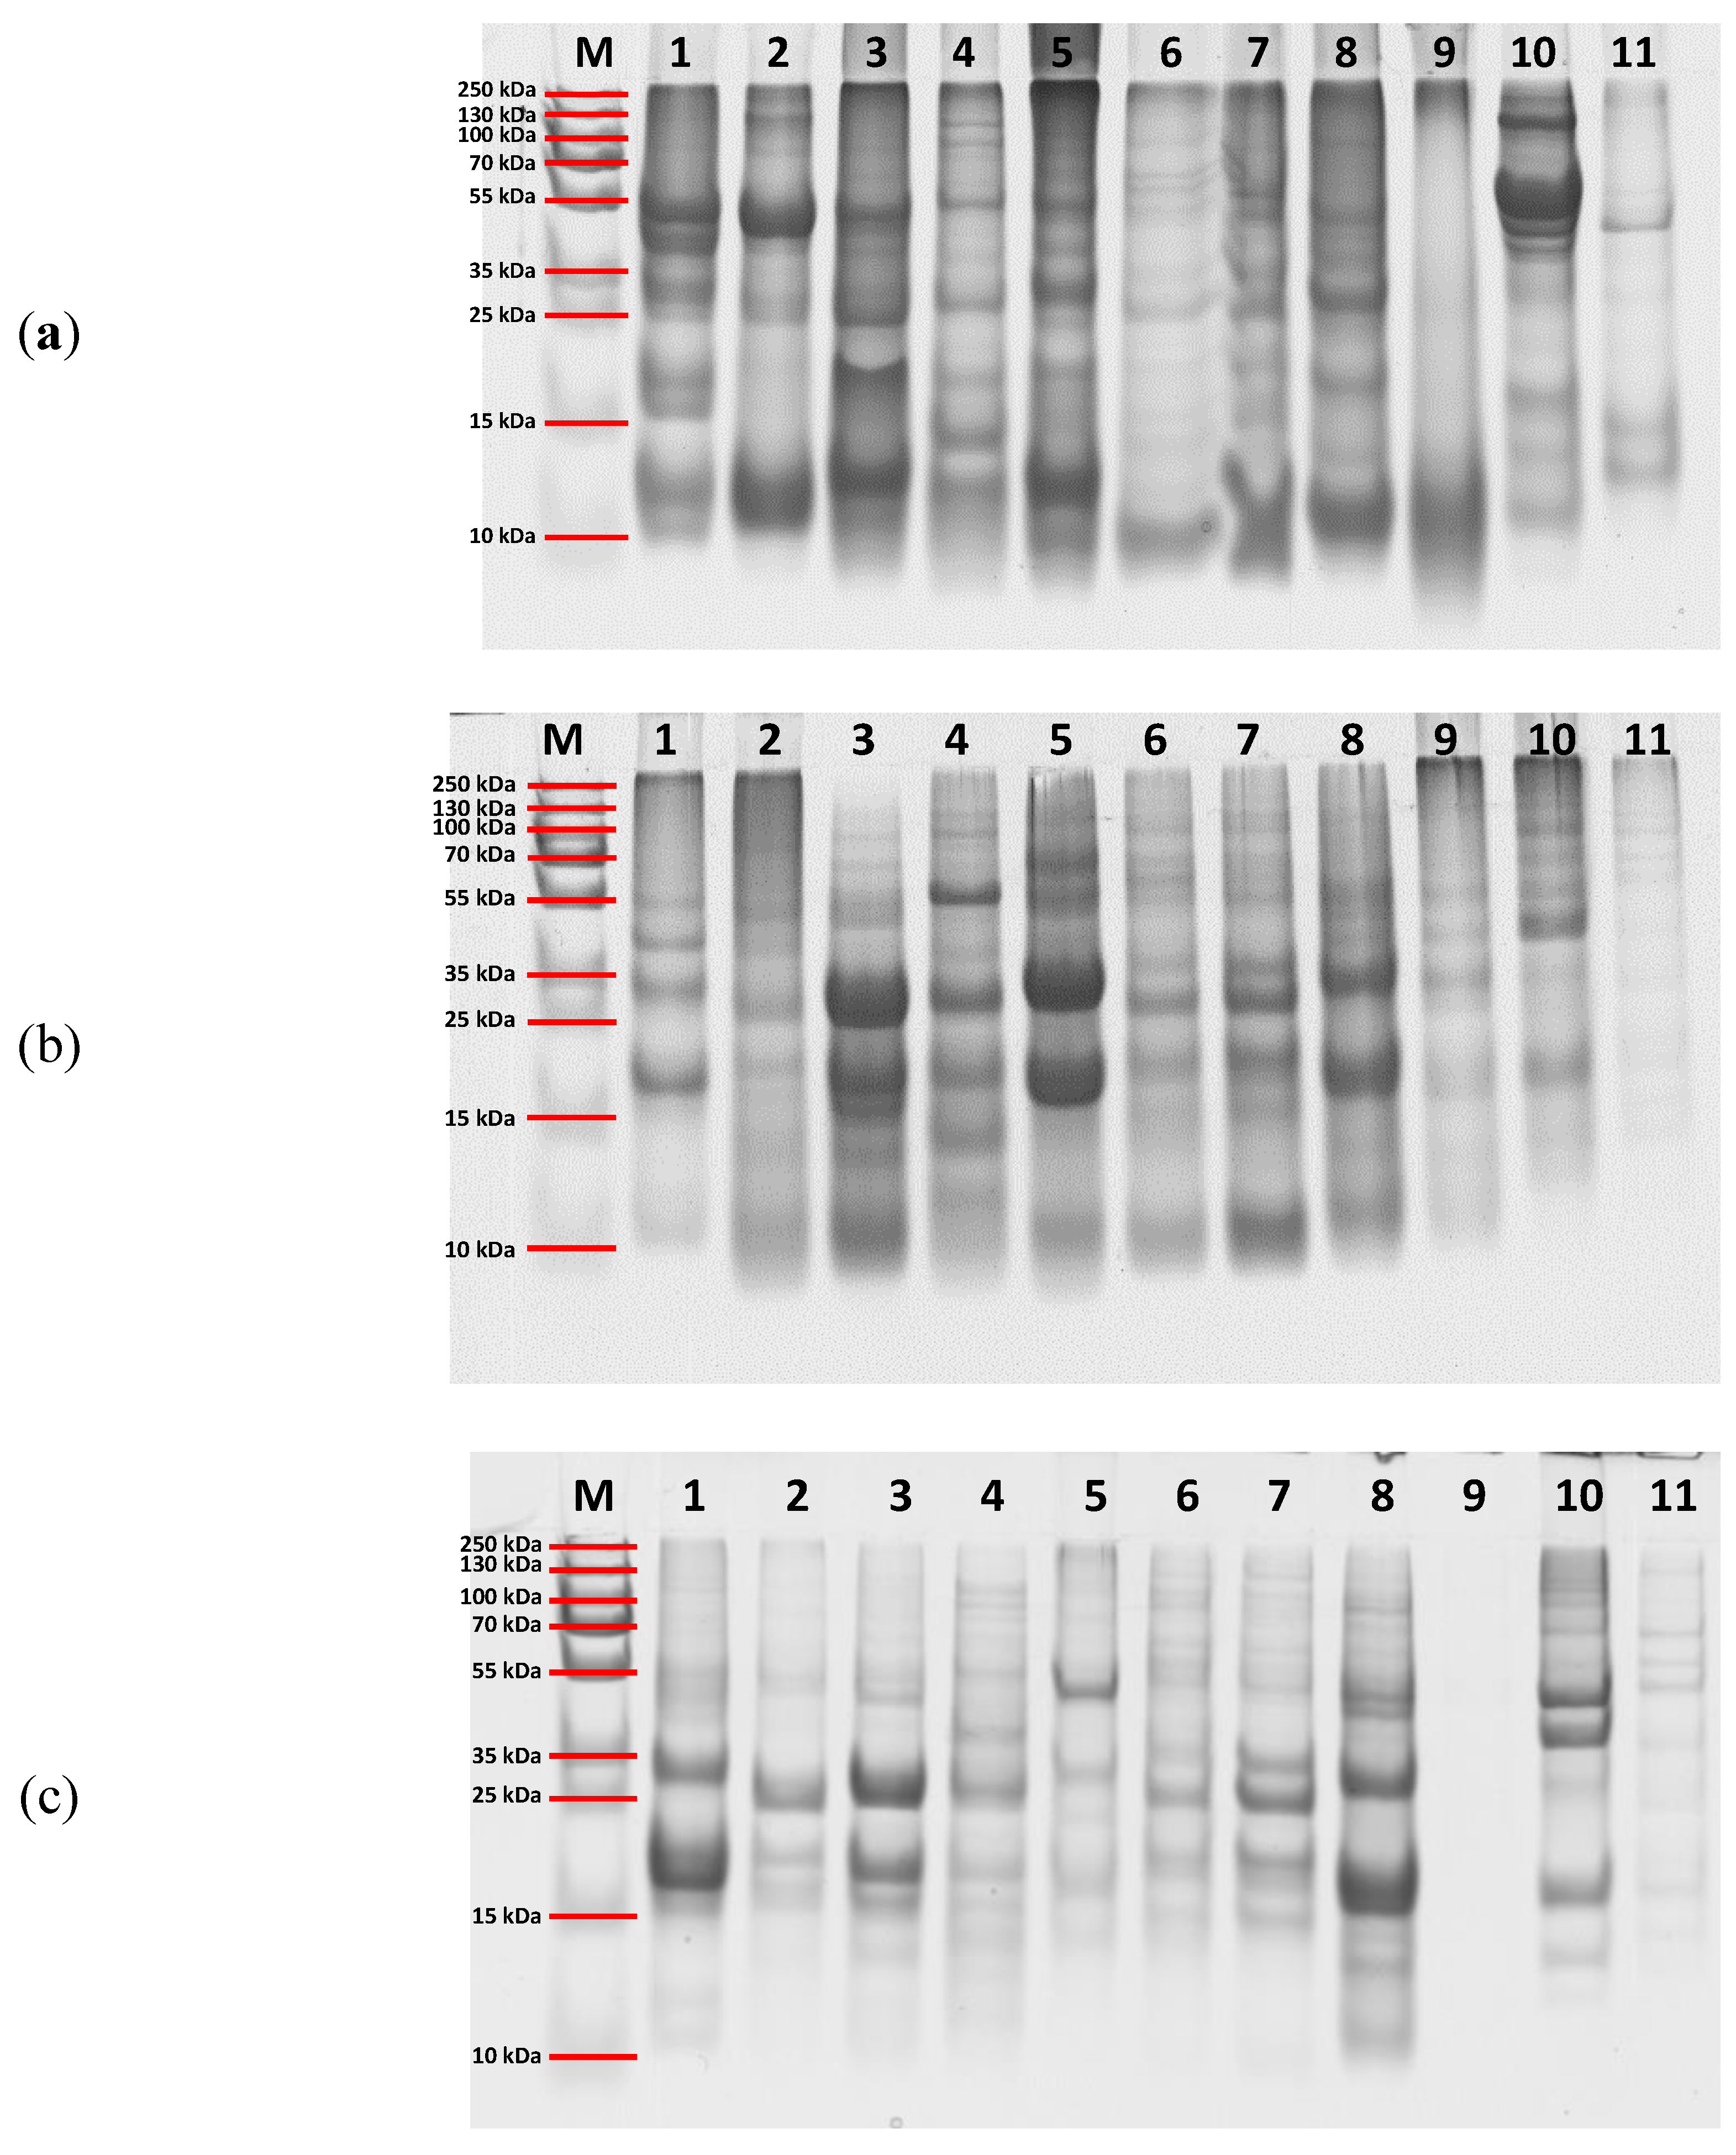
Figure 4.
Distribution of potential biomarker peptides identified for (a) flaxseed storage proteins Q8LPD3 Conlinin 2 and Q8LPD4 Conlinin 1; (b) sesame storage proteins Q9XHP0 11S globulin, Q9AUD1 2S albumin, and Q9AUD0 7S globulin; (c) amaranth storage proteins Q38712 11S globulin and Q38719 Agglutinin, (d) hemp proteins A0A090DLH8 Edestin 1, A0A090CXP8 Edestin 2, A0A219D1L6 Albumin, and A0A219D3H6 Edestin 3; (e) quinoa, including Q6Q385 11S seed storage globulin, A0A803M3Q4 Oleosin, and A0A803LYI9, and (f) poppy seed, with proteins A0A4Y7J814, A0A4Y7K3R5, and A0A4Y7KLU8. The results are expressed as peak area values per mg of defatted seed flour.
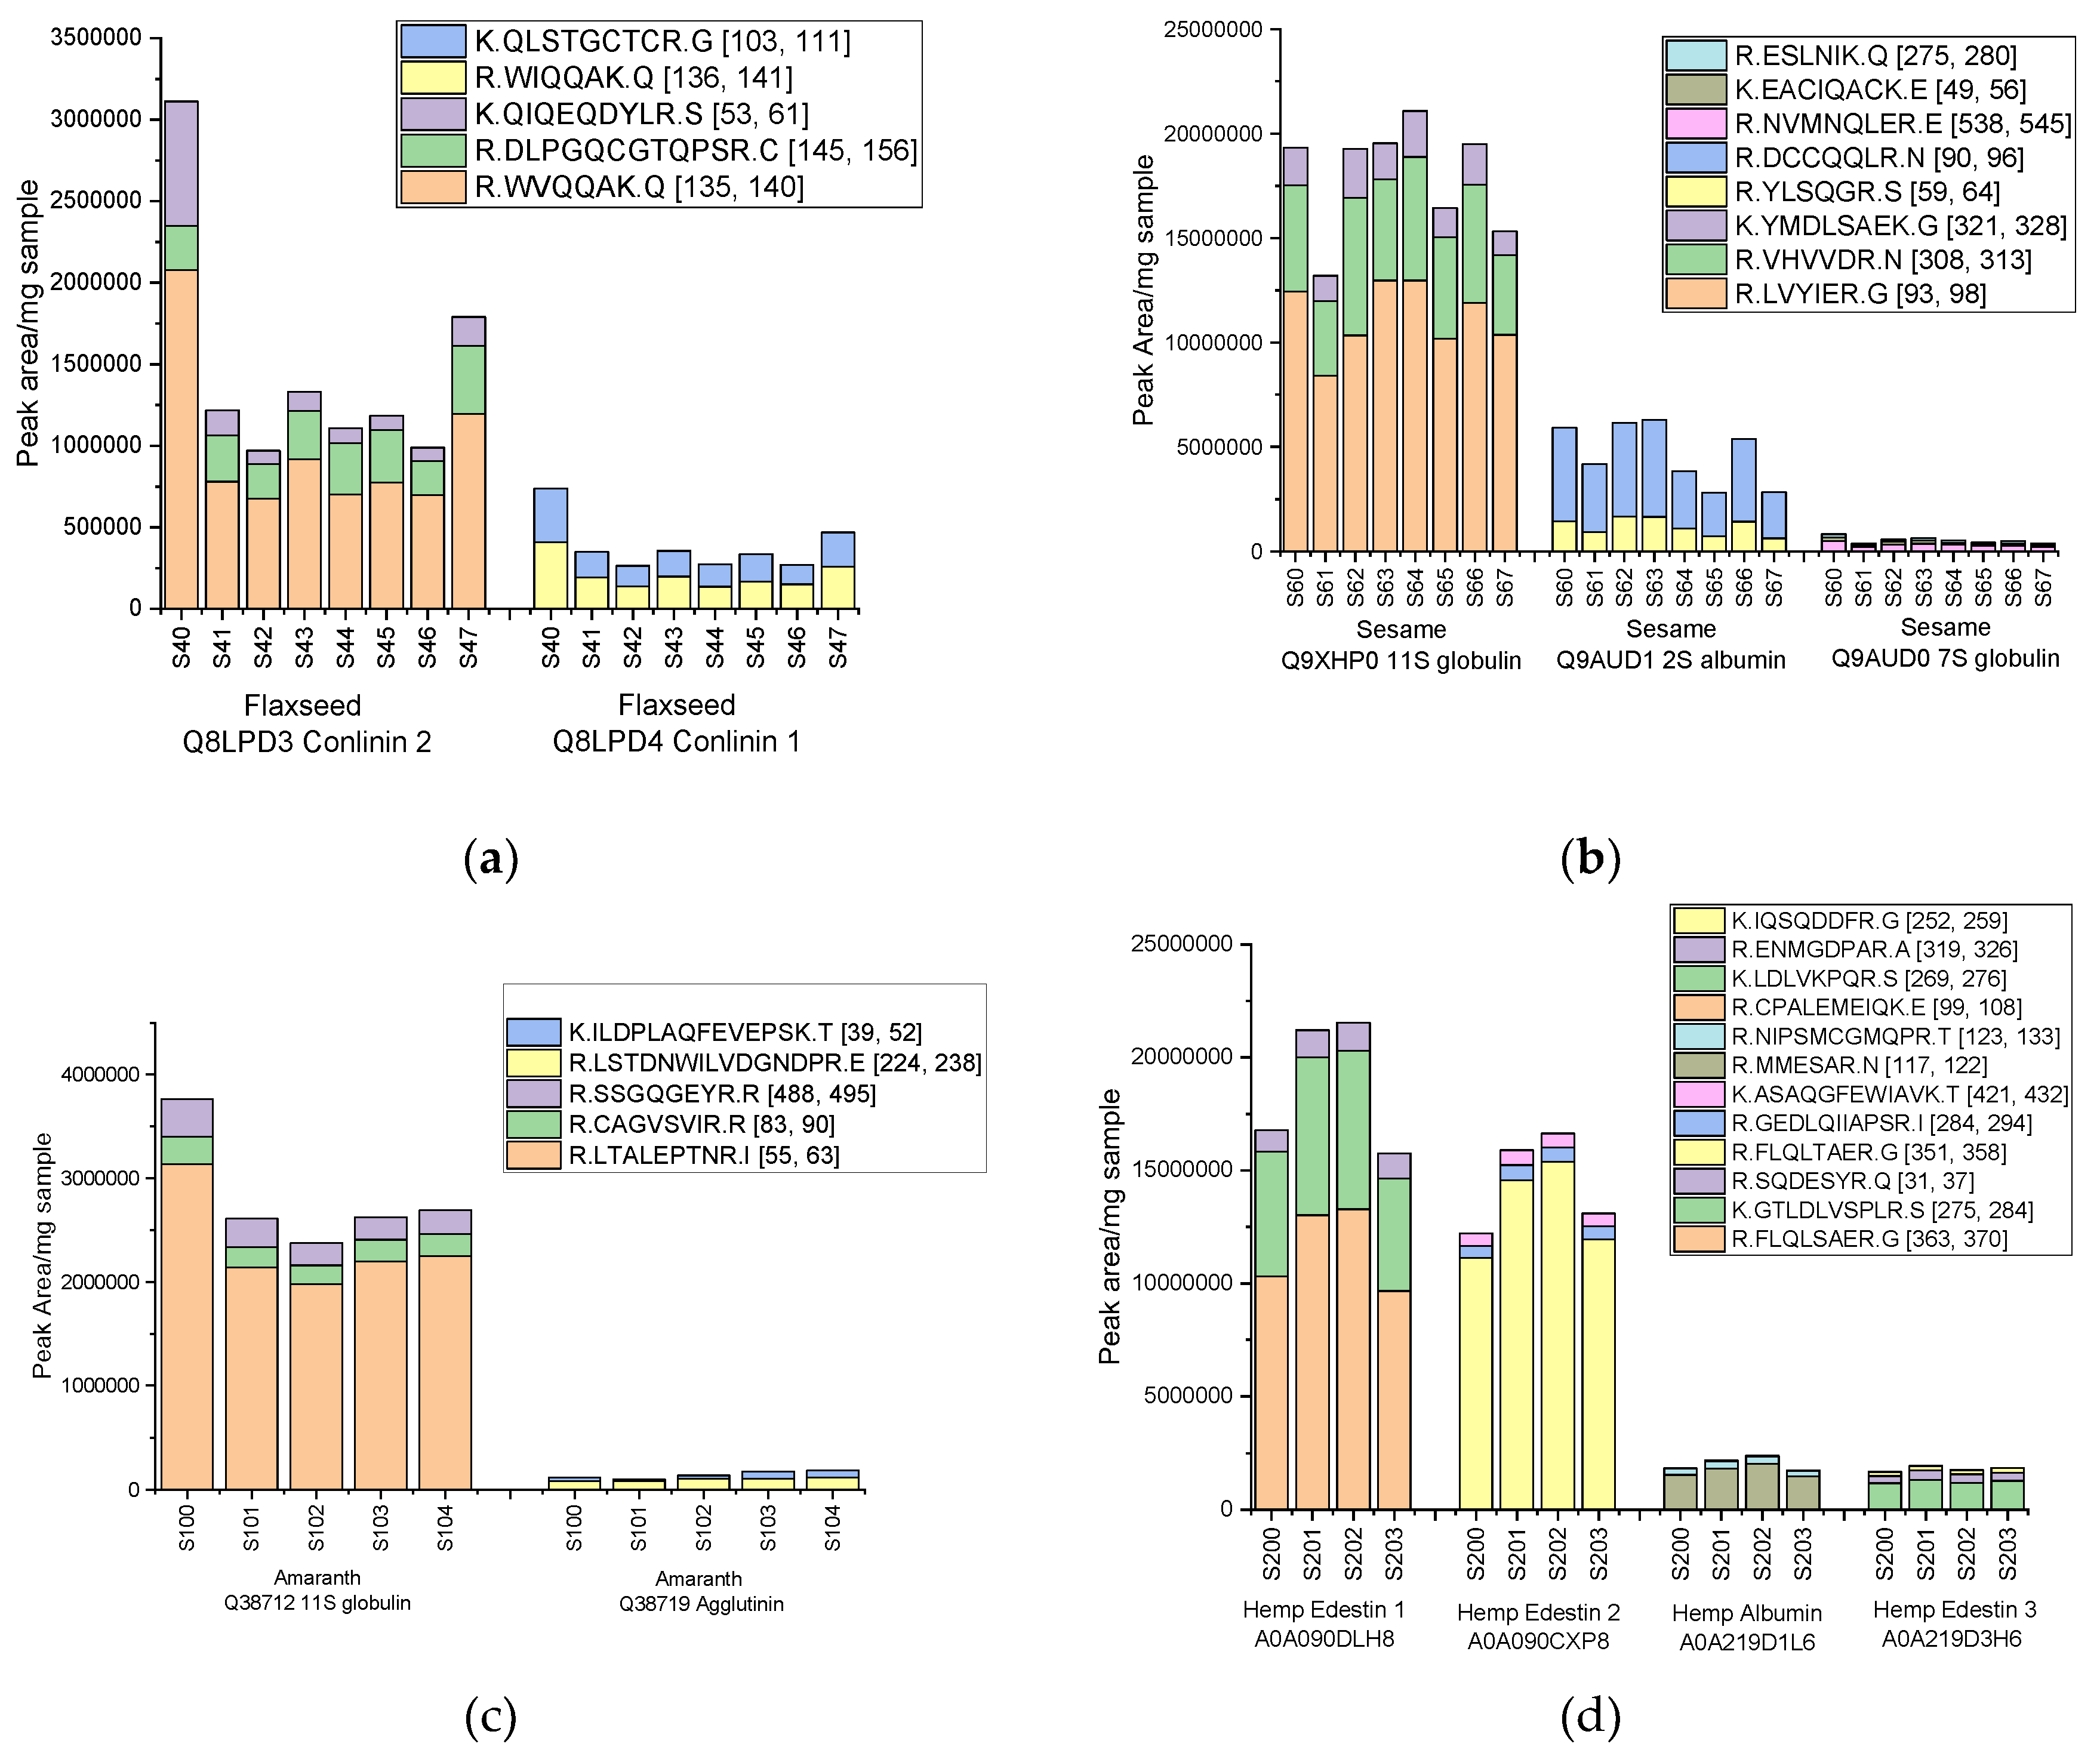
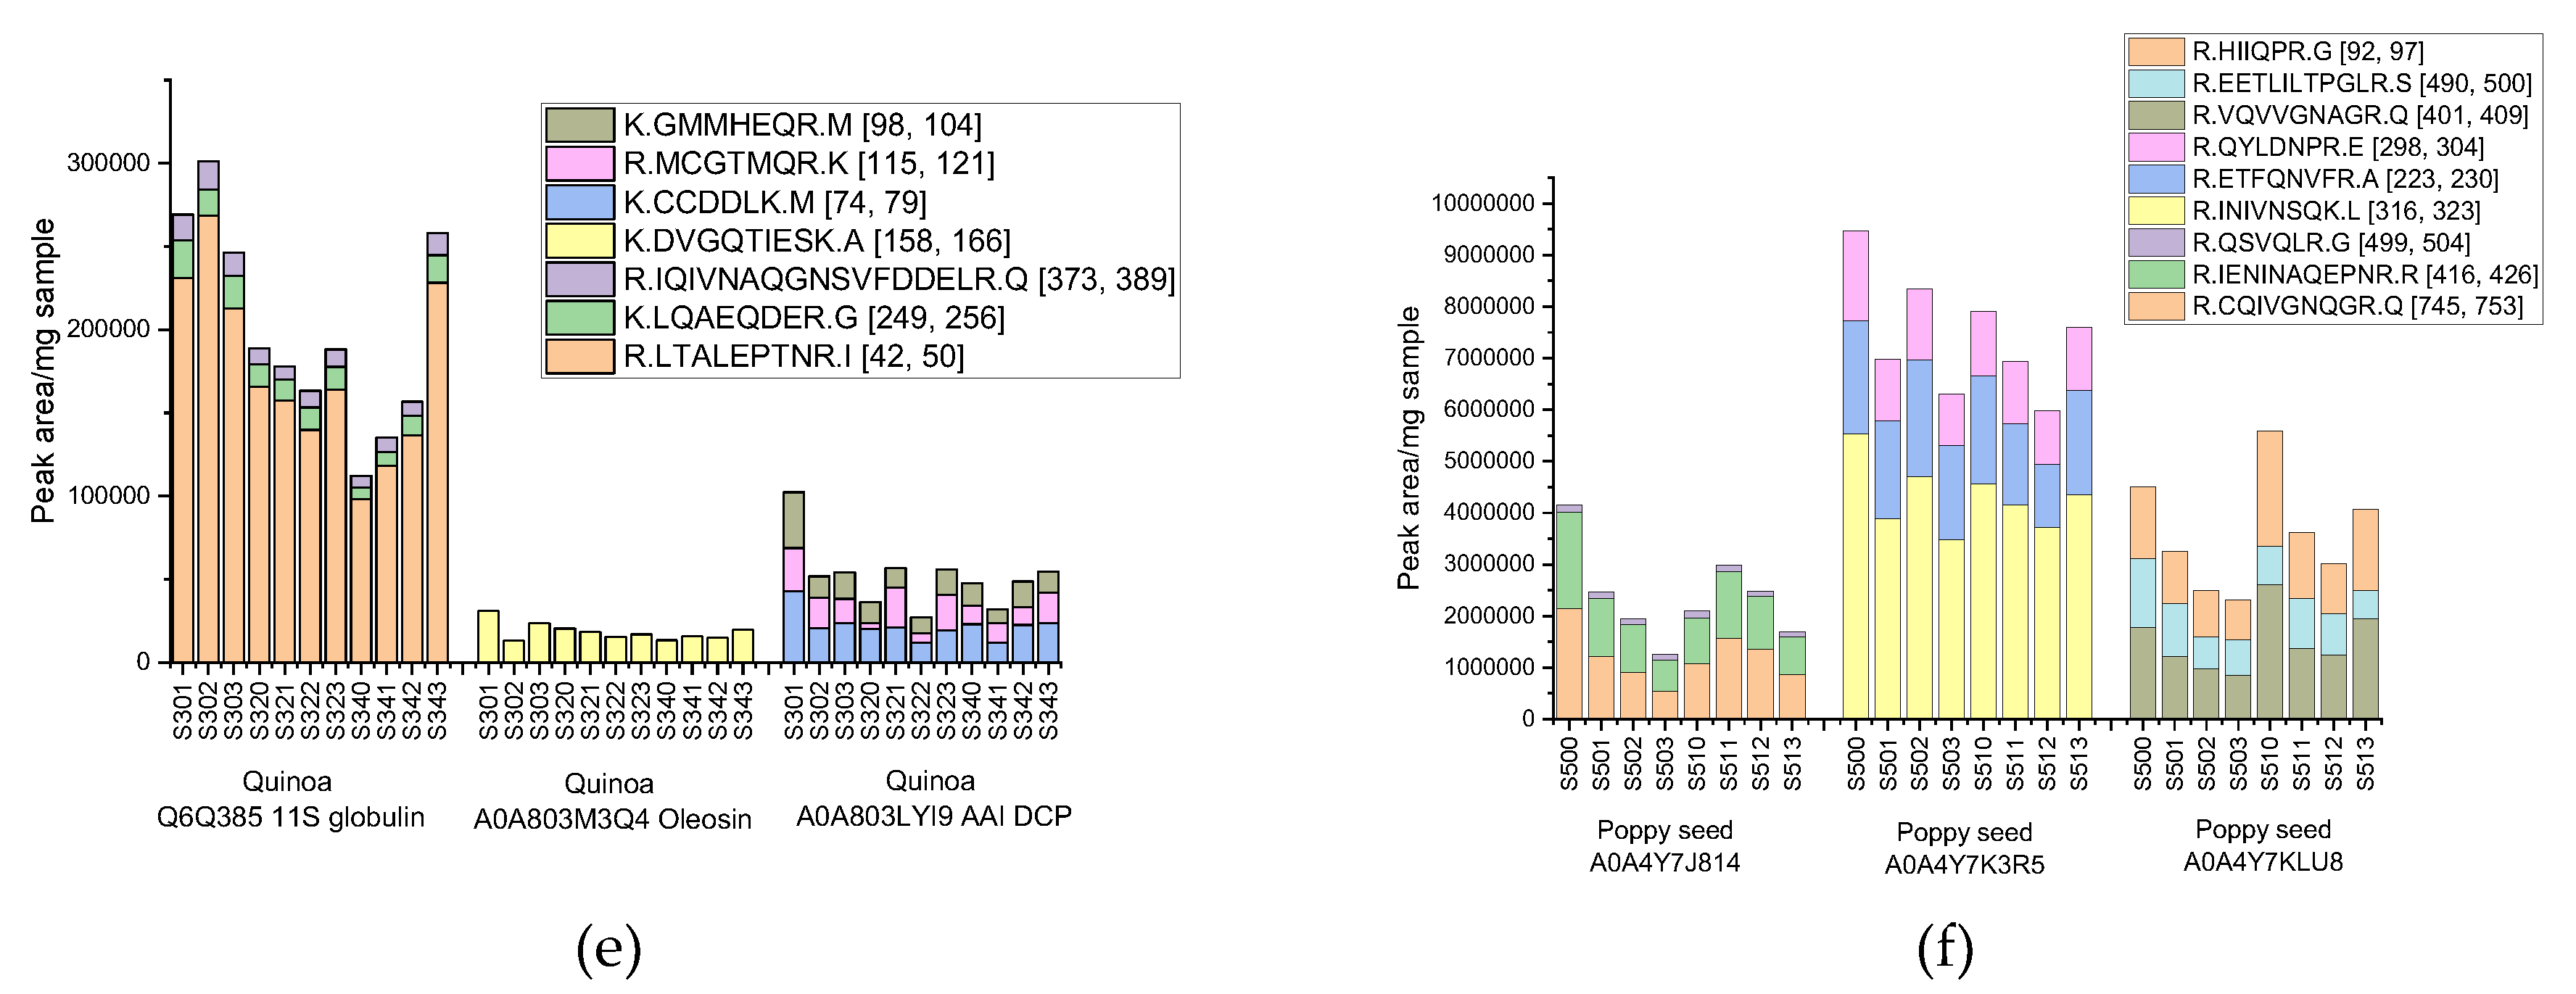

Table 1.
Superseed species-specific peptide markers and their corresponding proteins identified using targeted LC-MS/MS.
Table 1.
Superseed species-specific peptide markers and their corresponding proteins identified using targeted LC-MS/MS.
| Superseed Species |
Protein Accession |
Protein Name | Gene | Amino Acids | Mass (Da) |
Marker Peptide | Intensity Range (Peak Area/mg) |
|---|---|---|---|---|---|---|---|
| Flaxseed | Q8LPD3 | Conlinin 2 (2S albumin) |
Cnl2 | 168 | 19,012 | WVQQAK | 675,000 – 2,100,000 |
| DLPGQCGTQPSR | 209,000 – 761,000 | ||||||
| QIQEQDYLR | 82,000 – 271,000 | ||||||
| Q8LPD4 | Conlinin 1 (2S albumin) |
Cnl1 | 169 | 19,063 | WIQQAK | 137,000 – 410,000 | |
| QLSTGCTCR | 120,000 – 330,000 | ||||||
| Sesame | Q9XHP0 | 11S globulin seed storage |
n.d. | 459 | 51,830 | LVYIER | 10,170,000 – 12,958,000 |
| VHVVDR | 3,819,000 – 6,576,000 | ||||||
| YMDLSAEK | 1,142,000 – 2,202,000 | ||||||
| Q9AUD1 | 2S albumin | LOC10 5174067 |
153 | 17,504 | YLSQGR | 620,000 – 1,655,000 | |
| DCCQQLR | 2,105,000 – 4,642,000 | ||||||
| Q9AUD0 | 7S globulin | n.d. | 585 | 67,069 | NVMNQLER | 216,000 – 486,000 | |
| EACIQACK | 46,000 – 179,000 | ||||||
| ESLNIK | 63,000 – 148,000 | ||||||
| Amaranth | Q38712 | 11S globulin |
n.d. | 501 | 56,672 | LTALEPTNR | 2,139,000 – 3,134,000 |
| CAGVSVIR | 179,000 – 268,000 | ||||||
| SSGQGEYR | 216,000 – 362,000 | ||||||
| Q38719 | Agglutinin | AHA | 304 | 34,958 | LSTDNWILVDGNDPR | 80,000 – 107,000 | |
| ILDPLAQFEVEPSK | 18,000 – 69,000 | ||||||
| TYDGLVHIK | 23,000 – 58,000 | ||||||
| Hemp | A0A090DLH8 | Edestin 1 (11S globulin) |
ede1A | 511 | 58,504 | FLQLSAER | 9,657,000 – 13,279,000 |
| GTLDLVSPLR | 4,987,000 – 7,015,000 | ||||||
| SQDESYR | 952,000 – 1,242,000 | ||||||
| A0A090CXP8 | Edestin 2 (11S globulin) |
ede2C | 491 | 55,986 | FLQLTAER | 11,128,000 – 15,372,000 | |
| GEDLQIIAPSR | 535,000 – 676,000 | ||||||
| ASAQGFEWIAVK | 548,000 – 662,000 | ||||||
| A0A219D1L6 | Albumin (2S albumin) |
Cs2S-1 | 142 | 16,742 | MMESAR | 1,487,000 – 2,039,000 | |
| NIPSMCGMQPR | 241,000 – 331,000 | ||||||
| CPALEMEIQK | 17,000 – 31,000 | ||||||
| A0A219D3H6 | Edestin 3 (11S globulin) |
CsEde3B | 491 | 55,938 | LDLVKPQR | 1,325,000 – 1,190,000 | |
| ENMGDPAR | 331,000 – 416,000 | ||||||
| IQSQDDFR | 178,000 – 210,000 | ||||||
| Quinoa | Q6Q385 | 11S seed storage globulin | 11S | 480 | 53,641 | LTALEPTNR | 98,000 – 269,000 |
| LQAEQDER | 6,000 – 23,000 | ||||||
| IQIVNAQGNSVFDDELR | 7,000 – 17,000 | ||||||
| A0A803M3Q4 | Oleosin | n.d. | 185 | 19,083 | DVGQTIESK | 13,000 – 31,000 | |
| A0A803LYI9 | AAI domain-containing protein | n.d. | 129 | 15,358 | CCDDLK | 12,000 – 43,000 | |
| MCGTMQR | 3,000 – 26,000 | ||||||
| GMMHEQR | 8,000 – 34,000 | ||||||
| Poppy seed | A0A4Y7J814 | Protein-serine/threonine phosphatase | C5167_ 014922 | 853 | 95,547 | CQIVGNQGR | 540.000 – 2.148.000 |
| IENINAQEPNR | 602.000 – 1.870.000 | ||||||
| QSVQLR | 96.000 – 141.000 | ||||||
| A0A4Y7K3R5 | Cupin type-1 domain-containing protein | C5167_ 011661 | 468 | 53,356 | INIVNSQK | 3.473.000 – 5.527.000 | |
| ETFQNVFR | 1.232.000 – 2.253.000 | ||||||
| QYLDNPR | 996.000 – 1.748.000 | ||||||
| A0A4Y7KLU8 | Cupin type-1 domain-containing protein | C5167_ 048617 | 514 | 57,714 | VQVVGNAGR | 846.000 – 2.601.000 | |
| EETLILTPGLR | 546.000 – 1.332.000 | ||||||
| HIIQPR | 777.000 – 2.231.000 |
For each seed species, the selected biomarker peptides are listed along with their parent protein accession numbers, protein names, and their assigned role as either primary marker or qualifier peptide. The range of observed signal intensities (expressed as peak area per mg defatted flour) is provided to indicate peptide detectability and relative abundance across biological replicates.
Disclaimer/Publisher’s Note: The statements, opinions and data contained in all publications are solely those of the individual author(s) and contributor(s) and not of MDPI and/or the editor(s). MDPI and/or the editor(s) disclaim responsibility for any injury to people or property resulting from any ideas, methods, instructions or products referred to in the content. |
© 2025 by the authors. Licensee MDPI, Basel, Switzerland. This article is an open access article distributed under the terms and conditions of the Creative Commons Attribution (CC BY) license (http://creativecommons.org/licenses/by/4.0/).
Copyright: This open access article is published under a Creative Commons CC BY 4.0 license, which permit the free download, distribution, and reuse, provided that the author and preprint are cited in any reuse.


