
Submitted:
19 June 2025
Posted:
24 June 2025
You are already at the latest version
Abstract
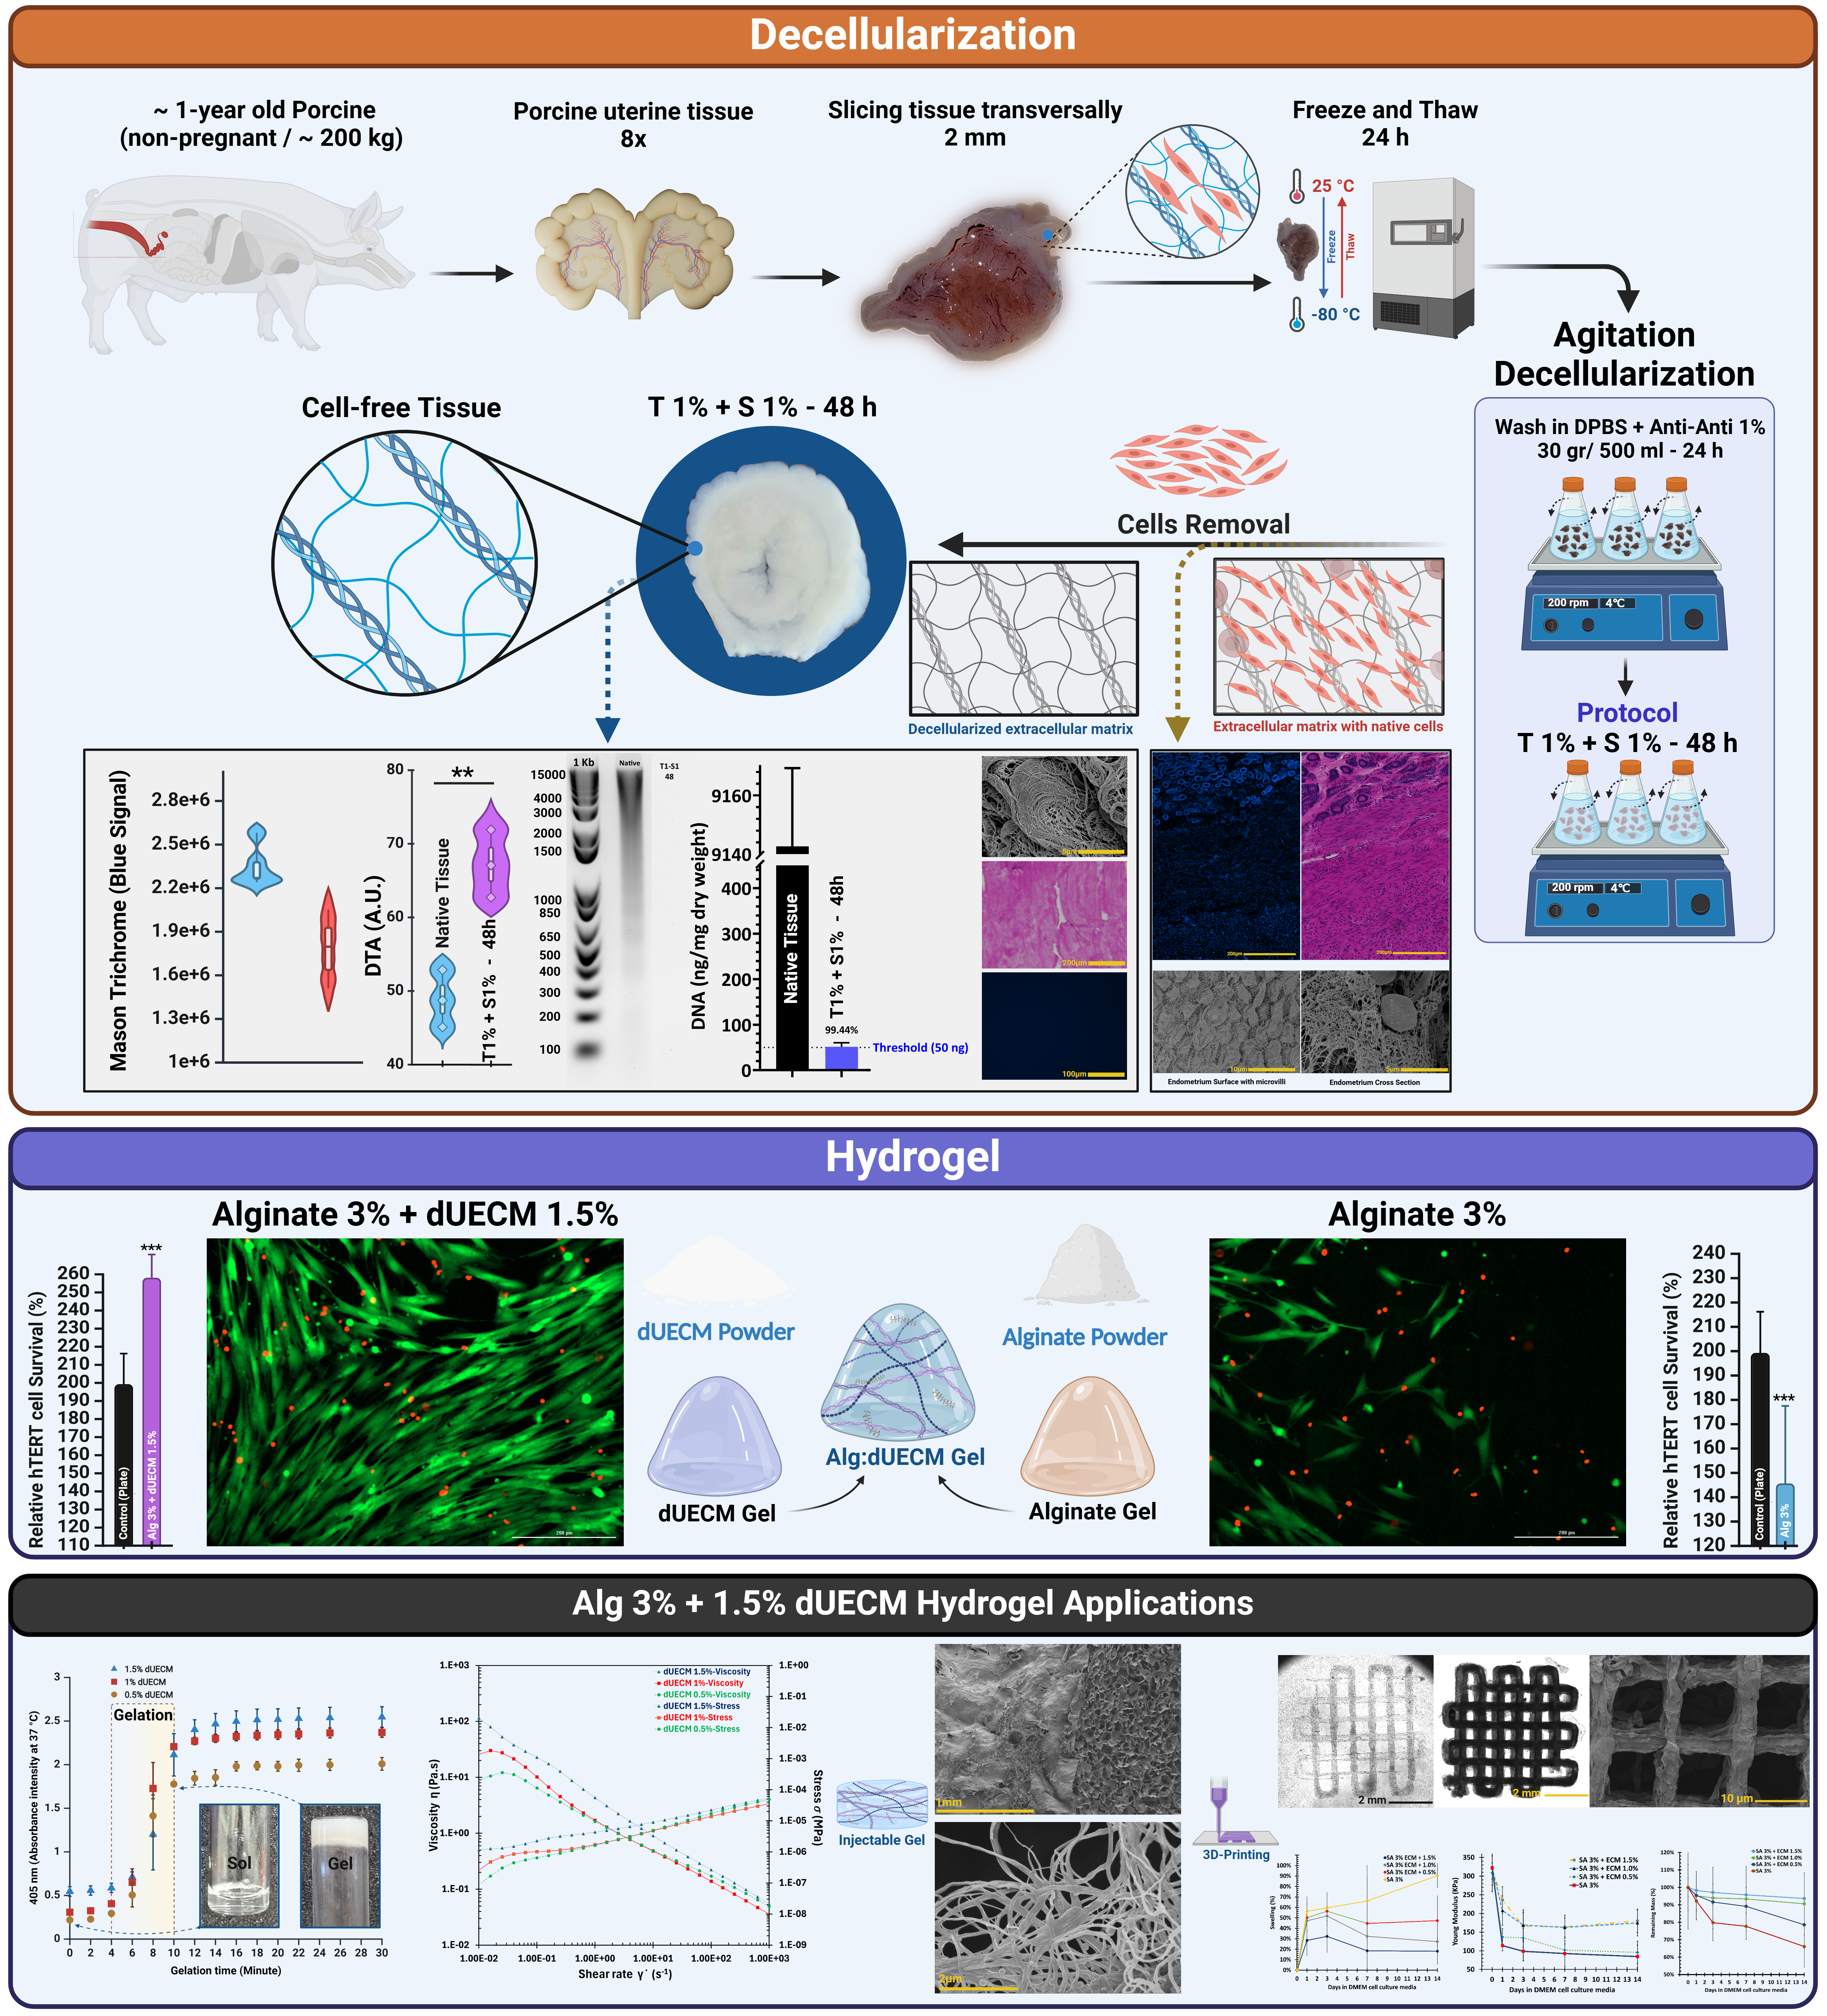
Background and aim: Decellularized uterine extracellular matrix (dUECM) holds promise for uterine tissue engineering due to its preserved bioactive components and structural integrity. However, bioprinting uterine constructs from dUECM remains unachievable due to the dUECM properties limited for bioprinting. To address issues, this study aimed to (1) develop a one-step protocol to effectively decellularize uterine and (2) synthese dUECM with alginate to form a novel bioactive hydrogel for bioprinting uterine constructs. The in vitro characterization of Alg:dUECM hydrogels with seeded human uterine myometrial-human telomerase reverse transcriptase cells (hTERT-HM) cells has been pursued in terms of mechanical stability, printability and bioactivity for uterine tissue engineering. Materials and Methods: Uterine tissues were decellularized using a one-step protocol with 1% Triton™ X-100 and varying sodium dodecyl sulfate (SDS) concentrations (0.1% - 1.5%) for 48 and 72 hours. Decellularized tissues were analyzed in different forms: fresh samples for tensile testing and histology (DAPI, H&E, Masson's trichrome), freeze-dried samples for SEM imaging, and powdered samples for DNA quantification, glycosaminoglycan (GAG) content, FT-IR, Raman spectroscopy, and TGA. Selected dUECM samples were digested with pepsin and acetic acid, and their rheology and gelation behaviour were assessed. Hydrogels were prepared by combining 2% and 3% alginate with 0.5%, 1%, and 1.5% dUECM. The resulting hydrogels were evaluated for swelling, degradation, mechanical properties, and printability. Biocompatibility was assessed using MTT and Live/Dead assays with hTERT-HM cells seeded on the selected hydrogel. Main Results: The decellularization protocol (1% Triton™ X-100 + 1% SDS for 48 hours) effectively reduced DNA content to 51.33 ± 9.02 ng/mg, nearing the immunogenic threshold of 50 ng/mg, with no visible nuclei, confirming efficient removal of cellular material. Additionally, GAG retention remained high at 54.94 ± 7.55 µg/mg dry weight after 48 hours, comparable to native tissue. FT-IR and Raman spectroscopy analyses confirmed the preservation of collagen's triple-helical structure (Amide III/1450: 1.04 ± 0.03, 1660/1620: 1.32 ± 0.11) with a reduction in thermal stability (TGA peak shift to ≈312°C, peak area 67.18 ± 4.59, p<0.001). In 3D printing studies, 3% Alg + 1.5% dUECM demonstrated the best structural properties, with a balanced printability factor (1.56 ± 0.20), enhanced swelling stability (47 ± 12% at day 14), and superior degradation resistance (94 ± 18% mass retention at day 14). Mechanical analysis confirmed strong structural integrity, with Young’s modulus decreasing from 322.7 ± 50.9 kPa at day 0 to 174.8 ± 29.8 kPa at day 14, outperforming other compositions. Cell viability assays demonstrated that 3% Alg + 1.5% dUECM exhibited a significant hTERT-HM proliferation (258.14 ± 12.83% by day 7, p = 0.0003) compared to 3% Alginate, with enhanced cell attachment. Conclusions: This study demonstrates that the protocol with 1% Triton™ X-100 + 1% SDS can remove cells while preserving ECM components effectively. A hydrogel synthesized from 3% Alg + 1.5% dUECM has appropriate printability, mechanical stability, and able to support cell attachment and proliferation. Collectively, these findings pave the road to engineering uterine tissue for medical applications.
Keywords:
decellularization
; hybrid hydrogel
; 3D bioprinting
; biomaterials
; tissue engineering
1. Introduction
Uterine tissue engineering potentially revolutionizes the treatment of infertility, congenital anomalies, uterine dysfunction, and pregnancy complications. Nowadays, the Cesarean section (CS) has been commonly performed to deliver babies through incisions made in the mothers’ abdomens and uteruses, with a global prevalence of approximately 21.1% of births [1]. While CS is life-saving, it can lead to complications like uterine scarring, impaired healing, and uterine niches [2,3], as well as infertility. To treat these CS-related complications and other uterine dysfunctions, uterine tissue engineering with the help of scaffolds or constructs fabricated from biomaterials has been emerged recently with great promise [4].
The development of functional constructs for uterine tissue engineering has been drawing considerable attention, but some issues remain. One key issue is the availability of biomaterials with appropriate biocompatibility, mechanical integrity, and reproducibility. For this, various biomaterials has been explored and among them, decellularized uterine extracellular matrix (dUECM), or the biomaterials created by removing all the cells from the native tissue of uterine emerges as a promising option due to their essential structural and biochemical cues for uterine tissue engineering [5,6]. It is known that the native extracellular matrix (or ECM) is typically composed of hundreds of proteins, glycosaminoglycans (GAGs), proteoglycans, growth factors, and cytokines, collectively referred to as the "matrisome" [7]. These components play vital roles in cellular adhesion, proliferation, migration, and differentiation. Decellularization of the uterine aims to remove immunogenic cellular components from the tissue and retain bioactive molecules, offering a unique advantage over synthetic or non-tissue-specific natural biomaterials in uterine tissue engineering [6,8,9]. Furthermore, native tissue-derived dUECM requires no exogenous cross-linking agents, thereby minimizing toxicity and irradiation risks [10]. It is noted that decellularization protocols are pivotal for preparing dUECM, ensuring the removal of immunogenic cellular components while preserving the biochemical and structural integrity of the ECM [11]. A variety of physical, chemical, and enzymatic techniques are have been developed, often in combination, to achieve optimal decellularization [12]. Among chemical methods, detergents such as octyl-phenoxy-polyethoxy-ethanol (TritonTM X-100) and sodium dodecyl sulfate (SDS) have been recognized as effective agents since 1995 [13]. TritonTM X-100, a non-ionic detergent, is highly effective at preserving ECM morphology and bioactive molecules but has limited efficiency in removing antigenic cellular components [14]. In contrast, SDS, an ionic detergent, is highly effective at removing cellular debris and DNA but can denature proteins and compromise ECM integrity if used for prolonged periods [15]. Studies have identified 1% Triton™ X-100 and 1% SDS as the optimal concentrations for decellularization, while SDS concentrations below or above 1% remain less explored [16,17,18,19,20,21,22,23]. Notably,these detergents are often used in separate sequential steps, with each step taking 24–48 hours, and total decellularization processes frequently spanning up to a week. The prolonged exposure to water, detergents, and mechanical agitation during this time significantly compromises ECM integrity, leading to the loss of crucial proteins such as glycosaminoglycans [24]. To address these challenges, this study aimed to develop and evaluate a simplified one-step decellularization protocol combining 1% Triton™ X-100 with varying concentrations of SDS to reduce processing time while preserving essential ECM components.
Despite its bioactivity, dUECM exhibits poor mechanical strength, limiting its ability to be fabricated into porous constructs. Three-dimensional (3D) bioprinting has emerged as a powerful tool to fabricate spatially controlled, porous constructs for tissue engineering [6]. In this context, alginate (Alg) has been widely used for its excellent printability, along with the appropriate biocompatibility, biodegradability, and ease of cross-linking with calcium ions [25,26,27]. However, Alg lacks inherent cell-adhesion motifs, which limits its ability to support cell attachment and proliferation [28]. It is rational to incorporate dUECM into Alg hydrogel for synergy of bioactive cues and printability, which, however, have not been reported in the literature. As inspired, the other aim of this study was to develop a novel bioactive hydrogel from dUECM and Alg, with synergistic properties appropriate for bioprinting constructs for use in uterine tissue engineering. In uterine tissue engineering, uterine smooth muscle cells play a pivotal role in tissue remodelling, contractility, and structural integrity of the uterus. It has been demonstrated that incorporating smooth muscle cells into engineered constructs enhances the ability to replicate the physiological behaviour of the uterus more effectively [29].
This study presents the development of a bioactive hybrid hydrogel composed of dUECM and Alg for use in 3D bioprinting. We describe the one-step decellularization process, biochemical and structural characterization of the dUECM, and the formulation of printable Alg:dUECM bioinks. The bioprinting procedure, as well as the hydrogel’s mechanical properties, swelling behavior, degradation profile, and printability, are systematically evaluated. Additionally, in vitro biocompatibility was assessed by seeding hTERT-HM cells onto casted Alg:dUECM hydrogels, with viability and proliferation analyzed over time [30]. The following sections provide detailed descriptions of the experimental design and evaluation methods.
2. Materials and Methods
2.1. Decellularization of Porcine Uterine Tissue
Whole reproductive tissue were procured from ~1-year-old pigs weighing ~200 kg (n = 8) from a local slaughterhouse. The tissues were immediately submerged in 1x sterile phosphate buffered saline (PBS; Sigma-Aldrich, Cat.# P4417, United States) and transported within 30 min to the lab for immediate processing. The uterine tissues were isolated and preserved in a −80°C freezer for subsequent use. For initiating the decellularization, the frozen tissues were transversally sliced into ∼2 mm discs and thawed overnight in the fridge, which were then washed with sterilized Dulbecco’s phosphate-buffered saline (DPBS pH 7.4; Gibco, Cat.# 21600, United States) with 1% antibiotic/antimycotic solution (Anti-Anti; Gibco, Cat.# 15240062, United States). Each set of sliced tissues (30 gr/500 mL DPBS) was transferred into 1,000 mL Erlenmeyer flasks, placed on an orbital shaker and secured with Parafilm® to avoid contamination. The tissues were continuously agitated at 200 rpm for 24 hours at 4°C to remove any remaining blood residues. The DPBS solution was replaced three times at 8-h intervals. The decellularization process was carried out by treating the uterine tissues with a combined solution of SDS and Triton™ X-100. The SDS concentrations used were 0.1%, 0.5%, 1%, and 1.5% (Sigma-Aldrich, Cat.# L3771, Japan), while the Triton™ X-100 concentration was maintained at 1% (Fisher Bioreagents, Cat.# BP151, Canada) for all treatments. Both chemicals were mixed in a single solution and added simultaneously to the tissues in the Erlenmeyer flask.
The tissues were exposed to this mixture for two different durations: 48 hours and 72 hours. This approach ensured that the decellularization process utilized the combined effects of SDS and Triton™ X-100 throughout the treatment period, allowing for consistent and effective tissue processing. The reagent was refreshed every 8 hours. Finally, the tissues were washed with ultrapure deionized H2O (MilliQ) for 72 hours at 4°C to remove the reagents residues. A thorough detergent removal was ensured by vigorously shaking 100 mL of the old Milli-Q water for 10–15 seconds prior to its disposal and replacement. The absence of bubbles indicated that the detergents had been effectively washed out. In total, eight decellularization protocols were compared. Figure 1 provides detailed protocols and characterization techniques.
2.2. Microstructural Analysis
2.2.1. DNA Quantification and Fragment-Size Determination
To quantify the remaining DNA content in decellularized tissues, 10 mg dry tissue was used in triplicates for each protocol. DNA content was extracted using a commercial kit (DNeasy® Blood and Tissue Kit; Qiagen, Cat# 69504) according to the manufacturer’s instructions, and DNA yield (ng/mg) was quantified spectrophotometrically (γ = 260 nm) with a Nanodrop® Spectrophotometer (Thermo Scientific 2000c). To visualize the DNA fragments, samples were loaded with DNA Gel Loading Dye (Thermo Scientific, R0611) and assessed on a 2% agarose gel containing SYBR Safe (Invitrogen, Cat.# S33102) for a total runtime of 90 min (60 min at 75 V and 30 min at 90 V). A 1 kb plus DNA ladder (Invitrogen™, Cat.# 10787018) was used as a reference. Images were acquired using a Bio-Rad ChemiDoc™ MP digital imaging system.
2.2.2. Glycosaminoglycans Assay
Glycosaminoglycans (GAGs) content of the decellularized tissues was determined by digesting 100 mg freeze-dried samples in 20 μL/mL Proteinase K (Qiagen, Cat.# 19131, pH 8) and incubating them overnight at 56°C. Enzyme inactivation was performed at 90°C for 10 min. GAG concentrations were calculated at pH 1.5 using the 1,9-dimethyl-methylene blue (DMMB; Sigma, Cat.# 341088) assay. Briefly, 20 μL of extracted GAG was added to 200 μL of DMMB dye, and the optical density (OD) was measured immediately with a Plate Reader Spectrophotometer (Molecular Devices SpectraMax 190) at 650 nm (n = 6). A standard curve was constructed using heparin (Sigma-Aldrich, Cat.# H3393-250KU).
2.2.3. H&E, DAPI and Mason Trichrome Staining
Native and decellularized tissues (Protocols 1-8) were fixed in 10% neutral buffered formalin (NBF; Sigma-Aldrich, Cat# HT501128) for 24 h at ambient temperature, embedded in paraffin, and sectioned at 10 μm thickness. To validate cell removal, the sections were stained with hematoxylin and eosin (H&E) and 4′,6-diamidino-2-phenylindole (DAPI; Sigma, Cat.# MBD0015). Slides stained with DAPI were treated with ProLong™ Diamond Anti-Fade Reagent (Invitrogen, Cat. # P36931), covered with micro cover glass (VWR, Cat.# 48404-454) and imaged with an automated microscope (BioTek Lionheart LX).
Masson’s trichrome staining was performed using a ready-to-use kit to visualize the collagen content in native and decellularized tissues (Cat.# HT15, Sigma-Aldrich). Tissue sections were placed on glass slides, deparaffinized in xylene, and rehydrated through a series of ethanol/water mixtures. The slides were treated with Bouin’s solution (Cat.# HT10132, Sigma-Aldrich) at 56°C for 15 minutes to enhance staining, then washed with tap water for 5 minutes. Nuclei were stained with Weigert’s hematoxylin for 5 minutes, followed by another 5-minute wash with tap water and a rinse in distilled water. Cytoplasm and muscle fibers were stained red with Biebrich scarlet-acid fuchsin for 5 minutes. Collagen was stained blue with aniline blue for 5 minutes, and the staining was set with 1% acetic acid for 2 minutes. The slides were rinsed with distilled water, dehydrated, cleared in xylene, and mounted with a resin-based medium. Under a light microscope, collagen appeared blue, cytoplasm red, and nuclei black.
2.2.4. Scanning Electron Microscopy (SEM)
The microstructure of the decellularized tissues was investigated using field-emission scanning electron microscopy (FE-SEM; Hitachi SU8010). Samples were fixed using 2.5% glutaraldehyde (GA; Polysciences Inc., Cat.# 00376) at 4 °C overnight, then gradually dehydrated by an increasing concentrations of ethanol (10%, 30%, 60%, 90%, and 100%) [31,32]. After dehydration, the samples were immersed into 1:2 and 2:1 hexamethyldisilizane (HMDS; Thermo Scientific, Cat.# A15139. AP): absolute ethanol, respectively, for 20 min and then 100% HMDS solution overnight. Samples were air-dried in a fume hood. For 3D-Bioprinted constructs, the samples were frozen at -80ºC overnight and freeze-dried (LACONCO) at −50°C under 0.05 mBar pressure for 48 h. Eventually, specimens were mounted on aluminum stubs with double-sided carbon tape and coated with 10 nm of gold (Quorum Q150TES Sputter Coater) as the conductive layer. For imaging, the voltage was fixed at an accelerating voltage of 3 KV to capture the secondary electron mode images.
2.2.5. FT-IR Spectroscopy
IR spectra of the freeze-dried native and decellularized specimens were acquired using Attenuated Total Reflectance-Fourier Transform Infrared spectroscopy (ATR-FTIR; Spectrum 3 Tri-Range MIR/NIR/FIR Spectrometer, PerkinElmer). The decellularized specimens were placed directly on the ATR crystal (n = 3). FT-IR spectra were acquired in 4,000–600 cm−1 range at a resolution of 4 cm−1.
2.2.6. Raman Spectroscopy
Raman spectroscopy measurements were performed to analyze native and decellularized tissue samples using a Renishaw InVia Reflex Raman microscope (Renishaw Inc., West Dundee). The instrument was equipped with an Ar+ laser (StellarPro-50, Modu-Laser, Centerville) operating at a wavelength of 514.5 nm with the laser set to 100% power and using a 1800 lines/mm grating. The microscope was focused onto the samples using Leica ×50 NPLAN objective lens (NA = 0.75), depending on the region of interest. The backscattered Raman signals were collected using a Peltier-cooled CCD detector. Measurements were performed in extended mode across the spectral range of 100–3200 cm−1 to capture a comprehensive molecular fingerprint. A detector exposure time of 10 seconds per scan was used, with laser power set between 1.8–3.6 mW as measured at the sample to minimize thermal damage. The instrument was calibrated prior to each session using an internal Si(110) standard, ensuring a reference peak at 520 cm−1. Each sample was analyzed in triplicate, with spectra collected at three distinct regions to ensure reproducibility and account for heterogeneity. Data preprocessing was conducted using a moving average method (window size: 20) for noise reduction and smoothing, subsequently followed by baseline correction to mitigate background interference. Spectra were normalized to allow direct comparison between native and decellularized tissues.
Peak fitting was performed using MagicPlot 3.0.1 software to accurately deconvolute overlapping peaks and characterize key molecular features. All data processing steps were standardized to maintain consistency across all samples.
2.2.7. Thermogravimetric Analysis (TGA)
To assess the protein content in each decellularization protocol, thermogravimetric analysis (TGA) was performed using a Perkin-Elmer TGA 8000 analyzer. Approximately 5 mg of the freeze-dried native and decellularized samples underwent heating from 50°C to 600°C at a rate of 10°C/min under a constant nitrogen gas flow of 30 cm3/min. By differentiating the TGA values, the differential form of TGA (DTA) was derived, facilitating the identification of the maximum disintegration temperature at each stage of thermal degradation.
2.3. Hydrogel Ink Preparation
To prepare the hydrogel ink, dUECM was utilized as the primary component. The decellularization process followed a validated protocol designed to maximize the preservation of essential bioactive molecules and effective removal of cellular material. Once the tissue was decellularized, it was freeze-dried to remove residual moisture, thereby enhancing its stability and shelf-life.
The dried dUECM was subsequently ground into a fine powder to facilitate enzymatic digestion. To achieve this fine particulate form, the freeze-dried tissue was pulverized using dry ice and a grinder to ensure uniformity and minimize aggregation. This step is critical for enhancing the reactivity of the powder in subsequent digestion.
The required quantity of dUECM powder was weighed and then subjected to enzymatic digestion. To ensure optimal digestion, the Voytik-Harbin method was used [33]. An aliquot of 100 mg of dUECM powder was suspended in a 0.5 M acetic acid solution (Cat.# 351271, Fisherbrand) containing 10 mg Pepsin (Cat.# P7125, Sigma-Aldrich) to catalyze the digestion process. The suspension was maintained at a temperature of 4°C under constant stirring (50 rpm) for 24 hours to ensure complete digestion. The cold environment helped preserve the structural integrity of the ECM components during the enzymatic reaction.
Following digestion, the resulting dUECM solution was neutralized with 10M sodium hydroxide (NaOH, Cat. # BP359, Fisher Scientific) [34]. This neutralization step was performed in a refrigerated environment at 4°C within a walk-in cooling chamber to prevent premature self-crosslinking of collagen molecules, which could compromise the hydrogel's handling and mixing with sodium alginate. The slow and controlled neutralization allowed for the formation of a homogeneous and stable hydrogel suitable for further steps, including cell viability testing and 3D printing.
To ensure the removal of residual components from the neutralization reaction (such as sodium ions and unreacted NaOH) as well as pepsin, the neutralized dUECM solution was subjected to dialysis. A 12–14 kDa molecular weight cut-off (MWCO) membrane was used to retain larger ECM components such as collagen and glycosaminoglycans while allowing smaller molecules like sodium ions, hydroxide ions, and pepsin to diffuse out.
The solution was dialyzed against a neutral PBS buffer. The dialysis process was carried out at 4°C to prevent degradation of ECM components, with buffer changes performed multiple times over a period of 48 hours. This protocol ensured thorough removal of small molecules and enzymes while preserving the integrity and bioactivity of the ECM components.
The rheological properties and gelation kinetics of the neutralized dUECM hydrogels were evaluated using a Discovery HR 20 rheometer (TA Instruments) and a combination of rheometry and turbidimetry tests. For the steady-shear rheology test, viscosity and stress were analyzed as functions of shear rate (10-2 to 103 s-1) at 4°C. These measurements provided insights into the flow behavior and mechanical stability of the hydrogels under varying flow conditions.
Rheological measurements were conducted using a 60 mm parallel plate geometry. For oscillatory shear test, gelation kinetics were assessed by monitoring the storage modulus (G’) and loss modulus (G”) across a range of temperatures (10, 15, 20, 25, and 30ºC). The gap size was set to 600 µm with an applied amplitude of 1% strain and a frequency of 1 Hz. This configuration ensured precise thermal control and allowed for accurate simulation of the temperature-dependent gelation behavior of the hydrogels.
Gelation kinetics were further investigated using a turbidimetry test conducted at 405 nm. dUECM dispersions at three concentrations (5 mg/mL, 10 mg/mL, and 15 mg/mL) were prepared in triplicate. A BioTek Synergy HT Multi-Detection Microplate Reader (BioTek Instruments) was preheated to 37°C to mimic physiological conditions. For each test, 200 µL of dUECM dispersion was pipetted into a 96-well plate and kept on ice to prevent premature gelation before being transferred to the preheated microplate reader. Absorbance measurements were recorded every 2 minutes. Changes in absorbance intensity over time were monitored to evaluate gelation progression, including initiation and stabilization times for each concentration. This integrated approach enabled a thorough characterization of the mechanical and kinetic properties of the dUECM hydrogels under physiologically relevant conditions.
2.4. Hydrogel Ink Printability
Hydrogels were prepared using alginic acid sodium salt (Cat.# A2033, Sigma-Aldrich) at two concentrations (2% and 3% w/v) and combined with dUECM at concentrations of 0.5%, 1%, and 1.5% w/v to form the following groups: 2% Alg, 2% Alg + 0.5% dUECM, 2% Alg + 1% dUECM, 2% Alg + 1.5% dUECM, 3% Alg, 3% Alg + 0.5% dUECM, 3% Alg + 1% dUECM, and 3% Alg + 1.5% dUECM (Figure 2A). A box-shaped structure (10 mm × 10 mm) was created using 3D builder software in a 3D manufacturing format (3 MF) and sliced into a 25-layer printable structure with a slice thickness defined as 80% of the theoretical strand diameter.
The 3D printing process was carried out using a pneumatic extrusion-based bioprinter (EnvisionTec 4th Gen 3D-Bioplotter, Gladbeck) with nitrogen gas at different pressures and speeds depending on printability. The nozzle was pre-warmed for 30 minutes prior to printing, and the hydrogel was maintained at 25°C during the printing process. The scaffolds were printed as a 90° lattice structure with a strand infill of 1 mm. After every five layers, a 3-second nozzle purging was performed to prevent clogging. The samples were printed into 12-well plates coated with 0.1% polyethyleneimine (PEI, M.W. 60,000, 50% w/w aq. Thermo Scientific) at 37°C the day prior to printing. PEI, a highly positively charged polycation, reacts with the negatively charged carboxyl groups in alginate, forming a polyelectrolyte complex that stabilizes the molecular structure and enhances strand attachment. On the day of printing, the PEI solution was replaced with 50 mM calcium chloride (CaCl2, Cat.# 223506, Sigma-Aldrich) in 0.1% PEI solution, and the scaffolds were printed directly into this solution.
The printed scaffolds were immediately crosslinked in a 100 mM CaCl2 solution for 10 minutes, washed with Dulbecco's Modified Eagle Medium (DMEM, Cat.# 31600034) cell culture media without FBS, and maintained in complete culture media at 37°C. To evaluate printability, two-layer constructs were printed, and strand diameters were measured using images captured by an automated fluorescence microscope (BioTek Lionheart LX) at 4× magnification. ImageJ software (version 1.54g) was used for the measurements. A total of 50 measurements were performed for each hydrogel group using quadruplicate scaffolds.
Printability was assessed by comparing the measured strand diameters to the theoretical strand diameter (200 μm). Variations in strand diameter were analyzed to determine the impact of hydrogel composition and printing parameters on scaffold fidelity calculated with the following formula:
where de is the diameter of each strand in 3D-printed scaffolds and dt is the diameter of each strand in the designed one. However, the printability of the hydrogels is usually greater than one due to their high degree of swelling.
2.5. Swelling and Degradation
To evaluate the swelling and degradation characteristics of 3D-printed alginate-dUECM scaffolds, the samples were incubated in complete Dulbecco's Modified Eagle Medium (DMEM, Cat.# 31600034) culture media containing 1% antibiotic-antimycotic (100X) containing 10,000 units/mL penicillin, 10,000 μg/mL of streptomycin at 37°C under 5% CO2. The scaffolds were fabricated under sterile conditions to prevent contamination that might influence swelling and mass loss measurements.
Immediately after printing, the scaffolds were gently blotted with sterile Kimwipes™ to remove excess moisture, and their initial wet weight (W0) was recorded. The scaffolds were then immersed in complete cell culture media and incubated at 37°C with 5% CO2. At predetermined intervals (0, 1, 3, 7, and 14 days), the scaffolds were removed from the media, blotted, and their wet weight (Wt) was measured. The swelling percentage was calculated using the formula [35]:
Where Wt represents the wet weight of the scaffold at each time point, and W0 is the initial wet weight. Measurements were conducted in quintuplicate for each time point to ensure statistical accuracy.
Following the swelling assessments, the scaffolds were freeze-dried to determine their dry weight at specific intervals (Wt). Separate scaffolds were lyophilized immediately after printing to establish the initial dry weight (W0). The remaining mass percentage was calculated using the formula [35]:
Where W0 is the initial dry weight of the scaffold, and Wl is the lyophilized weight at each time point. This process was performed for each interval (0, 1, 3, 7, and 14 days) using separate sets of scaffolds to maintain accuracy. All experiments were conducted in sterile conditions, and results were analyzed to determine the swelling and degradation behaviors of the scaffolds over time.
2.6. Cell Viability for Developed Hydrogel Ink (MTT and Live/Dead Assays)
Cell viability of the optimal hydrogel ink was assessed using MTT (3-[4,5-dimethylthiazol-2-yl]-2,5-diphenyltetrazolium bromide, Cat. # M6494, Invitrogen) and Live/Dead assays. The prepared Alg:dUECM hydrogels were cast into 24-well plates, and 5×10⁴ hTERT-HM cells [36] were seeded on the selected hydrogel surfaces (n = 6). The seeded hydrogels were incubated under standard culture conditions at 37°C with 5% CO2 and were maintained in complete culture media including, DMEM/F12 (Dulbecco's Modified Eagle Medium/Nutrient Mixture F-12, HEPES, Cat. # 11330-032, Gibco) supplemented with 10% fetal bovine serum (FBS, Gibco®, Cat. # A5256701) and 1% antibiotic-antimycotic (100X) containing 10,000 units/mL penicillin, 10,000 μg/mL of streptomycin analyzed at predetermined time points (days 1, 3, 5, and 7) (Figure 2B, C, and D).
To evaluate the metabolic activity of hTERT-HM cells seeded on the hydrogels, MTT assays were performed on days 1, 3, 5, and 7. MTT solution (0.5 mg/mL) was added to each well and incubated for 4 hours at 37ºC, allowing metabolically active cells to form formazan crystals. These crystals were dissolved in DMSO (Dimethyl sulfoxide, Cat. # BP231-1, Fisher bioreagents) and absorbance was measured at 550 nm using a microplate reader (BioTek Synergy HT Multi-Detection Microplate Reader) to assess cell proliferation and viability over time. Since most formazan crystals formed within the hydrogel matrix and DMSO alone made the casted gel rigid, hindering efficient dye elution, the hydrogels were crushed using a tissue grinder (Bio-Gen PRO200 Homogenizer) to facilitate dye extraction, which was then isolated via centrifugation. This step facilitated effective dye elution, enabling accurate optical density (OD) measurement.
The live/dead assay was performed to evaluate the viability, attachment, and distribution of hTERT-HM cells on the optimal Alg:dUECM hydrogel composition. Calcein AM (Cat. # AS-89201, AnaSpec, Fremont) and propidium iodide (PI, Cat. # AS-83215, AnaSpec, Fremont) were used to stain live and dead cells, respectively. Imaging was performed using a Lionheart Biotek fluorescence microscope in stacked imaging mode to minimize blurring caused by surface irregularities. The images were deconvoluted using the microscope’s software to enhance clarity and analyze cell viability and morphology.
2.7. Mechanical Properties
2.7.1. Tensile Testing of Decellularized Tissues
Uterine tissue was used as the source material for the tensile test study. The myometrial layer was isolated by peeling off the endometrial tissue. The tissues were then processed using four distinct decellularization protocols, with treatment durations of 48 and 72 hours. Native (non-decellularized) tissue was prepared as a control.
After decellularization, the tissues were cut transversally to obtain membrane-shaped samples. A cutting template, designed according to ISO 527-2:2012 standard, was used to shape the samples into a standard ‘dog bone’ geometry (Figure 3). This ensured uniformity and minimized stress concentration during testing.
The samples were prepared for tensile testing using a 3D mounting method based on Scholze et al.'s setup [37]. This process ensured consistent thickness and dimensions across all samples. To meet ISO standards, all cut samples were inspected and irregularities were trimmed.
The tensile properties of the prepared samples were tested using a MAK-10 ESM303 tensile testing machine (Mark-10 Corporation, USA), equipped with a 50 N load cell. The samples were clamped securely in the machine's grips, ensuring proper alignment to avoid off-axis loading. Testing was conducted at room temperature with samples hydrated in PBS to simulate physiological conditions.
The crosshead speed for tensile testing was set at 0.01 mm/sec, as appropriate for the mechanical characterization of soft biological tissues. Stress-strain curves were generated, and key mechanical properties, including ultimate tensile strength (UTS), Young's modulus, and elongation % at rupture, were calculated. We tested each protocol and treatment duration (24 and 48 hours) in triplicate to ensure statistical robustness.
Data from the tensile tests were analyzed to compare the effects of the decellularization protocols and treatment durations on the mechanical properties of the tissues.
2.7.2. Compressive Test on Scaffolds
To determine the elastic modulus of the 3D-printed scaffolds, a uniaxial compression test was conducted using the ElectroForce® BioDynamic® 5100 Series device equipped with a 20N load cell. Prior to testing, each scaffold dimension (x, y, and z) was carefully measured using a digital calliper.
The scaffolds were positioned on the test platform to ensure proper alignment and avoid uneven loading. Compression was applied at a constant speed of 0.01 mm/s, and the scaffolds were compressed to 50% of their original height. Throughout the compression process, the device recorded stress-strain data in real-time, generating stress-strain curves for each sample.
The elastic modulus was calculated from the slope of the linear region of the stress-strain curve, corresponding to the material's elastic deformation phase. The experiment was repeated for at least three samples from each scaffold group to ensure reproducibility and statistical significance of the results.
2.8. Statistical Analysis
Data were analyzed using IBM SPSS Statistics software version 27.0 (IBM Corp., Armonk, NY, USA). Quantitative variables are reported as mean ± standard deviation (SD). The normality of data distribution was assessed using the Shapiro-Wilk test, and appropriate statistical tests were selected accordingly. A one-way analysis of variance (ANOVA) was conducted to compare group means. For post-hoc pairwise comparisons, Dunnett’s test was employed to compare each experimental group with the designated control group. Statistical significance was defined as follows: **** for p < 0.0001, *** for p < 0.001, ** for p < 0.01, * for p < 0.05, and NS for non-significant differences.
3. Results
3.1. Assessment of DNA Residuals, Fragment Size Determination
The native tissue's DNA content was 9142.67 ± 26.63 ng/mg dry weight, thus serving as the control. Figure 4A shows that treatments combining 1% Triton™ X-100 and SDS at various concentrations and durations significantly decreased DNA content; each treatment's percentage reduction was calculated.
For Triton™ 1% + SDS 0.1%, the DNA content decreased to 419.33 ± 9.45 ng/mg dry weight after 48 hours, corresponding to a 95.41% reduction, and further to 408.67 ± 2.31 ng/mg dry weight after 72 hours, achieving a 95.53% reduction. Increasing the SDS concentration to 0.5% significantly improved DNA removal, with DNA content reduced to 82.67 ± 5.03 ng/mg dry weight after 48 hours (99.10% reduction) and to 81.33 ± 21.57 ng/mg dry weight after 72 hours (99.11% reduction).
Increasing the SDS concentration to 1% reduced DNA content to 51.33 ± 9.02 ng/mg dry weight after 48 hours, a 99.44% reduction, and further to 24 ± 7.21 ng/mg dry weight after 72 hours, resulting in a 99.74% reduction. The highest SDS concentration of 1.5% resulted in DNA content of 29.33 ± 7.57 ng/mg dry weight after 48 hours (99.68% reduction) and further decreased to 13.33 ± 12.86 ng/mg dry weight after 72 hours, achieving the most significant reduction of 99.85%.
All treatments with SDS concentrations of 1% or higher reduced DNA levels below the commonly accepted threshold of 50 ng/mg dry weight, with Triton™ 1% + SDS 1.5% at 72 hours demonstrating the most effective DNA removal. These findings highlight the efficiency of combining Triton™ 1% with SDS for decellularization, where higher SDS concentrations and extended treatment durations result in superior DNA elimination (Figure 4A).
The gel electrophoresis results showed clear bands for the native tissue, indicative of intact high-molecular-weight DNA. In the decellularized samples treated with Triton 1% + SDS 0.1%, faint smears were visually detected at approximately 100–400 bp after both 48 and 72 hours, suggesting partial fragmentation and incomplete DNA removal. No visible smears or bands were observed in the samples treated with higher SDS concentrations (0.5%, 1%, and 1.5%), indicating effective removal of DNA. These findings confirm the limitations of low SDS concentrations in fully degrading and eliminating DNA (Figure 4B).
The GAGs content in the native tissue was measured at 54.68 ± 4.38 µg/mg dry weight. The effects of decellularization with 1% Triton™ and various SDS concentrations and exposure times on GAG retention varied depending on the SDS concentration and exposure time (Figure 4C).
For treatments with Triton 1% + SDS 0.1%, GAGs content was higher at 57.92 ± 4.38 µg/mg dry weight after 48 hours, indicating minimal loss and a potential increase due to experimental variability. However, after 72 hours, GAGs content decreased to 42.17 ± 5.94 µg/mg dry weight, reflecting a significant reduction in GAGs retention.
Increasing the SDS concentration to 0.5% kept GAGs content consistent at 57.02 ± 6.80 µg/mg dry weight after 48 hours, showing negligible loss compared to native tissue. After 72 hours, however, GAGs content decreased significantly to 39.16 ± 4.30 µg/mg dry weight, indicating higher depletion over extended exposure.
For Triton™ 1% + SDS 1%, GAGs retention was initially high at 54.94 ± 7.55 µg/mg dry weight after 48 hours, similar to native levels. Prolonged treatment for 72 hours resulted in a significant drop to 33.19 ± 3.09 µg/mg dry weight, showing increased GAGs degradation. The highest SDS concentration, 1.5%, resulted in substantial GAGs loss. After 48 hours, GAG content was 37.51 ± 2.54 µg/mg dry weight, and after 72 hours, it further declined to 29.75 ± 2.23 µg/mg dry weight, representing the lowest GAG retention among all treatments (Figure 4C).
3.2. Histological Assessment
Figure 5 illustrates the native porcine uterine tissue, showcasing its three distinct layers: the endometrial layer, the inner circular smooth muscle layer of the myometrium, and the outer longitudinal smooth muscle layer of the myometrium [38]. The structural organization of each layer is depicted through DAPI staining (Figure 5A-A3), schematic representations (Figure 5B1-B3), and H&E staining (Figure 5C-C3).
The endometrium (Figure 5A1) shows dense nuclear localization in DAPI staining, supported by the schematic (Figure 5B1) illustrating glandular and vascular structures, and H&E staining (Figure 5C1) confirming the presence of blood vessels and glands. The inner circular smooth muscle layer (Figure 5A2) is marked by evenly distributed nuclei in DAPI staining, with the schematic (Figure 5B2) and H&E staining (Figure 5C2) highlighting its dense, circularly arranged smooth muscle fibers. The outer longitudinal smooth muscle layer (Figure 5A3) displays sparsely distributed nuclei in DAPI staining, with schematic (Figure 5B3) and H&E staining (Figure 5C3) emphasizing its longitudinal alignment of muscle fibers.
Additionally, SEM images provide detailed views of the tissue's surface and cross-sectional features. The surface of the endometrium (Figure 5D1) reveals microvilli structures, indicative of its functional role in nutrient exchange and secretion, while the cross-sectional view (Figure 5D2) highlights its vascularized nature with visible red blood cells (RBCs). The serosa, or peritoneal surface, is shown in Figure 5E1 with its smooth texture and wrinkles, while Figure 5E2 provides a cross-sectional view of the myometrium, displaying fibrous structures with visible RBCs embedded within. These findings together provide a comprehensive overview of the native uterine tissue's organization and functional features.
The decellularized samples were analyzed to assess the removal of cellular components and the preservation of ECM structures. In Triton™ 1% + SDS 0.1% (48 hours), nuclei were still visible in dense regions, predominantly in the myometrial segment, as observed in both H&E (Figure 6A2) and DAPI (Figure 6A3) staining. Additionally, collagen and other ECM structures were not distinctly visible, indicating incomplete decellularization (Figure 6A1).
For other treatment groups (Triton™ 1% + SDS 0.5%, 1%, and 1.5% after 48 hours), no visible nuclei were detected in either H&E (Figure 6B2, C2, and D2, respectively) or DAPI (Figure 6B3, C3, and D3) staining, indicating effective cellular removal. The SEM images (Figure 6B1-D1) of these groups revealed clear collagen fibers, demonstrating the preservation of the ECM's fibrous structure.
In Triton™ 1% + SDS 0.1% (72 hours), collagen fibrils became visible in SEM (Figure 6E1), but residual intracellular or extracellular components, likely proteins such as GAGs or elastin, covered them. Despite these residuals, no visible nuclei were observed in H&E (Figure 6E2) or DAPI (Figure 6E3) staining, indicating that extended treatment duration effectively removed cellular components. For the other 72-hour groups (Triton™ 1% + SDS 0.5%, 1%, and 1.5%), complete decellularization was confirmed with visible collagen fibers and no detectable nuclei in either staining method, demonstrating superior decellularization efficacy and ECM preservation (Figure 6F1-3, G1-3, and H1-3, respectively).
The analysis of decellularized samples revealed differences in collagen fiber organization across treatment groups. In Triton™ 1% + SDS 0.5% and 1% (48 hours), collagen fibers appeared well-oriented and structurally intact, as observed in SEM images (Figure 6B1 and C1), suggesting that these conditions partially preserved the ECM's natural architecture during decellularization. In contrast, the other treatment groups displayed less well-oriented and irregular collagen fibers, indicating some degree of ECM disruption likely caused by agitation or harsher conditions during decellularization.
In the 72-hour treatment groups, Triton™ 1% + SDS 0.5% (72 hours) protocol maintained well-oriented collagen fibers (Figure 6F1), demonstrating a balance between decellularization efficacy and ECM preservation. The other 72-hour groups, including Triton™ 1% + SDS 1% and 1.5%, exhibited irregular and disorganized ECM structures, with visible signs of agitation-induced damage, suggesting over-processing of the tissue. These results highlight the importance of optimizing SDS concentration and treatment duration to achieve effective decellularization while preserving ECM orientation and integrity.
Figure 7A demonstrates the Mason Trichrome staining of native and decellularized uterine tissues, highlighting the distribution and intensity of collagen (blue) and non-collagen components such as cellular material (red) across different protocols. The native tissue displayed the highest levels of collagen, with a mean blue pixel intensity of 2.35×10⁶ ± 0.14×10⁶, while the non-collagen components had a red intensity of 2.28×10⁶ ± 0.15×10⁶, reflecting the dense cellular network characteristic of native tissue (Figure 8 A and B).
48-hour treatments of decellularized tissues yielded different levels of collagen retention, contingent on SDS concentration. The Triton™ 1% + SDS 0.1% procedure led to a relatively high blue intensity (2.27×10⁶ ± 0.18×10⁶, p>0.05), suggesting minimal collagen degradation, along with a red signal intensity of 2.15 ×10⁶ ± 0.21×10⁶ (p>0.05), reflecting non-collagen components (Figure 7 B1 and Figure 8A and B, respectively). Similarly, the Triton™ 1% + SDS0.5% protocol showed comparable blue intensity (2.32×10⁶ ± 0.19×10⁶, p>0.05), reflecting effective preservation of collagen (Figure 7C1 and 8A). However, higher SDS concentrations, such as Triton™ 1% + SDS1% and Triton™ 1% + SDS 1.5%, resulted in significant decreases in blue intensity, measuring 1.79×10⁶ ± 0.22×10⁶ and 1.77×10⁶ ± 0.10×10⁶, respectively (p < 0.0001) (Figure 7D1 and E1, respectively and 8A), indicating significant collagen loss.
The 72-hour treatments demonstrated a further reduction in collagen content. The T1%+S0.1% protocol showed a blue intensity of 1.53×10⁶ ± 0.06×10⁶ (Figure 7B2), while T1%+S0.5% and T1%+S1% exhibited blue intensities of 1.49×10⁶ ± 0.09×10⁶ and 1.64×10⁶ ± 0.08×10⁶, respectively (p < 0.0001) (Figure 7C2 and D2, respectively and 8A). The most aggressive protocol, T1%+S1.5%, exhibited the lowest blue intensity (1.09×10⁶ ± 0.12×10⁶, p < 0.0001), reflecting substantial collagen degradation (Figure 7E2 and 8A).
These results highlight the effectiveness of lower SDS concentrations (0.1% and 0.5%) in preserving collagen, particularly in shorter treatment durations (48 hours). Increasing SDS concentration and extending treatment duration result in progressive collagen loss, emphasizing the need for optimized protocols to balance effective decellularization with collagen retention.
3.3. FTIR Spectral Analysis
FT-IR spectroscopy is a pivotal analytical technique for assessing the structural integrity of extracellular matrix (ECM) components, particularly collagen, during tissue decellularization processes. The FT-IR analysis reveals distinct structural modifications in decellularized tissues treated with various combinations of detergents, Triton™ X-100, and SDS. These changes are primarily evident in the spectral regions corresponding to the characteristic peaks of Amide I, Amide II, and Amide III bands, which serve as indicators of protein secondary structures and their conformational changes, as well as hydroxyl (-OH) and amine (-NH) stretching vibrations (Figure 9A and Table 1). A comparative evaluation across protocols provides insights into the preservation or alteration of ECM components.
The Amide I peak (1655 cm−1), associated with C=O stretching vibrations in the protein backbone, is sensitive to the protein's secondary structure (Figure 9A and B). In native tissue, the Amide I band exhibited a mean absorbance of 13.4494 ± 2.3703, indicative of an intact triple-helical structure. Decellularization protocols caused significant reductions, particularly with higher SDS concentrations and longer durations. Among the groups, T1% + S0.5% - 48h demonstrated the best preservation of Amide I with a mean value of 9.9172 ± 1.2161, which was not significantly different compared to the native tissue (p>0.05). In contrast, the T1% + S1.5% - 72h protocol exhibited one of the lowest values, 4.8133 ± 1.2020, reflecting substantial protein degradation and collagen denaturation (p<0.0001).
The Amide II peak (1538 cm−1), originating mainly from in-plane N-H bending and C-N stretching vibrations, provides insights into the hydrogen-bonding environment of proteins (Figure 9A and C). The native tissue displayed a mean absorbance of 6.9243 ± 1.3384, reflecting well-preserved hydrogen bonding. The T1% + S0.5% - 48 group again showed the best preservation, with a value of 5.3262 ± 0.5108, which was not significantly different from the native tissue (p>0.05). In contrast, the T1% + S1.5% - 48 protocol had the lowest value of 1.8836 ± 0.4032, highlighting extensive hydrogen-bond network disruption (p<0.0001).
The Amide III peak (1234 cm−1) involves complex vibrations, including N-H bending and C-N stretching, and provides valuable information about the secondary structure of proteins (Figure 9A and D). The native tissue maintained a high absorbance of 1.0038 ± 0.1257, while T1% + S0.5% - 48h emerged as the best group, with an absorbance of 0.7032 ± 0.03678, showing minimal significance when compared to native tissue (p>0.05). In contrast, the T1% + S1.5% - 72h protocol exhibited one of the lowest values at 0.3476 ± 0.05617, reflecting significant structural damage (p<0.0001).
In addition to these findings, the spectral region associated with aliphatic C-H stretching (2938 and 2875 cm−1) remained relatively consistent across all protocols, suggesting minimal disruption to lipid components. Conversely, the broad region of hydroxyl (-OH) stretching (3500–3200 cm−1) showed a significant reduction in absorbance in tissues treated with higher SDS concentrations for extended periods, indicating the loss of hydroxyl-containing components in the ECM (Figure 9A).
Quantitative analysis of the relative absorbance areas for Amide I, II, and III peaks further substantiates these findings (Figure 9B, C, and D). Protocols employing 1.5% SDS for 72 hours exhibited the lowest relative absorbance areas, highlighting their efficiency in removing ECM proteins and reflecting extensive structural damage. Conversely, T1% + S0.5% - 48h consistently demonstrated the best preservation across all Amide bands with statistically non-significant differences from native tissue in most cases.
The Amide III/1450 ratio, a critical marker of collagen triple helix integrity, provides valuable insights into the impact of decellularization protocols (Figure 9E). With a threshold of 1 representing preserved collagen structure, the analysis revealed notable variations across different treatment conditions.
The native tissue exhibited a mean ratio of 0.9915 ± 0.02545, which is close to the threshold, indicating a well-preserved collagen structure in its natural state. Among the decellularized groups, the T1% + S0.1% - 48h protocol showed a slight increase in the ratio to 1.0390 ± 0.05766, surpassing the threshold and suggesting minimal structural disruption. In contrast, the T1% + S0.1% - 72h group decreased to 0.9729 ± 0.04485, reflecting a mild collagen degradation with extended treatment duration.
The T1% + S0.5% - 48h protocol yielded a ratio of 1.0136 ± 0.02026, indicating preserved collagen structure. However, the T1% + S0.5%-72h group showed a substantially reduced ratio to 0.9263 ± 0.06783, highlighting the detrimental effect of prolonged exposure at this detergent concentration. Similarly, the T1% + S1% - 48h protocol exhibited the highest ratio of 1.0452 ± 0.03107 among all groups, reflecting excellent collagen preservation despite the increased detergent concentration. Extending the treatment to T1% + S1% - 72h led to a slight decrease in the ratio to 0.9797 ± 0.01149, though it remained near the threshold, indicating moderate preservation.
The T1% + S1.5% - 48h protocol maintained a ratio of 1.0015 ± 0.03287, effectively preserving collagen structure. However, the T1% + S1.5% - 72h protocol showed a slight decline to 0.9992 ± 0.033610, demonstrating near-threshold preservation with evidence of mild degradation.
The 1655/1690 ratio indicates collagen cross-linking and secondary structure integrity (Figure 9F). A higher ratio suggests better preservation of collagen’s native triple-helical structure, while lower values indicate structural alterations. The provided results reveal significant variations across different treatment protocols, reflecting the effects of decellularization conditions on collagen integrity.
The native tissue exhibited a mean ratio of 2.7631 ± 0.3194, indicating well-preserved collagen cross-linking and secondary structure in its unaltered state. Among the decellularized groups, the T1% + S0.1% - 48 protocol reduced to 2.3739 ± 0.2525, reflecting moderate structural disruption. Interestingly, the T1% + S0.1% - 72h protocol demonstrated a ratio recovery of 2.6360 ± 0.01975, suggesting that extended exposure under low detergent concentration might stabilize collagen cross-linking in certain conditions.
For the T1% + S0.5% - 48h protocol, the ratio was relatively high at 2.6973 ± 0.1748, indicating strong preservation of collagen integrity during shorter treatments with moderate detergent concentration. However, the T1% + S0.5% - 72h group experienced a notable decrease in the ratio to 2.3661 ± 0.09048, highlighting the adverse impact of prolonged exposure.
The T1% + S1% - 48h protocol maintained a ratio of 2.7164 ± 0.2228, demonstrating effective preservation of collagen structure under higher detergent concentrations over shorter durations. In contrast, the T1% + S1%-72h group exhibited a significant decline in the ratio to 2.3319 ± 0.05083, indicating pronounced structural disruption with extended treatment. Similarly, the T1% + S1.5% - 48h protocol resulted in a ratio of 2.3490 ± 0.11610, while the T1% + S1.5% - 72h group showed a partial recovery to 2.5372 ± 0.02916, suggesting some stabilization in collagen cross-linking under these conditions.
Studies indicate that the 1655/1690 ratio typically decreases with increased detergent concentration and exposure time, consistent with these findings [39,40]. The partial recovery observed in some groups aligns with reports that low detergent concentrations and extended durations may allow for partial restructuring of collagen cross-links [41].
Overall, shorter treatment durations (48 hours) generally preserved collagen integrity better than extended durations (72 hours). Protocols with higher SDS concentrations, such as 1% and 1.5%, demonstrated effective preservation of collagen at shorter durations, with the T1% + S1% - 48h protocol achieving the highest ratio. However, prolonged exposure to these concentrations led to a decline in collagen integrity. These results emphasize the importance of balancing detergent concentration and exposure time to optimize decellularization while maintaining ECM structure [39,40,41,42].
3.4. Raman Spectroscopy Analysis
The Raman spectroscopic analysis revealed significant molecular changes in ECM components, particularly in proteins and glycosaminoglycans (GAGs), across 24, 48, and 72 hours of decellularization treatments. The observed changes are characterized by shifts in Raman peaks, reflecting structural and biochemical alterations in collagen and GAGs. Figure 10A and Table 2 highlights key Raman peaks, including Amide I (1660–1680 cm−1), Amide III (1235–1340 cm−1), CH2/CH3 deformation (1450 cm−1), and skeletal stretches (930–950 cm−1), which serve as molecular fingerprints of collagen and related ECM components [43,44,45].
In Amide I Band (1660–1700 cm−1) region, dominated by C=O stretching vibrations, reflects secondary structural motifs such as α-helices (~1650 cm−1) and β-sheets (~1660–1670 cm−1). Native tissue showed strong signals, indicating a well-preserved structure. Among the treated groups, T1% + S0.1% - 48h showed an enhanced 1660/1620 ratio (1.68 ± 0.22), reflecting tight molecular packing and optimal β-sheet preservation (Figure 10B). However, prolonged exposure to detergents led to structural loosening, as evidenced by a decline in the ratio for T1% + S1.5% - 72 h (1.21 ± 0.15), indicative of molecular degradation.
The Amide III band (1235–1340 cm−1), associated with N-H bending and C-N stretching vibrations, provided insights into the protein backbone dynamics. The native tissue's 1240/1270 ratio (1.10 ± 0.03) highlighted a balanced and intact structure (Figure 10C). In 48-hour treatments, T1% + S1% - 48h (1.17 ± 0.07) demonstrated stress-induced conformational tightening, while T1% + S0.1% - 72h (0.86 ± 0.13) in the 72-hour group reflected extensive backbone degradation.
The side-chain dynamics (1450 cm−1), corresponding to CH2/CH3 deformations, were evaluated through the 1240/1450 ratio. A decrease in this ratio in groups like T1% + S1.5% - 72h (0.68 ± 0.09) signalled weakened molecular interactions due to excessive chemical exposure (Figure 10D). In contrast, the 48-hour treatment T1% + S0.5% - 48h retained near-native characteristics (0.86 ± 0.09), indicating effective preservation of side-chain stability.
The skeletal stretches (930–950 cm−1), reflecting the backbone flexibility of collagen, were well-preserved in 48-hour treatments like T1% + S0.5% - 48h. However, 72-hour treatments, such as T1% + S1.5% - 72h, exhibited reductions in intensity, indicating significant backbone disruptions.
The sulfated GAGs (~1063 cm−1), attributed to S=O stretching vibrations, served as markers for the presence of GAGs. The 48-hour treatment T1% + S0.5% - 48h retained strong signals, demonstrating effective preservation of sulfated GAGs, while these signals were markedly reduced in 72-hour treatments like T1% + S1% - 72h, highlighting significant GAG depletion.
Comparisons across the different time points underscored the balance achieved in the 48-hour treatments. While the 24-hour treatments, such as T1% + S1% - 24h, exhibited tight conformational packing with an elevated 1660/1620 ratio (1.45 ± 0.12), these early-stage protocols began to show minor reductions in GAG-specific signals, indicating the onset of ECM disruption. The 48-hour treatments, particularly T1% + S0.5% - 48h and T1% + S1% - 48h, maintained structural stability across multiple markers. These protocols showed near-native values for the 1240/1270 (1.22 ± 0.15) and 1240/1450 (0.86 ± 0.09) ratios, alongside effective GAG retention. By contrast, the 72-hour treatments were characterized by extensive degradation, with the 1320/1450 ratio dropping significantly in T1% + S1% - 72h (0.58 ± 0.12) and GAG-specific peaks almost disappearing (Figure 10E).
Among the protocols studied, T1% + S0.5% - 48h emerged as the most effective. This treatment achieved a near-native balance in structural and biochemical markers, preserving collagen’s secondary structure and maintaining GAG levels. While T1% + S1% - 48h also performed well, slight deviations in side-chain dynamics suggested that T1% + S0.5% - 48h offered superior preservation. These findings highlight the critical role of precise chemical exposure in optimizing decellularization outcomes.
3.5. Thermogravimetric Analysis (TGA)
The thermogravimetric analysis (TGA) results provide insights into the thermal decomposition behavior of porcine uterine tissue and its decellularized counterparts. The profiles reflect the effects of different SDS and Triton™ X-100 concentrations, treatment durations, and their impact on the structural and thermal properties of the extracellular matrix (ECM).
The TGA curves in Figure 11A illustrate the thermal degradation profiles of native and decellularized uterine tissues subjected to varying concentrations of SDS and Triton for 48 and 72 hours. The native tissue exhibits a characteristic degradation peak around 330°C, indicating stable protein content and structural integrity. In contrast, decellularized samples demonstrate varied peak temperatures and degradation behaviors depending on the SDS concentration and treatment duration. Notably, the 48-hour treatments at higher SDS concentrations (e.g., 1% and 1.5%) show slightly shifted degradation peaks compared to the native tissue, suggesting alterations in protein composition and thermal stability. Similarly, for the 72-hour treatments, degradation peaks are more distinct and shifted toward lower temperatures, especially at 1.5% SDS, highlighting substantial protein degradation.
Quantitative analysis of peak areas reveals significant differences in thermal degradation behavior (Figure 11B). The native tissue (48.84 ± 3.89) and the T1% + S0.1% - 48 group (47.07 ± 4.72) show comparable peak areas with no significant difference (p>0.05). However, as the SDS concentration increases to 0.5%, 1%, and 1.5%, the peak areas significantly rise to 60.09 ± 6.81, 67.18 ± 4.59, and 69.24 ± 3.86, respectively. Statistical analysis indicates that the differences between native tissue and T1% + S1% - 48h and T1% + S1.5% - 48h (p<0.001) are significant, suggesting enhanced detergent penetration and increased decellularization efficiency at these concentrations.
The 72-hour treatments exhibit a different trend, with all decellularized groups displaying lower peak areas than the native tissue (Figure 11C). The native tissue maintains a peak area of 48.84 ± 3.89. In contrast, the T1% + S0.1% - 72h group shows a reduced value of 37.69 ± 1.84. The T1% + S0.5% - 72h, T1% + S1% - 72h, and T1% + S1.5% - 72h groups exhibit further reductions in peak areas, with means of 33.89 ± 2.23, 35.22 ± 3.28, and 27.78 ± 3.33, respectively. Statistical analysis highlights significant differences between native tissue and all decellularized groups, with the most substantial reduction observed for T1% + S1.5% - 72h (p<0.0001). This trend suggests that prolonged exposure to higher SDS concentrations leads to more extensive protein degradation and structural disintegration.
The observed trends align with previous studies on decellularization protocols, which report that higher detergent concentrations and extended treatment durations enhance the removal of cellular components but also compromise ECM integrity. For instance, it has been reported on SDS-based protocols for soft tissues that protein denaturation and collagen loss are dose-dependent [5]. Furthermore, the thermal stability reductions observed in the 72-hour treatments correlate with the depletion of thermally stable proteins such as collagen and elastin.
3.6. Mechanical Properties of Decellularized Tissues
Tensile testing directly assesses the preservation of the extracellular matrix (ECM), ensuring its structural and functional integrity post-decellularization. Damage to ECM components like collagen or elastin during processing can compromise its ability to support cell attachment, migration, and differentiation, reducing its effectiveness in tissue engineering. By evaluating these properties, tensile testing validates the suitability of the decellularized ECM for regenerative applications, ensuring it can withstand mechanical loads, promote cellular interactions, and support functional recovery in clinical contexts.
The mechanical properties of native and decellularized tissues were evaluated based on stress-strain behavior, ultimate tensile strength (UTS), elongation at rupture, and Young’s modulus (Figure 12). The stress-strain curves (Figure 12A) highlight the mechanical integrity of the native tissue, which demonstrated the highest stress values. Among the decellularized groups, the T1% + S0.1%-48h treatment exhibited stress-strain behavior closest to the native tissue, suggesting minimal disruption to the tissue's mechanical properties. However, prolonged exposure (72h) and increased detergent concentrations (0.5–1.5% SDS) led to a significant reduction in stress values, with T1% + S1%-72h and T1% + S1.5%-72h showing the weakest performance.
The UTS values (Figure 12B) followed a similar trend, where the native tissue exhibited the highest UTS (2.44 ± 0.05 MPa). T1% + S0.1%-48h demonstrated a UTS comparable to the native tissue (2.34 ± 0.05 MPa, p=0.7094), indicating that this protocol effectively preserved the tensile strength. However, the UTS declined significantly with increasing detergent concentrations and treatment durations. For instance, T1% + S0.5%-48h and T1% + S1.5%-72h exhibited markedly lower UTS values (1.39 ± 0.11 MPa and 1.19 ± 0.10 MPa, respectively, p<0.0001). These findings emphasize that higher detergent concentrations and prolonged exposure compromise the tensile strength of decellularized tissues.
Elongation at rupture, a measure of tissue flexibility, is presented in Figure 12C. The native tissue showed an elongation of 110.67 ± 5.57%. Among the decellularized groups, T1% + S0.1% - 72h exhibited the highest elongation (163.56 ± 9.04%, p<0.0001), indicating enhanced flexibility compared to the native tissue. Conversely, treatments with higher SDS concentrations and shorter durations, such as T1% + S0.5% - 48h and T1% + S1% - 48h, significantly reduced elongation to 80.19 ± 2.91% and 86.51 ± 3.83%, respectively (p<0.01). Interestingly, T1% + S1.5%-72h demonstrated a partial recovery in flexibility with an elongation of 131.52 ± 16.36% (p<0.05).
Young’s modulus, an indicator of tissue stiffness, is shown in Figure 12D. The native tissue exhibited a modulus of 35.88 ± 2.02 kPa. T1% + S0.1%-48h significantly increased stiffness to 47.35 ± 1.29 kPa (p<0.0001), likely due to the retention of structural integrity. However, prolonged exposure (72h) at 0.1% SDS reduced stiffness to 24.65 ± 0.94 kPa (p<0.0001). The T1% + S0.5% - 72h treatment showed the lowest modulus (17.12 ± 1.73 kPa, p<0.0001), indicating significant softening due to extended exposure. Intermediate stiffness values were observed for T1% + S1% - 48h (33.68 ± 2.67 kPa) and T1% + S1.5% - 48h (26.57 ± 3.30 kPa).
In summary, these results indicate that low detergent concentrations (0.1% SDS) and shorter exposure times (48h) better preserve the mechanical properties of decellularized tissues. Conversely, higher concentrations and prolonged treatments significantly impair tensile strength, flexibility, and stiffness. These findings underscore the importance of optimizing decellularization protocols to maintain the mechanical integrity of the tissue for potential applications in tissue engineering.
3.7. Selection of the Optimal Decellularization Protocol for Further Analysis
The evaluation of decellularization protocols revealed tissue-specific outcomes influenced by structural integrity. For tissues with less intact structures, such as the endometrium, and for more intact segments, such as the uterine myometrium, the T1% + S1% - 48h protocol demonstrated superior DNA removal, achieving levels below the critical threshold of 50 ng/mg. While this protocol showed slightly reduced protein preservation compared to T1% + S0.5% - 48h, its enhanced decellularization minimizes the risk of immunogenicity, making it more suitable for downstream applications. Conversely, T1% + S0.5% - 48h preserved more protein, which may be advantageous for maintaining ECM functionality. However, the higher DNA residue levels in this protocol limit its applicability due to potential immunogenic responses, especially in clinical and translational contexts.
Given these findings, the T1% + S1% - 48h protocol was selected for future studies to ensure a balance between structural preservation and immunological safety. The decellularized powdered dUECM generated using this protocol will be used for further biofabrications.
3.8. Gelation Kinetics and Rheological Behavior of dUECM Gel
The steady-state rheological analysis of dUECM hydrogels at 0.5%, 1%, and 1.5% concentrations was conducted at 4°C to evaluate their viscosity and stress behavior under varying shear rates (Figure 13A). The results revealed that increasing the concentration of dUECM led to higher viscosity, with the 1.5% dUECM hydrogel exhibiting the highest viscosity, followed by 1% and 0.5%. This trend indicates enhanced mechanical stability at higher concentrations. All samples displayed shear-thinning behavior, where viscosity decreased with increasing shear rate, a desirable characteristic for bioink applications as it facilitates smooth extrusion during 3D bioprinting while maintaining post-printing structural stability.
The gelation kinetics of the dUECM hydrogels were examined at 405 nm using turbidimetry (Figure 13B). The absorbance intensity increased over time, confirming gel formation. The 1.5% dUECM hydrogel exhibited the fastest gelation, initiating at approximately 6 minutes and completing by 20 minutes. The 1% dUECM hydrogel showed moderate gelation kinetics, with gelation beginning around 8 minutes and stabilizing by 22 minutes. In contrast, the 0.5% dUECM hydrogel demonstrated delayed gelation, initiating at approximately 10 minutes and stabilizing after 24 minutes. These results suggest that higher dUECM concentrations accelerate gelation, resulting in faster structural stabilization.
The microstructural organization of the hydrogels was further investigated using SEM imaging (Figure 13C–E). The pore size analysis revealed significant differences across the three concentrations. The 0.5% dUECM hydrogel had the largest mean pore size of 17.73 ± 4.48 µm (range: 10.09–25.91 µm), with a loose and sparsely connected network. The 1% dUECM hydrogel displayed a mean pore size of 13.39 ± 4.10 µm (range: 7.54–21.42 µm) and a more organized structure, characterized by visible crosslinked collagen fibers. The 1.5% dUECM hydrogel exhibited the smallest mean pore size of 11.92 ± 2.59 µm (range: 6.69–15.28 µm), with a compact and highly uniform structure. These findings highlight the influence of dUECM concentration on microstructural organization, where higher concentrations produce denser and more uniform networks.
The temperature-dependent gelation behavior of the 1.5% dUECM hydrogel was evaluated using G′ and G″ moduli to determine the impact of temperature on gelation kinetics (Figure 13F1-3). At 10ºC, gelation was initiated at 891 seconds, demonstrating a slow and controlled process suitable for storage and handling. Increasing the temperature to 15°C accelerated gelation, with the onset occurring at 196 seconds. Further temperature increases to 20°C, 25°C, and 30°C significantly reduced gelation times to 64, 39, and 27 seconds, respectively. These results confirm the thermoresponsive nature of dUECM hydrogels and underscore the critical importance of maintaining storage and handling conditions below 10°C to prevent premature gelation.
In summary, the steady-state rheology results demonstrate enhanced mechanical stability with increasing dUECM concentration, while the gelation kinetics indicate faster gelation at higher concentrations. SEM imaging revealed that the microstructure becomes denser and more uniform with increasing concentration, and the temperature-dependent analysis highlighted the critical role of temperature in modulating gelation time. Together, these findings provide valuable insights into the design and application of dUECM hydrogels for various biomedical and biofabrication needs.
3.9. Printability, Swelling, Degradation, and Mechanical Properties of 3D-Printed Constructs
The printability of the 3D-printed constructs was assessed using the printability factor, where values closer to 1 indicate higher accuracy in reproducing the designed strand size. Six groups of hydrogels were analyzed: Alg 2% + 0.5, 1, and 1.5% dUECM and Alg 3% combined with the same dUECM concentrations. To ensure the hydrogels' effectiveness, their swelling, mechanical properties (Young’s modulus), and degradation behavior were studied. Controlled swelling is vital for maintaining structural integrity, dimensional stability, and nutrient exchange, while appropriate mechanical properties ensure the hydrogels can support printed structures and mimic native tissue. Additionally, tailored degradation rates enable scaffold bioresorption, compatibility with tissue regeneration, and controlled release of bioactive molecules, making these hydrogels versatile for biomedical applications.
In the Alg 2% group, the printability factor for Alg 2% alone was 1.58 ± 0.46. When dUECM was incorporated, the printability factors were 1.60 ± 0.19 for 0.5% dUECM, 1.65 ± 0.30 for 1% dUECM, and 1.87 ± 0.25 for 1.5% dUECM (Figure 14A1-6). Statistical analysis showed no significant differences between Alg 2% and the formulations with 0.5% or 1% dUECM (p> 0.0.5). However, the difference for the formulation with 1.5% dUECM was statistically significant (p < 0.0001).
In the Alg 3% group, the printability factor for Alg 3% alone was 1.92 ± 0.21. When dUECM was added, the printability factors were 1.82 ± 0.18 for 0.5% dUECM, 1.20 ± 0.19 for 1% dUECM, and 1.56 ± 0.20 for 1.5% dUECM (Figure 14B1-6). Statistical analysis revealed no significant difference between Alg 3% and the formulation with 0.5% dUECM (p>0.05). However, significant differences were observed for the formulations with 1% and 1.5% dUECM (p < 0.0001 for both).
The results for the Alg 2% group show that as the dUECM concentration increases, the printing pressure and printing speed are significantly affected (Figure 14A6 and 7). The mean pressure required for printing increased from 10.33 ± 0.58 kPa for Alg 2% alone to 11.00 ± 1.73 kPa for Alg 2% + dUECM 0.5%, 33.33 ± 5.77 kPa for Alg 2% + dUECM 1%, and 36.67 ± 5.77 kPa for Alg 2% + dUECM 1.5%. The difference in pressure was statistically significant between Alg 2% and formulations containing 1% (p=0.0003) and 1.5% dUECM (p=0.0001). This trend indicates that incorporating dUECM increases the bioink's viscosity, requiring higher extrusion pressure.
The mean printing speed followed a similar trend, increasing from 14.33 ± 1.15 mm/s for Alg 2% alone to 12.67 ± 2.52 mm/s for Alg 2% + dUECM 0.5%, 39.67 ± 6.81 mm/s for Alg 2% + dUECM 1%, and 57.33 ± 4.62 mm/s for Alg 2% + dUECM 1.5%. Statistical analysis revealed significant differences in printing speed for formulations containing 1% (p = 0.0002) and 1.5% dUECM (p < 0.0001). The increase in speed may be related to adjustments required to maintain strand uniformity under higher pressure.
In the Alg 3% group, a different trend was observed, where printing pressure increased consistently with higher dUECM concentrations, but printing speed showed a more variable behavior (Figure 14B6 and 7). The mean printing pressure increased from 35.00 ± 5.77 kPa for Alg 3% alone to 67.50 ± 9.57 kPa for Alg 3% + dUECM 0.5%, 77.50 ± 9.57 kPa for Alg 3% + dUECM 1%, and 102.50 ± 32.02 kPa for Alg 3% + dUECM 1.5%. The differences in pressure were significant for formulations containing 1% (p = 0.0134) and 1.5% dUECM (p = 0.0004). The increase in pressure highlights the influence of higher dUECM concentrations on the bioink's extrusion properties.
The mean printing speed was 21.67 ± 1.53 mm/s for Alg 3% alone, which increased to 27.33 ± 2.52 mm/s for Alg 3% + dUECM 0.5%, and then decreased slightly to 21.67 ± 1.53 mm/s for Alg 3% + dUECM 1% and 20.00 ± 1.73 mm/s for Alg 3% + dUECM 1.5%. Statistical analysis showed a significant difference in speed only for the formulation with 0.5% dUECM (p = 0.015), with no significant differences for the 1% and 1.5% dUECM formulations (p > 0.5). The drop in speed for higher dUECM concentrations may reflect the need for finer control during printing under higher pressures.
The results indicate that incorporating dUECM at varying concentrations has a distinct impact on the printability factor across the two groups. Additionally, reduced gel translucency indicated the presence of bioactive dUECM molecules in the strands. These findings underscore the importance of further evaluating related properties, such as crosslinking behavior and swelling dynamics. Conducting swelling measurements over extended periods will provide deeper insights into how printability correlates with long-term structural stability and functional performance.
The swelling properties of scaffolds over 14 days in complete DMEM culture media are shown in Figure 15A1 and A2. For the Alg 2% group, the printed scaffolds swelled by 52 ± 26% after 24 hours. However, the swelling gradually decreased over time, reaching 29 ± 12% by day 14. For the Alg 2% + 0.5% dUECM group, the scaffolds swelled by 48 ± 15% at 24 hours and then stabilized, with swelling decreasing to 26 ± 26% at day 14. Similarly, Alg 2% + 1% dUECM scaffolds showed 26 ± 10% swelling after 24 hours, decreasing to 13 ± 13% by day 14, demonstrating high stability. The Alg 2% + 1.5% dUECM group showed slightly higher swelling at 24 hours (43 ± 17%), which decreased to 16 ± 12% by day 14.
For the Alg 3% group, swelling values were generally higher. Alg 3% scaffolds swelled significantly, reaching 56 ± 7% at 24 hours and increasing to 90 ± 12% by day 14. The addition of dUECM reduced the swelling rate, with Alg 3% + 0.5% dUECM swelling by 50 ± 20% at 24 hours and stabilizing at 47 ± 24% by day 14. Alg 3% + 1% dUECM exhibited swelling of 47 ± 22% at 24 hours, which decreased to 27 ± 27% at day 14. Finally, the Alg 3% + 1.5% dUECM group swelled by 43 ± 14% at 24 hours, with a minimal increase to 47 ± 12% at day 14.
These results suggest that adding dUECM to alginate scaffolds enhances their stability by reducing swelling rates, especially in the Alg 2% + 1% and Alg 3% + 1.5% dUECM groups.
The mechanical stiffness of scaffolds, represented by Young’s modulus, is shown in Figure 15B1 and B2. For the Alg 2% group, the printed scaffolds demonstrated an initial modulus of 79.8 ± 27.1 kPa at day 0, which dropped significantly to 47.5 ± 32.6 kPa after 24 hours. By day 14, the modulus had further declined to 12.0 ± 6.5 kPa, indicating a substantial loss in stiffness over time.
Incorporating dUECM improved the mechanical performance of the Alg 2% group. Alg 2% + 0.5% dUECM scaffolds had an initial modulus of 168.1 ± 78.2 kPa, which decreased to 69.4 ± 7.2 kPa at 24 hours and 55.6 ± 23.7 kPa at day 14. Similarly, Alg 2% + 1% dUECM scaffolds exhibited an initial modulus of 227.6 ± 27.1 kPa, which dropped to 150.7 ± 32.6 kPa at 24 hours and stabilized at 143.9 ± 30.6 kPa at day 14.
Alg 3% scaffolds demonstrated an initial Young’s modulus of 322.6 ± 46.9 kPa, which decreased sharply to 113.8 ± 13.6 kPa at 24 hours and further declined to 84.6 ± 30.5 kPa by day 14. This trend reflects significant softening over time.
For Alg 3% + 0.5% dUECM, the initial modulus was 308.9 ± 50.9 kPa, slightly lower than the pure alginate group. After 24 hours, the modulus dropped to 136.6 ± 23.2 kPa and further reduced to 95.8 ± 29.8 kPa by day 14, showing better retention compared to the pure alginate scaffold.
In the Alg 3% + 1% dUECM group, the scaffolds displayed an initial modulus of 322.7 ± 46.9 kPa, which decreased to 207.9 ± 32.1 kPa at 24 hours and further to 174.8 ± 29.8 kPa by day 14. Maintaining the second highest stiffness for 14 days, this group showed excellent mechanical properties.
Finally, the Alg 3% + 1.5% dUECM group exhibited the highest stiffness retention. The modulus started at 322.7 ± 50.9 kPa, decreased to 207.8 ± 23.1 kPa at 24 hours, and stabilized at 174.8 ± 29.8 kPa by day 14. This performance highlights its superior mechanical integrity compared to the other groups.
Incorporating dUECM significantly improved mechanical stiffness retention across all groups compared to pure alginate scaffolds. Among the 3% alginate-based scaffolds, Alg 3% + 1.5% dUECM demonstrated the best mechanical stability over time and making it the most promising candidate for applications requiring mechanical compliance and structural integrity, as needed for uterine tissue engineering (Figure 15 B3).
The degradation behavior, illustrated in Figure 15 C1 and C2, was assessed based on mass retention, where 100% represents the initial mass immediately after printing and crosslinking (day 0).
For the Alg 2% group, the scaffolds retained 100 ± 13% of their initial mass at day 0. By 24 hours, the mass decreased to 78 ± 12% and further dropped to 53 ± 13% at day 3, 44 ± 14% at day 7, and 30 ± 12% by day 14. The incorporation of dUECM improved degradation resistance. Alg 2% + 0.5% dUECM scaffolds retained 100 ± 4% of their mass at day 0, which decreased to 76 ± 11% at 24 hours, 66 ± 7% at day 3, 61 ± 5% at day 7, and 59 ± 8% by day 14. Alg 2% + 1% dUECM scaffolds retained 100 ± 12% initially, dropping to 77 ± 12% at 24 hours, 69 ± 10% at day 3, 59 ± 9% at day 7, and stabilizing at 66 ± 12% by day 14. Finally, the Alg 2% + 1.5% dUECM scaffolds exhibited excellent degradation resistance compared to other Alg 2% groups. The scaffolds retained 100 ± 23% of their initial mass at day 0. By 24 hours, the retention decreased slightly to 98 ± 21%, followed by 96 ± 22% on day 3, maintaining 96 ± 13% on day 7, and reducing to 94 ± 18% by day 14.
For the Alg 3% group, the scaffolds retained 100 ± 5% of their initial mass at day 0, with a degradation profile of 92 ± 6% at 24 hours, 80 ± 10% at day 3, 78 ± 8% at day 7, and 66 ± 12% by day 14. Adding dUECM significantly enhanced stability. Alg 3% + 0.5% dUECM scaffolds retained 100 ± 13% of their mass at day 0, 95 ± 14% at 24 hours, 92 ± 10% at day 3, 89 ± 11% at day 7, and 79 ± 14% by day 14. Alg 3% + 1% dUECM scaffolds started with 100 ± 14%, retained 95 ± 14% at 24 hours, 94 ± 10% at day 3, 93 ± 11% at day 7, and maintained 91 ± 14% at day 14.
Alg 3% + 1.5% dUECM scaffolds showed the highest degradation resistance among all groups. The scaffolds retained 100 ± 23% of their initial mass at day 0. By 24 hours, the mass retention slightly decreased to 98 ± 21%, followed by 96 ± 22% at day 3, maintaining 96 ± 13% at day 7, and reducing to 94 ± 18% by day 14.
These results highlight that incorporating higher concentrations of dUECM, particularly at 1.5%, significantly improves scaffold stability by slowing degradation in 2 and 3% Alg groups.
3.10. Viability and Live/Dead Assay of hTERT-HM Cells
The results of the MTT assay reveal significant differences in relative hTERT-HM cell survival rates across various hydrogel compositions compared to the control groups. The positive control (plate without gel) demonstrated the highest cell survival, serving as the baseline at 100%. The negative controls—2% Alg and 3% Alg—exhibited significantly lower cell survival rates, serving as benchmarks for comparison with other experimental groups.
After 24h, the positive control was set at 100% cell viability. The negative controls, 2% Alg and 3% Alg, showed reduced viabilities of 71.55 ± 5.97% and 68.66 ± 2.01%, respectively (p = 0.026 and p = 0.0056, respectively). Among experimental groups, 3% Alg + 1.5% dUECM had the highest viability at 86.48 ± 3.71%, outperforming other compositions and the negative controls (p < 0.0001 and p = 0.0005, respectively). Other dUECM-containing hydrogels, such as 2% Alg + 1% dUECM, also demonstrated moderate viability (78.28 ± 2.40%), indicating the bioactivity of dUECM in enhancing cell survival (Figure 16A).
By 72h, the positive control exhibited a viability increase to 110.16 ± 5.51%, while the negative controls, 2% Alg and 3% Alg, recorded viabilities of 79.36 ± 5.73% and 86.23 ± 4.51%, respectively (p<0.0001). Among experimental groups, 3% Alg + 1.5% dUECM again led with 102.53 ± 3.10%, significantly higher than 2% and 3% alginate negative controls (p < 0.0001 and p = 0.0005, respectively). Other promising groups included 3% Alg + 1% dUECM, which achieved 98.25 ± 1.05%, indicating a stable and bioactive composition over time (Figure 16B).
By 120h, the positive control increased to 126.31 ± 7.51%, while the negative controls, 2% Alg and 3% Alg, showed viabilities of 93.30 ± 2.56% and 97.98 ± 1.70%, respectively. 3% Alg + 1.5% dUECM exhibited a remarkable increase to 144.13 ± 6.39%, significantly surpassing all other groups (p<0.001). The group 2% Alg + 1.5% dUECM also maintained its high performance with a viability of 115.29 ± 2.76%, demonstrating the impact of dUECM in promoting cell proliferation (Figure 16C).
At 168h, the positive control peaked at 199.30 ± 16.88%, while the negative controls, 2% Alg and 3% Alg, remained lower at 122.17 ± 12.63% and 145.70 ± 31.80%, respectively. 3% Alg + 1.5% dUECM emerged as the top performer, with high cell proliferation of 258.14 ± 12.83%, highlighting its superior bioactivity and stability (p=0.0003). The group 3% Alg + 1% dUECM also exhibited substantial viability of 197.58 ± 11.59%, supporting its potential for long-term applications (Figure 16D).
Overall, the consistent superiority of 3% Alg + 1.5% dUECM across all days underscores its promise as a robust hydrogel composition for uterine tissue engineering. The live/dead assay further corroborates these findings, with 3% Alg + 1.5% dUECM displaying the highest proportion of live cells and minimal cell death throughout the study period.
The live/dead assay results, shown in Figures 16E and F, illustrate the hTERT-HM cell viability over 24, 72, 120, and 168 hours for two groups: 3% Alg as the control (Figure 16E) and 3% Alg + 1.5% dUECM, the selected optimal composition based on MTT assay results (Figure 16F).
At 24h, we observed a sparse distribution of live (green) cells, with significant red fluorescence, suggesting limited cell attachment and viability. At the 72-hour mark, there was a small increase in cell viability, noticeable via the greater number of green cells. However, the red fluorescence of dead cells remains prominent, indicating persistent cell death. At 120h, live cells appear more densely populated, but the overall viability remains moderate. After 168h, there is a noticeable increase in green fluorescence, suggesting an improved environment for cell survival, but red fluorescence is still prevalent, reflecting limited bioactivity of 3% Alg alone.
In contrast, the 3% Alg + 1.5% dUECM group demonstrates a significant improvement in cell viability across all time points. After 24h, green fluorescence is markedly more prominent than the control, indicating enhanced initial cell attachment and viability due to the bioactive properties of dUECM. By 72h, cells exhibit increased proliferation and spreading, with minimal red fluorescence. By 120h, the density of green cells significantly rises, showing active proliferation and reduced cell death. After 168h, the 3% Alg + 1.5% dUECM composition supports robust cell growth, with dense green fluorescence and minimal red fluorescence, reflecting its superior capacity to maintain a favorable microenvironment for hTERT-HM cells.
These results confirm the enhanced bioactivity of 3% Alg + 1.5% dUECM, which not only supports higher cell viability but also reduces cell death over time compared to 3% Alg alone. This highlights its potential as a promising hydrogel for uterine tissue engineering applications.
3.11. Mimicking Uterine Tissue Microstructure: Alginate-dUECM Freeze-Dried Scaffold
The synthesized hydrogel composed of Alg 3% and 1.5% dUECM demonstrates significant potential for uterine tissue engineering, especially as an injectable hydrogel and freeze-dried mesh or membanes. This formulation combines the bioactivity of dUECM with the structural reinforcement of alginate, providing a matrix that mimics the native uterine extracellular matrix. Crosslinking significantly impacts the hydrogel’s ability to maintain protein stability, molecular bonding, and hydration, as demonstrated by the TGA and DTA analyses shown in Figure 17A.
The DTA results reveal distinct thermal behaviors between crosslinked (CL-dark blue) and non-crosslinked (NCL-red) hydrogels. Crosslinked hydrogels exhibit a higher mean peak area (6.6279 ± 5.2973) compared to non-crosslinked hydrogels (5.3825 ± 3.8413), indicating better protein preservation in the crosslinked group. The crosslinking process stabilizes the hydrogel matrix, maintaining the functional properties of dUECM proteins, which are critical for bioactivity. The DTA curves further show that the crosslinked hydrogel has a prominent peak in the temperature range of 50–100°C, which is absent or significantly less intense in the non-crosslinked counterpart. This peak suggests that the crosslinked hydrogel retains more water molecules within its structure, highlighting its enhanced hydration capacity. This characteristic is essential for maintaining scaffold integrity, as a well-hydrated environment supports cell viability, nutrient transport, and tissue integration.
The non-crosslinked hydrogel, while retaining some bioactivity, exhibits weaker thermal signals and hydration characteristics. The globular structures observed in SEM images suggest less cohesive bonding and reduced water retention. These deficiencies may limit its suitability for long-term or mechanically stable applications, though it may still find use in short-term applications emphasizing bioactivity.
In uterine tissue engineering, hydration plays a critical role in ensuring a suitable microenvironment for cellular activity and scaffold functionality. The ability of crosslinked hydrogels to retain more water molecules enhances their resemblance to native tissue, providing a hydrated and biomimetic platform for cell attachment, proliferation, and differentiation. Additionally, the improved protein preservation ensures sustained bioactivity, making crosslinked hydrogels more reliable for applications requiring prolonged performance. Non-crosslinked hydrogels, while less stable, may still serve as a viable option for specific applications where rapid degradation and high bioactivity are desired. However, their reduced hydration and mechanical stability may limit their broader applicability. The DTA results underscore the superior hydration and protein preservation capabilities of the crosslinked Alg 3% + 1.5% dUECM hydrogel. These properties make it a promising candidate for uterine tissue engineering, particularly for applications requiring a hydrated and mechanically stable scaffold. The ability to maintain scaffold integrity and hydration further supports its potential for injectable and freeze-dried gel applications. Further optimization of the crosslinking process could enhance these properties while ensuring biocompatibility and functionality in tissue engineering contexts.
The FTIR results for Alg 3% + 1.5% dUECM reveal critical insights into the role of crosslinking in modifying the chemical structure and functional group interactions within the hydrogel. The comparison between non-crosslinked and crosslinked samples highlights significant differences, particularly in the preservation of functional groups and the formation of bonds essential for maintaining hydrogel integrity (Figure 17B). These findings align with the combined functionality of alginate and dUECM and underscore the enhanced properties achieved through cross-linking.
The broad peak observed in the range of 3700–3120 cm−1 in the crosslinked hydrogel indicates the presence of extensive hydroxyl (O-H) groups. This peak signifies enhanced hydrogen bonding networks, resulting in increased water retention and hydration capacity. The ability to maintain a hydrated microenvironment is crucial for supporting cell viability, nutrient transport, and overall scaffold functionality in tissue engineering. Conversely, the non-crosslinked hydrogel exhibits a weaker signal in this region, reflecting reduced intermolecular bonding and lower hydration capacity, which may limit its effectiveness in mimicking native tissue conditions.
The Amide I (1638 cm−1), Amide II (1544 cm−1), and Amide III (1236 cm−1) peaks in the FTIR spectra are significantly sharper and more defined in the crosslinked hydrogel. These peaks are indicative of well-preserved protein secondary structures, including C=O stretching (Amide I), N-H bending (Amide II), and triple-helix structures (Amide III). The crosslinking process stabilizes these protein structures, ensuring that the bioactive components of dUECM are retained. This is essential for promoting cell attachment, proliferation, and differentiation, which are critical for successful tissue regeneration.
The sharper peaks in the crosslinked hydrogel at 2960, 2936, and 2880 cm−1, corresponding to aliphatic C-H stretching, reflect enhanced molecular interactions between alginate and dUECM. These interactions contribute to the mechanical reinforcement of the hydrogel, providing it with greater structural stability while maintaining flexibility. Similarly, the prominent C-O stretching peaks at 1070 and 1035 cm−1 confirm the preservation of carbohydrate structures, such as glycosaminoglycans (GAGs) from dUECM and polysaccharides from alginate. These functional groups are essential for retaining the bioactivity and mechanical properties of the hydrogel.
Crosslinking introduces covalent and non-covalent interactions that improve the overall functionality of the hydrogel. It enhances the preservation of protein integrity, ensuring sustained bioactivity, and strengthens hydrogen bonding networks, leading to superior hydration capacity. Additionally, crosslinking provides mechanical stability, enabling the hydrogel to maintain its structural integrity during handling and implantation. These properties are critical for creating a biomimetic scaffold that supports tissue regeneration in uterine tissue engineering.
To develop scaffolds for uterine tissue engineering, the microstructure of native uterine tissue and freeze-dried hydrogels was analyzed, as illustrated in Figure 17C1–C6. This analysis highlights the structural properties and porosity of different layers of uterine tissue, including the endometrium, myometrium and serosa, as well as the structural differences between crosslinked (CL) and NCL hydrogels (Figure 17D1 and E1, respectively). These insights guided the design of scaffolds to mimic the native uterine tissue's architecture and functionality.
The H&E-stained image (Figure 17C1) and SEM images (Figure 17C2–C3) of the native tissue depict a uniform serosal layer, which is critical for the structural and functional integrity of the uterine wall. By casting and freeze-drying the Alg 3% + dUECM 1.5% hydrogels, a smooth and intact top surface resembling the serosa was achieved (Figure 17D1-Top). The interconnected pore structure observed in the scaffolds further confirms their suitability for mimicking the native uterine tissue, facilitating cellular infiltration and nutrient transport (Figure 17D2). The crosslinked hydrogel (Figure 17D3) exhibits well-defined collagen fibers, indicating the successful stabilization of dUECM proteins and alignment of the matrix structure. In contrast, the non-crosslinked hydrogel (Figure 17E3) lacks this structural integrity, with globular alginate polymers visible between partially crosslinked dUECM components. This highlights the importance of crosslinking in achieving a biomimetic structure. SEM images of the crosslinked hydrogel (Figure 17D1–D2) show an intact surface with uniformly distributed interconnected pores, replicating the serosa's architecture. In the non-crosslinked hydrogel (Figure 17E1–E2), cylindrical porosities dominate the surface, resulting in a less uniform and less mechanically stable structure.
Porosity measurements of native uterine tissue layers and scaffolds provide critical insights into their structural design and functional relevance (Figure 17C6). In native tissue, the endometrium exhibited the largest pore size (249 ± 94 µm), followed by the middle layer (60 ± 44 µm) and the myometrium (43 ± 54 µm). These variations reflect the distinct functional roles of each layer, with larger pores in the endometrium facilitating nutrient exchange and smaller pores in the myometrium offering structural support.
In the hydrogel scaffolds, the NCL scaffold showed a mean pore size of 83 ± 37 µm, which was slightly larger than the CL scaffold's mean pore size of 69 ± 35 µm. The reduction in pore size in the crosslinked hydrogel is likely due to matrix stabilization and tightening induced by the crosslinking process. This structural refinement enhances mechanical stability and integrity while maintaining adequate porosity to support cellular infiltration, a critical factor for tissue engineering applications.
Future research should aim to optimize scaffold architecture further, ensuring enhanced functionality and biocompatibility to support diverse tissue engineering needs.
4. Discussion
Traditional decellularization protocols often involve sequential steps with multiple detergents, extending processing times and increasing the risk of ECM damage. Our study introduces a streamlined one-step decellularization protocol and hybrid hydrogel development, aiming to advance uterine tissue engineering. By employing 1% Triton™ X-100 combined with varying concentrations of SDS, this approach offers a more efficient alternative, reducing processing time and detergent usage while maintaining ECM integrity. This efficiency is particularly advantageous for scaling up production and clinical translation, where time and resource optimization are critical.
The protocol achieved significant cellular component removal, reducing DNA content below 50 ng/mg dry weight, a critical threshold to minimize immunogenicity [60]. The combination of 1% Triton™ and 1.5% SDS for 72 hours demonstrated a 99.85% reduction in DNA content, indicating high decellularization efficiency. However, higher SDS concentrations, while effective in cellular material removal, negatively affected the preservation of essential ECM components such as glycosaminoglycans (GAGs) and collagen. Lower SDS concentrations (0.1% and 0.5%) preserved GAG content more effectively at 48 hours, supporting findings that milder detergents minimize ECM disruption [23]. Conversely, higher SDS concentrations resulted in significant GAG depletion, particularly with extended exposure, highlighting the critical balance between decellularization efficacy and ECM preservation [61].
The combination of Triton™ X-100 and SDS in decellularization protocols provides a synergistic approach that enhances cell removal efficiency while preserving the integrity of the ECM [62,63]. Triton™ X-100, a nonionic surfactant, disrupts lipid-lipid and lipid-protein interactions in cell membranes, facilitating the solubilization of cellular components with minimal damage to the ECM. Conversely, SDS, an anionic surfactant, efficiently disrupts cell membranes and solubilizes nuclear material due to its strong ionic interactions [24].
When mixed, Triton™ X-100 and SDS do not neutralize each other, as Triton™ X-100 lacks ionic charges that would oppose SDS’s anionic activity. Instead, their combination forms mixed micelles, which optimize the surface activity of the solution [64]. This interaction enables SDS to retain its cellular removal capacity while Triton™ X-100 moderates SDS’s harsh effects on ECM components, such as glycosaminoglycans and collagens.
The efficiency and integrity of proposed protocol were further validated through biophysical and biochemical analyses. FT-IR and Raman spectroscopy confirmed the retention of key ECM components, particularly in protocols utilizing SDS 0.5% and 1%. The presence of Amide I and Amide III peaks, indicative of collagen integrity, showed minimal disruption under these conditions. The Amide III/1450 ratio further substantiated the preservation of collagen's triple-helix structure, essential for maintaining the biomechanical properties of the scaffold. TGA highlighted significant protein loss at higher SDS concentrations, reflecting ECM degradation. These findings underscore the importance of selecting detergent concentrations that effectively decellularize tissues without compromising ECM structural integrity. Rheological assessments demonstrated favorable gelation kinetics and mechanical stability in dUECM hydrogels, supporting the production of scaffolds suitable for 3D bioprinting applications [65,66].
Incorporating dUECM into alginate-based hydrogels significantly enhanced their bioactivity. Alginate, while offering excellent chemical and mechanical stability, lacks inherent cell-binding sites, limiting its effectiveness in tissue engineering applications [67]. The addition of dUECM introduces bioactive cues that promote cellular adhesion and proliferation, addressing this limitation.
Building on the success of decellularization, we developed hybrid hydrogels incorporating alginate and dUECM to address the unique challenges of uterine tissue engineering. The uterus presents unique challenges for tissue engineering due to its complex structure and dynamic physiological functions. A successful scaffold must replicate the mechanical properties, support cellular activities, and accommodate the cyclical changes characteristic of uterine tissue. Our findings suggest that hybrid hydrogels incorporating dUECM and alginate can meet these requirements, offering a balance between structural support and bioactivity [65].
For the first time, the hTERT-HM cell line was tested on a bioactive, alginate/tissue-specific ECM-based hydrogel to evaluate its viability and proliferation. The results of the MTT and live/dead assays demonstrated the superior bioactivity of the hybrid hydrogel, particularly the 3% Alg + 1.5% dUECM composition, which consistently outperformed all other tested groups. This composition provided a biologically favorable microenvironment, supporting high cell viability and active proliferation while significantly minimizing cell death over time. Fluorescence microscopy findings confirmed enhanced cellular attachment and growth, further highlighting the hydrogel's bioactivity.
The spindle-shaped hTERT-HM displayed parallel alignment and a tendency to form a layered and interwoven architecture, effectively mimicking the native uterine environment. This organization suggests that the cells are well-proliferated and responsive to mechanical and biochemical cues, such as ECM components like collagen or laminin, as well as substrate topography [2]. These findings indicate the critical role of cellular mechanosensing in guiding alignment, reflecting their function in uterine tissue remodeling and contractility. This behavior closely mirrors native tissue organization, establishing the potential of this model for uterine tissue engineering and drug screening.
These results align with findings from previous studies, such as Heidari et al. [29,68], who demonstrated the potential of hTERT cells for recellularizing decellularized myometrial tissue. However, their study used inert wool glass 3D meshes, which lacked suitability for tissue engineering applications [68]. In contrast, the bioactive alginate/dUECM hydrogel not only supports cell attachment but also actively enhances proliferation and viability, offering a more functional platform for uterine tissue reconstruction.
The integration of hTERT cells with bioactive hydrogels like 3% Alg + 1.5% dUECM demonstrates significant potential for advancing uterine tissue engineering. Broader applications include disease modeling, such as investigating fibroids and adenomyosis, and drug screening to evaluate new therapies [69]. For instance, Busch et al. found that incorporating low-viscosity ECM facilitates the formation of 3D tri-cultures with uterine-like organization, emphasizing the importance of ECM-based systems in mimicking native tissue structures [70]. Additionally, the bioactivity of dUECM-containing hydrogels offers opportunities to study ECM remodeling and cell-matrix interactions under various pathological conditions. Functional validation through gene expression, protein analysis, and contraction studies will further establish their applicability in translational medicine [71].
Uterine tissue engineering aims to develop functional grafts for uterine factor infertility or defects [72,73]. By leveraging the inherent properties of dUECM, the alginate + dUECM hydrogels demonstrate significant potential to address unmet needs in uterine tissue engineering and regenerative medicine. These findings underscore the critical importance of balancing decellularization efficiency with ECM preservation and highlight the transformative potential of our synthesized hydrogel as a clinically relevant scaffold.
5. Conclusions
The fabrication of functional uterine tissue constructs remains limited by the lack of biomaterials that are both biologically instructive and mechanically suitable for 3D printing. While dUECM offers promising bioactivity, it is not printable in its native form. Moreover, traditional multi-step decellularization methods are inefficient and can compromise ECM quality.
In this study, we developed a one-step decellularization protocol using 1% Triton™ X-100 and 1% SDS for 48 hours. This approach effectively removed immunogenic cellular components while preserving key ECM molecules, eliminating the need for DNase and reducing processing time and chemical exposure. To enable 3D bioprinting, dUECM was blended with alginate, a polymer valued for its printability and mild crosslinking, to form a composite hydrogel.
Among the formulations tested, 3% alginate with 1.5% dUECM exhibited the best performance in terms of printability, mechanical integrity, and degradation stability. In vitro studies using casted hydrogels showed that hTERT-HM cells remained viable, proliferated significantly, and displayed elongated morphology indicative of uterine smooth muscle behavior.
In conclusion, this study demonstrates that the optimized decellularization protocol can efficiently preserve the biofunctionality of uterine ECM, and that the resulting dUECM–alginate hydrogel supports key structural and cellular features necessary for uterine tissue engineering. Together, these findings lay the groundwork for future development of patient-specific, biofabricated uterine constructs for medical applications.
Credit Authors Statement
AFAY: Writing–review and editing, Writing–original draft, Visualization, Validation, Software, Methodology, Investigation, Formal Analysis, Data curation, Conceptualization. KT: Writing–review and editing, Validation, Methodology, Conceptualization. ME: Writing–review and editing, Software, Formal Analysis, Data curation. LB: Data curation VS: Writing–review and editing, Data Curation. BA: Resources. DJM: Writing–review and editing, Validation, Resources. IB: Writing–review and editing, Validation, Supervision, Resources, Funding acquisition. XC: Writing–review and editing, Validation, Supervision, Resources, Project administration, Funding acquisition.
Funding
The author(s) declare that financial support was received for the research, authorship, and/or publication of this article. The support from the Natural Sciences and Engineering Research Council (NSERC) of Canada (Funding Numbers: RGPIN 06369-2019 and 2020-05315) and the University of Saskatchewan’s Devolved Scholarship to the present work is acknowledged.
Acknowledgements
The author sincerely acknowledges Dr. Ewa I. Miskiewicz for her exceptional expertise, generous training, and unwavering support in the laboratory, which have been invaluable to this research. Special thanks to BioRender.com for providing access to their platform for graphical illustrations. The author also extends deep gratitude to Dr. Amin Babaei-Ghazvini for his invaluable training on FTIR, TGA, and the tensile machine, as well as his insightful guidance on sample analysis. Additionally, heartfelt appreciation is given to the Institut Catholique des Arts et Métiers (ICAM), France, and its intern students, Alex Guinle and Marius Pannetier, for their assistance in the tissue engineering lab and significant contributions to the 3D-printing experiments.
Data availability statement
The raw data supporting the conclusions of this article will be made available by the authors, without undue reservation.
References
- Ana Pilar, B.; Jiangfeng, Y.; Ann-Beth, M.; João Paulo, S.; Jun, Z. Trends and projections of caesarean section rates: Global and regional estimates. BMJ Global Health 2021, 6, e005671. [Google Scholar] [CrossRef]
- Hanuman, S.; Pande, G.; Nune, M. Current status and challenges in uterine myometrial tissue engineering. Bioengineered 2023, 14, 2251847. [Google Scholar] [CrossRef] [PubMed]
- Tahermanesh, K.; Hanjani, S.; Saadat Mostafavi, S.R.; Shahriyari, R.; Fazel Anvari-Yazdi, A.; Karimi-Zarchi, M.; Samimi, M.; Karimi, A.; Allahqoli, L.; Alkatout, I. Hourglass cesarean scar: A neglected external niche in association with the internal niche. International Journal of Gynecology & Obstetrics 2022, 157, 478–480. [Google Scholar] [CrossRef]
- Francés-Herrero, E.; Lopez, R.; Hellström, M.; de Miguel-Gómez, L.; Herraiz, S.; Brännström, M.; Pellicer, A.; Cervelló, I. Bioengineering trends in female reproduction: A systematic review. Human Reproduction Update 2022, 28, 798–837. [Google Scholar] [CrossRef]
- Fazel Anvari Yazdi, A.; Tahermanesh, K.; Ejlali, M.; Babaei-Ghazvini, A.; Acharya, B.; Badea, I.; MacPhee, D.J.; Chen, X. Comparative analysis of porcine-uterine decellularization for bioactive-molecule preservation and DNA removal. Frontiers in Bioengineering and Biotechnology 2024, 12, 1418034. [Google Scholar] [CrossRef]
- Chen, D.X. Extrusion bioprinting of scaffolds: An introduction. In Extrusion Bioprinting of Scaffolds for Tissue Engineering, Springer: 2024; pp. 1–15.
- Hynes, R.O.; Naba, A. Overview of the matrisome—An inventory of extracellular matrix constituents and functions. Cold Spring Harbor perspectives in biology 2012, 4, a004903. [Google Scholar] [CrossRef]
- Kasravi, M.; Ahmadi, A.; Babajani, A.; Mazloomnejad, R.; Hatamnejad, M.R.; Shariatzadeh, S.; Bahrami, S.; Niknejad, H. Immunogenicity of decellularized extracellular matrix scaffolds: A bottleneck in tissue engineering and regenerative medicine. Biomaterials Research 2023, 27, 10. [Google Scholar] [CrossRef]
- Fazel Anvari Yazdi, A.; Tahermanesh, K.; Ejlali, M.; Babaei-Ghazvini, A.; Acharya, B.; Badea, I.; MacPhee, D.J.; Chen, X. Comparative analysis of porcine-uterine decellularization for bioactive-molecule preservation and DNA removal. Frontiers in Bioengineering and Biotechnology 2024, 12. [Google Scholar] [CrossRef]
- Yunoki, S.; Matsuda, T. Simultaneous Processing of Fibril Formation and Cross-Linking Improves Mechanical Properties of Collagen. Biomacromolecules 2008, 9, 879–885. [Google Scholar] [CrossRef]
- McInnes, A.D.; Moser, M.A.; Chen, X. Preparation and use of decellularized extracellular matrix for tissue engineering. Journal of functional biomaterials 2022, 13, 240. [Google Scholar] [CrossRef]
- Choudhury, D.; Yee, M.; Sheng, Z.L.J.; Amirul, A.; Naing, M.W. Decellularization systems and devices: State-of-the-art. Acta Biomaterialia 2020, 115, 51–59. [Google Scholar] [CrossRef] [PubMed]
- Wilson, G.J.; Courtman, D.W.; Klement, P.; Michael Lee, J.; Yeger, H. Acellular matrix: A biomaterials approach for coronary artery bypass and heart valve replacement. The Annals of Thoracic Surgery 1995, 60, S353–S358. [Google Scholar] [CrossRef] [PubMed]
- Cartmell, J.S.; Dunn, M.G. Effect of chemical treatments on tendon cellularity and mechanical properties. Journal of Biomedical Materials Research 2000, 49, 134–140. [Google Scholar] [CrossRef]
- Gilbert, T.W.; Sellaro, T.L.; Badylak, S.F. Decellularization of tissues and organs. Biomaterials 2006, 27, 3675–3683. [Google Scholar] [CrossRef]
- Mendibil, U.; Ruiz-Hernandez, R.; Retegi-Carrion, S.; Garcia-Urquia, N.; Olalde-Graells, B.; Abarrategi, A. Tissue-specific decellularization methods: Rationale and strategies to achieve regenerative compounds. International journal of molecular sciences 2020, 21, 5447. [Google Scholar] [CrossRef]
- Crapo, P.M.; Gilbert, T.W.; Badylak, S.F. An overview of tissue and whole organ decellularization processes. Biomaterials 2011, 32, 3233–3243. [Google Scholar] [CrossRef]
- Santoso, E.G.; Yoshida, K.; Hirota, Y.; Aizawa, M.; Yoshino, O.; Kishida, A.; Osuga, Y.; Saito, S.; Ushida, T.; Furukawa, K.S. Application of detergents or high hydrostatic pressure as decellularization processes in uterine tissues and their subsequent effects on in vivo uterine regeneration in murine models. PLoS ONE 2014, 9, e103201. [Google Scholar] [CrossRef]
- Campo, H.; Baptista, P.M.; López-Pérez, N.; Faus, A.; Cervelló, I.; Simón, C. De-and recellularization of the pig uterus: A bioengineering pilot study. Biology of Reproduction 2017, 96, 34–45. [Google Scholar] [CrossRef]
- Sargazi, Z.; Zavareh, S.; Jafarabadi, M.; Salehnia, M. An efficient protocol for decellularization of the human endometrial fragments for clinical usage. Progress in Biomaterials 2021, 10, 119–130. [Google Scholar] [CrossRef]
- Almeida, G.H.D.R.; Gibin, M.S.; Rinaldi, J.d.C.; Gonzaga, V.H.d.S.; Thom, C.R.; Iglesia, R.P.; da Silva, R.S.; Fernandes, I.C.; Bergamo, R.O.; Lima, L.S.; et al. Development and Biocompatibility Assessment of Decellularized Porcine Uterine Extracellular Matrix-Derived Grafts. Tissue Engineering Part C: Methods 2024, 30, 569–589. [Google Scholar] [CrossRef]
- Arezoo, N.; Mohammad, H.; Malihezaman, M. Tissue engineering of mouse uterus using menstrual blood stem cells (MenSCs) and decellularized uterine scaffold. Stem Cell Research & Therapy 2021, 12, 1–12. [Google Scholar] [CrossRef]
- Sehic, E.; Brännström, M.; Hellström, M. Progress in Preclinical Research on Uterus Bioengineering That Utilizes Scaffolds Derived from Decellularized Uterine Tissue. Biomedical Materials & Devices 2023, 1, 66–73. [Google Scholar] [CrossRef]
- Golebiowska, A.A.; Intravaia, J.T.; Sathe, V.M.; Kumbar, S.G.; Nukavarapu, S.P. Decellularized extracellular matrix biomaterials for regenerative therapies: Advances, challenges and clinical prospects. Bioactive Materials 2024, 32, 98–123. [Google Scholar] [CrossRef]
- Gorroñogoitia, I.; Urtaza, U.; Zubiarrain-Laserna, A.; Alonso-Varona, A.; Zaldua, A.M. A Study of the Printability of Alginate-Based Bioinks by 3D Bioprinting for Articular Cartilage Tissue Engineering. Polymers 2022, 14, 354. [Google Scholar] [CrossRef]
- Li, N.; Duan, X.; Ding, X.F.; Zhu, N.; Chen, X. Characterization of hydrogel-scaffold mechanical properties and microstructure by using synchrotron propagation-based imaging. Journal of the Mechanical Behavior of Biomedical Materials 2025, 163, 106844. [Google Scholar] [CrossRef]
- Alizadeh Sardroud, H.; Rosa, G.D.S.; Dust, W.; Cham, T.-C.; Roy, G.; Bater, S.; Chicoine, A.; Honaramooz, A.; Chen, X.; Eames, B.F. Comparison study on hyaline cartilage versus fibrocartilage formation in a pig model by using 3D-bioprinted hydrogel and hybrid constructs. Biofabrication 2025, 17, 015014. [Google Scholar] [CrossRef]
- Leonardo, M.; Prajatelistia, E.; Judawisastra, H. Alginate-based bioink for organoid 3D bioprinting: A review. Bioprinting 2022, 28, e00246. [Google Scholar] [CrossRef]
- Heidari Kani, M.; Chan, E.-C.; Young, R.C.; Butler, T.; Smith, R.; Paul, J.W. 3D Cell Culturing and Possibilities for Myometrial Tissue Engineering. Annals of Biomedical Engineering 2017, 45, 1746–1757. [Google Scholar] [CrossRef]
- Condon, J.; Yin, S.; Mayhew, B.; Word, R.A.; Wright, W.; Shay, J.; Rainey, W.E. Telomerase immortalization of human myometrial cells. Biology of reproduction 2002, 67, 506–514. [Google Scholar] [CrossRef]
- Mehdizadeh, K.A.; Tahermanesh, K.; Chaichian, S.; Joghataei, M.T.; Moradi, F.; Tavangar, S.M.; Mousavi, N.A.S.; Lotfibakhshaiesh, N.; Pour, B.S.; Fazel, A.Y.A. How to prepare biological samples and live tissues for scanning electron microscopy (SEM). 2014. [CrossRef]
- Mehdizadehkashi, A.; Tahermanesh, K.; Anvari-Yazdi, A.F.; Chaichian, S.; Azarpira, N.; Nobakht, M.; Abed, S.M.; Hashemi, N. Ultrastructural investigation of pelvic peritoneum in patients with chronic pelvic pain and subtle endometriosis in association with chromoendoscopy. Journal of Minimally Invasive Gynecology 2017, 24, 114–123. [Google Scholar] [CrossRef]
- Voytik-Harbin, S.L.; Brightman, A.O.; Waisner, B.Z.; Robinson, J.P.; Lamar, C.H. Small intestinal submucosa: A tissue-derived extracellular matrix that promotes tissue-specific growth and differentiation of cells in vitro. Tissue engineering 1998, 4, 157–174. [Google Scholar] [CrossRef]
- Pati, F.; Jang, J.; Ha, D.-H.; Won Kim, S.; Rhie, J.-W.; Shim, J.-H.; Kim, D.-H.; Cho, D.-W. Printing three-dimensional tissue analogues with decellularized extracellular matrix bioink. Nature Communications 2014, 5, 3935. [Google Scholar] [CrossRef] [PubMed]
- Ketabat, F.; Maris, T.; Duan, X.; Yazdanpanah, Z.; Kelly, M.E.; Badea, I.; Chen, X. Optimization of 3D printing and in vitro characterization of alginate/gelatin lattice and angular scaffolds for potential cardiac tissue engineering. Frontiers in Bioengineering and Biotechnology 2023, 11. [Google Scholar] [CrossRef] [PubMed]
- Carney, S.A.; Tahara, H.; Swartz, C.D.; Risinger, J.I.; He, H.; Moore, A.B.; Haseman, J.K.; Barrett, J.C.; Dixon, D. Immortalization of Human Uterine Leiomyoma and Myometrial Cell Lines After Induction of Telomerase Activity: Molecular and Phenotypic Characteristics. Laboratory Investigation 2002, 82, 719–728. [Google Scholar] [CrossRef]
- Scholze, M.; Singh, A.; Lozano, P.F.; Ondruschka, B.; Ramezani, M.; Werner, M.; Hammer, N. Utilization of 3D printing technology to facilitate and standardize soft tissue testing. Scientific Reports 2018, 8, 11340. [Google Scholar] [CrossRef]
- Fadare, O.; Roma, A.A. Normal Histology of the Uterine Corpus. In Atlas of Uterine Pathology, Springer International Publishing: Cham, 2019; pp. 1–22. [CrossRef]
- de Campos Vidal, B.; Mello, M.L.S. Collagen type I amide I band infrared spectroscopy. Micron 2011, 42, 283–289. [Google Scholar] [CrossRef]
- Júnior, Z.S.S.; Botta, S.B.; Ana, P.A.; França, C.M.; Fernandes, K.P.S.; Mesquita-Ferrari, R.A.; Deana, A.; Bussadori, S.K. Effect of papain-based gel on type I collagen-spectroscopy applied for microstructural analysis. Scientific reports 2015, 5, 11448. [Google Scholar] [CrossRef]
- Hopkins, J.; Brenner, L.; Tumosa, C. Variation of the amide I and amide II peak absorbance ratio in human hair as measured by Fourier transform infrared spectroscopy. Forensic science international 1991, 50, 61–65. [Google Scholar] [CrossRef]
- Júnior, Z.S.S.; Botta, S.B.; Ana, P.A.; França, C.M.; Fernandes, K.P.S.; Mesquita-Ferrari, R.A.; Deana, A.; Bussadori, S.K. Effect of papain-based gel on type I collagen - spectroscopy applied for microstructural analysis. Scientific Reports 2015, 5, 11448. [Google Scholar] [CrossRef]
- Cárcamo, J.J.; Aliaga, A.E.; Clavijo, R.E.; Brañes, M.R.; Campos-Vallette, M.M. Raman study of the shockwave effect on collagens. Spectrochimica Acta Part A: Molecular and Biomolecular Spectroscopy 2012, 86, 360–365. [Google Scholar] [CrossRef]
- France, C.A.M.; Thomas, D.B.; Doney, C.R.; Madden, O. FT-Raman spectroscopy as a method for screening collagen diagenesis in bone. Journal of Archaeological Science 2014, 42, 346–355. [Google Scholar] [CrossRef]
- Cárcamo-Vega, J.J.; Brañes, M.R.; Loske, A.M.; Campos-Vallette, M.M. The influence of the number of shock waves and the energy flux density on the Raman spectrum of collagen type I from rat. Shock Waves 2020, 30, 201–214. [Google Scholar] [CrossRef]
- Bergholt, M.S.; Serio, A.; Albro, M.B. Raman Spectroscopy: Guiding Light for the Extracellular Matrix. Frontiers in Bioengineering and Biotechnology 2019, 7. [Google Scholar] [CrossRef]
- Takahashi, Y.; Sugano, N.; Takao, M.; Sakai, T.; Nishii, T.; Pezzotti, G. Raman spectroscopy investigation of load-assisted microstructural alterations in human knee cartilage: Preliminary study into diagnostic potential for osteoarthritis. Journal of the mechanical behavior of biomedical materials 2014, 31, 77–85. [Google Scholar] [CrossRef]
- Unal, M.; Akkus, O. Raman spectral classification of mineral-and collagen-bound water's associations to elastic and post-yield mechanical properties of cortical bone. Bone 2015, 81, 315–326. [Google Scholar] [CrossRef]
- Dong, R.; Yan, X.; Pang, X.; Liu, S. Temperature-dependent Raman spectra of collagen and DNA. Spectrochimica Acta Part A: Molecular and Biomolecular Spectroscopy 2004, 60, 557–561. [Google Scholar] [CrossRef]
- Xiao, J. Raman Detection of Collagen Biomarkers. In Collagen Mimetic Peptides and Their Biophysical Characterization, Springer Nature Singapore: Singapore, 2024; pp. 175–189. [CrossRef]
- McColl, I.H.; Blanch, E.W.; Gill, A.C.; Rhie, A.G.; Ritchie, M.A.; Hecht, L.; Nielsen, K.; Barron, L.D. A new perspective on β-sheet structures using vibrational Raman optical activity: From poly (L-lysine) to the prion protein. Journal of the American Chemical Society 2003, 125, 10019–10026. [Google Scholar] [CrossRef]
- Madzharova, F.; Heiner, Z.; Kneipp, J. Surface enhanced hyper-Raman scattering of the amino acids tryptophan, histidine, phenylalanine, and tyrosine. The Journal of Physical Chemistry C 2017, 121, 1235–1242. [Google Scholar] [CrossRef]
- Mitra, S.; Werling, K.; Berquist, E.J.; Lambrecht, D.S.; Garrett-Roe, S. CH mode mixing determines the band shape of the carboxylate symmetric stretch in Apo-EDTA, Ca2+–EDTA, and Mg2+–EDTA. The Journal of Physical Chemistry A 2021, 125, 4867–4881. [Google Scholar] [CrossRef]
- Chamberlain, L.J.; Yannas, I.V.; Hsu, H.P.; Strichartz, G.; Spector, M. Collagen-GAG Substrate Enhances the Quality of Nerve Regeneration through Collagen Tubes up to Level of Autograft. Experimental Neurology 1998, 154, 315–329. [Google Scholar] [CrossRef]
- Fernández-Galiana, Á.; Bibikova, O.; Vilms Pedersen, S.; Stevens, M.M. Fundamentals and Applications of Raman-Based Techniques for the Design and Development of Active Biomedical Materials. Advanced Materials 2024, 36, 2210807. [Google Scholar] [CrossRef] [PubMed]
- Freitas, A.; Aroso, M.; Barros, A.; Fernández, M.; Conde-Sousa, E.; Leite, M.; Carvalho, E.; Ribeiro, C.; Ferreira, R.; Pêgo, A. Characterization of the Striatal Extracellular Matrix in a Mouse Model of Parkinson’s Disease. Antioxidants 2021, 10, 1095. [Google Scholar] [CrossRef] [PubMed]
- Pecul, M.; Deillon, C.; Thorvaldsen, A.J.; Ruud, K. The aqueous Raman optical activity spectra of 4(R)-hydroxyproline: Theory and experiment. Journal of Raman Spectroscopy 2010, 41, 1200–1210. [Google Scholar] [CrossRef]
- Ye, H.; Rahul; Kruger, U.; Wang, T.; Shi, S.; Norfleet, J.; De, S. Burn-related Collagen Conformational Changes in ex vivo Porcine Skin using Raman Spectroscopy. Scientific Reports 2019, 9, 19138. [CrossRef]
- Movasaghi, Z.; Rehman, S.; Rehman, I.U. Raman Spectroscopy of Biological Tissues. Applied Spectroscopy Reviews 2007, 42, 493–541. [Google Scholar] [CrossRef]
- Campo, H.; López-Martínez, S.; Cervelló, I. Decellularization Methods of Uterus in Tissue Engineering. In Decellularization Methods of Tissue and Whole Organ in Tissue Engineering, Kajbafzadeh, A.-M., Ed. Springer International Publishing: Cham, 2021; pp. 141–152. [CrossRef]
- Giorgi Filho, R.C.; Martinez Junior, A.M.; Calmon, M.F.; Tiera, M.J.; Alvares, D.S.; Agreli, G.; Nery, J.G. Physicochemical Decellularization of Bovine Pericardium: Effects on DNA Elimination, Extracellular Matrix Preservation, and Biocompatibility. Waste and Biomass Valorization 2024, 1–13. [Google Scholar] [CrossRef]
- Owoyomi, O.; Jide, I.; Akanni, M.; Soriyan, O.; Morakinyo, M. Interactions between sodium dodecylsulphate and Triton X-100: Molecular properties and kinetics investigations. J Appl Sci 2005, 5, 729–734. [Google Scholar] [CrossRef]
- Bergström, M.; Eriksson, J.C. A Theoretical Analysis of Synergistic Effects in Mixed Surfactant Systems. Langmuir 2000, 16, 7173–7181. [Google Scholar] [CrossRef]
- Denkova, P.S.; Van Lokeren, L.; Willem, R. Mixed Micelles of Triton X-100, Sodium Dodecyl Dioxyethylene Sulfate, and Synperonic L61 Investigated by NOESY and Diffusion Ordered NMR Spectroscopy. The Journal of Physical Chemistry B 2009, 113, 6703–6709. [Google Scholar] [CrossRef]
- Chen, X.B.; Fazel Anvari-Yazdi, A.; Duan, X.; Zimmerling, A.; Gharraei, R.; Sharma, N.K.; Sweilem, S.; Ning, L. Biomaterials / bioinks and extrusion bioprinting. Bioactive Materials 2023, 28, 511–536. [Google Scholar] [CrossRef]
- Gharraei, R.; Bergstrom, D.J.; Chen, X. Extrusion bioprinting from a fluid mechanics perspective. IJB 2024, 10. [Google Scholar] [CrossRef]
- Silva, R.; Singh, R.; Sarker, B.; Papageorgiou, D.G.; Juhasz, J.A.; Roether, J.A.; Cicha, I.; Kaschta, J.; Schubert, D.W.; Chrissafis, K. Hybrid hydrogels based on keratin and alginate for tissue engineering. Journal of Materials Chemistry B 2014, 2, 5441–5451. [Google Scholar] [CrossRef] [PubMed]
- Kani, M.H. Exploring Novel Application of Tissue Engineering Strategies to Human Myometrium. 2017.
- MacPhee, D.J.; Lye, S.J. Focal Adhesion Signaling in the Rat Myometrium Is Abruptly Terminated with the Onset of Labor1. Endocrinology 2000, 141, 274–283. [Google Scholar] [CrossRef]
- Busch, C.; Hill, C.J.; Paterson, K.; Mellin, R.; Zagnoni, M.; Hapangama, D.K.; Sandison, M.E. Functional, patient-derived 3D tri-culture models of the uterine wall in a microfluidic array. Human Reproduction 2024, 39, 2537–2550. [Google Scholar] [CrossRef] [PubMed]
- Bursztyn, L.; Eytan, O.; Jaffa, A.J.; Elad, D. Mathematical model of excitation-contraction in a uterine smooth muscle cell. American Journal of Physiology-Cell Physiology 2007, 292, C1816–C1829. [Google Scholar] [CrossRef]
- Sittadjody, S.; Criswell, T.; Jackson, J.D.; Atala, A.; Yoo, J.J. Regenerative Medicine Approaches in Bioengineering Female Reproductive Tissues. Reproductive Sciences 2021, 28, 1573–1595. [Google Scholar] [CrossRef]
- Hellström, M.; Bandstein, S.; Brännström, M. Uterine Tissue Engineering and the Future of Uterus Transplantation. Annals of Biomedical Engineering 2017, 45, 1718–1730. [Google Scholar] [CrossRef]
Figure 1.
Porcine uterine decellularization protocols with a flow diagram of decellularization protocols and techniques used to quantify the efficiency of decellularization procedures.
Figure 1.
Porcine uterine decellularization protocols with a flow diagram of decellularization protocols and techniques used to quantify the efficiency of decellularization procedures.
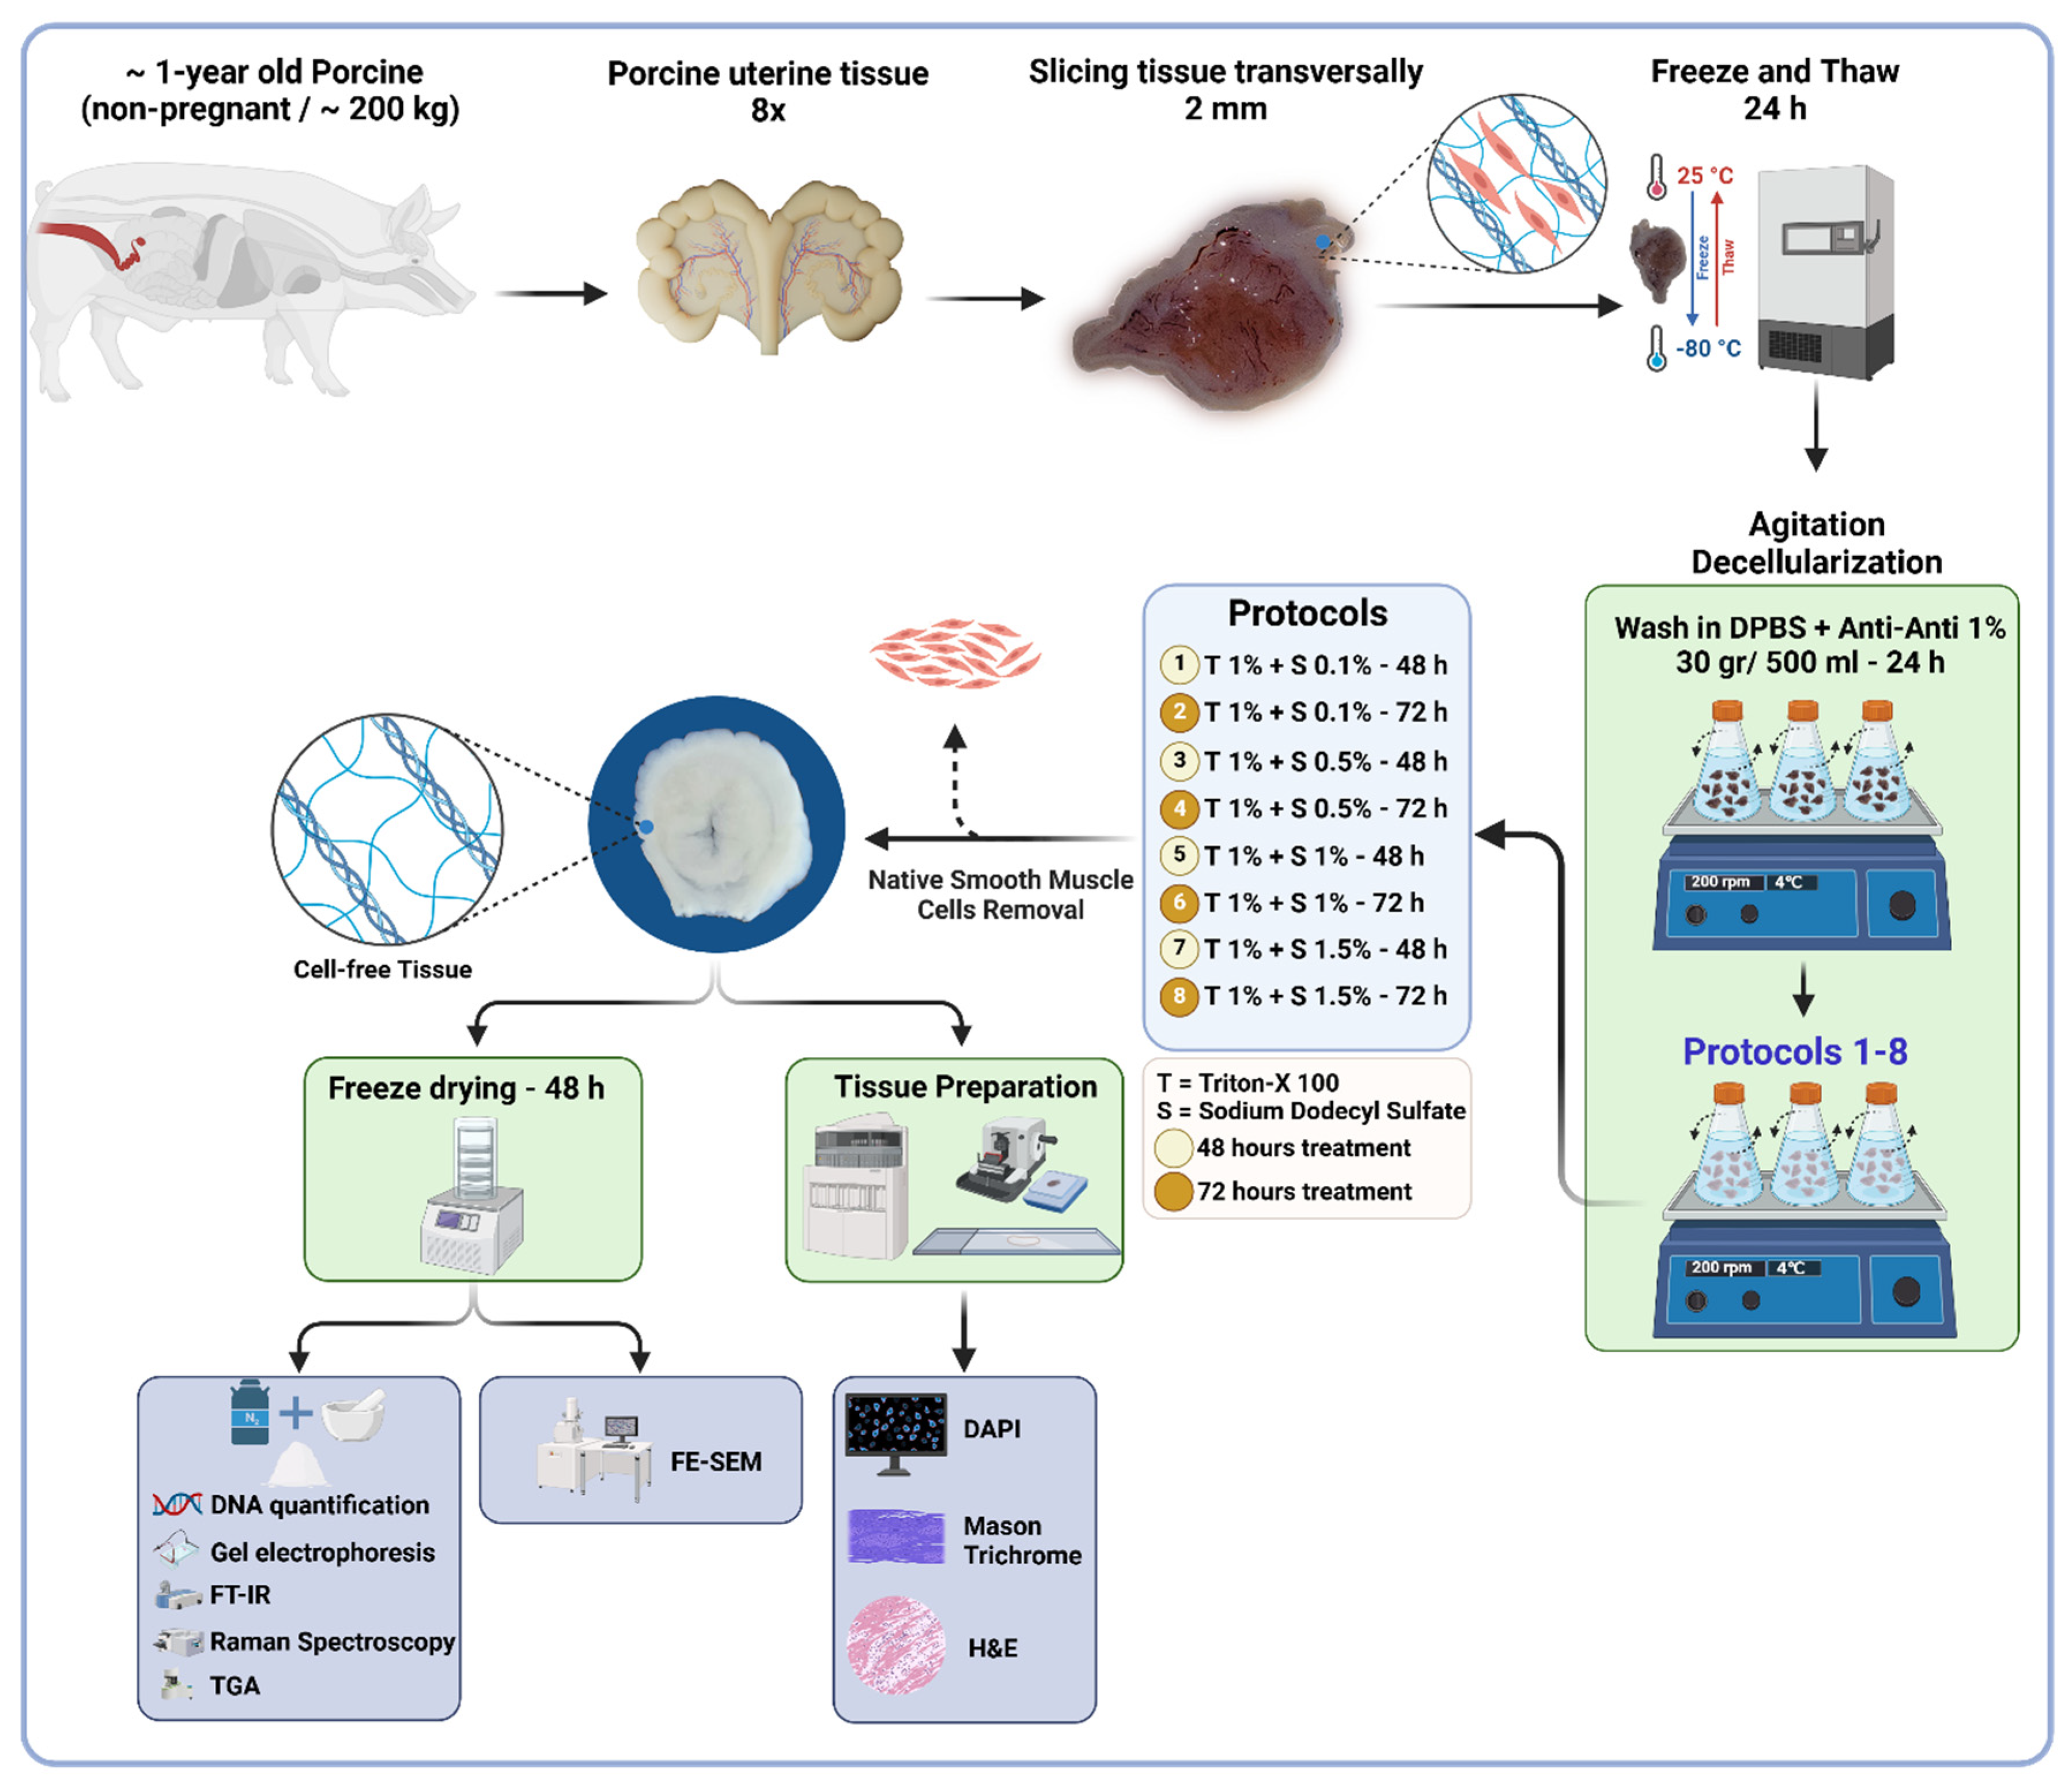
Figure 2.
Flow diagram of hydrogel ink preparation, hTERT-HM cell expansion, and seeding of the cells for MTT and Live/Dead assays.
Figure 2.
Flow diagram of hydrogel ink preparation, hTERT-HM cell expansion, and seeding of the cells for MTT and Live/Dead assays.
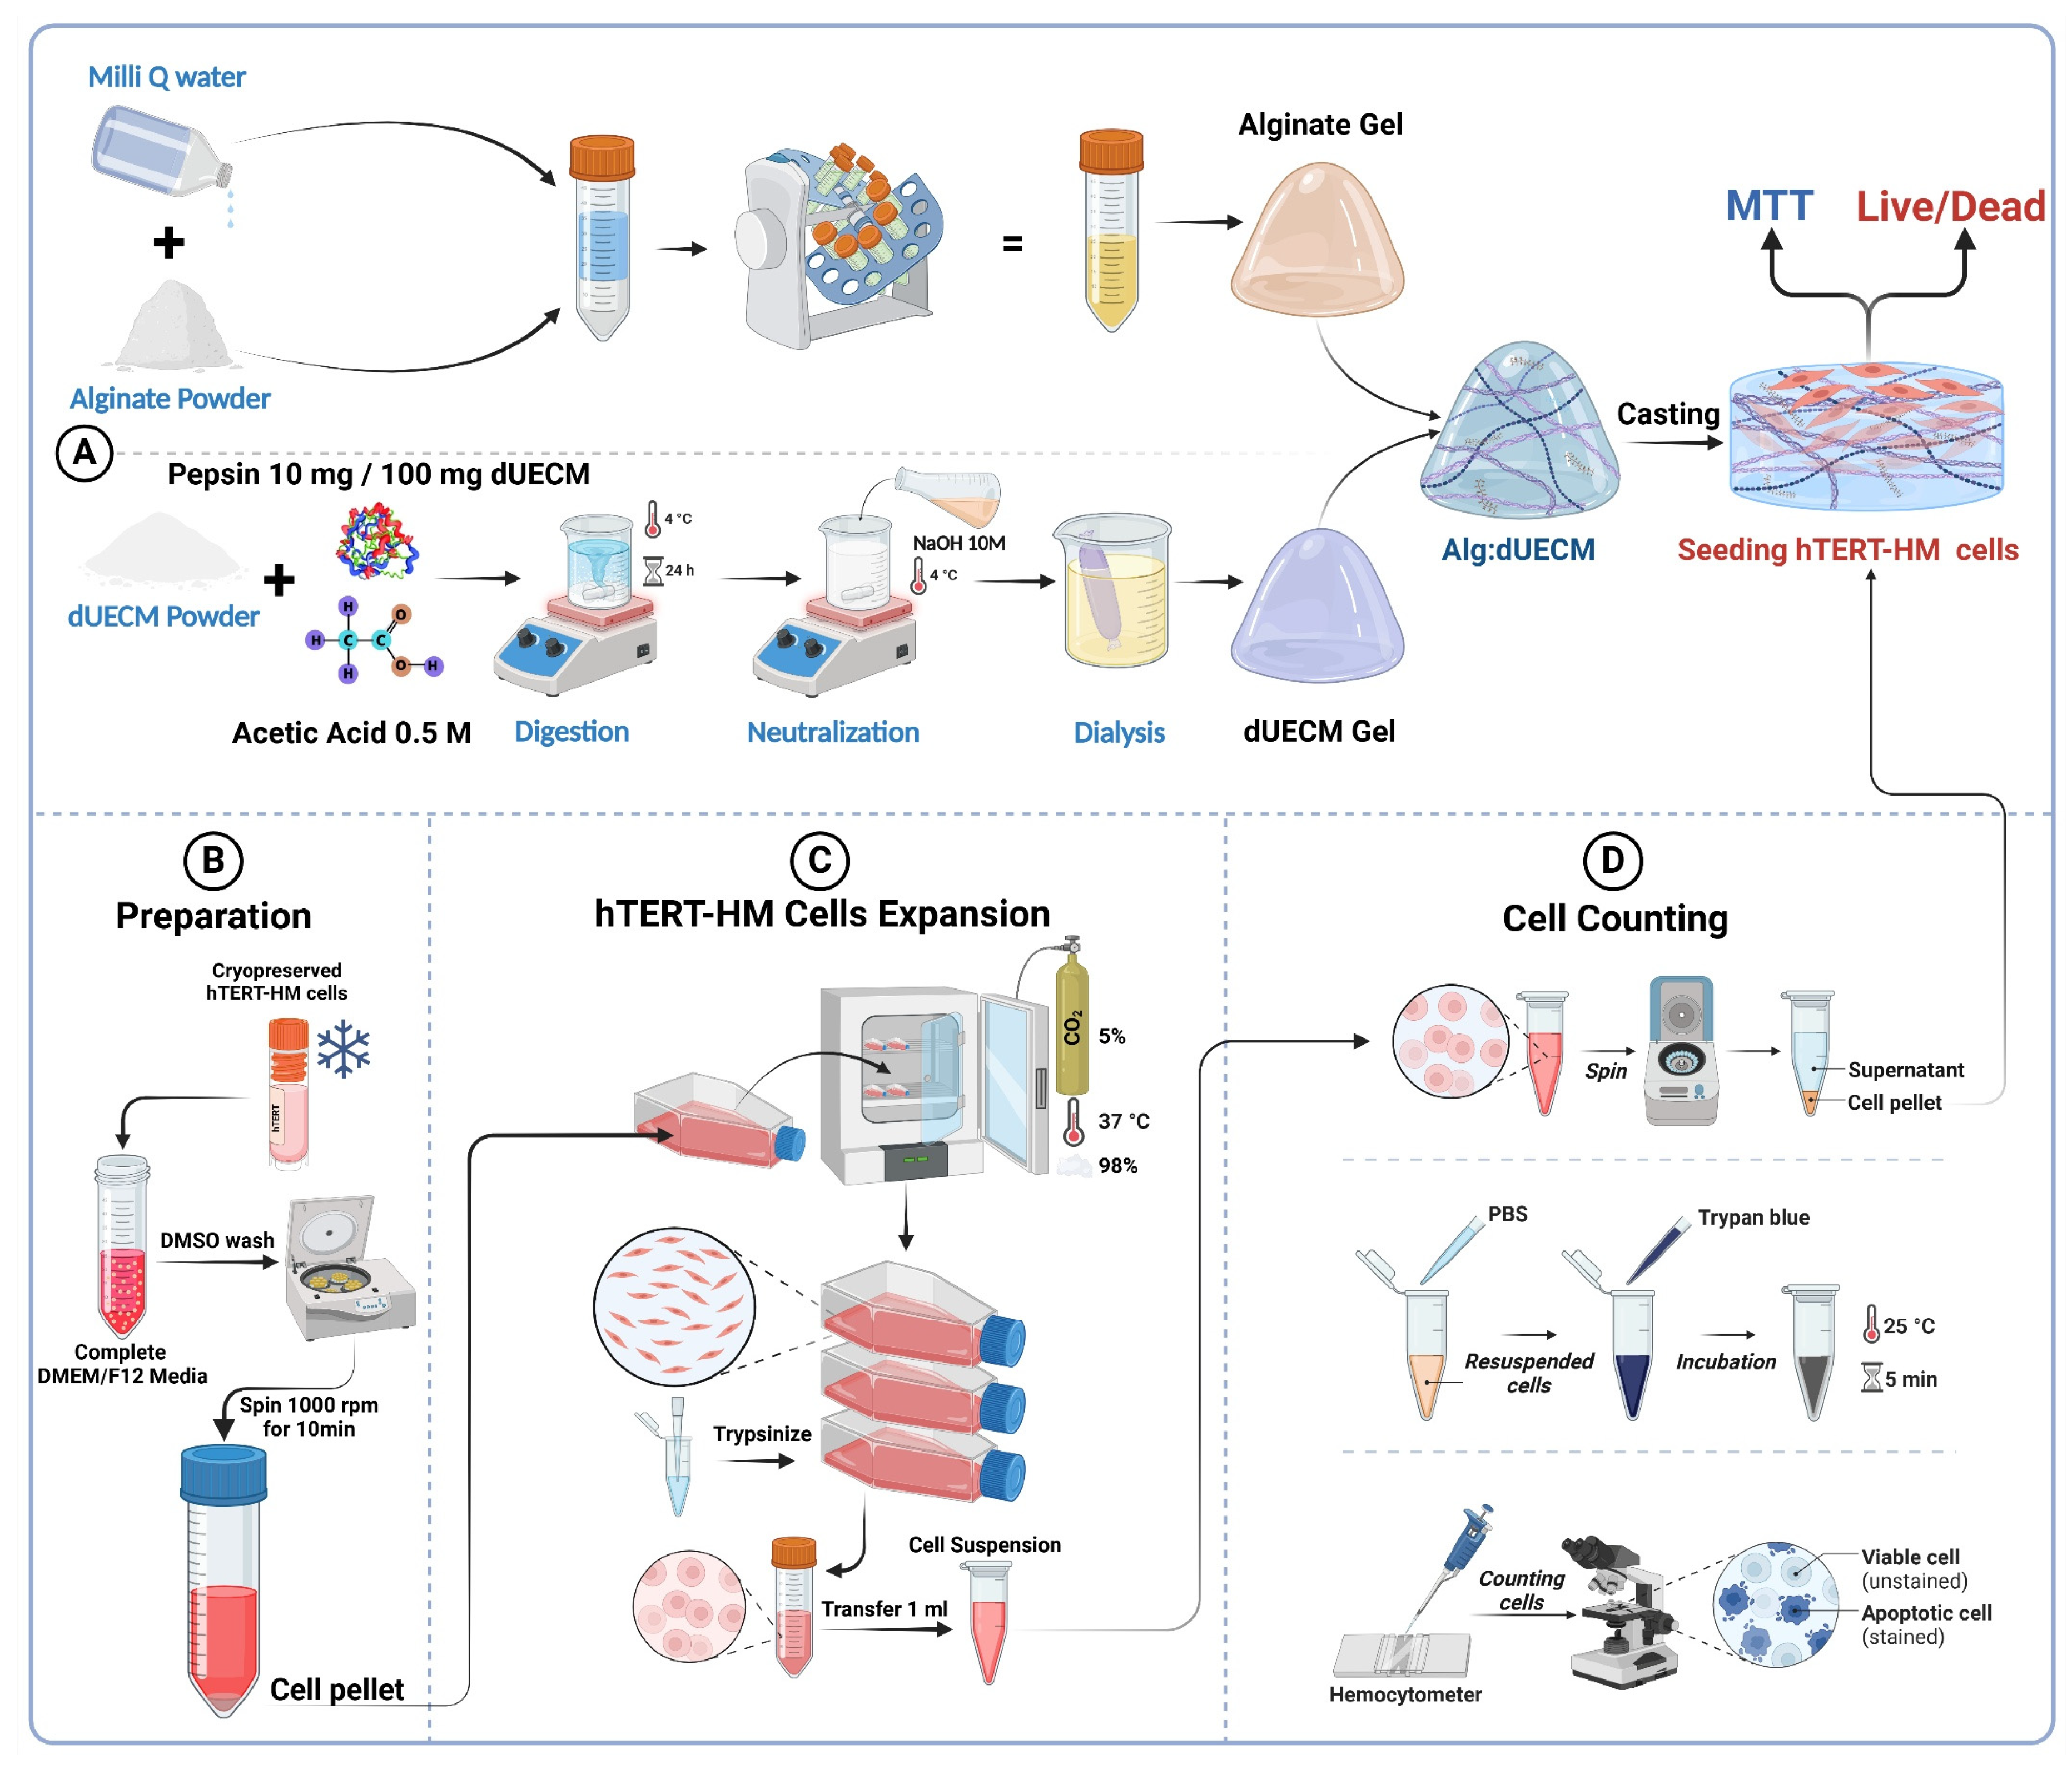
Figure 3.
Procedure of specimen cutting and mounting for tensile experiments.
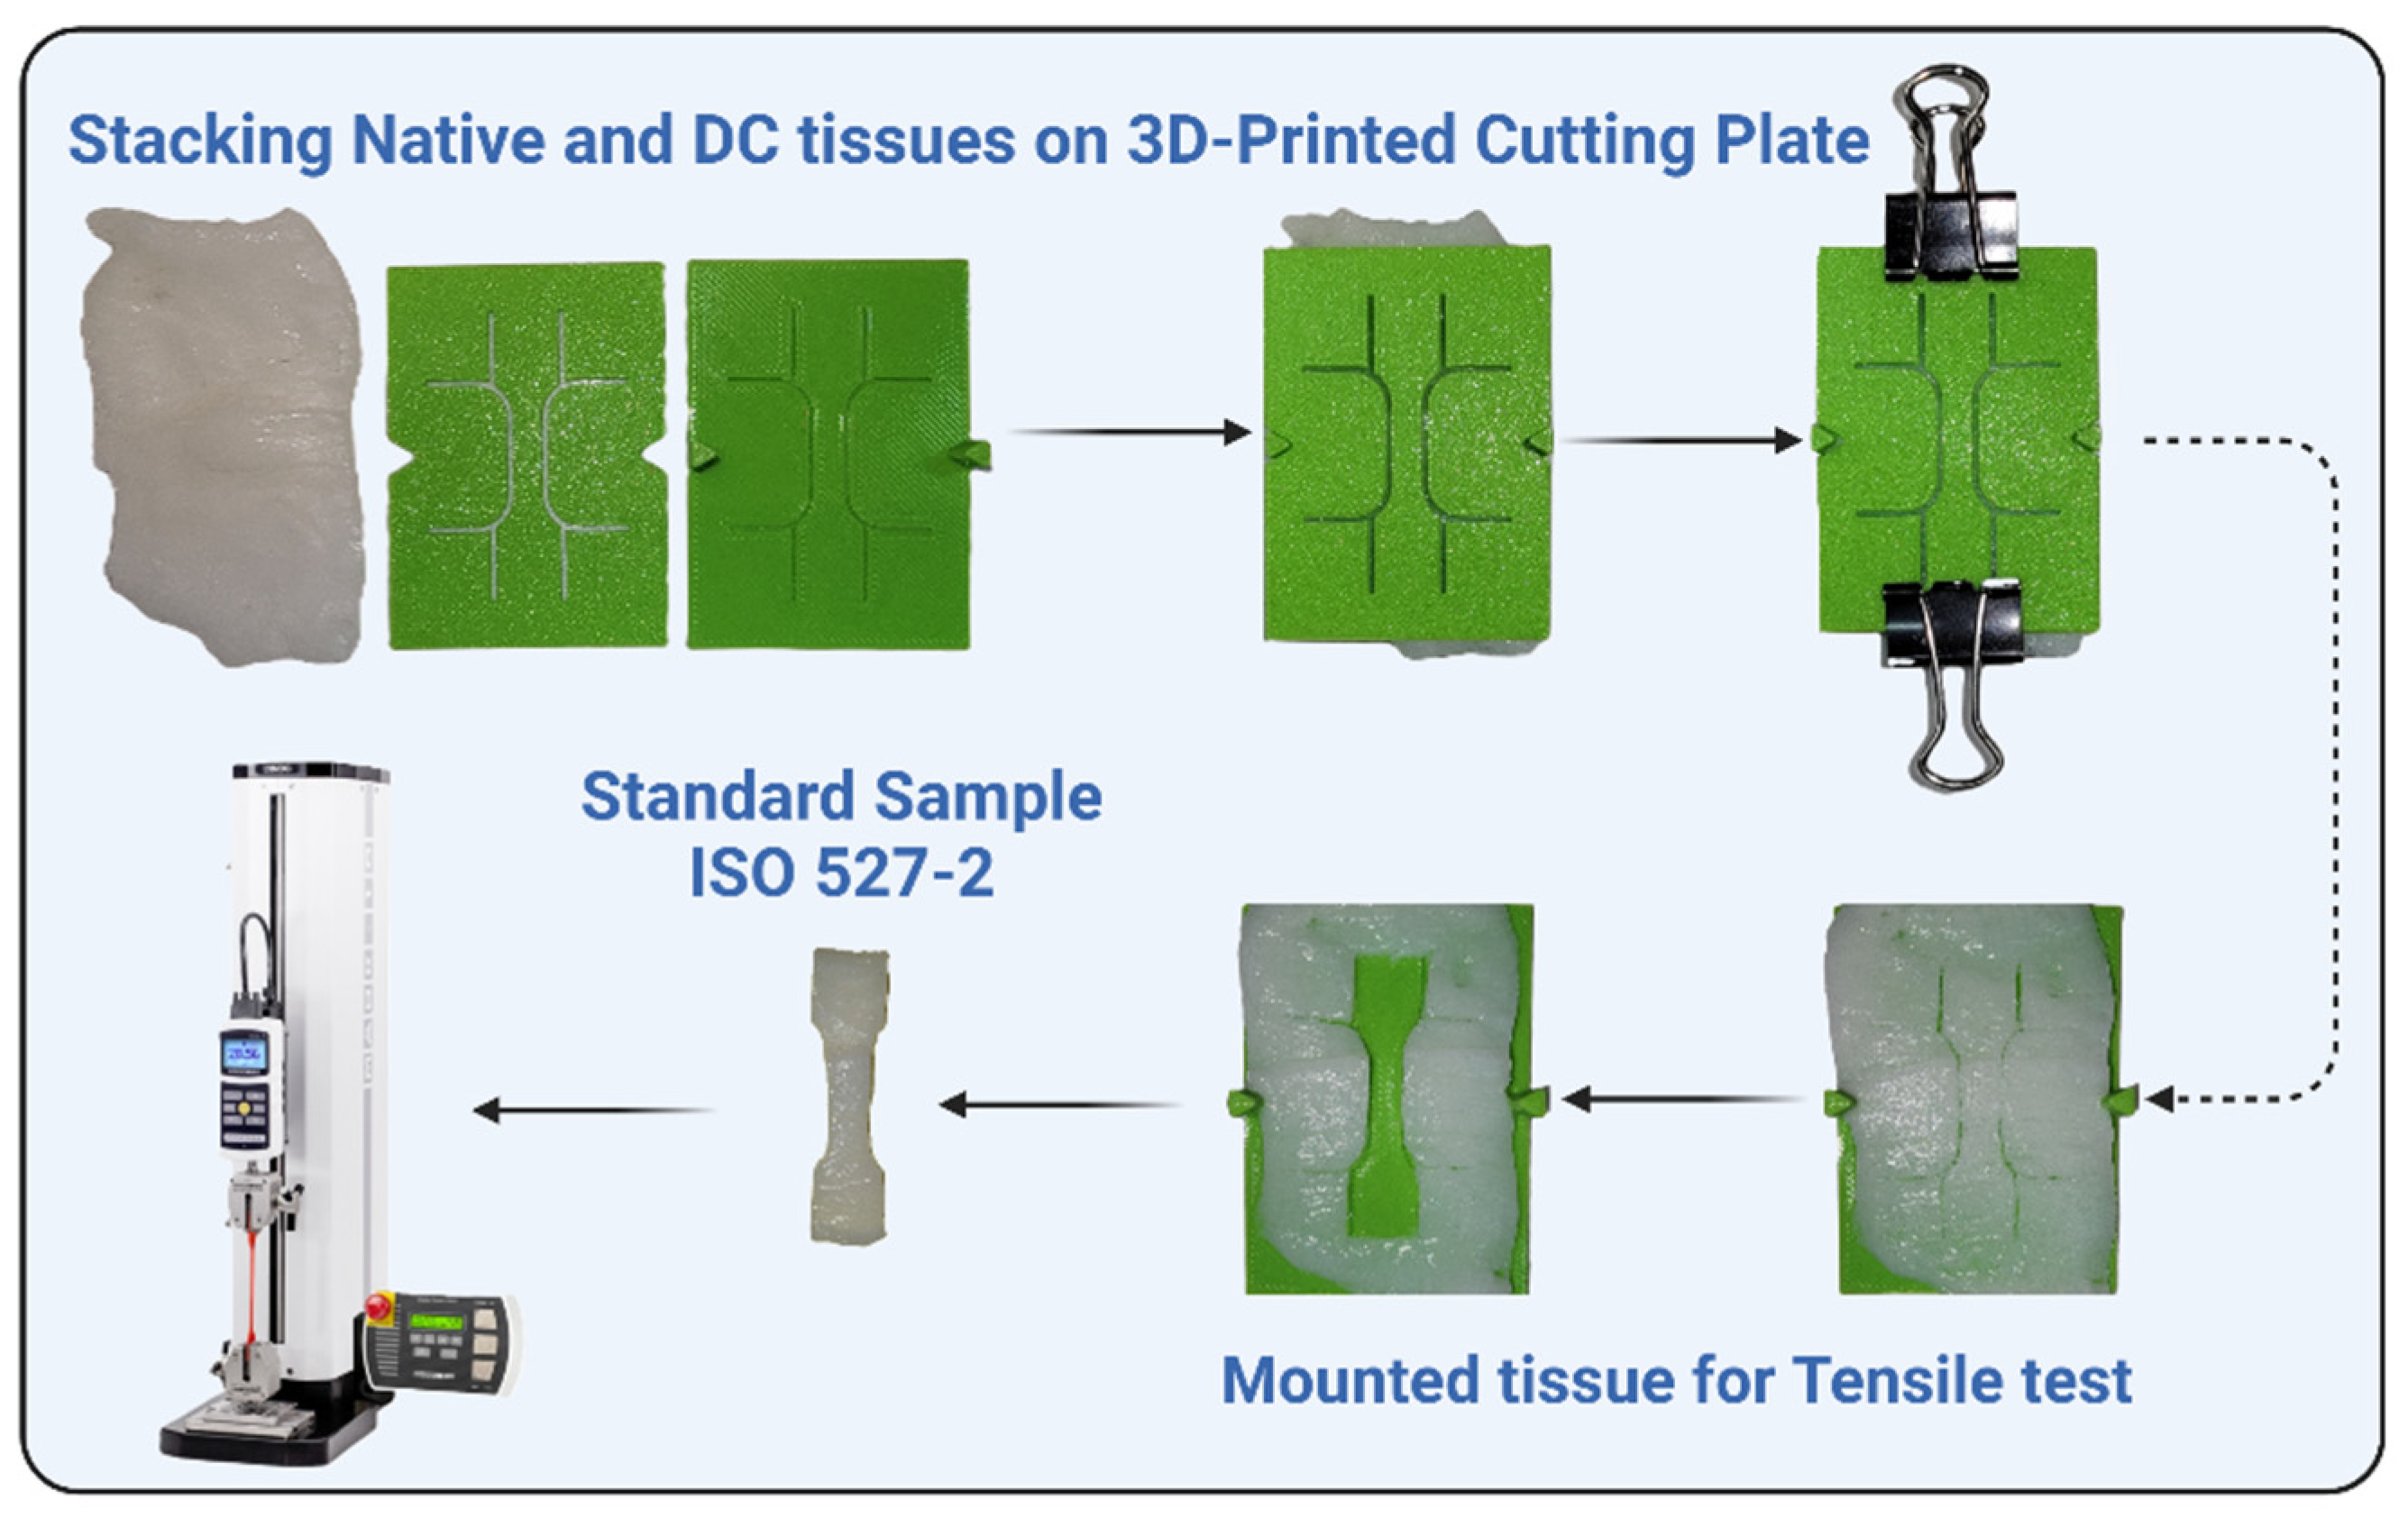
Figure 4.
DNA Quantification, Gel Electrophoresis, and GAG Assay of Decellularized Porcine Uterine Tissue. (A) DNA content was significantly reduced in decellularized samples compared to native tissue (9142.67 ± 26.63 ng/mg dry weight), with Triton 1% + SDS 1.5% (72 hours) achieving the lowest residual DNA (13.33 ± 12.86 ng/mg) and meeting the threshold of 50 ng/mg. (B) Gel electrophoresis showed high-molecular-weight DNA in native tissue and faint smears (100–400 bp) in Triton 1% + SDS 0.1% samples at 48 and 72 hours. No DNA was detected in SDS concentrations of 0.5% or higher. (C) GAG content in native tissue was 54.68 ± 4.38 µg/mg, with Triton 1% + SDS 0.1% and 0.5% retaining GAG levels at 48 hours. Higher SDS concentrations (1% and 1.5%) and longer exposure times led to significant GAG depletion, with Triton 1% + SDS 1.5% (72 hours) showing the lowest GAG content (29.75 ± 2.23 µg/mg).) GAG content in native tissue was 54.68 ± 4.38 µg/mg, with Triton 1% + SDS 0.1% and 0.5% retaining GAG levels at 48 hours. Higher SDS concentrations (1% and 1.5%) and longer exposure times led to significant GAG depletion, with Triton 1% + SDS 1.5% (72 hours) showing the lowest GAG content (29.75 ± 2.23 µg/mg). Statistical significance is indicated as follows: ns = not significant, p<0.05 (*), p<0.01 (**), p<0.001 (***), and *p<0.0001 (****). Data are presented as mean ± SD.
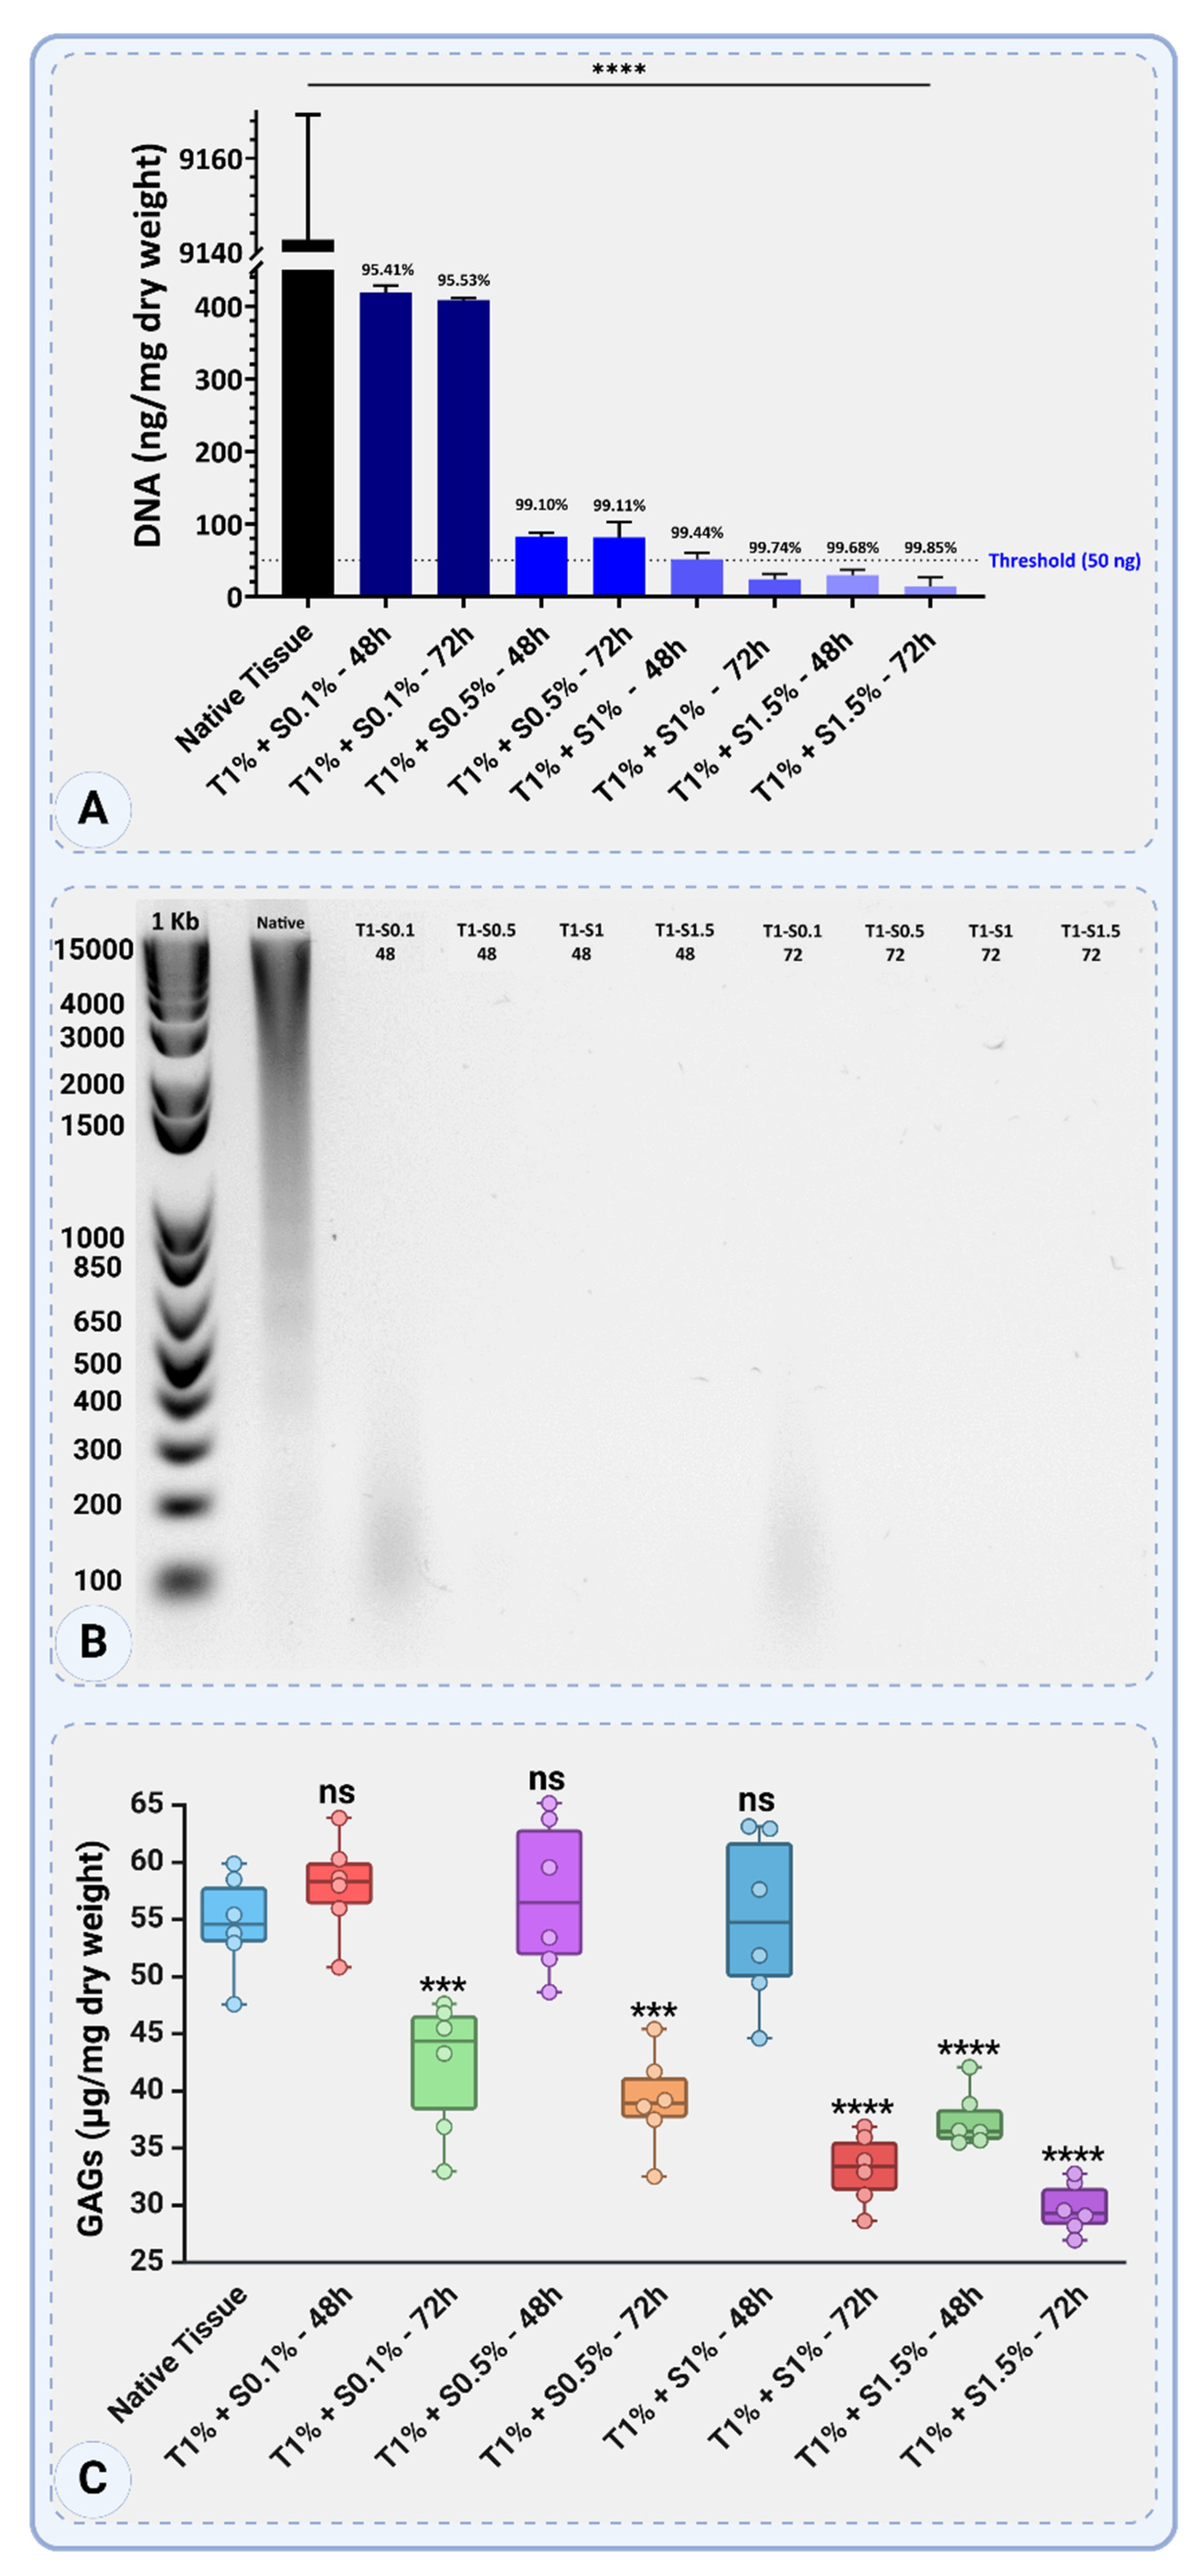
Figure 5.
Structural and Cellular Characterization of Native Porcine Uterine Tissue. The figure illustrates the three distinct layers of the native uterine tissue: the endometrial layer, the inner circular smooth muscle layer of the myometrium, and the outer longitudinal smooth muscle layer of the myometrium. (A-A3) DAPI staining highlights nuclear localization across the layers: dense nuclei in the endometrium (A1), evenly distributed nuclei in the inner circular smooth muscle (A2), and sparsely distributed nuclei in the outer longitudinal smooth muscle (A3). (B1-B3) Schematic representations depict key structural features of each layer: glands and blood vessels in the endometrium (B1), circularly arranged smooth muscle fibers in the inner layer (B2) and longitudinally aligned muscle fibers in the outer layer (B3). (C-C3) H&E staining further confirms these features, revealing glandular and vascular structures in the endometrium (C1) and the distinct arrangement of muscle fibers in the inner (C2) and outer layers (C3). (D1-D2) SEM images of the endometrial surface show microvilli (D1) and a cross-sectional view with visible red blood cells (D2). (E1-E2) SEM of the serosa (E1) shows a smooth fibrous surface, while the cross-section of the myometrium (E2) highlights embedded red blood cells within the fibrous structure.
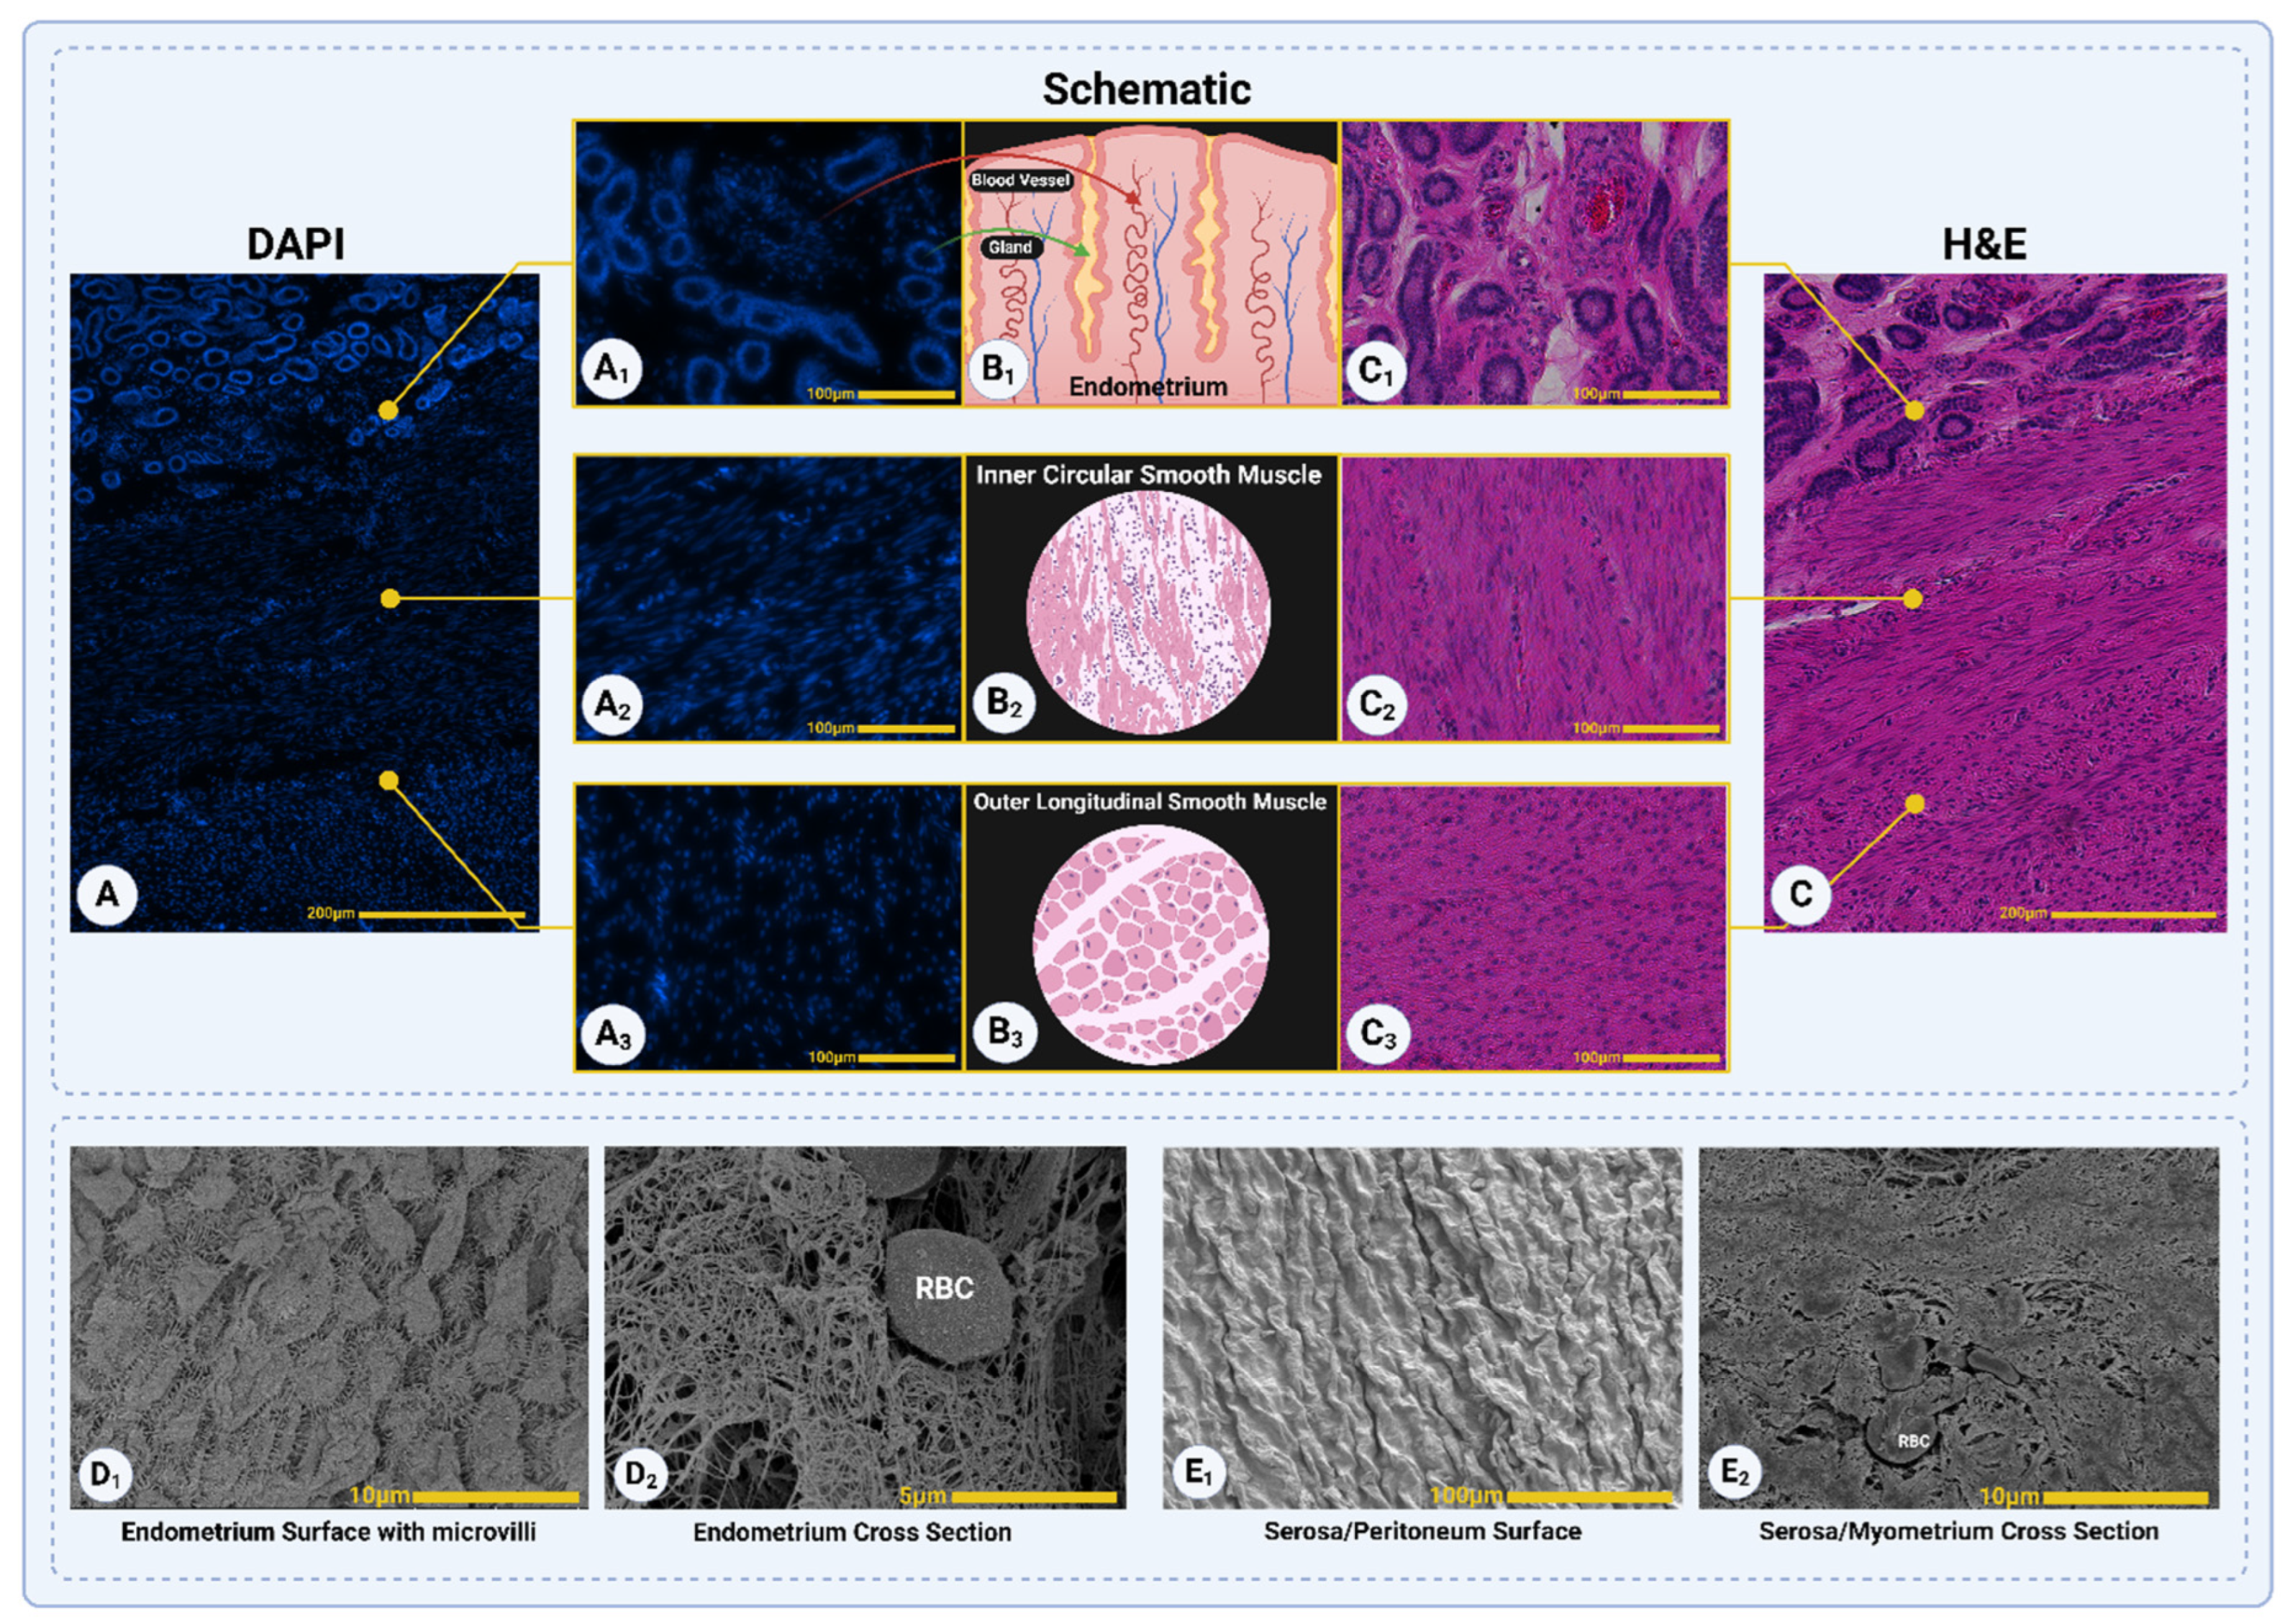
Figure 6.
Structural Assessment of Decellularized Porcine Uterine Tissue Under Different Protocols. SEM imaging (A1-H1), H&E staining (A2-H2), and DAPI staining (A3-H3) illustrate the ECM structure and cellular remnants after different decellularization treatments. In Triton™ 1% + SDS 0.1% (48 hours, A1-A3), nuclei remain visible in dense myometrial areas, and collagen fibers are not visible in SEM. By 72 hours (Triton™ 1% + SDS 0.1%, E1-E3), collagen fibrils become visible in SEM but are covered by extracellular components, with no detectable nuclei in H&E and DAPI. In other protocols (Triton™ 1% + SDS 0.5%, 1%, and 1.5%), nuclei are absent, and collagen fibers are visible. Collagen fibers are well-oriented in Triton™ 1% + SDS 0.5% and 1% (48 hours, B1 and C1), while Triton™ 1% + SDS 1.5% 48-hour protocol show irregular ECM structures with signs of agitation-induced damage. At 72 hours, only Triton™ 1% + SDS 0.1 and 0.5% (E1 and F1) retains well-oriented ECM, whereas other treatments (G1 and H1) result in disorganized and disrupted ECM.
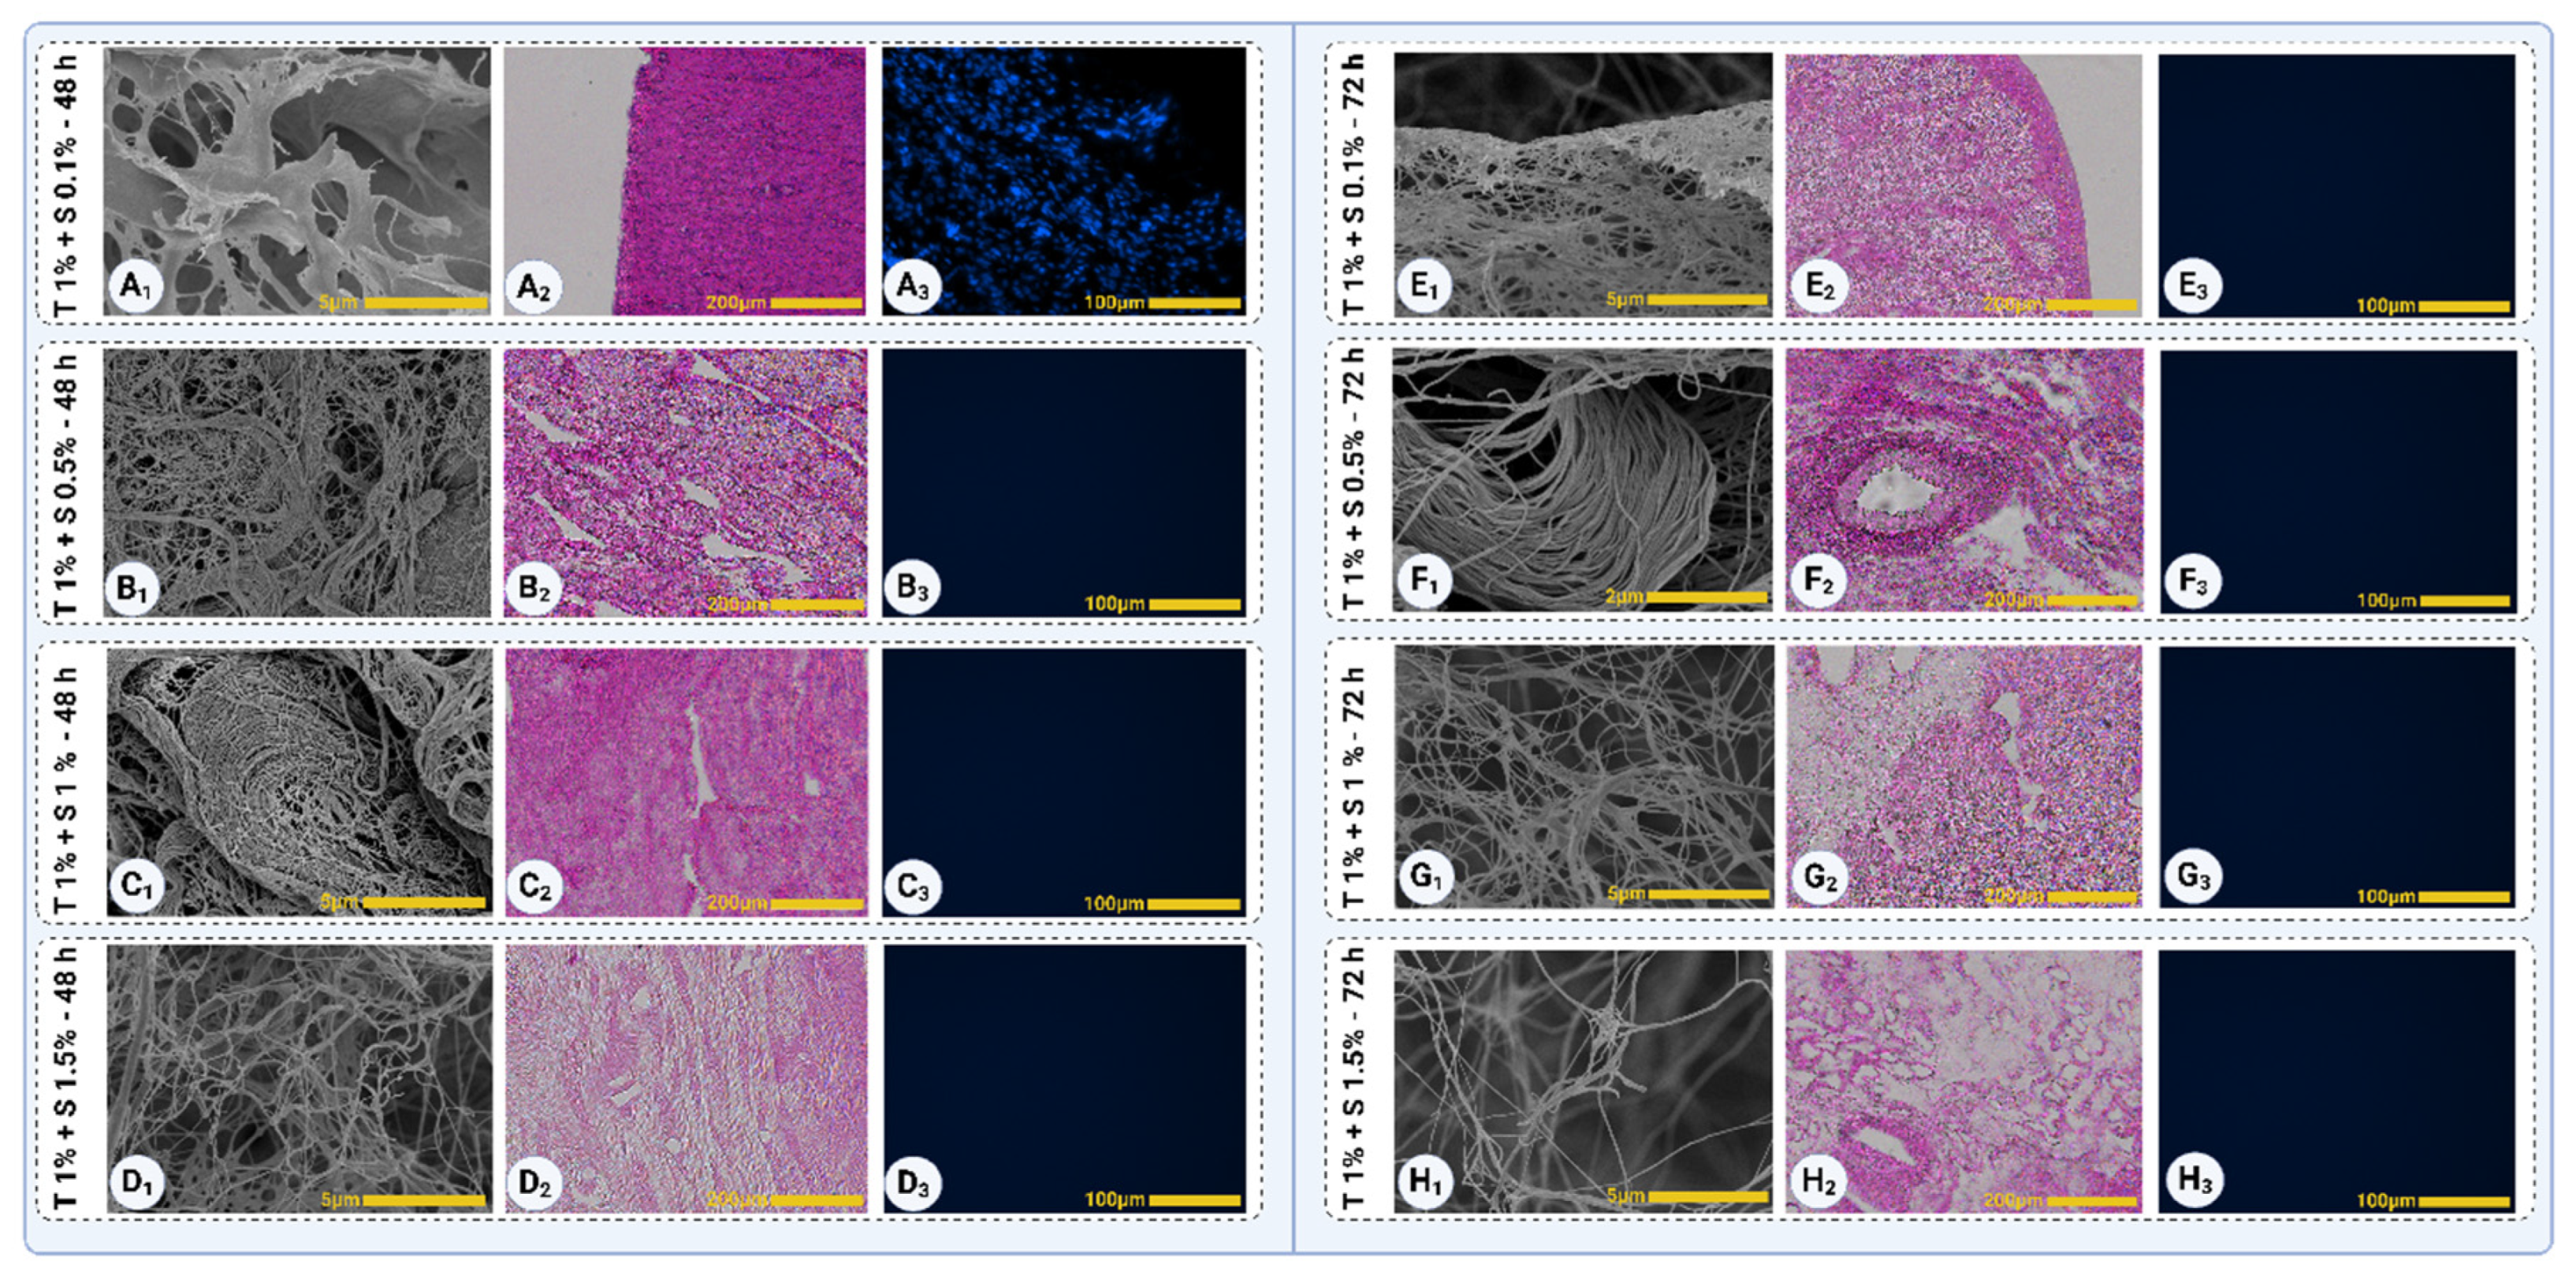
Figure 7.
Mason Trichrome staining of native and decellularized uterine tissues, illustrating collagen distribution (blue) and non-collagen components (red). Panel A shows the native tissue with the highest collagen content and non-collagen signals, reflected in the dense blue and red intensities. Panels B1–E1 represent tissues treated with various decellularization protocols for 48 hours, where T1% + S0.1% - 48h (B1) retains a high level of collagen. Collagen loss becomes progressively evident with increased SDS concentration in C1 (T1% + S0.5% - 48h), D1 (T1% + S1% - 48h), and E1 (T1% + S1.5% - 48h). Panels B2-E2 show tissues treated for 72 hours, with the most pronounced collagen degradation observed in E2 (T1% + S1.5% - 72h). Non-collagen components (red signals) are primarily seen in A (native tissue) and B1 (T1% + S0.1% - 48h), reflecting effective decellularization in other protocols.
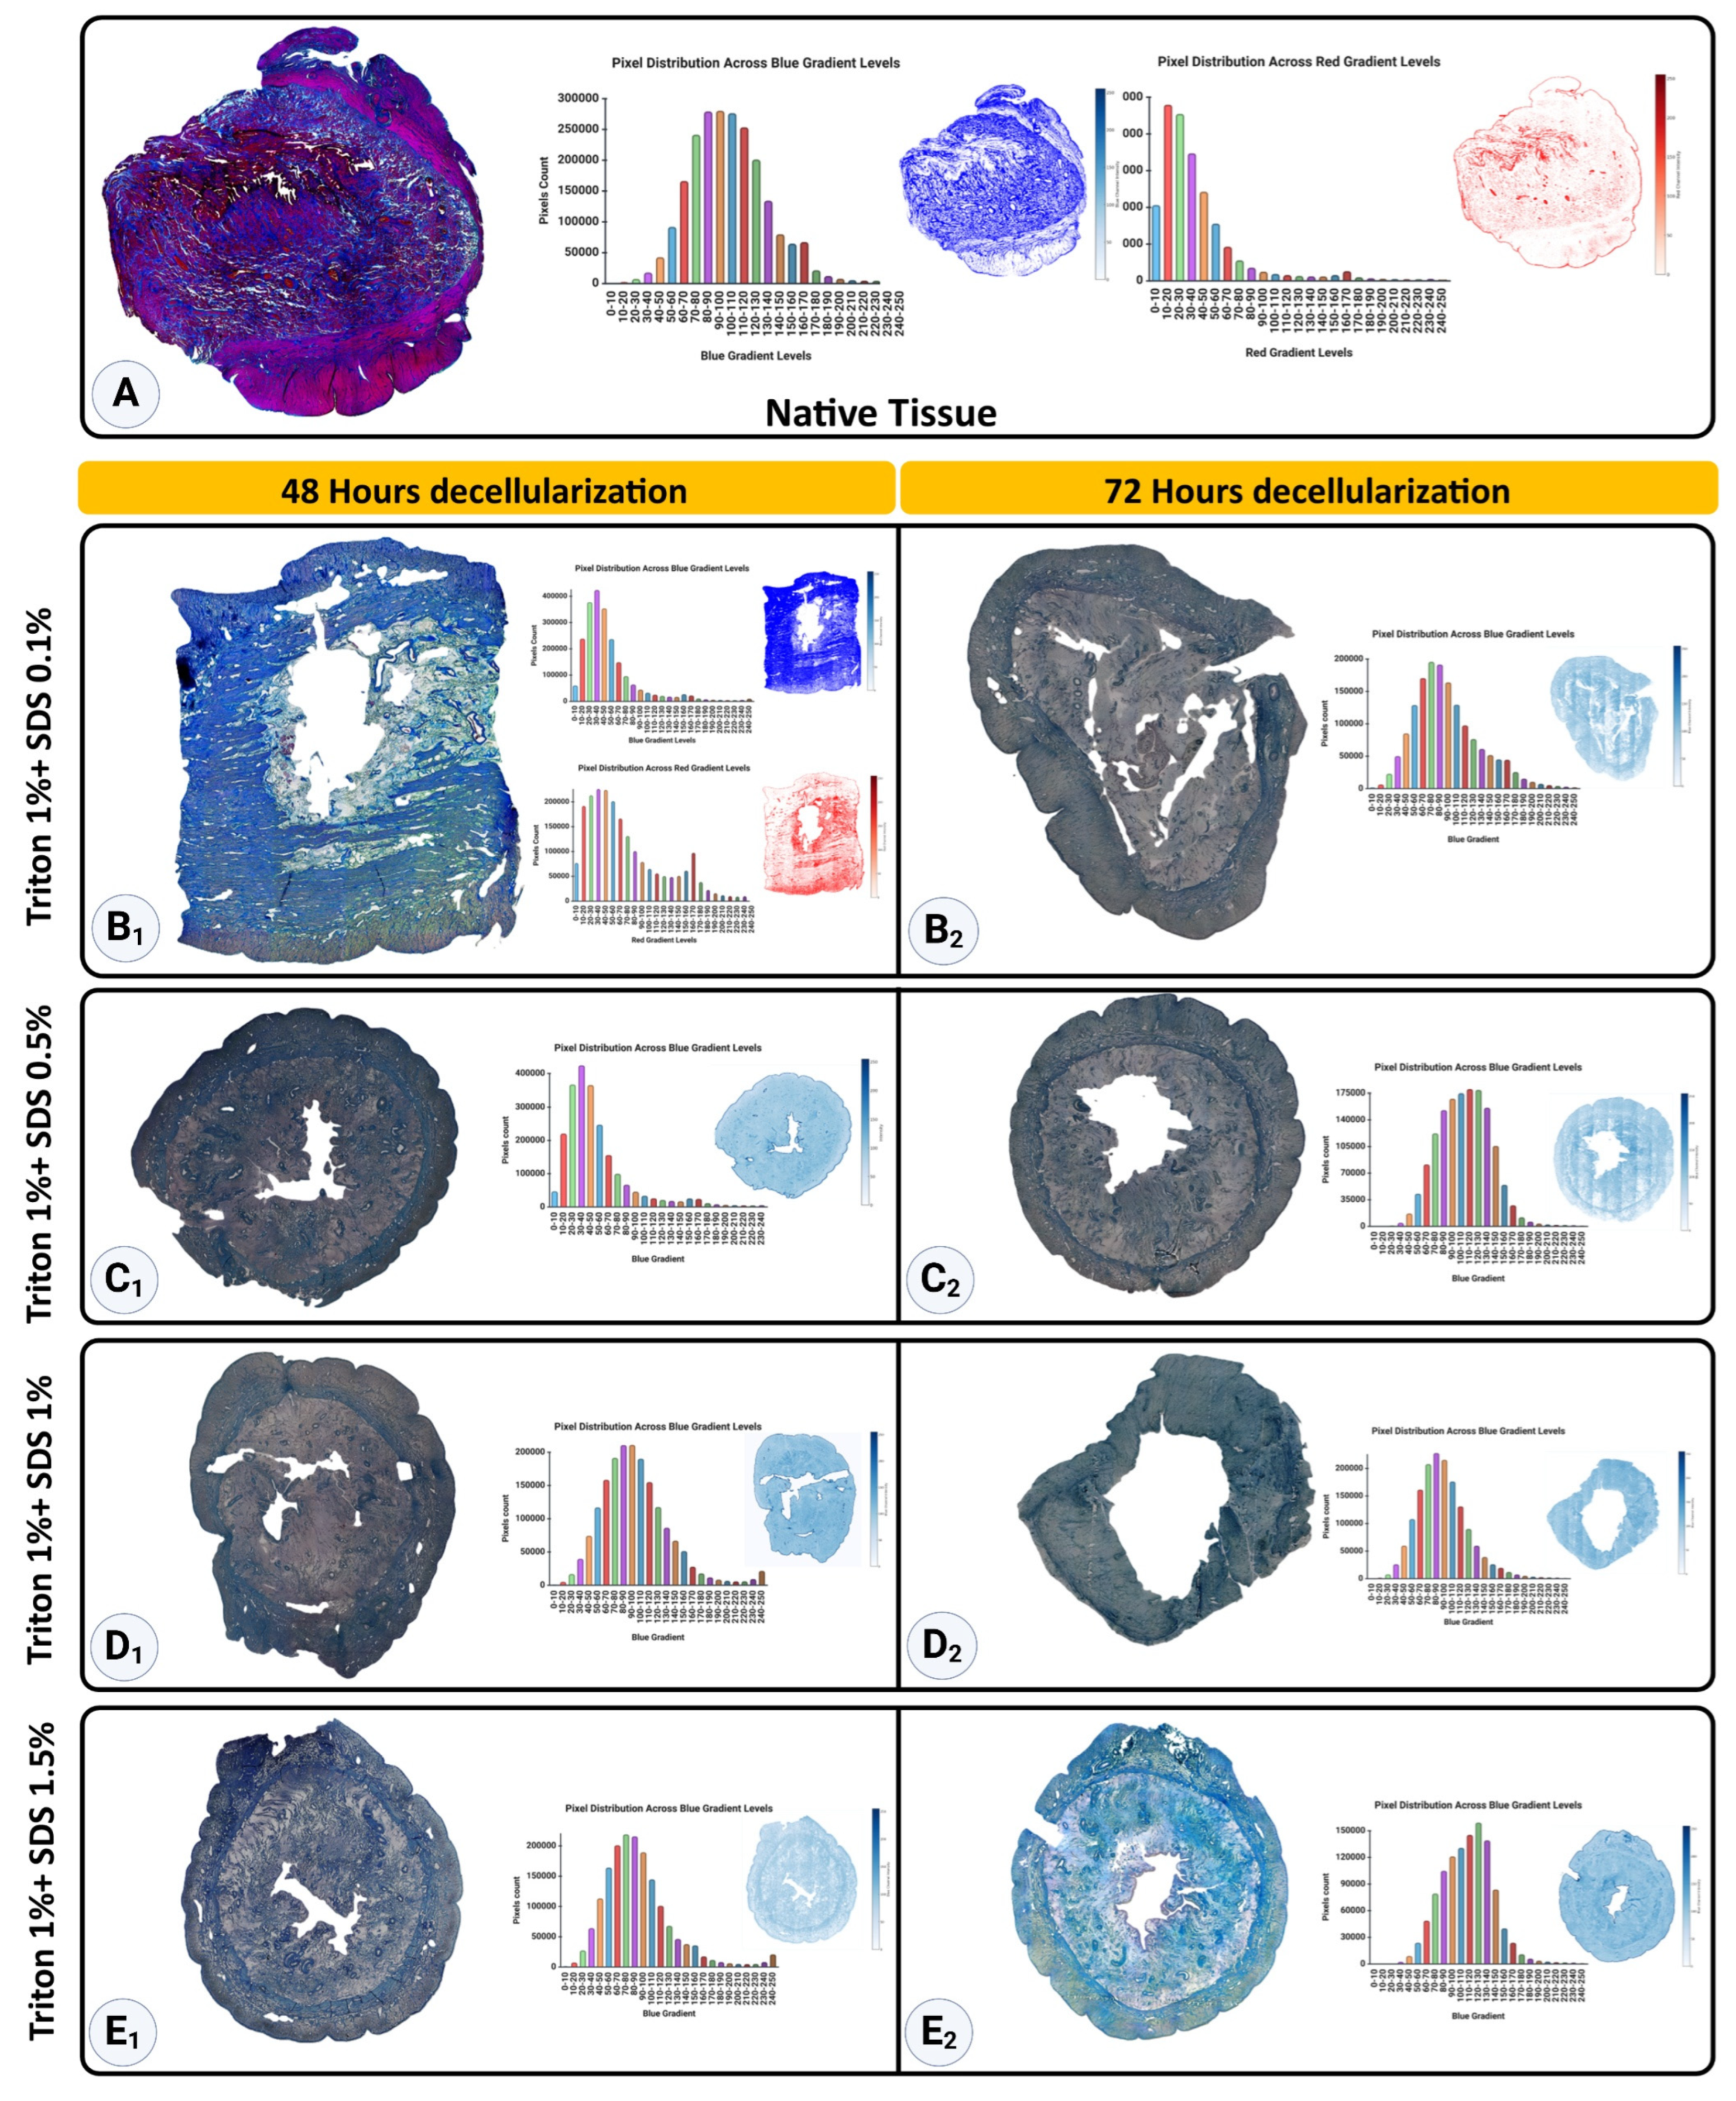
Figure 8.
Violin plots quantifying blue (A) and red (B) pixel intensities from Mason Trichrome-stained samples. Panel A illustrates collagen content across native and decellularized tissues, with the native tissue showing the highest blue intensity. Among decellularized tissues, T1% + S0.1% - 48h retains the most collagen, while T1% + S1.5% - 72h) demonstrates the lowest. Panel B quantifies non-collagen components, with measurable red signals only in native tissue and T1%+S0.1%-48h). Statistical significance is indicated as follows: ns = not significant and *p<0.0001 (****). Data are presented as mean ± SD.
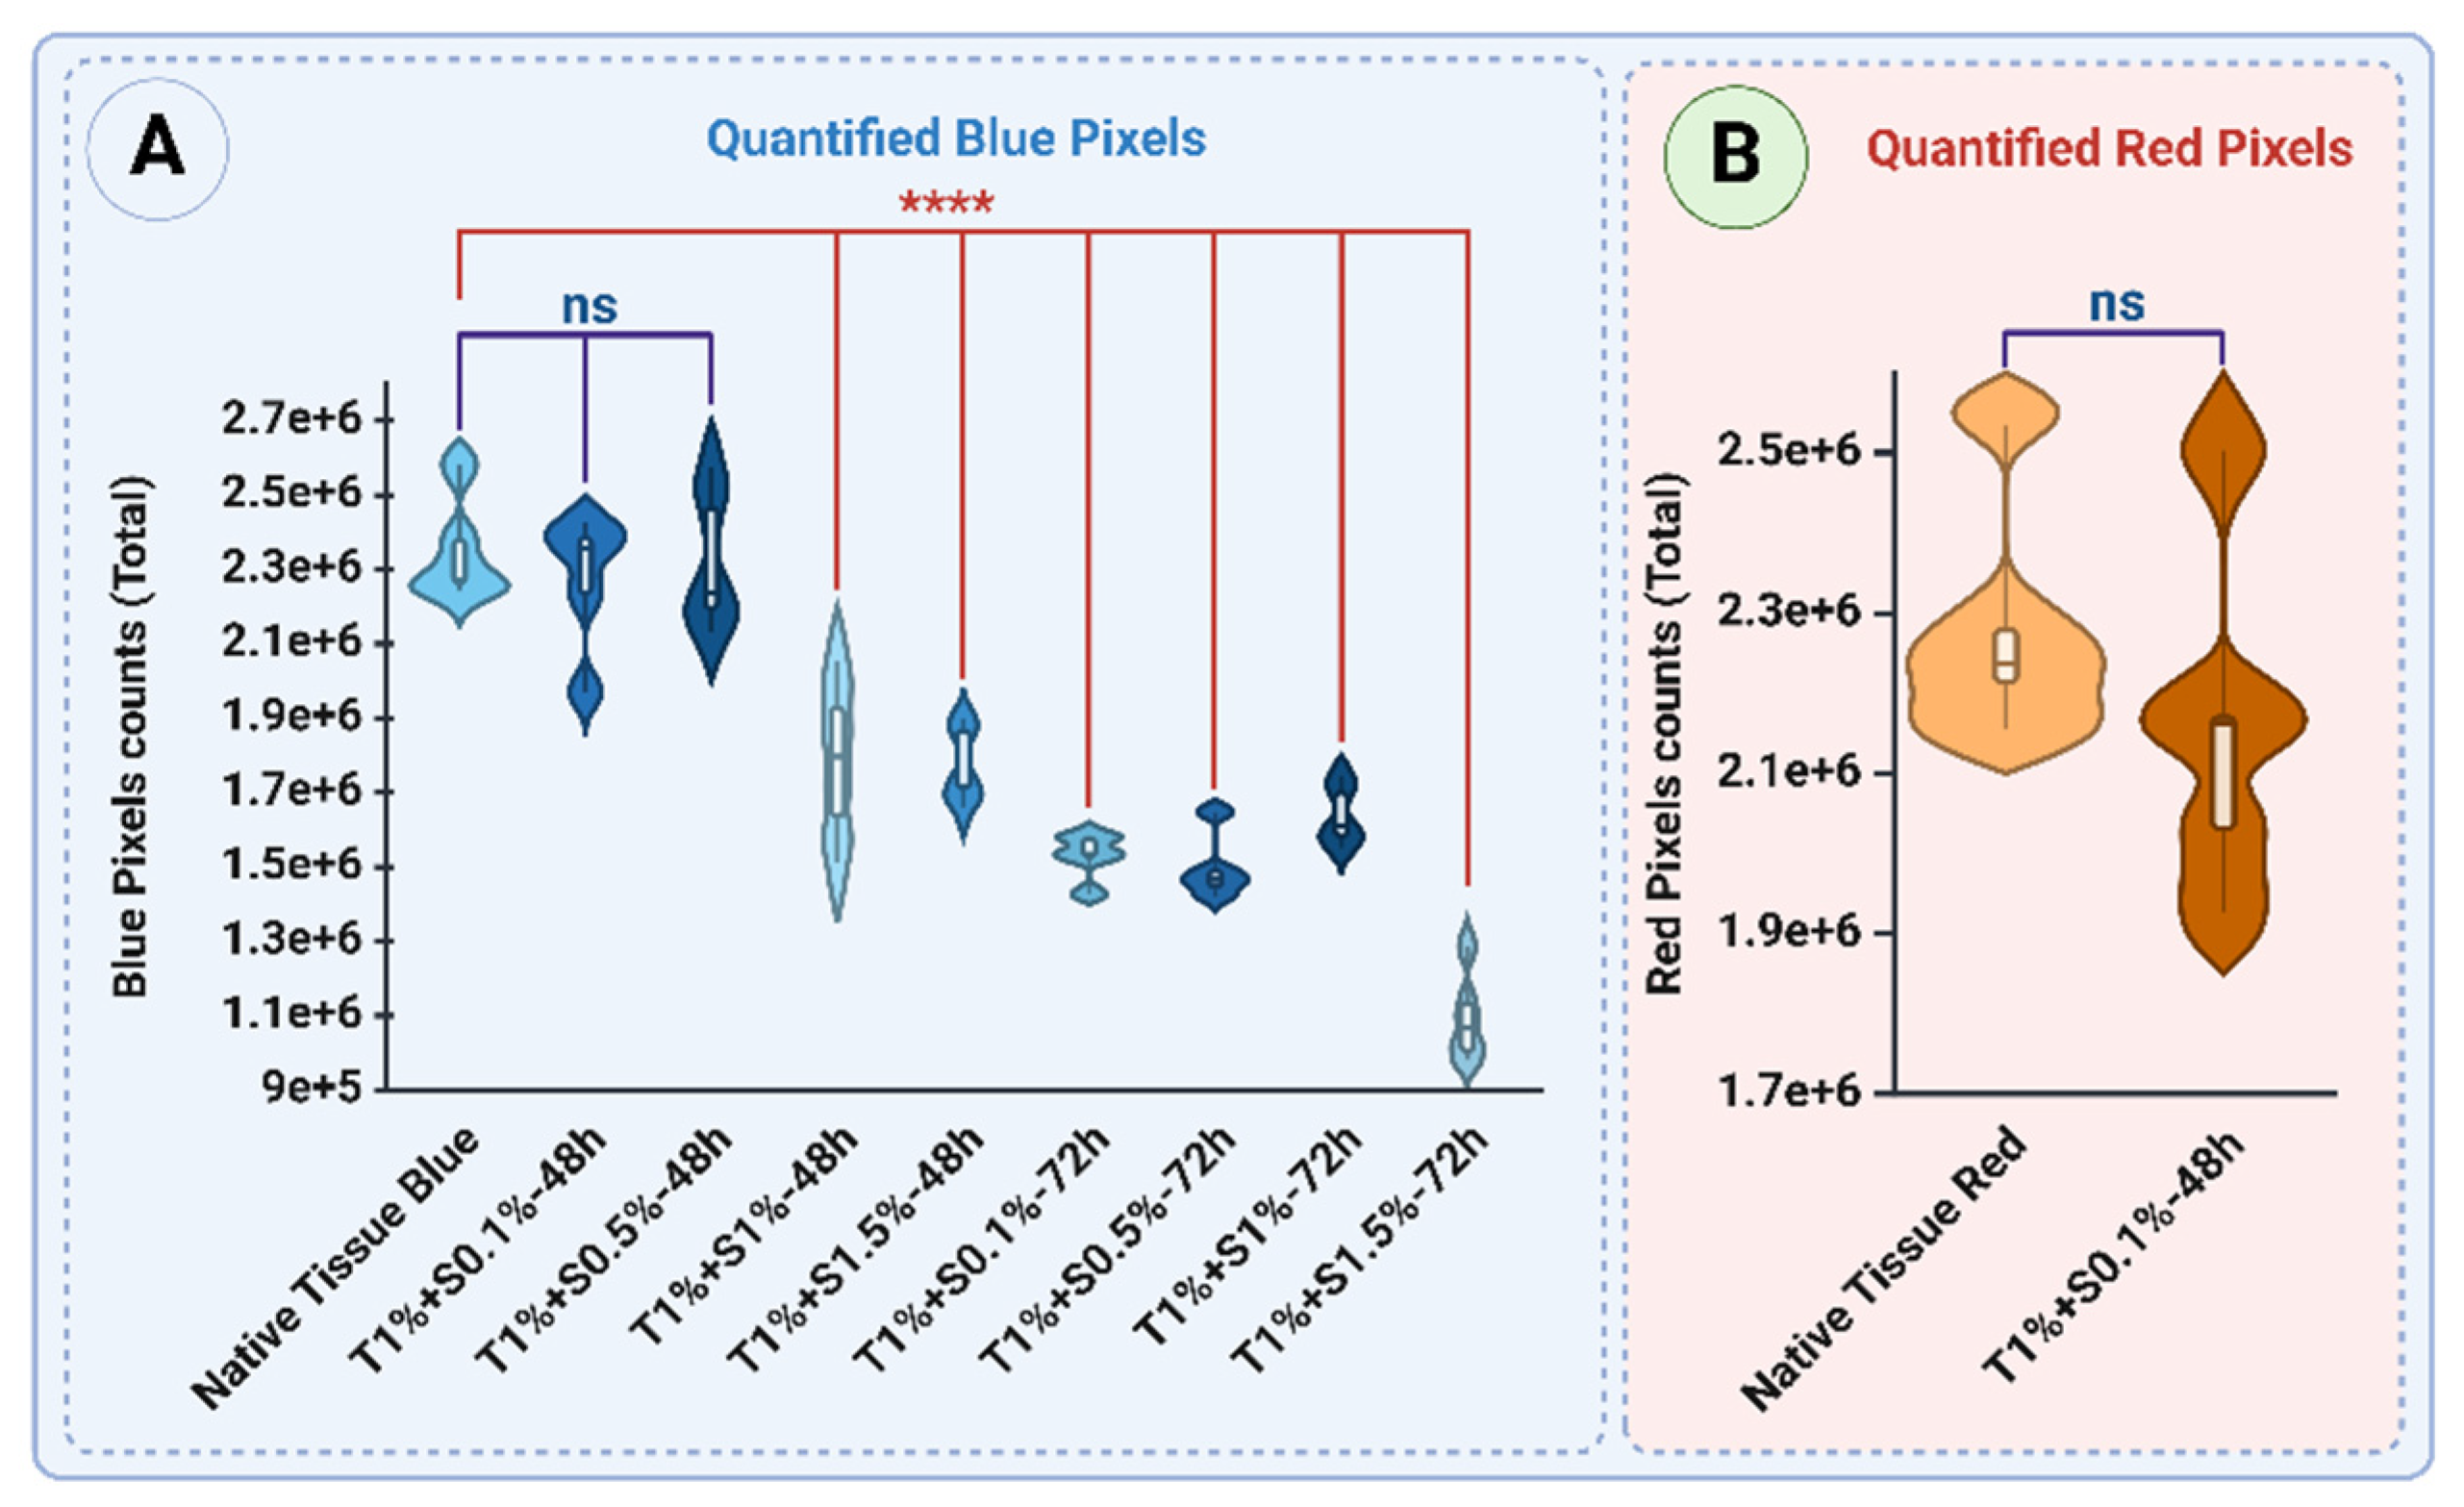
Figure 9.
FTIR Analysis. Panel A displays FTIR spectra highlighting the characteristic peaks of Amide I, II, and III bands for native and decellularized tissues. Panels B, C, and D present quantitative analyses of Amide I, II, and III peak areas, respectively, reflecting protein content and structural integrity across protocols. Panel E illustrates the Amide II/I ratio, indicating protein denaturation and structural changes under varying decellularization conditions. Statistical significance is indicated as follows: ns = not significant, p<0.05 (*), p<0.01 (**), p<0.001 (***), and *p<0.0001 (****). Data are presented as mean ± SD.
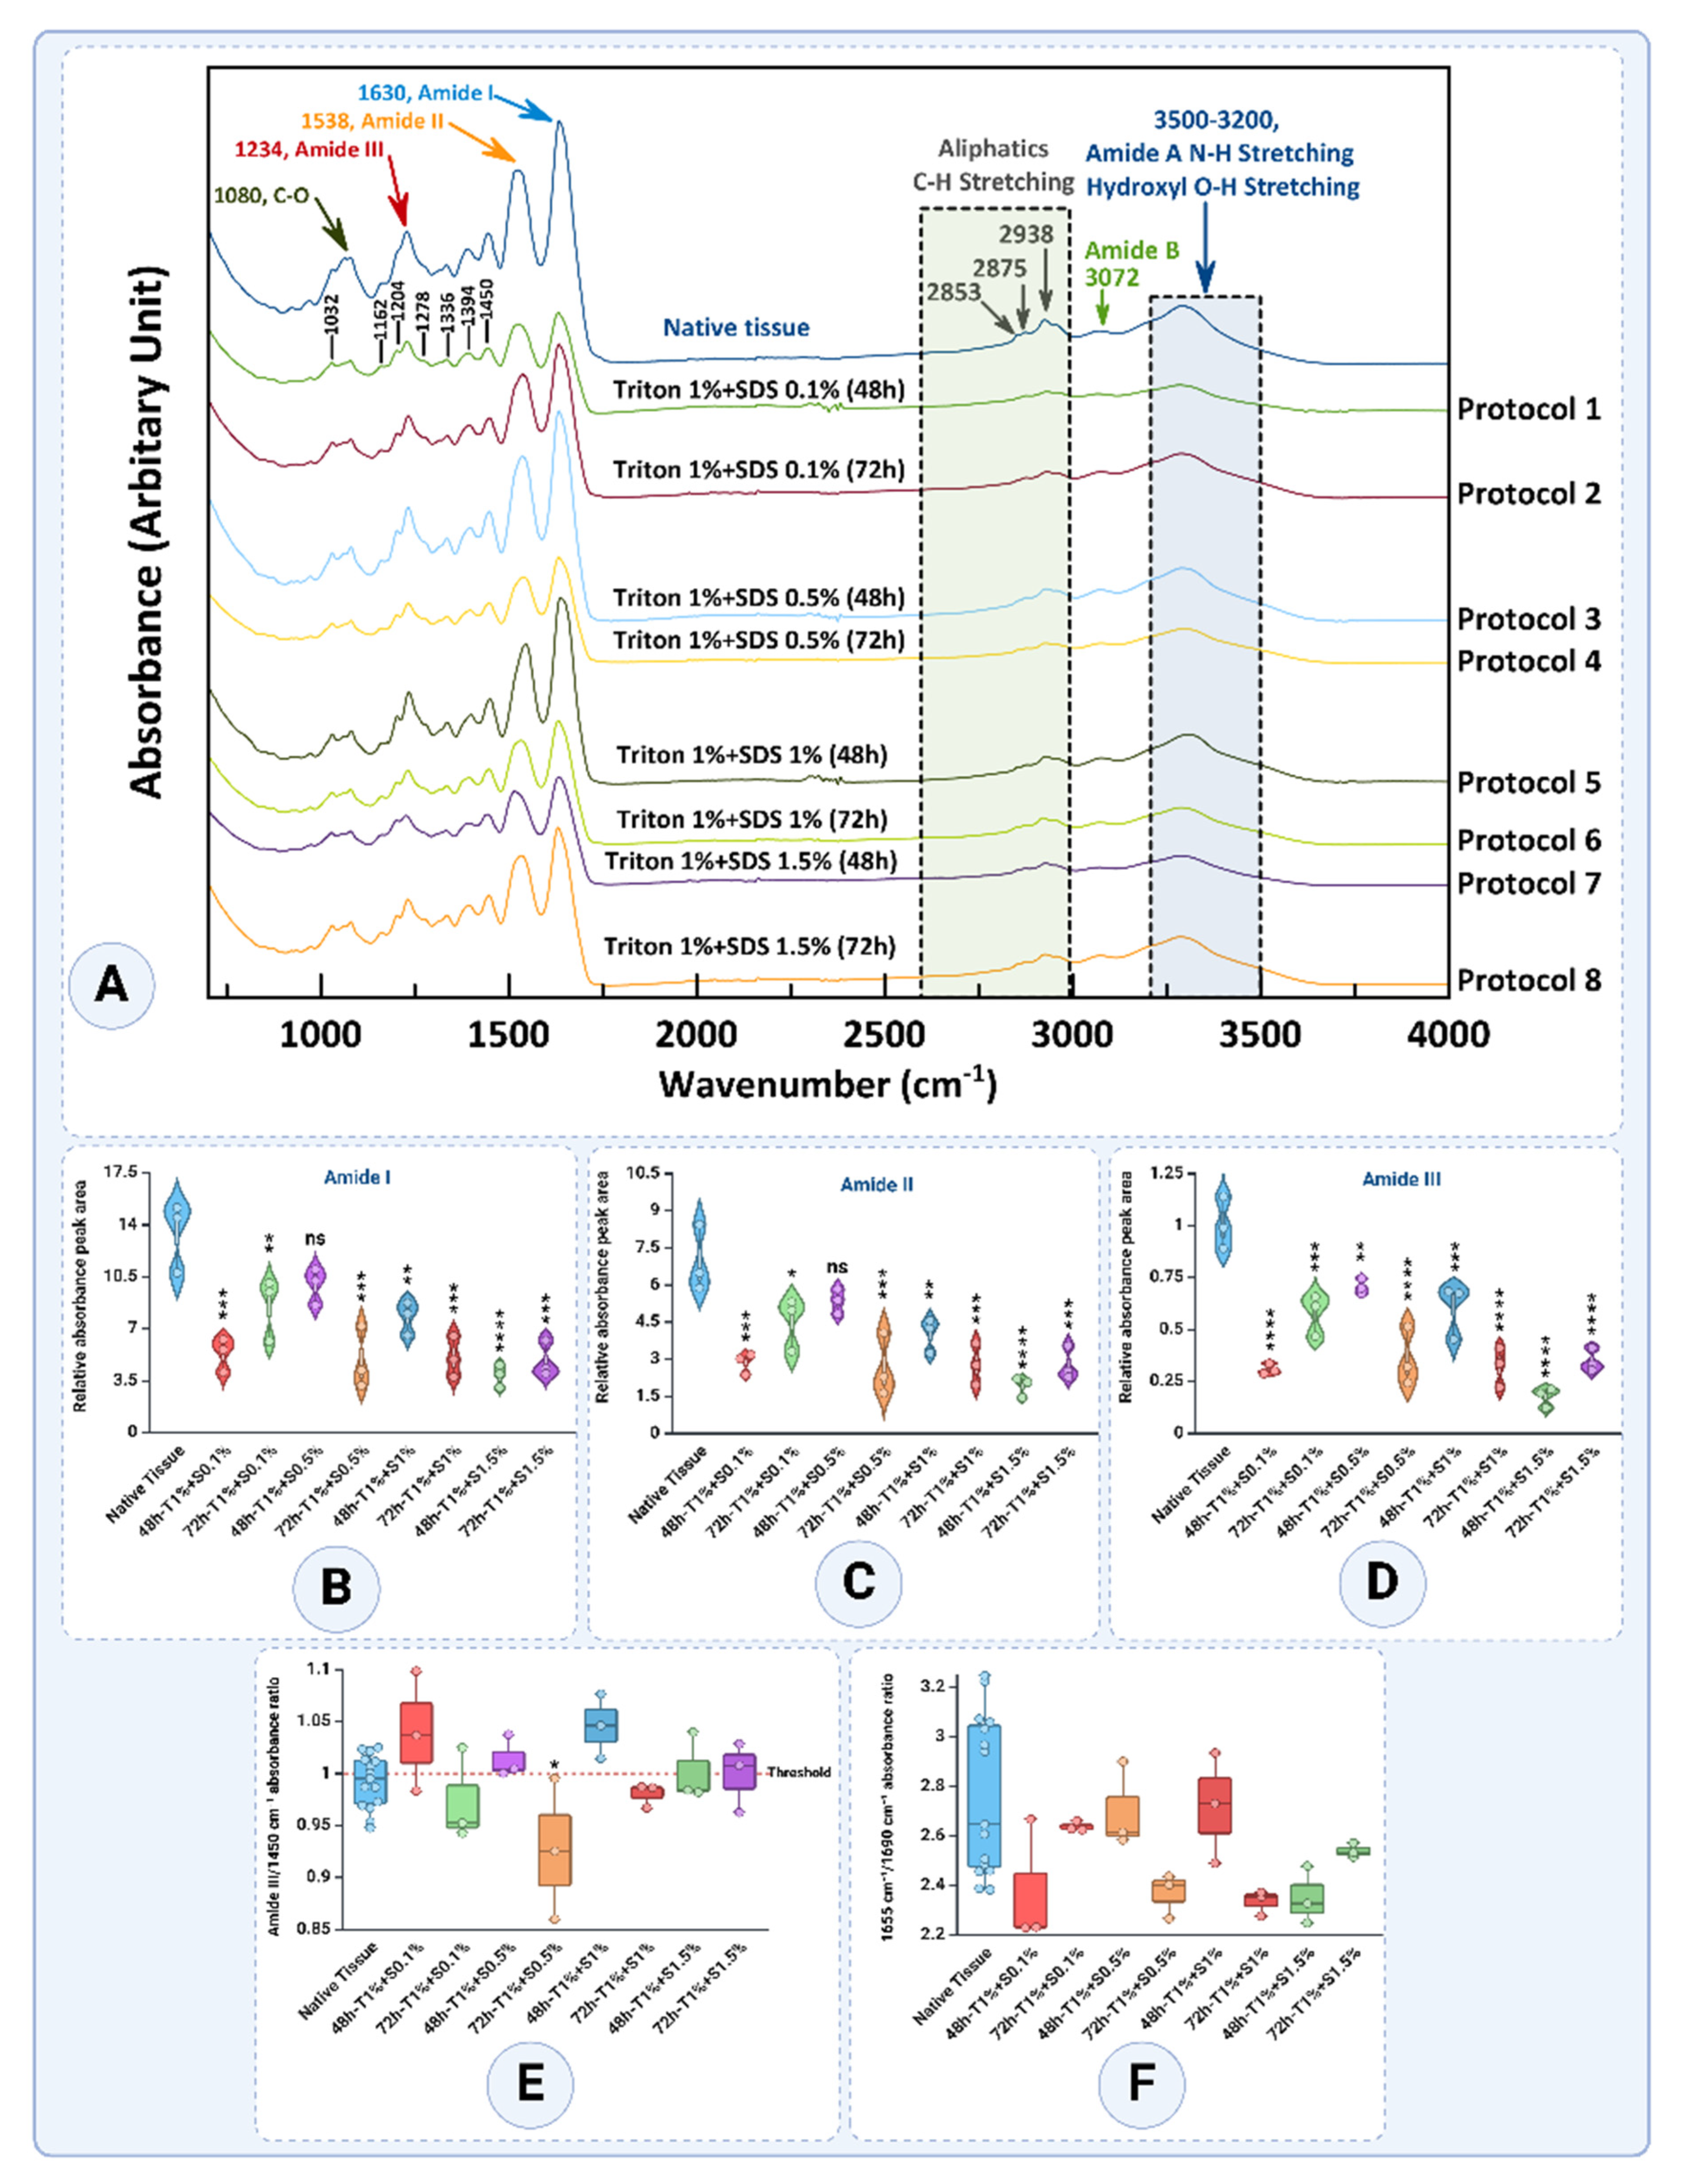
Figure 10.
Comparative Raman Spectroscopic Analysis of ECM Components Post-Decellularization: A illustrates characteristic Raman spectra for native and treated tissues across different protocols, highlighting key molecular regions such as Amide I, Amide III, CH2/CH3 deformations, and GAG-associated peaks. B shows the 1660/1620 ratio, reflecting molecular packing and β-sheet content. C presents the 1240/1270 ratio, indicative of protein backbone stability. D highlights the 1240/1450 ratio, evaluating side-chain interactions and hydration. E explores the 1320/1450 ratio, measuring backbone-side-chain dynamics, comparing native tissue and treatments at 24, 48, and 72 hours. Statistical significance is indicated as follows: ns = not significant and p<0.01 (**). Data are presented as mean ± SD.
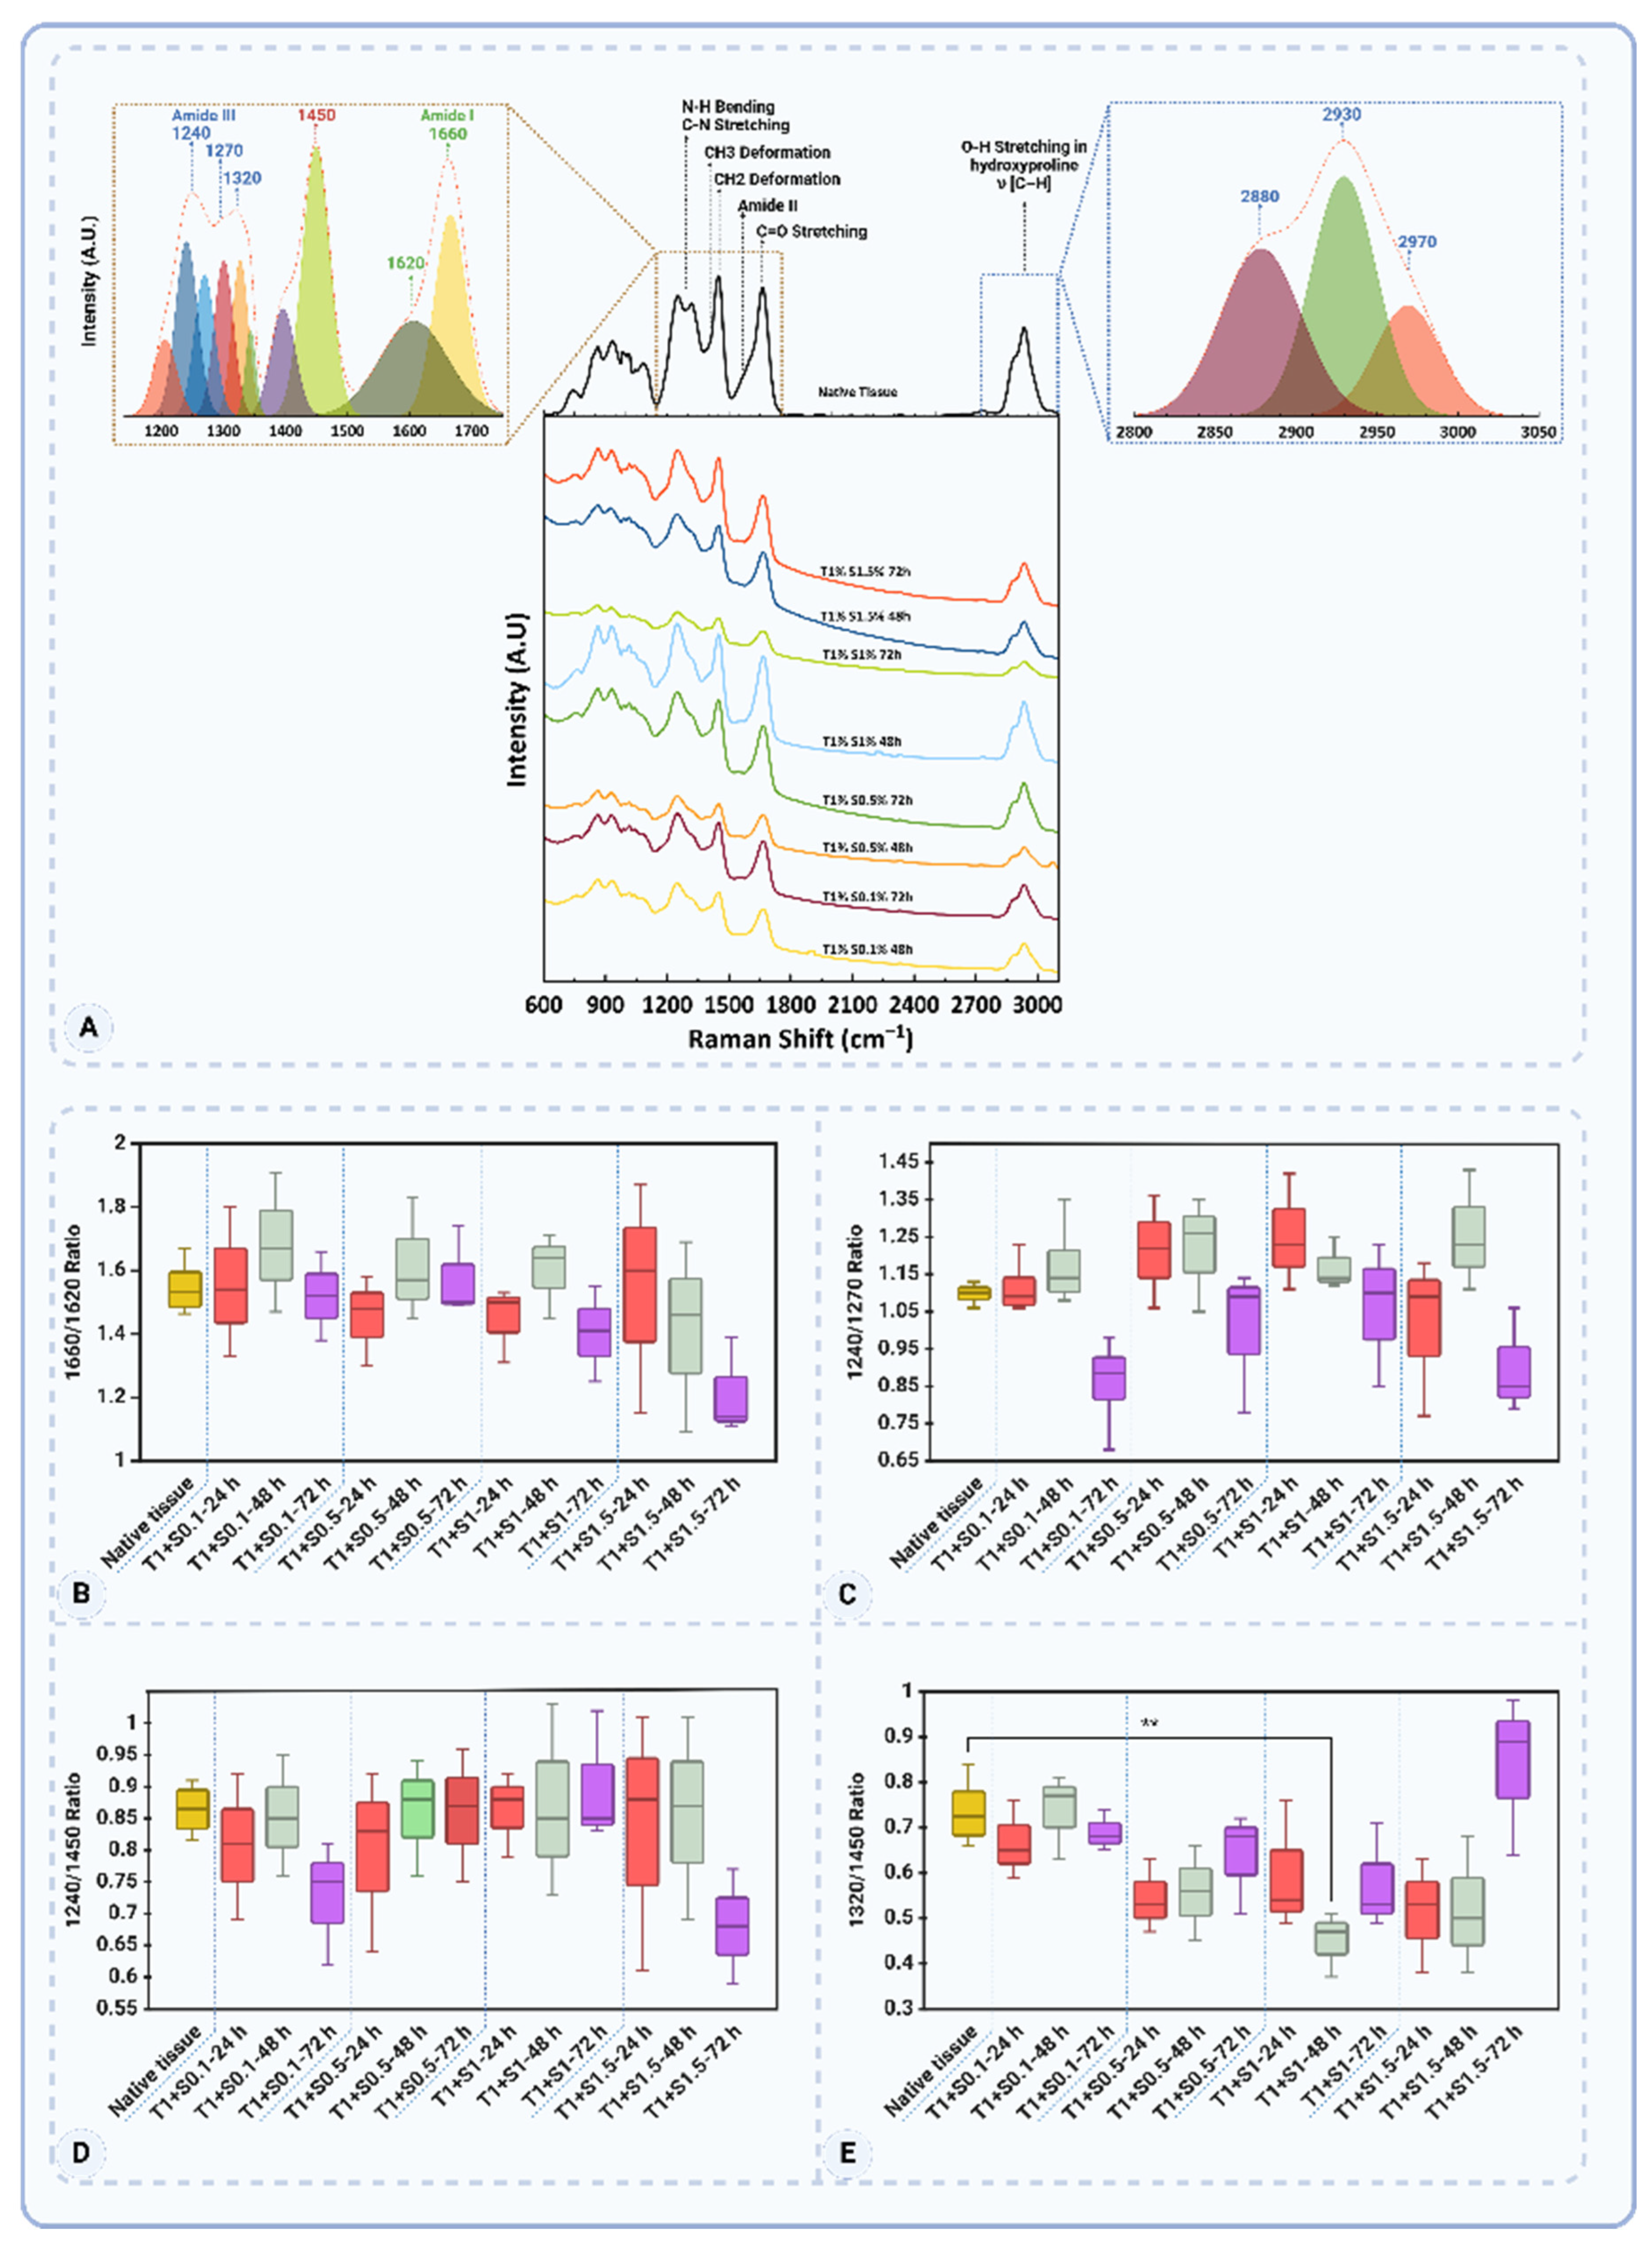
Figure 11.
Thermogravimetric analysis (TGA) and peak area comparison of native and decellularized porcine uterine tissues. (A) TGA profiles showing the thermal degradation of native tissue and samples treated with 1% Triton™ X-100 and varying SDS concentrations (0.1%, 0.5%, 1%, and 1.5%) for 48 and 72 hours. The major degradation phase between 200°C and 500°C indicates the breakdown of proteins, including collagen. (B) Peak area comparison of TGA data for native tissue and decellularized samples treated for 48 hours. Lower SDS concentrations (0.1% and 0.5%) exhibit minimal changes compared to native tissue, while higher concentrations (1% and 1.5%) show significant increases in peak areas, reflecting enhanced decellularization. (C) Peak area comparison for 72-hour treatments. Extended exposure to SDS leads to significant reductions in peak areas, with the greatest effect observed for SDS 1.5%, indicating substantial protein removal and ECM disruption. Statistical significance is indicated as follows: ns = not significant, p<0.05 (*), p<0.01 (**), p<0.001 (***), and *p<0.0001 (****). Data are presented as mean ± SD.
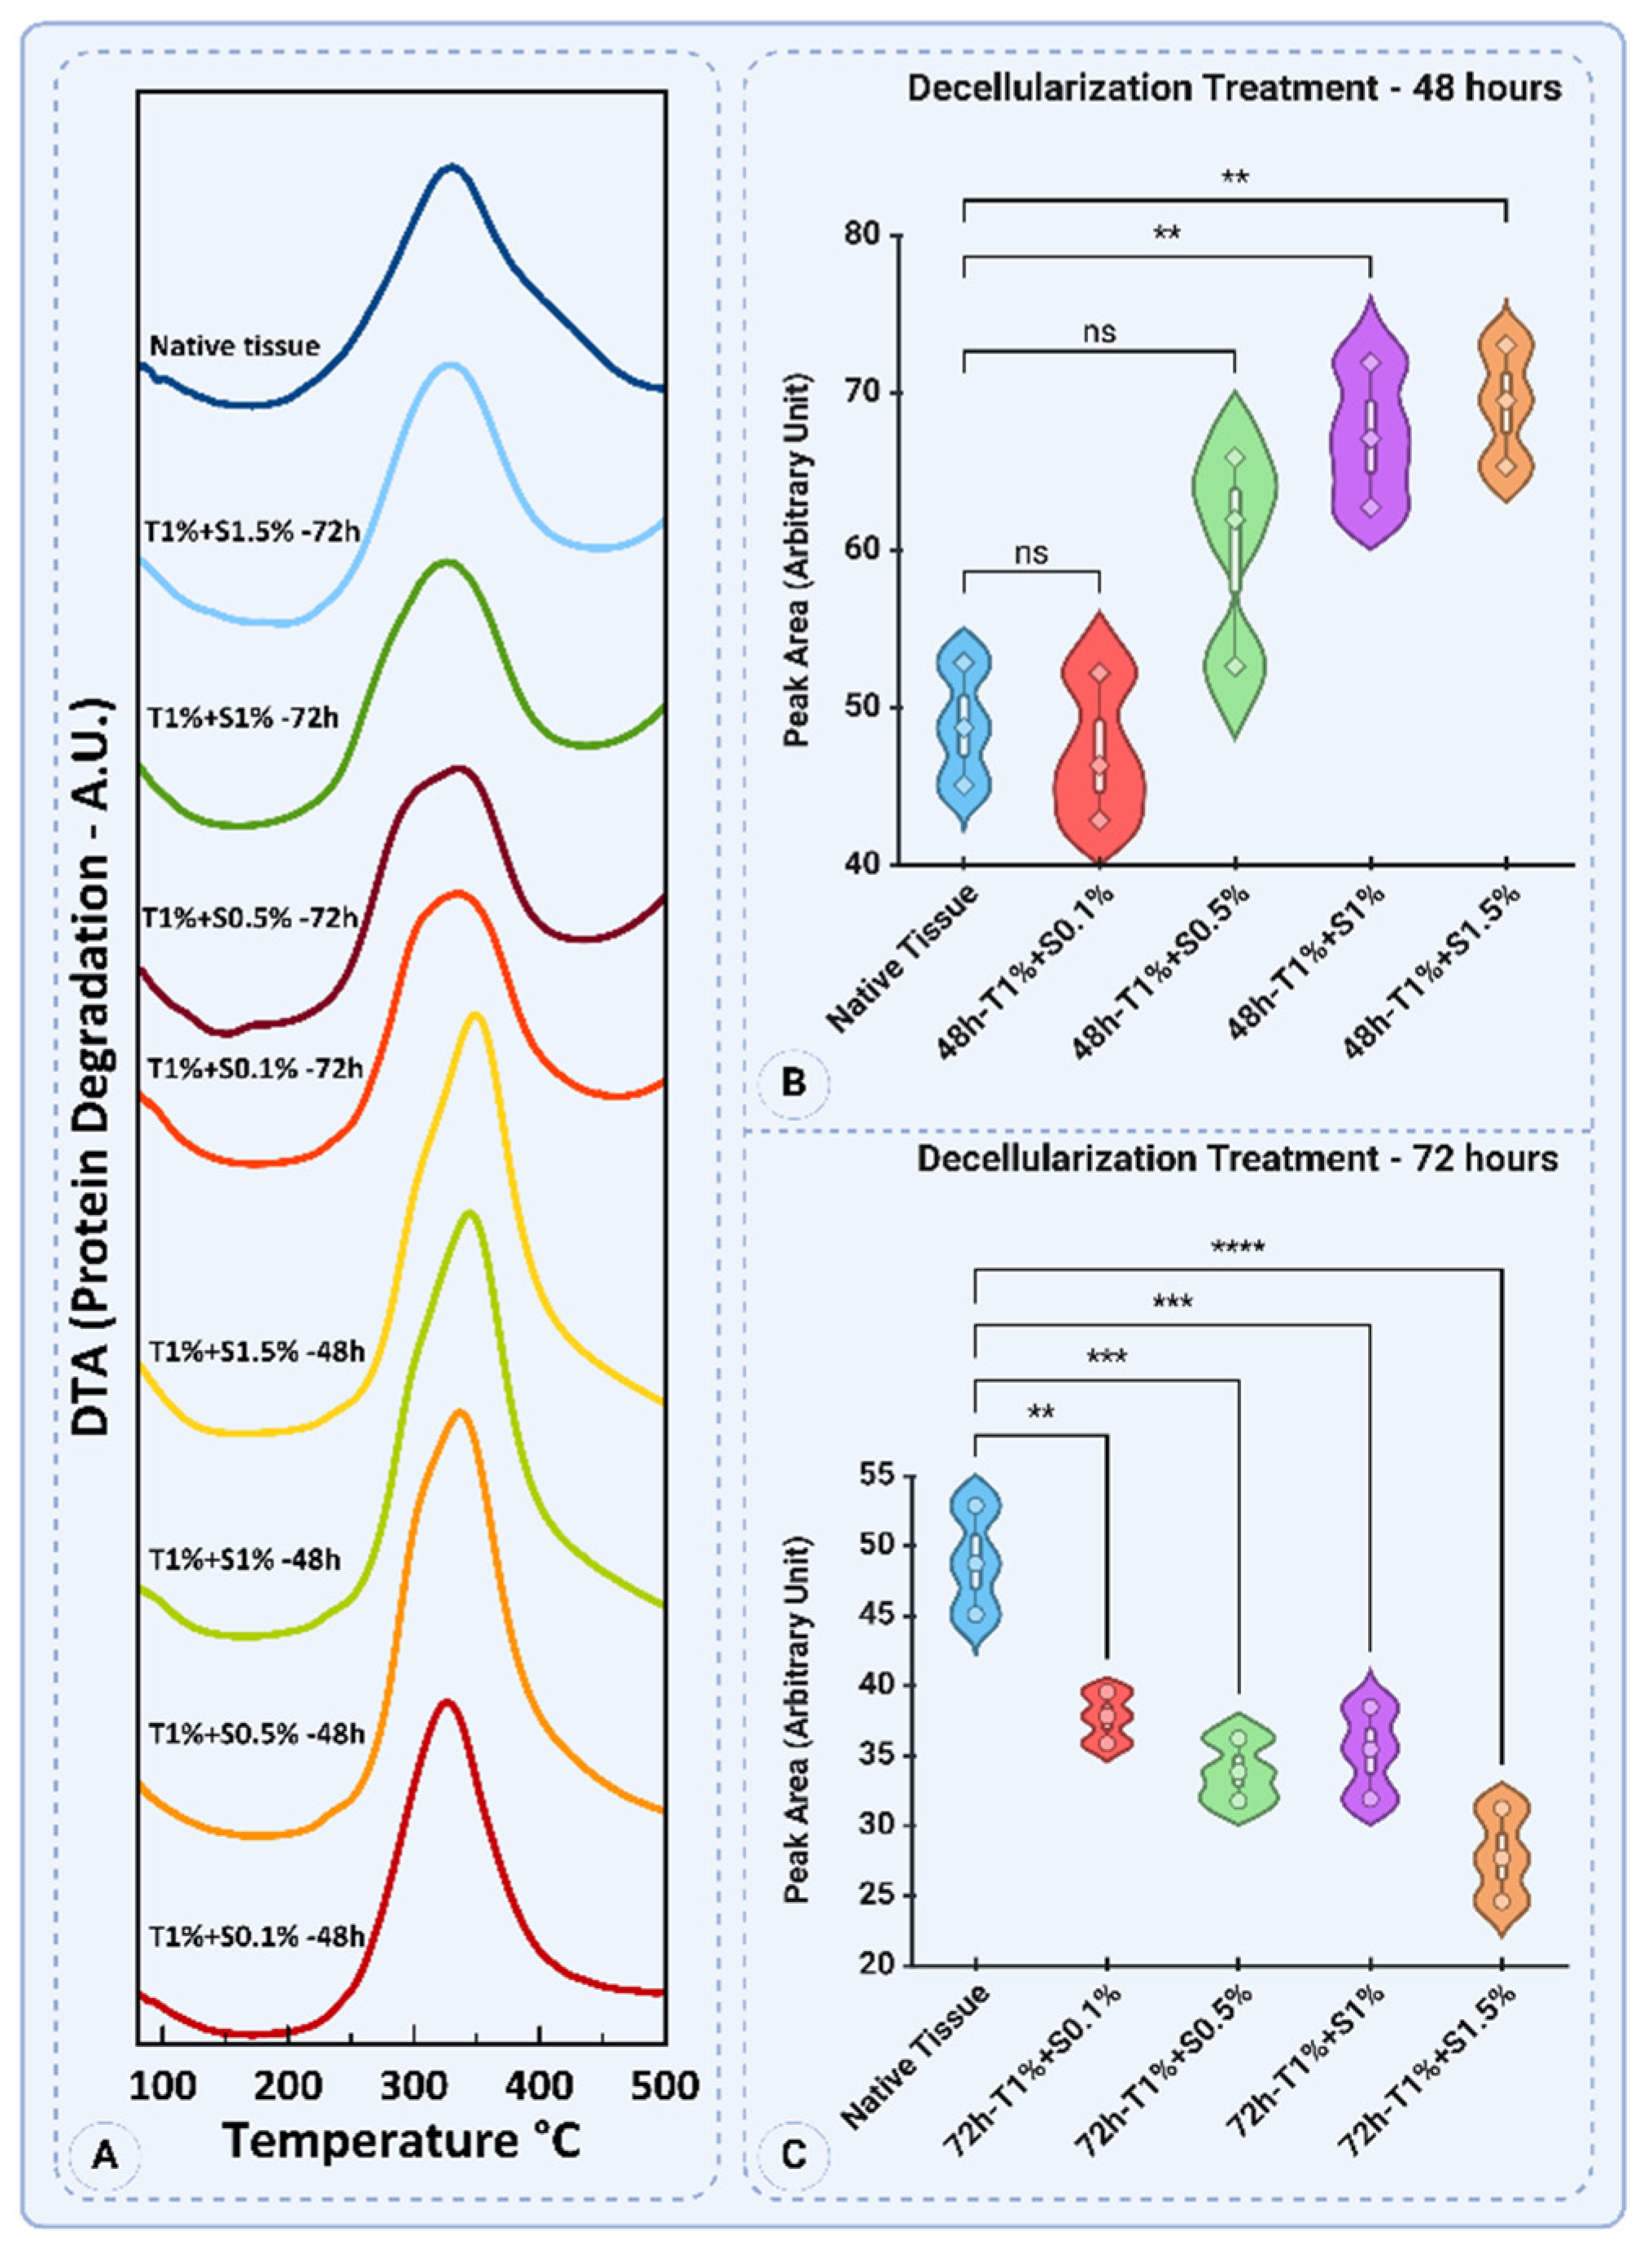
Figure 12.
Mechanical characterization of native and decellularized tissues. (A) Stress-strain curves illustrating the mechanical behavior of native tissue and decellularized tissues treated with different protocols (T1% + SDS concentrations of 0.1%, 0.5%, 1%, and 1.5% for 48 and 72 hours). The native tissue exhibited the highest stress values, while decellularized tissues showed reduced mechanical integrity, particularly at higher SDS concentrations and longer exposure times. (B) Ultimate tensile strength (UTS) values of native and decellularized tissues. The native tissue showed the highest UTS, while significant reductions were observed in treatments with higher SDS concentrations (p<0.0001). (C) Percent elongation at rupture of the tissues. T1% + S0.1% - 72h demonstrated the highest elongation, indicating enhanced flexibility, while T1% + S0.5% - 48h and T1% + S1% - 48h had the lowest values. (D) Young’s modulus (stiffness) of the tissues. The native tissue showed a modulus of 35.88 ± 2.02 kPa, with stiffness preserved in T1% + S0.1% - 48h but significantly reduced in treatments with prolonged exposure and higher SDS concentrations (p<0.0001). Statistical significance is indicated as follows: ns = not significant, p<0.05 (*), p<0.01 (**), p<0.001 (***), and *p<0.0001 (****). Data are presented as mean ± SD.
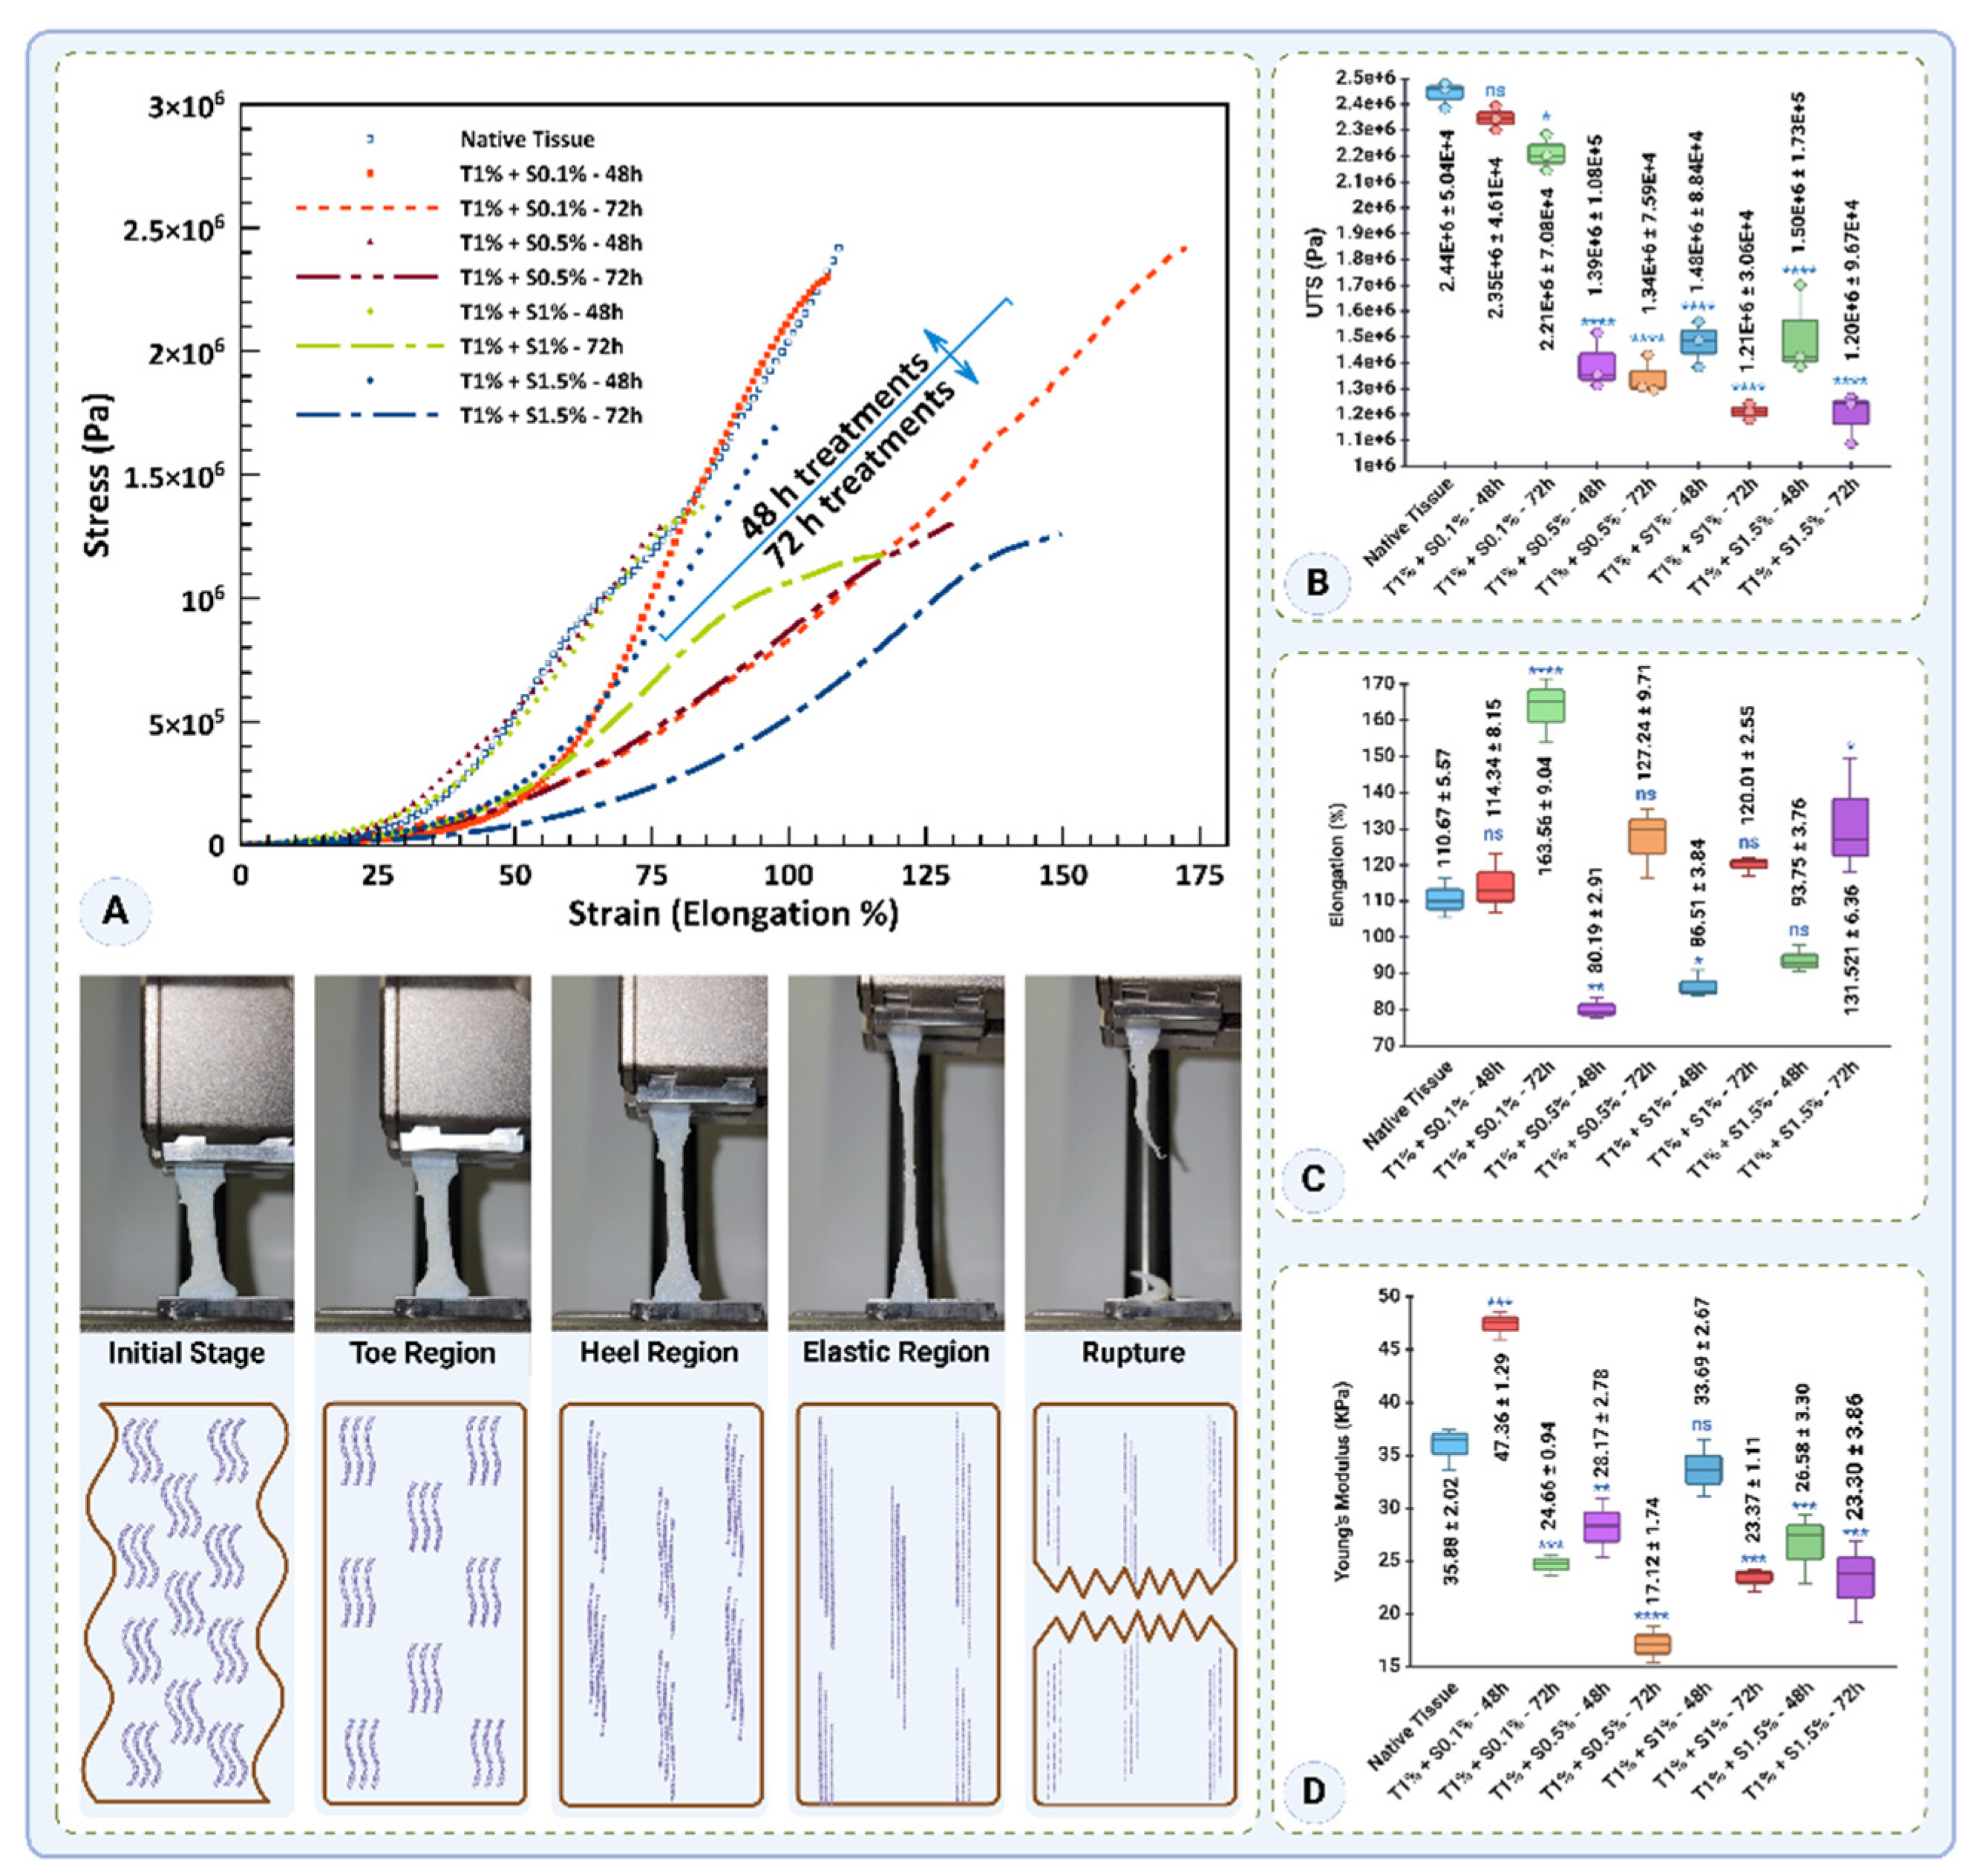
Figure 13.
Gelation kinetics, rheological properties, and microstructural evaluation of dUECM hydrogels at different concentrations. (A) Steady-state rheological analysis at 4°C showing viscosity and stress as functions of shear rate for 0.5%, 1%, and 1.5% dUECM hydrogels, demonstrating shear-thinning behavior and increased viscosity with higher concentrations. (B) Turbidimetric analysis at 405 nm illustrating the gelation progression over time for the three concentrations, with initiation and completion times highlighted. Inset images show the sol and gel states of the hydrogels. (C–E) SEM micrographs detailing the microstructural organization of hydrogels: (C) 0.5% dUECM with the largest pore size (17.73 ± 4.48 µm, range: 10.09–25.91 µm) and a loose network; (D) 1% dUECM with a moderately smaller pore size (13.39 ± 4.10 µm, range: 7.54–21.42 µm) and visible crosslinked collagen fibers; (E) 1.5% dUECM with the smallest pore size (11.92 ± 2.59 µm, range: 6.69–15.28 µm), exhibiting a compact and highly uniform structure. (F1–F3) G′ and G″ moduli of 1.5% dUECM hydrogels showing temperature-dependent gelation kinetics. Gelation onset times decrease significantly with increasing temperatures (10 ºC to 30 ºC), underscoring the thermoresponsive behavior of dUECM and the importance of maintaining handling and storage below 10°C. The data highlight concentration- and temperature-dependent variations in gelation behavior, mechanical properties, and microstructural organization.
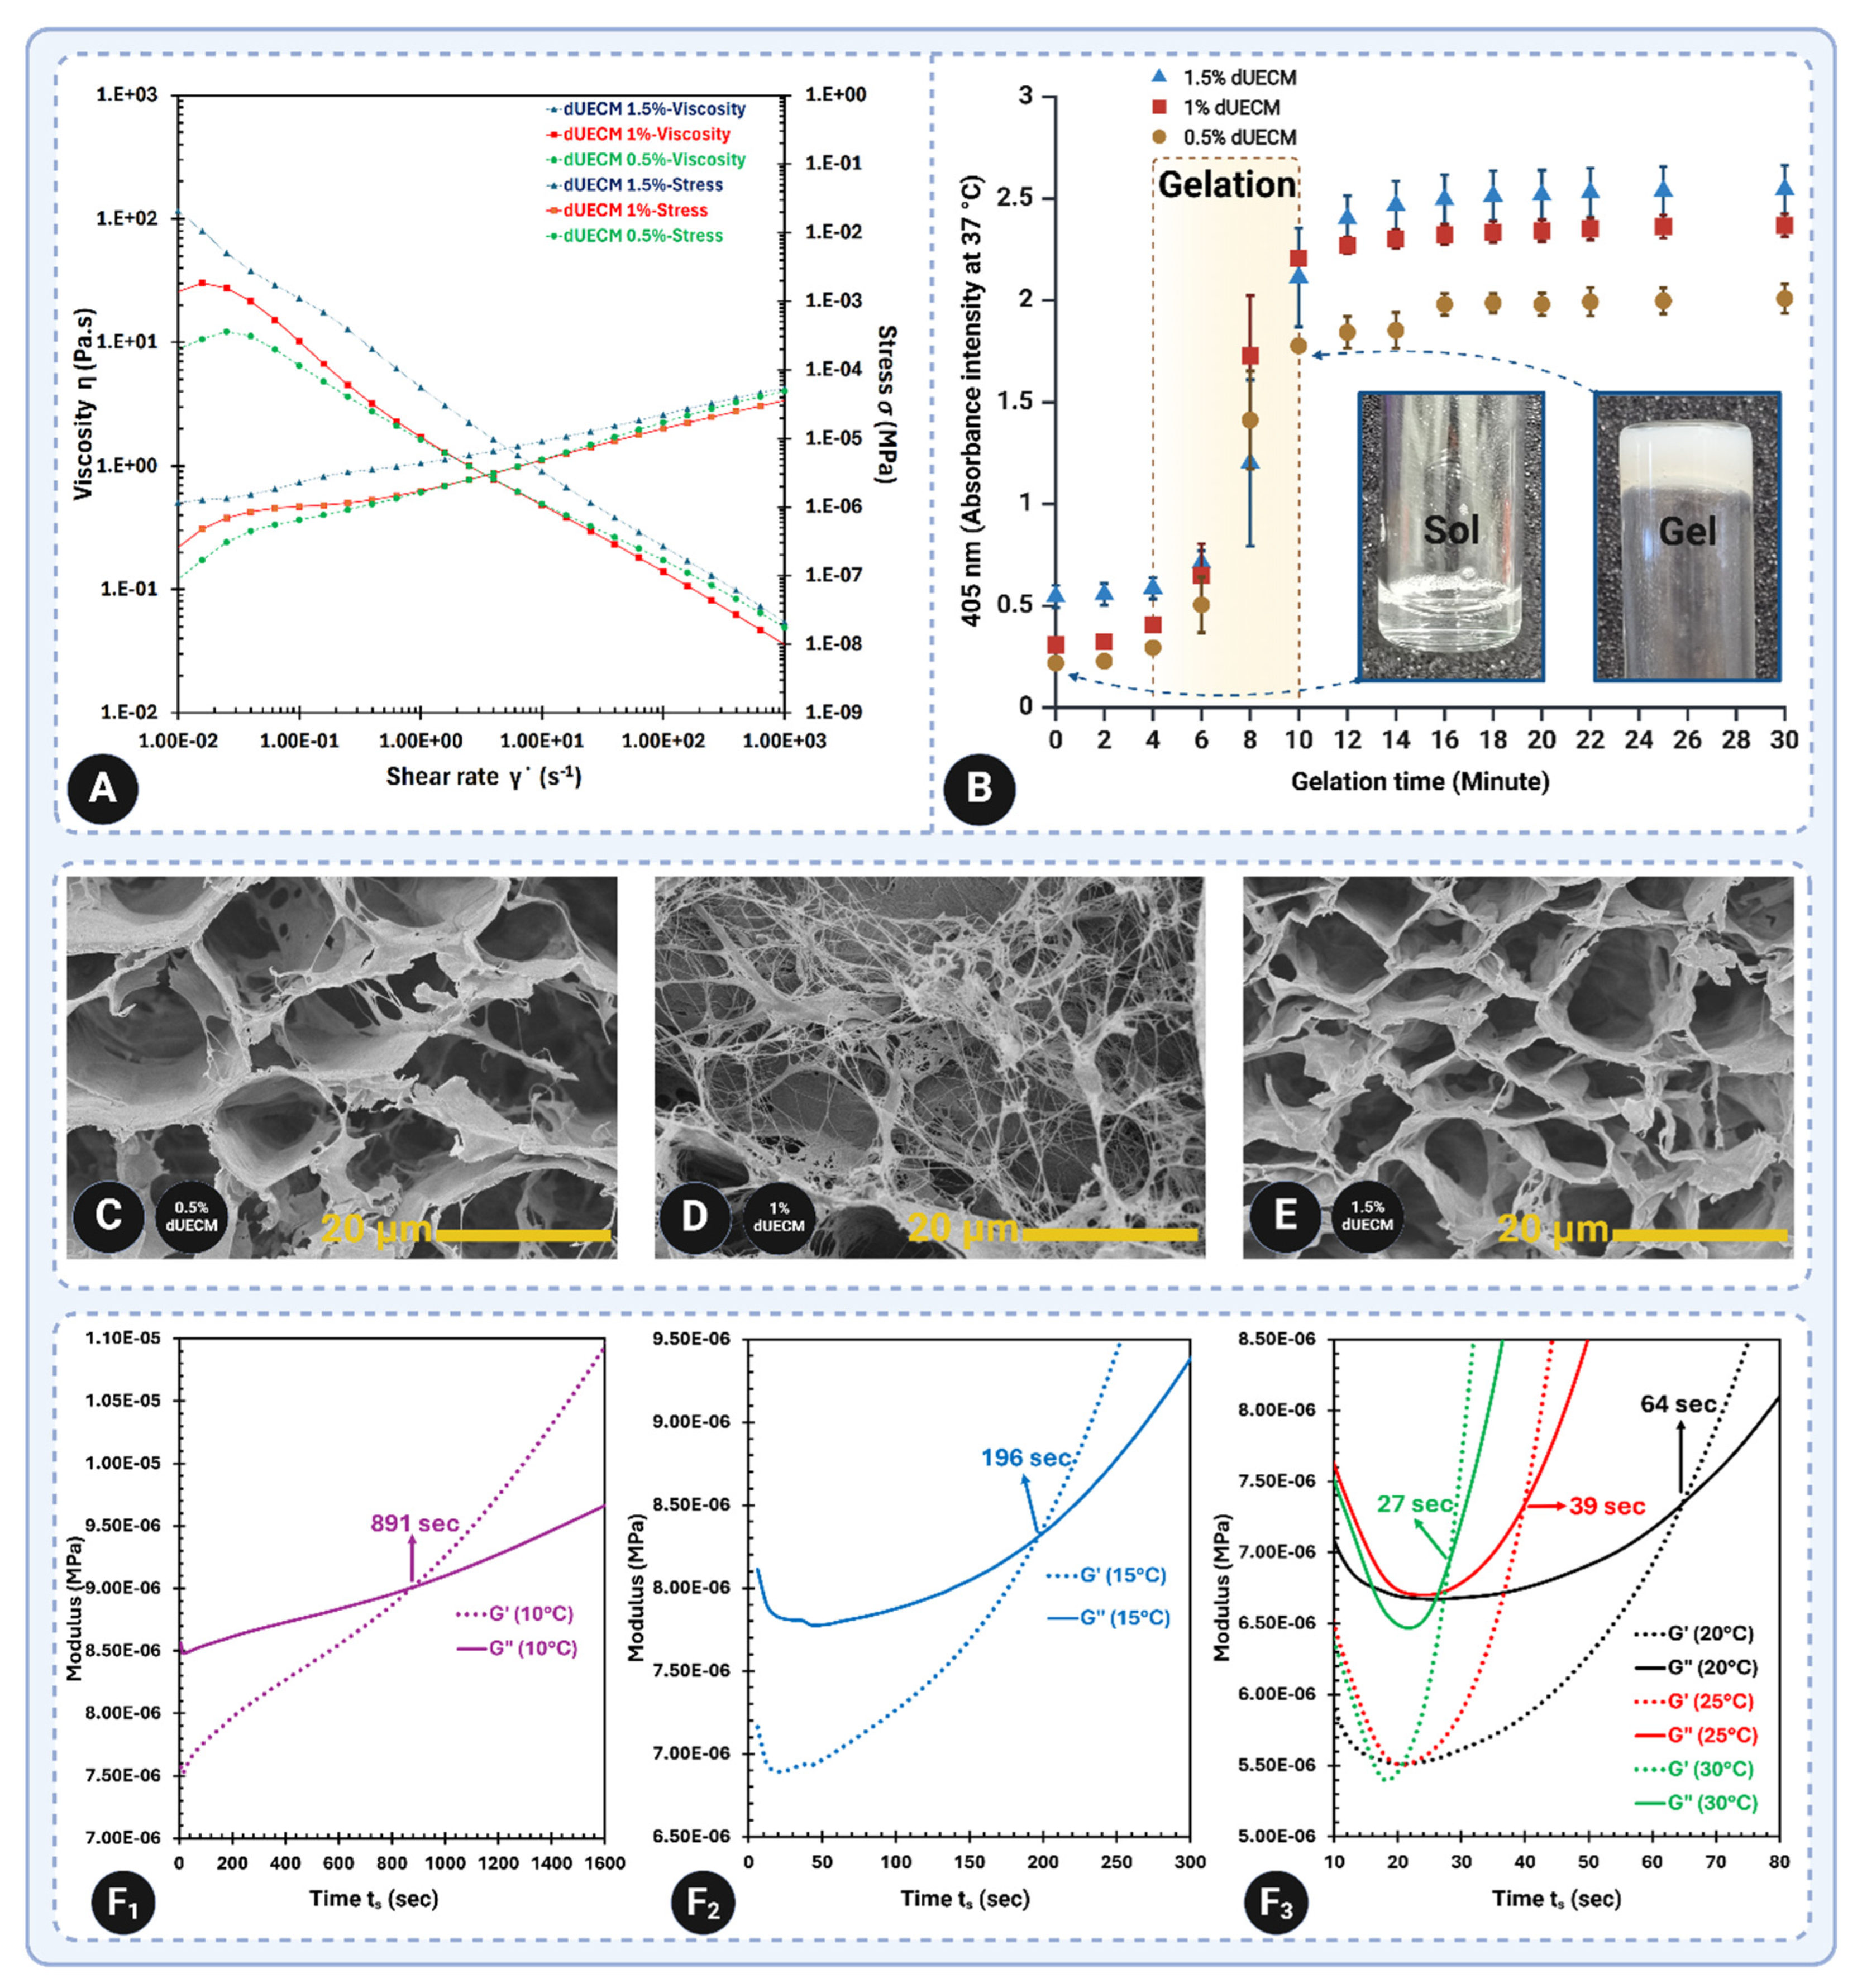
Figure 14.
Printability and structural evaluation of 3D-printed constructs. Panels A1–A4 and B1–B4 show the optical microscopy (OM) images of 2-layer and 25-layer constructs and SEM images of 25-layer constructs for the Alg 2% group (A1–A4) and Alg 3% group (B1–B4) with varying concentrations of dUECM (0.5%, 1%, and 1.5%). The images demonstrate the structural fidelity and strand morphology influenced by dUECM incorporation. Panels A5 and B5 depict the printability factors, with values closer to 1 indicating higher accuracy in reproducing the designed strand size. Panels A6 and B6 present the measured strand dimensions, with statistical comparisons showing the effects of dUECM addition on strand size. Statistical significance is indicated as follows: ns = not significant, p<0.05 (*), p<0.01 (**), p<0.001 (***), and *p<0.0001 (****). Data are presented as mean ± SD.
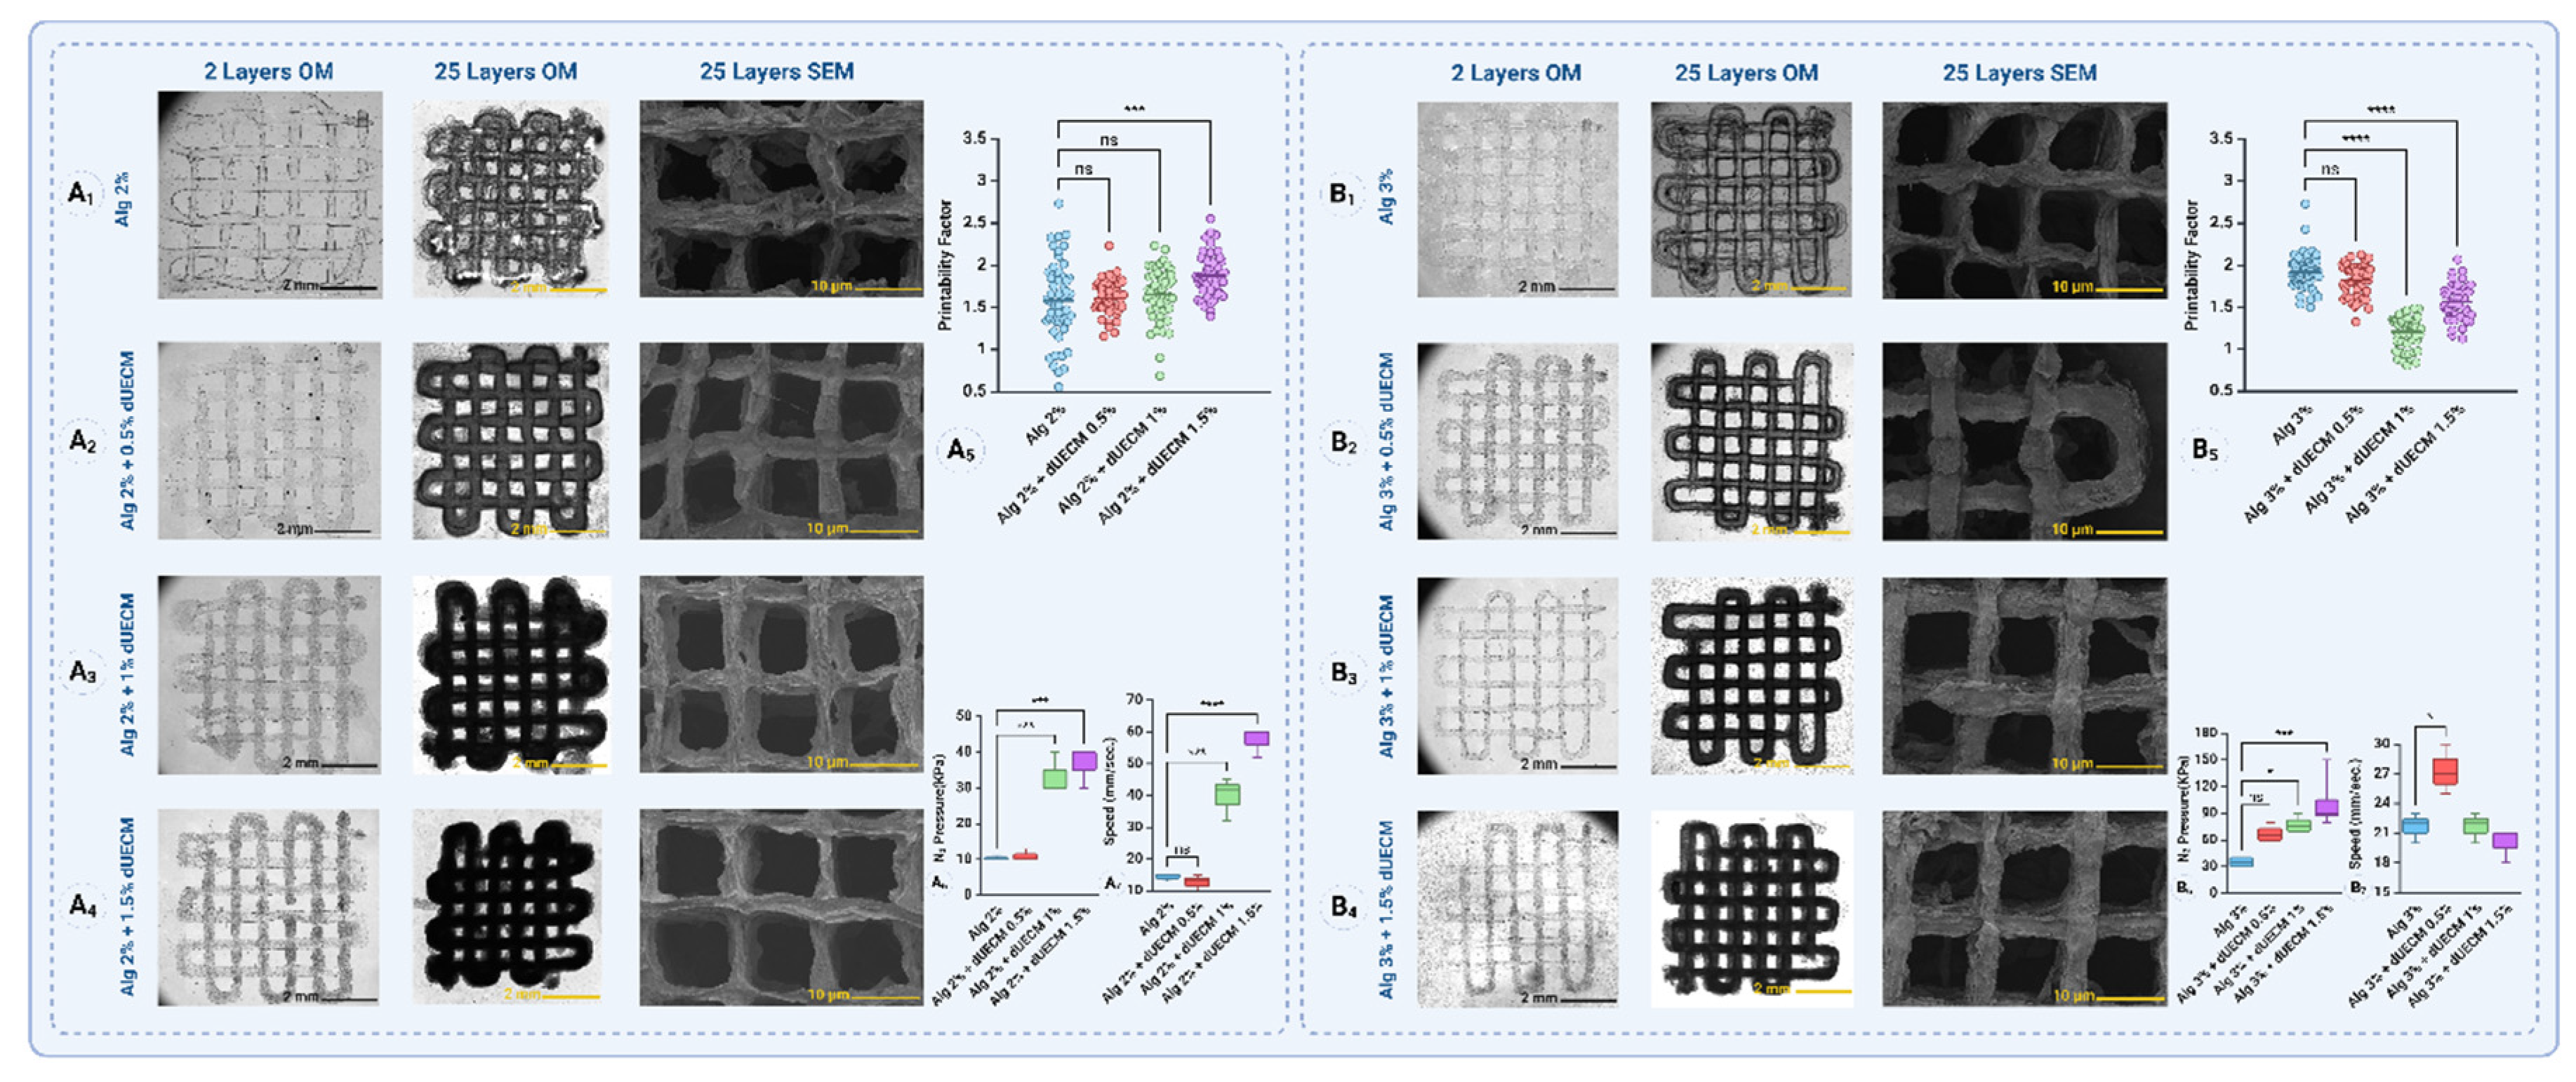
Figure 15.
Swelling, mechanical, and degradation properties of alginate-based scaffolds supplemented with varying concentrations of decellularized extracellular matrix (dUECM). Panels A1 and A2: Swelling percentages of 2% alginate groups (SA 2%:dUECM 0.5, 1 and 1.5%) and 3% alginate groups (SA 2%:dUECM 0.5, 1 and 1.5%) scaffolds, respectively, over 14 days in DMEM culture media. Panels B1 and B2: Young’s modulus of 2% and 3% alginate scaffolds, respectively, demonstrating the effect of dUECM concentrations (0.5%, 1.0%, and 1.5%) on scaffold mechanical stability over 14 days. Panel B3: Schematic representation of scaffold mechanical properties showing the structural interplay between alginate and dUECM, where higher dUECM concentrations increase scaffold stiffness and stability. Panels C1 and C2: Degradation profiles based on the percentage of remaining mass of scaffolds, highlighting the enhanced stability of scaffolds with increasing dUECM concentrations.
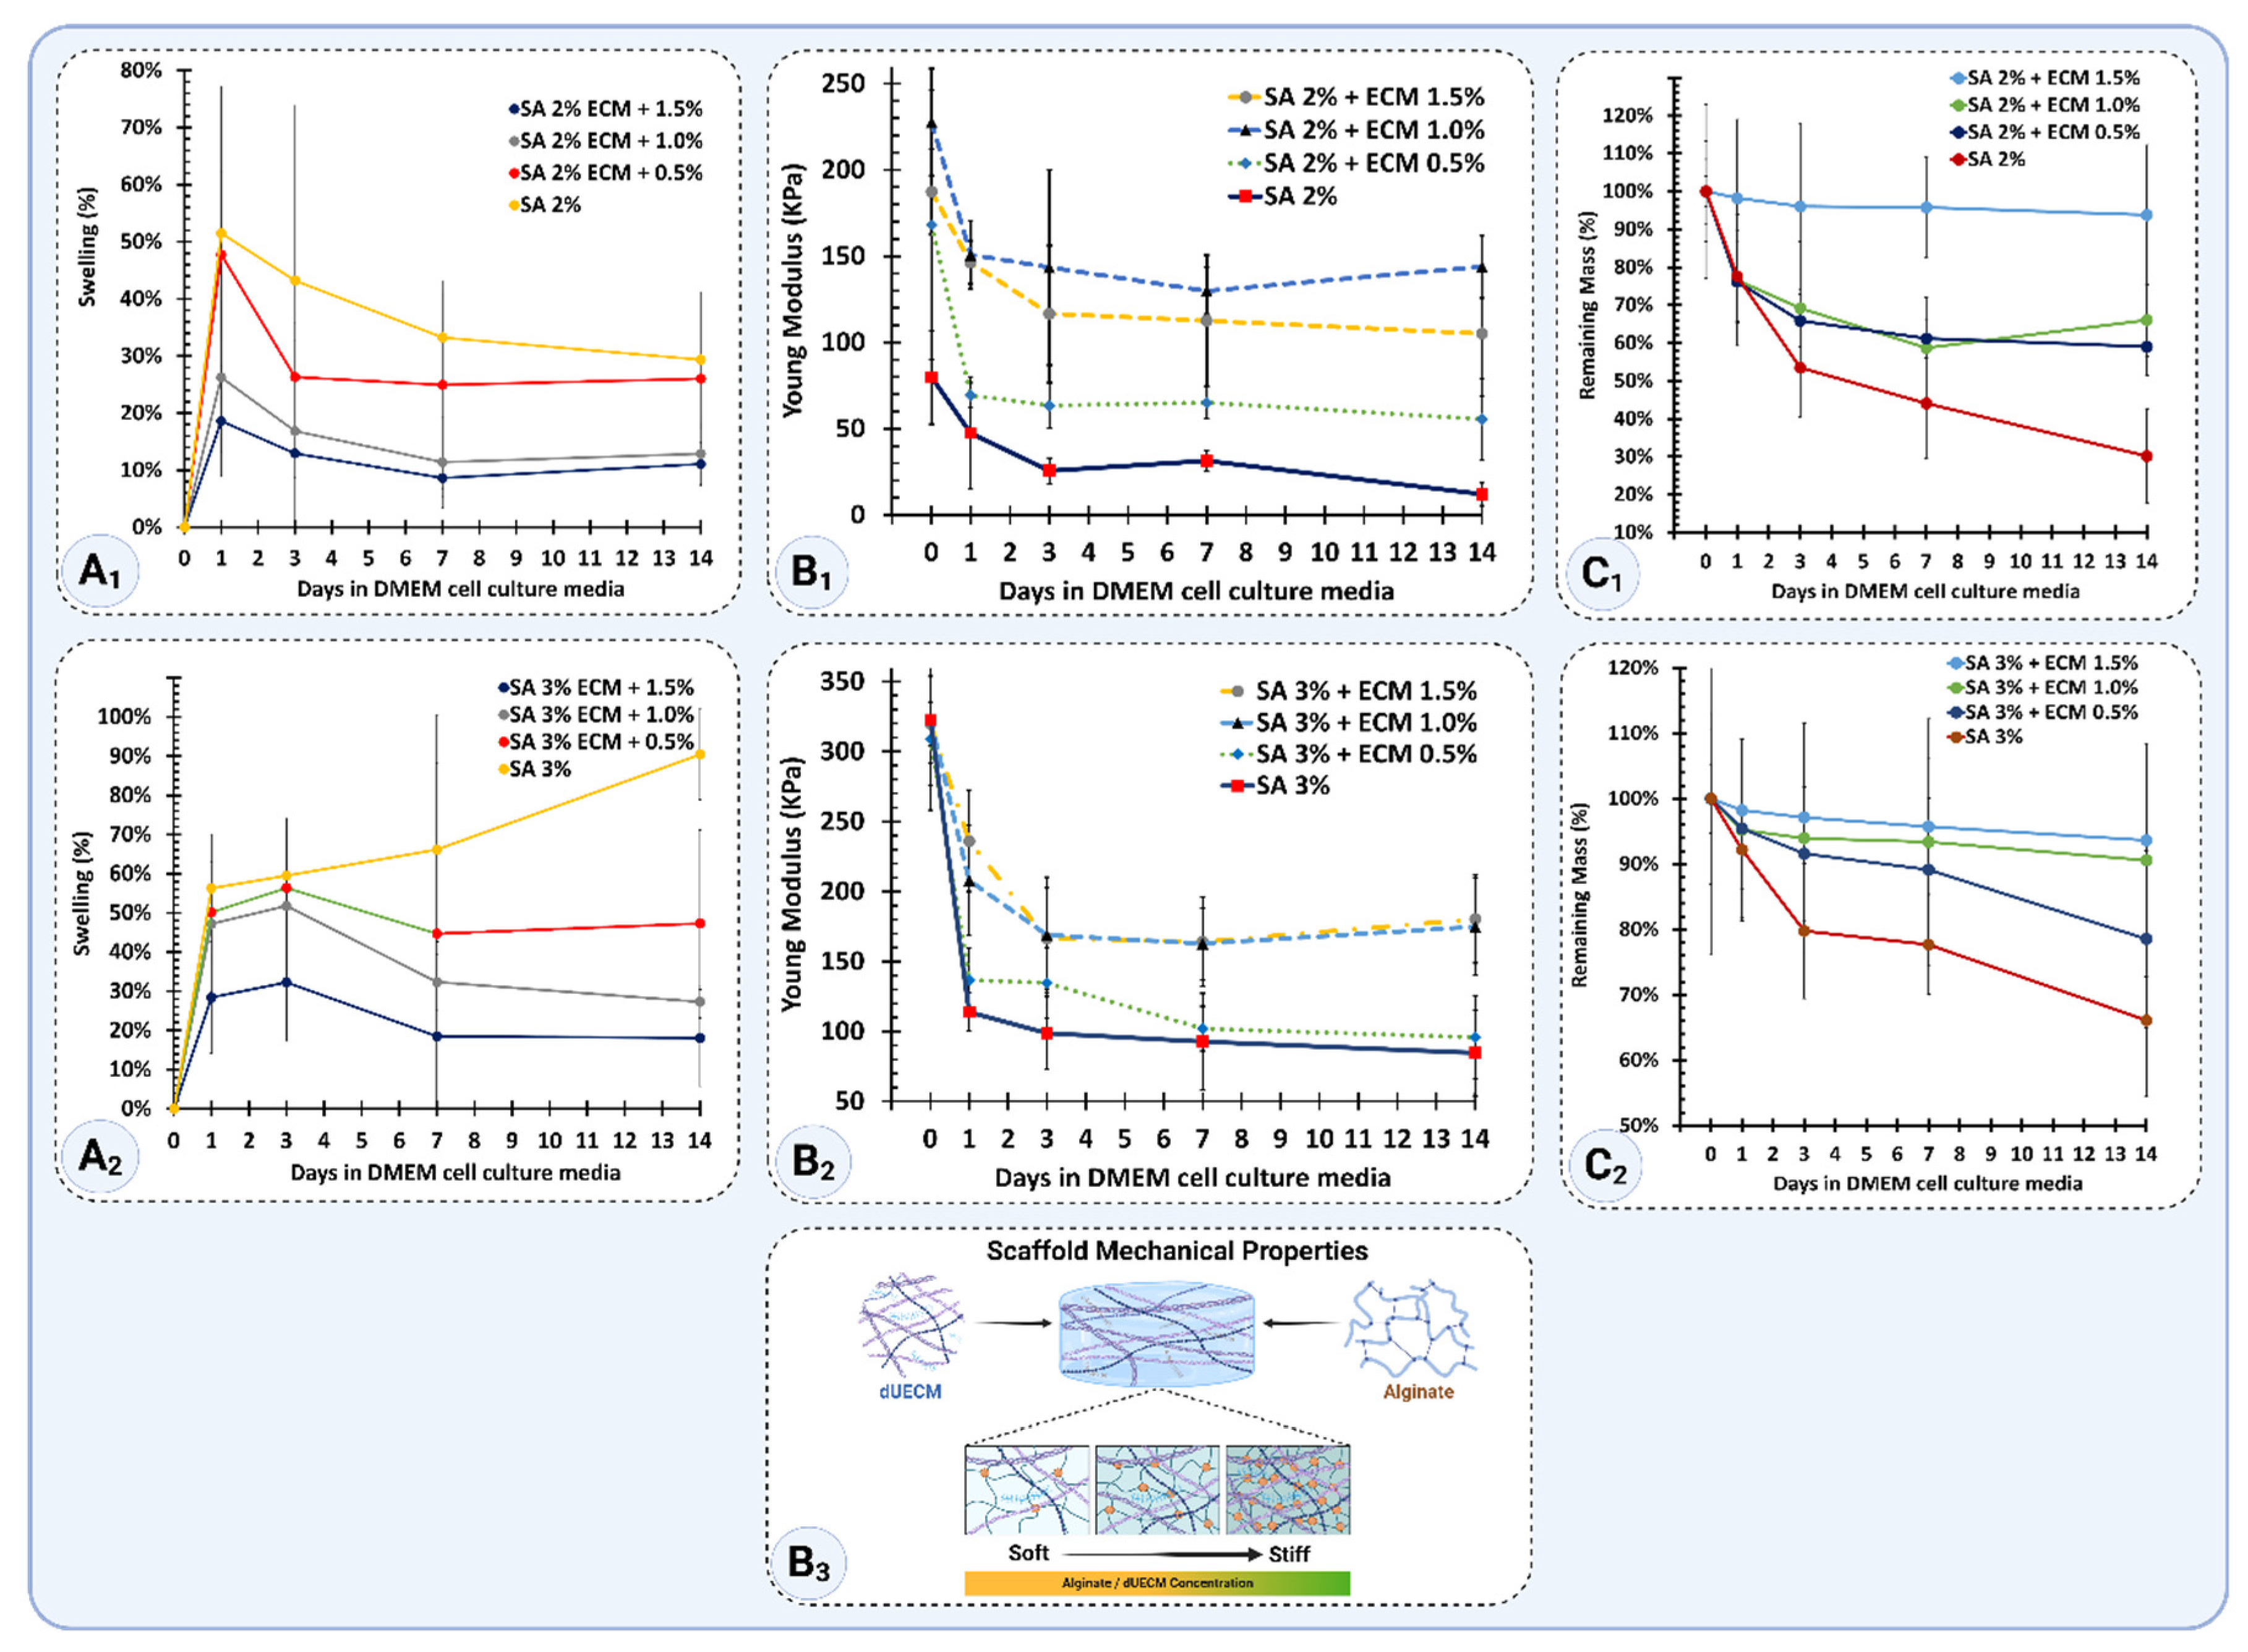
Figure 16.
MTT Assay and Live/Dead Cell Viability Assessment of hTERT-HM Cells Cultured on 3% alginate and 3% alginate + 1.5% dUECM Hydrogels. (A-D) Relative cell survival (%) of hTERT-HM cells cultured on various hydrogels for Day 1 (A), Day 3 (B), Day 5 (C), and Day 7 (D), as measured by the MTT assay. The 3% SA + 1.5% dUECM group consistently outperformed the 3% SA control group and other compositions, showing significant (p = 0.0003) enhancement in cell survival after Day 5, indicating logarithmic growth. Error bars represent standard deviations (SD) from triplicates. (E-F) Live/Dead assay images illustrating cell viability on Day 1, Day 3, Day 5, and Day 7 for (E) 3% SA control and (F) 3% SA + 1.5% dUECM hydrogels. Green fluorescence indicates live cells, while red fluorescence indicates dead cells. The 3% SA + 1.5% dUECM hydrogel demonstrated spindle-shape, enhanced cell attachment, proliferation, and survival compared to 3% SA alone. By Day 7, dense green fluorescence in the 3% SA + 1.5% dUECM group highlights robust cell viability and minimal cell death. Scale bars represent 200 µm. Statistical significance is indicated as follows: ns = not significant, p<0.05 (*), p<0.01 (**), p<0.001 (***), and *p<0.0001 (****). Data are presented as mean ± SD.
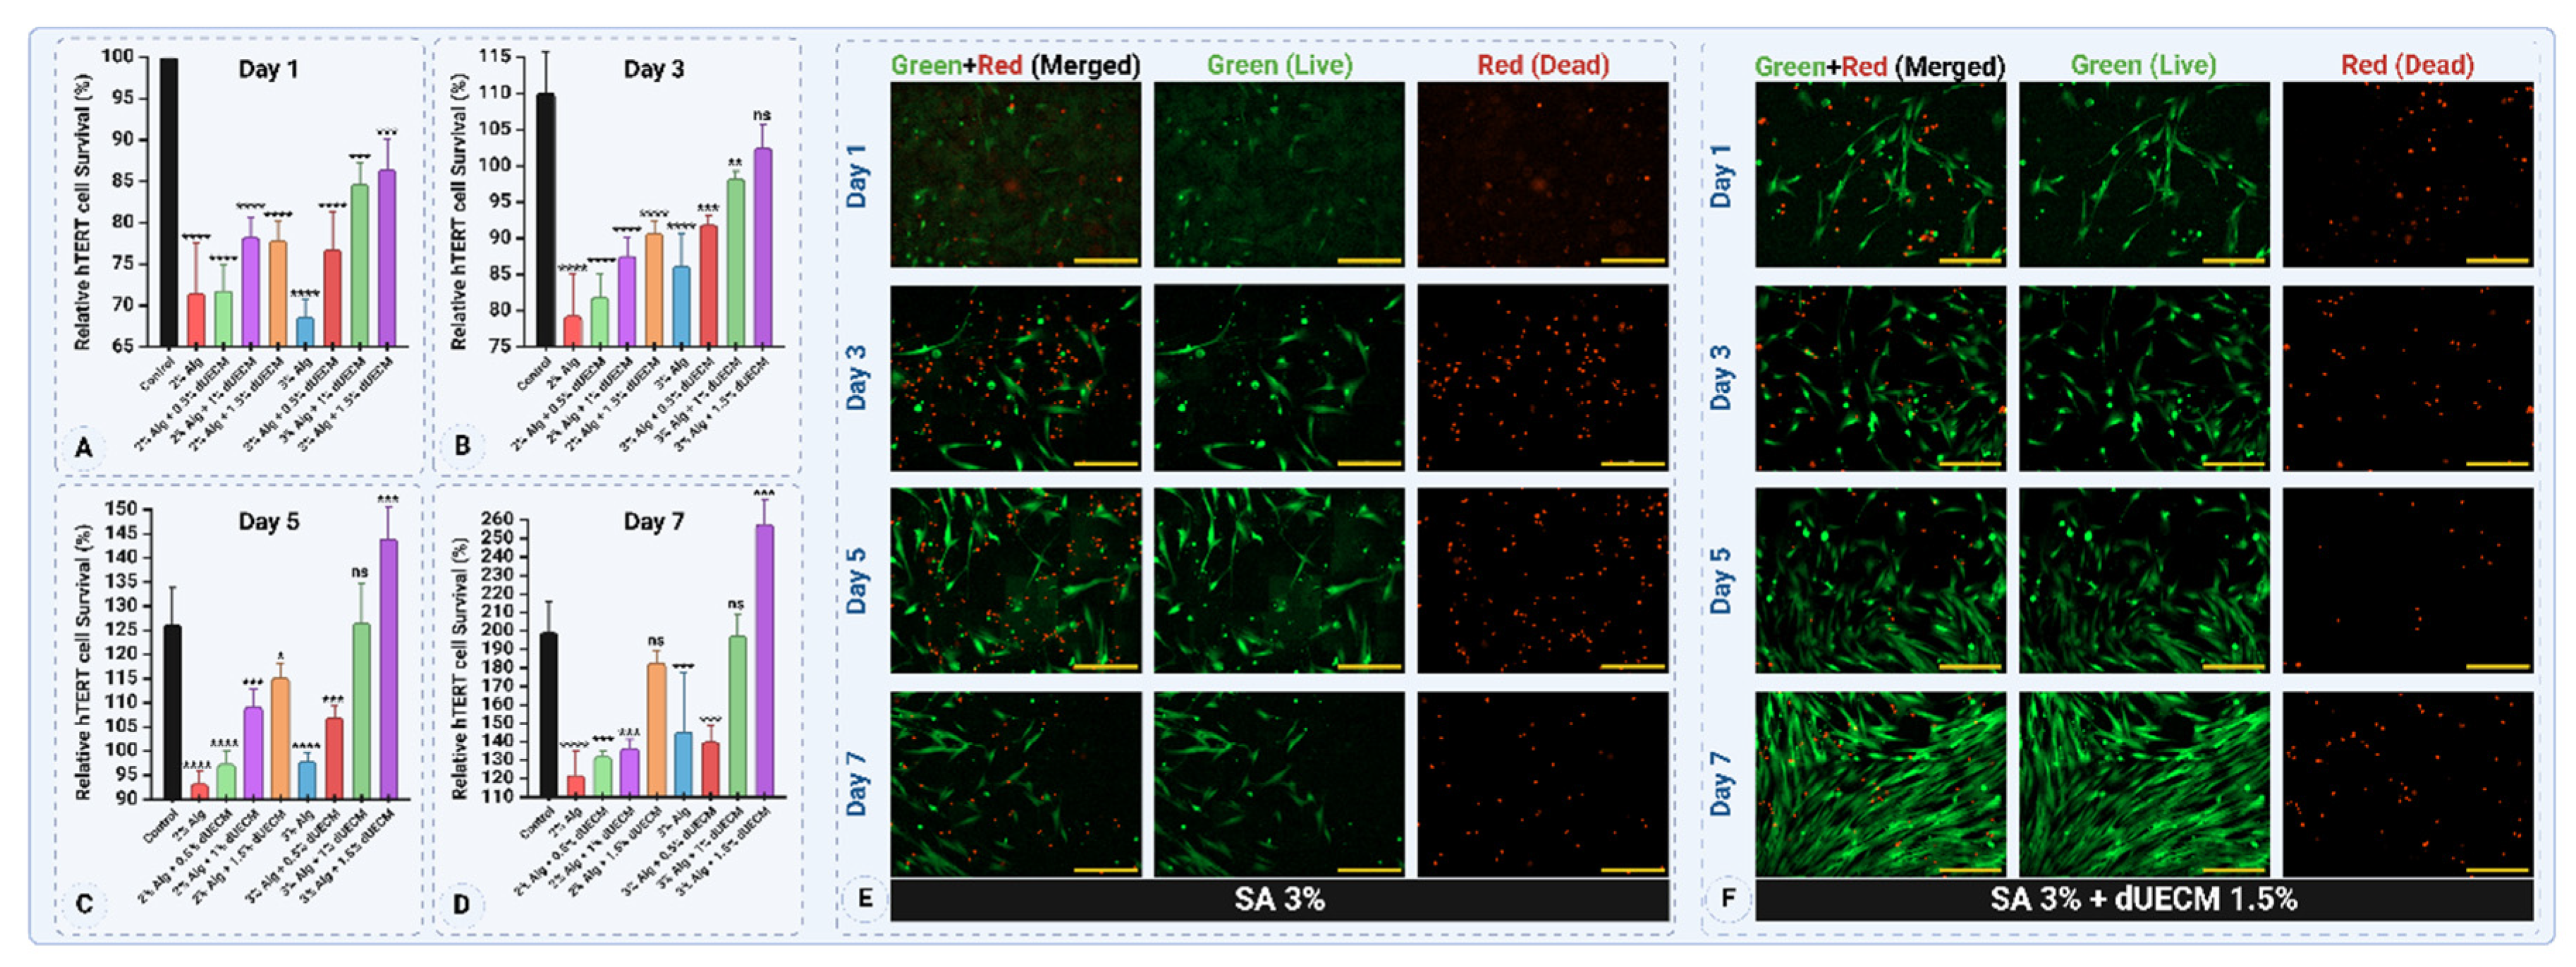
Figure 17.
Thermal, chemical, and microstructural analysis of native uterine tissue and freeze-dried hydrogels composed of Alg 3% + dUECM 1.5%. (A) TGA and showing weight loss and thermal transitions of crosslinked (CL) and non-crosslinked (NCL) hydrogels. (B) FT-IR spectra comparing crosslinked and non-crosslinked hydrogels, emphasizing the preservation of key functional groups such as Amide I, II, and III, and the prominent hydroxyl group (3700–3120 cm−1) in crosslinked hydrogels. (C1–C6) Microstructural characterization of native uterine tissue and hydrogels: (C1) H&E-stained native uterine cross-section showing distinct layers; (C2–C3) SEM images of native uterine tissue depicting the serosa, lymphatic stomata, and aligned collagen fibers; (C4–C5) cross-sectional SEM and uterine porosity structure. (D1–D5) SEM images of crosslinked Alg 3% + dUECM 1.5%, highlighting an intact surface, uniform interconnected pores, and well-aligned collagen fibers. (E1–E5) SEM images of non-crosslinked Alg 3% + dUECM 1.5%, showing cylindrical porosities, globular alginate structures, and a disrupted surface morphology. (C6) Quantitative analysis of pore size distribution in native uterine layers (endometrium, interlayer, and myometrium) and hydrogels (CL and NCL), confirming the mimicked porosity of crosslinked scaffolds for uterine tissue engineering applications.
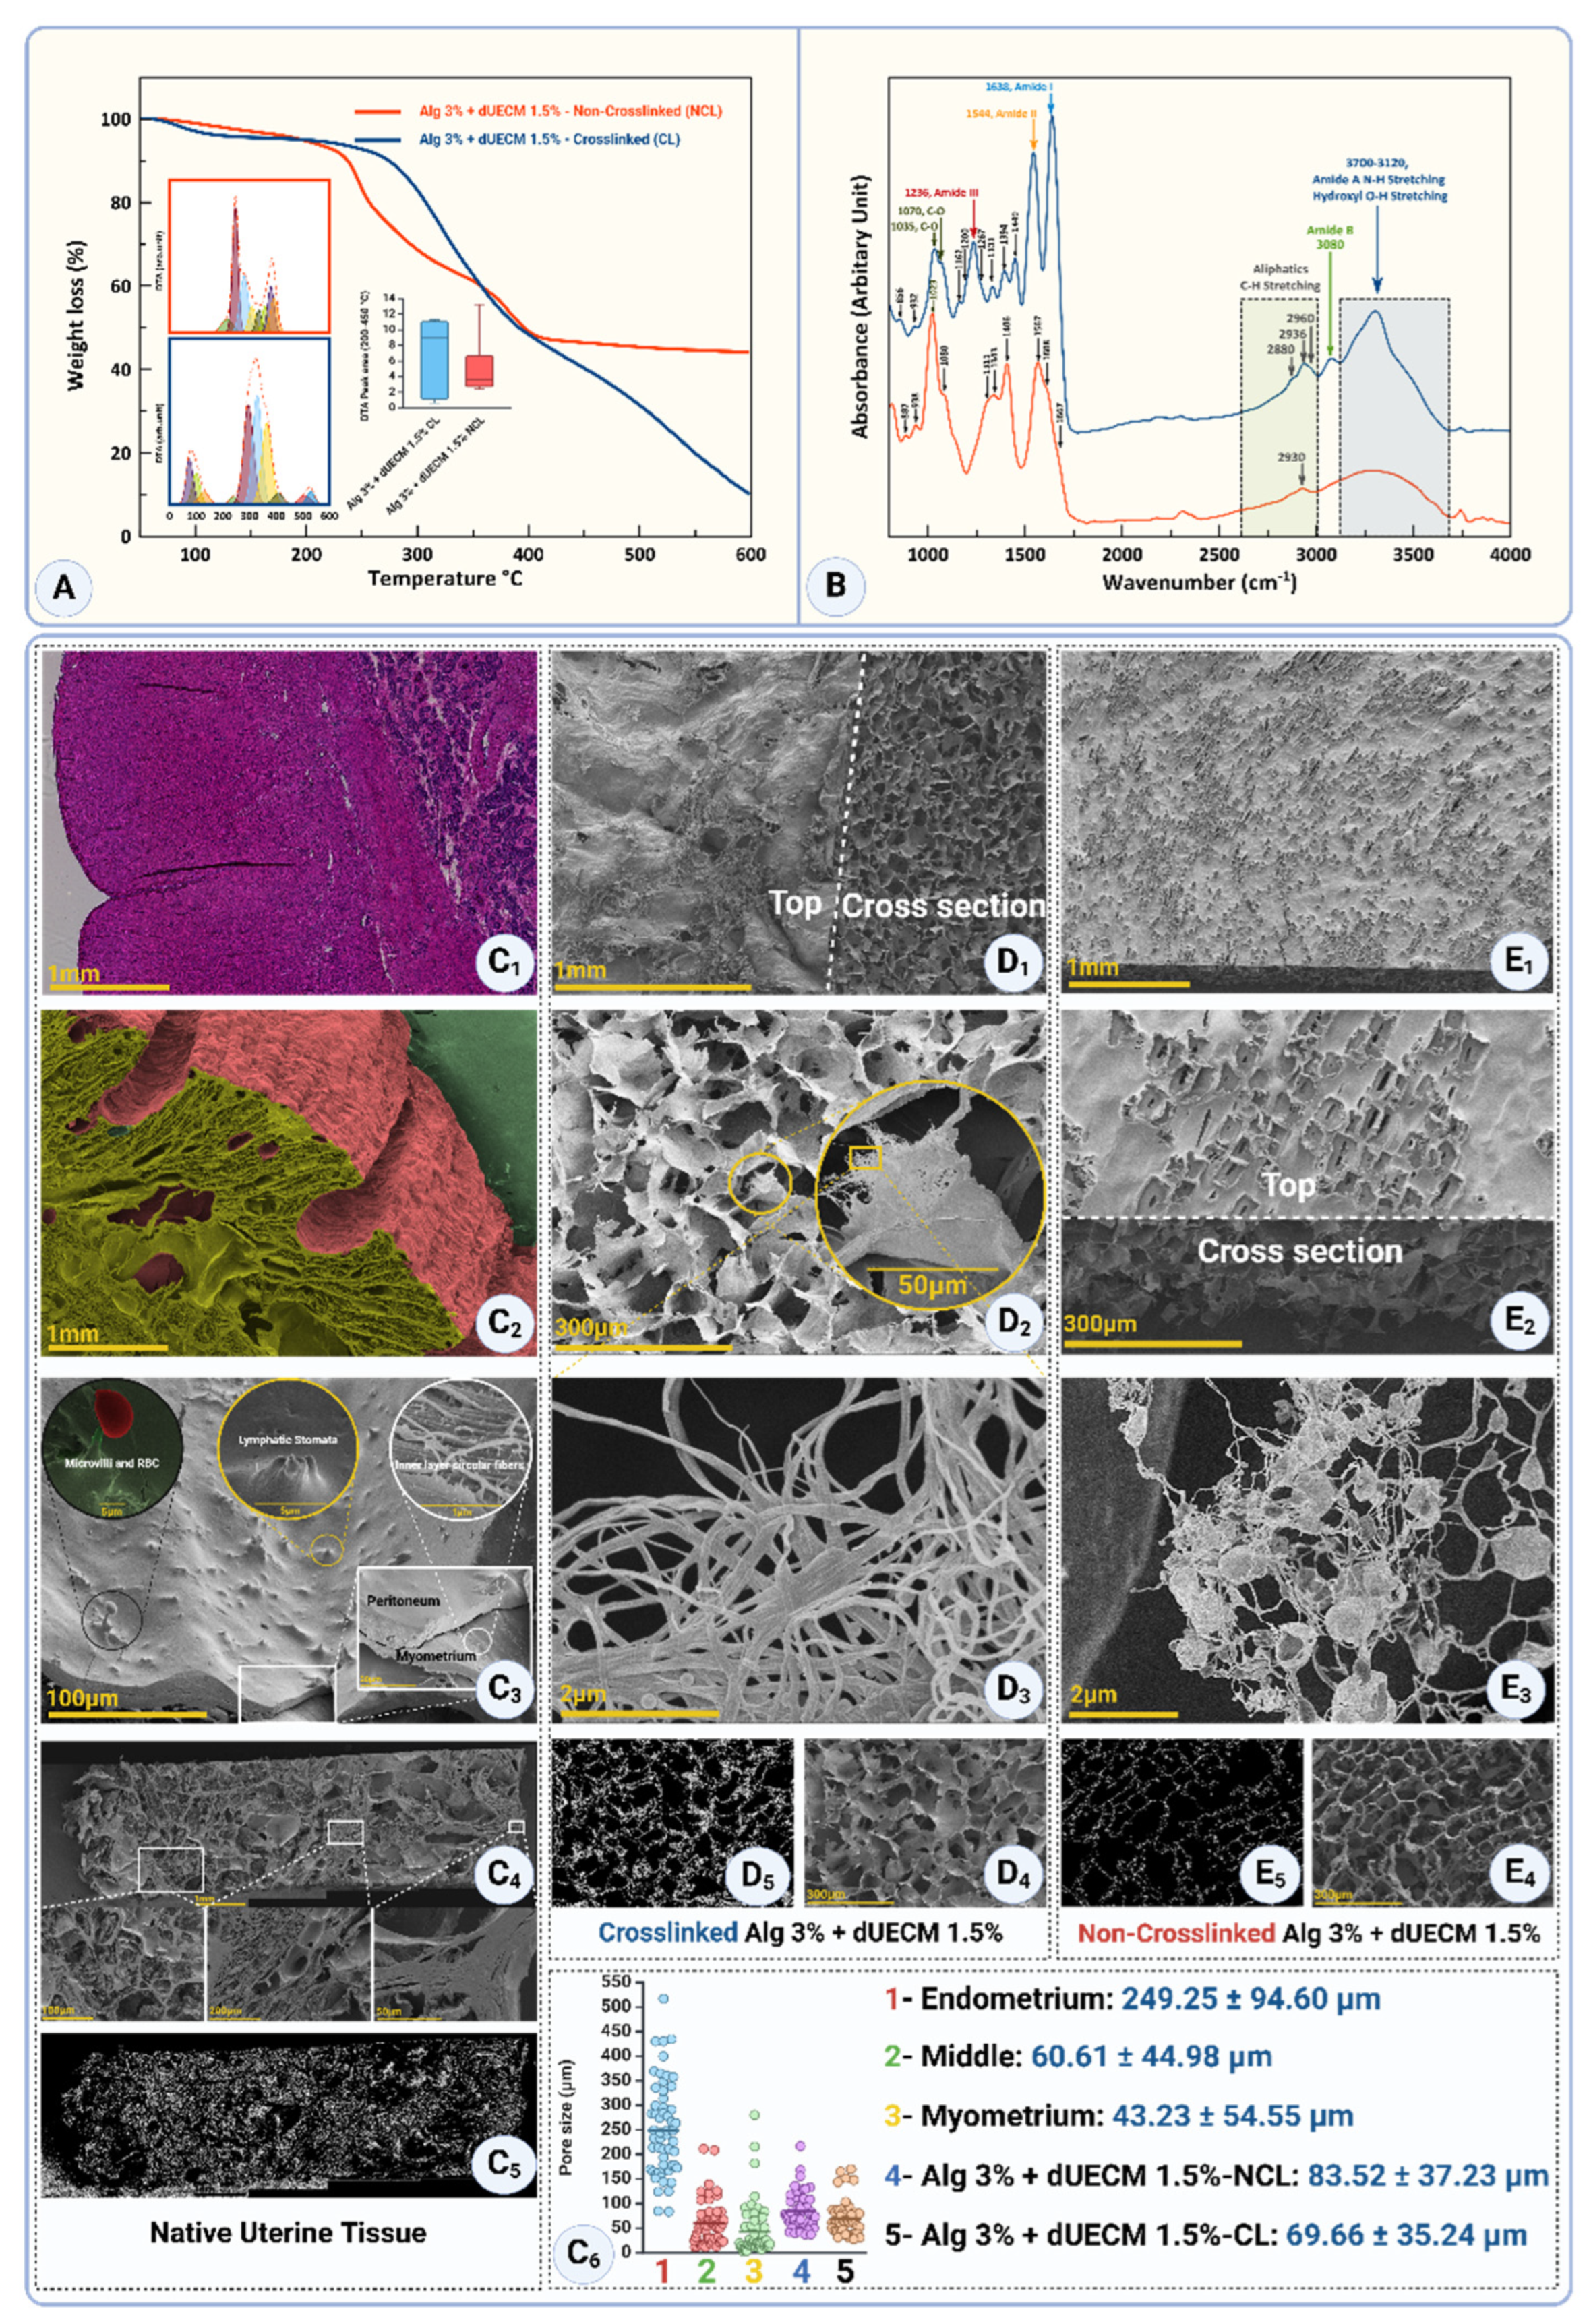

Table 1.
Peak wavenumbers, chemical assignments, vibration types, and structural significance observed in FTIR analysis of decellularized uterine tissue.
Table 1.
Peak wavenumbers, chemical assignments, vibration types, and structural significance observed in FTIR analysis of decellularized uterine tissue.
| Peak Wavenumber (cm−1) | Chemical Assignment | Vibration type | Structural significance |
|---|---|---|---|
| 3500–3200 | Hydroxyl (-OH) | Stretching | Represents hydrogen-bonded hydroxyl groups; strong in native tissue, reduced in decellularized samples. |
| 3072 | Amide B (-NH) | Stretching | Indicates N-H stretching; minor reduction observed in SDS-treated samples. |
| 2938 | Aliphatic (-CH) | Asymmetric Stretching | Reflects lipid components; relatively unchanged across all protocols. |
| 2875 | Aliphatic (-CH) | Symmetric Stretching | Represents lipid components; minimal disruption in decellularized samples. |
| 1655 | Amide I (C=O stretching) | Stretching | High in native tissue; reflects collagen integrity and secondary structure. |
| 1630 | Amide I (C=O stretching) | Stretching | Decreased intensity indicates collagen denaturation or degradation. |
| 1538 | Amide II (N-H bending, C-N) | Bending and stretching | Reduced intensity in decellularized samples, suggesting disruption of peptide bonds. |
| 1450 | Carboxylate (COO−) | Symmetric Stretching | Reflects alterations in carboxylic acid groups; varies with protocol severity. |
| 1234 | Amide III (N-H bending, C-N) | Bending and stretching | Significantly reduced with increasing SDS concentration, reflecting collagen damage. |
| 1080 | C-O-C in polysaccharides | Stretching | Indicates glycosaminoglycan (GAG) presence; loss indicates ECM component degradation. |
Table 2.
Raman shift assignments and structural implications for ECM components in decellularized tissue.
Table 2.
Raman shift assignments and structural implications for ECM components in decellularized tissue.
| Raman Shift (cm−1) | Protein Backbone/Functional Group | Assignment | Secondary Structure Motif/Feature | Relevance in Decellularization/Collagen Studies | Ref. |
|---|---|---|---|---|---|
| 1670–1680 | Amide I | C=O Stretching | β-Turn/random β-space | Associated with structural reorganization or loss of secondary structure; often indicates stress-induced conformational changes. | [46,47,48,49,50] |
| 1660–1670 | β-sheet | Indicates tight molecular packing; sensitive to hydrogen bonding and chemical treatments. | |||
| 1650–1655 | α-helix | Correlates with structural integrity; α-helical content is often reduced after harsh treatments like detergents. | |||
| 1330–1340 | Amide III | N-H Bending and C-N Stretching | α-helix | Sensitive to protein backbone vibrations; alterations reflect denaturation or stress. | [50,51] |
| 1235–1250 | β-sheet | Indicative of β-sheet formation; associated with fibril stability. | |||
| 930–950 | Skeletal Stretch | C-C Stretching | α-helix | Reflects backbone flexibility and stabilization. | |
| 1600–1610 | Aromatic Side Chains | C=C Stretching (Phenylalanine, Tyrosine) | Aromatic Ring Vibration | Highlights changes in aromatic residues, indicative of chemical alterations. | [52] |
| 1450 | CH2/CH3 Deformation | CH2/CH3 Bending | Side Chain Vibrations | Sensitive to hydration and side-chain interactions; decreased in degraded collagen. | [46] |
| 1400–1410 | COO− Symmetric Stretching | Carboxyl Groups | Ionization and Side-Chain Modifications | Reflects changes in acidic side chains during decellularization. | [53] |
| 1080 | Skeletal Stretch | C-O-C Stretching | Glycosaminoglycans (GAGs) | Indicates preservation or removal of ECM components like GAGs. | [54,55] |
| 1000 | Aromatic Side Chains | Phenylalanine Ring Breathing | Aromatic Stability | Indicates changes in phenylalanine-rich environments, reflecting stress or treatment. | [56] |
| 860–870 | Hydroxyproline | C-C Stretching in Pyrrolidine Ring | Collagen-Specific Vibrations | Strongly related to collagen stability; hydroxyproline is a marker of intact collagen. | [57] |
| 800–820 | Skeletal Backbone | C-C Bending | Backbone Flexibility | Changes reflect decellularization impacts. | [58,59] |
Disclaimer/Publisher’s Note: The statements, opinions and data contained in all publications are solely those of the individual author(s) and contributor(s) and not of MDPI and/or the editor(s). MDPI and/or the editor(s) disclaim responsibility for any injury to people or property resulting from any ideas, methods, instructions or products referred to in the content. |
© 2025 by the authors. Licensee MDPI, Basel, Switzerland. This article is an open access article distributed under the terms and conditions of the Creative Commons Attribution (CC BY) license (http://creativecommons.org/licenses/by/4.0/).
Copyright: This open access article is published under a Creative Commons CC BY 4.0 license, which permit the free download, distribution, and reuse, provided that the author and preprint are cited in any reuse.


