Submitted:
21 June 2025
Posted:
23 June 2025
You are already at the latest version
Abstract
The aim of this study was to investigate the effect of girth design and girth tension, six horses regularly ridden were used. Each horses underwent 4 experimental sessions in an unbalanced latin-square design with two girth tensions (8kg or 16kg) and two girth designs (straight girth (S) or anatomical girth(A)). Pressure between the saddle and the horse was measured at 100Hz with a pressure mat (0.5 sensels per cm2). 2D limb kinematics were determined from anatomical markers placed on the fore and hindlimbs. Video was collected at 240fps. There was no significant effect of girth type, girth tension or girth type*tension interaction for any of the measured variables, with the exception of carpal flexion, which was significantly greater for A8 (median: 103°, 25th-75th percentile: 100°-112°) than S8 (101°, 96°-106°; P=0.043). There was no effect of girth type (A or S) on mean saddle pressure for either cranial or caudal regions (p>0.05), but caudal average pressure was significantly lower than cranial average pressure both at 8 and 16kg tensions (p<0.05). For both mean and peak pressure, the ratio cranial:caudal was significantly higher with 16 kg tension (p<0.05), indicating that as the girth tension increases the pressures shift towards the cranial aspect. In conclusion, neither girth tension nor girth type significantly influenced 2D limb kinematics, but higher tension have shifted the load towards the cranial area significantly, which could contribute towards cranial thoracic back pain or injuries.
Keywords:
riding
; exercise
; equestrian
; biomechanics
; tack
1. Introduction
The girth, or cinch in Western riding, is a strap used to secure the saddle in place on ridden horses. A large variety of materials are used in girths including leather, elastic, nylon, neoprene, cotton, wool and PVC and girths also come in a large range of designs including straight, anatomical (shaped or contoured), string, dressage, jumping short and full length. Girths usually have two buckles that attach to the billets (girth straps) fixed to the saddle of which there are commonly either 2 or 3. Whatever the configuration, combined with the saddle, the girth forms a relatively inflexible ring around the horse at the level of T to T10. The girth overlays both the m.serratus ventralis thoracis and the m.pectoral ascendens whilst the saddle is pulled down onto the m.spinalis dorsi and the m.longissimus dorsi. These muscles play pivotal roles in both posture and locomotion and girth tensions required to provide saddle stability therefore have the potential to impact stride kinematics. Thus, whilst there has been interest in and speculation of the extent to which restriction by the saddle-girth system may potentially negatively impact both ventilation and locomotion, interestingly there have been relatively few published studies.
In racehorses, average resting girth tensions of 9-13kg have been reported although values as low as 3kg and as high as 22kg have been recorded [1]. However, during the process of girth tightening values as high as 53kg were recorded, with 40kg being an average peak value [1]. Bowers and Slocombe [2] investigated the effects of resting canvas girth tensions of 5, 10, 15 and 20kg on peak girth tensions in a combination of thoroughbred and standardbred horses during galloping on a treadmill. Peak expiratory tension was similar to that set at rest, but mean peak tension at inhalation was 12.8, 22.3, 32.9 and 38.0kg for 5, 10, 15 and 20kg resting tension, respectively. Furthermore, run time to fatigue was significantly decreased at 10, 15 and 20kg compared with 5kg resting tension [2]. The same authors investigated the impact of girth material in a later study [3] and found that at initial tensions of 6, 12 and 18kg, girths with elastic in reduced peak inspiratory girth tension compared with canvas girths.
The reason why high girth tensions may limit performance has been subject to much speculation, with restriction of ventilation being frequently cited [2,3]. Marlin et al. [4] demonstrated that during canter and gallop exercise, horses exhibit paradoxic chest movements such that whilst abdominal circumference increases during inhalation, there is a small decrease in chest circumference at the level of the 7th/8th ribs. In addition, simultaneous measurements of airflow and girth tension during canter show that when breath holding occurs, girth tension changes continue in phase with stride and are even elevated (Marlin, unpublished observation). The implication is that horses do not use chest expansion during canter and gallop to achieve ventilation and that tidal volume is driven by diaphragmatic movements. The likely explanation for the lack of chest expansion and contraction is that the forelimb and chest muscles effectively “lock” the frontal thorax to stabilise the shoulder in the absence of any bony attachment to the axial skeleton [5] In a treadmill study on Thoroughbred horses run at 110%VO2max, Bowers et al. concluded that “increasing girth tension was not associated with changes in respiratory mechanical or gas exchange properties” [6].
Girth tension was measured at rest and during lunging exercise at initial resting tensions of 6, 10, 14 and 18kg [7]. Girth tension increased from stand to walk to trot to canter and some differences were seen due to rein (i.e., left versus right). However, there are some methodological concerns with this study as although the load cell was able to generate readings at 200Hz, the signal was only sampled once per second and thus some detail of the signal will have been lost.
The pressure and force under a range of “standard” girths and an anatomical girth design were investigated using a pressure mat under the girth in ridden horses [8] Maximum force on the left side of the horse under the girth for the standard and anatomical girth was 344N and 281N, respectively and for the right side was 328N and 288N, respectively and these were significantly different.
The aim of the present study was to investigate the interaction between girth tension and girth type using a standard straight material girth and a leather anatomical girth at initial tensions of 8 and 16kg.
2. Material and Methods
3.1. Ethical Approval
Ethical approval was provided from the Agriculture, Animal and Environmental Sciences Research Ethics Panel, reference number 1717. Informed owner consent was obtained and each rider completed a physical activity readiness questionnaire (PAR-Q, short version) prior to the commencement of data collection.
3.2. Sample Population
A convenience sample of six horses, determined by the research equation approach [9] were used (Table 1), consisting of five geldings and one mare, with the mean± standard deviation (SD) height of 162±2cm and a mean age of 10±4 years. All horses were in regular ridden schooling work. Four of the horses were owned by private riders, two were from the Anglia Ruskin University Equine Development Centre. All horses were ridden by their owner, with the exception of the two riding school horses, ridden by a student. All horses were familiar with the environment. An arena habituation period was carried out for all horses prior to data collection.
3.3. Girth Tension and Girth Types
Initial (resting, pre-exercise) girth tension was measured using an in-line load-cell gauge (SF-916, Jiangyin Suofei Electronic Technology Co., Ltd) (Figure 1). Two girths were used (Figure 2): A standard straight girth (Unbranded) and an anatomical leather girth (A; Fairfax Short Dressage girth, Fairfax Saddles Ltd., The Saddlery, Walsall, West Midlands, WS3 2XJ, UK). All horses were ridden in their own bridles and saddles to mitigate effects of ill-fitting tack [10]. All horses were ridden in general purpose riding saddles, except for horse 2 which was ridden in a dressage saddle.
3.4. Kinetics Measurements
Pressure measurement between the saddle and horse was made with the Tekscan CONFORMat Tekscan system (Tekscan, Inc. 333 Providence Highway, Norwood, MA 02062, United States) which consists of a matrix of 32 x 32 individual resistive sensing elements (1024 in total) in a mat 47 x 47cm giving a density of 0.5 sensels per cm2. Data were sampled at 100Hz. Calibration was undertaken with the horse standing still, with the rider mounted and feet out of the stirrups. Data was collected and analysed using the proprietary software CONFORMAT Research (Tekscan, Inc. 333 Providence Highway, Norwood, MA 02062, United States). Example of data yielded can be seen in Figure 3.
3.5. Limb Kinematics
Hemispherical reflective markers (20mm diameter) were attached to both forelimbs using double-sided sticky tape as follows: the spine of the scapula; caudal humeral tuberosity; above the head of the radius; ulnar carpal bone; fetlock; coronet band (front and hind limbs); tuber coxae (Figure 3). Palpation of these anatomical locations and placement of the markers were undertaken by the same author (OR) throughout the trial to improve consistency. Markers were applied before warm-up so the horses could habituate to them. All horses were ridden in their normal saddles so there would be minimal external influences on kinematics. Video calibration was performed at the beginning of each day by filming a metre-long rule in the centre of the data collection channel (Figure 4). A camera (iPhone 15, Apple, US) was used to capture 240 frames per second. The camera was setup on a tripod approximately 7 metres perpendicular to the centre of the marked data collection channel with a second tripod holding a halogen light, which was used to illuminate the markers, placed directly behind it.
The slow-motion videos were uploaded onto a computer where 2D motion analysis software was used to analyse the videos (Quintic Biomechanics v35, Quintic Consultancy Ltd., Coleshill). Software calibration was achieved using the video containing the 1-metre rule. Angles for the shoulder, elbow, carpus and fetlock were analysed throughout a full stride length, depicting the initial toe down-stance phase for the landing forelimb, toe off, and then the full swing phase, to toe down again. All joint angles, protraction and retraction were analysed according to the relevant marker placements, and stride length was measured from toe down of one stride to toe down of the next. The maximum flexion and maximum extension values were recorded for each intervention. All whole stride within the 10s video were analysed.
3.6. Experimental Design & Protocol
The study utilised a within-subjects repeated measures design. Intervention order was semi-randomised (Table 2), to attempt to reduce order of treatment effect. For each horse, the horse was brought to the arena and the anatomical markers positioned. The pressure mat was placed on the horse by the same author (EM) to try to ensure consistency. No saddle pad was used. The saddle was placed on the horse and the girth tightened with the tension gauge in-line (Figure 1). Once the rider had mounted, a few minutes were given to allow for stretching and compression of the mat, saddle and girth. The girth was then loosened and the mat calibrated to the weight of the rider and saddle. The required girth tension was then achieved by tightening at the end of exhalation to either 8kg or 16kg. Prior to data collection, each horse underwent their usual warm-up routine, for approximately five minutes, to allow for acclimatisation to the arena. The warm-up and data collection were carried out in the same arena (60x24m) on an Andrews Bowen Propell surface. All data collection took place over 2 days. Once warmed-up, horses completed three passes through the alleyway, at rising trot, on each rein, in which ten seconds of data were collected. Passes were discarded if the horses changed gait or showed any inconsistency in gait.
3.7. Data Analysis and Statistical Analysis
Difference score (%) cranial:caudal was calculated by the equation:
Difference score (%)= (cranial-caudal)/caudal
Statistical analysis was undertaken using SPSS software (v29.0, IBM, Armonk, New York, USA).
3.7.1. Kinetics Data
Shapiro-Wilk test indicated that all kinetics data assumed a normal-distribution (p>0.05), therefore a two-way repeated measures ANOVA was used to determine main effects of girth (A or S) and tension (8 kg or 16 kg) and interaction effects of girth*tension. Data are presented as mean±SD with significance set at p<0.05.
3.7.2. Kinematics Data
Shapiro-Wilk test indicated that for limb kinematics, data were parametric for all data, but for retraction. Data with normal-distribution (p>0.05 on Shapiro-Wik test) were analysed with a two-way repeated measures ANOVA to determine main effects of girth (A or S) and tension (8 kg or 16 kg) and interaction effects of girth*tension. Non-parametric data (p<0.05 on Shapiro-Wil test), Wilcoxon’s rank tests (for non-parametric pairs) or paired t-tests (for parametric pairs) were used to analyse the data.
3. Results
All horses completed all interventions. Data for the left and right rein passes were combined.
3.1. Kinematics
Results for all kinematics variables are available in Table 3.
There was no significant effect of girth type, girth tension or girth type*tension interaction for any of the measured variables, with the exception of carpal flexion.
When we investigated the main and interaction effects of girth design and tension on forelimb carpus flexion, we found that the interaction effect Design*Tension on carpus flexion was not significant (F(1,5)=2.824, P=0.154). Furthermore, there was no significant main effect for tension on carpus flexion (F(1,5)=0.068, P=0.804); however, there was a significant main effect for design on carpus flexion (F(1,5)=7.317, P=0.043). Post hoc analysis with a Bonferroni adjustment revealed that carpal flexion was statistically significantly higher with A8 when compared to S8 (-2.954 (95% CI, -5.760 to -0.147)°, p =0.043) (Figure 5)
3.2. Kinetics
Results for kinetics variables are available in Table 4.
There was no effect of girth type on mean saddle pressure for either cranial or caudal regions, but the 16kg tension has increased the mean saddle pressure on the cranial area of the saddle, in comparison with the 8kg tension (F(1.5)= 10.81, P=0.022).
When analysing % difference score caudal: cranial areas of the saddle mean pressure distribution, there was a main effect of the girth tension F(1,5)= 7.832, p=0.038, with a considerably higher loaded cranial area with the 16 kg tension in comparison with the 8kg tension, a mean difference of 32.9%. Meaning that as the tension increased to 16kg, the mean pressure has significantly moved towards the cranial area of the saddle (Figure 6).
Peak saddle pressure was not significantly different between region or girth type or girth tension. However, when analysing the % difference score between cranial:caudal areas of the saddle, peak pressure has shown a significant shift towards the cranial area in the 16kg tension, with 33.2% more peak pressure, in average, on the cranial area with 16 kg tension in comparison with 8 kg tension (F(1,5)= 7.310, p=0.043) (Figure 7).
For the mean force (N) under the saddle, there was no main effect of girth type for neither cranial nor caudal regions, but the 16kg tension has increased significantly the mean force on the cranial area of the saddle, in comparison with the 8kg tension (F(1.5)= 9.43, P=0.028).
4. Discussion
Mean pressures in the present study are similar to those previously reported for rising trot [11,12]. A ratio of ~2.5 to 1 for cranial to caudal mean saddle pressure for a correctly fitted saddle has also been reported previously [12] as seen in the present study.
As far as we are aware this is the first study to investigate the effect of different girth tensions on saddle pressures. Neither average nor peak saddle pressure were affected by girth tension, despite quite a large difference (8kg versus 16kg) and the fact that we had anticipated that an increase in girth tension would result in an increase in pressure between the saddle and horse. However, we have observed a significant shift on the mean and peak pressures towards the cranial part f the saddle as the tension increased. The rationale for expecting an increase is that the saddles and girths used effectively produce a largely inflexible “ring” around the horses’ frontal thorax. Girth tension shows cyclical changes related to both breathing and or stride in horses. Chest movements at the level of the 7th rib, which is the approximate location of where the girth sits, at rest and during trot in unridden horses exercising on a treadmill have been shown to correlate with ventilation whilst at canter and gallop they are unrelated to ventilation and are related to forelimb position and muscle volume underlying the girth. There may be several explanations as to why we did not see an impact of girth tension on saddle pressure. The first is that the riders’ contribution to saddle pressure given a mass of around 75kg and a force of 150kg at 1.5g acceleration in rising trot far exceeds the force contribution of the girth. In addition, whilst the girth tension was set prior to exercise and confirmed after exercise, as tension was not measured during the test it is conceivable that the compensation by the horse may have reduced the impact of the different pre-exercise tensions.
Wright [7] investigated the effect of pre-exercise girth tensions of 6, 10, 14 and 18kg in Hanovarian horses lunged on a circle. The girth used was an inflexible (in terms of length) padded material girth. As data were only collected at 1Hz peak values are unreliable but the average reported values may be acceptable. At walk there was minimal change in mean girth tension from that at rest, but at trot and canter the 6kg resting tension had increased to a mean of 7.1 (+18%) and 9.6kg (+60%), respectively, whilst for the 18kg resting tension, the increase at trot was to a mean of 21.3kg (+18%) and 24.3kg (+35%) at canter. Given that in galloping horses initial tensions of only 10kg result in a reduction of run time to fatigue of 14% compared with an initial tension of 5kg, it would be surprising if girth tensions of this level did not have some effect on horses performance.
Bowers and Slocombe compared elasticated and canvas girths but did not study leather girths [3,6]. In the present study both girths, although constructed of different materials (leather and material), can be considered to be relatively inelastic. Murray et al. [8] investigated pressure beneath a variety of unspecified girths and an anatomically shaped girth and reported that the anatomical girth reduced peak under-girth pressures and improved limb protraction and carpal/tarsal flexion in rising trot. Whilst Murray et al. found significant differences in girth design, specifically that the anatomical girth performed better, it is perhaps surprising that in the present study we found a significant effect of tension but not girth type/material. One important difference is that Murray et al. used elite horses and riders [8] whilst in the present study the horses and riders were not elite. It is also conceivable that standardisation of girth tension negated any difference between the girth types.
In the study of Murray et al. [8] girth tension was not measured. Instead the authors reported that “the girth was tightened symmetrically to the tension that the rider normally used”. Whilst the tensions commonly used in racing have been reported [1] we are not aware of any studies investigating tensions commonly used in others equestrian disciplines. Resting girth tension in the study of Bowers and Slocombe [1] ranged from 3 to 20kg after tightening but before exercise. This was used as the basis to set the two tensions used in the present study.
Given that both girth design, girth material and girth tension have been shown to influence limb kinematics and onset of fatigue [2,8], it is surprising that this area has received so little attention and clearly there is scope for further research examining the interaction of girth material, girth design, girth tension and gait. Research should also be undertaken to describe the typical pre-exercise girth tensions used by riders competing dressage, jumping and cross-country.
The main limitation of this study is the small number of horses. For example, to detect a change of 5kPa from a mean of 15±5 kPa in the present study only has a power of 46%.
5. Conclusions
In conclusion, girth tension and girth type had minor effects on limb kinematics, and regarding kinetics, the main effect seem was a significant shift of the mean pressure and peak pressure towards the cranial aspect of the saddle in non-elite horses and riders in rising trot.
Author Contributions
Conceptualization, D.M. and R.B..; methodology, D.M. and R.B..; software, D.M. and R.B.; validation, D.M. and R.B..; formal analysis, D.M.; O.R.; E.M.; R.B.; investigation, D.M.; O.R.; E.M.; R.B.; resources, D.M. and R.B..; data curation, O.R. and E.M.; writing—original draft preparation, D.M. and R.B..; writing—review and editing, O.R and E.M..; supervision, R.B.; All authors have read and agreed to the published version of the manuscript.
Funding
This research received no external funding
Institutional Review Board Statement
The study was conducted in accordance with the Declaration of Helsinki, and approved by Agriculture, Animal and Environmental Sciences Research Ethics Panel, reference number 1717
Data Availability Statement
Dataset available on request from the authors
Conflicts of Interest
The authors declare no conflicts of interest
Abbreviations
The following abbreviations are used in this manuscript:
| ROM | Range of Motion |
| A | Anatomical Girth |
| S | Straight Girth |
References
- BOWERS, J.; SLOCOMBE, R. Tensions Used on Girths on Thoroughbred Racehorses. Aust Vet J 2000, 78, 567–569. [Google Scholar] [CrossRef] [PubMed]
- BOWERS, J.R.; SLOCOMBE, R.F. Influence of Girth Strap Tensions on Athletic Performance of Racehorses. Equine Vet J 1999, 31, 52–56. [Google Scholar] [CrossRef] [PubMed]
- BOWERS, J.; SLOCOMBE, R.; SIDES, R.; BAYLY, W.; KINGSTON, J. Interaction of Saddle Girth Construction and Tension on Respiratory Mechanics and Gas Exchange during Supramaximal Treadmill Exercise in Horses. Aust Vet J 2005, 83, 62–67. [Google Scholar] [CrossRef] [PubMed]
- MARLIN, D.J.; SCHROTER, R.C.; CASHMAN, P.M.M.; DEATON, C.M.; POOLE, D.C.; KINDIG, C.A.; McDONOUGH, P.; ERICKSON, H.H. Movements of Thoracic and Abdominal Compartments during Ventilation at Rest and during Exercise. Equine Vet J 2002, 34, 384–390. [Google Scholar] [CrossRef] [PubMed]
- Dyce, K.M.; Sack, W.O.; Wensing, C.J.G. Textbook of Veterinary Anatomy; 4th ed.; 2009;
- BOWERS, J.; SLOCOMBE, R. Comparison of Girth Materials, Girth Tensions and Their Effects on Performance in Racehorses. Aust Vet J 2005, 83, 68–74. [Google Scholar] [CrossRef] [PubMed]
- Wright, S. Girth Tensions and Their Variability While Standing and during Exercise. Comp Exerc Physiol 2010, 7, 141–148. [Google Scholar] [CrossRef]
- Murray, R.; Guire, R.; Fisher, M.; Fairfax, V. Girth Pressure Measurements Reveal High Peak Pressures That Can Be Avoided Using an Alternative Girth Design That Also Results in Increased Limb Protraction and Flexion in the Swing Phase. The Veterinary Journal 2013, 198, 92–97. [Google Scholar] [CrossRef] [PubMed]
- Arifin, W.N.; Zahiruddin, W.M. Sample Size Calculation in Animal Studies Using Resource Equation Approach. Malaysian Journal of Medical Sciences 2017, 24, 101–105. [Google Scholar] [CrossRef]
- Meschan, E.M.; Peham, C.; Schobesberger, H.; Licka, T.F. The Influence of the Width of the Saddle Tree on the Forces and the Pressure Distribution under the Saddle. The Veterinary Journal 2007, 173, 578–584. [Google Scholar] [CrossRef] [PubMed]
- Martin, P.; Cheze, L.; Pourcelot, P.; Desquilbet, L.; Duray, L.; Chateau, H. Effect of the Rider Position during Rising Trot on the Horse׳s Biomechanics (Back and Trunk Kinematics and Pressure under the Saddle). J Biomech 2016, 49, 1027–1033. [Google Scholar] [CrossRef] [PubMed]
- Murray, R.; Guire, R.; Fisher, M.; Fairfax, V. Reducing Peak Pressures Under the Saddle Panel at the Level of the 10th to 13th Thoracic Vertebrae May Be Associated With Improved Gait Features, Even When Saddles Are Fitted to Published Guidelines. J Equine Vet Sci 2017, 54, 60–69. [Google Scholar] [CrossRef]
Figure 1.
Tension gauge.

Figure 2.
A) Standard straight material girth (S) and B) anatomical leather girth (F).
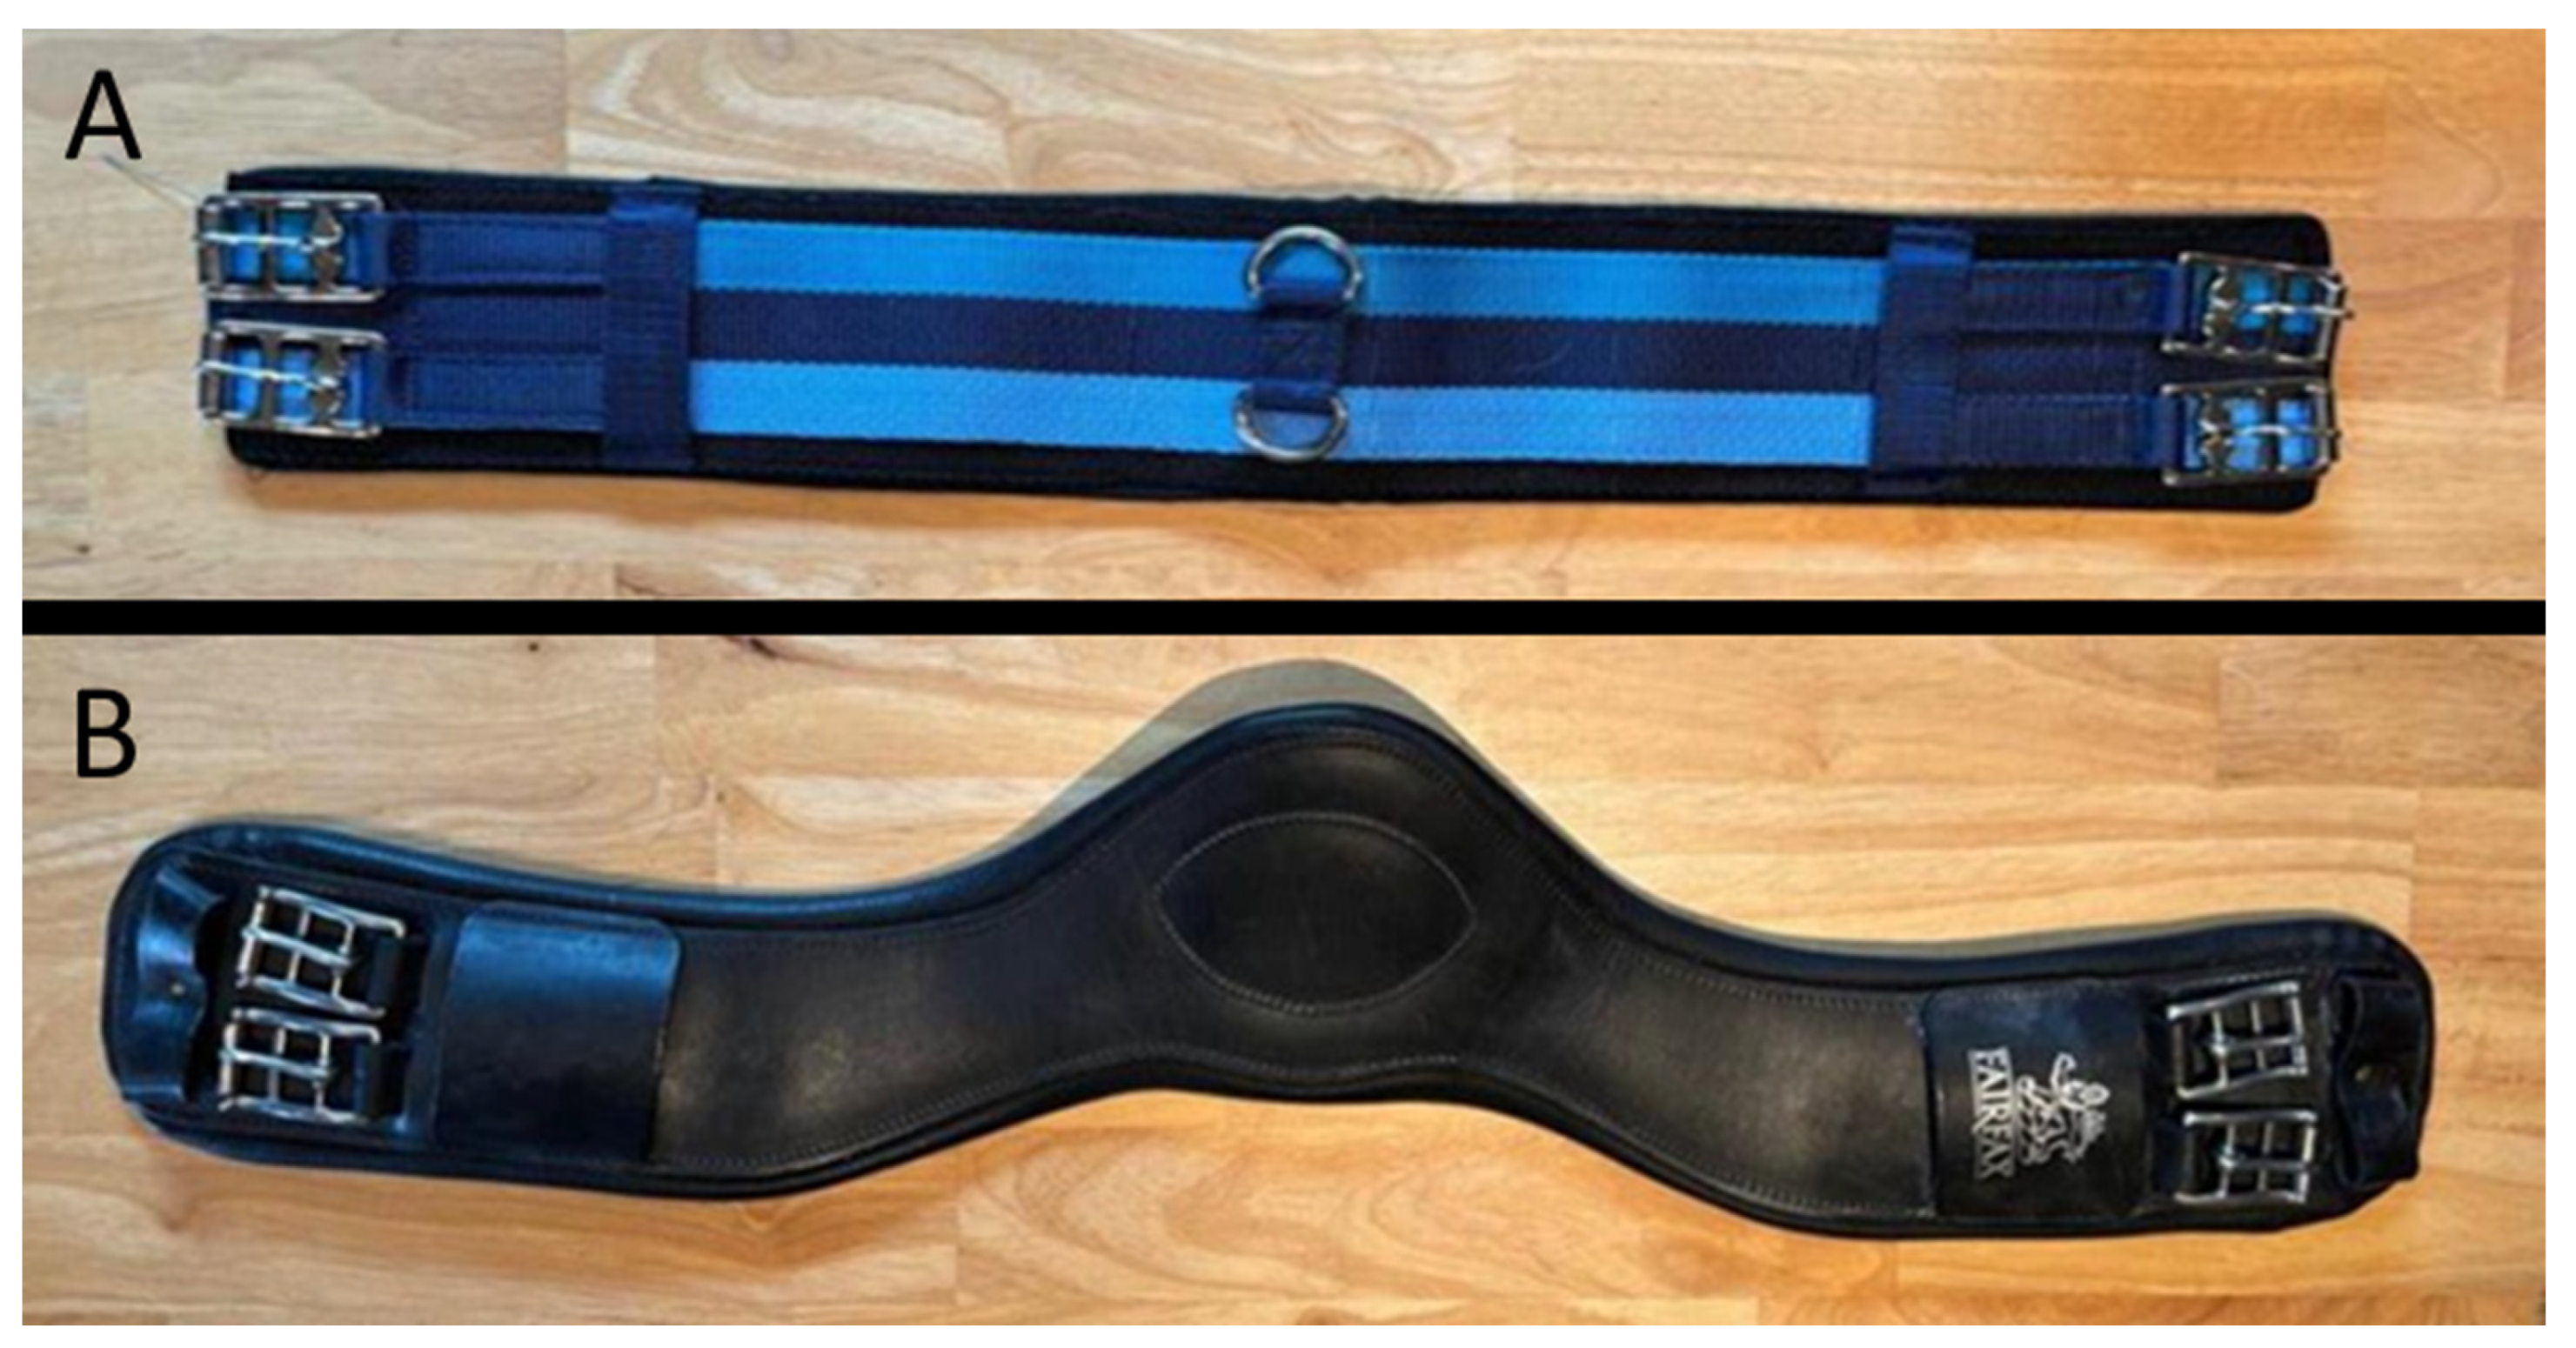
Figure 3.
Example of pressure mapping from saddle pressures obtained during the experiment.
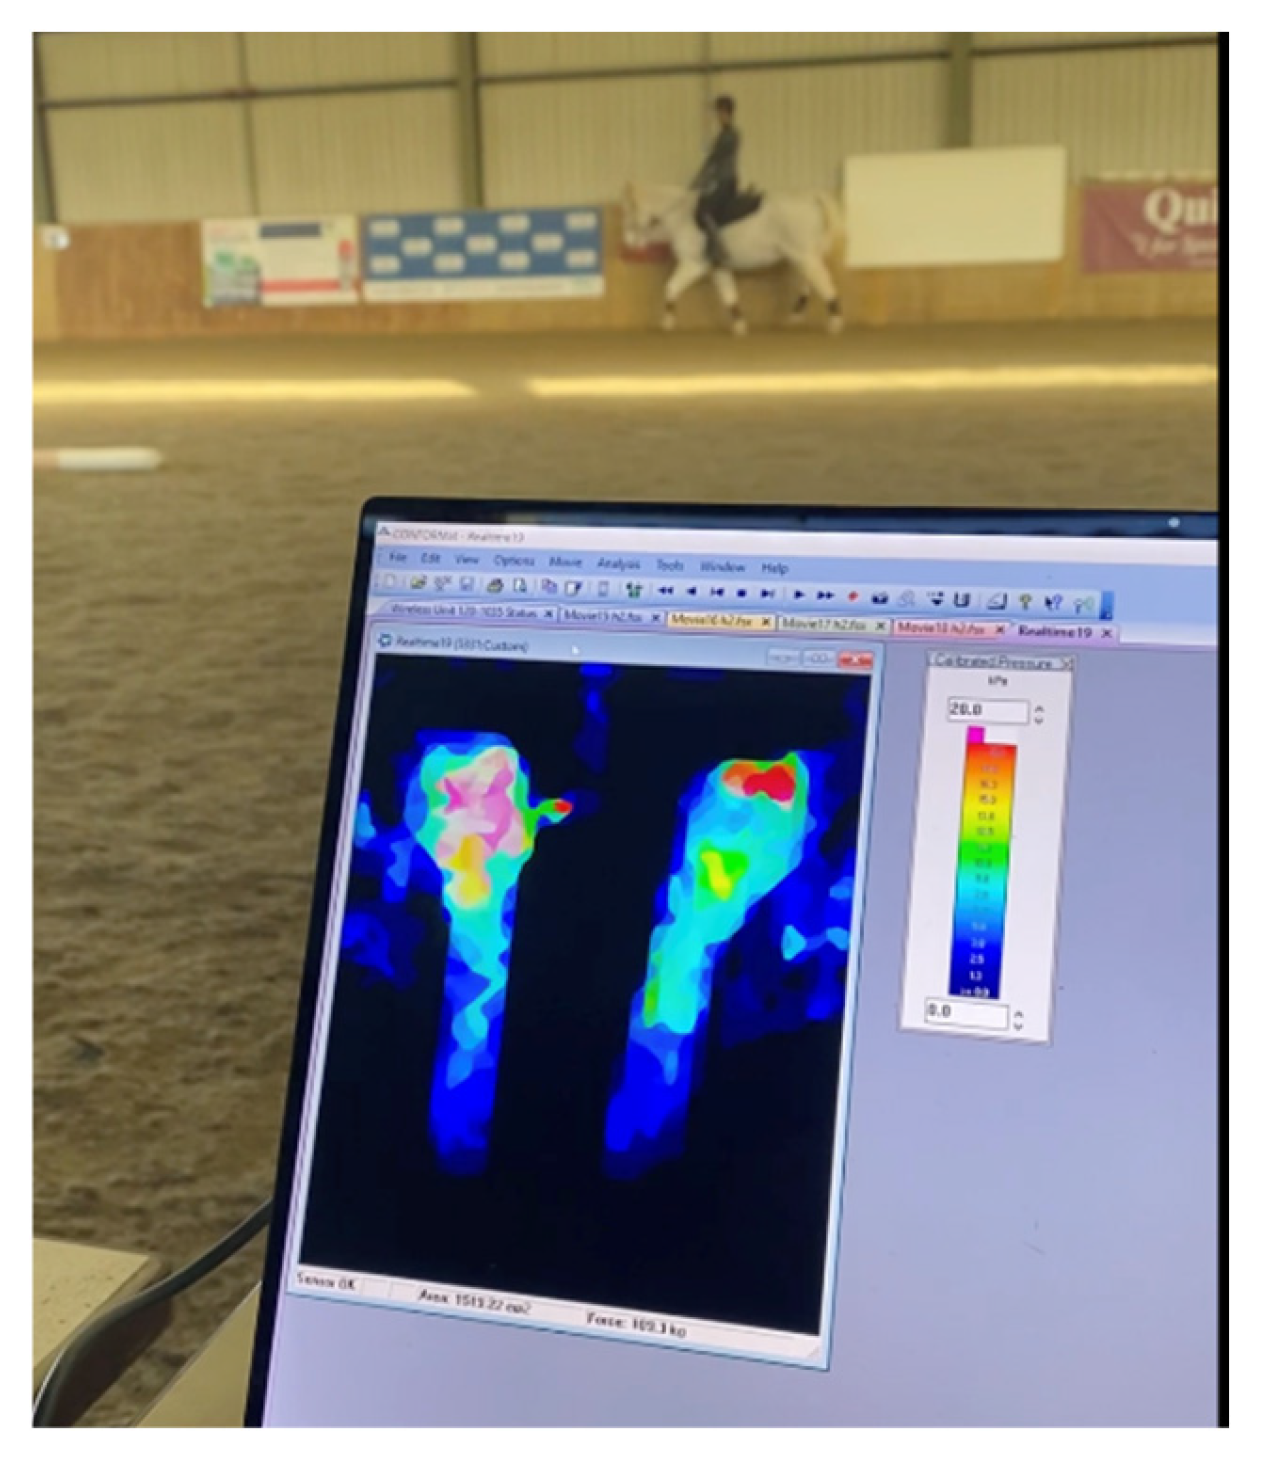
Figure 4.
Location of anatomical markers.
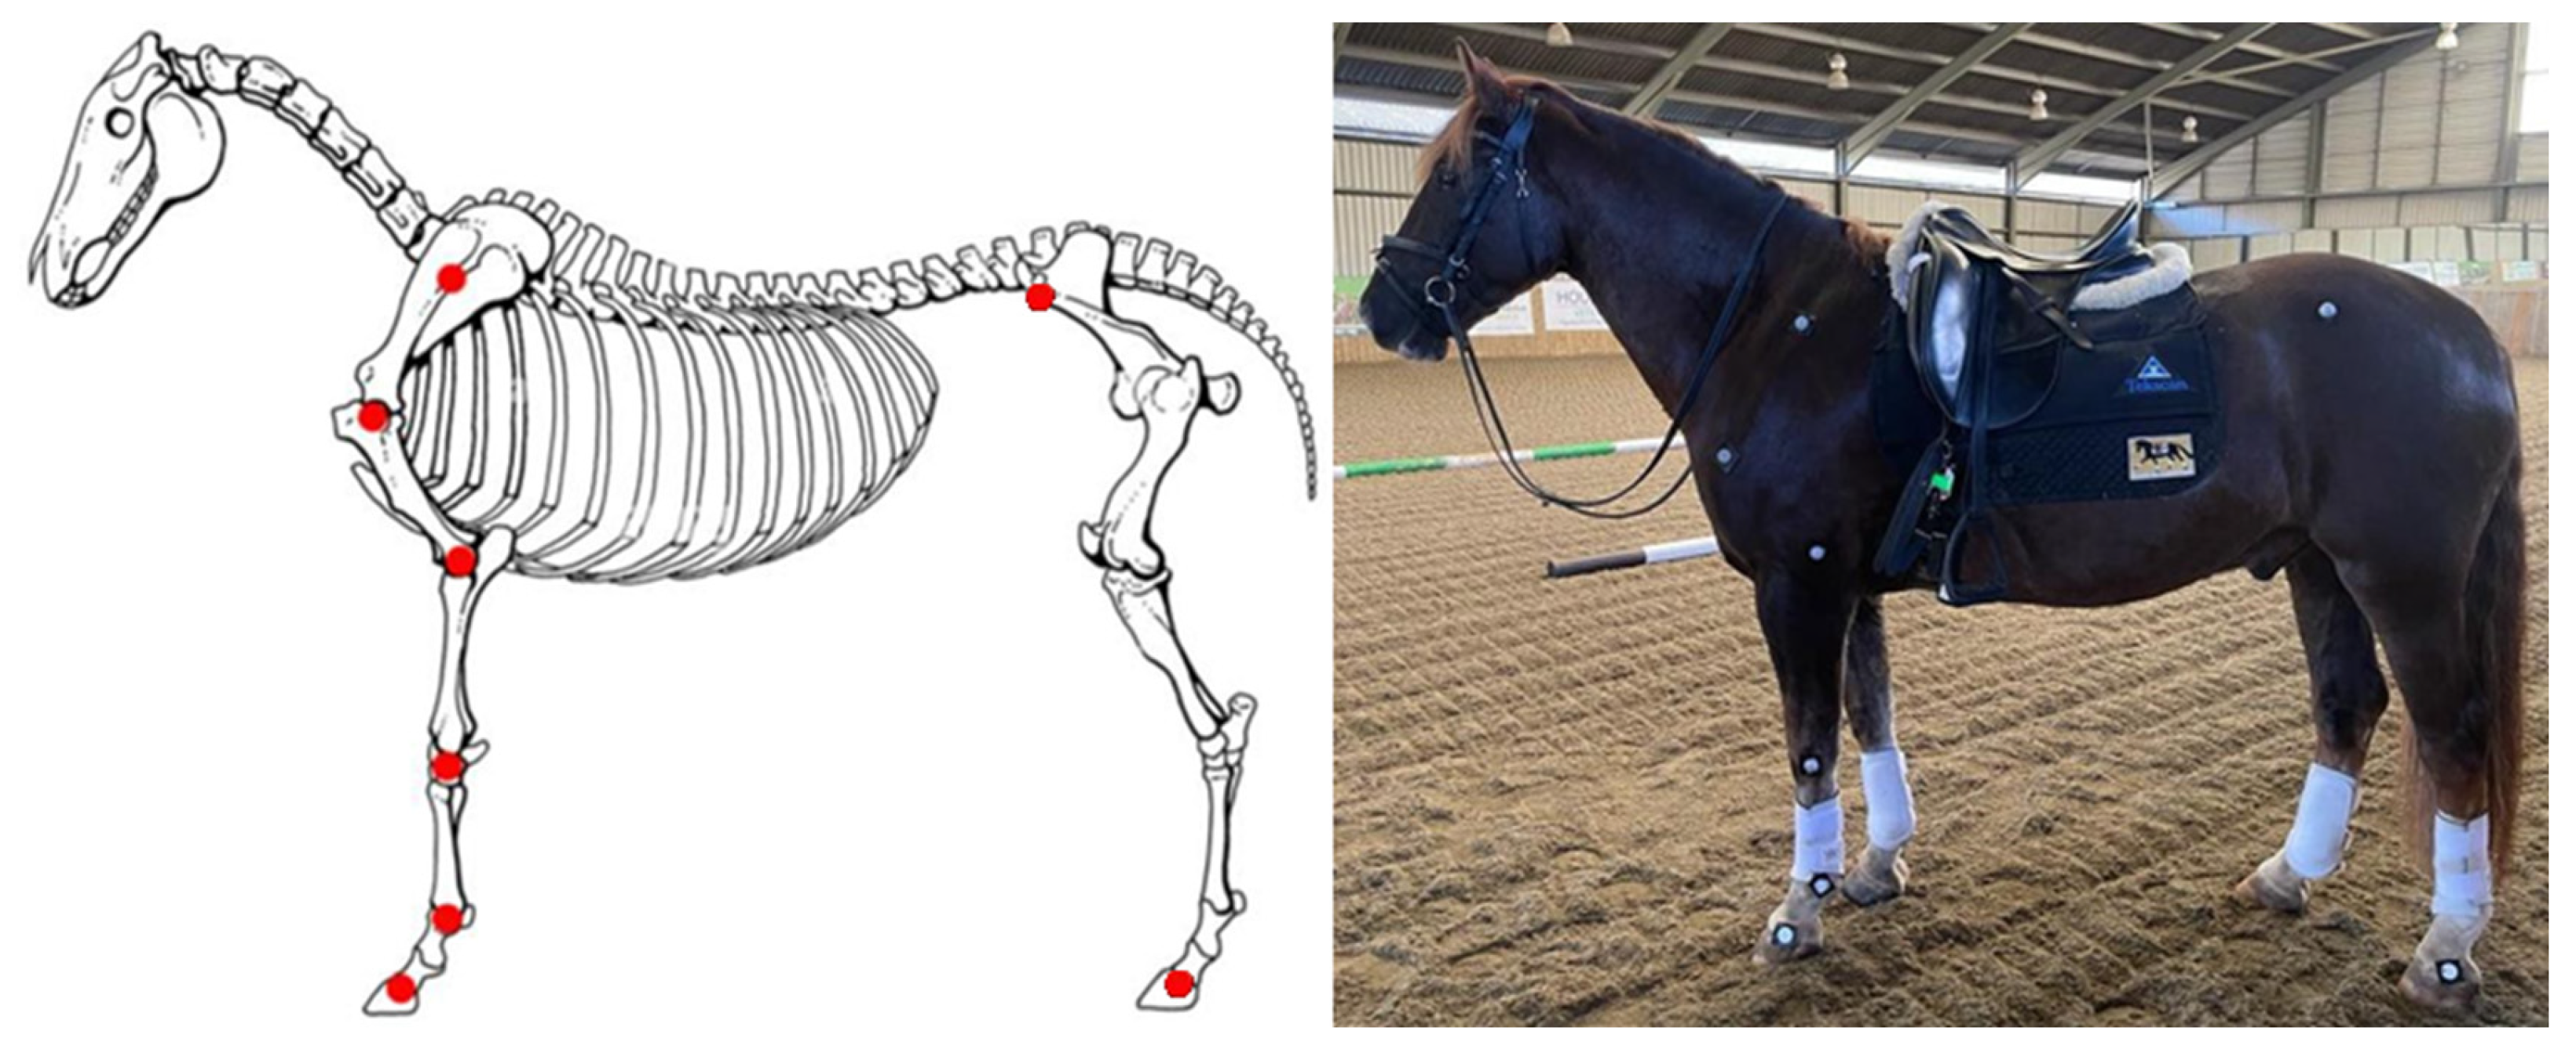
Figure 5.
Carpal flexion angle (°) for anatomical (A) and straight (S) girths with 8 kg and 16 kg of tension. Median, 25th and 75th percentiles, minimum and maximum. Horizontal line represent median and “x” the mean. n=6 horses.
Figure 5.
Carpal flexion angle (°) for anatomical (A) and straight (S) girths with 8 kg and 16 kg of tension. Median, 25th and 75th percentiles, minimum and maximum. Horizontal line represent median and “x” the mean. n=6 horses.
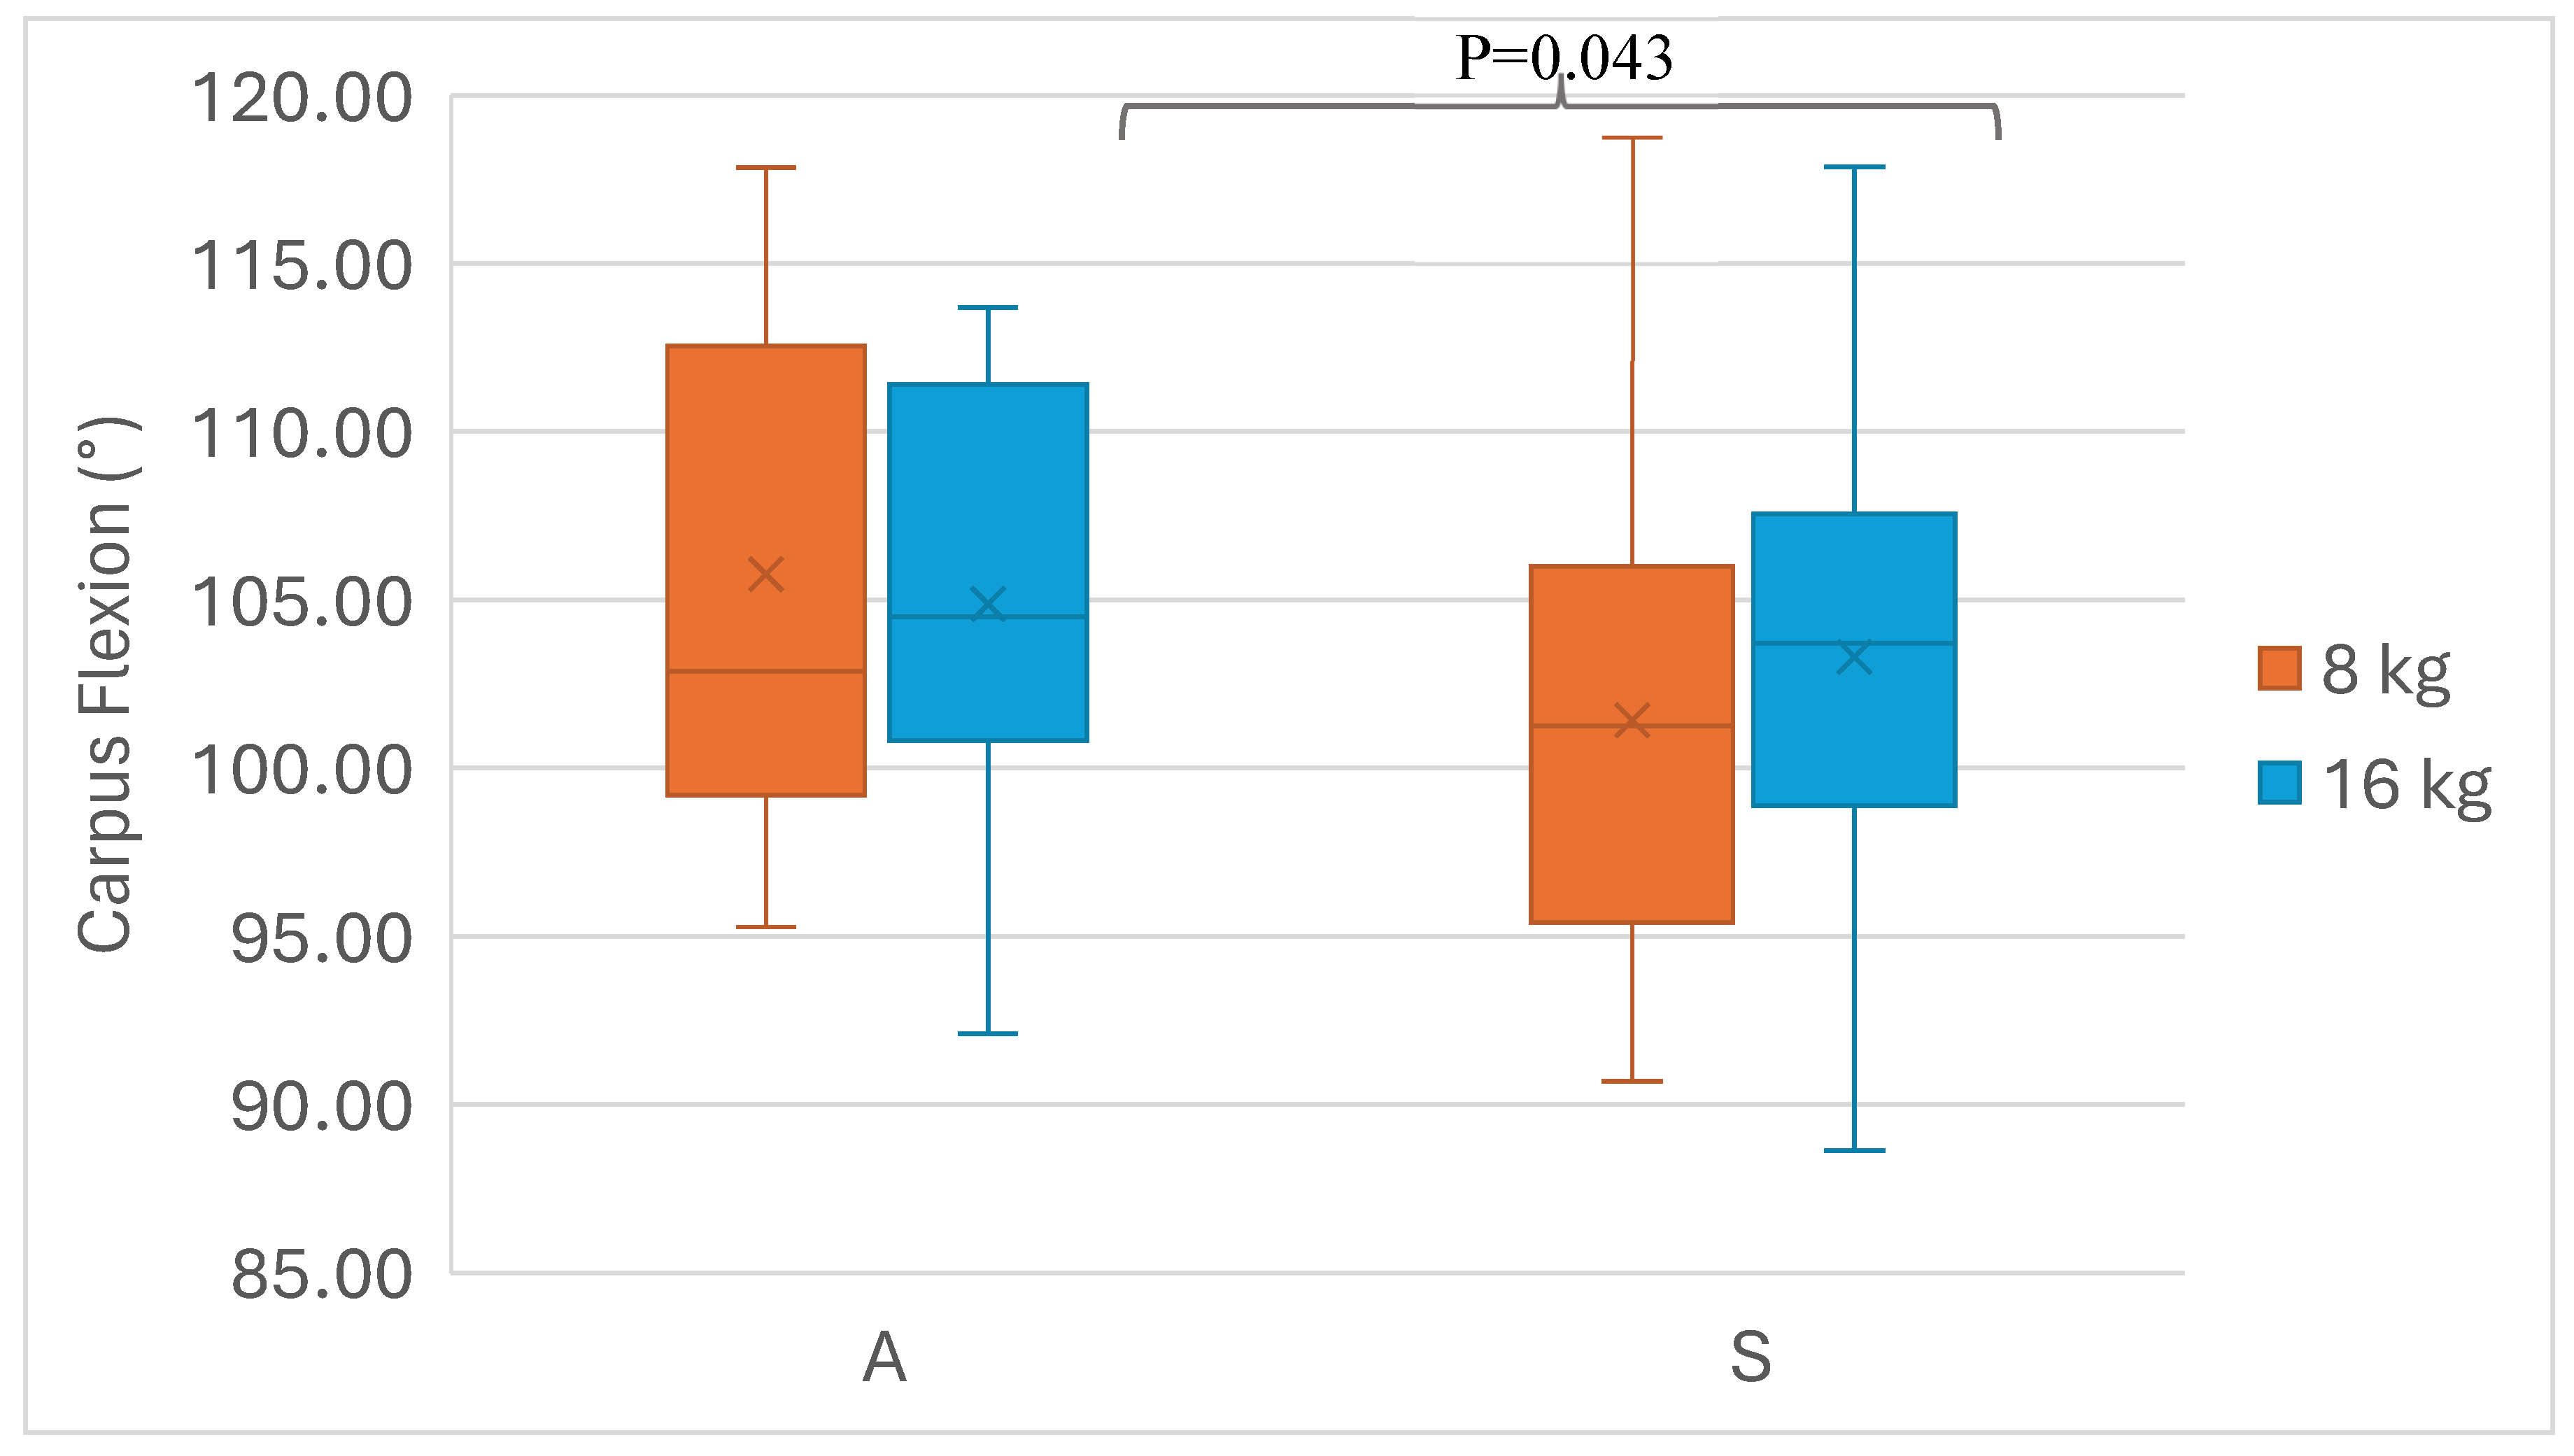
Figure 6.
Mean saddle pressure difference score cranial: caudal (%) at the for all girths combined with 8 kg and 16 kg of tension. Median, 25th and 75th percentiles, minimum and maximum. Horizontal line represent median and “x” the mean. n=6 horses.
Figure 6.
Mean saddle pressure difference score cranial: caudal (%) at the for all girths combined with 8 kg and 16 kg of tension. Median, 25th and 75th percentiles, minimum and maximum. Horizontal line represent median and “x” the mean. n=6 horses.
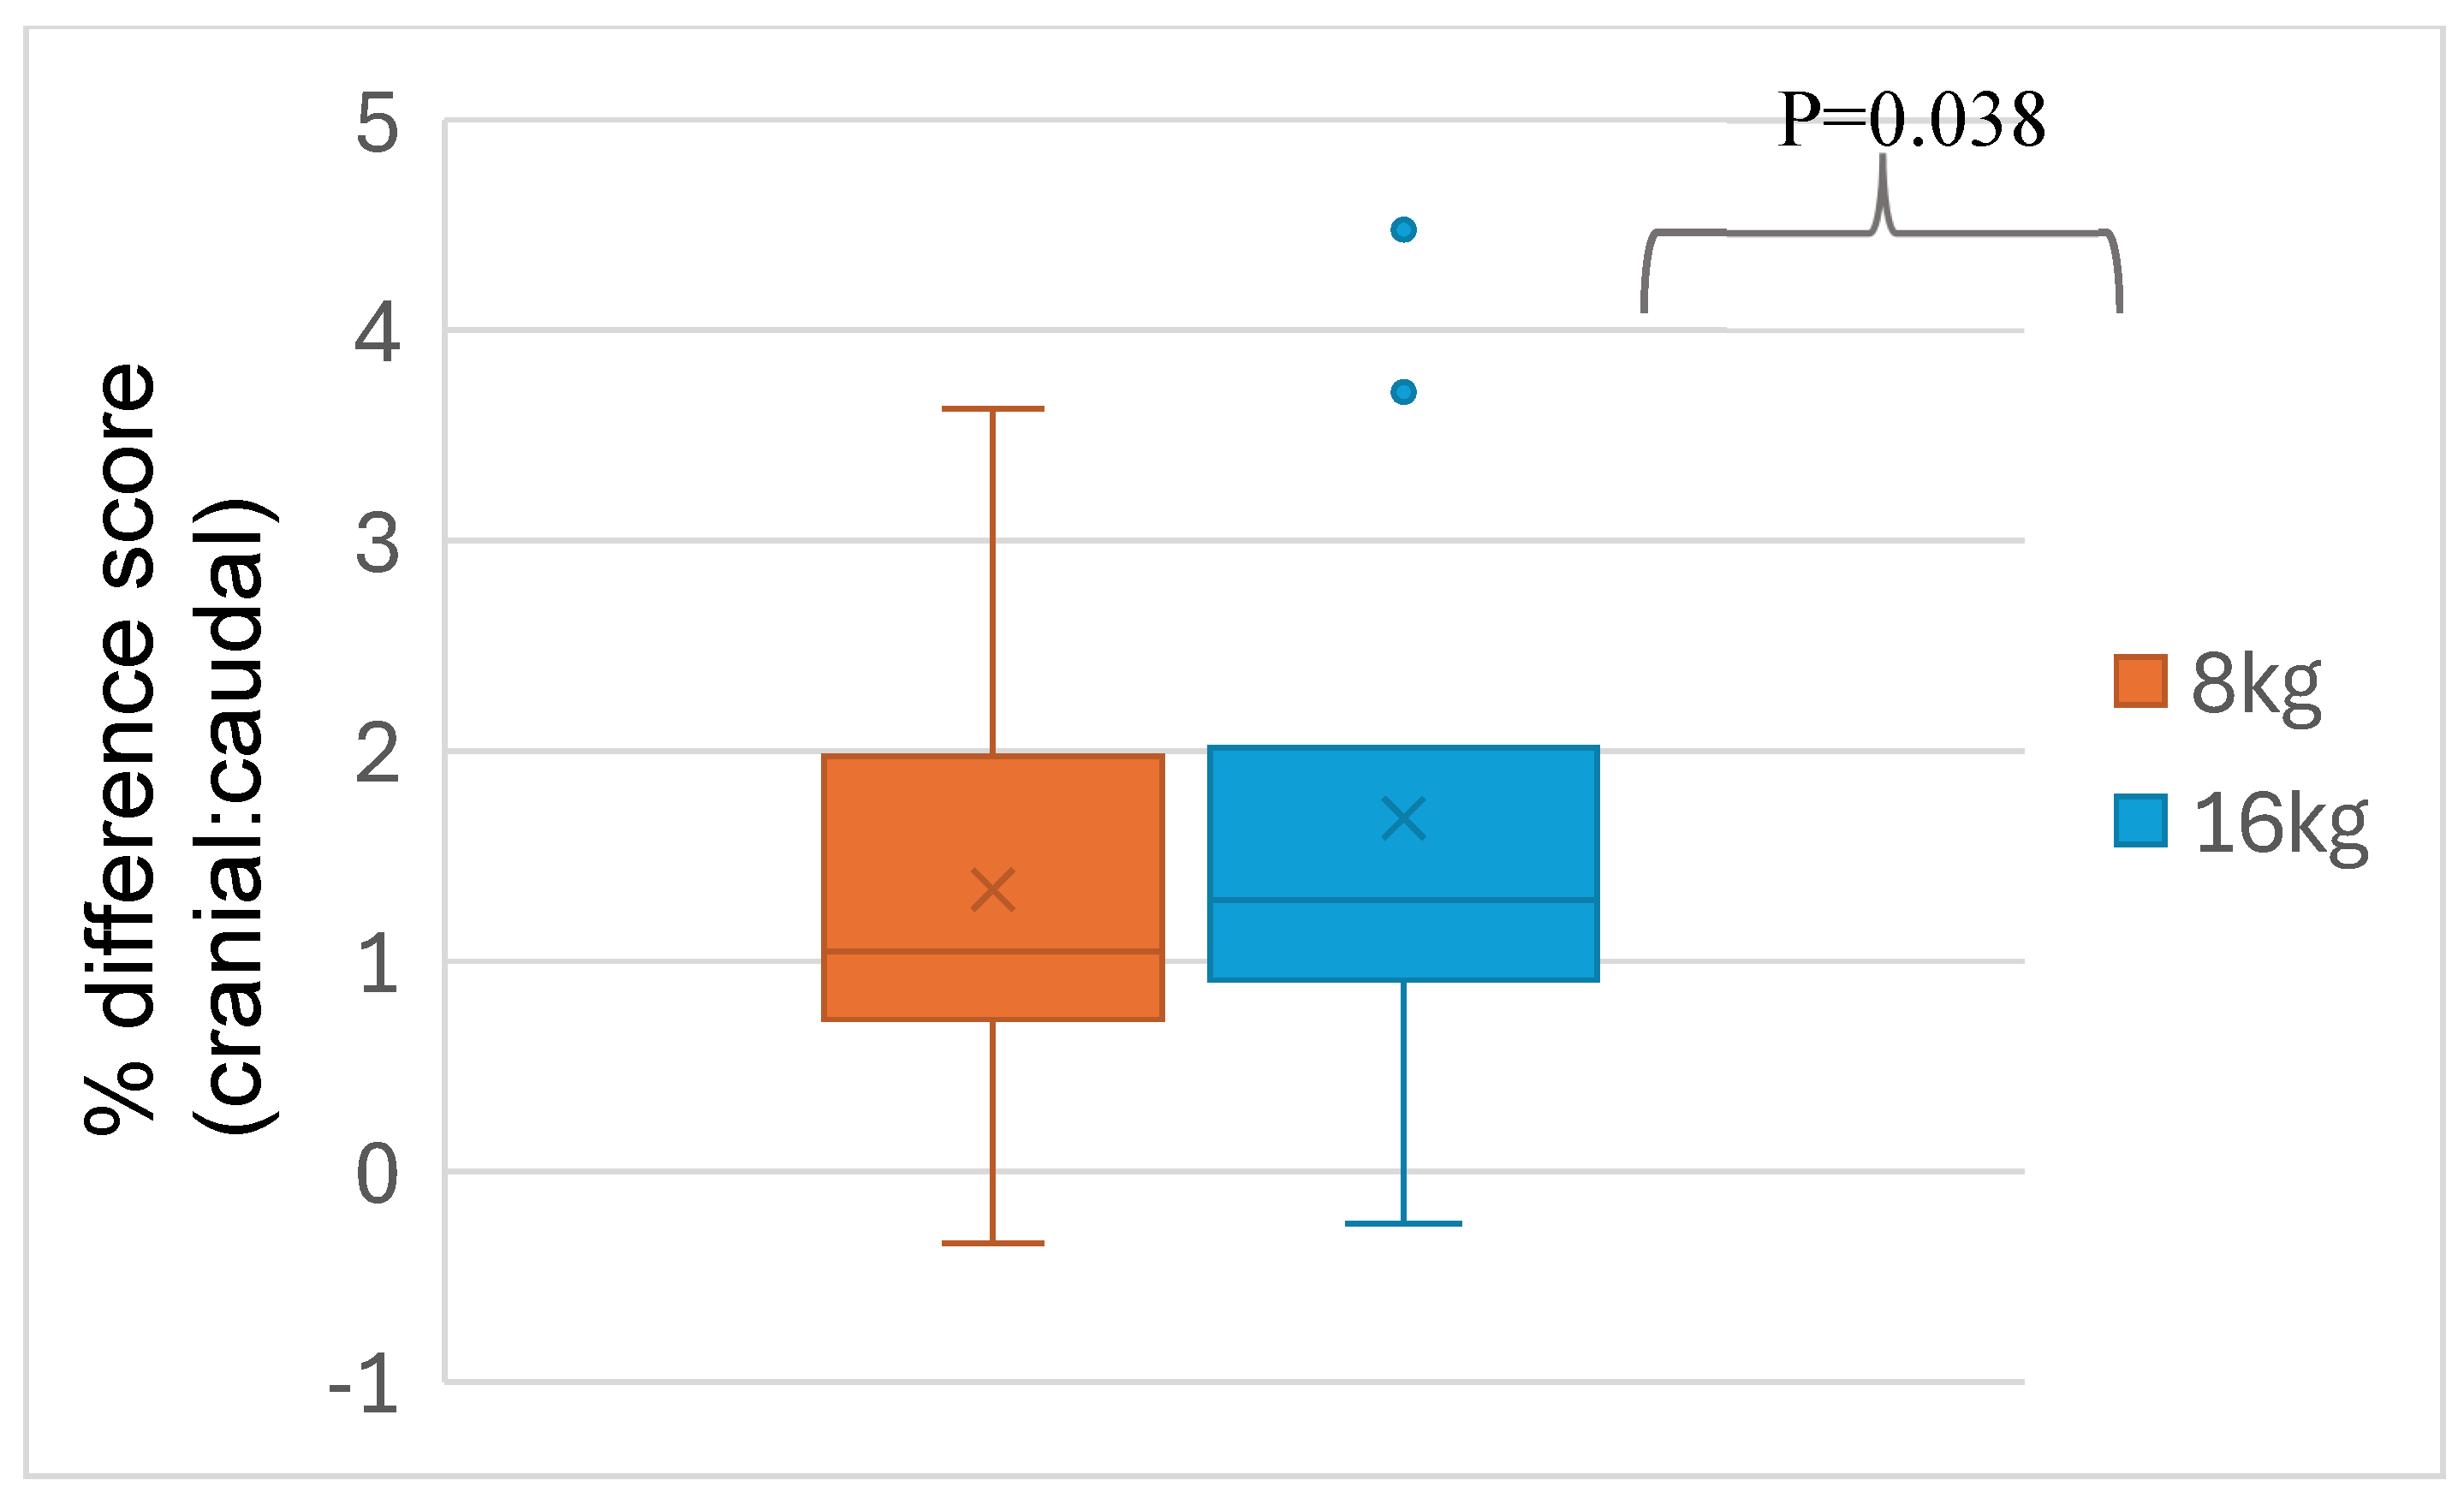
Figure 7.
Peak saddle pressure difference score cranial: caudal (%) at the for all girths combined with 8 kg and 16 kg of tension. Median, 25th and 75th percentiles, minimum and maximum. Horizontal line represent median and “x” the mean. n=6 horses.
Figure 7.
Peak saddle pressure difference score cranial: caudal (%) at the for all girths combined with 8 kg and 16 kg of tension. Median, 25th and 75th percentiles, minimum and maximum. Horizontal line represent median and “x” the mean. n=6 horses.
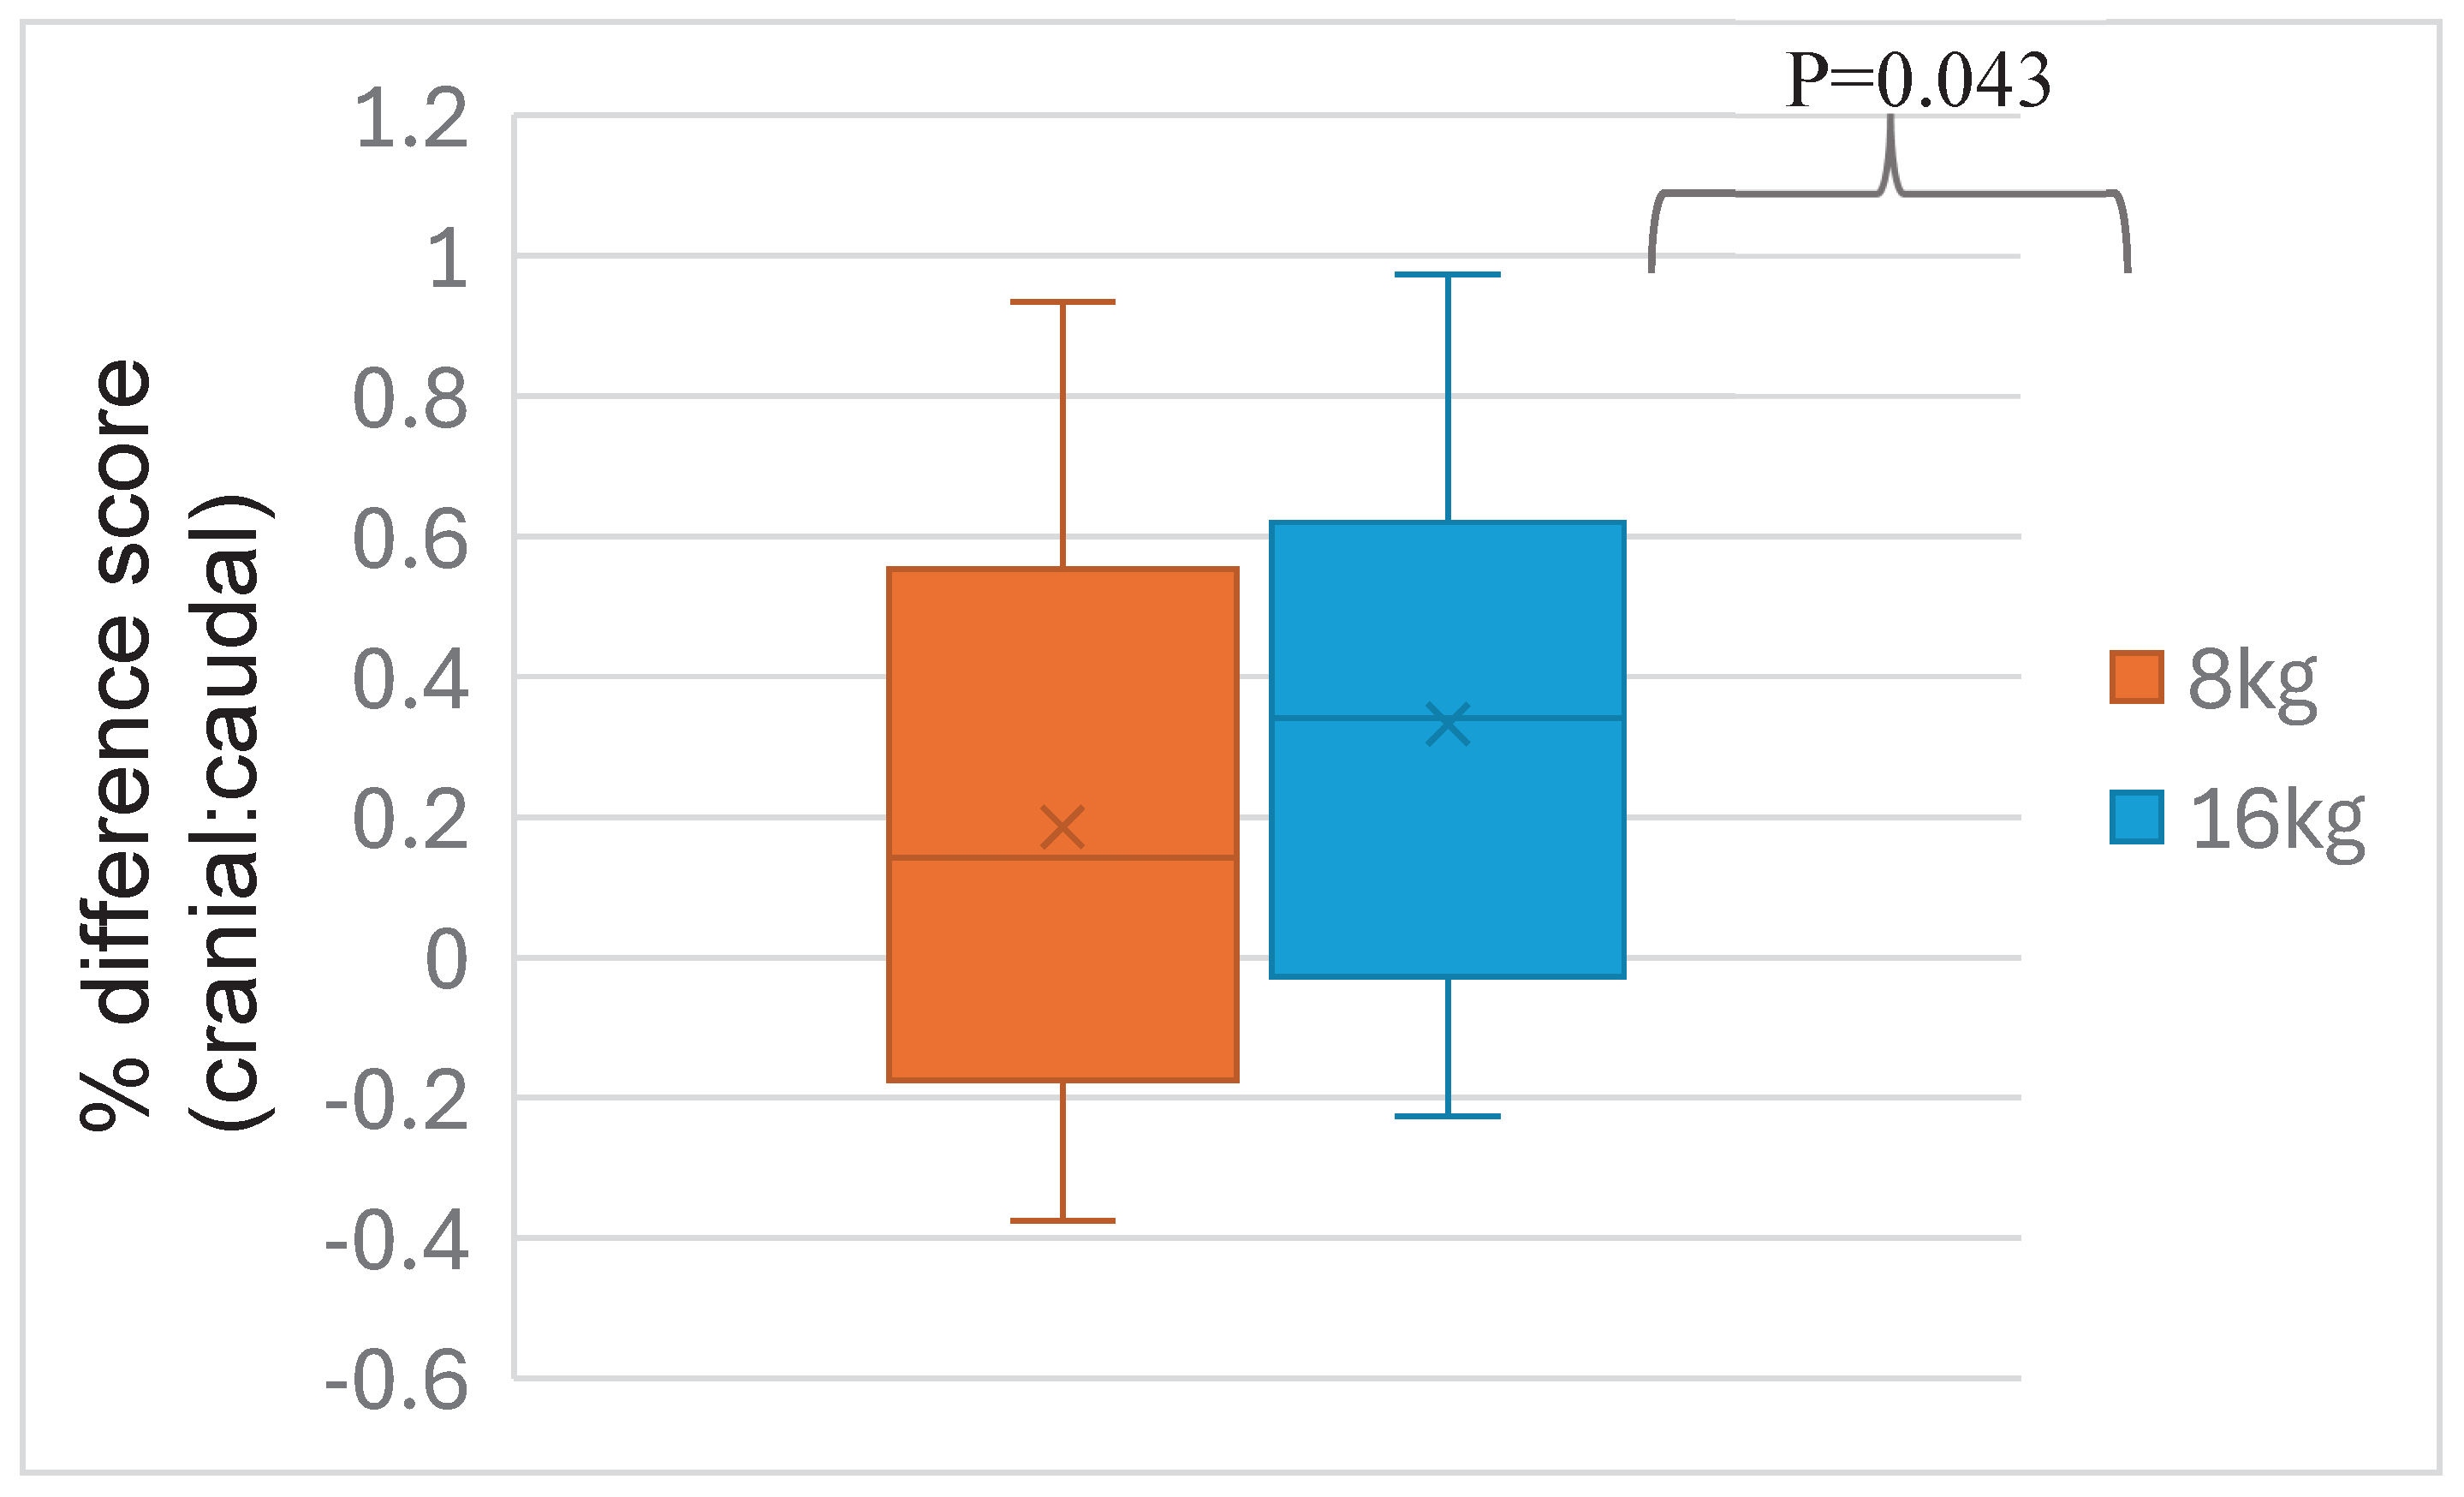

Table 1.
Sample population.
| Horse | Age (years) | Gender | Breed | Height (cm) |
|---|---|---|---|---|
| 1 | 13 | Gelding | Connemara | 163 |
| 2 | 9 | Mare | Dutch Warmblood | 163 |
| 3 | 10 | Gelding | Irish Sports Horse | 163 |
| 4 | 4 | Gelding | Irish Sports Horse | 160 |
| 5 | 16 | Gelding | Irish Sports Horse | 163 |
| 6 | 10 | Gelding | Irish Cob | 158 |
Table 2.
Order of intervention for girth type (anatomical - A or standard - S) and tension (8= 8kg or 16=16kg) for each subject.
Table 2.
Order of intervention for girth type (anatomical - A or standard - S) and tension (8= 8kg or 16=16kg) for each subject.
| Horse | Intervention 1 | Intervention 2 | Intervention 3 | Intervention 4 |
|---|---|---|---|---|
| 1 | A8 | A16 | S16 | S8 |
| 2 | A16 | A8 | S8 | S16 |
| 3 | S16 | S8 | A8 | A16 |
| 4 | A8 | A16 | S16 | S8 |
| 5 | S16 | S8 | A8 | A16 |
| 6 | A8 | A16 | S16 | S8 |
Table 3.
Mean ± standard deviation and Median (25th-75th percentile) for stride length (m), forelimb protraction, hindlimb protraction, shoulder, elbow, carpus and fetlock flexion, extension and ROM angles (°) for standard (S) and anatomical girths (A) at 8 and 16kg tension (n=6 horses).
Table 3.
Mean ± standard deviation and Median (25th-75th percentile) for stride length (m), forelimb protraction, hindlimb protraction, shoulder, elbow, carpus and fetlock flexion, extension and ROM angles (°) for standard (S) and anatomical girths (A) at 8 and 16kg tension (n=6 horses).
| S8 | S16 | A8 | A16 | Girth Type (S v A) | Girth Tension (8 v 16kg) | Girth Type*Tension | |
|---|---|---|---|---|---|---|---|
| Stride length (m) | 3.07±0.69 2.98 (2.44-3.60) |
3.14±0.69 3.25 (2.48-3.87) |
3.04±0.69 2.97 (2.46-3.46) |
3.13±0.70 2.94 (2.54-3.84) |
F(1,5)=0.602, P=0.473 | F(1,5)=0.953, P=0.374 | F(1,5)=0.071, P=0.800 |
| Forelimb protraction (°) | 20.30±1.62 20 (20-21) |
20.18±1.31 20 (19-21) |
19.54±1.71 19 (18-21) |
20.42±1.66 20 (19-22) |
F(1,5)=0.747, P=0.427 | F(1,5)=1.252, P=0.314 | F(1,5)=3.072, P=0.140 |
| Forelimb retraction (°) | 19.06±2.31 19 (17-19) |
19.23 ± 2.28 19 (18-21) |
20.26 ± 1.70 20 (19-22) |
19.33 ± 1.50 19 (19-20) |
S8 vs A8= z = -1.782, p=0.075 S16 vs A16= t(5)=0.144, P=0.891 |
S8 vs S16= z = 0.314, p=0.753 A8 vs A16= t(5)=2.231, P=0.076 |
NA |
| Shoulder | |||||||
| Flexion (°) | 94.98±6.54 93 (90-98) |
97.61±5.40 98 (94-103) |
96.89±6.27 98 (92-101) |
97.90±6.09 98 (94-103) |
F(1,5)=0.014, P=0.911 | F(1,5)=0.469, P=0.524) | F(1,5)=0.008, P=0.933 |
| Extension (°) | 106.32±9.16 104 (100-109) |
107.83±6.48 106 (104-113) |
106.69±7.79 106 (102-109) |
107.91±7.65 106 (104-116) |
F(1,5)=0.014, P=0.911 | F(1,5)=0.469, P=0.524 | F(1,5)=0.008, P=0.933 |
| ROM (°) | 11.34±7.24 9 (7-12) |
10.21±2.52 10 (8-11) |
9.80±2.90 9 (8-12) |
10.01±2.88 9 (8-11) |
F(1,5)=1.330, P=0.301 | F(1,5)=0.205, P=0.669 | F(1,5)=0.410, P=0.550 |
| Elbow | |||||||
| Flexion (°) | 92.43±5.92 91 (89-94) |
92.78±6.41 92 (89-98) |
92.67±5.15 94 (91-96) |
93.78±6.24 93 (90-99) |
F(1,5)=0.445, P=0.534 | F(1,5)=0.298, P=0.609 | F(1,5)=0.445, P=0.534 |
| Extension (°) | 143.56±6.83 143 (137-148) |
145.77±7.03 145 (139-153) |
144.77±5.78 147 (143-150) |
145.81±7.48 145 (139-153) |
F(1,5)=1.440, P=0.284 | F(1,5)=1.478, P=0.278 | F(1,5)=1.059, P=0.351 |
| ROM (°) | 52.99±4.61 51 (49-53) |
51.12±2.89 53 (51-56) |
53.09±2.77 53 (51-55) |
52.03±3.48 53 (51-54) |
F(1,5)=1.453, P=0.282 | F(1,5)=0.163, P=0.703 | F(1,5)=5.228, P=0.071 |
| Carpus | |||||||
| Flexion (°) | 101.42±7.86 101 (96-106) |
103.31±8.03 104 (99-107) |
105.76±7.61 103 (100-112) |
104.87±6.69 104 (101-111) |
F(1,5)=7.317, P=0.043 | F(1,5)=0.068, P=0.804 | F(1,5)=2.824, P=0.154 |
| Extension (°) | 183.74±2.98 184 (181-185) |
183.22±3.27 183 (181-184) |
183.72±4.82 183 (181-187) |
182.46±4.00 182 (179-184) |
F(1,5)=0.229, P=0.653 | F(1,5)=1.189, P=0.325 | F(1,5)=0.480, P=0.519 |
| ROM (°) | 82.31±7.31 84 (78-88) |
79.91±8.30 82 (75-84) |
77.95±8.04 80 (70-84) |
77.59±8.73 79 (71-84) |
F(1,5)=4.084, P=0.099 | F(1,5)=1.129, P=0.337 | F(1,5)=1.574, P=0.265 |
| Fetlock | |||||||
| Flexion (°) | 148.21±10.37 147 (142-152) |
148.49±10.22 148 (142-152) |
150.78±9.50 151 (143-157) |
151.15±8.75 152 (143-159) |
F(1,5)=2.929, P=0.14 | F(1,5)=0.695, P=0.442 | F(1,5)=0.003, P=0.961 |
| Extension (°) | 236.05±2.96 236 (234-237) |
235.47±4.27 236 (233-238) |
234.27±6.75 237 (233-238) |
234.73±5.66 235 (231-239) |
F(1,5)=0463, P=0.506 | F(1,5)=0.025, P=0.876 | F(1,5)=0.002, P=0.958 |
| ROM (°) | 85.55±9.92 86 (77-92) |
86.99±10.86 87 (82-97) |
83.49±8.12 84 (77-90) |
83.59±10.53 80 (77-94) |
F(1,5)=3.747, P=0.111 | F(1,5)=0.336, P=0.588 | F(1,5)=0.316, P=0.598 |
Table 4.
Mean ± standard deviation for Mean Pressure (kPa), Peak Pressure (kPa) and Mean Force (N), on the cranial and caudal areas of the saddle, for standard (S) and anatomical girths (A) at 8 and 16kg tension (n=6 horses).
Table 4.
Mean ± standard deviation for Mean Pressure (kPa), Peak Pressure (kPa) and Mean Force (N), on the cranial and caudal areas of the saddle, for standard (S) and anatomical girths (A) at 8 and 16kg tension (n=6 horses).
| S8 | S16 | A8 | A16 | Girth Type (S v A) | Girth Tension (8 v 16kg) | Girth Type*Tension | |
|---|---|---|---|---|---|---|---|
| Mean Pressure (kPa) | |||||||
| Cranial | 16.73 ± 7.22 | 18.80 ± 7.71 | 15.13 ± 4.65 | 20.07 ± 5.35 | F(1.5)= 0.003, P=0.962 | F(1.5)= 10.81, P=0.022 | F(1.5)= 2.38, P=0.184 |
| Caudal | 7.67 ± 2.53 | 8.33 ± 7.71 | 8.12 ± 2.58 | 8.50 ± 2.57 | F(1.5)= 1.047, P=0.353 | F(1.5)= 0.774, P=0.428 | F(1.5)=401, P=0.554 |
| Cranial vs Caudal | t(5) = 3.260, P=0.023 | t(5) = 3.053, P=0.028 | t(5) = 3.055, P=0.028 | t(5) = 4.647, P=0.006 | |||
| Peak Pressure (kPa) | |||||||
| Cranial | 35.15 ± 10.54 | 37.43 ± 9.76 | 33.08 ± 2.28 | 38.80 ± 9.75 | F(1.5)= 0.005, P=0.947 | F(1.5)= 2.33, P=0.187 | F(1.5)= 0.83, P=0.404 |
| Caudal | 30.77 ± 10.8 | 29.18 ± 7.35 | 32.83 ± 12.23 | 31.20 ± 9.64 | F(1.5)= 1.76, P=0.242 | F(1.5)= 0.886, P=0.390 | F(1.5)= 0.002, P=0.964 |
| Cranial vs Caudal | t(5) = 0.886, P=0.415 | t(5) = 1.99, P=0.103 | t(5) = 0.048, P=0.963 | t(5) = 1.80, P=0.131 | |||
| Mean Force (N) | |||||||
| Cranial | 519.07 ± 233.29 | 575.33 ± 255.45 | 447.92 ± 210.22 | 581.92 ± 255.31 | F(1.5)= 0.193, P=0.679 | F(1.5)= 9.43, P=0.028 | F(1.5)= 3.05, P=0.141 |
| Caudal | 146.12 ± 47.30 | 148.32 ± 43.67 | 152.23 ± 45.76 | 147.23 ± 55.29 | F(1.5)= 0.090, P=0.776 | F(1.5)= 0.031, P=0.868 | F(1.5)= 0.298, P=0.609 |
| Cranial vs Caudal | t(5) = 4.532, P=0.006 | t(5) = 4.437, P=0.007 | t(5) = 4.011, P=0.010 | t(5) = 4.654, P=0.006 | |||
Disclaimer/Publisher’s Note: The statements, opinions and data contained in all publications are solely those of the individual author(s) and contributor(s) and not of MDPI and/or the editor(s). MDPI and/or the editor(s) disclaim responsibility for any injury to people or property resulting from any ideas, methods, instructions or products referred to in the content. |
© 2025 by the authors. Licensee MDPI, Basel, Switzerland. This article is an open access article distributed under the terms and conditions of the Creative Commons Attribution (CC BY) license (http://creativecommons.org/licenses/by/4.0/).
Copyright: This open access article is published under a Creative Commons CC BY 4.0 license, which permit the free download, distribution, and reuse, provided that the author and preprint are cited in any reuse.


