
Submitted:
20 June 2025
Posted:
23 June 2025
You are already at the latest version
Abstract
Computer-assisted surgery (CAS) and virtual surgical planning (VSP) have transformed jaw reconstruction, allowing immediate insertion of dental implants during surgery for better rehabilitation of occlusal function. However, traditional planning for optimal location and angulation of dental implants and fibula relies on experience and can be time-consuming. This study aimed to propose a function-driven workflow and develop an automatic computer program for optimal positioning of simultaneous dental implants and fibula segments. A customized computer program was developed using MATLAB. Computed tomography (CT) of lower limbs of ninety-one Southern Chinese individuals were retrieved and cross-section of 3-dimensional (3D) fibula models were comprehensively investigated for implant installation. Our research has proved that the accuracy of the program in identifying the anatomical orientation of fibula was 92%. The ideal location, angulation and length of implant could be automatically generated based on any selected implant diameter, with surgical feasibility of 94%. To the best of our knowledge, this is the first study to develop and validate a customized automatic computer program for osseointegrated implant design in fibula flap. This program can be incorporated to the current workflow of CAS to push forward the frontier of reliable and efficient surgical planning for function-driven jaw reconstruction.
Keywords:
Computer-assisted surgery
; Jaw reconstruction
; Fibula free flap
; Simultaneous dental implant
; Oral oncology
; Head and neck cancer
; Dental rehabilitation
1. Introduction
Defects of the maxilla and mandible as a result of tumour resection, trauma, bony necrosis after radiation, or anti-resorptive drugs often lead to significant aesthetic and functional deficits [1]. Hidalgo first described the use of fibula free flap (FFF) in the maxillofacial region for mandibular reconstruction in 1989 [2]. FFF reconstruction with simultaneous dental implant placement has become a pivotal approach for the functional reconstruction of jaw defects following resection of benign or malignant tumours, allowing the functional rehabilitation of chewing, swallowing, speech, and aesthetics [3]. Conventional freehand mandibular reconstruction could be challenging and time-consuming as it greatly relies on the surgeon’s experiences with ‘trial and error’ during the operation[4,5,6]. Positioning of fibula segments using the conventional approach could make dental implant placement technically challenging or impossible. Computer-assisted surgery (CAS) and Virtual Surgical Planning (VSP) have transformed jaw reconstruction, enabling the immediate insertion of dental implants during surgery for improved rehabilitation of occlusal function [7,8,9,10,11]. Our center has previously proposed and has been adopting the novel “surgeon-dominated” approach to the design of 3D printed patient-specific surgical plates [12]. Figure 1 demonstrates the current digital workflow at our center. The size of the selected implant depends on the height and width of available bone [13]. Although the fibula looks like a uniformly shaped long bone, determining the ideal implant position and angulation at the fibula segments during VSP could be time-consuming as its cross-sectional shape and dimension vary along its length [11,14].
To address this issue, a precise evaluation of bone dimensions and morphology is essential [15]. Previous anatomical studies of the fibula have shown that the length of the harvested fibula and the bone available for implant placement vary between ethnicities [4,16,17]. And more recently, CT scan-based analysis of fibula anatomy was carried out to find out the optimal site for implant installation in fibula, however, the sample size of 20 patients was small [18]. Another limitation of the previous studies was that only a linear measurement was recorded from the anterior surface to the posterior aspect of the fibula cross-section, without considering the anatomical orientation, surgical feasibility, or width of the dental implant within the cross-section.
Although CAS showed increased intraoperative efficiency with reduced total operative time, pre-operative computer planning could be time-consuming [4]. In the case of fibula implant planning, the process of choosing the appropriate implant dimension could be tedious as it often requires ‘trial and error’ to ensure good angulation of dental implants, bi-cortical engagement, and enough bony collar over the entire implant without any thread exposure, thereby improving its stability and survival. Therefore, a fully automatic program is required to determine the optimal size and location of dental implants and fibula segments while respecting the anatomical considerations of a fibula free flap harvest. This will pave the way towards automatic placement of dental implants during VSP to provide a reliable and efficient solution for functional jaw reconstruction with fibula free flap.
The aim of the current study is to describe the development and verification of an automatic program to determine the optimal size and angulation of simultaneous dental implants in functional jaw reconstruction of jaw defects with fibula free flap.
2. Materials and Methods
2.1. Study Population
This study was approved by the Institutional Review Board of the University of Hong Kong/ Hospital Authority of Hong Kong West Cluster (IRB: UW 24-121). Patients planned for fibula free flap jaw reconstruction in the Department of Oral and Maxillofacial Surgery, Queen Mary Hospital, Hong Kong, from January 2018 to February 2023 were retrospectively recruited. Ninety-one CT scans of the lower limbs were available and retrieved for analysis. The patients’ demographic and clinical information were obtained from medical records.
Inclusion criteria included: (a) Chinese patients with the age of 18 years old or above at the time of diagnosis; (b) Diagnosed with oral and maxillofacial pathology from January 2018 to February 2023 and indicated for fibula free flap reconstruction with or without simultaneous implant rehabilitation; (c) CT scan of lower limbs was performed and available for analysis.
Exclusion criteria included: (a) Patients younger than 18 years old at the time of diagnosis; (b) Ethnicity is not Chinese; (c) Fibula free flap was not required for the reconstruction of the defect after tumor resection; (d) Patients who were not able to take preoperative CT scan of lower limbs.
2.2. Image Processing for Measurements
The data of the CT scan of the lower extremities were exported as Digital Imaging and Communications in Medicine (DICOM) files, which were then imported into ProPlan CMF 3.0 software (Materialize, Leuven, Belgium). Images were segmented by radiodensity to rebuild the 3D virtual models of the fibula bone (CT threshold values: Min. 226; Max. 3071). The models were exported as stereolithography (STL) data and analyzed using a customized computer program created by our team, as described in detail below.
2.3. Customized Computer Program
2.3.1. Identifying the Anterior Aspect of the Fibula
MATLAB platform was used to run the customized computer program. The computer program began by calculating the central axis of the bone. The bone was repositioned so that its lowest point was at the origin (0, 0, 0). The bone point cloud was aligned with the z-axis, maintaining the vertical orientation during slicing. The algorithm identified the anterior direction of the fibula using the most protruded part, which involved calculating the distance of each point from the central axis, identifying the furthest group of points, and computing their average vector to represent the anterior direction of the bone.
The anterior aspect of the 3D fibula model was indicated by a green arrow in Figure 2. Once the anterior vector was calculated, the bone point cloud was rotated to align the anterior vector along the y-axis (0, 1, 0), ensuring a consistent orientation of the anterior direction relative to the coordinate system.
2.3.2. Cross-Section of Fibula at Different Heights
The apex of the fibula head was denoted as point A, and that of the lateral malleolus was point I (Figure 3). The bone was then sliced at seven different heights. The 8 cm distances measured from the apex of the fibula head and that of the lateral malleolus were not generally used for harvesting to maintain the integrity of the knee and ankle [13,16]. These areas each correspond to approximately 20% at the top and bottom of the fibula length and were excluded from the analysis. The remaining 60% of the fibula length was divided into six equal segments to obtain the cross-section geometry along the fibula. Each of the dividing points from the apex of the fibula head was denoted B, C, D, E, F, G, and H as illustrated in Figure 3. This provided a detailed representation of the bone’s structure at various heights, enabling a comprehensive understanding of its geometry and features. The number of segments and distance between each layer were a user-defined parameter.
Four different-colored reference lines represented the outputs of four distinct algorithms, which helped differentiate their outputs and facilitate comparison and analysis of the results. Each algorithm and its contribution to the overall analysis of the bone geometry are detailed in the following sections:
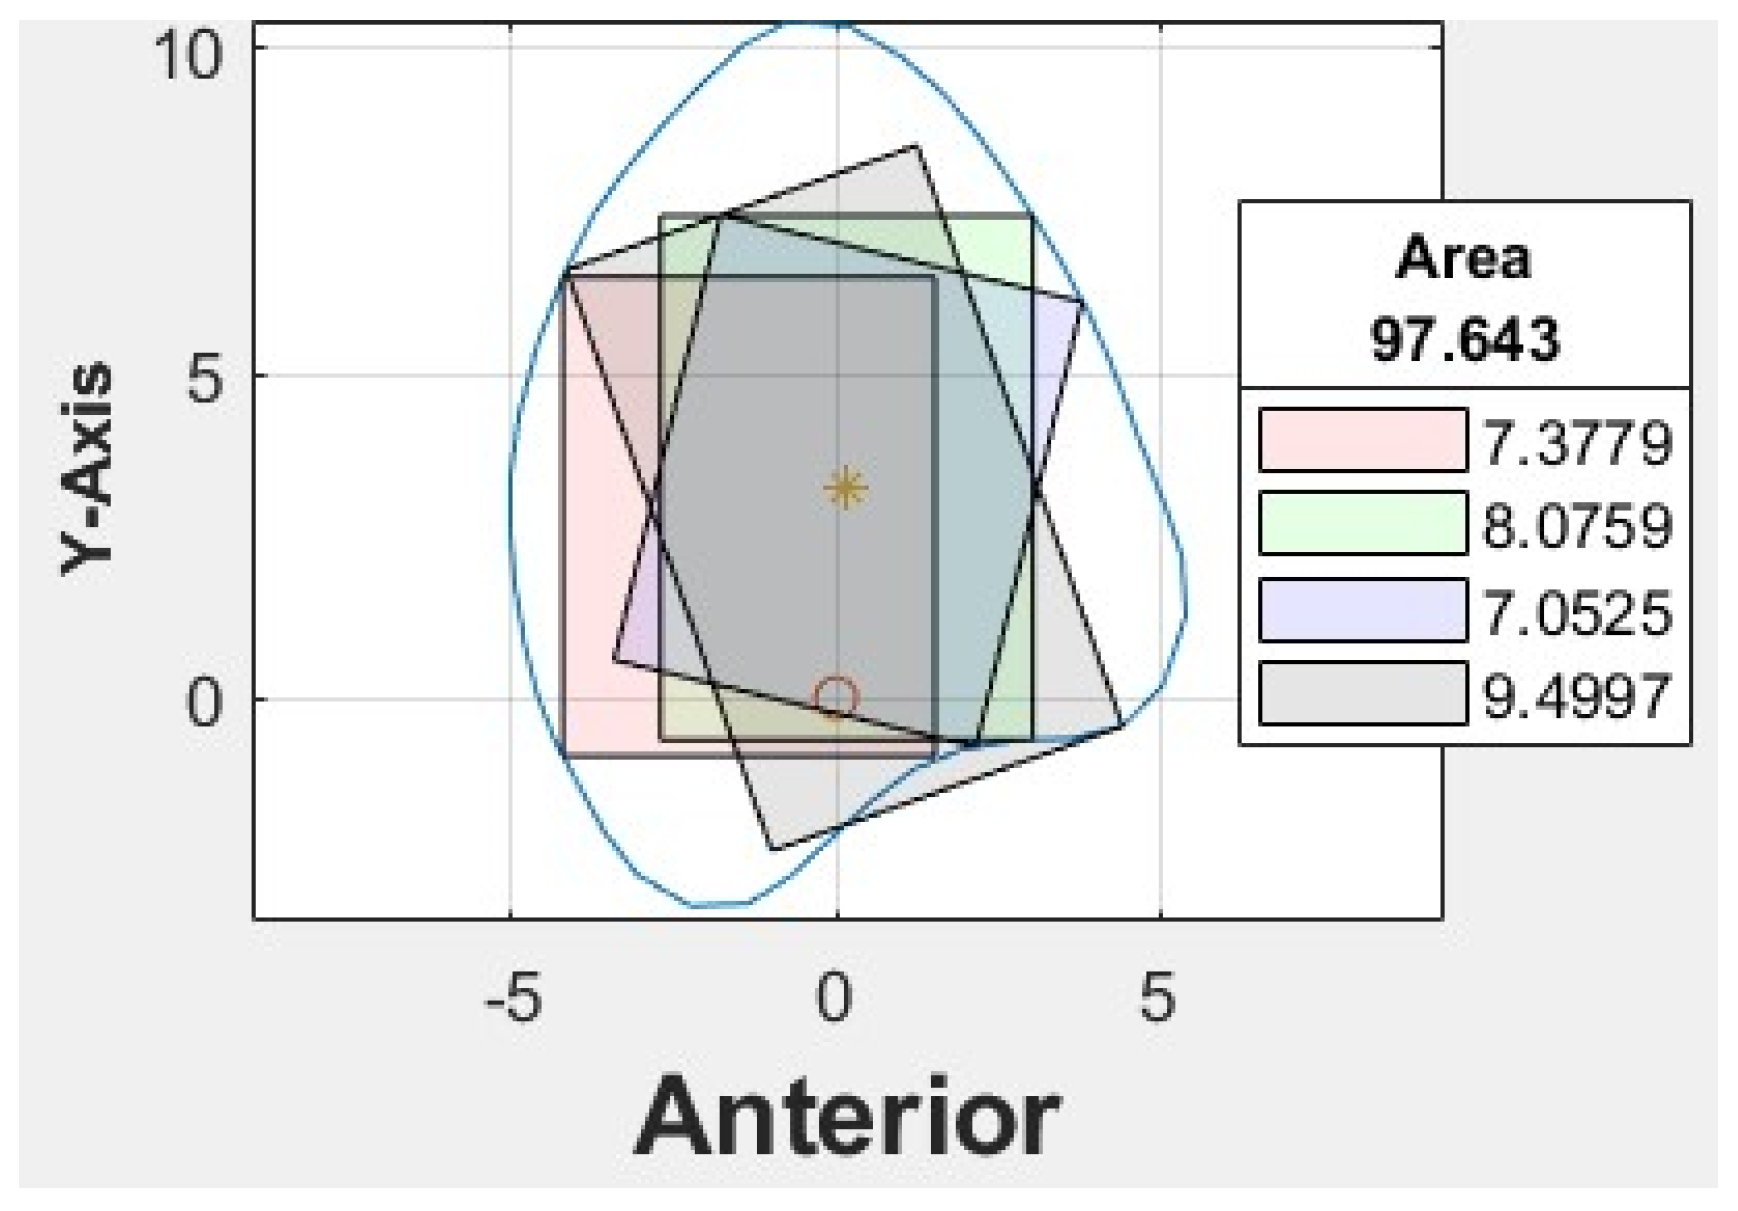
Red line: A set of 100 equidistant gridlines was drawn parallel to the y-axis (anterior direction), as illustrated in Figure 4a. Among these gridlines, the one with the maximum length was identified as the central axis of the red rectangle.
Green line: The algorithm calculated the geometric center point of the contour and drew a vertical line through this center point, parallel to the y-axis, as illustrated in Figure 4b. Consequently, the vertical line represented the thickness of the bone in the anterior direction.
Blue line: It computed the average position of all vertices in the contour and drew lines from each point situated on the contour’s boundary that pass through the contour’s average position (geometric center) and end on the opposite side of the average point, as illustrated in Figure 4c.
Black line: In this algorithm, the blue line served as a reference line, which was continuously rotated around its midpoint. The midpoint referred to the middle point of the line itself, rather than the center point of the entire contour or shape. As the blue line was rotated in 1° increments, the algorithm analyzed each orientation to find the one that allowed the creation of the largest possible rectangle with a predetermined fixed width inside the polygon. The line with the optimal orientation was then identified and used to create the desired rectangle, as illustrated in Figure 4d.
Cross-sections at the potential harvesting sites (point B to H) were then analyzed, alongside the generation of red, green, blue, and black reference lines (Figure 5).
2.3.3. Rectangle Plot
Based on the coordinates of the four reference lines and a user-defined value for the width of the rectangle, four colored rectangle plots would be automatically generated using the corresponding algorithms. Each rectangle represented the greatest dimension of dental implants with the proposed angulation.
2.4. Clinical Implications
At our center, the standard dental implant system used for functional jaw reconstruction is the Nobel Parallel Conical Connection TiUltra (Nobel BioCare AB, Göteborg, Sweden). The implant dimensions commonly used were narrow (Ø3.75 mm) and regular (Ø4.3 mm) platforms, with a length of 8.5 mm, 10 mm, 11.5 mm, and 13 mm. However, this number could be easily adjusted in the program with a different implant system. The width of the rectangle represented the user-defined implant diameter with an additional 1.0 mm bony collar included on both sides of the implant (lateral and medial aspects) to ensure no implant thread exposure through the bone. Hence, the widths of rectangles for regular and narrow implants were 6.3 mm and 5.75 mm, respectively (Figure 6). This was used as the input value to allow the program to automatically generate the four colored rectangles and calculate the optimal angulation and maximum implant length at sections B, C, D, E, F, G, and H (Figure 7). The length of the rectangle corresponded to the maximal length of implant possible at each cross-section, with consideration of the surgical feasibility (i.e., from the anterior or lateral aspect of the fibula to the posterior border) and avoidance of the postero-medial portion to prevent interruption to the blood supply from the pedicle.
2.5. Workflow
With the use of MATLAB software, STL files of the fibula model were imported and analyzed automatically by the program. Each STL file would generate three popup windows, including the 3D bone model (Figure 2), cross-sections with four colored reference lines (Figure 5), as well as the cross-sections with four colored rectangles at seven different heights representing the ideal angulation and length of dental implant for each algorithm (Figure 7). A spreadsheet file would be generated automatically to allow direct observation and comparison of the maximum length of rectangles.
The orientation of fibula bone models was verified by two assessors (MY.C and YN.X) to evaluate the accuracy level of the program in identifying the anterior edge of the fibula, as this determines the correct insertion angle of the dental implants. The two assessors would then go through the cross-section analysis for each bone model to verify the anatomical considerations of implant insertion in a fibula free flap and select the rectangle with the greatest length. The inter-rater reliability was assessed for each measurement.
2.6. Statistical Analysis
Statistical analyses were performed using IBM SPSS Statistics Version 28. The two-way random intraclass correlation coefficient was used to determine the level of agreement between two raters when determining the orientation of the fibula and analyzing the best angulation and dimension of the implant at each cross-section.
3. Results
3.1. Patient’s Demographic Background
The demographic data and disease characteristics of patients are presented in Table 1. Of the 91 Chinese patients recruited, 52 (57%) were male and 39 (43%) were female. Patients’ ages ranged from 20 to 86 years, with a mean of 58.4 ± ± 16.7 years. No significant age difference was found between genders (p = 0.882). The majority of the lesions were found in the mandible (77%) and were malignant in nature (68%).
3.2. Program Accuracy
The accuracy level in identifying the orientation and anterior edge of the fibula model was verified before proceeding with cross-sectional analysis. With trial and error and multiple updates to the computer program, no to minimal manual adjustments were required in orienting the fibula models. With the most protruded part method as described earlier, the protruded part at the anterior surface of the lateral malleolus, as highlighted in red in Figure 8, was found to be a reliable benchmark for identifying the inferior and anterior direction of the fibula model. Among the four colored rectangles, the black rectangle demonstrated the maximum length with surgical feasibility in 94% of the cross-sections (Table 2).
Figure 8.
Surface model of fibula bone.
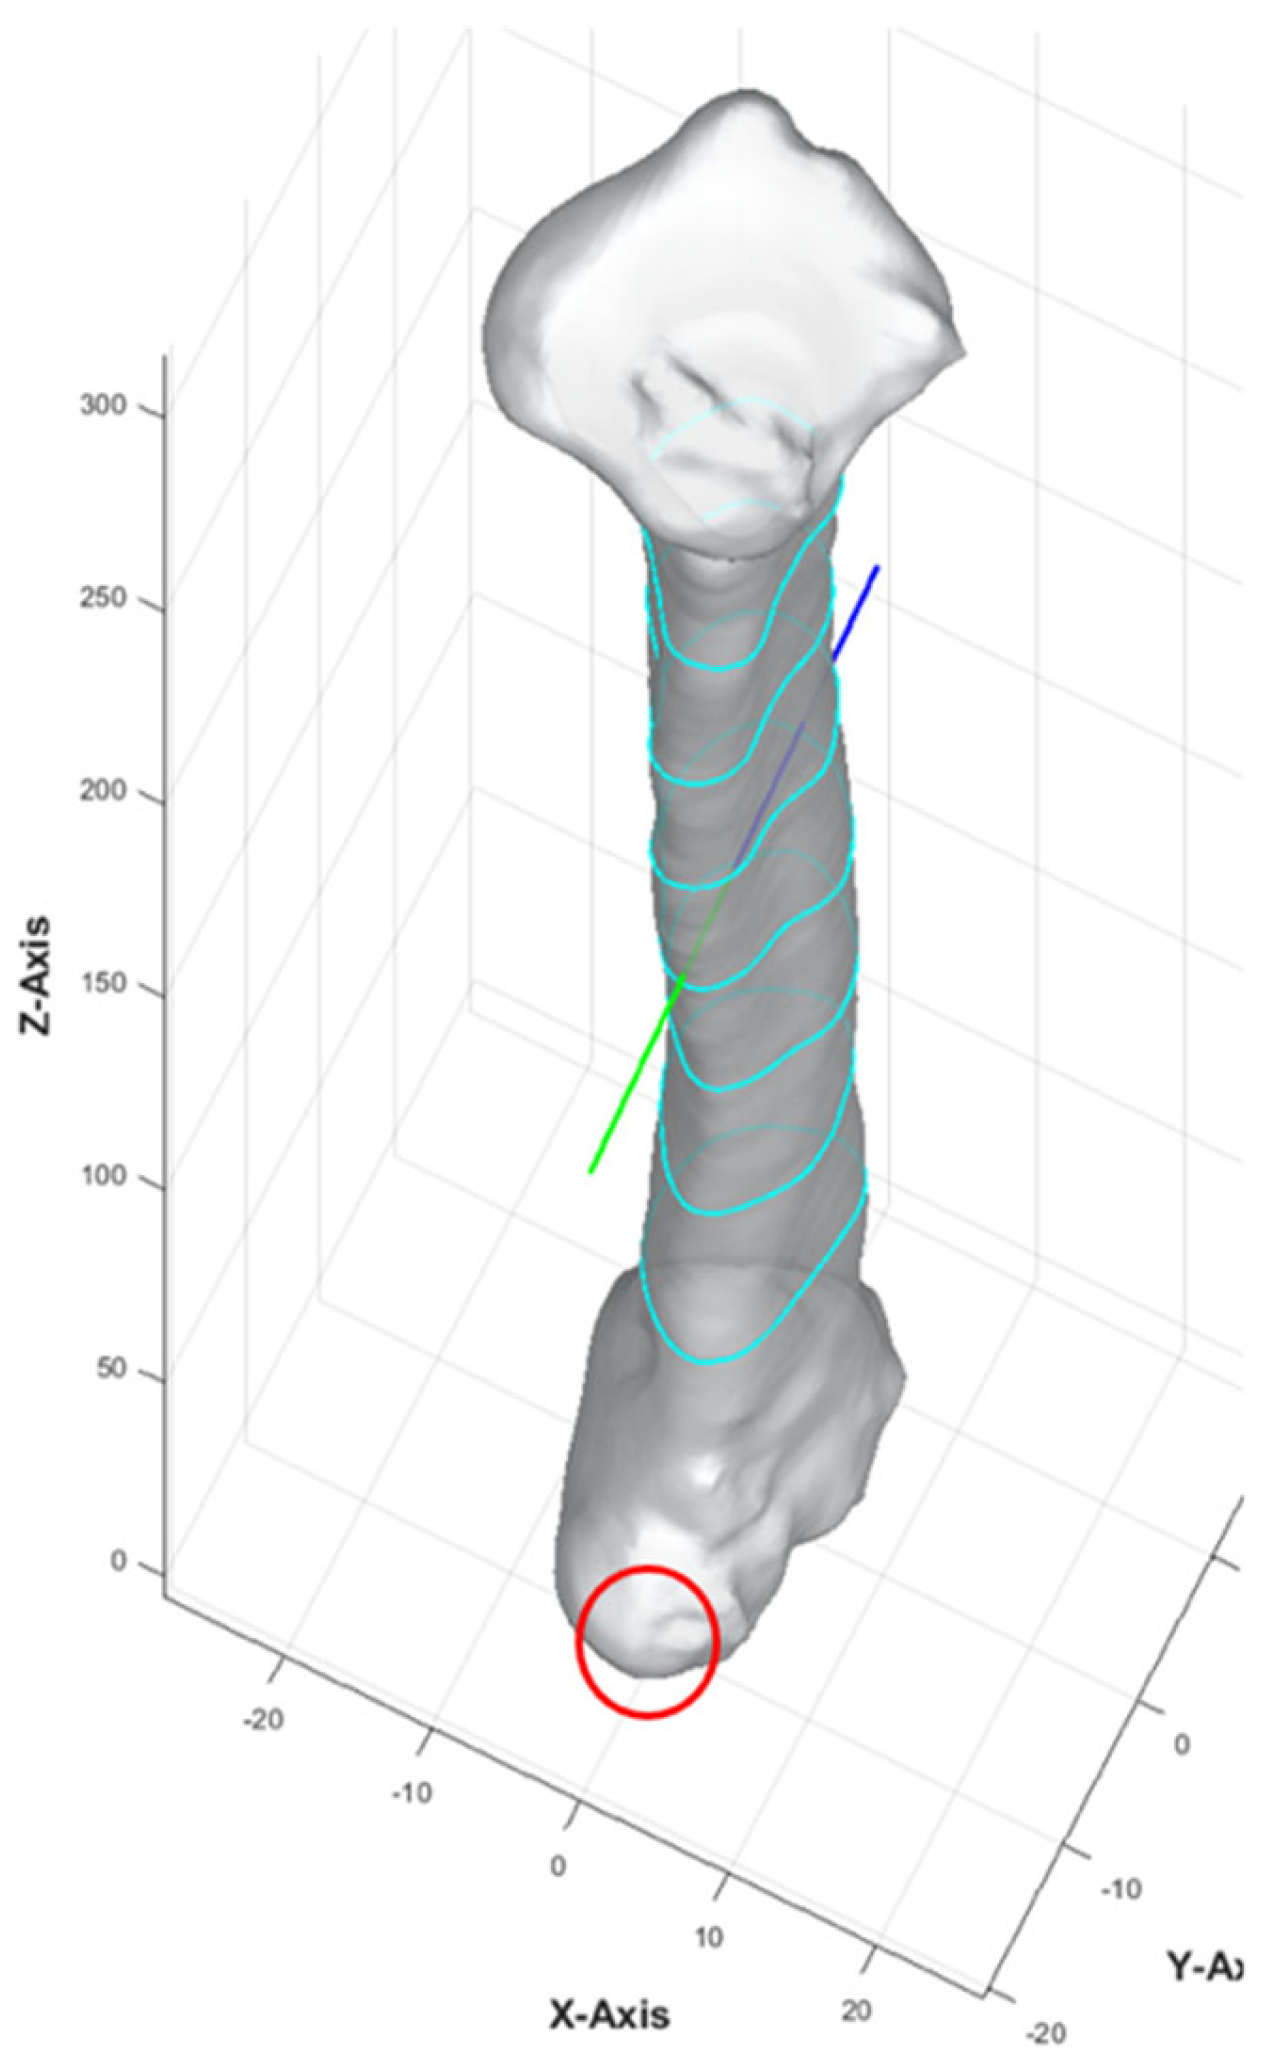

Table 2.
Algorithm selected in fibula cross-sections.
| Rectangles generated by algorithm | Number of cross-sections |
| Black | 94% (1195/1274) |
| Green | 3% (41/1274) |
| Red | 2% (22/1274) |
| Blue | 1% (16/1274) |
3.3. Inter-Rater Agreement Measures
A second assessor (YN.X) conducted the same analysis independently using the customized computer program. Inter-rater agreement was assessed on all STL bone models. The intraclass correlation coefficient was 0.981, indicating that the level of agreement and consistency between the two raters when analyzing the best angulation and dimension of the implant at each cross-section was excellent. Among 1274 cross-sections, a different colored rectangle was chosen between the raters in 107 cross-sections (8%) when considering both the maximum possible length of implants and surgical feasibility. Table 3 lists the number of measurements that were not in agreement concerning the location of the cross-section. More discrepancy was noted towards the proximal end of the fibula, of which 48% had a difference of less than 1.0 mm (as listed in supplementary material, Table S1). 79% (85/107) of the disagreements were due to different preferences when determining the ideal implant angulation. Both measurements were surgically feasible; however, one may prefer to insert the implant from the anterior aspect of the fibula (as shown by the black rectangle in Figure 9) and the other from a relatively more lateral aspect (as indicated by the blue rectangle in Figure 9). For the remaining 21% (22/107) of the cases, one may consider that it remains surgically feasible even though a small portion of the rectangle (<1.0 mm) exceeded the contour of the cross-section (Figure 10).
Table 3.
Number of measurements not in agreement between raters.
| Cross-section | ||||||||
| B | C | D | E | F | G | H | ||
| Female | 5.75 mm | 4 | 2 | 4 | 1 | 4 | 3 | 1 |
| 6.3 mm | 6 | 7 | 8 | 3 | 3 | 5 | 1 | |
| Male | 5.75 mm | 13 | 6 | 3 | 3 | 2 | 0 | 1 |
| 6.3 mm | 15 | 2 | 5 | 3 | 0 | 1 | 1 | |
| Total | 38 | 17 | 20 | 10 | 9 | 9 | 4 | |
Figure 9.
Different implant angulations.
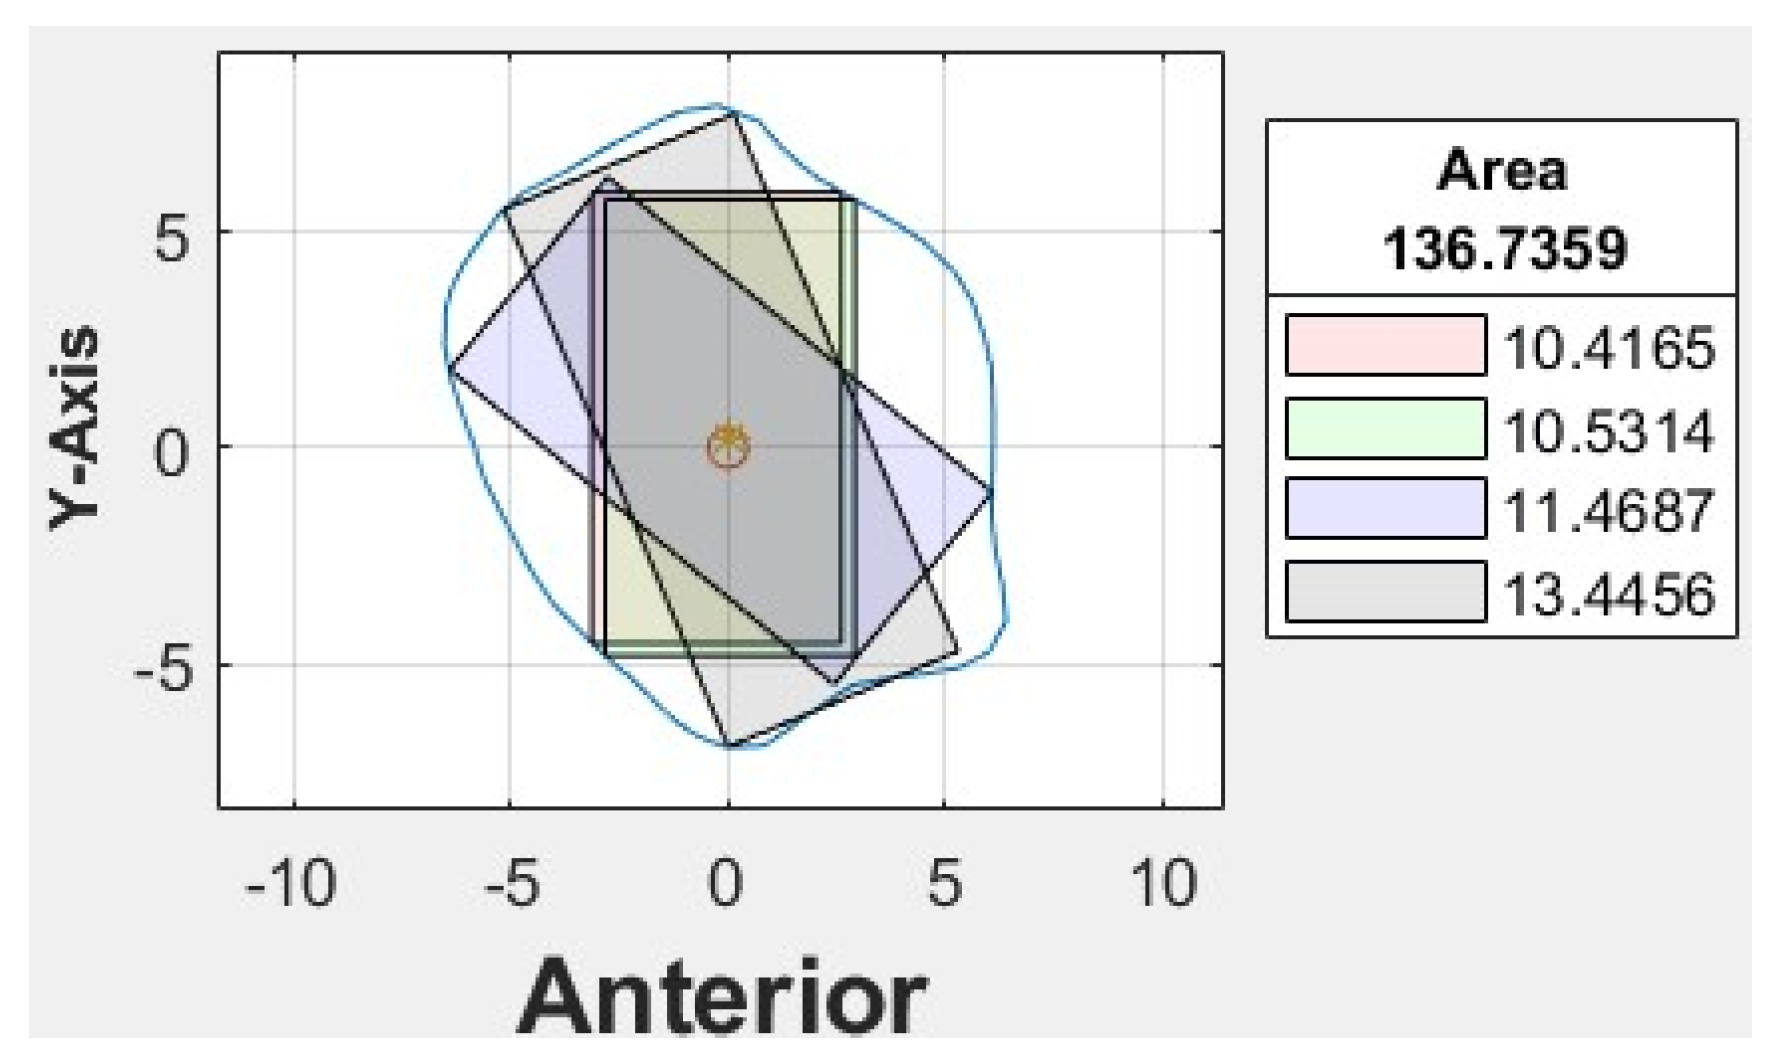
Figure 10.
Black rectangle out of contour.
4. Discussion
Fibula free flap with simultaneous dental implant placement is now routinely performed for functional jaw reconstruction in our center. However, additional time was needed for preoperative planning, especially in determining the orientation of dental implants and fibula segments, to restore aesthetics and function after ablative surgery. ‘Trial and error’ and frequent switching between the planning software and CT scan were often needed to ensure that there would be enough bone surrounding the implant to optimize its stability and survival. Existing cadaveric studies that described fibula morphology have identified the ideal segments for osseointegrated implants in FFF reconstructions; however, little attention was paid to the anatomical requirements of the fibula, surgical feasibility, or orientation of dental implants in relation to the cross-sectional analysis. To the best of our knowledge, this is the first study to determine the optimal size and angulation of dental implants using an automatic computer program, while incorporating surgical considerations when harvesting a fibula free flap for jaw reconstruction.
To ensure surgical feasibility, the anterior aspect of the fibula was automatically identified using the program developed, hence the direction of implant installation. Our research has proved that the accuracy and reproducibility of the program in identifying the anterior surface of the fibula was as high as 92%. The ideal location, angulation, and maximum length of implant could be automatically generated based on the selected implant diameter. In addition, the implants’ ideal position according to prosthetic considerations predetermines the position of the fibula segments for bony reconstruction [18]. This is an important step paved towards automatic function-driven fibula reconstruction of the jaw.
In the current study, the specific algorithm for generating the black rectangle proved to be the most effective in representing the ideal angulation with maximum implant length and surgical feasibility in 94% of the cases studied. Based on this significant finding, further efforts could be made to streamline and improve this specific algorithm, aiming to convert implant selection and planning into a fully automated procedure that requires minimal manual adjustments. With the excellent inter-rater agreement, it was demonstrated that the computer program was user-friendly and could be relied upon to pre-determine the ideal implant angulation based on cross-sectional analysis. Although discrepancies were present between the raters when selecting the ideal implant angulation, the differences were acceptable, as different surgeons might have slightly different preferences or opinions on the concept of surgical feasibility [13]. A small portion of the rectangle (<1.0 mm) exceeding the contour of the cross-section would be acceptable, as the final implant length was determined by subtracting a 1.0 mm bony collar at the apical portion from the maximum length of the rectangle. Furthermore, a greater discrepancy was noted at the proximal end of the fibula; this could be due to its triangular shape, which allows for different implant angulations while still being surgically feasible.
As with all computer programs or software, regular updates are required to further improve the computer coding and its functionality. This is particularly important when the program is applied to a larger study population, it would likely require updates to accommodate the anatomical variations in the population for a more reliable and accurate analysis. With the significant advances in artificial intelligence and machine learning, this technology can be further integrated into the workflow of automatic virtual surgical planning for functional jaw reconstruction. The study’s limitation was its retrospective nature; further prospective studies incorporating a customized computer program in VSP are needed to validate this protocol and evaluate the postoperative implant position for functional jaw reconstruction.
5. Conclusions
This current study describes the development and verification of an automated program to determine the optimal size and angulation of dental implants in functional jaw reconstruction using a fibula free flap. This customized automatic computer program can be incorporated into the current guided implant design workflow to advance the frontier of function-driven fibula reconstruction of the jaw. This will pave the way towards automatic placement of dental implants during VSP to provide a reliable and efficient solution for functional jaw reconstruction with fibula free flap.
6. Patents
Title of invention: Method and System for automatic identification of a dental implant position on a bone. US 63/754,065. Filing date: 02/05/2025.
Supplementary Materials
The following supporting information can be downloaded at the website of this paper posted on Preprints.org, Table S1: Table showing the differences in measurements between raters.
Author Contributions
Conceptualization, MY.C., A.N., YX.S and JJ.P.; methodology, MY.C., A.N., YX.S and JJ.P.; software, MY.C. and A.N.; validation, MY.C.; formal analysis, MY.C. and XN.Y.; investigation, MY.C. and XN.Y.; data curation, MY.C and KY.L.; writing—original draft preparation, MY.C. and JJ.P.; writing—review and editing, MY.C., YX.S and JJ.P.; visualization, X.X.; supervision, YX.S and JJ.P.; funding acquisition, YX.S. All authors have read and agreed to the published version of the manuscript.
Funding
This research was funded by General Research Fund, Research Grants Council (No. 17114722) and Health and Medical Research Fund (No. 08192096), Hong Kong.
Institutional Review Board Statement
This study was approved by the Institutional Review Board of the University of Hong Kong/ Hospital Authority of Hong Kong West Cluster (IRB: UW 24-121; 13/03/2024).
Informed Consent Statement
Patient consent was waived due to the retrospective nature of the study.
Data Availability Statement
Suggested Data Availability Statements are available in section “MDPI Research Data Policies” at https://www.mdpi.com/ethics.
Conflicts of Interest
The authors declare no conflicts of interest.
Abbreviations
The following abbreviations are used in this manuscript:
| CAS | Computer-assisted surgery |
| CT | Computer tomography |
| DICOM | Digital Imaging and Communications in Medicine |
| FFF | Fibula free flap |
| STL | Stereolithography |
| VSP | Virtual surgical planning |
| 3D | Three-dimentional |
| Ø | Diameter |
References
- Weitz, J. , et al., Accuracy of mandibular reconstruction by three-dimensional guided vascularised fibular free flap after segmental mandibulectomy. Br J Oral Maxillofac Surg, 2016. 54(5): p. 506–10.
- Hidalgo, D.A. , Fibula free flap: a new method of mandible reconstruction. Plast Reconstr Surg, 1989. 84(1): p. 71–9.
- Su, Y.R. , et al., Fibula Flap Reconstruction for the Mandible: Why It Is Still the Workhorse? Atlas Oral Maxillofac Surg Clin North Am, 2023. 31(2): p. 121–127.
- Powcharoen, W. , et al., Computer-Assisted versus Conventional Freehand Mandibular Reconstruction with Fibula Free Flap: A Systematic Review and Meta-Analysis. Plast Reconstr Surg, 2019. 144(6): p. 1417–1428.
- Pu, J.J. , et al., Current Trends in the Reconstruction and Rehabilitation of Jaw following Ablative Surgery. Cancers (Basel), 2022. 14(14).
- Pu, J.J. , et al., Unexpected Change of Surgical Plans and Contingency Strategies in Computer-Assisted Free Flap Jaw Reconstruction: Lessons Learned From 98 Consecutive Cases. Front Oncol, 2022. 12: p. 746952.
- Zhu, W.Y. , et al., “Three-in-one” patient-specific surgical guides for simultaneous dental implants in fibula flap jaw reconstruction: A prospective case series. Clin Implant Dent Relat Res, 2021. 23(1): p. 43–53.
- Pu, J.J. , et al., A quantitative comparison of bone resection margin distances in virtual surgical planning versus histopathology: a prospective study. Int J Surg, 2024. 110(1): p. 111–118.
- Pu, J.J. , et al., Do predetermined surgical margins compromise oncological safety in computer-assisted head and neck reconstruction? Oral Oncol, 2020. 111: p. 104914.
- Liu, R. , et al., Cutting-edge patient-specific surgical plates for computer-assisted mandibular reconstruction: The art of matching structures and holes in precise surgery. Front Surg, 2023. 10: p. 1132669.
- Pu, J.J. , et al., A Comparative Study on a Novel Fibula Malleolus Cap to Increase the Accuracy of Oncologic Jaw Reconstruction. Front Oncol, 2021. 11: p. 743389.
- Yang, W.F. , et al., A novel ‘surgeon-dominated’ approach to the design of 3D-printed patient-specific surgical plates in mandibular reconstruction: a proof-of-concept study. Int J Oral Maxillofac Surg, 2020. 49(1): p. 13–21.
- Apinhasmit, W., P. Sinpitaksakul, and S. Chompoopong, Anatomical considerations of the Thai fibula used as a fibula osteocutaneous free flap in mandibular reconstruction and dental implant placement. J Med Assoc Thai, 2012. 95(4): p. 561–8.
- Matsuura, M. , et al., Clinicoanatomic examination of the fibula: anatomic basis for dental implant placement. Int J Oral Maxillofac Implants, 1999. 14(6): p. 879–84.
- Cavalcanti, M.G. , et al., Validation of spiral computed tomography for dental implants. Dentomaxillofac Radiol, 1998. 27(6): p. 329–33.
- Choi, S.W. , et al., Topographical anatomy of the fibula and peroneal artery in Koreans. Int J Oral Maxillofac Surg, 2001. 30(4): p. 329–32.
- Zlotolow, I.M. , et al., Osseointegrated implants and functional prosthetic rehabilitation in microvascular fibula free flap reconstructed mandibles. Am J Surg, 1992. 164(6): p. 677–81.
- Ide, Y. , et al., Anatomical examination of the fibula: digital imaging study for osseointegrated implant installation. J Otolaryngol Head Neck Surg, 2015. 44(1): p. 1.
Figure 1.
Computer-aided virtual surgical planning workflow: (a) CT data of the recipient jaw and donor fibula were segmented to construct the 3D models; (b) Virtual reconstructive surgeries were conducted using ProPlan CMF 3.0 and the positions of fibula segments were optimized to provide an excellent contouring of defects; (c) Implants were planned digitally on ideal positions based on the pre-existing dentition; (d) Implant positions were checked in the CT lower limbs to ensure bi-cortical engagement and no threads exposure.
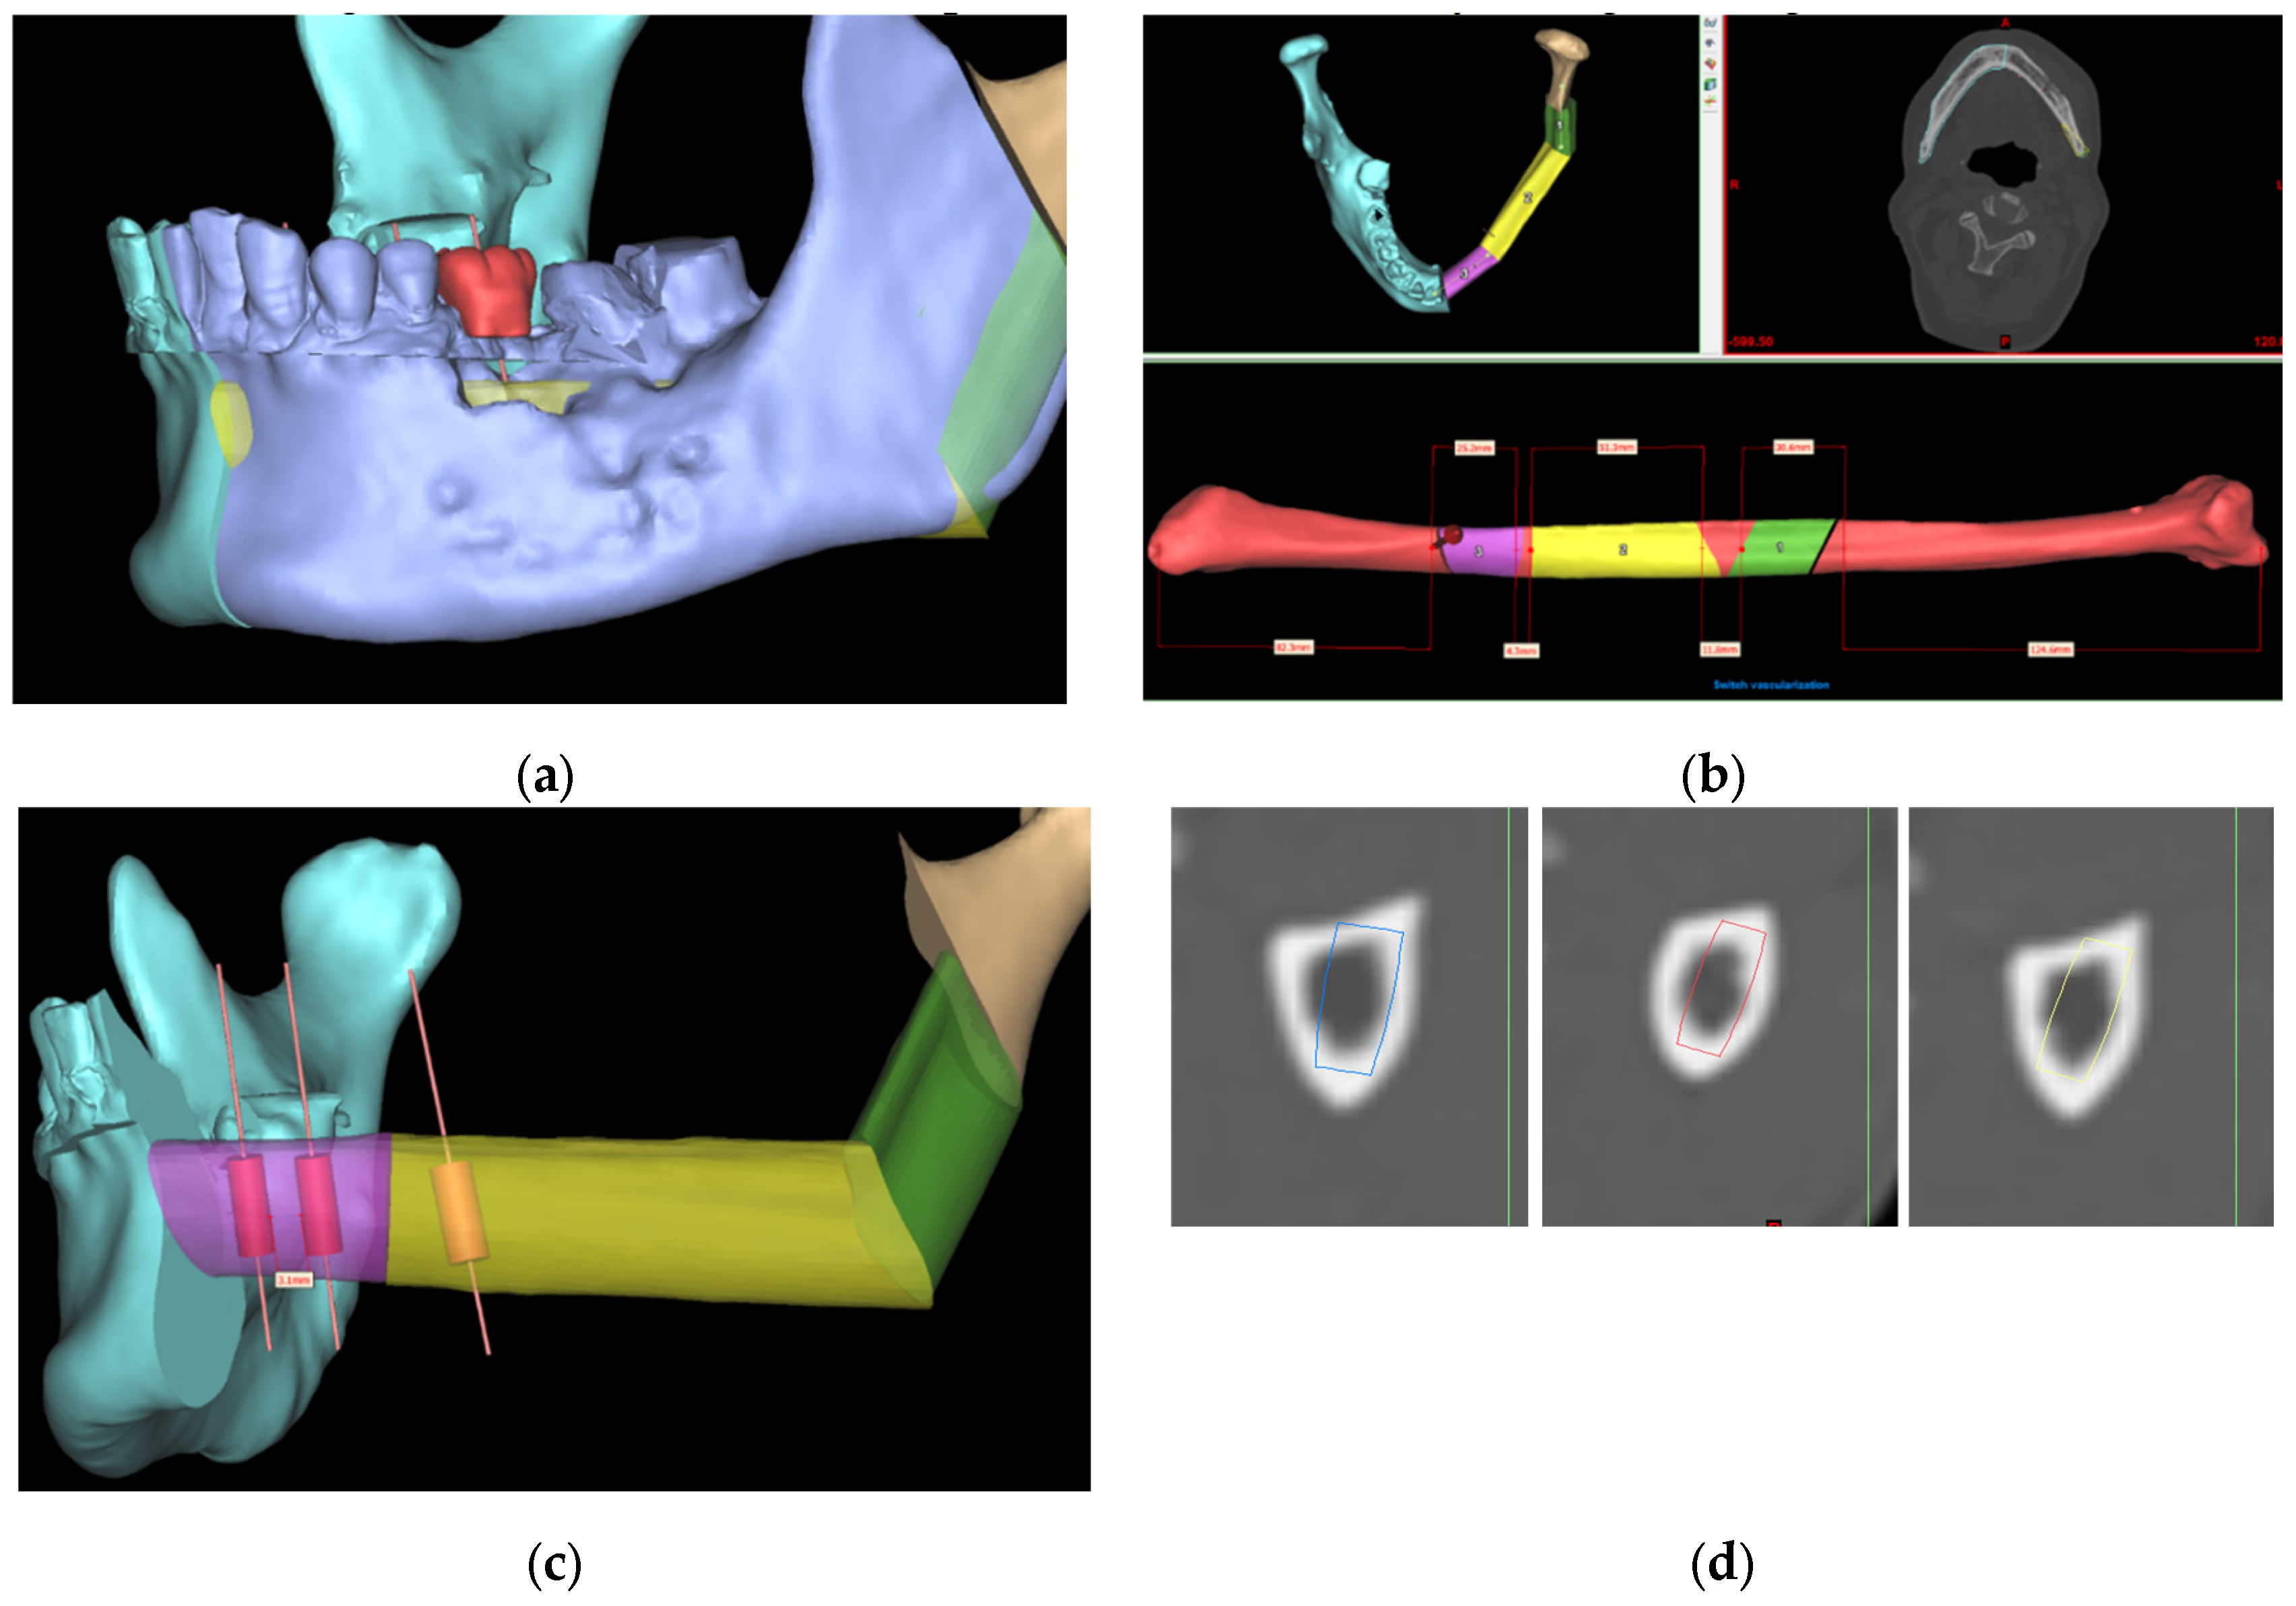
Figure 2.
3D model of fibula. The contour as illustrated by the blue lines represented the cross-section of the fibula model at different slice height.
Figure 2.
3D model of fibula. The contour as illustrated by the blue lines represented the cross-section of the fibula model at different slice height.
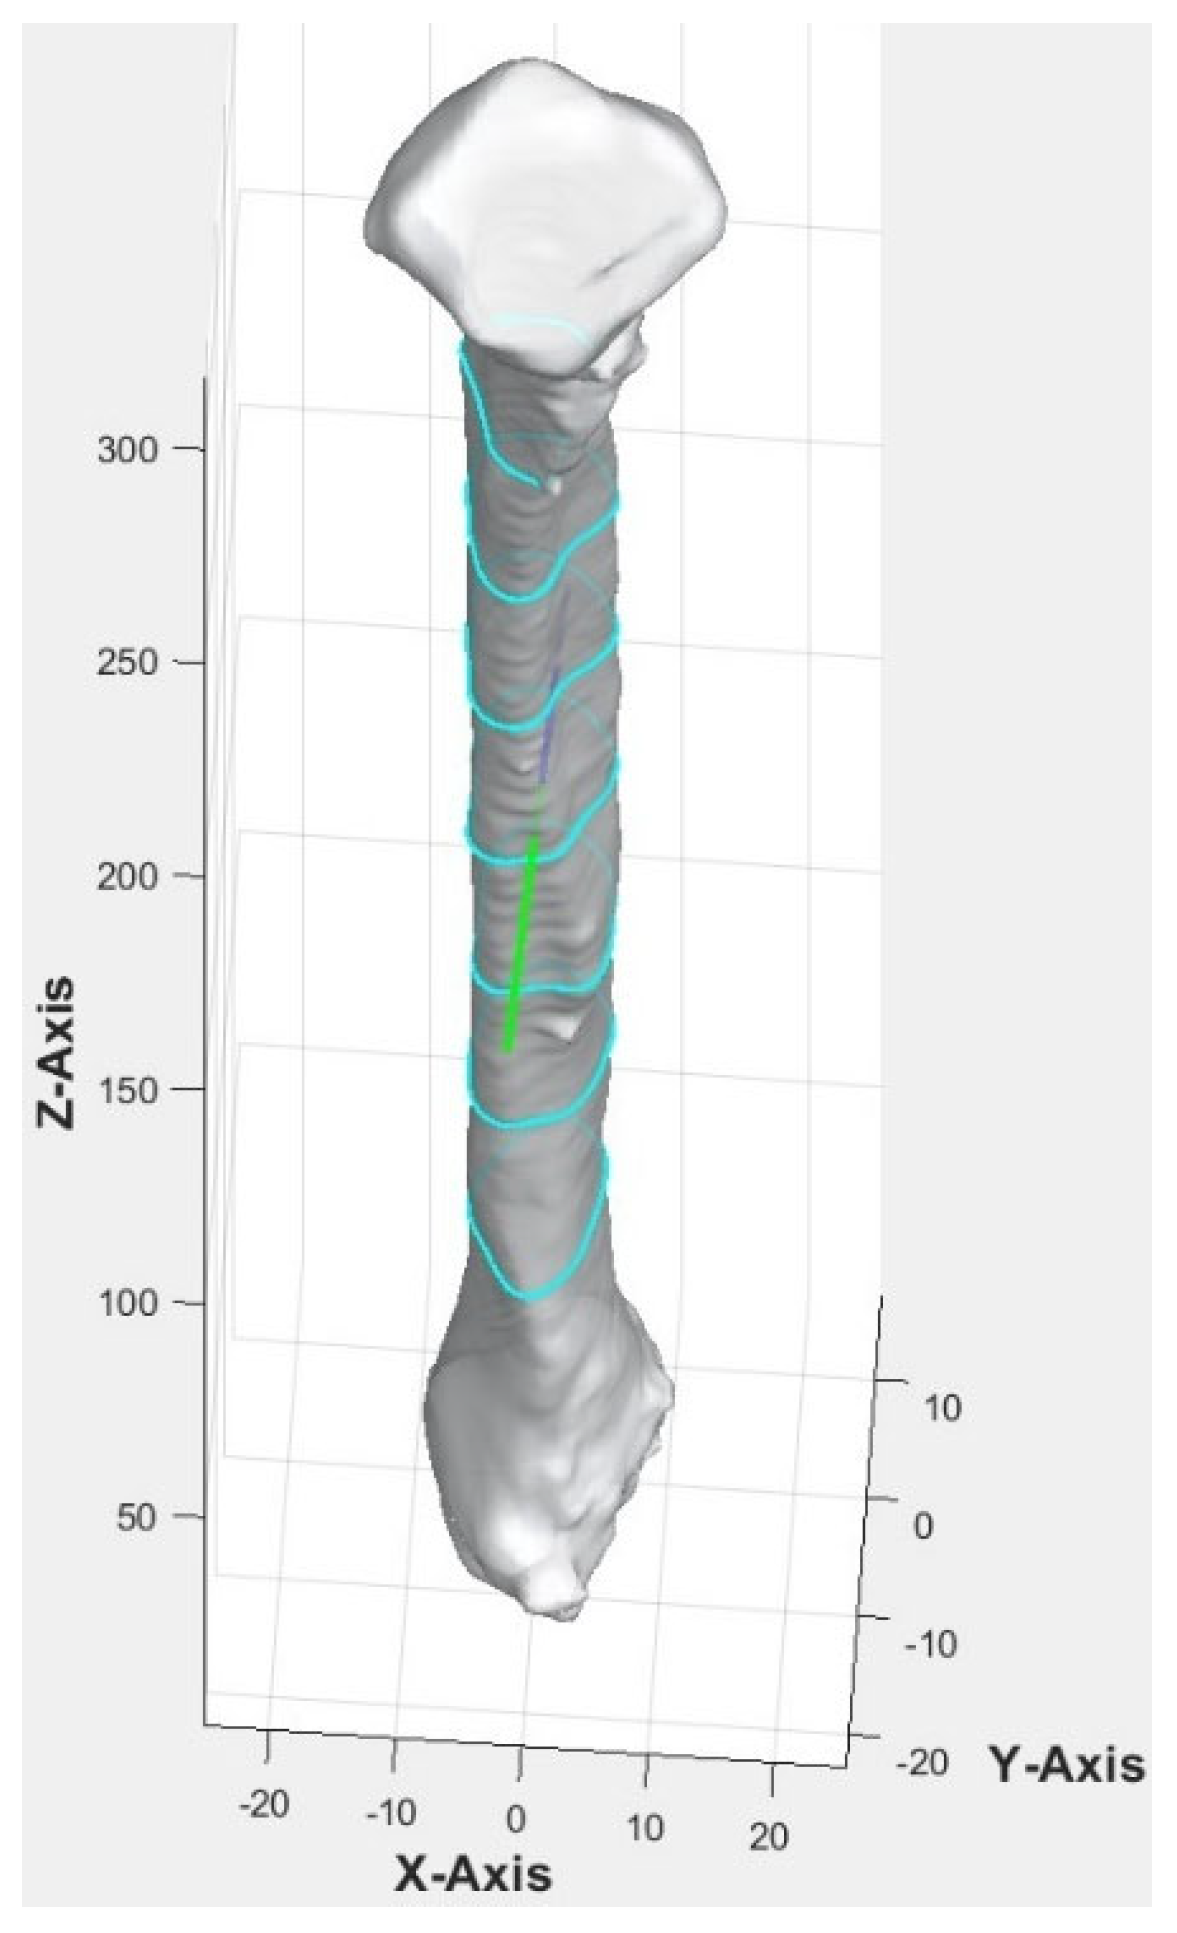
Figure 3.
Position of cross-section of fibula bone model.
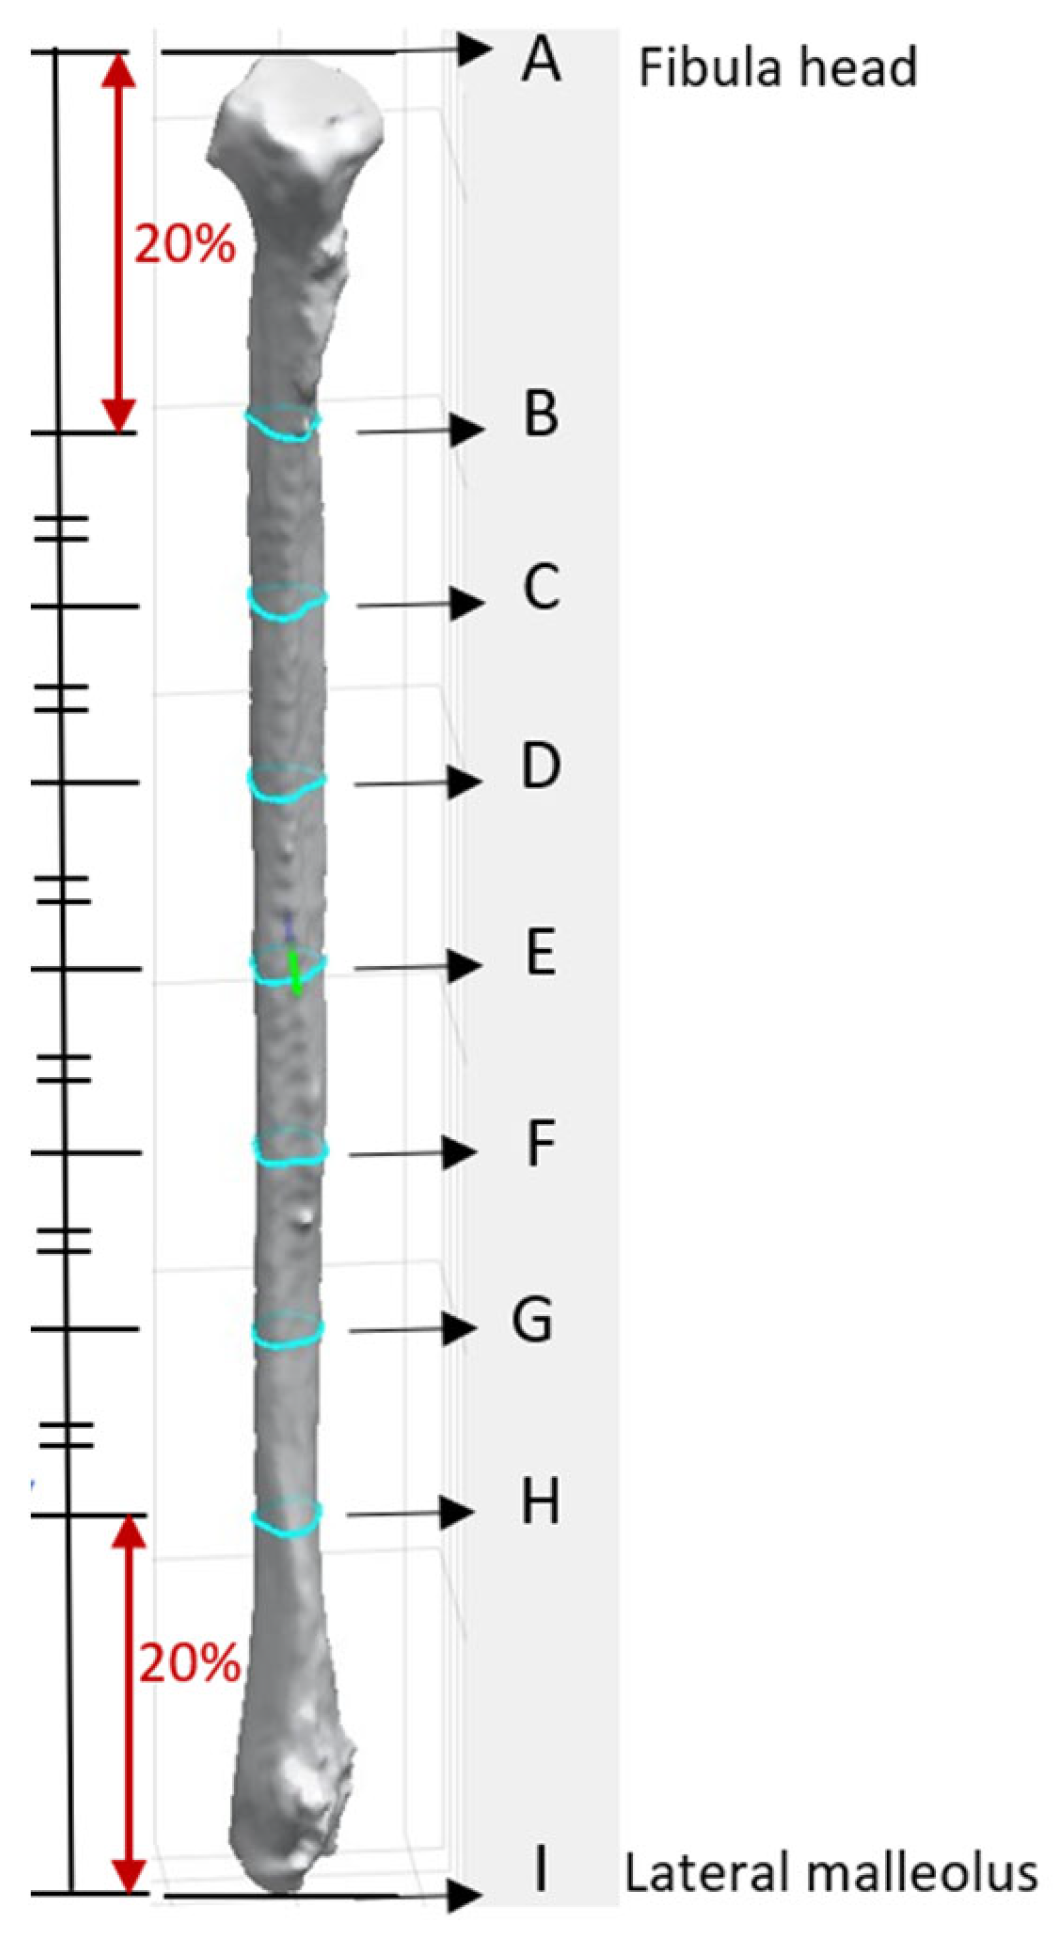
Figure 4.
Algorithm for references lines: (a) Algorithm for red line – grid line with the maximum length; (b) Algorithm for green line – demonstrating a vertical line that passes through the geometric center of the contour; (c) Algorithm for blue line – the longest line was highlighted among the different lines that pass through the geometric center of the contour; (d) Algorithm for black line – blue line was rotated around its midpoint at constant intervals, the highlighted line in black was the identified line for drawing the rectangle.
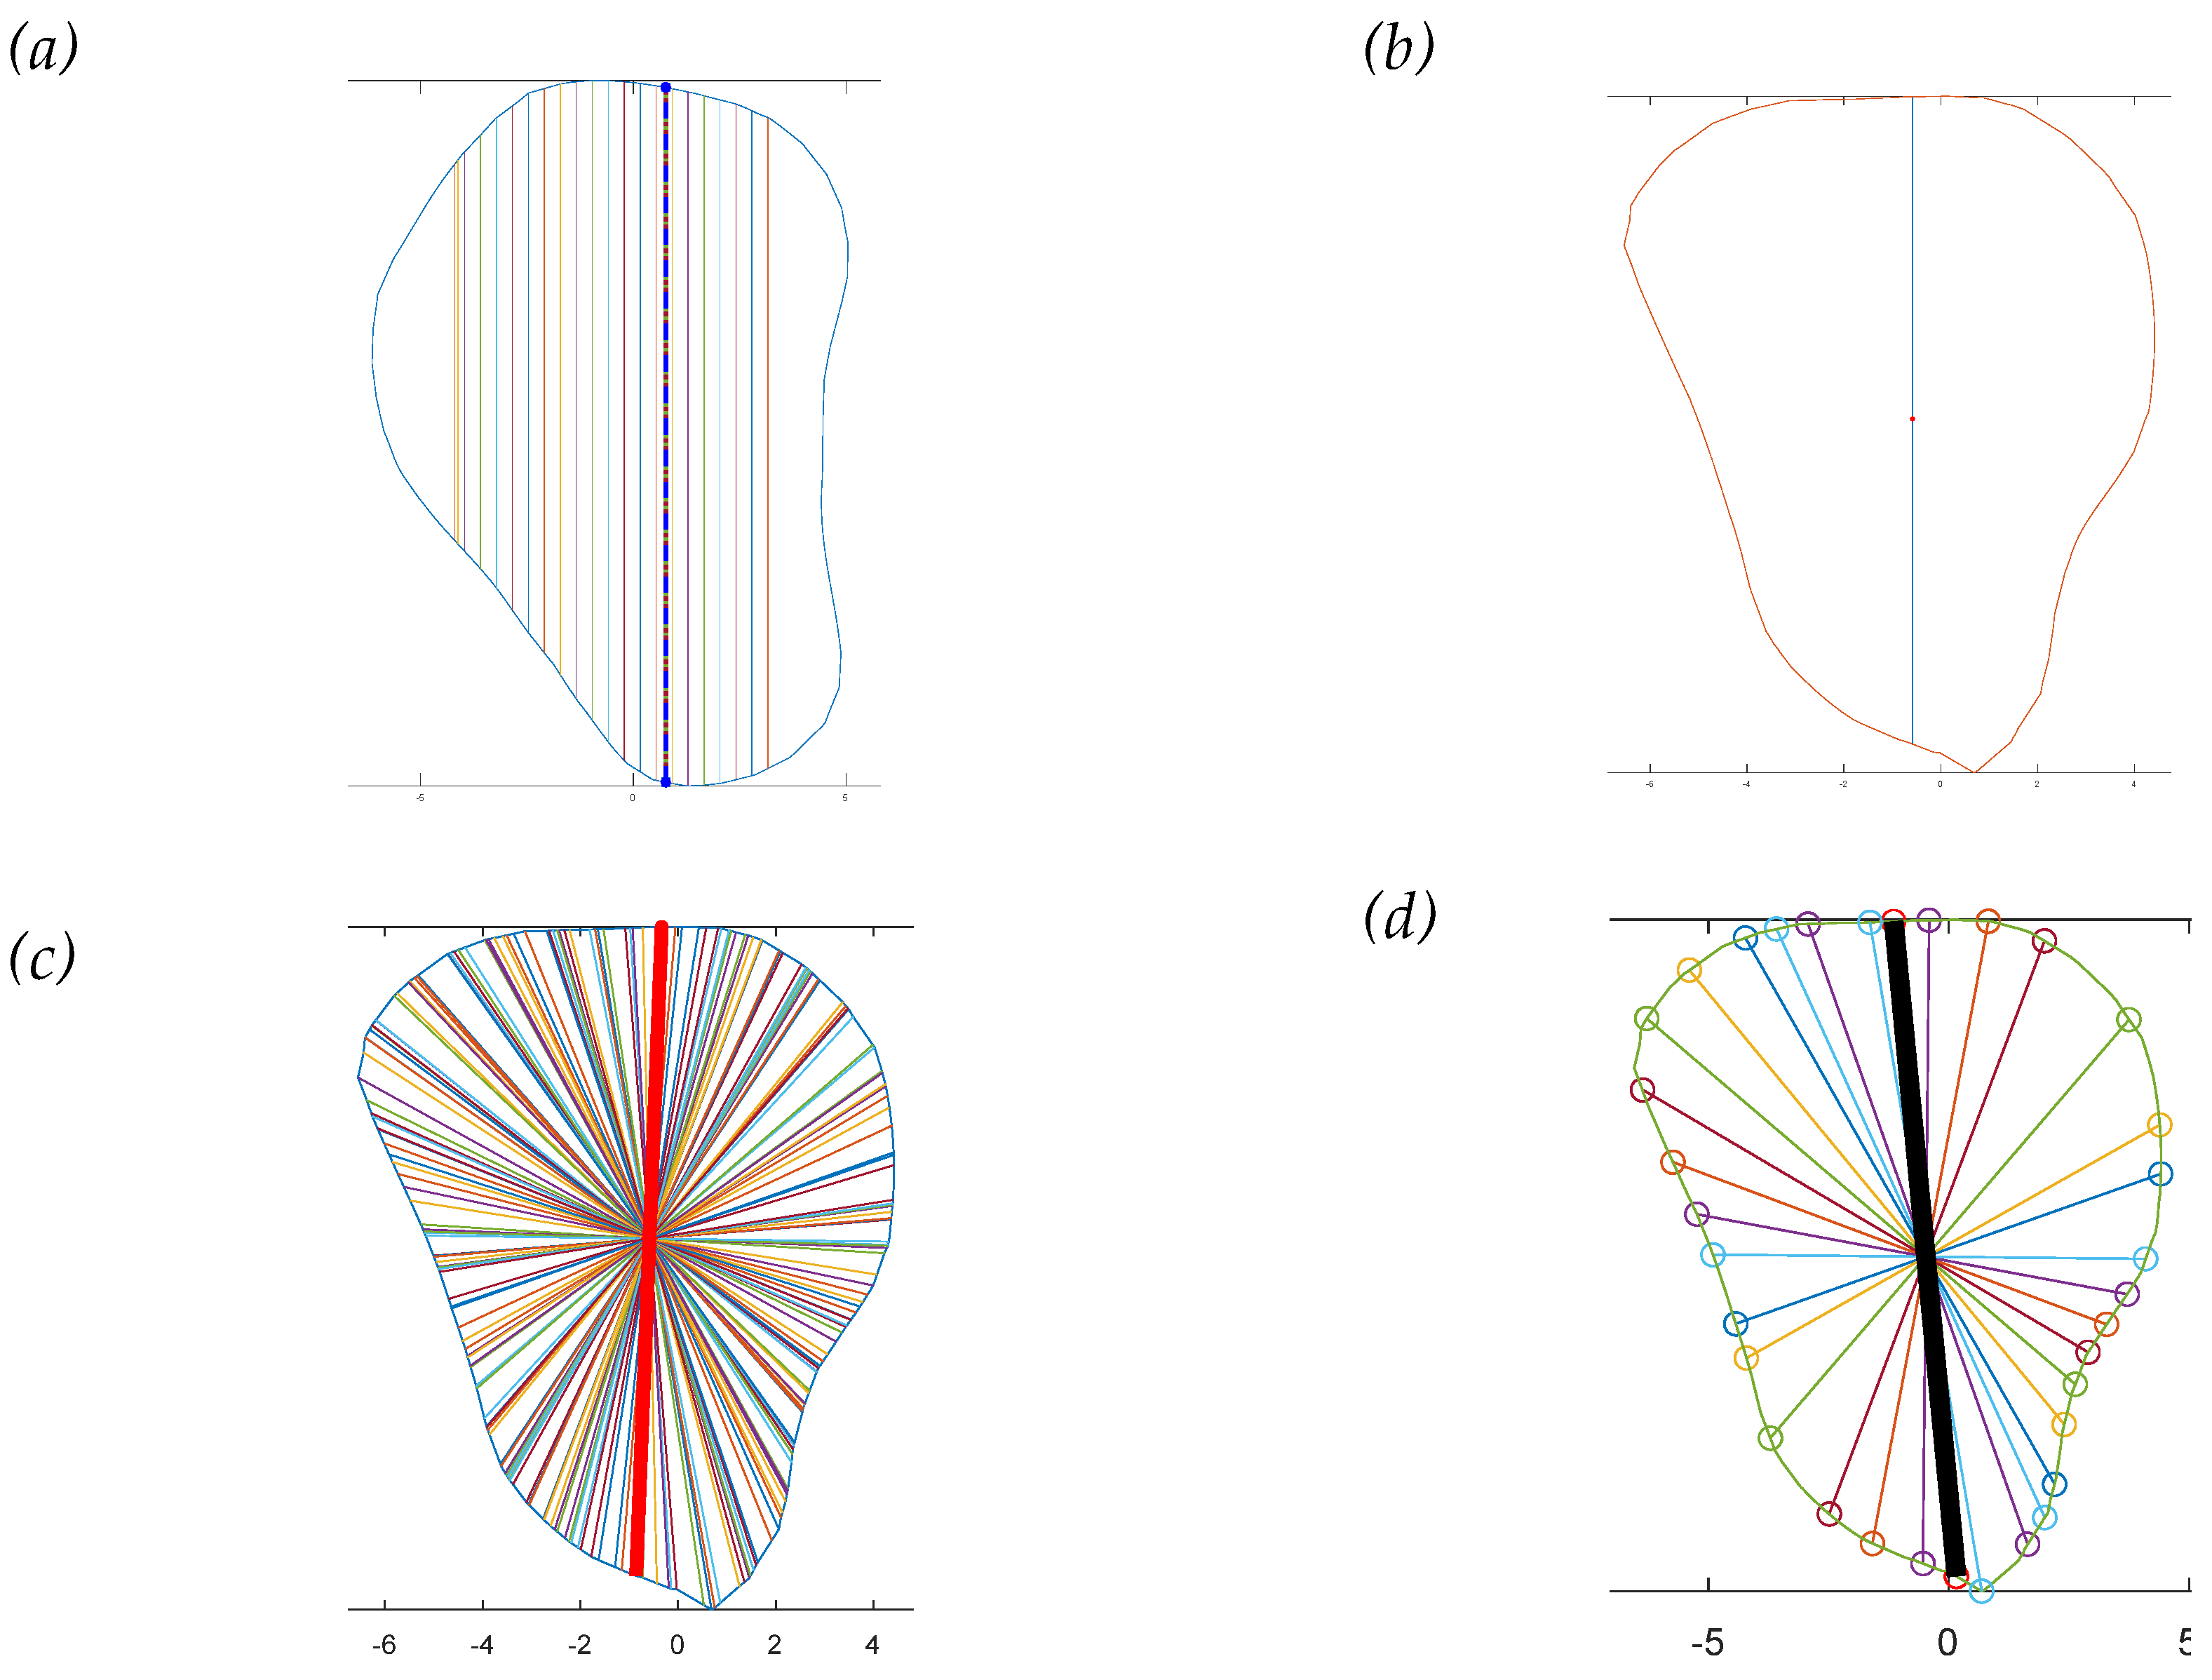
Figure 5.
Software interface demonstrating the seven fibula cross-sections with four reference lines. Blue contour represented the outline of each cross-section from point B to H. The X-axis represented the anterior aspect of the fibula.
Figure 5.
Software interface demonstrating the seven fibula cross-sections with four reference lines. Blue contour represented the outline of each cross-section from point B to H. The X-axis represented the anterior aspect of the fibula.
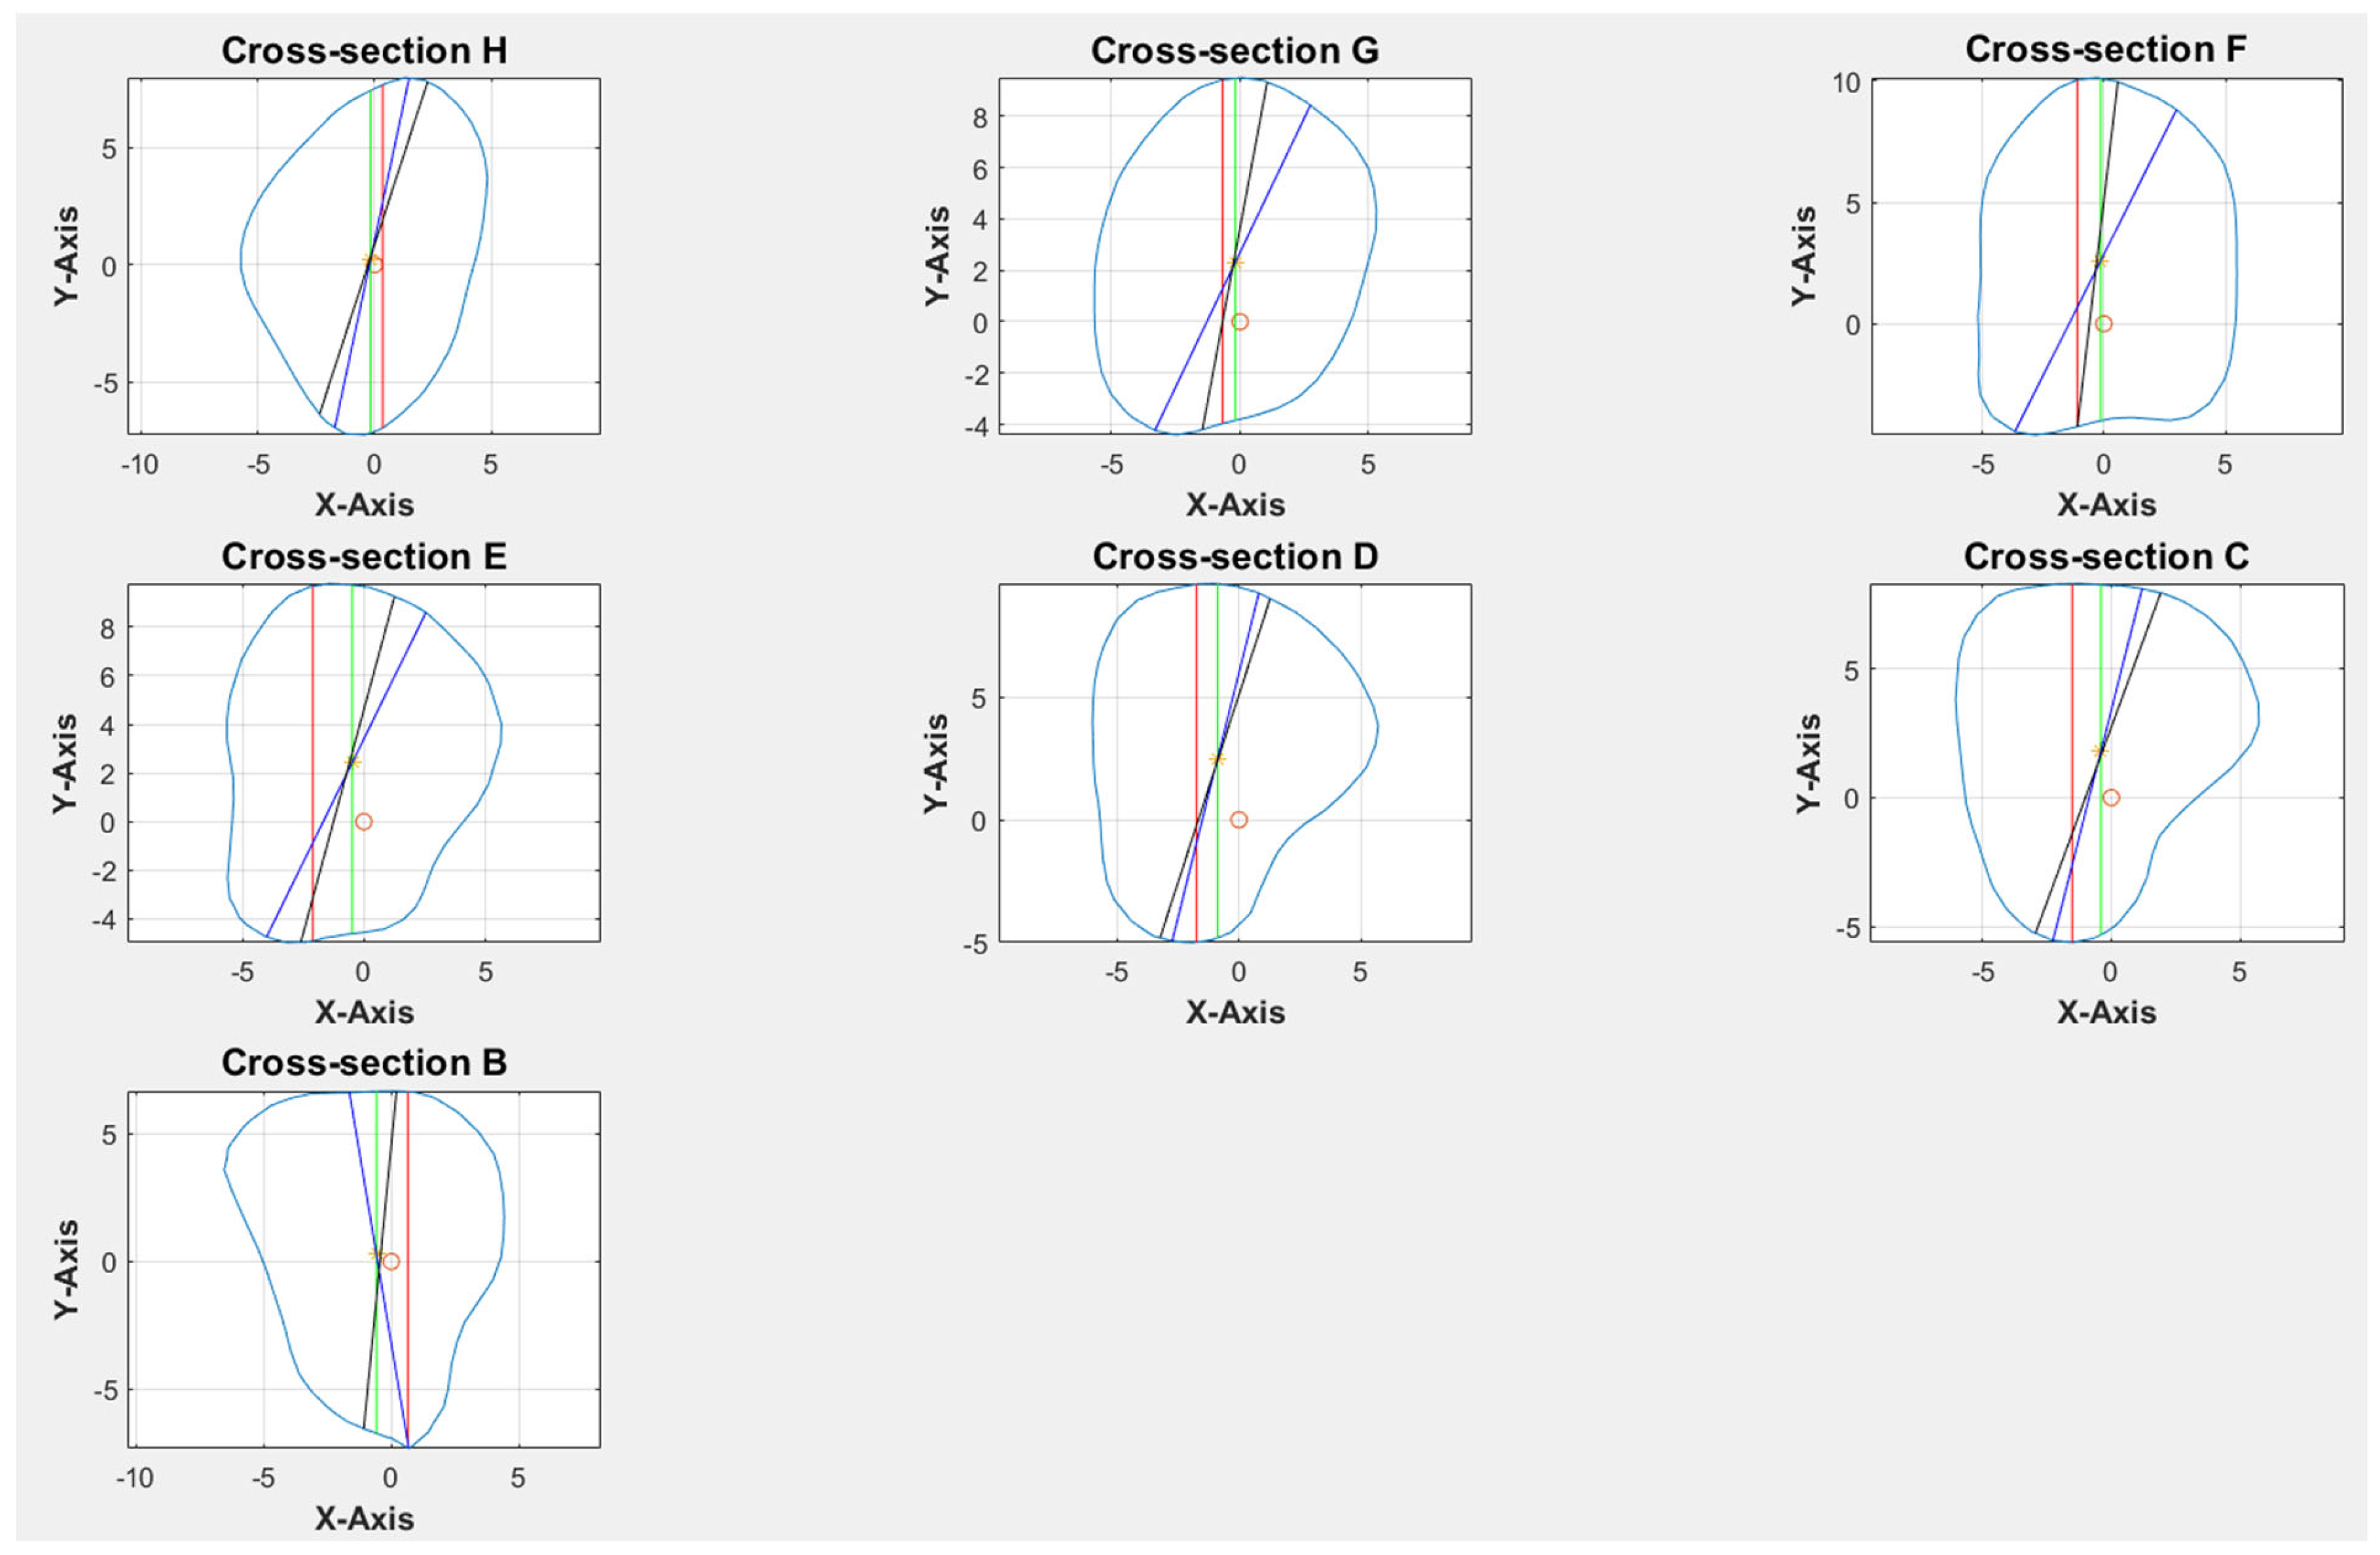
Figure 6.
Illustration of rectangles within a cross-section.
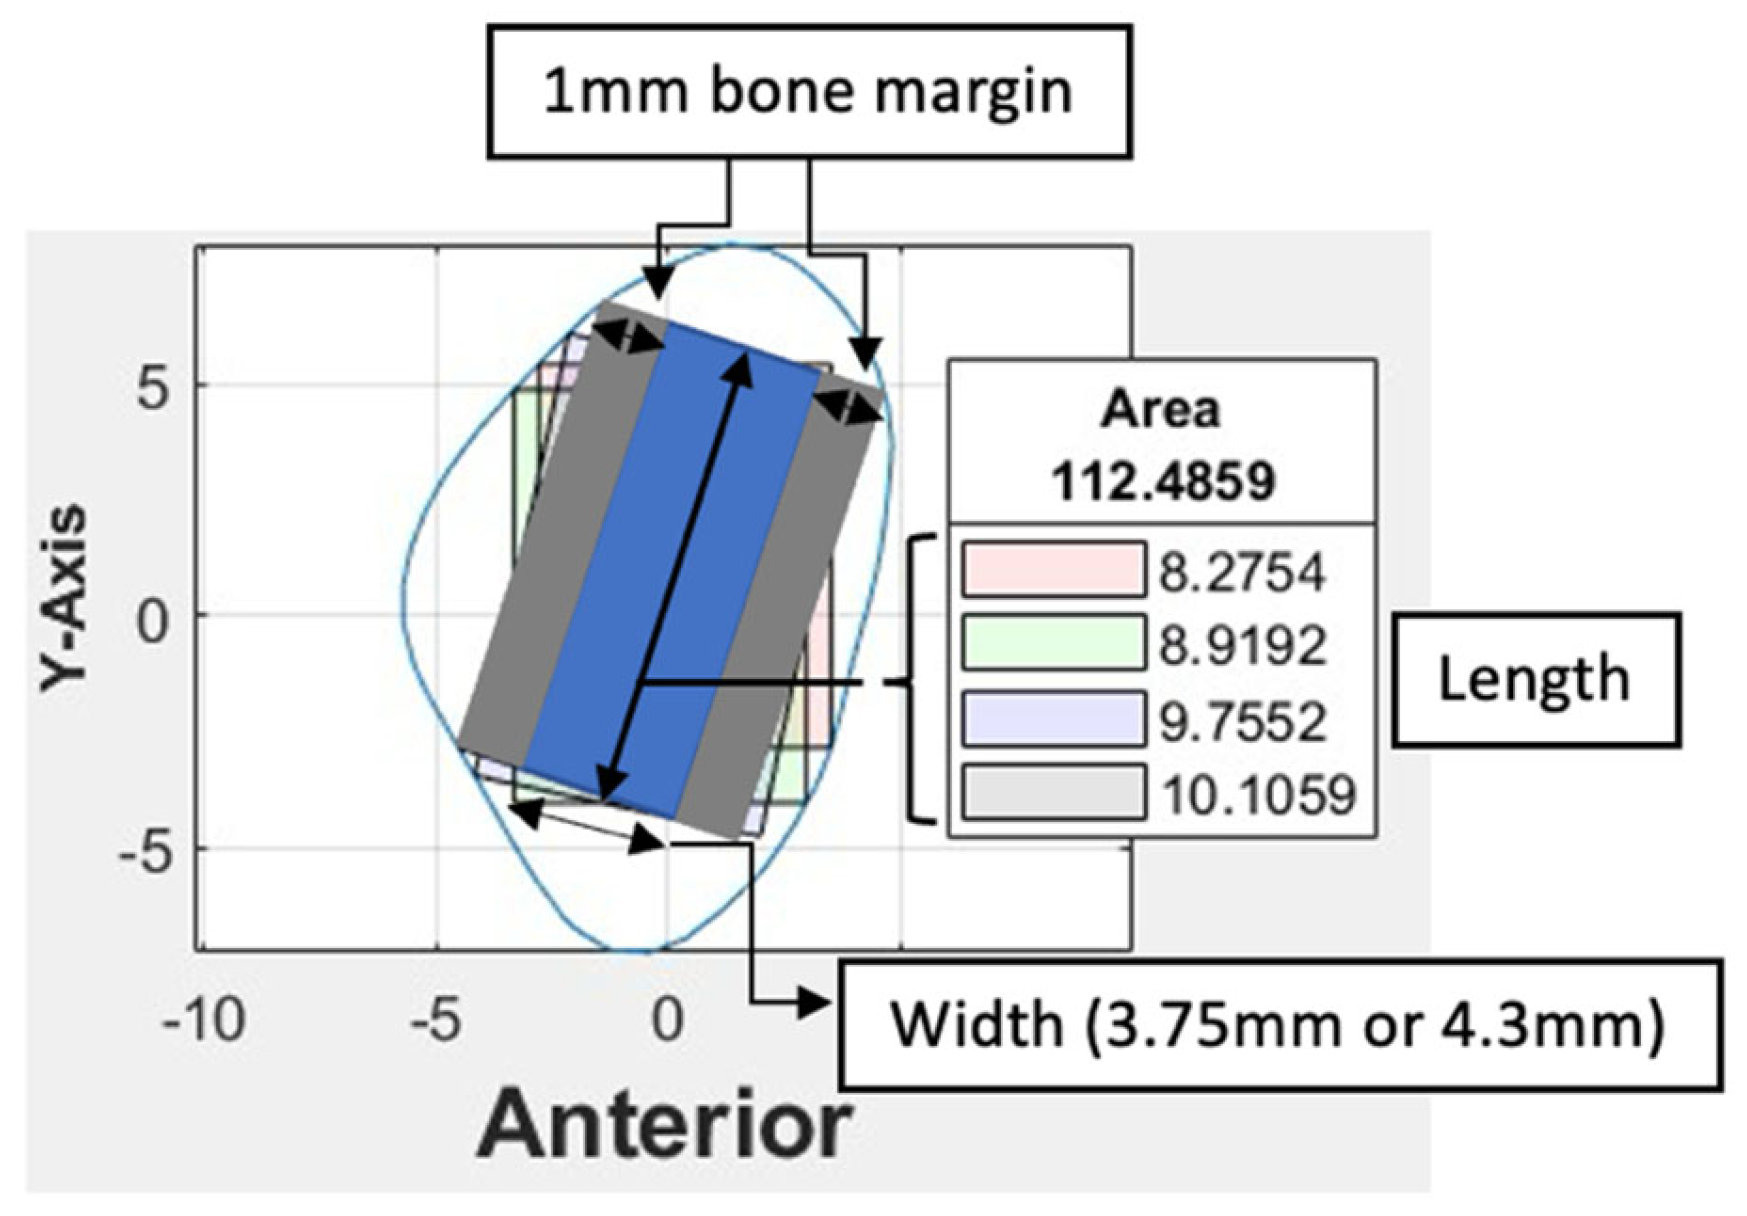
Figure 7.
Software interface demonstrating cross-section of fibula segments and four coloured rectangles, each representing the different angulation and implant length generated by the four distinct algorithms.
Figure 7.
Software interface demonstrating cross-section of fibula segments and four coloured rectangles, each representing the different angulation and implant length generated by the four distinct algorithms.
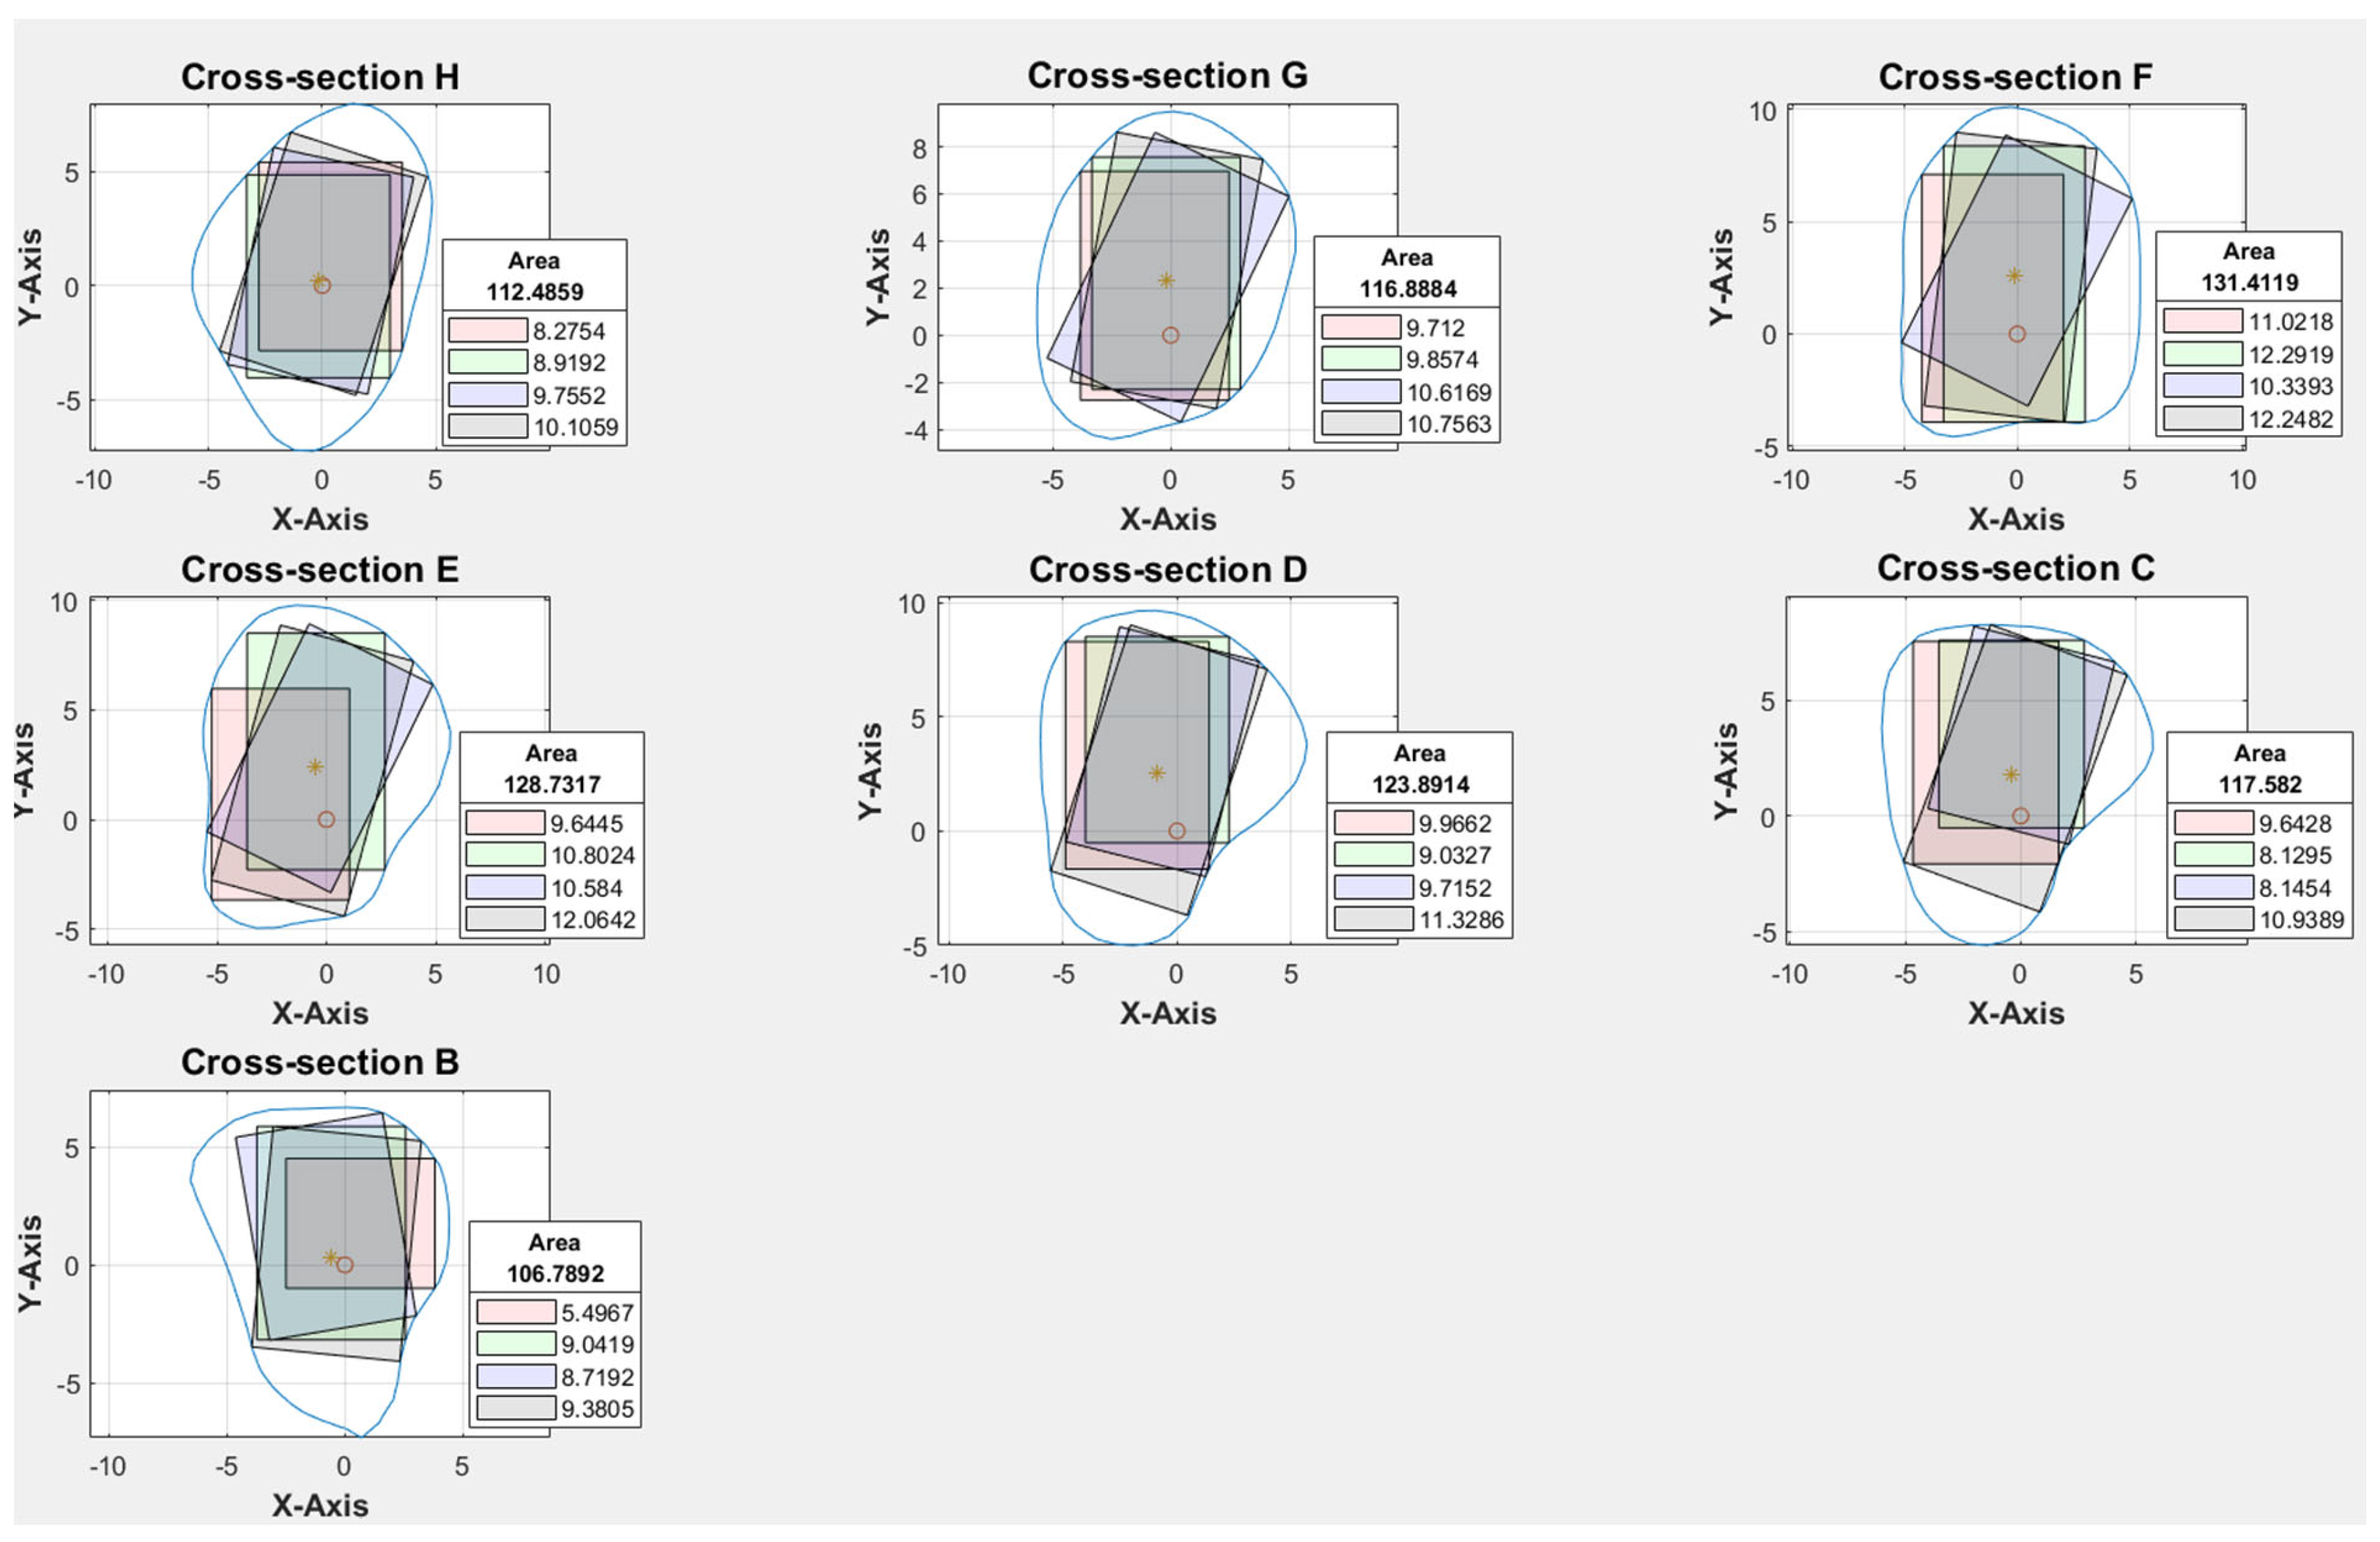
Table 1.
Patient demographics and reconstruction characteristics.
| Characteristic | Male (n=52) | Female (n=39) | p value |
| Age (mean) | 58.6 ± 17.7 | 58.2 ± 15.4 | 0.882b |
| Lesion type | |||
| Benign | 21.2% (11/52) | 25.6% (10/39) | 0.857c |
| Malignant | 69.2% (36/52) | 66.7% (26/39) | |
| Othersa | 9.6% (5/52) | 7.7% (3/39) | |
| Defect site | |||
| Maxilla | 19.2% (10/52) | 28.2% (11/39) | 0.315c |
| Mandible | 80.8% (42/52) | 71.8% (28/39) |
a Others included secondary reconstruction and osteoradionecrosis; b This p value was calculated by means of the Mann–Whitney U test; c This p value was calculated by means of the chi-square test.
Disclaimer/Publisher’s Note: The statements, opinions and data contained in all publications are solely those of the individual author(s) and contributor(s) and not of MDPI and/or the editor(s). MDPI and/or the editor(s) disclaim responsibility for any injury to people or property resulting from any ideas, methods, instructions or products referred to in the content.. |
© 2025 by the authors. Licensee MDPI, Basel, Switzerland. This article is an open access article distributed under the terms and conditions of the Creative Commons Attribution (CC BY) license (http://creativecommons.org/licenses/by/4.0/).
Copyright: This open access article is published under a Creative Commons CC BY 4.0 license, which permit the free download, distribution, and reuse, provided that the author and preprint are cited in any reuse.


