
Submitted:
18 June 2025
Posted:
20 June 2025
You are already at the latest version
Abstract
A series of linear isocyanate-free polyurethanes (NIPUs) were obtained by aminolysis of erythritol dicarbonate (EDC) with polyethers (diamino-PEG, diamino-PPO and diamino-PEG/PPO) and 1,12-diaminododecane (DADD), which acts as a chain extender to form hard segments. The obtained NIPUs contained different concentrations of DADD relative to the polyether (72.5–80 wt%). Detailed chemical structure analysis of synthesized NIPU was performed using a combination of FTIR and 1H NMR. FTIR spectra confirmed that the EDC-DADD segments formed a network of hydrogen bonds. This is reflected in WAXD diffractograms showing ordered crystalline domains originating in DADD. The reflections assigned to the DADD segments exhibited changes in their position and intensity with decreasing concentration, indicating an increase in interplanar spacing and a loss of higher-order order. WAXD also showed that the soft segments of PEG and PEG/PPO retain their ordered crystal structure regardless of the DADD content. At a larger length scale, SAXS revealed similar micromorphology for the different polyethers, with a broad peak indicating long-range order in the DADD-rich segments and a weak separation of the soft and hard phases. DSC analyses confirmed the complex phase behavior, where the PEG-based materials showed melting of crystalline fragments and the amorphous PPO showed a glass transition. DMA indicated the stability of the glass transition temperature in the PPO samples and the presence of an unusual structural transition. The results emphasize the influence of the type of poly(ether) on the thermal and microphase properties of the studied non-isocyanate polyurethanes.
Keywords:
dicarbonate erythritol
; polyhydroxyurethane
; segmented non-isocyanate polyurethane
; structure
; phase separation
1. Introduction
Polyurethanes are an important class of polymers, widely used due to their versatility - they come in various forms, such as foams, elastomers, adhesives, sealants or coatings, which allows for their broad use in many industries, including the biomedical, automotive and construction sectors [1,2]. The vast possibilities of modifying polyurethanes’ properties by selecting appropriate raw materials with different structures and functionalities make it possible to design macromolecular materials for various applications. [3]. Conventional polyurethanes are produced according to the method developed by Bayer before the outbreak of World War II, from polyols and isocyanates [4]. However, one of the main challenges related to the safety and synthesis of these materials is the toxic nature of isocyanates. The harmful effects of isocyanates, as well as their precursor - phosgene, on human health and the environment, have led to the introduction of regulations restricting their use. Therefore, the search for alternatives that would be safer and more environmentally friendly has become one of the main directions of development of the polyurethane industry [5,6].
A viable option is synthesis of isocyanate-free polyurethanes (NIPU), which do not require the use of toxic diisocyanates [7,8].
Moreover, replacing isocyanates in the synthesis of NIPU makes the reaction mixture less sensitive to moisture, unlike traditional polyurethanes, where the reaction of isocyanates with water leads to the formation of amine groups and carbon dioxide [9]. On the downside, isocyanate-free polyurethanes are characterized by a longer polymerization time, which makes their production a slower and more time-consuming process [8].
Currently, one of the most promising method to synthesize isocyanate-free polyurethanes (NIPU) is aminolysis of cyclic carbonates [10,11,12]. This approach closely resembles the conventional method of polyurethane synthesis [13], while avoiding the use of harmful isocyanates at all stages [8,14]. Cyclic carbonates are nontoxic and moisture-insensitive, eliminating the need for special storage conditions [15]. Moreover, the aminolysis process does not produce volatile organic compounds or byproducts requiring separation. The resulting polyhydroxyurethanes (PHUs) are characterized by the simultaneous formation of urethane and hydroxyl groups, primarily secondary hydroxyls, upon ring-opening of cyclic carbonates [16]. The ratio of primary to secondary hydroxyl groups depends on the solvent and the chemical structure of both amines and cyclic carbonates [16,17,18].
The presence of hydroxyl groups adjacent to urethane bonds significantly affects the thermomechanical properties of PHUs [19,20,21], often distinguishing them from conventional polyurethanes [22,23]. Specifically, hydroxyl groups disrupt hydrogen bonding within rigid segments and enhance compatibility between rigid and flexible segments, especially in polyether-based PHUs. This increased miscibility, while improving homogeneity, can suppress microphase separation—a critical factor in tuning material performance—and thereby diminish mechanical strength and thermal stability [19].
Thus, the composition and structural nature of the rigid and flexible segments play a pivotal role in determining whether phase separation and ordered microstructures can be achieved in NIPUs. The flexible segments influence chain mobility and interphase interactions, while the rigidity and polarity of hard segments, and their ability to form hydrogen bonds, determine the extent of phase segregation and internal cohesion.
Hydroxyl groups also contribute to the formation of intra- and inter-molecular hydrogen bonds, increasing the chemical resistance of PHUs compared to conventional PUs [8,24,25]. However, these same groups hinder crystallization, rendering PHUs predominantly amorphous or only semi-crystalline with limited capacity for microphase separation [8,23,27]. Additionally, they increase water absorption, leading to material plasticization and reduced stiffness [24].
Recent studies by Torkelson and collaborators [19,28,29] underscore the critical influence of segmental architecture on the final properties of segmented PHUs. In these hybrid materials, the use of flexible polyether segments such as polyethylene oxide (PEO) facilitated strong hydrogen bonding between ether oxygen atoms in the soft segments and hydroxyls in the hard segments - this resulted in significant phase mixing. Conversely, the introduction of flexible segments like polypropylene glycol (PPG), with bulkier structures and less accessible ether oxygens, hindered hydrogen bond formation, thus promoting phase separation. PHUs containing polytetramethylene oxide (PTMO) segments demonstrated an intermediate behavior, showing partial suppression of hydrogen bonding and enabling controlled microphase organization [29]. These findings clearly indicate that precise control over both the type and the ratio of soft and hard segments is essential for tuning the morphology and performance of PHUs [21].
The low reactivity of many multifunctional carbonates—such as those derived from biopolyols, epoxidized terpenes, or vegetable oils—necessitates the use of catalysts like triethylamine, DABCO, DBU, TBD, and thioureas in PHU synthesis [30,32]. The purpose of their use is to increase the rate of reaction and enable processes to be carried out under milder conditions. Among these, TBD stands out due to its high catalytic efficiency [33,34]. Nevertheless, even with catalysts, the solution polyaddition method requires elevated temperatures and prolonged reaction times [35,36,37,38,39,40,41]. As noted by Besse et al. [42,43,44], the extended polymerization time can promote side reactions, making precise stoichiometric control difficult and thereby limiting the achievable molar mass of the final polymer. Moreover, the presence of a catalyst may in some cases lead to undesirable effects, such as degradation or change of the product microstructure.
A sustainable route for synthesizing five-membered dicarbonates involves the carbonation of sugar-derived tetraols. A key example is erythritol dicarbonate (EDC), derived from optically active meso-erythritol, which benefits from an inductive effect that enhances its reactivity relative to other carbonates [45,46]. Due to this increased reactivity, the synthesis of NIPU with the participation of EDC can be carried out without a catalyst, which simplifies the process and reduces the risk of undesirable side reactions. Studies of EDC aminolysis in DMSO at room temperature reveal that the reaction rate and regioselectivity are heavily influenced by stereochemistry. The resulting hydroxyurethanes predominantly contain secondary hydroxyl groups (about 85%) [47,48], further emphasizing the importance of segmental composition and functionality in determining hydrogen bonding patterns, phase behavior, and thus various material properties.
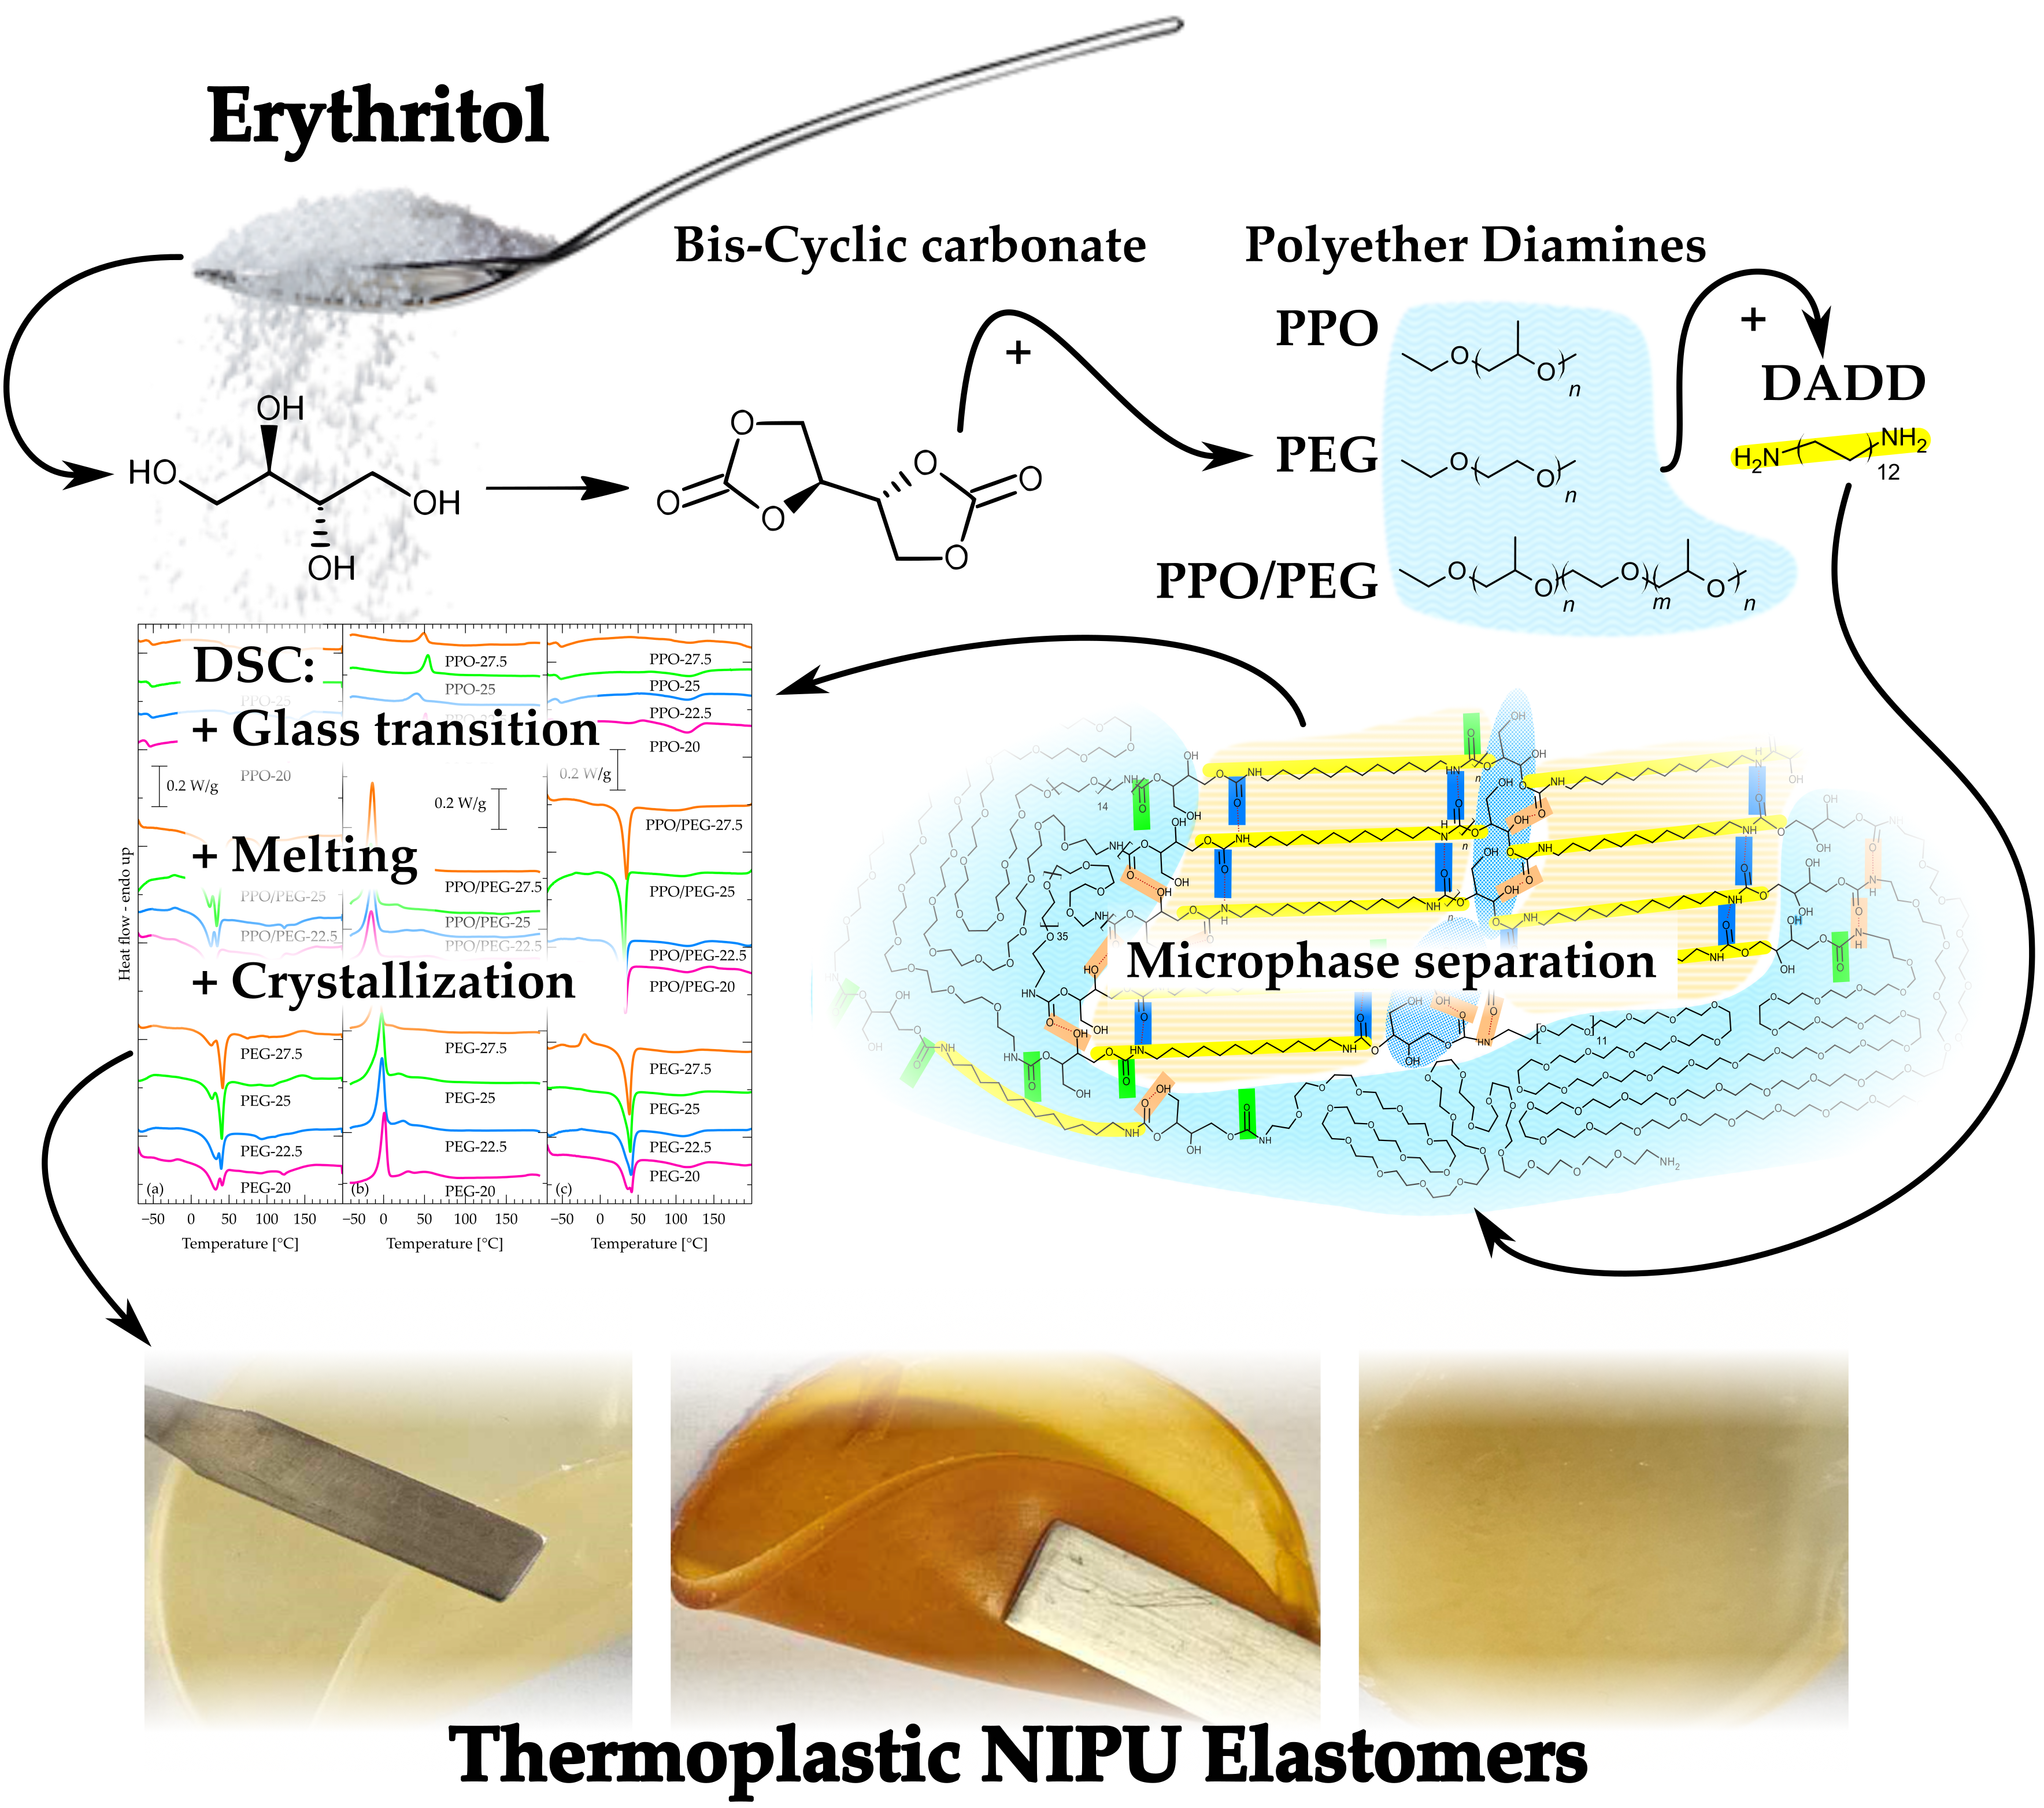
Hence, in this work, we synthesized NIPU using erythritol dicarbonate, three kinds of polyether (PEG, PPO or PPO/PEG) and 1,12-diaminododecane (DADD) in different ratios of flexible segment (i.e. polyether) to rigid segment (1,12-diaminododecane). The selection of these three polyethers was made to investigate the influence of the structure and properties of soft segments on phase separation. PEG (polyethylene glycol) is a linear, highly hydrophilic polyether, while PPO (polypropylene glycol) is characterized by higher hydrophobicity and lower crystallinity. The third polyether, designated as PPO/PEG, is actually a triblock copolymer from the poloxamer family, containing PPO blocks in the core and PEG at the chain ends. It was chosen due to its amphiphilic nature and potential self-assembly ability, which makes it an interesting material for studying the influence of soft segment architecture on copolymer morphology. The use of 1,12-diaminododecane (DADD) as a rigid segment was motivated by its well-defined, aliphatic structure, which can promote the ordering of hard segments and thus enhance phase separation.
The specific aim of this work was to investigate the influence of the most crystalline of short diamines, 1,12-diaminododecane, on phase separation. The phase separation behavior of EDC-derived NIPU segmented copolymers with polyethers and DADD has not been investigated or reported yet. The present study shows that the choice of a rigid segment can significantly tune the phase separation state in segmented PHUs.
2. Results and Discussion
Linear polyhydroxyurethanes were obtained in the reaction of difunctional cyclic erythritol dicarbonate with amine components, which were: polyethers (diamino-PEG, diamino-PPO or diamino-PPO/PEG) and a shorter amine - 1,12-diaminododecane. The details of the synthesis are given in Section 4 and presented in Scheme 1.
Erythritol dicarbonate (EDC) reacts with a mixture of two amines in equimolar amounts to EDC dicarbonate (1:1). In the first step, EDC reacts with the selected polyether, and then in the second step, 1,12-diaminododecane (DADD) is added to the system to form a linear system. The mass fractions of polyether: DADD are shown in Table 2. The samples will be denoted as: EDC-<polyether>-<mass fraction of the polyether in the amine component in wt%>, e.g. EDC-PEG-27.5.
All polyethers used in the course of this study had a molecular weight of approximately 2000 Da, whereas Jeffamine@ED2003 is characterized by a triblock structure with 39 repeating units in the central m block and a total of 6 repeating units in the n and l blocks, resulting in a predominantly PEG-based backbone. The introduction of the selected polyether with a higher molecular weight to the reaction resulted in the possibility to complete the reaction before the introduction of the shorter DADD acting as a chain extender. It should be emphasized that no catalyst was used in the synthesis of NIPU, since the reactivity of erythritol dicarbonate is high.
2.1. FT-IR
Figure 1 shows the ATR-FTIR spectra of all obtained materials. The band corresponding to the residual cyclic carbonate (ca. 1800 cm⁻¹ [19]) shows negligible intensity, which indicates a high degree of conversion and a high molar mass exceeding the entanglement limit. The obtained spectra qualitatively correspond to those reported for systems synthesized in a similar way [49].
The bands at 3300 and 3315 cm-1 are assigned to hydrogen bond stretching vibrations of OH and NH groups, respectively. Mishra et al. [50] described three types of NH stretching vibrations in segmented polyurethanes at 3499, 3352 and 3306 cm-1. They are assigned to:
- free NH groups,
- NH groups that are connected to carbonyl in hard segments – type I
- NH groups that are connected to ether oxygen in soft segments – type II.
In our work, all obtained NIPUs showed a sharp band at about 3340 cm-1, which suggests that NH groups participate in type I hydrogen bonding. The second region that was considered is the location of absorption bands at 1680–1720 cm-1 originating from the formation of carbonyls in polyurethanes. Various studies explore the influence of hydrogen bonding on the C═O resonance frequencies in phase-separated PU systems, [21,51], and the carbonyl band often consists of two components: free C=O (not hydrogen-bonded): ~1720 cm⁻1 and hydrogen-bonded C=O: ~1680–1700 cm⁻1. The ratio of the band area of bound to free carbonyls can be used as an indicator of the degree of hard segment ordering – and thus the degree of phase separation. Shifts in this band indicate the strength and number of hydrogen bonds (stronger bonds cause a shift toward lower wave numbers). The region associated with the stretching vibrations of urethane carbonyls (1680–1700 cm-1) appears to consist of two strongly overlapping components, roughly centered around 1712 cm-1, and 1684 cm-1 (Figure 2). These two signals are routinely observed in polyurethanes [52], as well as in polyamides [53]. The component with the highest wavenumber – 1712 cm-1 – is assigned to carbonyls without hydrogen bonds. The component at a lower wavenumber – 1684 cm-1 – corresponds to the occurrence of carbonyls hydrogen-bonded in a disordered manner. Deconvolution of this region (Figure 2) was performed using the functions proposed by Stancik [54], which describe macromolecules well. The proposed model shows, that there is another component in the form of a rather sharp band at about 1688 cm-1 with the lowest intensity. We can attribute it to the presence of hard segments that create ordered crystal domains. Such approach was used previously in classical polyurethanes [55]. Scheme 2 shows a simplified illustration of the microphase-separated structure of the NIPU system, indicating the spatial distribution of various hydrogen-bonded and free carbonyl domains. This diagram shows the correspondence between the hard and soft segment distribution and the type of hydrogen bonds observed in the FTIR spectra. A distinction is visible between free carbonyls (1712 cm⁻¹), randomly hydrogen-bonded carbonyls (1684 cm⁻¹) and those in ordered crystalline segments (1688 cm⁻¹). The presence of these segments correlates with the occurrence of the band at 3340 cm-1, assigned to NH groups that are connected to carbonyl in the hard segments.
It is observed that the change of the polyether:DADD ratio does not cause significant changes in the surface area of this component (at 1688 cm-1) – Figure 2b. This may be due to subtle changes in the mass ratios. The change of the PPO:DADD ratio does not cause significant changes in the components at 1712 and 1684 cm-1, while in the case of the change of the PEG:DADD and PEG/PPO:DADD ratios, a decrease in the surface area of both components is observed first, and for the highest ratios an increase in non-hydrogen-bonded carbonyls occurred.
2.2. 1H NMR
1H NMR was performed to confirm the chemical structure of obtained polymers and to elucidate the detailed structural features of the polymer backbone and the end groups. The spectra of each material are combined at Figure 3. Spectra were recorded in DMSO-d₆ to preserve and resolve exchangeable NH and OH protons. Various polymer formulations—based on biscyclic erythritol dicarbonate (EDC) and different diamines (DADD, PEG-diamine, PPO/PEG-based copolymer, and PPO-diamine) were analyzed.
To enhance readability across a broad dynamic range of signal intensities, each spectrum was plotted twice: the true-intensity trace is shown as a dotted line (used for integration), and a 10-fold amplified overlay is shown as a solid line, allowing detection of low-intensity signals such as NH and OH protons [48,56]. This dual plotting reveals subtle features that would otherwise be masked by dominant methylene signals.
Each proton environment is labeled with lowercase letters (a–t) in the chemical structure above the spectra and assigned to corresponding signals using dashed vertical guide lines. The signal assignments confirm the expected PHU structure and allow differentiation of backbone units, end groups, and regioisomeric ring-opening products. Notably:
- Methyl groups from PPO (a) appear at δ 0.85–0.95 ppm as a doublet, broadened in mixed PEG-PPO systems.
- Internal aliphatic CH₂ groups (b) from DADD are seen as broad multiplets at δ 1.2–1.5 ppm, while β-methylene groups (c) are slightly downfield (δ ~1.6–2.0 ppm) due to proximity to urethane and ether linkages.
- Terminal NH₂ and adjacent CH₂ signals (d, e) are visible in some spectra as low-intensity features, indicating slight chain-end functionality.
- Methylene groups adjacent to NH (f, g) in DADD and PEO segments appear at δ ~2.9–3.1 ppm.
- PPO methine and ether CH₂ (h, i) resonate at δ ~3.3–3.4 ppm and δ ~3.5–3.7 ppm, respectively, forming part of the PEO/PPO backbone.
- CHOH-associated CH₂ and CH protons (j, m, o) appear from δ 4.0 to 4.7 ppm, with signal complexity reflecting regioisomeric ring opening.
- Secondary OH groups (p) show broad signals at δ 4.8–5.0 ppm, and a distinct multiplet at δ ~5.02 ppm (pH) is attributed to hydrogen-bonded CH–OH. The peak pH may be due to OH … O=C – the hydroxyl groups, bonded with urethane group and responsible for dividing FTIR band for urethanes, into 1684 cm-1 band.
- Notably, the CHOH–OH signal splitting varies with diamine structure: a triplet is observed when PPO is used (due to asymmetric, rigid environments near the urethane), while a doublet appears in PEG-containing systems where greater flexibility and symmetry may reduce additional coupling.
The presence of urethane NH groups (r, s, t) is confirmed by broad downfield signals at δ ~6.8–7.5 ppm, with minor chemical shift differences depending on whether DADD, PEG, or PPO-derived urethane segments are present.
This spectral analysis, particularly the observation of CHOH and OH signals in expected regions with the correct multiplicity, provides strong confirmation of successful ring-opening addition of amines to cyclic carbonates, resulting in a linear PHU with pendant primary and secondary hydroxyl groups.
2.3. WAXD
X-ray diffraction analysis (WAXD) was performed to investigate the effect of 1,12-diaminododecane (DADD) content on the structure of isocyanate-free polyurethanes (NIPU) - Figure 4.
DADD, as a linear aliphatic diamine, is incorporated into the hard segments and significantly affects their organization. WAXD results showed that the diffraction reflections from PEG soft segments and from PEG/PPO (~19° and ~23° 2θ) [57] remain unchanged regardless of the amount of DADD introduced. This means that PEG and PEG/PPO maintain their ordered, crystalline structure and are not disturbed by the presence of hard segments. In the case of PPO-based segments, typically amorphous, no distinct reflections were observed, which confirms their non-crystalline nature. In contrast, the reflections associated with DADD segments change significantly with the increase of their fraction in the material. The main diffraction peak is shifted towards lower values of the 2θ angle, which indicates an increase in the interfacial distance and suggests a more loosely packed arrangement of these segments. At the same time, the second diffraction reflection (observed in pure DADD) disappears, which may indicate the loss of higher-order order. The lack of changes in the position of the PEG and PEG/PPO reflections with simultaneous shift and disappearance of the signals associated with DADD confirms that the changes in the structure concern only the hard segments. In the NIPU spectra based on PEG and PEG/PPO, a reflection appears at an angle of ~20°, and for PPO (~20° and 22.7°) originating from EDC-DADD segments, the intensity of which decreases with the increase of the soft segments. These observations lead to the conclusion that DADD forms rigid, partially ordered domains, the spatial organization of which decreases with the increased content of this diamine, which is consistent with the mechanism of microphase separation of hard and soft segments in NIPU. The obtained results are consistent with previous reports on the behavior of polyurethanes based on PEG and aliphatic segments. It has been emphasized in the literature that PEG forms stable crystalline domains resistant to the influence of hard segment modifications, and long aliphatic diamines such as DADD can form partially ordered structures, the order of which depends on the conditions of synthesis and concentration [19,58].
2.4. SAXS
The SAXS curves (Figure 5) are very similar to each other indicating very similar micromorphology between the three polyethers. This is somewhat unexpected taking into account that samples containing PEG chains contain crystalline structures as shown by DSC (Section 2.5) and WAXD (Section 2.3). Such regions however do not give rise to new features in the length scale accessible by the experiment. This should be attributed to small contrast between amorphous and crystalline domains as compared to that between DADD and polyether segments.
The curves have two main features. On the low q side, a prominent drop of the signal starts at the 0.04 - 0.05 Å-1 region. For the PPO-based sample, a very weak upturn is observed before the drop. This should be attributed to a weak phase separation between DADD rich regions and polyether rich ones. It is worth noting that in conventional segmental polyurethanes, well-defined peaks related to microphase separation occur in this q range [59,60,61,62,63,64].
At 0.3 Å-1 a relatively broad peak is observed for all materials under investigation. This is indicative of strong ordering with periodicity in the order of a few nm, at a length scale much smaller than that of the microphase separation, i.e. within one of the domains. Its location is seemingly the same for all materials, which points to its attribution to ordering within DADD rich domains, presumably the distance between urethane units, possibly coordinated with each other with hydrogen bonds.
In order to draw more quantitative results, we fitted model functions to the curves. The drop on the low q side was modelled adequately with a Teubner-Strey function, typically used for weakly phase separated systems [65,66,67].
Where , and . In this model is a scale parameter, is a correlation length, and is a measure of the periodicity of the phase separation related to the domain size.
The peak around 0.3 Å-1 was modelled with a Lorentz peak function [68].
Where is a scale parameter, is a correlation length and with being the characteristic distance between scatterers. As a background, a constant term was used, along with a power law to account for an upturn at high values.
Results of the fitting are collcted in Table 1.
The dL values (periodicity) of the low length scale order, at this point attributed to the ordering of the hydroxyurethane segments in DADD-rich segments, confirms the observation that it is the same for all three samples. The correlation length parameter of the Lorentz peak is also similar between the samples and somewhat smaller than the periodicity, indicating that the order is very localized, i.e. does not extend beyond a few units.
Turning our attention to the feature at low q values, also here, the correlation length parameter ξTS is smaller than the repeat distance, indicating a very weak and not well periodic phase separation. The length scale of the phase separation dTS shows very little variation with the type of polyether. However, it seems that the PPO based material forms smaller structures than the PEG based one, and their copolymer forms structures of intermediate periodicity. The reason for this observation is not clear at this point, but it should be sought in the complex correlation between the molar mass of the polyethers, the packing of their segments, and the amount of hard segments diluted in the soft phase. The ratio of correlation length to periodicity parameters is higher for the PPO-based material, possibly indicating better microphase separation – higher incompatibility between PPO and DADD-rich segments as compared to PEG. This is compatible also with the fact that the upturn before the drop of the signal is more visible for the PPO-based material.
2.5. DSC
The DSC profiles indicate that the materials have a quite complex phase behavior.
Starting from the first heating run (Figure 6a), the PEG and PPO/PEG based materials show a strong, sharp, and complex endothermic peak around 40 °C, which correspond to the melting of crystalline regions originating from the relatively long PEG segments [69]. The melting is followed at higher temperature by a series of thermal events, presumably corresponding to gradual disordering of the ordered structures observed by SAXS (Section 2.4) and WAXD (Section 2.3). Similar behavior is observed for the PPO based materials, however no sharp melting endotherm is observed due to the amorphous nature of the polyether. Instead, a glass transition step is observed around −60 °C. This should be attributed to the amorphous PPO segments. The fact that it is observed at somewhat higher temperature than that of the pure polyether (around −70 °C [70]) indicates that it is mixed to some extent with the more rigid hydroxyurethane/DADD rich segments. The fact that it does not show a dependence with composition, indicates that in this composition range, the amount of diluted hydroxyurethane/DADD rich segments in the soft phase is constant.
Proceeding to the cooling curves of PPO based materials, well-defined single exothermic peaks emerge in the range of 20 – 60 °C. Given that PPO is an amorphous polymer, this peak should be attributed to ordering of DADD-rich segments as argued in SAXS and WAXD results. This is another strong indication of weak, yet existent, thermoplasticity of the materials. Similar peaks appear in the same region also for the materials based on the other two polyethers, but for them, the peaks are double, much broader, and at slightly lower temperatures (higher supercoolings). This correlates well with the indications from SAXS that phase separation is stronger for the PPO based materials, due to higher incompatibility between the hydrophilic hydroxy-urethane- and DADD-rich segments and the hydrophobic PPO.
It is also interesting to note that the intensity, temperature, and width of the ordering exotherms does not follow well-defined trends with the fraction of the polyethers in the materials. This indicates a complex dependence of ordering dynamics on the composition. At this point we would like to refrain from speculations regarding the nature of ordering and thus the mechanisms driving it. In order to provide more concrete discussion on the matter, a combination of static and dynamic DSC and temperature resolved SAXS experiments should be conducted following the methodology followed in the seminal works of Koberstein in the 1980s-90s for conventional polyurethanes [58,59,60,71,72,73,74,75].
PEG and PPO/PEG samples exhibit yet another much stronger and sharper ordering endotherm in the region 0 to −20 °C. This should be attributed to crystallization of the relatively long PEG units. The crystallization needs some more supercooling as compared to the pristine polyether [68]. This peak also does not show well defined trends with composition. The mechanism behind this observation is also not trivial to understand as it is intimately connected to the microphase separation development and simultaneous emergence of polyether-rich regions [76].
We now turn our attention to the second heating curves. The shallow and broad endothermic peak is observed around 130 – 140 °C. This should be attributed to disordering of the hydroxyurethane/DADD-rich domains which had formed order during cooling. Two indications for this attribution of the peak is that it occurs at temperatures well above the ordering and that its location is sensitive neither to composition, nor to the kind of the polyether in the system. In addition, although quantification is challenging due to the width of the peaks, we can state that for materials with low polyether-high DADD content, the peaks are better discerned and this is another strong indication that they originate from the urethane/DADD rich domains.
The sharper peaks around the 20 – 30 °C are related to the melting of crystalline PEG regions. A detailed account of these procedures is not within scope of this work, however, the complex interplay of PEG crystallinity and phase separation is worth studying in future work.
On the low temperature side, for the PPO based materials, the glass transition step, observed also during the first heating, is visible around −60 °C.
The PEG-containing materials are strongly crystalline as we have already observed. Hence, no well-discernible glass transition steps are visible. This should be related either to the small amount of amorphous polyether segments reducing the intensity of the phenomenon, or to extreme broadening of the effect due to the heterogeneity. Nevertheless, for one material (EDC-PEG_27.5), exhibiting also cold crystallization, a step is visible around -45 °C. Glass transition temperature of PEG is known to vary strongly with crystallinity and therefore we would like to refrain from any comments regarding this particular value [77,78].
2.6. DMA
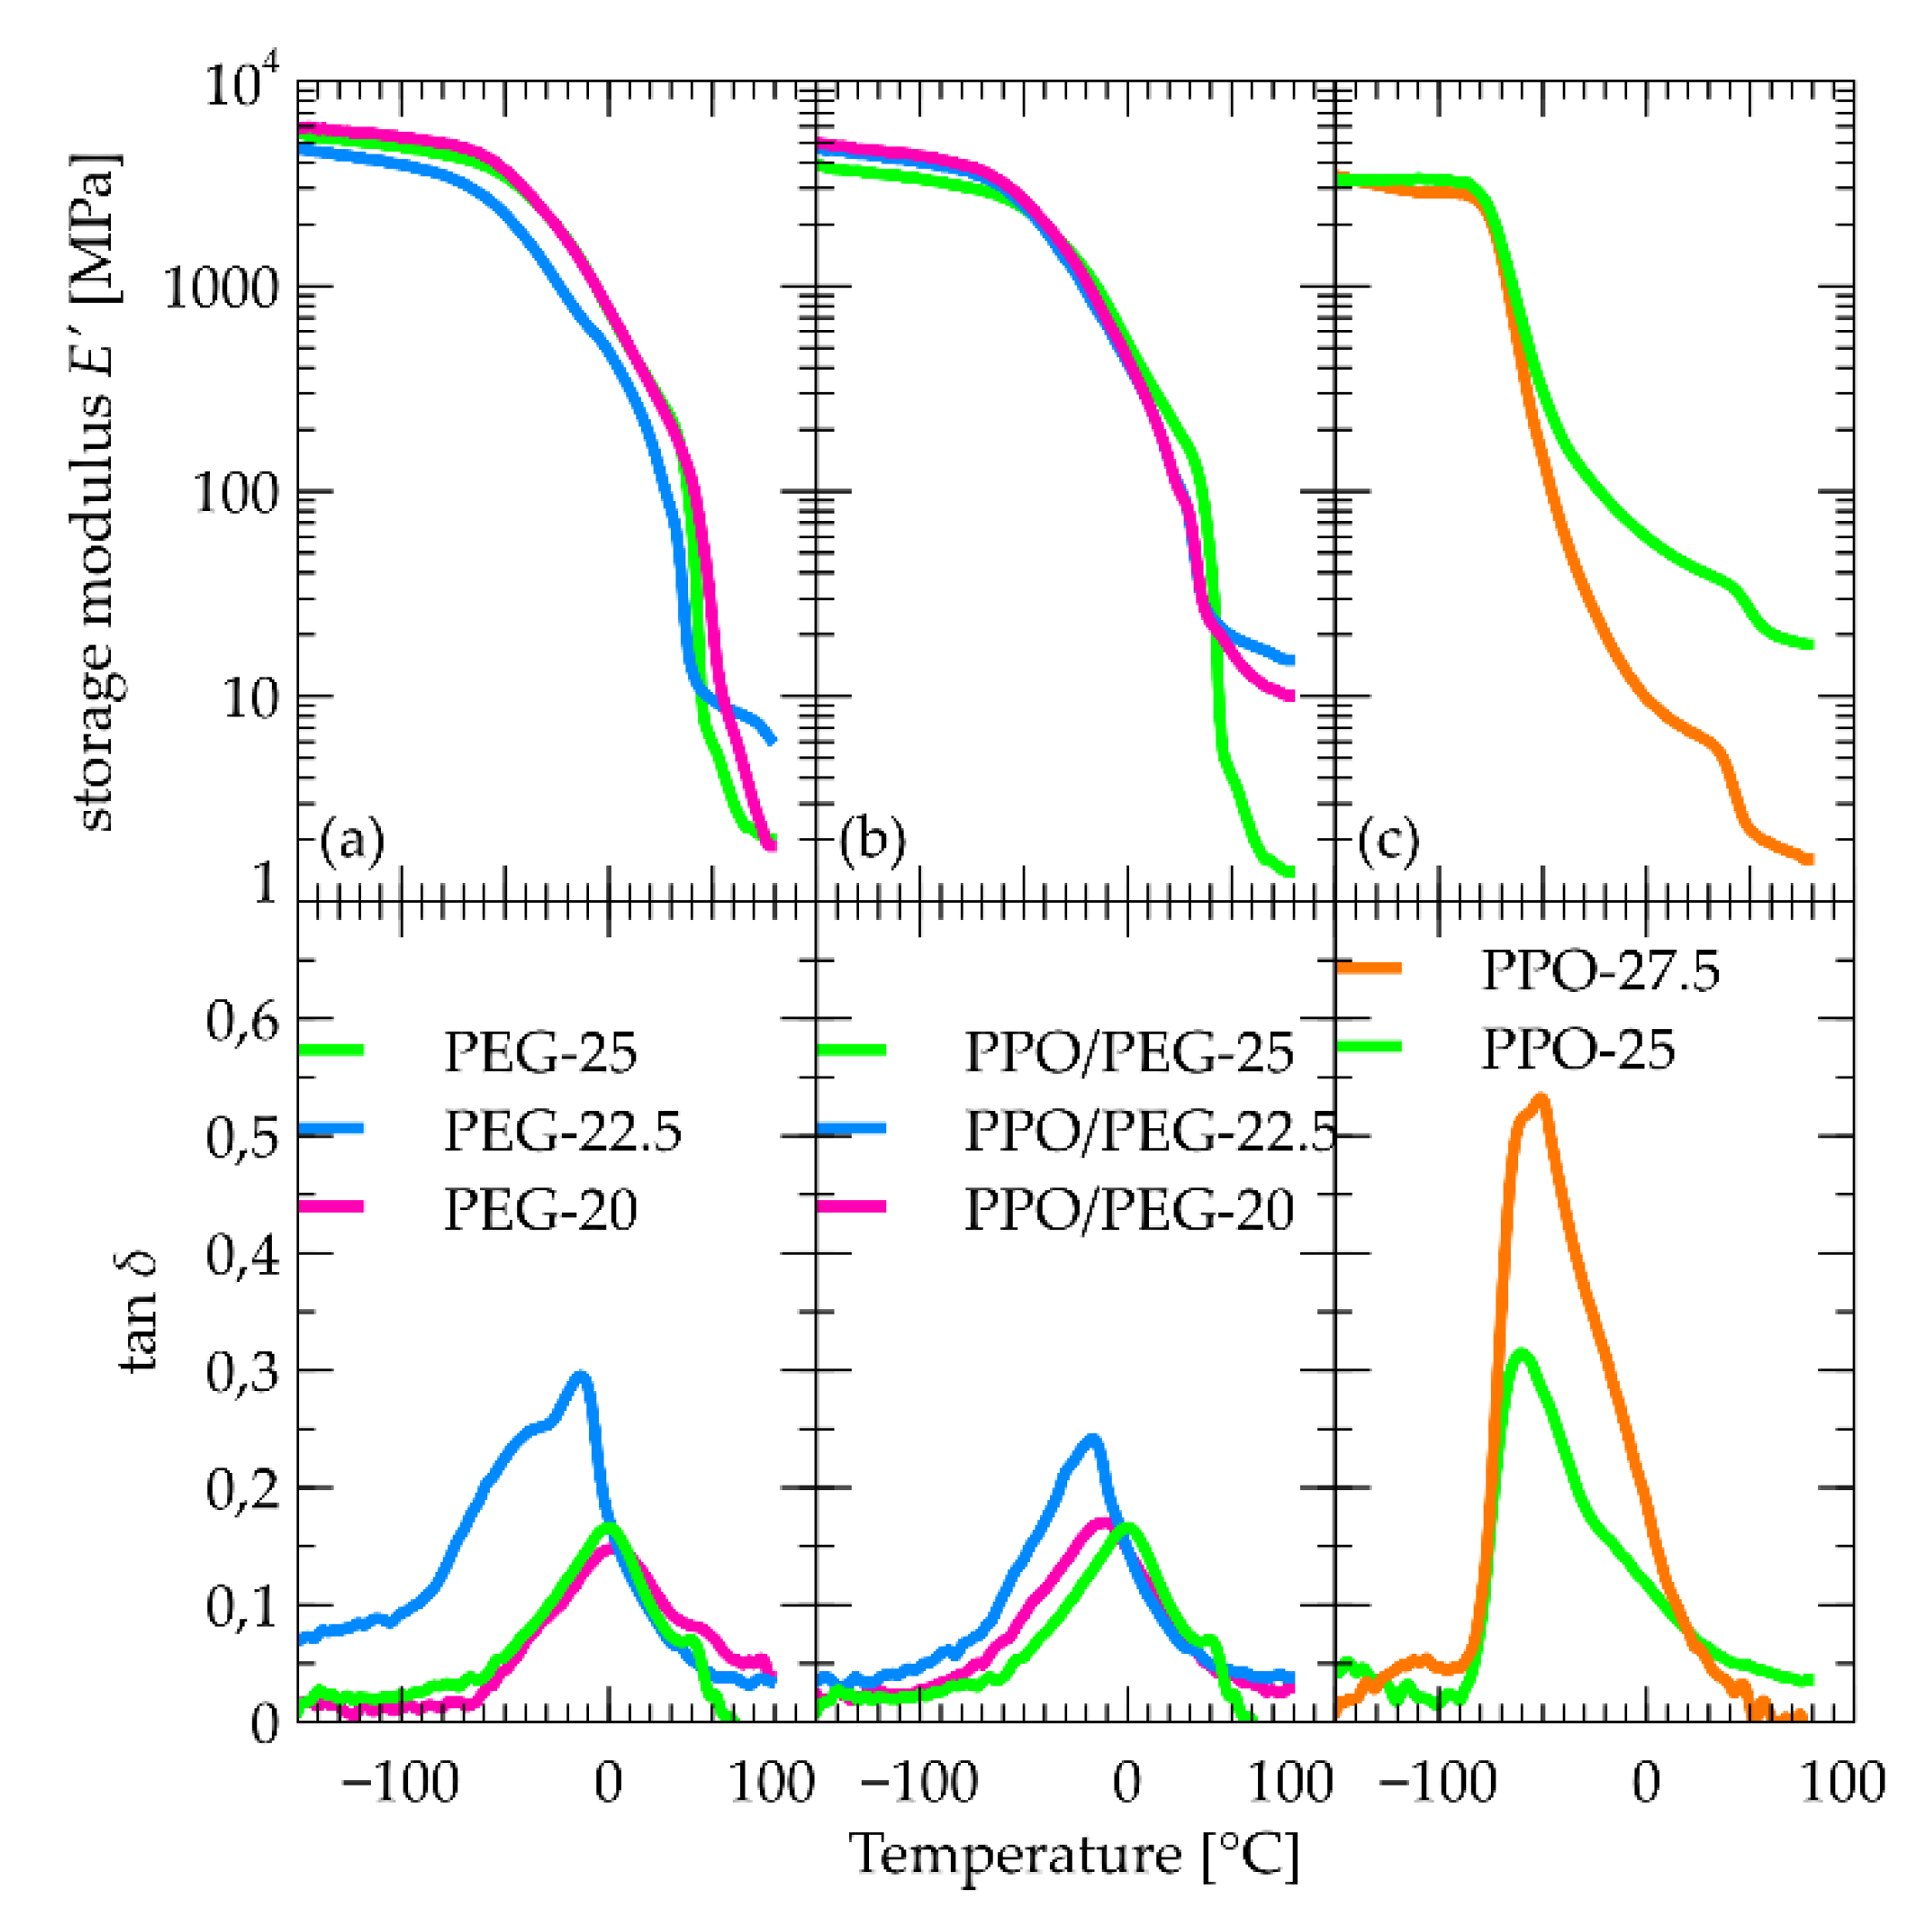
Starting from the PPO-based materials (Figure 7c), the basic feature of the DMA curves is a step in E’ accompanied by a complex peak in tan δ. This is attributed to the α relaxation associated with the dynamic glass transition. Its temperature corresponds well with the calorimetric glass transition temperature as observed by DSC, and confirms the stability with PPO content observed by DSC.
At higher temperatures another sharp step occurs around 40 °C. This step is not accompanied by a peak in tanδ so it cannot be attributed to relaxation, but rather to a structural change or a phase transition. Interestingly, however, nothing is visible in this region in DSC experiments. We should then assume an athermal transition. This is compatible with effects of transcarbamoylation [79], which is an interesting point to follow in future work. Finally, we would like to note that while composition does not affect significantly the glassy modulus, the rubbery one drops by an order of magnitude when PPO content rises from 25 to 27.5% indicating that it is the hydroxyurethane/DADD domains that provide the mechanical integrity of the materials.
For the PEG containing materials (Figure 7a), the E’ step is much broader and complex, and is accompanied by tan δ peaks, presumably associated with the α relaxation. They occur at much higher temperatures as compared to the PPO materials and show a non-monotonic dependence with composition. This should be associated with slowing down of mobility due to effects of crystallinity, which is also irregular with composition. Also here, a drop of E’ is observed around 40 °C, which however in this case can be easily attributed to melting of PEG segments.
4. Materials and Methods
4.1. Materials
The following materials were used: (2R,3S)-butano-1,2,3,4-tetraol meso-erythritol (Wish Pharma, Poland), dimethyl carbonate (Sigma-Aldrich), 1,5,7-triazabicyclo[4.4.0]dec-5-ene (TBD), dimethyl sulfoxide, poly(ether amine): polyethylene glycol diamine (Mn = 2019 Da) from Specific Polymers (France), Jeffamine@ ED2003 (PPO:PEG:PPO= 3:39:3, Mn = 2288 Da), Jeffamine@ D2000 (PPO, Mn = 2144 Da) acquired from Huntsman, USA.
4.2. Synthesis of Erythritol Di(carbonate)
The five-membered di(cyclic carbonate) was synthesized through the transcarbonation reaction - Scheme 3- starting from meso-erythritol according to the modification of procedure described by Dannecker and Meier [80].
In a 100 ml flask, erythritol (2 g, 16.4 mmol) and TBD (114 mg, 0.820 mmol) were dispersed in DMC and heated to 60°C for 40 min until complete dissolution at the rotary evaporator. Then the temperature was lowered to 40°C and the reaction continued at 320 mbar. After 30 min, a white precipitate erythritol di(carbonate) (EDC) was formed. The product was filtered off after the mixture was cooled down to room temperature and washed with water yielding a white powder with a melting point of 169 °C (lit.: 168−170 °C) [48].
FTIR (ATR): ν = 1806, 1777, 1544, 1472, 1377, 1297, 1203, 1144, 1064, 1028, 977, 897, 773, 744, 715, 533 cm−1.
1H-NMR (DMSO-d6, 500 MHz): δ (ppm) = 5.16–5.09 (m, 2 H, CH), 4.59–4.54 (m, 2H, CH2, diastereotopic signals), 4.38–4.35 (m, 2H, CH2, diastereotopic signals);
13C-NMR (DMSO-d6, 500 MHz): δ (ppm) = 155.7 (CO), 75.6 (CH), 65.8 (–CH2-)
4.3. General Procedure for Synthesis of Non-Isocyanate Polyurethanes (NIPUs)
EDC in DMSO (1mol/L) was added to a 50 ml round flask and heated to 80oC to dissolve EDC. Then, the appropriate polyamines were added: PPO, PPO/PEG or PEG. The stoichiometry of EDC to amine (polyether and DADD) was maintained at a 1:1 molar ratio for all NIPU compositions. The reactions were carried out at 80 oC for approx. 48h and their progress was monitored by FTIR spectroscopy. The lack of changes in the intensity of the bands originating from the decaying vibrations of the carbonyl group of the cyclic carbonate in favor of the emerging band originating from the vibrations of the carbonyl group of the formed urethane bond of PHU determined the addition of a low-molecular-weight amine, i.e. 1,12-diaminododecane (DADD) (approx. 74h). After the DADD reaction, the viscous liquid with a slightly yellow or slightly orange color was poured into a polypropylene mold and placed in an oven at 100 °C (72 h) to complete the reaction between the carbonate and amine groups and evaporate the solvent. A series of NIPUs was obtained based on the variable molar ratio of polyether: DADD according to the protocol showed in Table 2.
4.4. Methods
4.4.1. Fourier-Transform Infrared Spectroscopy (FT-IR)
FTIR was applied to track the reaction progress by a Thermo Scientific Nicolet iS5 spectrometer equipped with a diamond crystal in attenuated total reflectance unit manufactured by Thermo Electron Corporation. FTIR analysis was conducted in the wavenumber range 4000 – 400 cm-1, with a scanning resolution of 4 cm-1. Deconvolution of carbonyl band was done in a program Grafity Labs with three functions proposed by Stancik and Brauns [54], which are the classical Gaussian functions:
with additional asymmetric component:
Equation (1) is a Gaussian function with area A, centered at frequency υ. Asymmetry is introduced by substituting its full-width-at-half-maximum parameter with a well behaved sigmoidal function (2). The asymmetry is expressed by the parameter γ. When = 0 the Eq 1 reduces to a simple Gaussian function.
4.4.2. Nuclear Magnetic Resonance (NMR)
NMR spectra were recorded with an FT-NMR 500 MHz spectrometer (JEOL JNM-ECZR500 RS1, ECZR version). The measurement temperature was 21 °C with pulse width of 3.4 µs, 2 s of relaxation, and 1.6 s of acquisition of 3072 scans. DMSO-d6 was used as a solvent and the spectra shift was referenced on their characteristic shift.
4.4.3. Differential Scanning Calorimetry (DSC)
DSC curves were recorded with a Mettler Toledo 823 calorimeter purged with argon and calibrated with indium. Samples of approximately 8 mg were placed in standard aluminum pans with a pierced lid. The samples were cooled to −80 oC and heated up to 190 °C at 10 K/min, to detect morphological changes that would indicate ordering in the as-synthesized materials. Subsequently, a cooling-heating run in the same range and at the same rate was conducted to detect reordering effects.
4.4.4. Wide Angle X-Ray Diffraction (WAXD)
The D2 PHASER apparatus from Bruker was used for the X-ray investigations. The analysis was performed with the following parameters: the range of the 2θ angle was 3-40 °, the size of the slit on the lamp was 0.6 mm, and the aperture was 1 mm. The counting time was 0.5 °/min with a step of 0.020 °.
4.4.5. Small Angle X-Ray Scattering (SAXS)
The materials containing 25% of the polyether were selected for investigation with Small-angle x-ray scattering (SAXS). Curves were recorded with a SmartLab SE (Rigaku) X-ray setup with a (2D) Hypix 400 x-ray detector (Rigaku) and a 2.2 kW Cu Long Fine Focus anode lamp. Films of thickness approximately 0.8 mm were measured, in transmission mode, with a windowless holder. The nominal 2θ range was −0.005° to 10.0° at a step of 0.005° at a scanning speed of 0.017°min−1. The background was measured with an empty holder under the same conditions. The signal of the empty holder at high 2θ was considered as dark current and was subtracted from all measurements. The corrected signal of the holder was then subtracted from the signal of the sample, taking into account the absorption as follows:
In this equation, I denotes intensity, and indices s and h indicate sample and holder, respectively. Angle was converted to momentum transfer by q=4π/λ sinθ, with λ=1.5406 Å the wavelength of the source.
4.4.6. Dynamic Mechanical Analysis (DMA)
DMA measurements were conducted with a Netzsch 242C analyzer in tension mode. The specimens had approximate dimensions 12 x 5 x 0.5 mm. Measurements run up to 60 °C at 2 K/min with frequency 1Hz, in nitrogen atmosphere. The reason for the relatively low upper limit is that above those temperature the samples became too soft to measure. Some of the materials were not possible to measure even at low temperatures either due to poor integrity or due to brittleness.
5. Conclusions
NIPU elastomers were synthesized via cyclic carbonate aminolysis from erythritol dicarbonate hard segment, PEG- or PPO- or PPO/PEG-based soft segments, and DADD as chain extender. This formulation resulted in a phase separated morphology in a fashion very similar to that of conventional polyurethanes (PU). That is, a phase separated morphology, in probably two co-continuous phases: one rich in EDC-DADD hard segments, and a second one consisting mostly of polyether segments with some hard ones diluted in it. The hard domains are crystalline and also form a periodic structure of approx. 2 nm likely related to repeat distances between urethane groups. PEG and PPO/PEG retain their crystalline structure within the NIPUs. Albeit this microphase separation is rather weak as compared to that of conventional polyurethanes, this work shows the potential of NIPUs as a viable alternative.
NMR and FTIR spectra can be interpreted following the paradigm of conventional polyurethanes, showing the expected chemical structure and intersegmental hydrogen bonding. On the basis of NMR and FTIR results it is hypothesized that secondary OH from the hydroxy urethane group also takes part in hydrogen bonding in addition to the conventional hydrogen bonding in PUs.
DSC reveals that ordering in hard domains is lost during an order-disorder transition around 120 °C which is significantly lower than that of conventional polyurethanes presumably due to weaker hydrogen bonding. Reordering is possible during cooling at reasonable rates, indicating that the materials can be used as thermoplastics. PEO segments in both PEO and PPO/PEG materials are able to crystalize and melt at temperatures close to these of the pristine counterparts. Glass transition temperature of PPO rich domains is slightly higher than that of pure PPO, indicating the existence of hard segments diluted in this phase.
The materials have good mechanical integrity in a rather narrow DADD content range. With increasing DADD content, the rubbery modulus of the PPO based materials increases which shows that hard segments indeed provide mechanical integrity. However, in the PEO and PPO/PEG materials, it is the crystallinity of the PEG segments that controls mechanical properties.
In summary, it can be stated that the final properties of the tested NIPUs are the result of a balance between the crystallinity of the soft segments, the order and compatibility of the hard domains, and the ability for microphase separation. Maintaining the crystallinity of PEG and PEG/PPO, while modulating the structure of the DADD segments, allows the design of materials with diverse morphology and functionality. Based on the findings of Beniah et al. (2017) [29], where the use of PTMO soft segments was shown to suppress hydrogen bonding in segmented polyhydroxyurethanes, we propose a complementary strategy described in this work, involving the use of DADD as a relatively long chain extender. Since these two strategies affect hydrogen bonding via distinct structural mechanisms—soft segment flexibility versus chain extender length and crystallinity—they may act additively or even synergistically when used in combination. This may offer a new avenue for fine-tuning phase separation and related mechanical or thermal properties in NIPU-based materials. The combined effect of those two approaches is feasible because the use of DADD as a universal rigid segment allows the shaping of the domain order without disturbing the crystalline properties of the soft segments. This work therefore provides a solid basis for further design of NIPUs with controlled structure and predictable functional properties.
In future work, it is worth further studying the kinetics of phase separation, as well as the nature of the phase separation in the meso and molecular scale by temperature resolved spectroscopic techniques.
Author Contributions
Conceptualization: E.H.; Data curation: E.H., J.O., K.N.R.; Formal Analysis: J.O., K.N.R.; Funding acquisition: E.H.; Investigation: E.H., K.W., A.C., K.S., P.Z., K.N.R.; Methodology: E.H., K.N.R.; Project administration: E.H.; Resources: E.H., K.P.; Supervision: E.H.; Validation: E.H.; Visualization: K.W., A.C., K.S., J.O., K.N.R.; Writing – original draft: E.H., J.O., K.N.R.; Writing – review & editing: E.H., J.O., K.N.R., K.P. All authors have read and agreed to the published version of the manuscript.
Funding
The research was carried out as part of the project Student Scientific Circles Create Innovations SKN/SP/601186/2024 “Design and fabrication of thermoplastic non-isocyanate polyurethanes (NIPU) for biomedical applications” funded by the Ministry of Education and Science in Poland.
Institutional Review Board Statement
Not applicable.
Data Availability Statement
Not applicable.
Acknowledgments
The authors are very grateful to the central laboratory of the Faculty of Chemical Engineering and Technology of PK for providing access to SAXS apparatus, and to Adam Kuc for excellent assistance.
Conflicts of Interest
The authors declare no conflict of interest.
References
- Catalá, J.; Guerra, I.; García-Vargas, J.M.; Ramos, M.J.; García, M.T.; Rodríguez, J.F. Tailor-Made Bio-Based Non-Isocyanate Polyurethanes (NIPUs), Polymers, 2023, 15, 1589-1609. [CrossRef]
- Griffin, M.; Castro, N.; Bas, O.; Saifzadeh, S.; Butler, P.; Hutmacher, D.W. The Current Versatility of Polyurethane Three-Dimensional Printing for Biomedical Applications, Tissue Eng. Part B., 2020, 26, 272–283. [CrossRef]
- Król P. Synthesis methods, chemical structures and phase structures of linear polyurethanes. Properties and applications of linear polyurethanes in polyurethane elastomers, copolymers and ionomers, Prog. Mater. Sci., 2007, 52, 915–1015. [CrossRef]
- Engels H.W.; Pirkl H.G.; Albers R.; Albach R.W.; Krause J.; Hoffmann A.; Casselmann H.; Dormish J. Polyurethanes: Versatile Materials and Sustainable Problem Solvers for Today’s Challenges, Angew. Chemie Int. Ed., 2013, 52, 9422–9441. [CrossRef]
- Gomez-Lopez A.; Panchireddy S.; Grignard B.; Calvo I.; Jerome C.; Detrembleur C.; Sardon H. Poly(hydroxyurethane) Adhesives and Coatings: State-of-the-Art and Future Directions, ACS Sustain. Chem. Eng., 2021, 9, 9541–9562. [CrossRef]
- Kathalewar M.S.; Joshi P.B.; Sabnis A.S.; Malshe V.C. Non-isocyanate polyurethanes: From chemistry to applications, RSC Adv. 2013, 3, 4110–4129. [CrossRef]
- Munn A.; Hazards of Isocyanates, Ann. Occup. Hyg. 1965, 8, 163–169. [CrossRef]
- Rayung M.; Ghani N.A.; Hasanudin N. A review on vegetable oil-based non isocyanate polyurethane: towards a greener and sustainable production route, RSC Adv., 2024, 14, 9273–9299. [CrossRef]
- Chattopadhyay D.K.; Webster D.C. Thermal stability and flame retardancy of polyurethanes, Prog. Polym. Sci. 2009, 34, 1068–1133. [CrossRef]
- Rokicki G.; Parzuchowski P.G.; Mazurek M. Non-isocyanate polyurethanes: Synthesis, properties, and applications, Polym. Adv. Technol. 2015, 26, 707–761. [CrossRef]
- Carré C.; Ecochard Y.; Caillol S.; Avérous L. From the Synthesis of Biobased Cyclic Carbonate to Polyhydroxyurethanes: A Promising Route towards Renewable Non-Isocyanate Polyurethanes, ChemSusChem. 2019, 12, 3410–3430. [CrossRef]
- Błażek K; Datta J. Renewable natural resources as green alternative substrates to obtain bio-based non-isocyanate polyurethanes-review, Crit. Rev. Environ. Sci. Technol. 2019, 49, 173–211. [CrossRef]
- Blain M.; Jean-Gérard L.; Auvergne R.; Benazet D.; Caillol S.; Andrioletti B. Rational investigations in the ring opening of cyclic carbonates by amines, Green Chem. 2024, 16, 4286–4291. [CrossRef]
- Cornille A.; Auvergne R.; Figovsky O.; Boutevin B.; Caillol S. A perspective approach to sustainable routes for non-isocyanate polyurethanes, Eur. Polym. J. 2017, 87, 535–552. [CrossRef]
- Yu W.; Maynard E.; Chiaradia V.; Arno M.C.; Dove A.P. Aliphatic Polycarbonates from Cyclic Carbonate Monomers and Their Application as Biomaterials, Chem. Rev. 2021, 121, 10865–10907. [CrossRef]
- Cornille A.; Blain M.; Auvergne R.; Andrioletti B.; Boutevin B.; Caillol S. A study of cyclic carbonate aminolysis at room temperature: Effect of cyclic carbonate structures and solvents on polyhydroxyurethane synthesis, Polym. Chem. 2017, 8, 592–604. [CrossRef]
- Tomita H.; Sanda F.; Endo T. Structural analysis of polyhydroxyurethane obtained by polyaddition of bifunctional five-membered cyclic carbonate and diamine based on the model reaction, J. Polym. Sci. Part A Polym. Chem. 2001, 39, 851–859. [CrossRef]
- Tomita H.; Sanda F.; Endo T. Model reaction for the synthesis of polyhydroxyurethanes from cyclic carbonates with amines: Substituent effect on the reactivity and selectivity of ring-opening direction in the reaction of five-membered cyclic carbonates with amine, J. Polym. Sci. Part A Polym. Chem. 2001, 39, 3678–3685. [CrossRef]
- Leitsch E. K.; Beniah G.; Liu K.; Lan T.; Heath W. H.; Scheidt K. A.; Torkelson J. M. Nonisocyanate Thermoplastic Polyhydroxyurethane Elastomers via Cyclic Carbonate Aminolysis: Critical Role of Hydroxyl Groups in Controlling Nanophase Separation, ACS Macro Lett. 2016, 5, 424-429. [CrossRef]
- Besse V.; Camara F.; Méchin F.; Fleury E.; Caillol S.; Pascault J.-P.; Boutevin B. How to explain low molar masses in PolyHydroxyUrethanes (PHUs), Eur. Polym. J. 2015, 71, 1-11. [CrossRef]
- Sintas J. I.; Bean R. H.; Zhang R.; Long T. E. Nonisocyanate Polyurethane Segmented Copolymers from Bis-Carbonylimidazolides, Macromol. Rapid Commun. 2024, 45, 2400057-2400064. [CrossRef]
- Anderson J. R.; Argyropoulos J. N. Ambient temperature curable isocyanate-free compositions for preparing crosslinked polyurethanes, US 8,653,174 B2, 2014.
- Schimpf V.; Heck B.; Reiter G.; Mülhaupt R. Triple-Shape Memory Materials via Thermoresponsive Behavior of Nanocrystalline Non-Isocyanate Polyhydroxyurethanes, Macromolecules 2017, 50, 3598–3606. [CrossRef]
- Datta J.; Włoch M. Progress in non-isocyanate polyurethanes synthesized from cyclic carbonate intermediates and di- or polyamines in the context of structure–properties relationship and from an environmental point of view, Polym. Bull. 2016, 73, 1459–1496. [CrossRef]
- Nohra B.; Candy L.; Blanco J.-F.; Raoul Y.; Mouloungui Z. Aminolysis Reaction of Glycerol Carbonate in Organic and Hydroorganic Medium, J. Am. Oil Chem. Soc. 2012, 89, 1125–1133. [CrossRef]
- Lam K.Y.; Lee C. S.; Pichika M. R.; Cheng S. F.; Yie R.; Tan H. Non-isocyanate polyurethane-acrylate as UV- and thermo-responsive plasticizer for thermoplastic elastomer, J. Appl. Polym. Sci. 2024, 141, e55703. [CrossRef]
- Zhang B.; Yang X.; Lin X.; Shang H.; Liu Q.; Wang H.; Liu S.; Xu X.; Dong F. High-Strength, Self-Healing, Recyclable, and Catalyst-Free Bio-Based Non-Isocyanate Polyurethane, ACS Sustain. Chem. Eng. 2023, 11, 6100–6113. [CrossRef]
- Beniah G.; Liu K.; Heath W. H.; Miller M. D.; Scheidt K. A.; Torkelson J.M. Novel Thermoplastic Polyhydroxyurethane Elastomers as Effective Damping Materials over Broad Temperature Ranges, Eur. Polym. J. 2016, 84, 770-783. [CrossRef]
- Beniah G.; Uno B.; Lan T.; Jeon J.; Heath W.H.; Scheidt K.A.; Torkelson J.M. Tuning nanophase separation behavior in segmented polyhydroxyurethane via judicious choice of soft segment, Polymer 2017, 110, 218-277. [CrossRef]
- Ochiai, B.; Inoue, S.; Endo, T. One-pot non-isocyanate synthesis of polyurethanes from bisepoxide, carbon dioxide, and diamine. J. Polym. Sci. Part A: Polym. Chem. 2005, 43, 6613–6618. [Google Scholar] [CrossRef]
- Diakoumakos, C.D.; Kotzev, D.L. Non-Isocyanate-Based Polyurethanes Derived upon the Reaction of Amines with Cyclo carbonate Resins. Macromol. Symp. 2004, 216, 37−46. [Google Scholar] [CrossRef]
- Blain, M.; Jean-Gérard, L.; Auvergne, R.; Benazet, D.; Caillol, S.; Andrioletti, B. Rational investigations in the ring opening of cyclic carbonates by amines. Green Chem. 2014, 16, 4286−4291. [Google Scholar] [CrossRef]
- Lambeth, R. Organocatalytic synthesis of (poly)hydroxyurethanes from cyclic carbonates and amines. Polymer 2013, 54, 5568–5573. [Google Scholar] [CrossRef]
- Chen, Q.; Gao, K.; Xie, H.; Zhao, Z.K.; Bao, M. Preparation of lignin/glycerol-based bis(cyclic carbonate) for the synthesis of polyurethanes. Green Chem. 2015, 17, 4546–4551. [Google Scholar] [CrossRef]
- Prompers, G.; Keul, H.; Höcker, H. Polyurethanes with pendant hydroxy groups: polycondensation of D-mannitol-1,2:5,6-dicarbonate with diamines. Des. Monomers Polym. 2005, 8, 547–569. [Google Scholar] [CrossRef]
- Fidalgo, D.M.; Kolender, A.A.; Varela, O. Stereoregular poly O-methyl [m,n]-polyurethanes derived from D-mannitol. J. Polym. Sci. Part A: Polym. Chem. 2013, 51, 463–470. [Google Scholar] [CrossRef]
- Ubaghs, L.; Fricke, N.; Keul, H.; Höcker, H. Polyurethanes with Pendant Hydroxyl Groups: Synthesis and Characterization. Macromol. Rapid Commun. 2004, 25, 517–521. [Google Scholar] [CrossRef]
- Prompers, G.; Keul, H.; Höcker, H. Polyurethanes with pendant hydroxy groups: polycondensation of 1,6-bis-O-phenoxycarbonyl-2,3[ratio]4,5 di-O-isopropylidenegalactitol and 1,6-di-O-phenoxycarbonylgalactitol with diamines. Green Chem. 2006, 8, 467–478. [Google Scholar] [CrossRef]
- Boyer, A.; Cloutet, E.; Tassaing, T.; Gadenne, B.; Alfos, C.; Cramail, H. Solubility in CO2 and carbonation studies of epoxidized fatty acid diesters: towards novel precursors for polyur ethane synthesis. Green Chem. 2010, 12, 2205–2213. [Google Scholar] [CrossRef]
- Mazurek-Budzyńska, M.M.; Rokicki, G.; Drzewicz, M.; Guńka, P.A.; Zachara, J. Bis(cyclic carbonate) based on d-mannitol, d-sorbitol and di (trimethylolpropane) in the synthesis of non-isocyanate poly (carbonate-urethane)s. Eur. Polym. J. 2016, 84, 799–811. [Google Scholar] [CrossRef]
- Lamarzelle, O.; Durand, P.-L.; Wirotius, A.-L.; Chollet, G.; Grau, E.; Cramail, H. Activated lipidic cyclic carbonates for non isocyanate polyurethane synthesis. Polym. Chem. 2016, 7, 1439–1451. [Google Scholar] [CrossRef]
- Fatoumata, C.; Mechin, F.; Fleury, E.; Caillol, S.; Pascault, J.-P.; Boutevin, B. How to explain low molar masses in PolyHydroxyUrethanes (PHUs). Eur. Polym. J. 2015, 71, 1–11. [Google Scholar]
- Besse, V.; Auvergne, R.; Carlotti, S.; Boutevin, G.; Otazaghine, B.; Caillol, S.; Pascault, J.-P.; Boutevin, B. Synthesis of isosorbide based polyurethanes: An isocyanate free method. React. Funct. Polym. 2013, 73, 588–594. [Google Scholar] [CrossRef]
- Delebecq, E.; Pascault, J.-P.; Boutevin, B.; Ganachaud, F. On the Versatility of Urethane/Urea Bonds: Reversibility, Blocked Isocyanate, and Non-isocyanate Polyurethane. Chem. Rev. 2013, 113, 80–118. [Google Scholar] [CrossRef]
- Schmidt S.; Gatti F. J.; Luitz M.; Ritter B. S.; Bruchmann B.; Mulhaupt R. Erythritol Dicarbonate as Intermediate for Solvent- and Isocyanate Free Tailoring of Bio-Based Polyhydroxyurethane Thermoplastics and Thermoplastic Elastomers, Macromolecules 2017, 50, 2296−2303. [CrossRef]
- Kihara, N.; Endo, T. Synthesis and properties of poly (hydroxyurethane)s. J. Polym. Sci. Part A: Polym. Chem. 1993, 31, 2765–2773. [Google Scholar] [CrossRef]
- Schmidt S., Göppert N. E., Bruchmann B.; Mülhaupt R. Liquid sorbitol ether carbonate as intermediate for rigid and segmented non-isocyanate polyhydroxyurethane thermosets. Eur. Polym. J. 2017, 94, 136–142. [Google Scholar] [CrossRef]
- Salvado, V.; Dolatkhani, M.; Grau, E.; Vidil, T.; Cramail, H. Sequence-Controlled Polyhydroxyurethanes with Tunable Regioregularity Obtained from Sugar-Based Vicinal Bis-cyclic Carbonates. Macromolecules 2022, 55, 7249–7264. [Google Scholar] [CrossRef]
- Raftopoulos K.N.; Łukaszewska I.; Lalik S.; Zając P.; Bukowczan A.; Hebda E.; Marzec M.; Pielichowski K. Structure–Glass Transition Relationships in Non Isocyanate Polyhydroxyurethanes. Molecules 2024, 29, 4057. [CrossRef]
- Mishra A. K.; Chattopadhyay D. K.; Sreedhar B.; Raju K. V. S. N. FT-IR and XPS studies of polyurethane-urea-imide coatings. Prog. Org. Coat. 2006, 55, 231-243. [CrossRef]
- Koutsoumpis S.; Ozimek J.; Raftopoulos K. N.; Hebda E.; Klonos P.; Papadakis C. M.; Pielichowski K.; Pissis P. Polyurethanes with POSS pendent on flexible hard segments: Morphology and glass transition. Polymer, 2018, 147, 225-236. [CrossRef]
- Wang Z.; Liu Z.; Gao Z.; Li X.; Eling B.; Poselt E.; Schander E.; Wang Z. Structure transition of aliphatic m,6-Polyurethane during heating investigated using in-situ WAXS, SAXS, and FTIR, Polymer 2022, 254, 125072-125083. [CrossRef]
- Skrovanek D.J.; Painter P.C.; Coleman M.M.; Hydrogen Bonding in Polymers. Infrared Temperature Studies of Nylon 11, Macromolecules 1986, 19, 699–705. [CrossRef]
- Stancik A. L.; Brauns E. B. A simple asymmetric lineshape for fitting infrared absorption spectra, Vibrational Spectroscopy 2008, 47, 66-69. [CrossRef]
- Koutsoumpis S.; Ozimek J.; Raftopoulos K. N.; Hebda E.;, Klonos P.; Papadakis C. M.; Pielichowski K.; Pissis P. Polyurethanes with POSS pendent on flexible hard segments: Morphology and glass transition, Polymer, 2018, 147, 225-236. [CrossRef]
- Nobre S. S.; Lima P. P.; Mafra L.; Sá Ferreira R. A.; Freire R. O.; Fu L.; Uwe Pischel U.; Zea Bermudez V.; Malta O. L.; Carlos L. D. Energy Transfer and Emission Quantum Yields of Organic−Inorganic Hybrids Lacking Metal Activator Centers, J. Phys. Chem. C 2007, 111, 3275–3284. [CrossRef]
- Raut P. W.; Shitole A. A.; Khandwekar A.; Sharma N. Engineering biomimetic polyurethane using polyethylene glycol and gelatin for blood-contacting applications, Journal of Materials Science 2019, 54, 10457–10472. [CrossRef]
- Beniah G.; Fortman D. J.; Heath W. H.; Dichtel W. R.; Torkelson J. M. Non-Isocyanate Polyurethane Thermoplastic Elastomer: AmideBased Chain Extender Yields Enhanced Nanophase Separation and Properties in Polyhydroxyurethane, Macromolecules 2017, 50, 4425–4434. [CrossRef]
- Koberstein J.T.; Russell T.P. Simultaneous SAXS-DSC study of multiple endothermic behavior in polyether-based polyurethane block copolymers, Macromolecules 1986, 19, 714–720. [CrossRef]
- Koberstein J.T.; Stein R.S. Small-angle X-ray scattering studies of microdomain structure in segmented polyurethane elastomers, Journal of Polymer Science: Polymer Physics 1983, 21, 1439–1472. [CrossRef]
- Leung L.M.; Koberstein J.T. Small-angle scattering analysis of hard-microdomain structure and microphase mixing in polyurethane elastomers, Journal of Polymer Science: Polymer Physics 1985, 23, 1883–1913. [CrossRef]
- Koutsoumpis S.; Raftopoulos K.N.; Oguz O.; Papadakis C.M.; Menceloglu Y.Z.; Pissis P. Dynamic glass transition of the rigid amorphous fraction in polyurethane-urea/SiO2 nanocomposites, Soft Matter 2017, 13, 4580–4590. [CrossRef]
- Koutsoumpis S.; Raftopoulos K.N.; Jancia M.; Pagacz J.; Hebda E.; Papadakis C.M.; Pielichowski K.; Pissis P. POSS moieties with PEG vertex groups as diluent in Polyurethane elastomers: morphology and phase separation, Macromolecules 2016, 49, 6507–6517. [CrossRef]
- Raftopoulos K.N.; Koutsoumpis S.; Jancia M.; Lewicki J.P.; Kyriakos K.; Mason H.E.; Harley S.J.; Hebda E.; Papadakis C.M.; Pielichowski K.; Pissis P. Reduced Phase Separation and Slowing of Dynamics in Polyurethanes with Three-Dimensional POSS-Based Cross-Linking Moieties, Macromolecules 2015, 48, 1429–1441. [CrossRef]
- Teubner M.; Strey R.; Origin of the scattering peak in microemulsions, J Chem Phys 1987, 87, 3195–3200. [CrossRef]
- Endo H.; Mihailescu M.; Monkenbusch M.; Allgaier J.; Gompper G.; Richter D.; Jakobs B.; Sottmann T.; Strey R.; Grillo I. Effect of amphiphilic block copolymers on the structure and phase behavior of oil–water-surfactant mixtures, J Chem Phys 2001, 115, 580–600. [CrossRef]
- SasView 6.0.1 documentation » teubner_strey, (n.d.). https://www.sasview.org/docs/user/models/teubner_strey.html (accessed May 22, 2025).
- SasView 6.0.1 documentation » peak_lorentz, (n.d.). https://www.sasview.org/docs/user/models/peak_lorentz.html (accessed May 22, 2025).
- Vallance M.; Yeung A.S.; Cooper S.L. A dielectric study of the glass transition region in segmented polyether-urethane copolymers, Colloid & Polymer Science 1983, 261, 541–554. [CrossRef]
- Umoren S.A.; Solomon M.M.; Saji V.S. Polyethers, in: Polymeric Materials in Corrosion Inhibition, Elsevier, 2022: pp. 399–417. [CrossRef]
- Koberstein J.T.; Galambos A.F. Multiple melting in segmented polyurethane block copolymers, Macromolecules 1992, 25, 5618–5624. [CrossRef]
- Leung L.M.; Koberstein J.T. DSC Annealing Study of Microphase Separation and Multiple Endothermic Behavior in Polyether-Based Polyurethane Block Copolymers, Macromolecules 1986, 19, 706–713. [CrossRef]
- Koberstein J.T.; Leung L.M. Compression-molded polyurethane block copolymers. Evaluation of microphase compositions, Macromolecules 1992, 25, 6205–6213. [CrossRef]
- Koberstein J.T.; Gancarz I.; Clarke T.C. The effects of morphological transitions on hydrogen bonding in polyurethanes: Preliminary results of simultaneous DSC–FTIR experiments, J Polym Sci B Polym Phys 1986, 24, 2487–2498. [CrossRef]
- Koberstein J.T.; Galambos A.F.; Leung L.M. Compression-Molded Polyurethane Block Copolymers. Microdomain Morphology and Thermomechanical Properties, Macromolecules 1992, 25, 6195–6204. [CrossRef]
- Raftopoulos K.N.; Janowski B.; Apekis L.; Pielichowski K.; Pissis P. Molecular mobility and crystallinity in polytetramethylene ether glycol in the bulk and as soft component in polyurethanes, Eur Polym J 2011, 47, 2120–2133. [CrossRef]
- Umoren S.A.; Solomon M.M.; Saji V.S. Polyethers, in: Polymeric Materials in Corrosion Inhibition, Elsevier, 2022: pp. 399–417. [CrossRef]
- Faucher J.A.; Koleske J. V.; Santee E.R.; Stratta J.J.; Wilson C.W. Glass Transitions of Ethylene Oxide Polymers, J Appl Phys 1966, 37, 3962–3964. [CrossRef]
- Bakkali-Hassani C.; Berne D.; Ladmiral V.; Caillol S. Transcarbamoylation in Polyurethanes: Underestimated Exchange Reations?, Macromolecules 2022, 55, 7974–7991. [CrossRef]
- Dannecker P.-K.; Meier M.A.R. Facile and Sustainable Synthesis of Erythritol bis(carbonate), a Valuable Monomer for Non-Isocyanate Polyurethanes (NIPUs), Sci Rep 2019, 9, 9858-9864. [CrossRef]
Scheme 1.
Reaction schemes for synthesis of PEG-, PPO- and PEG/PPO-based PHUs with 1,12-diaminododecane.
Scheme 1.
Reaction schemes for synthesis of PEG-, PPO- and PEG/PPO-based PHUs with 1,12-diaminododecane.
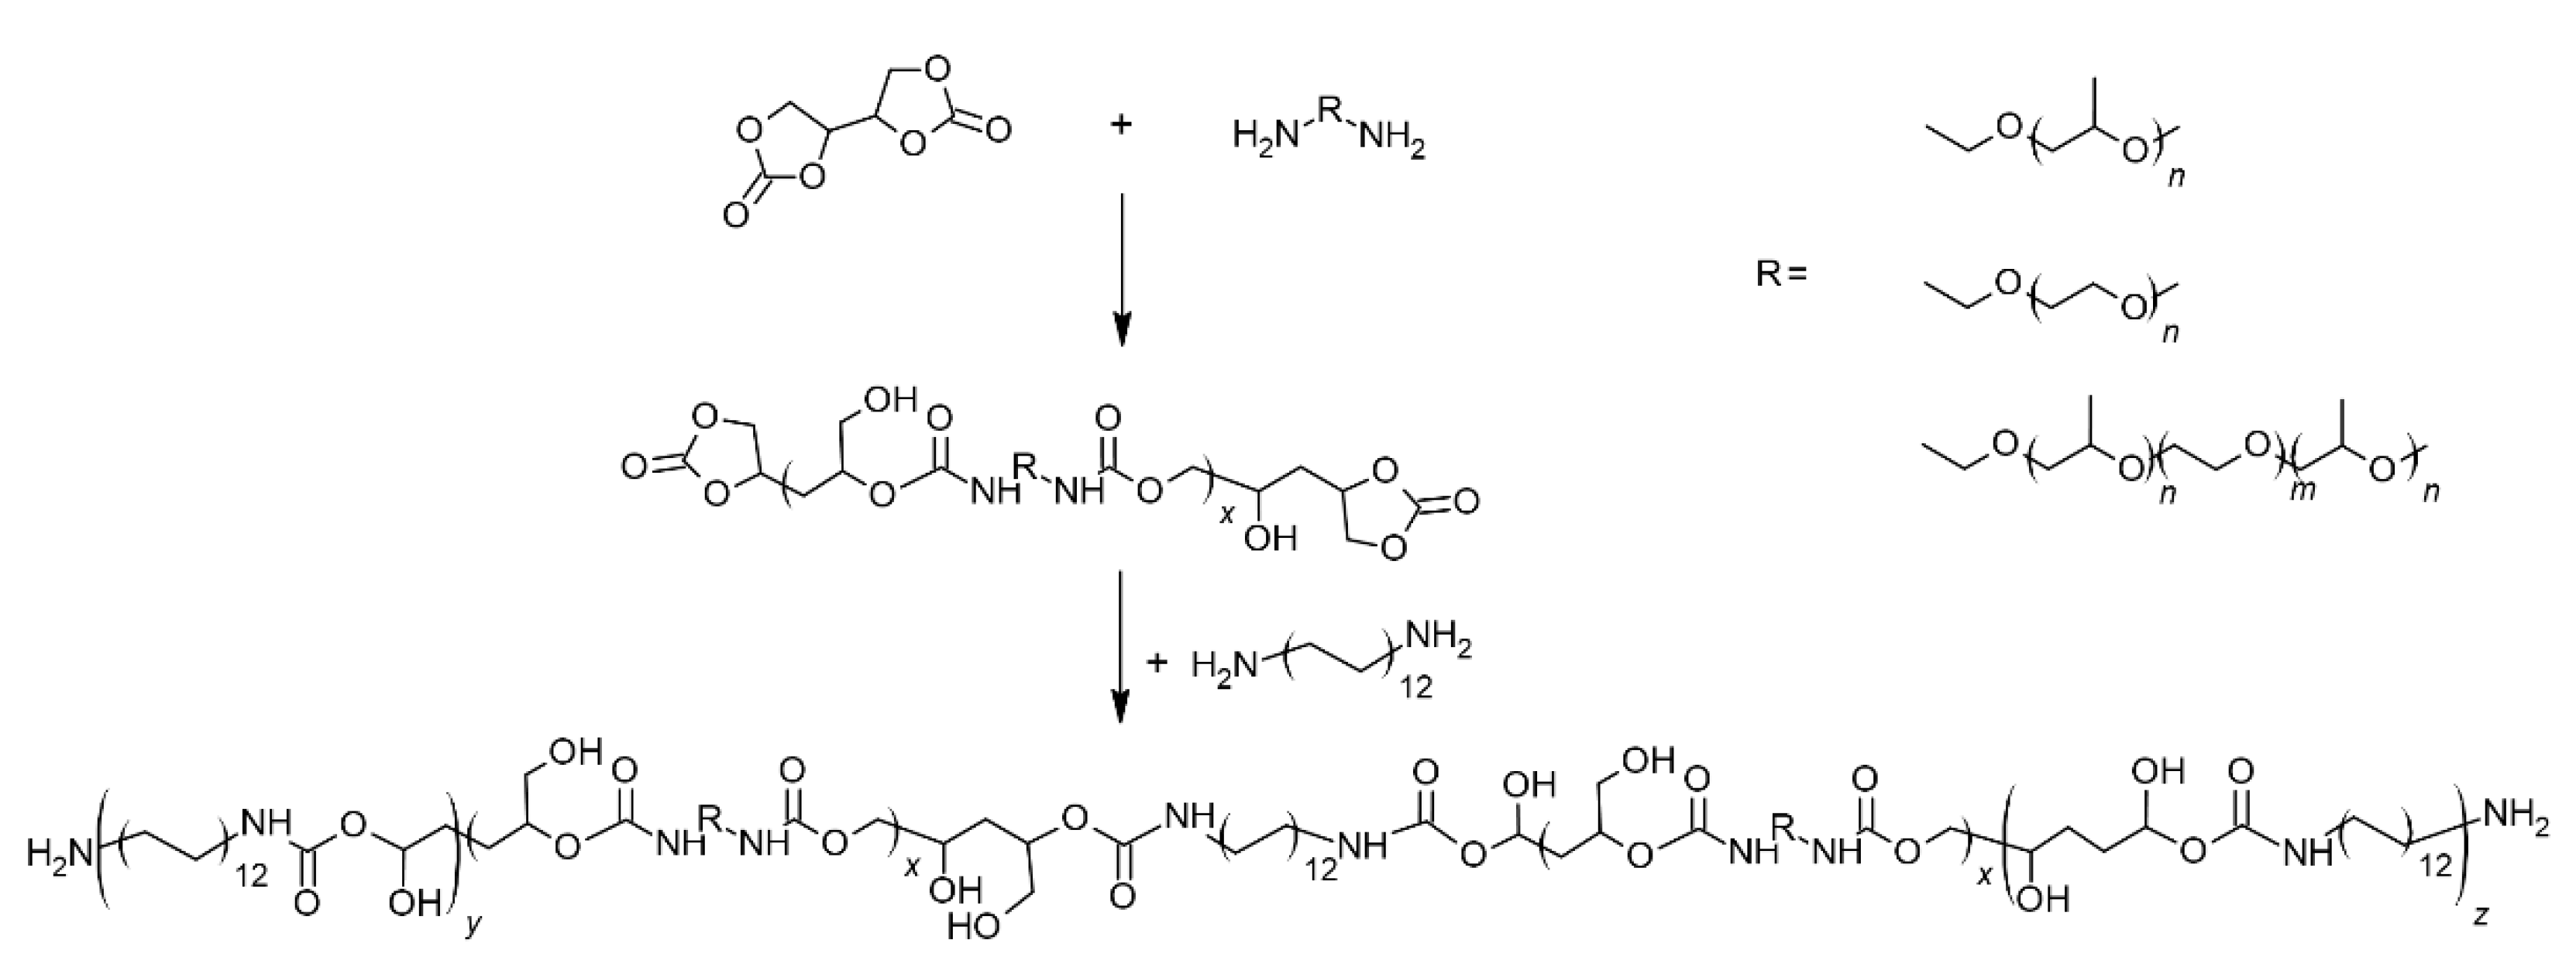
Figure 1.
ATR-FTIR spectra of non-isocyanate polyurethanes synthesized using PEG and PPO substrates.
Figure 1.
ATR-FTIR spectra of non-isocyanate polyurethanes synthesized using PEG and PPO substrates.
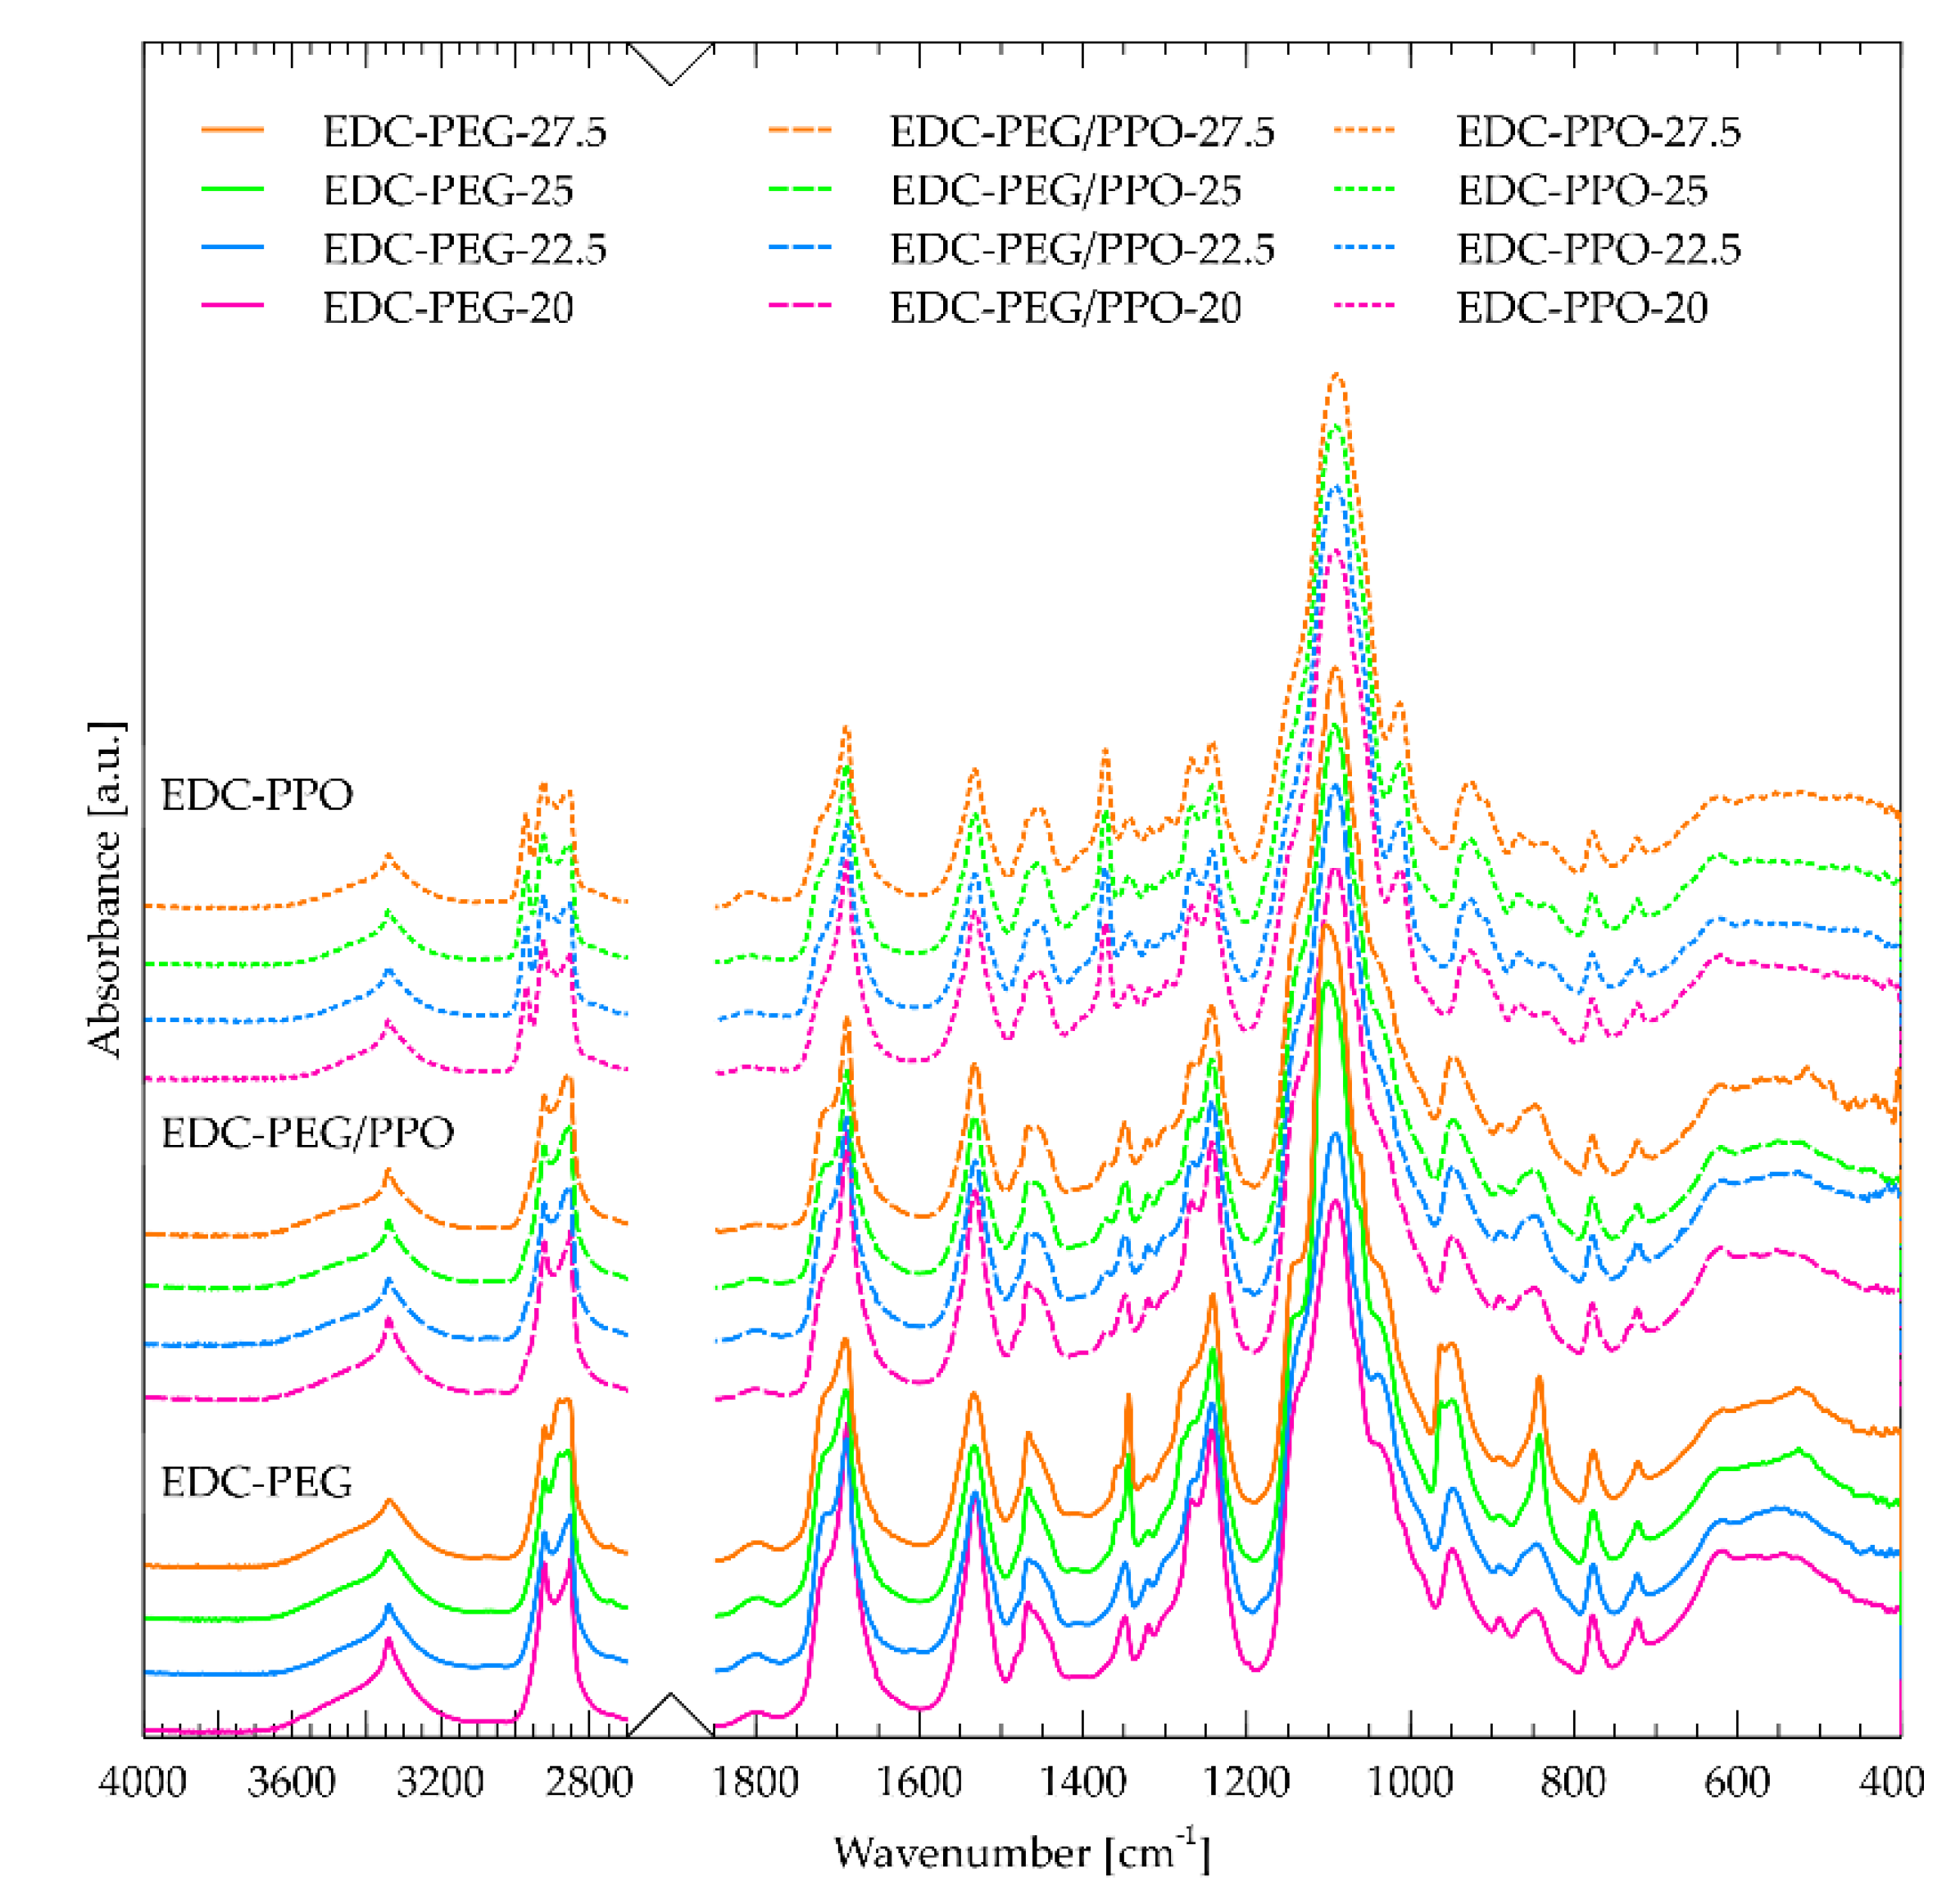
Figure 2.
ATR-FTIR spectra of all materials in the amide I region related to the carbonyl of the urethane group. (a) EDC-PEG (b) EDC-PEG/PPO (c) EDC-PPO. Second row shows the intensities of the bands as determined by the deconvolution. The third row shows ratio χ, associated with phase separation.
Figure 2.
ATR-FTIR spectra of all materials in the amide I region related to the carbonyl of the urethane group. (a) EDC-PEG (b) EDC-PEG/PPO (c) EDC-PPO. Second row shows the intensities of the bands as determined by the deconvolution. The third row shows ratio χ, associated with phase separation.

Scheme 2.
Simplified illustration of phase-separated NIPU structure showing polyether hydrophilic domains, crystallized DADD hard segments, erythritol hydrophilic domains, and hydrogen-bonded vs. free carbonate domains (IR peaks: 1712 cm⁻¹, 1688 cm⁻¹, and 1684 cm⁻¹).
Scheme 2.
Simplified illustration of phase-separated NIPU structure showing polyether hydrophilic domains, crystallized DADD hard segments, erythritol hydrophilic domains, and hydrogen-bonded vs. free carbonate domains (IR peaks: 1712 cm⁻¹, 1688 cm⁻¹, and 1684 cm⁻¹).
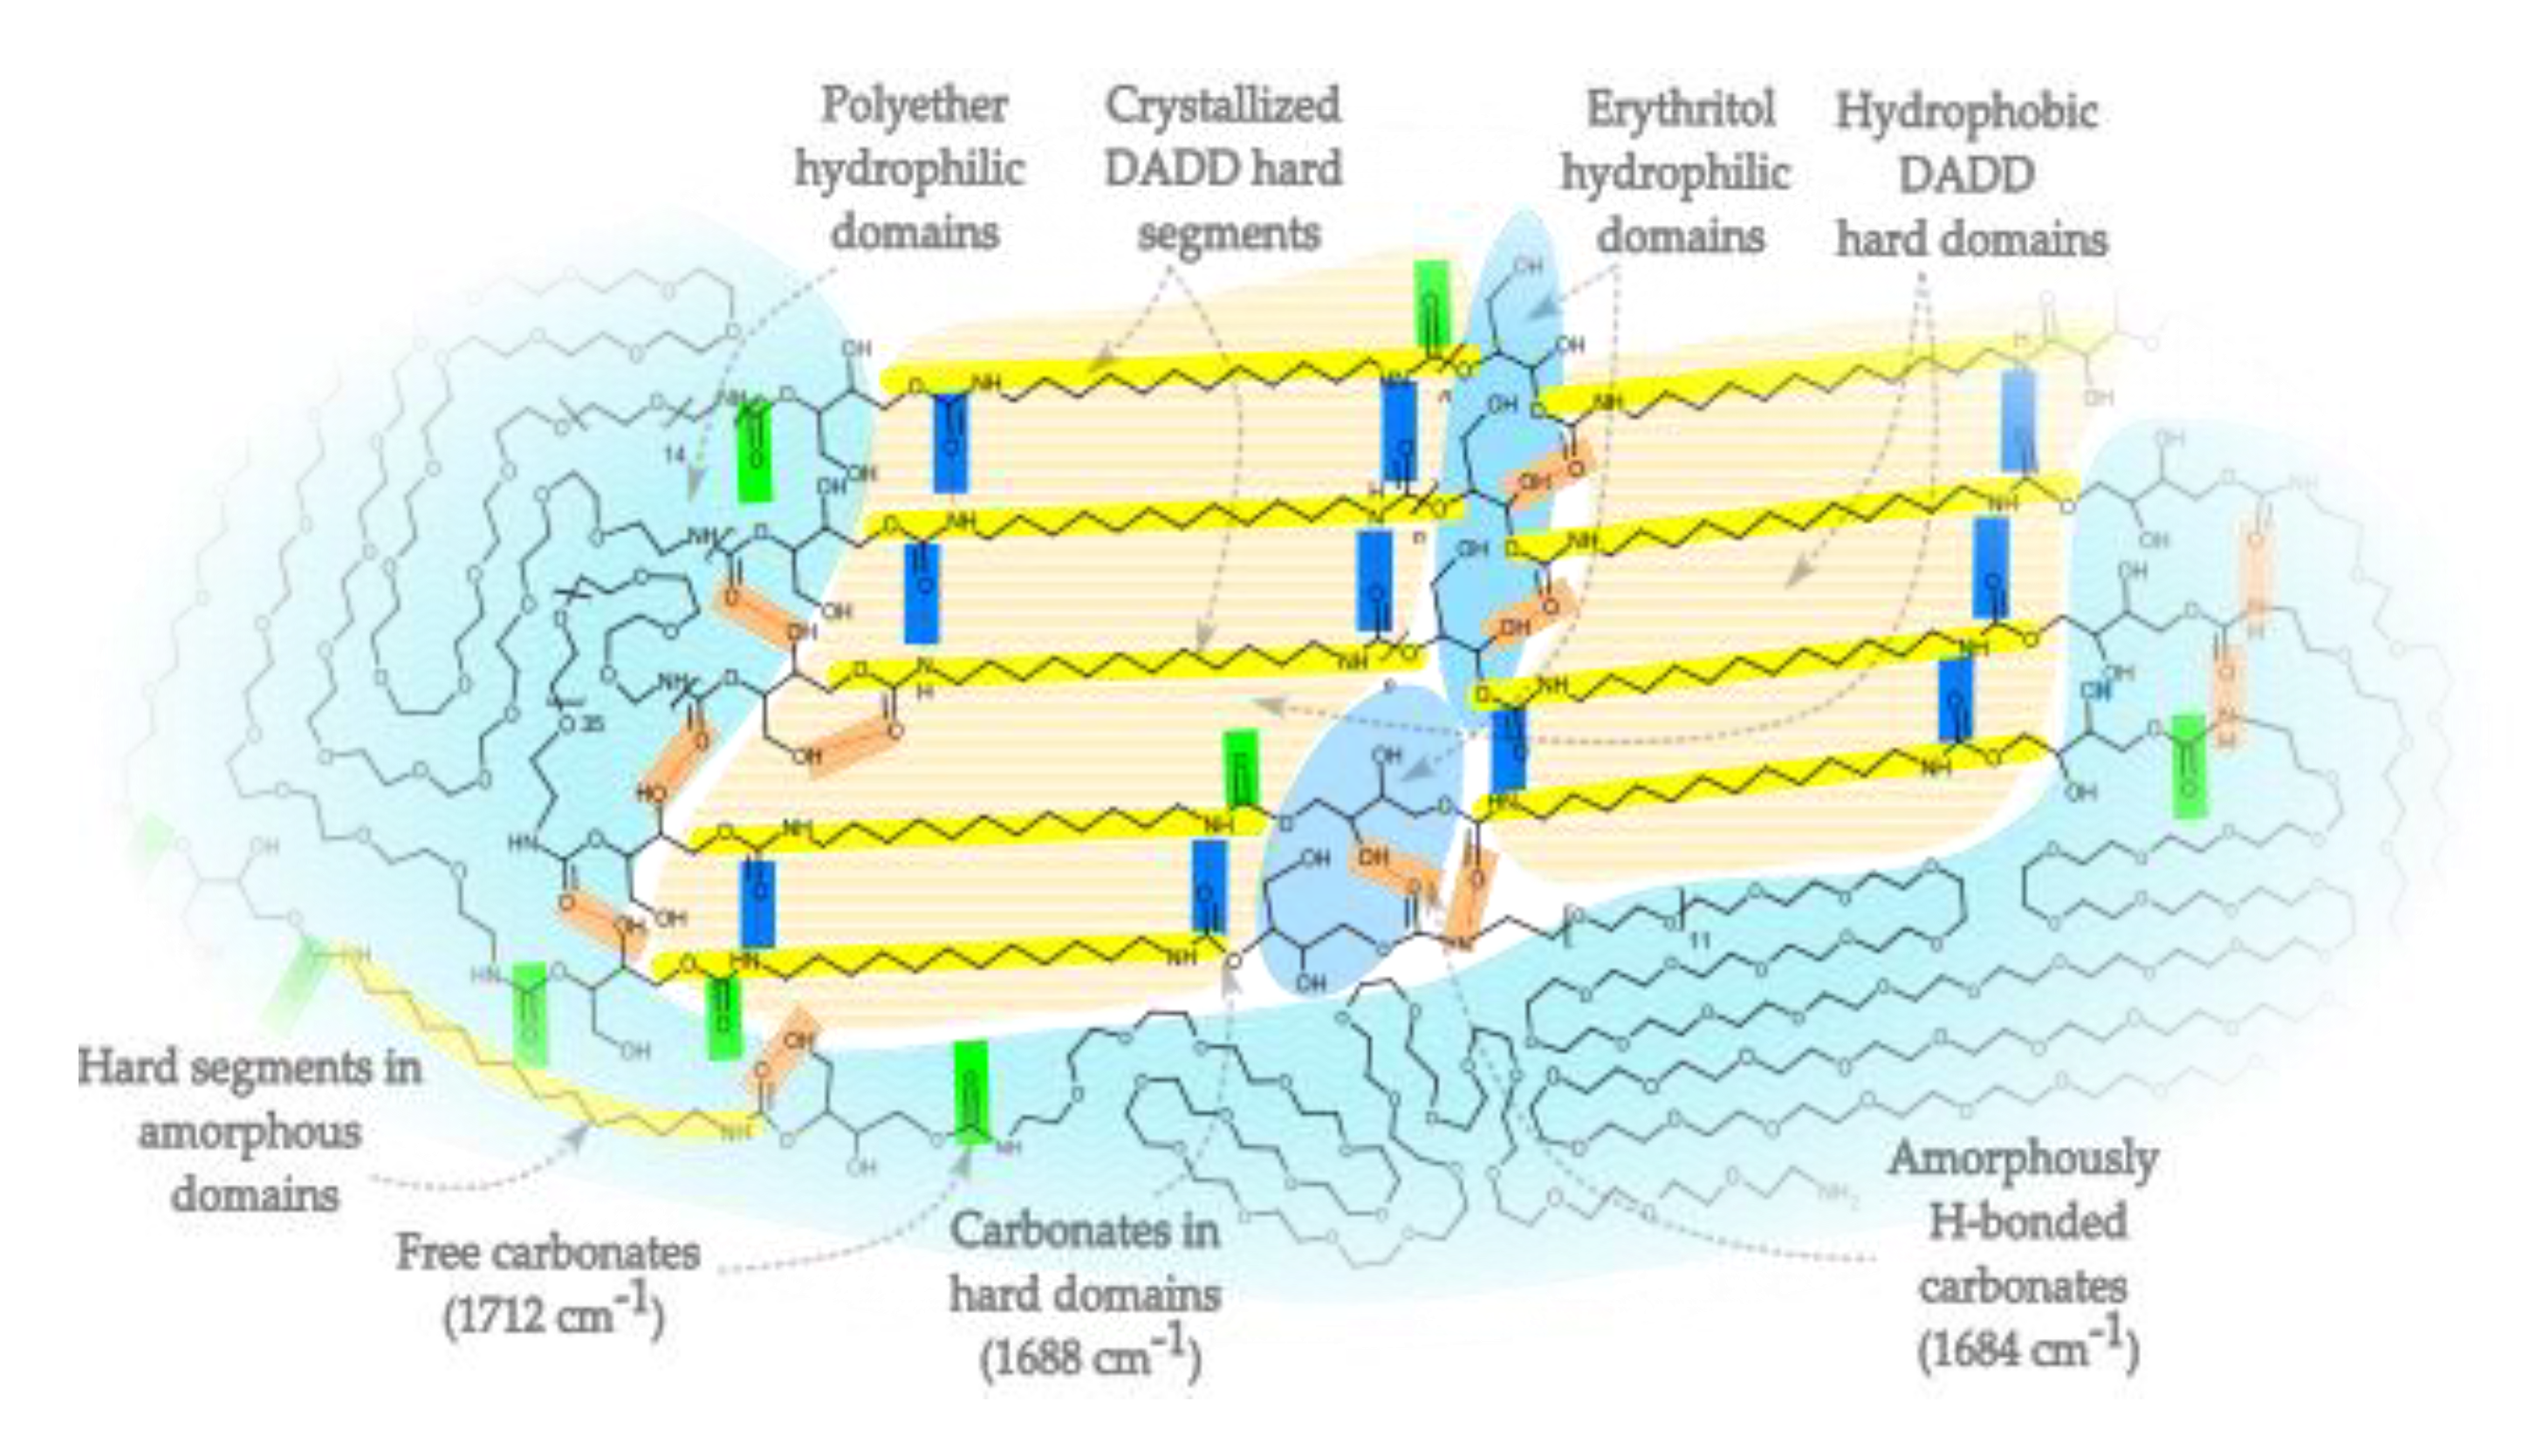
Figure 3.
¹H NMR spectra (DMSO-d₆, 400 MHz) of all materials. Each spectrum is overlaid twice: (1) a dotted line at true intensity (used for integration), and (2) a solid line, amplified 10× to reveal weak signals such as NH and OH resonances. Letters (a–t) correspond to proton environments labeled in the chemical structure above, with dashed vertical lines aiding in peak identification. Key features include methylene and methine resonances, NH and OH groups (pH: hydrogen-bonded and p: unbonded), and weak signals from unreacted terminal groups.
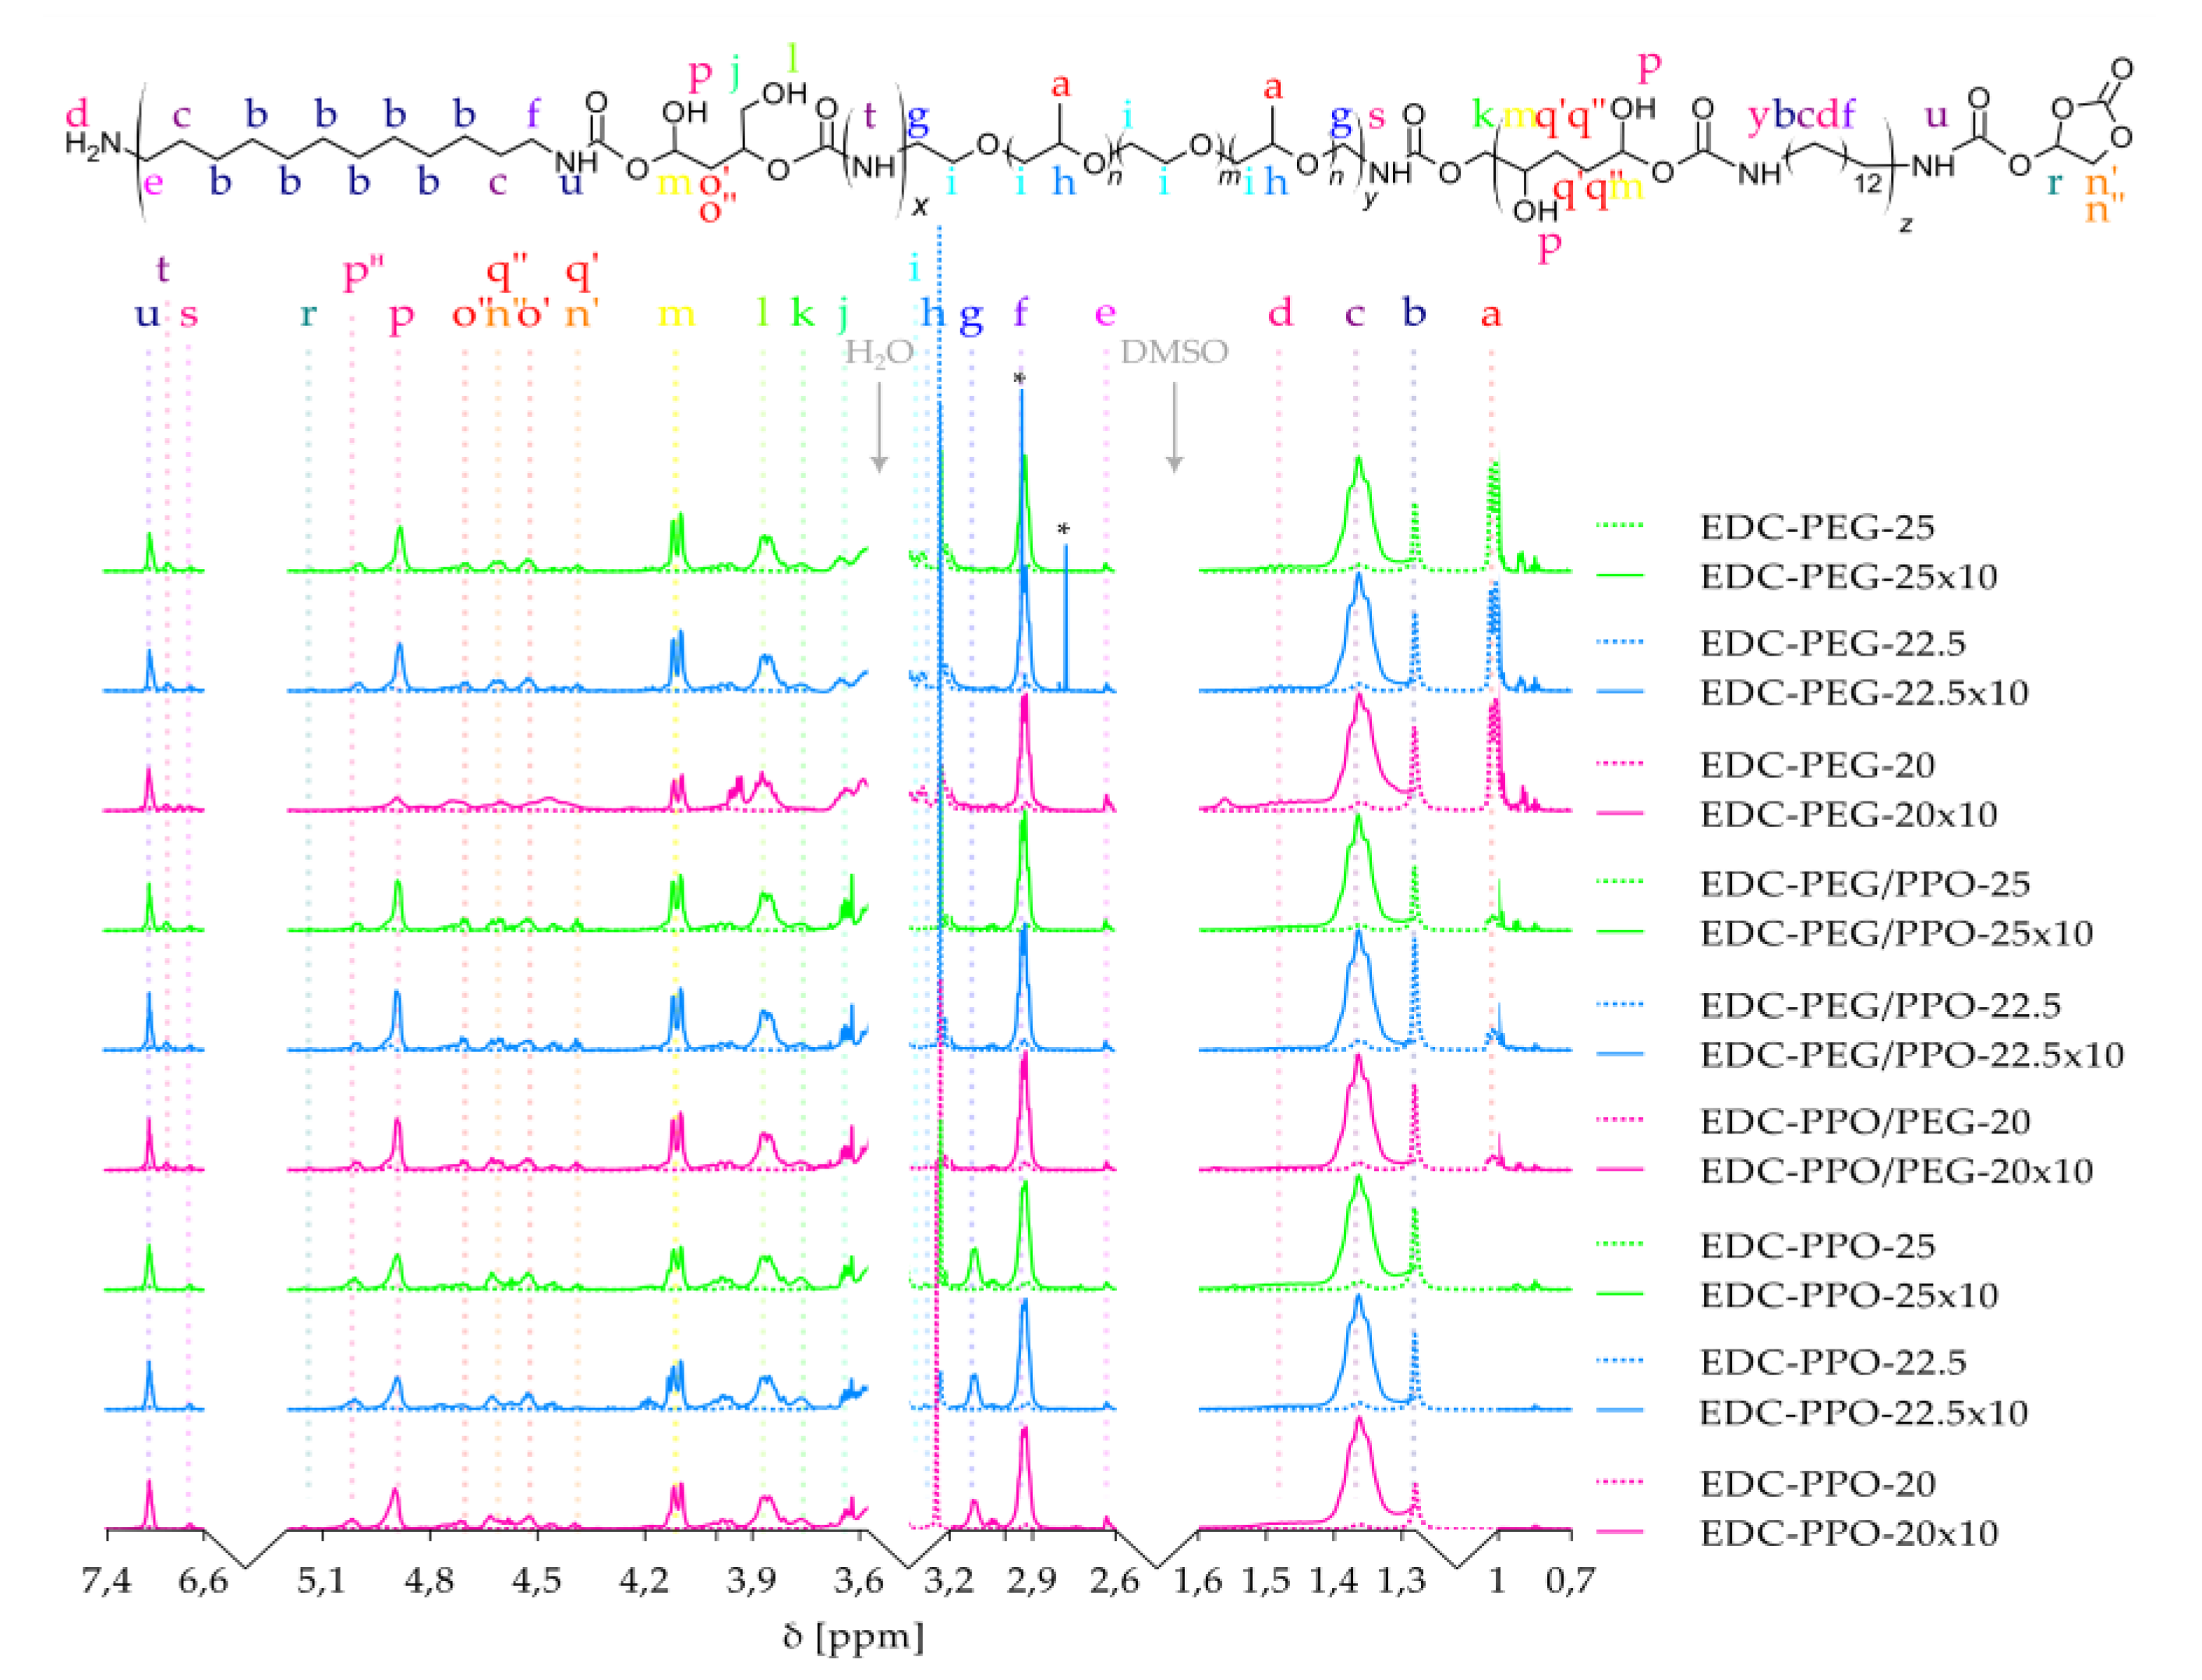
Figure 4.
WAXD patterns of reagents and PHU based in PEG, PPO and PEG/PPO copolymers with different content in relation to DADD.
Figure 4.
WAXD patterns of reagents and PHU based in PEG, PPO and PEG/PPO copolymers with different content in relation to DADD.
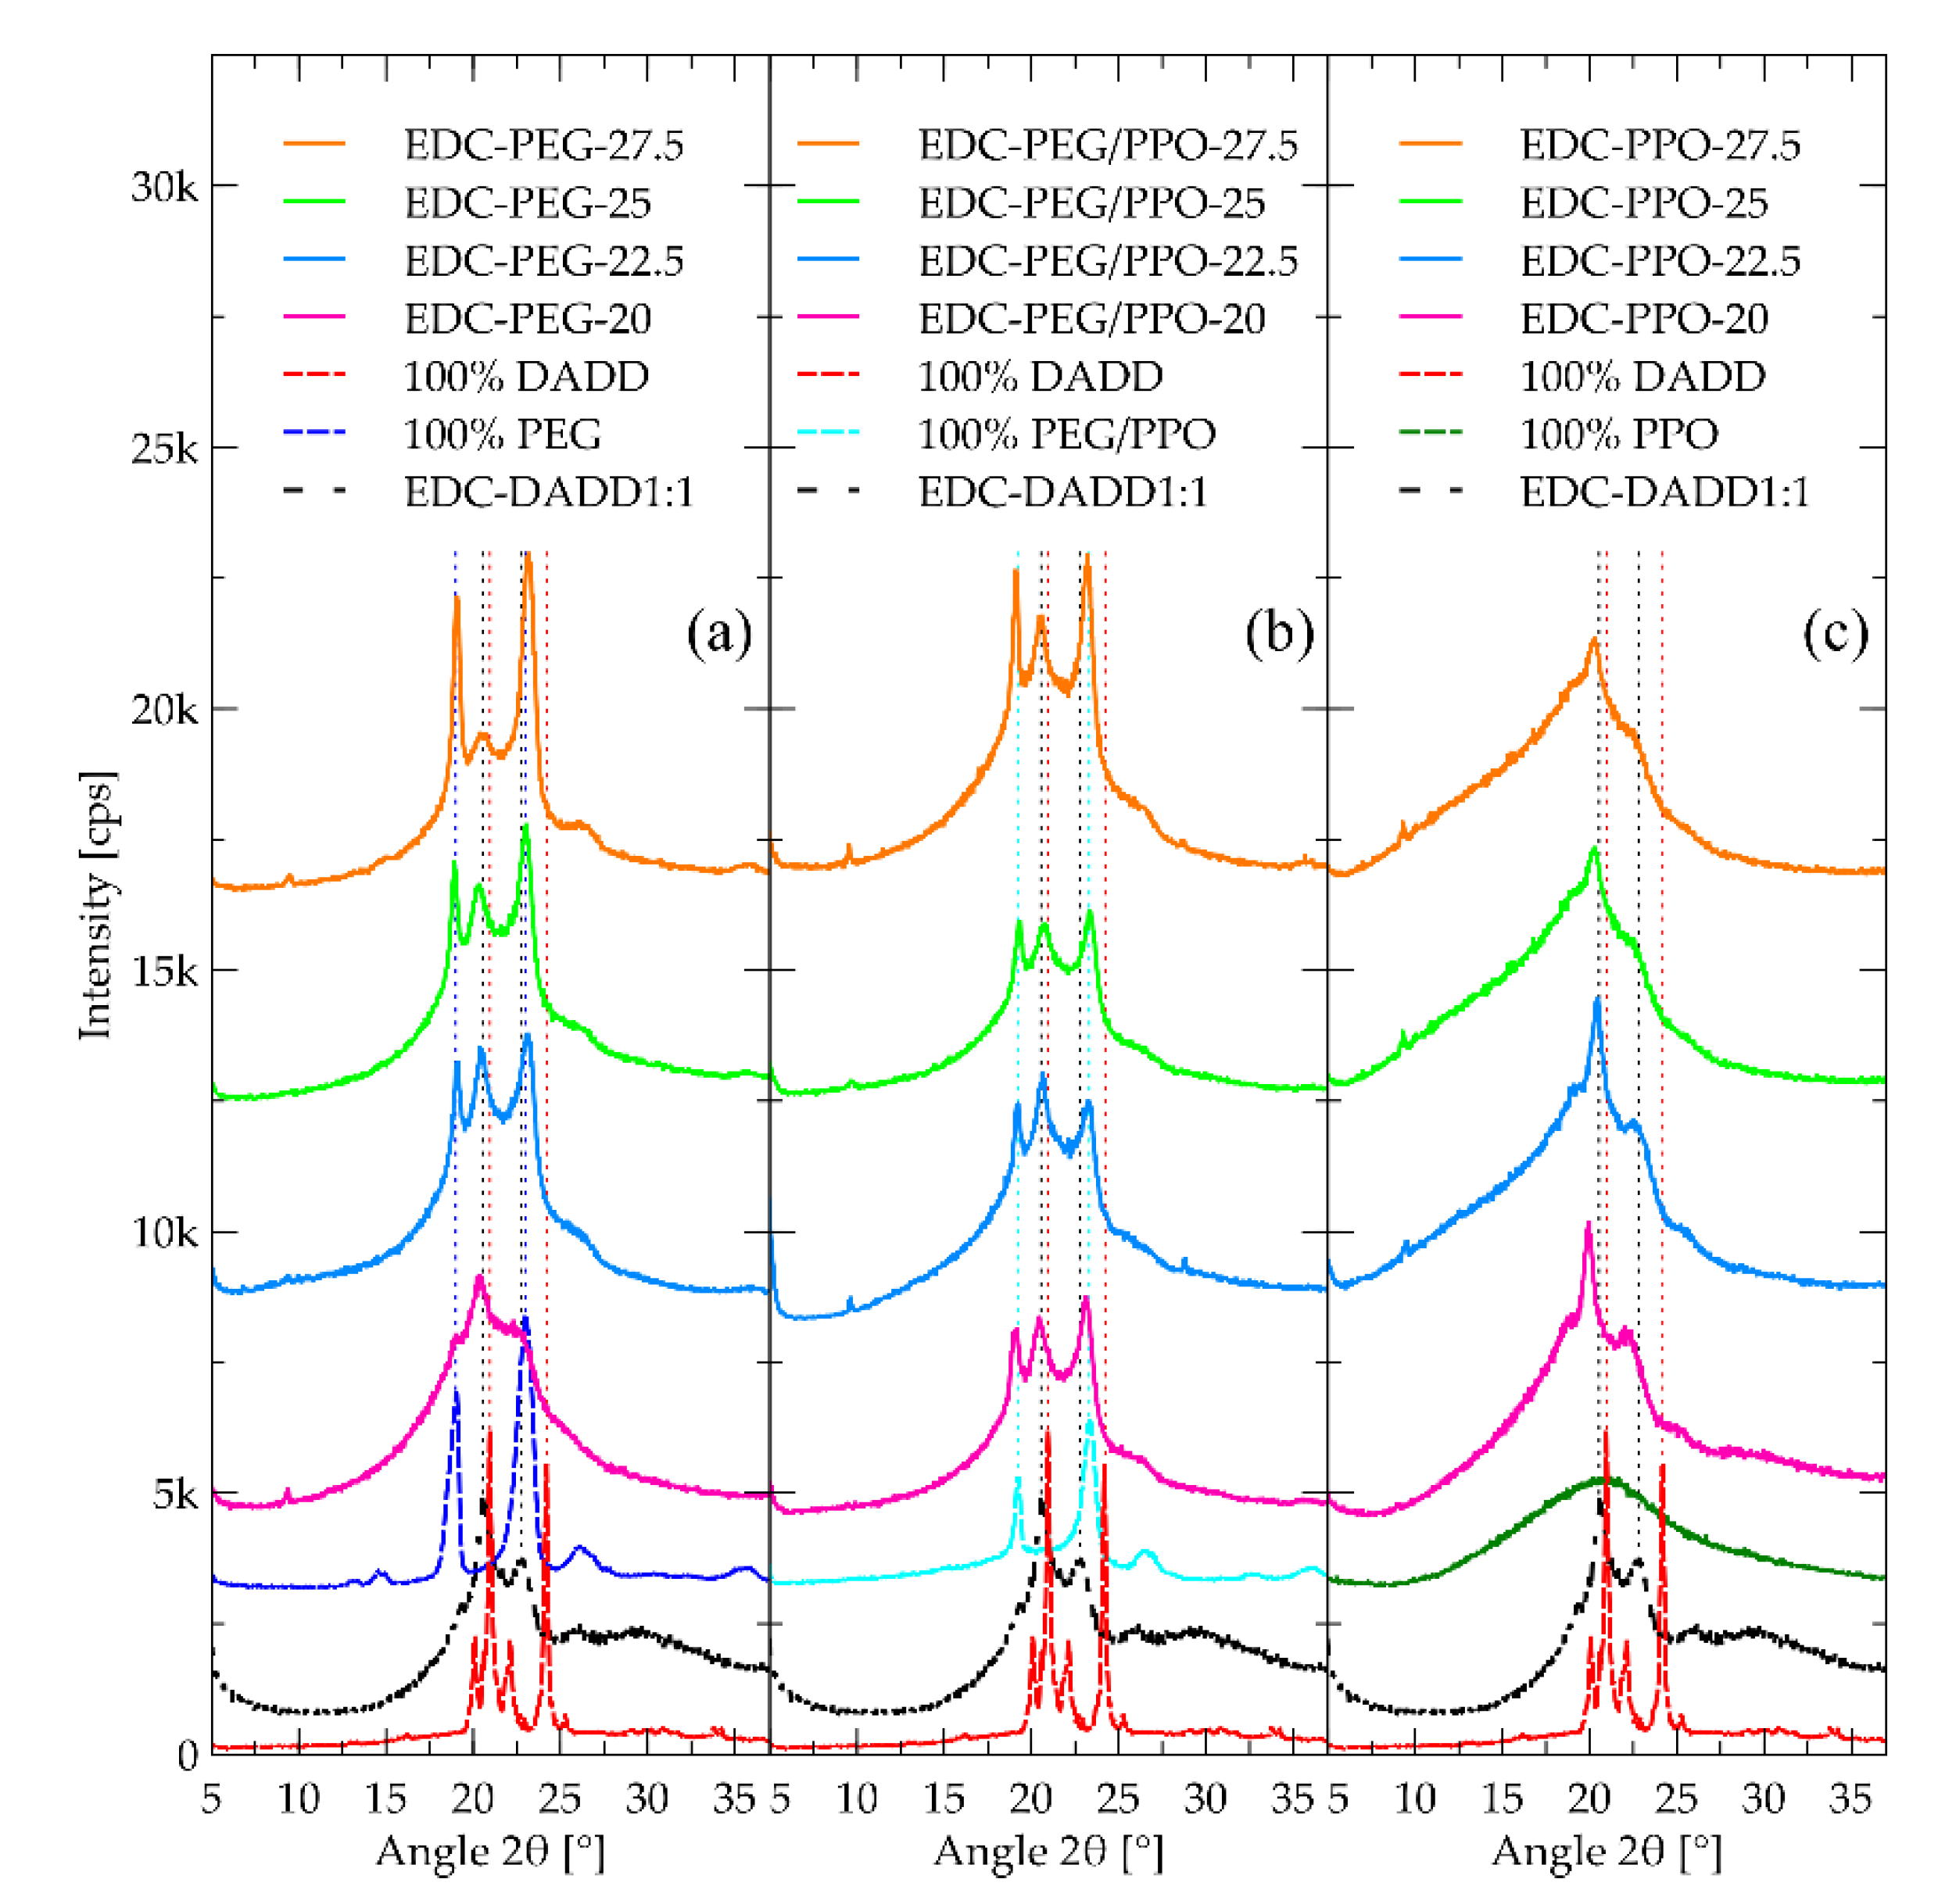
Figure 5.
SAXS curves recorded with the samples including 25% of each of the polyethers. Results of the fit along with the components of the model are also included. Curves have been translated for clarity.
Figure 5.
SAXS curves recorded with the samples including 25% of each of the polyethers. Results of the fit along with the components of the model are also included. Curves have been translated for clarity.
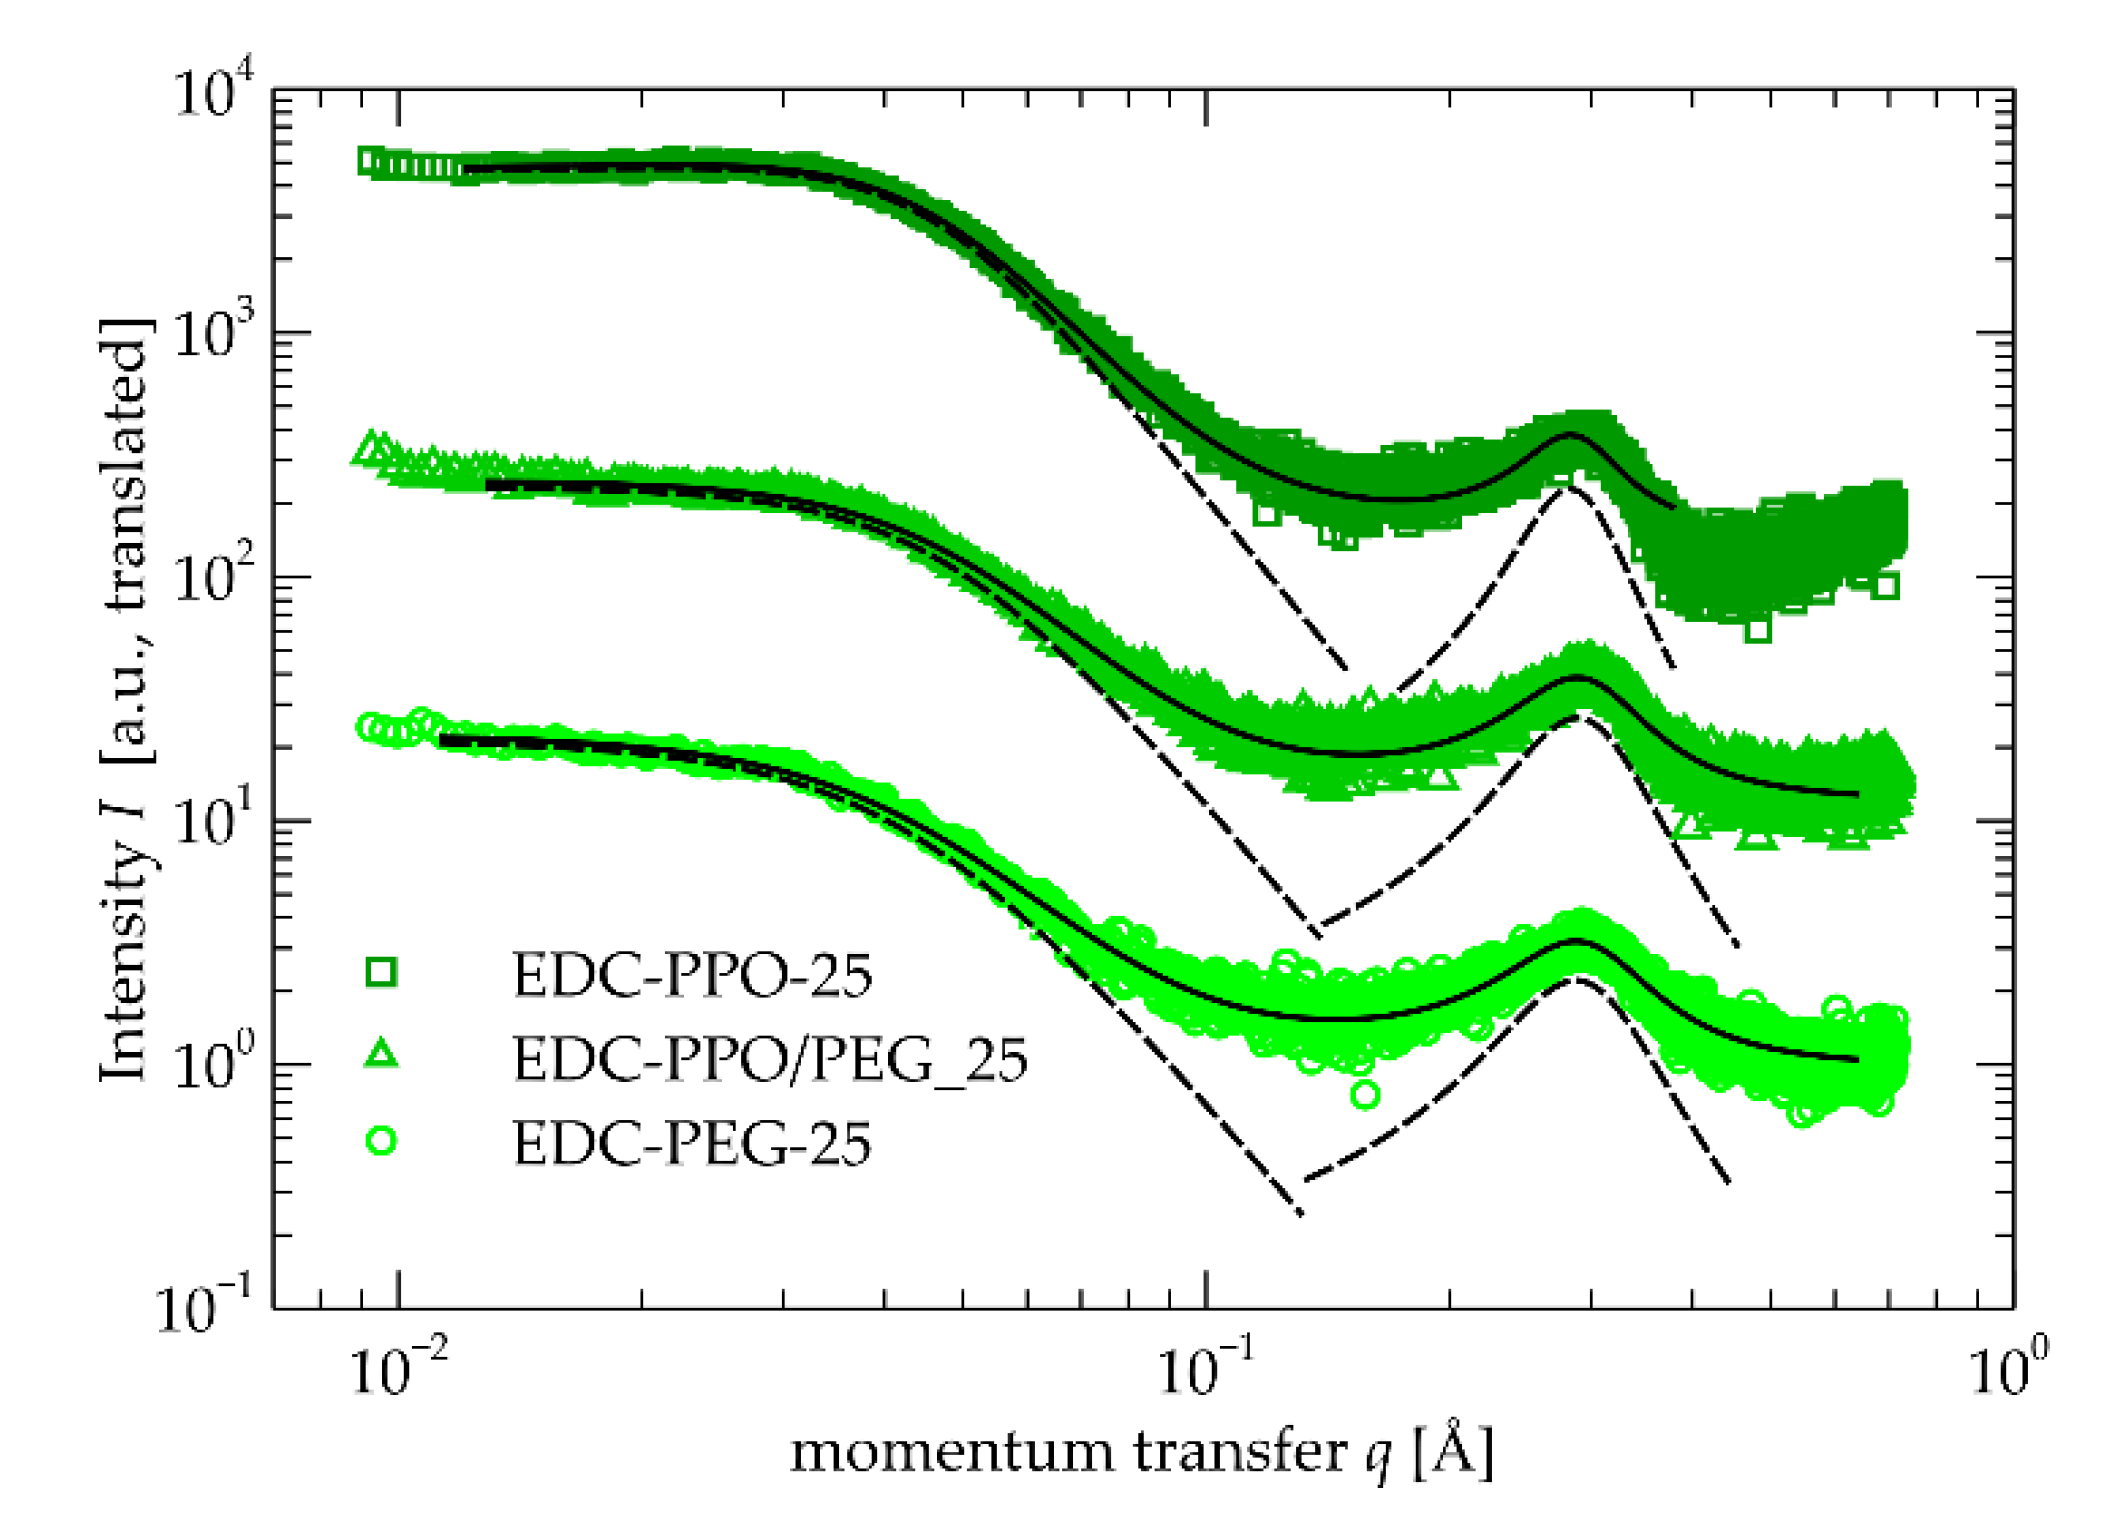
Figure 6.
DSC curves recorded with all materials under investigation. (a) first heating run (b) cooling run (c) second heating run. The prefix EDC in the code name of the samples has been omitted for clarity.
Figure 6.
DSC curves recorded with all materials under investigation. (a) first heating run (b) cooling run (c) second heating run. The prefix EDC in the code name of the samples has been omitted for clarity.
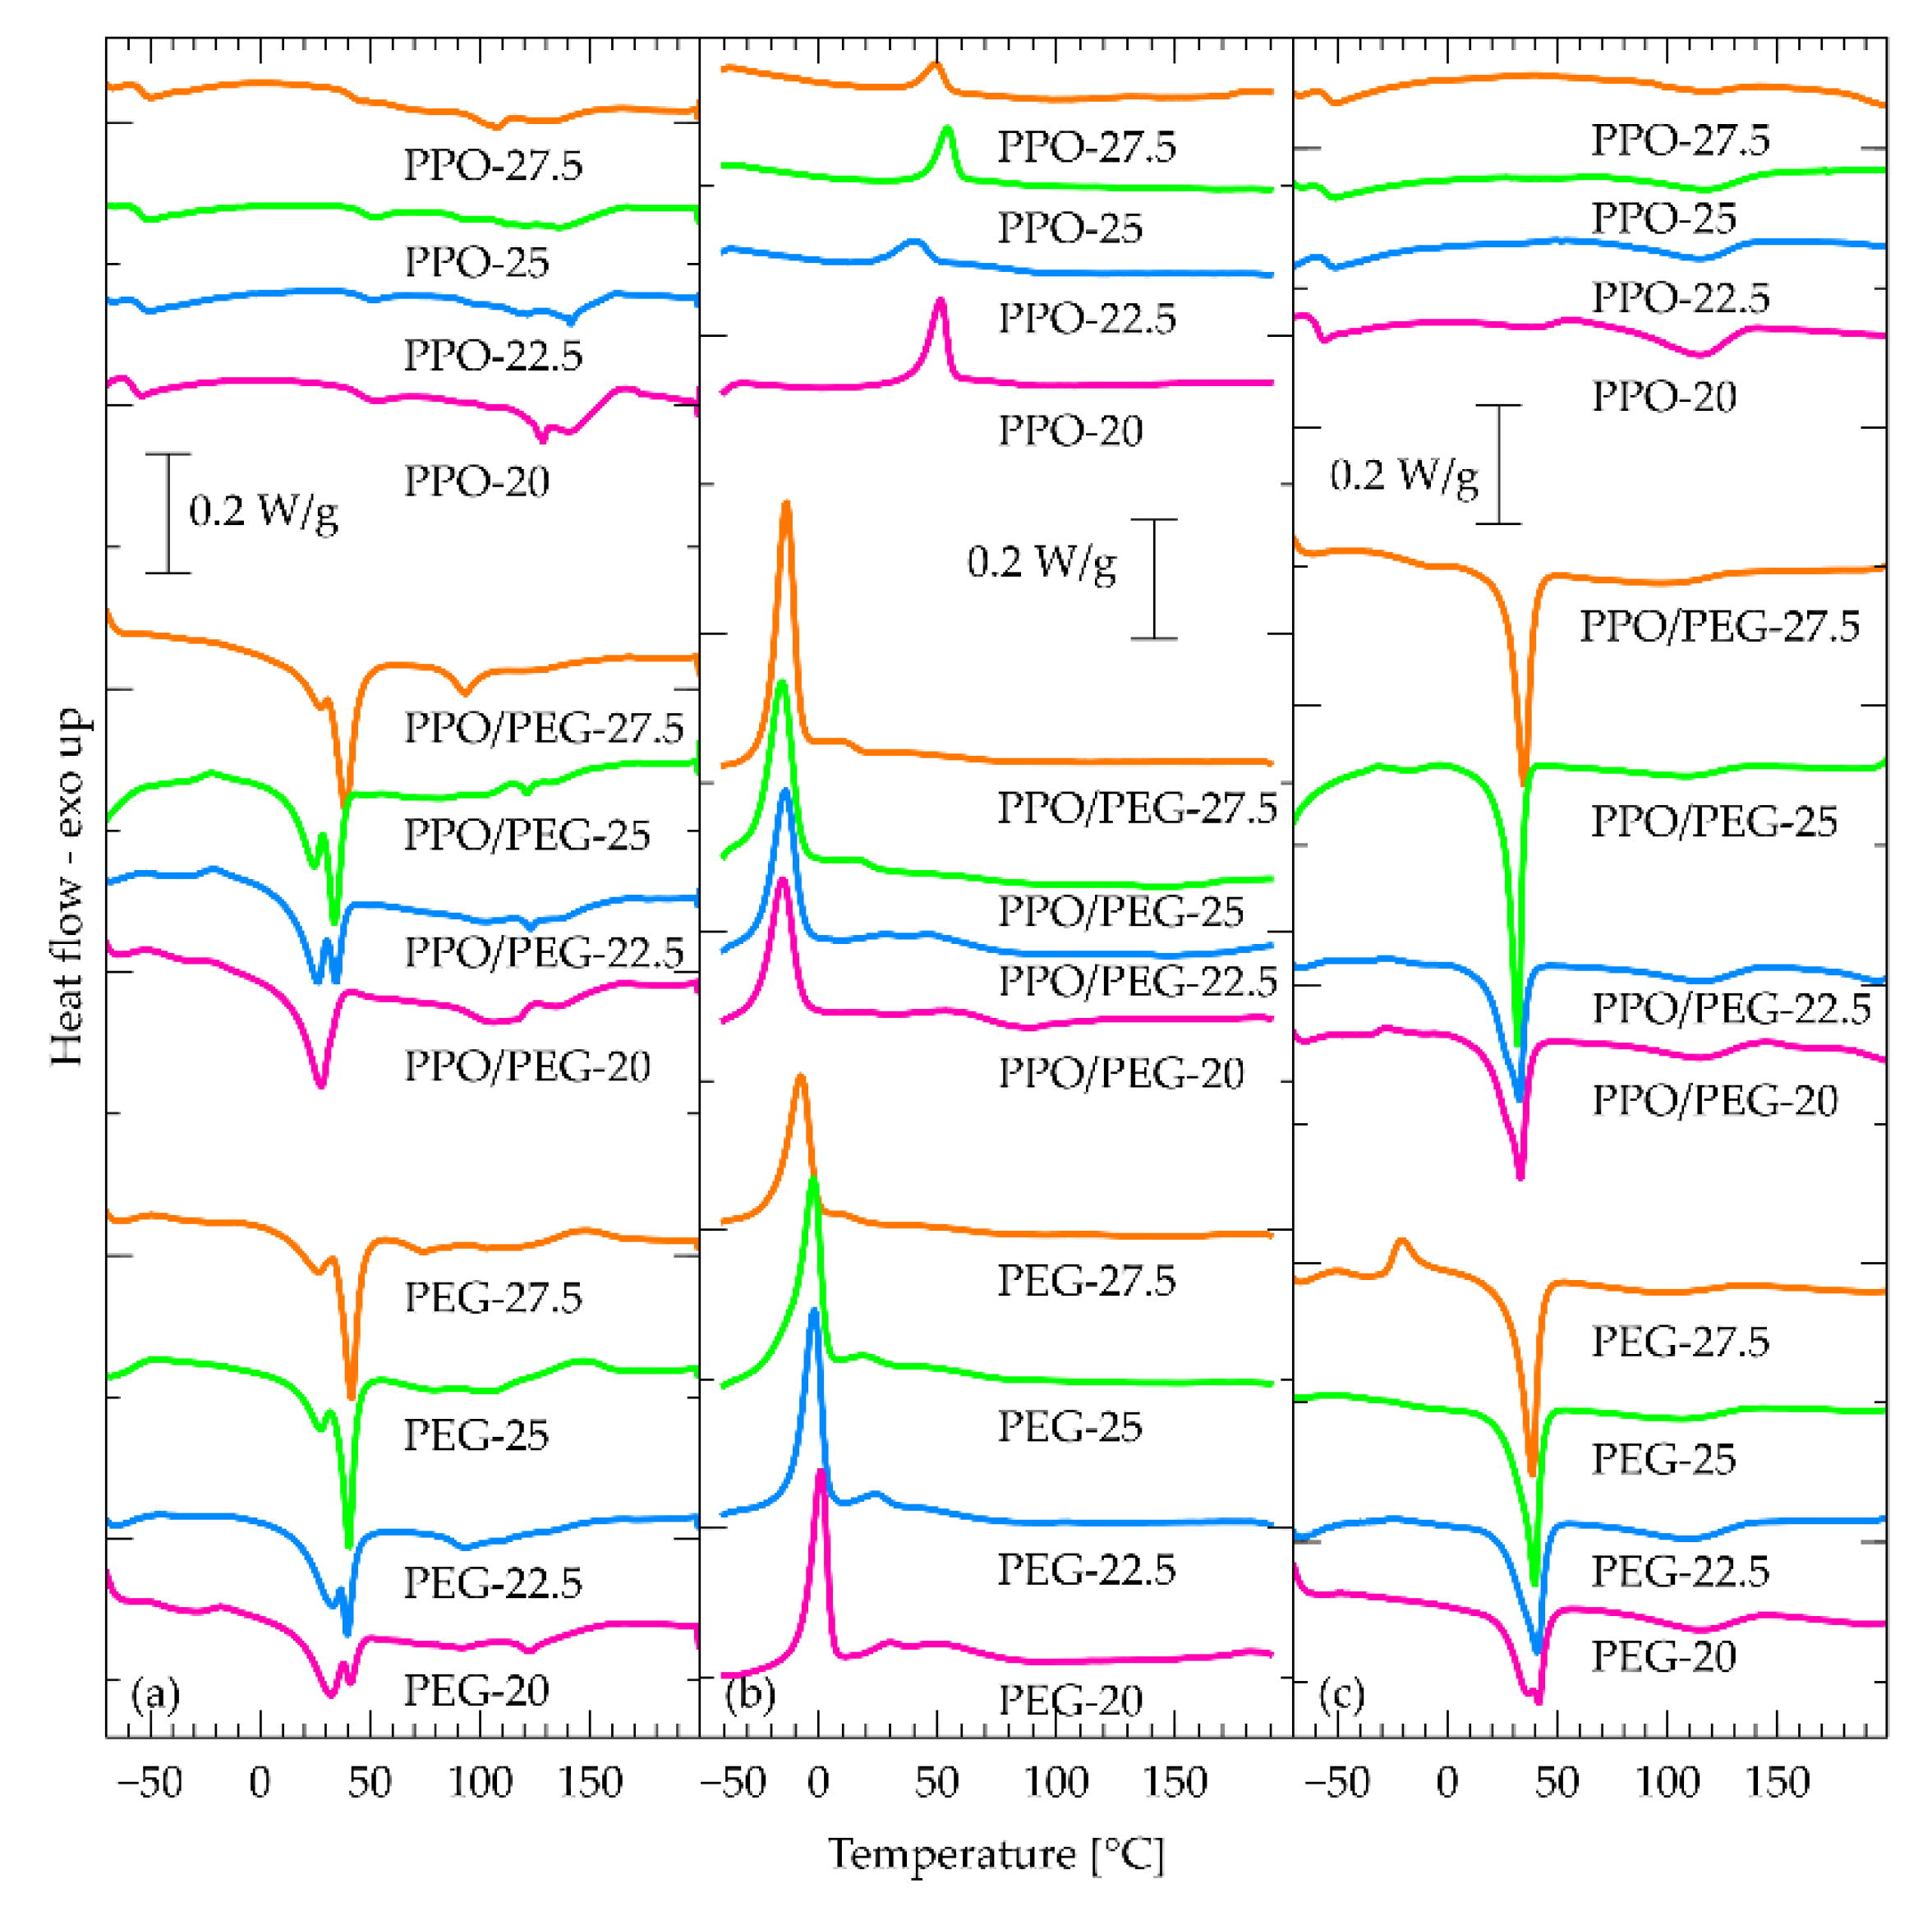
Figure 7.
DMA curves of all materials for which a DMA measurement was possible. (a) PEG-based materials, (b) PPO/PEG-based materials, (c) PPO-based materials.
Figure 7.
DMA curves of all materials for which a DMA measurement was possible. (a) PEG-based materials, (b) PPO/PEG-based materials, (c) PPO-based materials.
Scheme 3.
Scheme of the reaction of erythritol to erythritol di(carbonate).
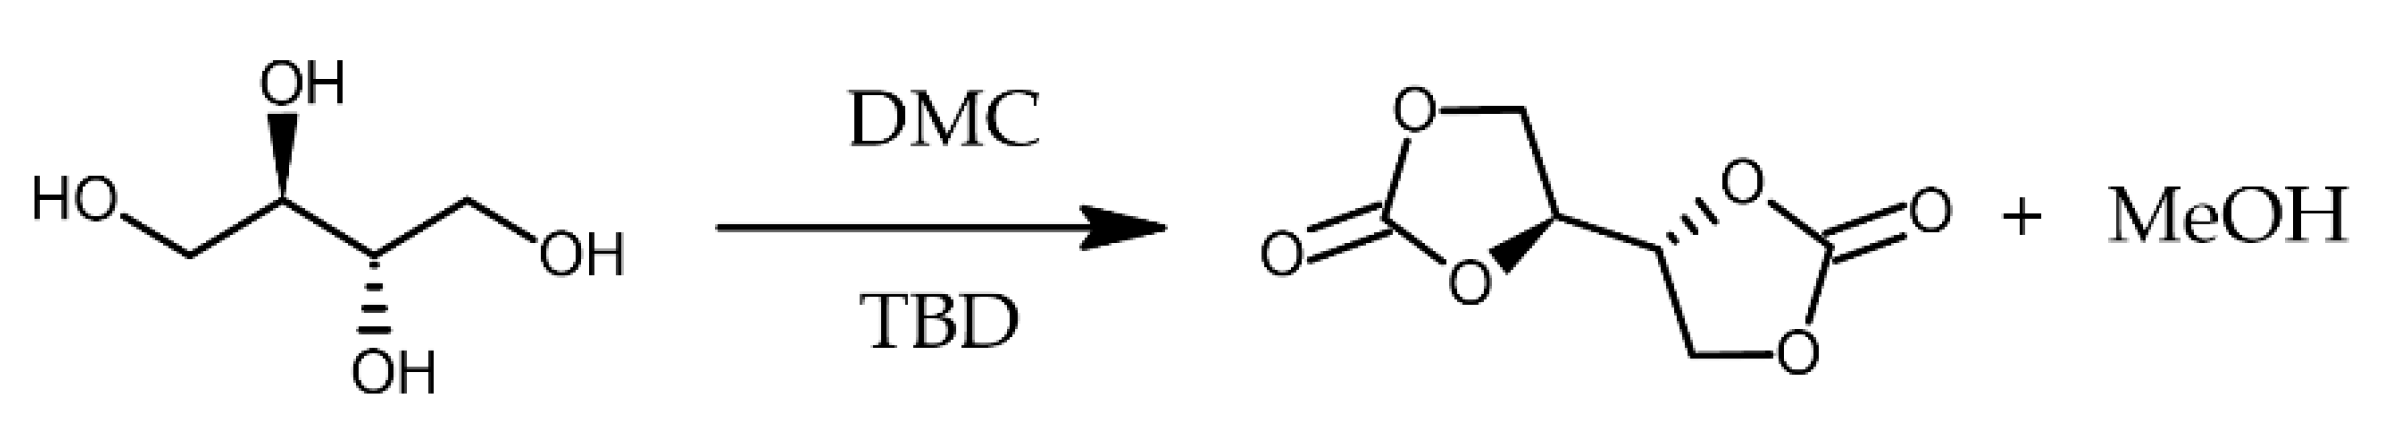

Table 1.
Teubner-Strey and Lorentz parameters as determined by the fit. Details in text.
| Sample | (nm) | (nm) | (nm) | (nm) |
|---|---|---|---|---|
| EDC-PEG-25 | 22.41±0.10 | 3.07±0.03 | 2.19±0.05 | 1.46±0.03 |
| EDC-PPO-25 | 17.50±0.03 | 3.42±0.01 | 2.26±0.06 | 1.68±0.06 |
| EDC-PEG/PPO-25 | 19.00±0.06 | 2.86±0.02 | 2.18±0.04 | 1.62±0.04 |
Table 2.
NIPU names and compositions.
| Sample name | Polyether | Amine | Polyether: Amine [wt%] |
| EDC-PEG_20 | H2N-PEG-NH2 | DADD | 20:80 |
| EDC-PEG_22.5 | H2N-PEG-NH2 | 22.5:77.5 | |
| EDC-PEG_25 | H2N-PEG-NH2 | 25:75 | |
| EDC-PEG_27,5 | H2N-PEG-NH2 | 27.5:72.5 | |
| EDC-PPO_20 | H2N-PPO-NH2 | 20:80 | |
| EDC-PPO_22.5 | H2N-PPO-NH2 | 22.5:77.5 | |
| EDC-PPO_25 | H2N-PPO-NH2 | 25:75 | |
| EDC-PPO_27.5 | H2N-PPO-NH2 | 27.5:72.5 | |
| EDC-PPO/PEG_20 | H2N-PPO/PEG-NH2 | 20:80 | |
| EDC-PPO/PEG_22.5 | H2N-PPO/PEG-NH2 | 22.5:77.5 | |
| EDC-PPO/PEG_25 | H2N-PPO/PEG-NH2 | 25:75 | |
| EDC-PPO/PEG_27.5 | H2N-PPO/PEG-NH2 | 27.5:72.5 |
Disclaimer/Publisher’s Note: The statements, opinions and data contained in all publications are solely those of the individual author(s) and contributor(s) and not of MDPI and/or the editor(s). MDPI and/or the editor(s) disclaim responsibility for any injury to people or property resulting from any ideas, methods, instructions or products referred to in the content. |
© 2025 by the authors. Licensee MDPI, Basel, Switzerland. This article is an open access article distributed under the terms and conditions of the Creative Commons Attribution (CC BY) license (http://creativecommons.org/licenses/by/4.0/).
Copyright: This open access article is published under a Creative Commons CC BY 4.0 license, which permit the free download, distribution, and reuse, provided that the author and preprint are cited in any reuse.


