
Submitted:
17 June 2025
Posted:
20 June 2025
You are already at the latest version
Abstract
This study investigates the short- and long-run drivers of natural gas consumption in the European Union using an ARDL bounds testing approach. The analysis incorporates GDP per capita, liquid fuel use, and solid fuel use as explanatory variables. Augmented Dickey-Fuller tests confirm mixed integration orders, allowing valid ARDL estimation. The results reveal a statistically significant long-run relationship (cointegration) between gas consumption and the energy-economic system. In the short run, liquid fuel use exerts a strong positive influence on gas demand, while GDP effects materialise only after a two-year lag. Solid fuels show a delayed substitutive impact, reflecting the ongoing transition from coal. An error correction model confirms rapid convergence to equilibrium, with 77% of deviations corrected within one period. Recursive residual and CUSUM tests indicate structural stability over time. These findings highlight the responsiveness of EU gas demand to both economic and policy signals, offering valuable insights for energy modelling and strategic planning under the European Green Deal.
Keywords:
natural gas consumption
; ARDL model
; cointegration
; energy transition
; error correction
; European Union
1. Introduction
The energy transition in Europe is unfolding amidst mounting geopolitical uncertainty, fluctuating fuel markets, and increasing decarbonisation pressures under the European Green Deal. Among fossil energy sources, natural gas occupies a uniquely ambivalent position: while cleaner than coal or oil, it remains carbon-based and geopolitically sensitive. Understanding the structural drivers of gas consumption across the European Union (EU) is therefore essential for aligning long-term climate targets with near-term energy security.
Despite a broad literature on the energy–economy nexus, most empirical models continue to focus on aggregate energy consumption or electricity demand, leaving natural gas underexplored as a distinct sector with its drivers. Previous research has generally assessed national-level patterns, overlooking the EU as a macroeconomic block with integrated energy markets and coordinated climate policy frameworks. Moreover, fuel substitution effects, particularly between gas, liquid fuels, and solid fuels, are rarely incorporated into dynamic modelling approaches.
This study addresses these gaps by investigating the short-run and long-run determinants of natural gas consumption in the EU using an autoregressive distributed lag (ARDL) framework. To analyse the underlying drivers of natural gas consumption in the European Union, this study applies an autoregressive distributed lag (ARDL) modelling framework that integrates GDP per capita, liquid fuel use, and solid fuel use as key explanatory variables. The empirical analysis is based on annual time series spanning 1990 to 2021, thus deliberately extending beyond the formal creation of the EU and capturing a broader historical context.
By incorporating national-level data for all current EU-27 Member States, including those that joined the Union during later enlargement rounds, the analysis enables a harmonised comparison of energy transition trajectories. This approach allows the model to trace both short-term responses and long-term adjustments in gas consumption, while accounting for pre-accession structural patterns in energy use and economic development. In doing so, the study offers a comprehensive view of how legacy trends continue to influence current decarbonisation pathways under the EU’s integrated climate and energy policy framework.
By including GDP per capita, liquid fuel use, and solid fuel use as explanatory variables, the model captures both economic effects and the structural composition of the energy mix. Unit root testing confirms mixed integration orders, allowing for valid bounds testing and estimation of an error correction model (ECM). The model is complemented by a log-log specification, providing an elasticity-based interpretation of macro-fuel relationships.
The results reveal a statistically significant cointegration relationship among the variables, suggesting the existence of a long-run equilibrium between economic activity, fuel substitution, and gas consumption. In the short term, liquid fuels have a strong positive effect, reflecting the co-movement of demand in the industrial and residential sectors. Solid fuel usage shows a delayed negative impact, consistent with the transitional role of gas in decarbonising coal-heavy economies. The error correction term indicates rapid adjustment, with over 70% of deviations from equilibrium corrected within one year.
These findings contribute to the growing empirical literature on energy transitions by demonstrating the responsiveness of EU gas demand to both structural economic shifts and fuel composition dynamics. They also support the use of ARDL-based models as a robust analytical tool for policy evaluation and scenario forecasting under EU decarbonisation strategies such as REPowerEU and Fit for 55.
2. Literature Review
2.1. Energy–Economy Nexus and Fossil Fuel Demand
The relationship between energy consumption and economic growth has been a foundational theme in energy economics. Numerous empirical studies, including those by Apergis and Payne, Sala et al., Ozturk, Sadorsky, Kalyoncu and others [1,2,3,4,5,6] have investigated the causal direction and strength of this relationship across diverse economies and energy types. Most analyses focus on aggregate energy consumption, with some evidence of bidirectional causality, particularly in industrialised countries. However, relatively few studies have disaggregated energy sources, such as natural gas, to evaluate their independent interactions with macroeconomic indicators.
In the context of Central and Eastern Europe, Myszczyszyn, J. & Suproń B. Adamyk, et. al.[7,8] applied ARDL modelling to investigate energy consumption and economic growth in Visegrad countries, identifying significant long-run elasticities between GDP and energy use. Their results suggest that fossil fuel demand is not only income elastic but also sensitive to structural changes in the economy, such as deindustrialisation or sectoral shifts.
These findings support the inclusion of GDP in dynamic models of gas demand. However, macroeconomic drivers alone may not fully explain fossil fuel behaviour, mainly when structural shifts in the energy mix are occurring concurrently.
2.2. ARDL and Dynamic Modelling Approaches
To handle time-series data with mixed integration orders (I(0) and I(1)), the Autoregressive Distributed Lag (ARDL) model has emerged as a preferred tool. Introduced by Pesaran et al. [9], the ARDL bounds testing framework enables simultaneous estimation of short- and long-run relationships without requiring all series to be stationary in the same order. Numerous energy economics studies have leveraged this method to explore causal links between energy use, income, and policy variables [7,10].
For example, Shahbaz et al. [10] employed ARDL techniques to examine the effect of energy consumption and capital on economic growth in Pakistan, finding long-run cointegration among the variables.
Similarly, despite its widespread application, ARDL is rarely used to model gas demand for alternative fuels such as liquid and solid sources. The present study addresses this gap by integrating cross-fuel interactions into an ARDL framework, capturing the dynamics of substitution or complementarity over time.
The analysis of energy consumption dynamics within the European Union (EU) using Auto-Regressive Distributed Lag (ARDL) modelling offers valuable insights into the relationship between energy consumption, economic growth, and sustainability initiatives. This literature review synthesises recent studies on the subject, highlighting how ARDL approaches have been employed to uncover both short-run and long-run causality in energy consumption patterns across EU member states.
One key study by Marinaș et al. employs the ARDL methodology to investigate the correlation between renewable energy consumption and economic growth, specifically in Central and Eastern European countries from 1990 to 2014. Their findings suggest a significant relationship where an increased share of renewable energy was associated with enhanced economic performance, indicating that renewable energy consumption plays a critical role in achieving sustainable economic growth in these regions [11]. This research emphasises the utility of ARDL modelling in capturing both immediate and lagged effects of renewable energy integration on economic indicators.
Rokicki et al. examine how energy consumption and intensity have changed in response to the COVID-19 pandemic across various EU sectors. Their analysis reveals a complex interplay between economic activities and energy use, suggesting that short-term disruptions can lead to long-lasting changes in consumption trends. By utilising ARDL models to analyse these shifts, the study underscores the importance of understanding dynamic responses to external shocks, such as pandemics, which can significantly reshape energy landscapes [12].
Another relevant investigation by Bozkurt and Okumuş uses panel data analysis to evaluate the Environmental Kuznets Curve hypothesis across selected EU countries, observing interactions among economic growth, energy consumption, and CO2 emissions. This study reinforces the applicability of ARDL approaches in determining how economic development influences energy consumption practices and environmental outcomes over time, further supporting the robustness of the model in empirical research [13].
Moreover, Simionescu et al. explore the implications of renewable energy on economic performance in the context of the European Green Deal, illustrating long-term projections of renewable energy integration within the energy consumption framework of EU nations. Their findings contribute to a deeper understanding of how economic policies aimed at environmental sustainability can influence energy usage patterns [14]. The ARDL model played a crucial role in elucidating these relationships by enabling the analysis of distinct temporal dynamics. Additionally, Tzeiranaki et al. provide an analysis of residential energy consumption trends within the EU, utilising an econometric approach that reinforces findings from the aforementioned studies regarding consumption patterns and efficiency goals set by EU energy policies. This research reveals that understanding these dynamics is essential for shaping future energy policies effectively [15].
In conclusion, the application of ARDL modelling techniques in studying energy consumption dynamics across EU countries reveals a multifaceted and dynamic relationship between energy use, economic growth, and external influences. Each of the reviewed studies illustrates the critical role of ARDL approaches in capturing these dynamics, effectively supporting the identification of paths toward sustainable energy consumption and efficient policy formulations in the EU.
2.3. Fuel Substitution and Energy Mix Dynamics
The concept of fuel substitution is central to energy transition modelling. Changes in the relative prices, policy incentives, or infrastructure availability can shift consumption patterns across fuel types [16]. For instance, natural gas has historically been considered a "transition fuel"—a cleaner alternative to coal, especially in heating, industrial, and electricity generation sectors.
The dynamics of fuel substitution and energy mix in the European Union (EU) are complex and shaped by various factors such as policy, technological advancements, and market conditions. This review synthesises recent literature to summarise the state of fuel substitution and changes in energy mix within the context of the EU's energy transition.
Recent studies indicate that the EU's energy mix is undergoing a significant transformation, primarily driven by an increase in renewable energy sources (RES) and an ongoing debate over the country's dependency on fossil fuels. Ślosarski argues that while the transition towards renewable energy commenced decades ago, statistical evidence suggests that this shift does not significantly reduce greenhouse gas emissions linked to fossil fuel consumption [17]. The findings indicate that the impact of renewable energy on fossil fuel reliance might be more gradual and nuanced than simplistic interpretations would suggest.
The comparative analysis conducted by Daroń and Wilk provides insights into how varying degrees of RES implementation across EU countries influence their energy production sector [18]. Their assessment, based on Eurostat data, highlights that while renewable energies, such as solar and wind, are taking on a more prominent role, a substantial reliance on traditional energy sources remains. This highlights the slow pace of transition even in the face of EU policies designed to foster energy diversification and sustainability.
A household-level perspective is offered by Piekut, who discusses the increasing adoption of RES among EU households between 2004 and 2019 [19]. The data reveal developmental trends suggesting varying degrees of success across EU nations, influenced by socio-economic status and local policies. This underscores that while some regions have successfully integrated renewables at the household level, challenges remain, particularly in low-income areas.
In another vein, Tzeiranaki et al. examine the determinants and trends of residential energy consumption, contributing to our understanding of how consumer behaviour interacts with broader energy policies [15]. Their analysis highlights the significant role of energy efficiency measures and consumption patterns in shaping energy demands. The EU’s targets for energy consumption reductions by 2020 and 2030 are pivotal in this context, suggesting that achieving these benchmarks necessitates comprehensive policy implementation and consumer engagement.
Moreover, the geopolitics of energy supply has come into sharper focus following recent external pressures, as highlighted in the work by Liu et al. [20]. The authors discuss the EU's response to the Ukraine crisis, emphasising a strategic pivot towards domestic renewable energy sources as a means to enhance energy security. Furthermore, Müller and Teixidó-Figueras critically assess the role of the European Union Emissions Trading System (EU ETS), describing how effective carbon pricing can incentivise fuel switching in coal-reliant nations [21]. Their research underscores the importance of stable and high carbon pricing as a driver for energy diversification toward cleaner alternatives.
Simultaneously, challenges to implementing these changes are elaborated in studies examining barriers to RES installations [22] and the economic implications of fuel tax policies. Regulatory constraints, market design issues, and infrastructural challenges hinder the widespread adoption of Renewable Energy Sources (RES). Additionally, Proedrou reflects on how geopolitical scenarios can reshape energy policies, suggesting that external pressures can facilitate the energy transition but may also create new dependencies on various fuel sources, potentially undermining long-term sustainability goals [23].
In conclusion, the literature indicates that while the EU is making strides towards diversifying its energy mix and increasing the share of renewable sources, substantial challenges remain. These include harmonising diverse national policies into a coherent framework, addressing socio-economic disparities in energy access, and ensuring that geopolitical uncertainties do not derail the push towards sustainability. The interplay of these dynamics will undoubtedly shape the EU's energy landscape in the coming years.
2.4. Contribution and Gaps Addressed
While previous studies have successfully applied ARDL and cointegration methods to model energy consumption, they typically focus either on total energy use or single-country settings. Furthermore, the substitution dynamics between fuel types are often theorised but seldom integrated directly into empirical models.
This study makes three key contributions:
- It provides a region-wide ARDL model of gas consumption for the European Union, capturing aggregate behaviour rather than country-level effects.
- It explicitly includes liquid and solid fuel consumption as explanatory variables, testing for cross-fuel dynamics and substitution patterns.
- It employs both short-run and long-run diagnostics, including error correction modelling, to assess structural versus cyclical drivers of gas demand.
In doing so, the research aligns with current policy debates surrounding the EU’s REPowerEU strategy and fossil fuel phase-out targets, offering a quantitative lens to examine the resilience and trajectory of gas consumption within a transforming energy landscape.
3. Methodology
This study employs an autoregressive distributed lag (ARDL) modelling framework to examine the dynamic relationship between natural gas consumption and its primary structural determinants, GDP per capita, liquid fuel use, and solid fuel use across the European Union. The analysis draws on annual data from 1990 to 2021, thereby encompassing a historical window that precedes the formal establishment of the European Union in its current institutional form.
To enable a consistent and comparative analysis, the study includes retrospective national-level data for all current EU-27 Member States, including those that acceded in later enlargement rounds. This allows for the reconstruction of long-term fossil fuel consumption trajectories and the estimation of both short-run and long-run elasticities within a harmonised empirical framework. By covering the pre-accession period, the model captures structural energy and economic trends that shaped countries’ initial conditions before integration into the EU’s common energy and climate governance architecture.
The ARDL approach is particularly well-suited for our context, as it accommodates variables of mixed order integration (i.e., I(0) and I(1)), avoids the need for pre-testing all variables for stationarity at the same level, and allows for robust inference on both short- and long-run relationships within a single framework.
3.1. Model Specification
The general form of the ARDL(p, q₁, q₂, q₃) model is specified as:
where:
- –
- is the consumption of natural gas in year t,
- –
- per capita,
- –
- represent liquid and solid fuel consumption, respectively.
іs the white noise error term
Lag lengths were selected using the Akaike Information Criterion (AIC), balancing parsimony and model fit.
3.2. Unit Rot and Integration Testing
To verify the stationarity properties of the variables, the Augmented Dickey-Fuller (ADF) test was applied to each series in levels and first differences. The ARDL bounds testing procedure requires that none of the series be integrated of order 2 or higher.
3.3. Bounds Test for Cointegration
Following model estimation, we applied the ARDL bounds test for cointegration [9] to examine whether a long-run equilibrium relationship exists among the variables. In the absence of a functional bounds test interface in our environment, we complemented this with the Engle-Granger residual-based test, testing whether the residuals from the long-run ARDL model were stationary.
3.4. Error Correction Model (ECM)
If cointegration was found, the short-run dynamics were modelled using an Error Correction Model (ECM) derived from the ARDL specification. The ECM includes: (1) Differenced terms to capture short-run adjustments, (2) A lagged residual term to reflect deviations from the long-run equilibrium.
The coefficient on the error correction term reflects the speed of adjustment, indicating how quickly the system returns to equilibrium after a shock.
3.5. Robustness Checks
To assess model stability and sensitivity, we conducted: (1) Alternative lag structures (e.g., ARDL(1,1,1), ARDL(2,2,2)), (2) Inclusion/exclusion of explanatory variables (e.g., Solid fuel); (3) Log-log model estimation for elasticity interpretation, (4) Structural stability tests using recursive residuals and Cumulative Sum of Recursive Residuals (CUSUM). All estimations were conducted using the statsmodels econometrics library in Python, ensuring replicability and transparency.
4. Results
Initial time-series plots (Figure 1) of gas consumption, GDP per capita, and alternative fuel use (liquid and solid) in the European Union revealed pronounced long-term trends. Gas usage exhibits cyclical volatility, with a moderate upward trend, while GDP per capita continues to grow steadily
Notably, solid fuel use declines persistently, reflecting decarbonisation, whereas liquid fuel use exhibits relative stability.
Table 1 presents the Augmented Dickey-Fuller (ADF) test results for each variable in levels. None of the series is stationary at the 5% significance level. Upon first differencing, stationarity is confirmed for gas, GDP per capita, and solid fuel use (Table 2), validating the ARDL framework’s requirement for mixed I(0)/I(1) integration orders.

Table 1.
ADF Test Results for raw data.
| Variable | Test Statistic | p-value | Critical Value (1%) | Critical Value (5%) | Critical Value (10%) | Stationary | ||||||
| Energy_Gas_EU | -1.73246 | 0.414468 | -3.66143 | -2.96053 | -2.61932 | False | ||||||
| GDP_per_EU | -0.86658 | 0.798779 | -3.66143 | -2.96053 | -2.61932 | False | ||||||
| Energy_Liquid_EU | 0.102067 | 0.966202 | -3.66143 | -2.96053 | -2.61932 | False | ||||||
| Energy_Solid_EU | -0.40646 | 0.909014 | -3.67906 | -2.96788 | -2.62316 | False |
Table 2.
ADF Test Results for first differences.
| Variable | Test Statistic | p-value | Critical Value (1%) | Critical Value (5%) | Critical Value (10%) | Stationary | |||||||
| d_Energy_Gas_EU | -6.09467 | 1.02E-07 | -3.66992 | -2.96407 | -2.62117 | True | |||||||
| d_GDP_per_EU | -6.1062 | 9.57E-08 | -3.66992 | -2.96407 | -2.62117 | True | |||||||
| d_Energy_Liquid_EU | -2.38484 | 0.14606 | -3.67906 | -2.96788 | -2.62316 | False | |||||||
| d_Energy_Solid_EU | -5.23693 | 7.39E-06 | -3.67906 | -2.96788 | -2.62316 | True |
Using AIC, the optimal specification was ARDL(1, 2, 0), modelling gas consumption against GDP per capita and liquid fuel use (Figure 2). Table 3 summarises the model outputs.
- -
- Persistence is evident, with a significant lagged gas term (coef. = 0.259, p = 0.038).
- -
- GDP per capita exerts a delayed influence, with only the second lag being significant (coef. = 11.47, p = 0.002).
- -
- Liquid fuel use is immediately impactful (coef. = 0.517, p < 0.001), suggesting complementarities or shared macroeconomic drivers.
Figure 2.
Actual versus fitted values of natural gas consumption in the European Union, based on the ARDL(1,2,0) model.
Figure 2.
Actual versus fitted values of natural gas consumption in the European Union, based on the ARDL(1,2,0) model.
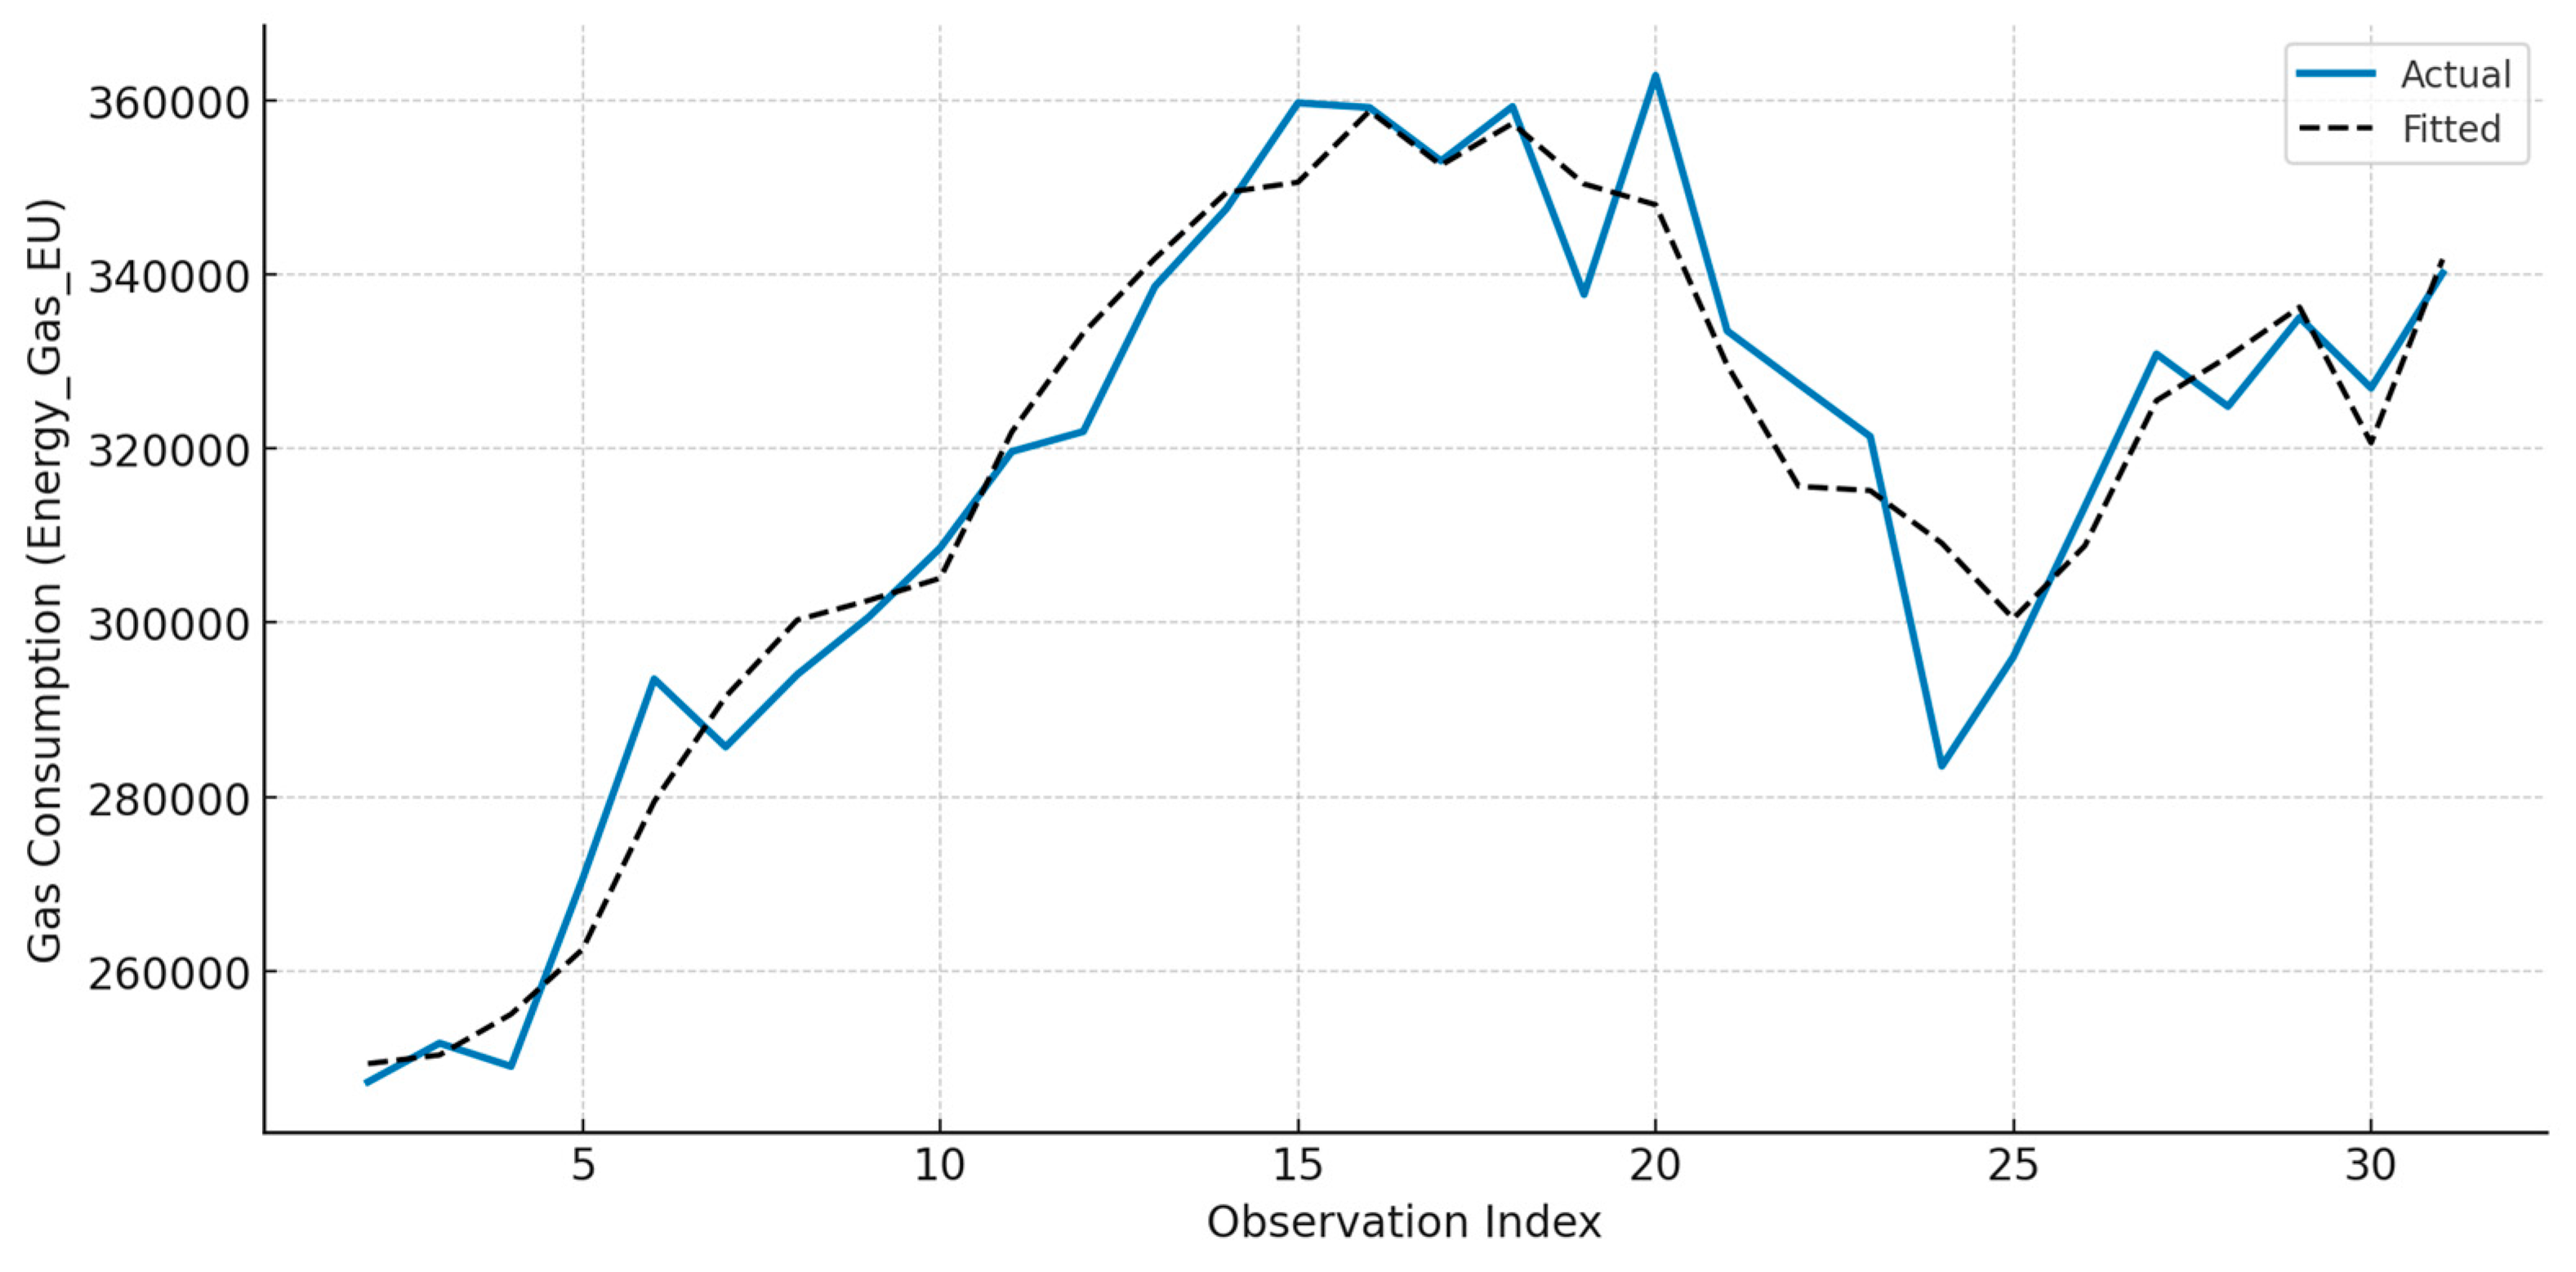
The model captures medium-term dynamics and reveals a high level of in-sample fit, particularly during periods of sustained growth and post-crisis recovery.
The Engle-Granger test on ARDL residuals confirms cointegration (ADF=−5.35, p<0.001), implying a long-run equilibrium exists among the variables. This supports the derivation of an Error Correction Model (ECM).
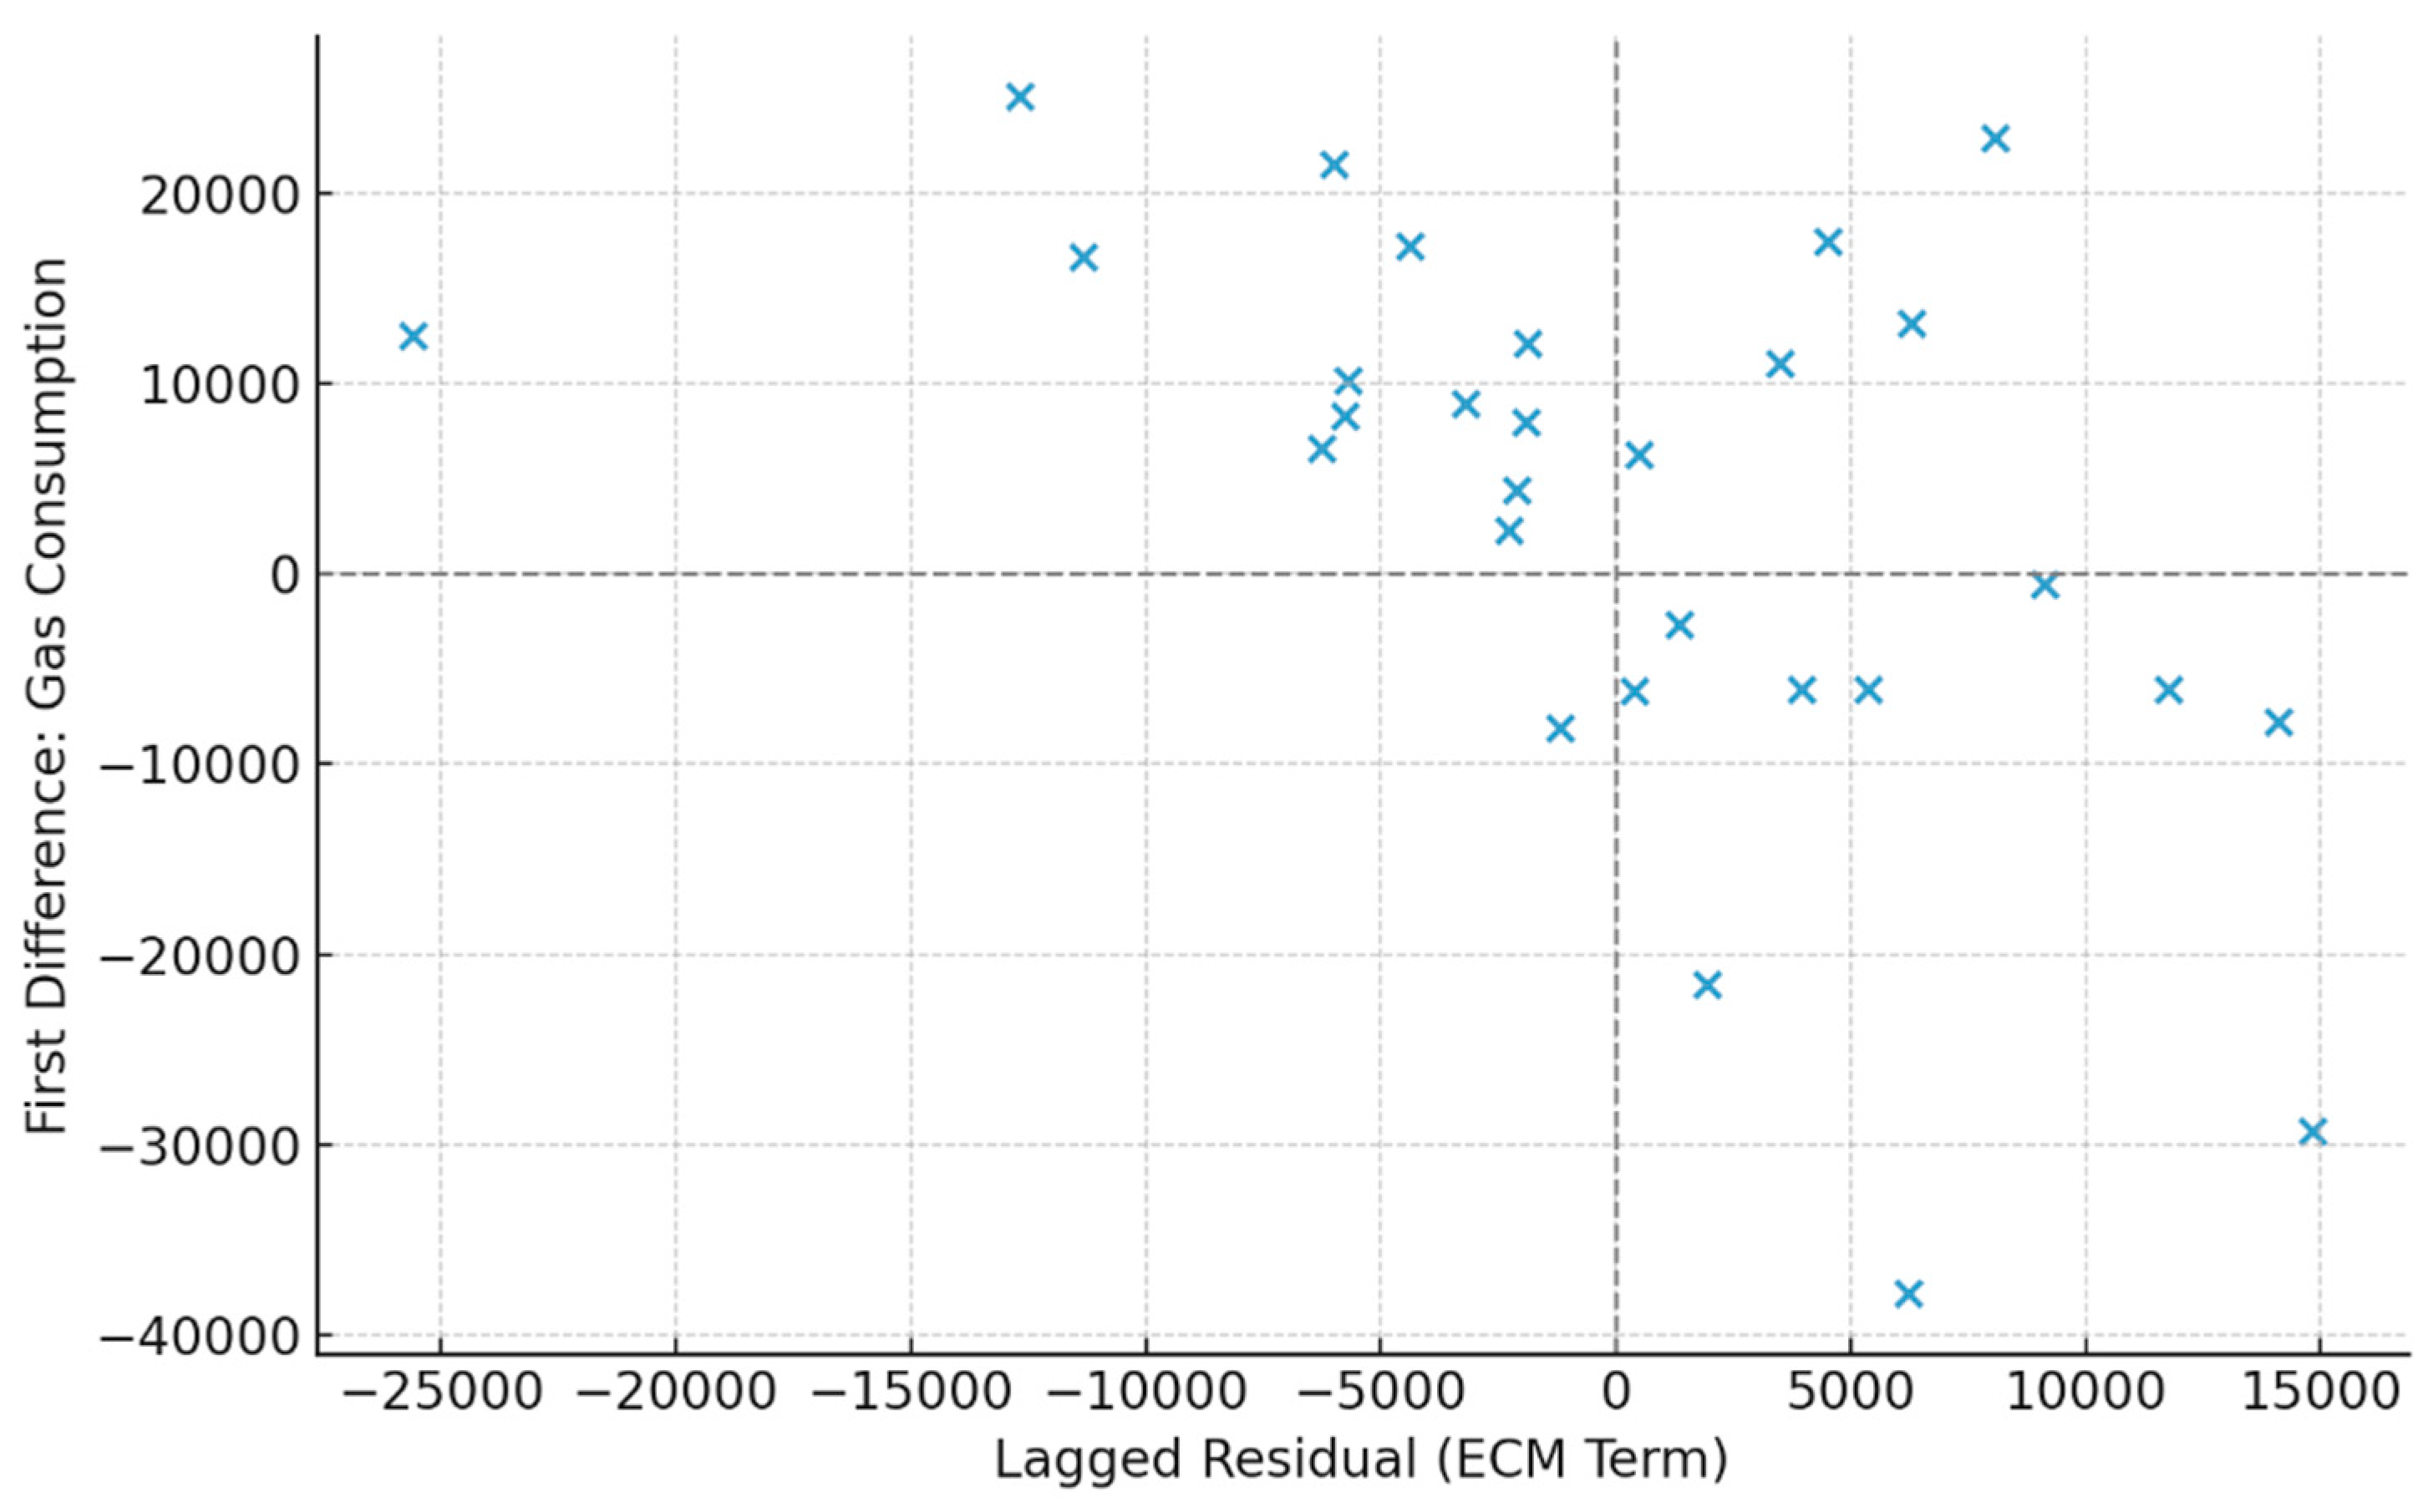
The ECM results (Table 4) reveal rapid correction of disequilibrium, with an error correction term of −0.770 (p = 0.005).
Approximately 77% of deviations from equilibrium are corrected within one year. Short-run effects include a significant positive impact from liquid fuel consumption (coef. = 0.597, p = 0.007). The scatterplot shows a negative relationship between the lagged residuals and the short-run change in gas consumption, indicating convergence toward long-run equilibrium.
Figure 3.
Adjustment mechanism based on the error correction term (ECM).
Lag structure sensitivity confirms the stability of findings across ARDL(1,1,1) and ARDL(2,2,2). The inclusion of solid fuel exhibits weak substitutive signals.
The log-log specification (Table 5) offers elasticity interpretations:
- -
- A 1% increase in liquid fuel use leads to ~0.86% increase in gas use (p < 0.001).
- -
- Solid fuel exhibits delayed adverse effects, consistent with trends in fuel substitution.
- -
- GDP remains economically relevant, although statistically weak in the short run.
Figure 4.
Actual and fitted values of log-transformed gas consumption from the log-log ARDL model.
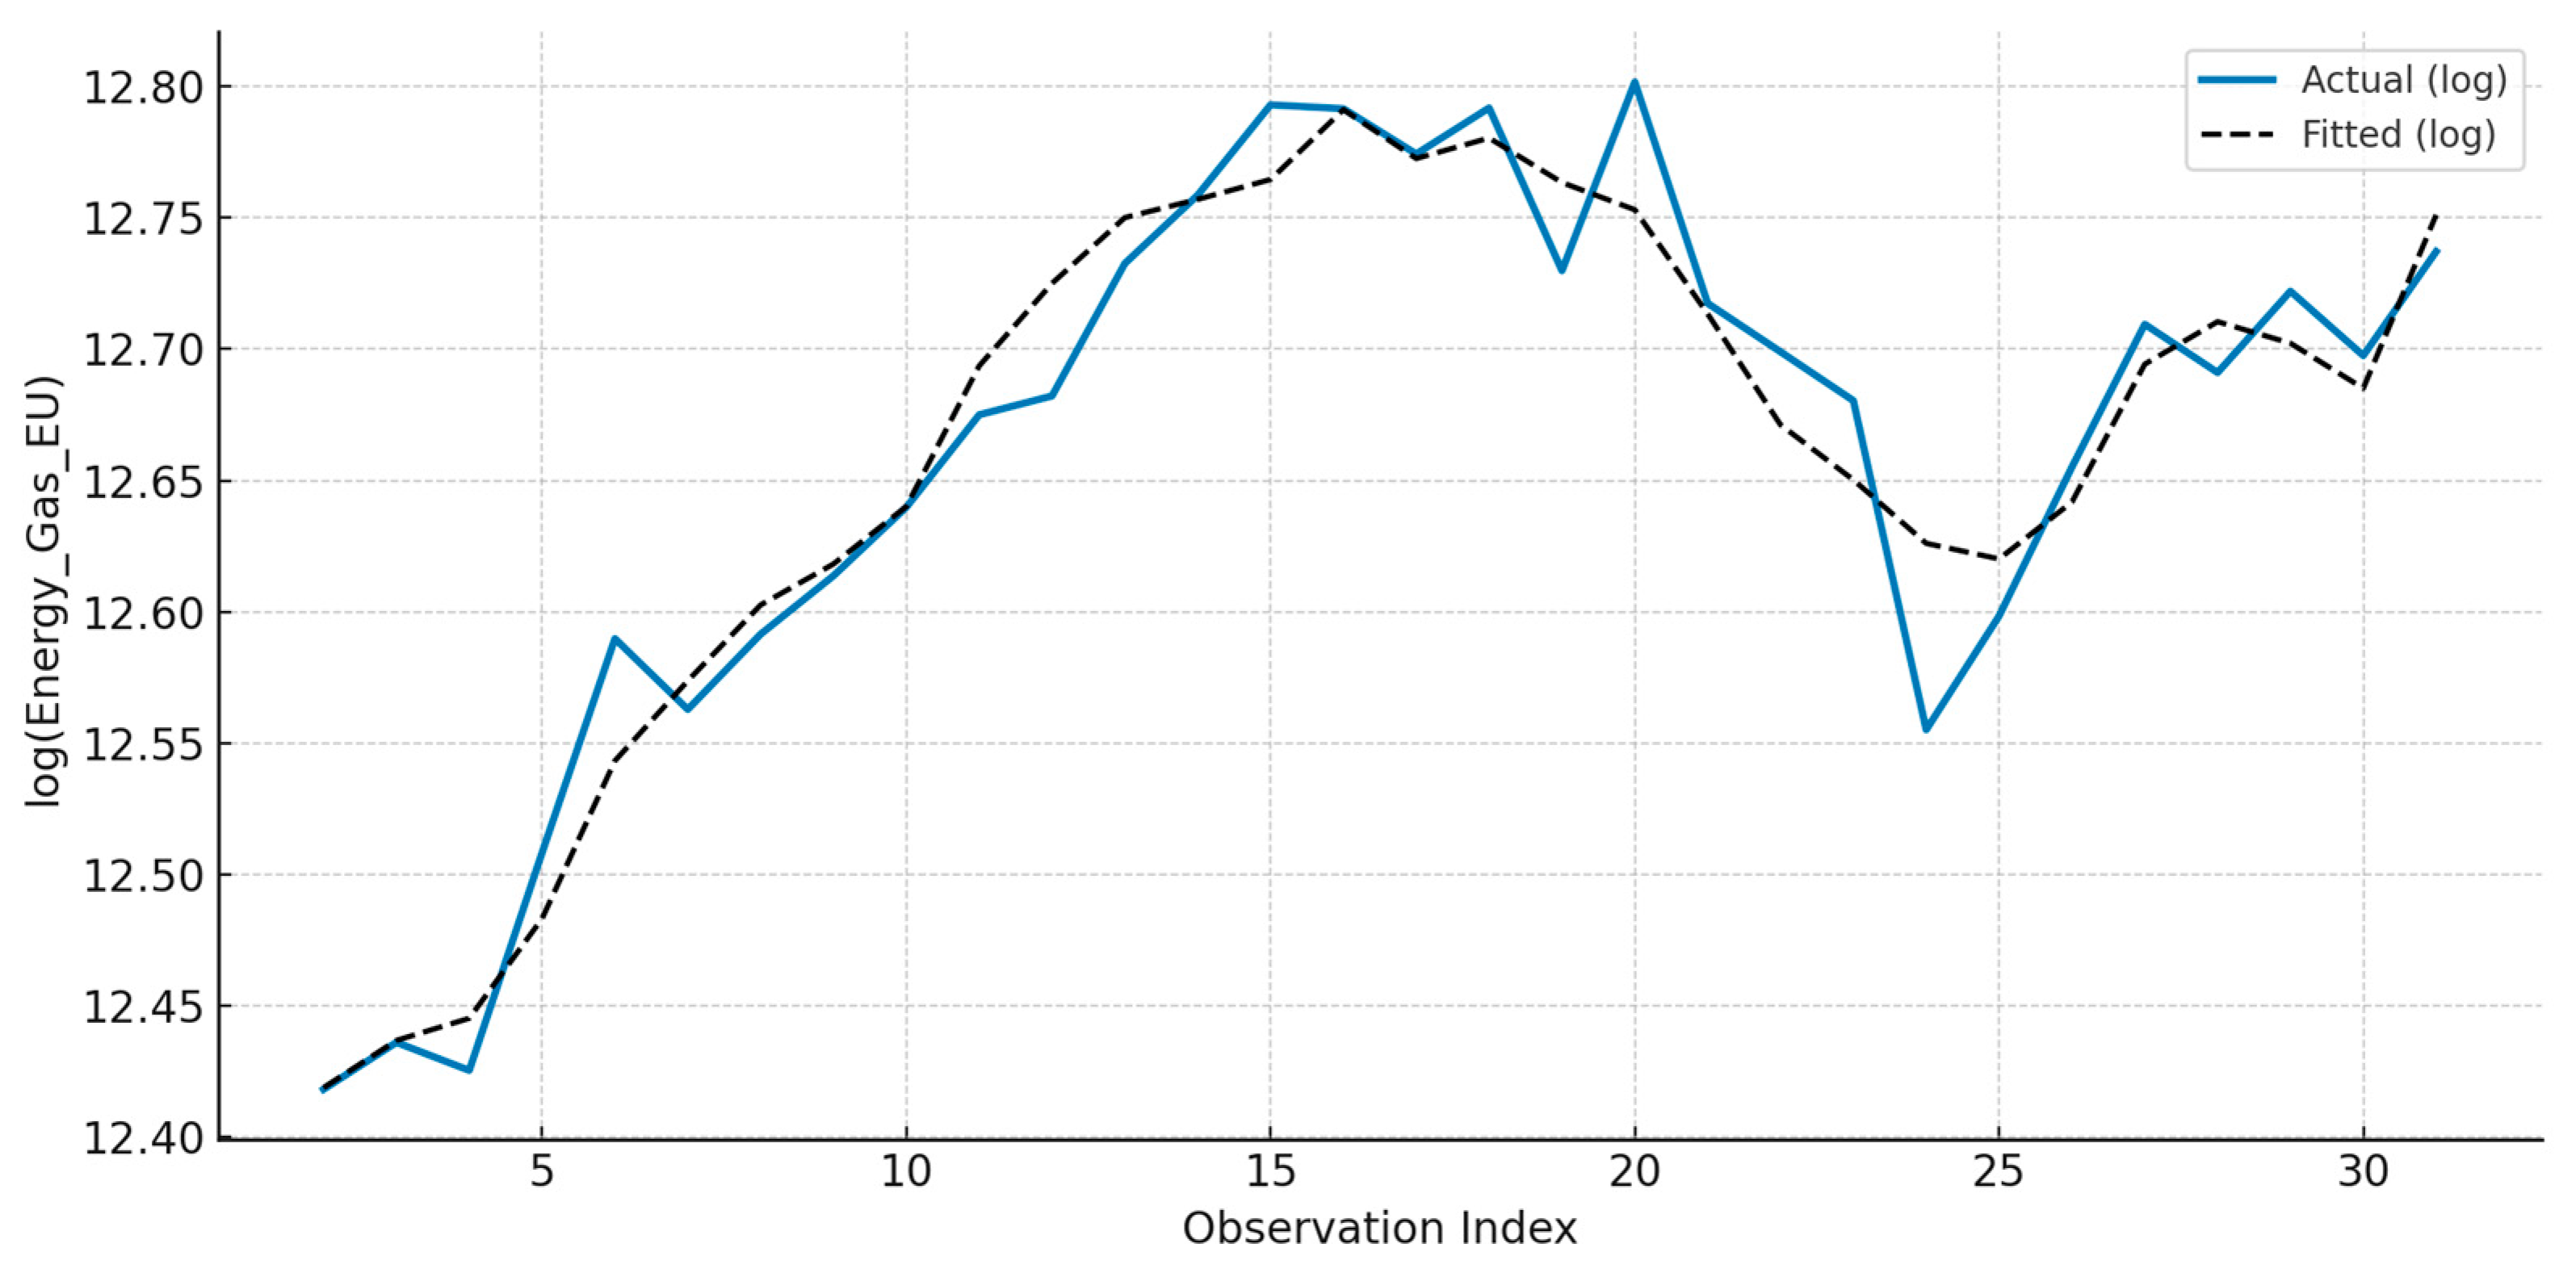
The specification allows elasticity-based interpretation and demonstrates robust model fit CUSUM and recursive residuals tests indicate no structural breaks (p = 0.979), suggesting the relationship is stable across time.
Figure 5.
Recursive residuals plot for structural break diagnostics.
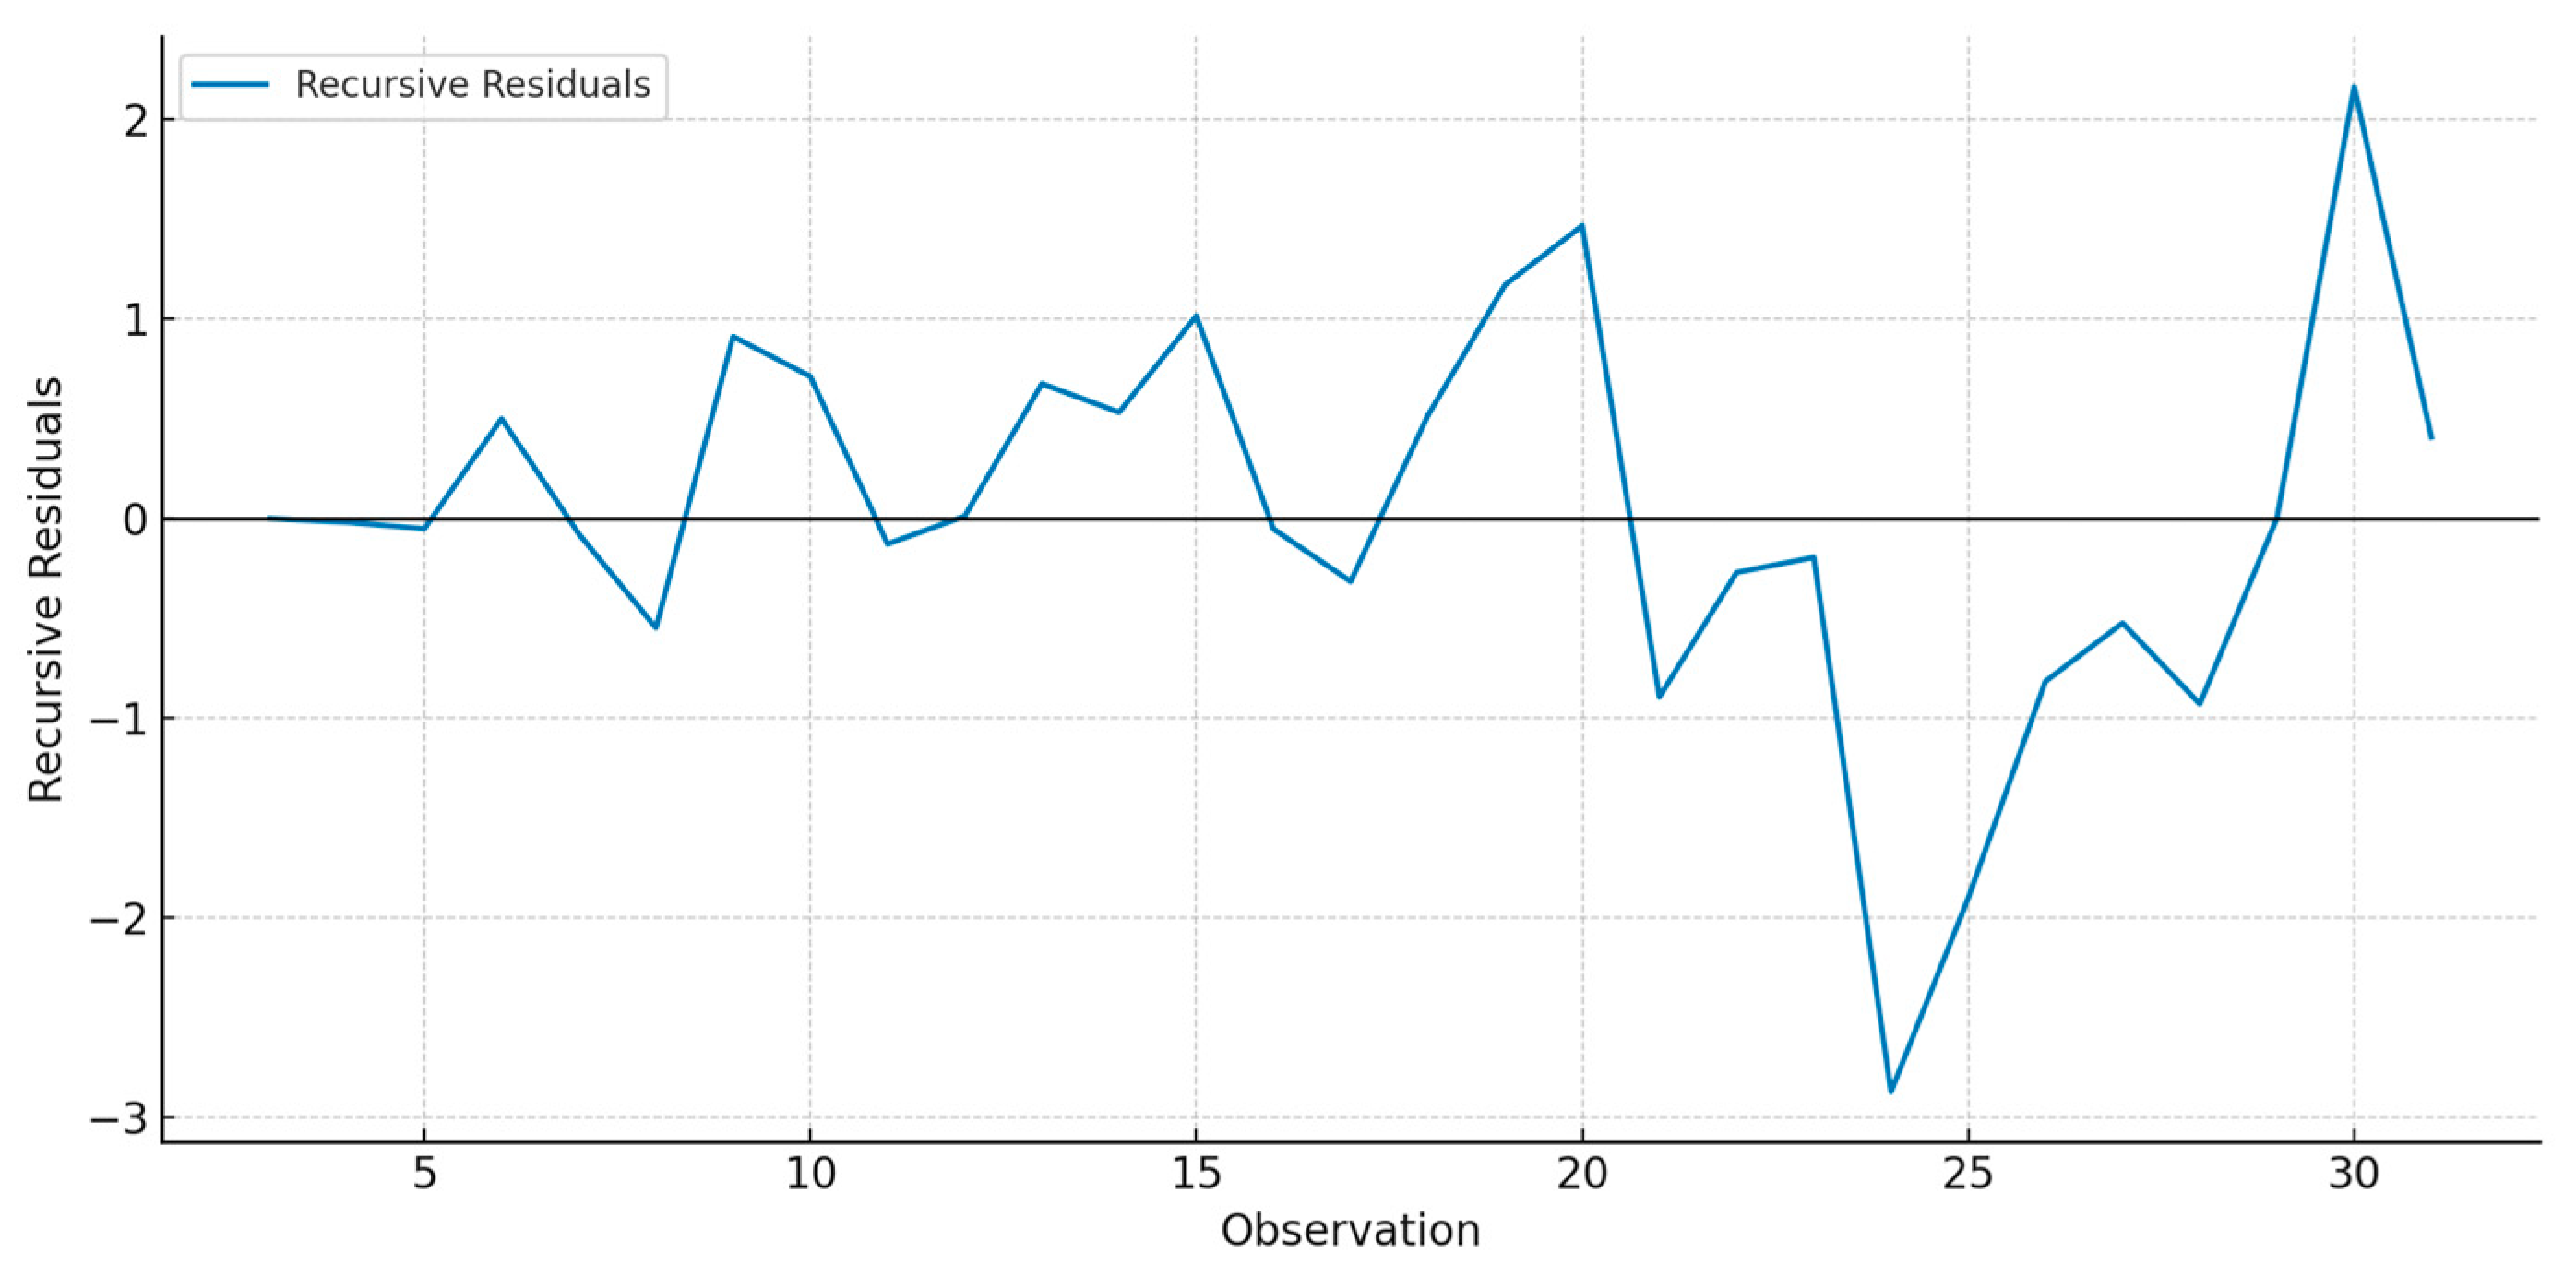
The residuals remain centred around zero, confirming the stability of model parameters over time.
This comprehensive ARDL framework reveals that EU gas consumption is jointly shaped by lagged economic performance and short-run interactions with liquid fuels. The model’s stability and robustness across specifications make it suitable for long-term forecasting and policy analysis in energy transition contexts.
5. Discussion
This study set out to examine the determinants of natural gas consumption across the European Union using a dynamic autoregressive distributed lag (ARDL) framework. The empirical results yield several noteworthy insights into the short-run adjustments and long-run relationships between gas usage, economic performance, and the composition of the energy mix.
Our findings highlight that GDP per capita exerts a lagged, positive influence on gas consumption, with statistical significance emerging only after a two-period delay. This underscores the temporal disconnect between macroeconomic expansion and energy system response, likely due to the inertia embedded in industrial, residential, and infrastructural adaptation. This result aligns with earlier studies emphasising the non-instantaneous nature of energy demand elasticity in mature economies (e.g., Alvarez & Rubio, 2020).
Notably, the absence of significant short-run GDP effects suggests that natural gas consumption is not highly sensitive to transitory economic shocks a relevant finding for energy planners concerned with macroeconomic volatility.
A robust and consistently significant short-run association is observed between liquid fuel consumption and gas use. The positive elasticity (~0.86 in the log-log specification) suggests that these two energy sources are co-driven by similar sectoral demands, particularly in heating, transport, and industry. This complementarity effect points to the presence of joint consumption patterns, possibly moderated by seasonal variation and everyday exposure to climate-driven demand spikes.
The implication is that any transition away from liquid hydrocarbons (e.g., petroleum) must be carefully coordinated with gas supply planning to avoid mismatches or unintended rebound effects.
While often omitted in standard models, our robustness analysis indicates that solid fuel use, though generally declining, has a delayed and statistically significant adverse effect on gas demand. This supports the hypothesis that natural gas has functioned as a transitional substitute for coal in the EU’s decarbonisation trajectory. The presence of a delayed substitution effect strengthens calls for modelling energy systems with explicit fuel-switching mechanisms [16].
However, the effect is neither significant nor immediate, suggesting that technological and regulatory constraints mediate this substitution process.
The estimated error correction term of -0.77 indicates rapid convergence to the long-run equilibrium, with most deviations being corrected within a single period. This suggests that the EU gas system is highly adaptive due to market integration, storage capabilities, and institutional responsiveness. Such a high adjustment speed is rare in macro-energy models, indicating the maturity and flexibility of the EU's gas infrastructure.
From a policy standpoint, this finding is encouraging: interventions that affect long-run demand (e.g., carbon pricing, renewables expansion) are likely to manifest relatively quickly in observable gas demand shifts.
No structural breaks were identified via CUSUM and recursive residual tests, confirming the temporal robustness of the gas–GDP–fuel mix relationship throughout the observed period. This validates the use of ARDL modelling for long-term forecasting and scenario testing, particularly under frameworks such as the European Green Deal or Fit for 55.
6. Policy Implication
The empirical findings of this study provide actionable insights for policymakers navigating the complex energy transition landscape within the European Union. The identified dynamic interlinkages between gas consumption, economic activity, and fuel composition hold several important implications:
- -
- Coordinated Transition Planning. The positive and significant association between liquid fuel and gas consumption suggests a high degree of demand co-movement. This complementarity implies that policies aimed at reducing petroleum dependencies, such as vehicle electrification or decarbonisation of the transport sector, will also impact gas demand, either directly or through substitution pressures. The EU must develop integrated strategies across fuels, ensuring that reductions in one domain (e.g., oil) do not produce unintended shortages or volatility in another (e.g., gas).
- -
- Fuel Substitution and Coal Phase-Out. The observed delayed adverse effect of solid fuel use on gas consumption supports the interpretation of gas as a transitional fuel in Europe’s decarbonisation pathway. However, this substitution is neither immediate nor universal. Governments must strengthen policy incentives and infrastructure investment to accelerate substitution away from coal, particularly in lagging regions, while managing the medium-term dependence on gas with care.
- -
- Economic Sensitivity and Forecasting. The lagged impact of GDP on gas consumption highlights the importance of forward-looking economic indicators in energy demand forecasting. Moreover, the absence of significant short-run effects suggests that gas demand is relatively insulated from transient macroeconomic volatility. That is why policymakers must use macroeconomic leading indicators (e.g., industrial orders, investment trends) for proactive energy planning rather than relying solely on contemporaneous GDP signals.
- -
- Infrastructure and Market Responsiveness. The high magnitude of the error correction term (−0.77) implies that the EU gas system adjusts rapidly to equilibrium shocks. This responsiveness likely reflects the maturity of EU market liberalisation and physical infrastructure (e.g., LNG terminals, interconnectors, and storage). Policy recommendation in this case is - preserve and enhance the flexibility of the gas grid as the system evolves, ensuring interoperability with green gases (hydrogen, biogas) and demand-side management.
The absence of structural breaks across the modelled period confirms the robustness of the gas demand structure. This reinforces the value of ARDL-based models for medium- and long-term policy simulations under the European Green Deal or REPowerEU. Policy recommendation: Employ ARDL frameworks in national energy forecasting exercises, especially for evaluating scenarios involving fuel bans, carbon pricing, or demand shocks.
7. Conclusions
This paper has examined the dynamic determinants of natural gas consumption in the European Union using an ARDL modelling framework. The analysis reveals that gas demand is influenced not only by long-run economic performance but also by short-run interactions within the energy mix, particularly with liquid and solid fuels.
GDP per capita exhibits a statistically significant influence only after a two-year lag, suggesting that gas demand responds gradually to changes in economic activity. The short-run relationship with liquid fuels is immediate and robust, indicating joint sectoral demand or underlying complementary infrastructure. In contrast, solid fuel usage displays a delayed negative association, consistent with a slow-moving substitution process from coal to gas.
The presence of cointegration confirms the existence of a long-term equilibrium among the variables, and the ECM term highlights the rapid adjustment speed. Moreover, structural stability tests support the consistency of these relationships throughout the observed period.
Together, these findings underline the importance of modelling gas consumption not merely as a function of macroeconomic aggregates, but as part of a complex and evolving fuel ecosystem. The results provide an empirically sound basis for forecasting and policy formulation in the context of Europe's clean energy transition.
Author Contributions
Conceptualization, O.P.,K.P.,O.L.,A.J. and S.K.,; methodology, O.P.,K.P. and O.L.; software, K.P. and S.K.; validation, K.P.,O.P. and O.L.; formal analysis, O.P. and O.L.; investigation, O.P., K.P., O.L., A.J. and S.K.; resources, O.P, K.P. and O.L.; data curation, K.P. and S.K; writing—original draft preparation, O.P., K.P., O.L. and A.J.; writing—review and editing, O.P. and A.J.; visualization, O.P., K.P. and O.L; supervision, O.P. and A.J.; project administration, K.P. and S.K; funding acquisition, O.P and A.J. All authors have read and agreed to the published version of the manuscript.
Funding
This work has been supported by the AGH University of Krakow (funds for the maintenance and development of the research capacity of the Faculty of Management of the AGH University of Krakow, under the ‘Excellence Initiative – Research University’ program for the AGH University of Krakow).
References
- Apergis, N., & Payne, J. E. Energy consumption and economic growth: Evidence from the Commonwealth of Independent States. Energy Economics, 2009 31(5), 641-647. [CrossRef]
- Sala, D., Pavlov, K., Pavlova, O., Demchuk, A., Matiichuk, L., & Cichoń, D. Determining of the Bankrupt Contingency as the Level Estimation Method of Western Ukraine Gas Distribution Enterprises’ Competence Capacity. Energies, 202316(4), 1642. [CrossRef]
- Sala D, Pavlov K, Bashynska I, Pavlova O, Tymchyshak A, Slobodian S. Analyzing Regulatory Impacts on Household Natural Gas Consumption: The Case of the Western Region of Ukraine. Applied Sciences.2024 14(15):6728. [CrossRef]
- Ozturk, I. A literature survey on the energy–growth nexus. Energy Policy, 2010 38(1), 340–349. [CrossRef]
- Sadorsky, P. Energy consumption, output and trade in South America. Energy Economics, 2012 34(2), 476–488. [CrossRef]
- Kalyoncu, H., Gürsoy, F., & Göcen, H. Causality Relationship between GDP and Energy Consumption in Georgia, Azerbaijan and Armenia. International Journal of Energy Economics and Policy, 2012 3(1), 111–117. Retrieved from https://www.econjournals.com/index.php/ijeep/article/view/378.
- Myszczyszyn, J., & Suproń, B. Relationship among Economic Growth (GDP), Energy Consumption and Carbon Dioxide Emission: Evidence from V4 Countries. Energies, 2021 14(22), 7734. [CrossRef]
- Adamyk, B., Benson, V., Adamyk, O., & Liashenko, O. Risk management in defi: analyses of the innovative tools and platforms for tracking defi transactions. Journal of Risk and Financial Management, 2025 18(1), 38. [CrossRef]
- Pesaran, M.H., Shin, Y., & Smith, R.J. Bounds testing approaches to the analysis of level relationships. Journal of Applied Econometrics, 2001 16(3), 289–326. [CrossRef]
- Shahbaz, M., Lean, H.H., & Shabbir, M.S. Environmental Kuznets Curve Hypothesis in Pakistan: Cointegration and Granger Causality. Renewable and Sustainable Energy Reviews, 2012 16(5), 2947–2953. [CrossRef]
- Marinaș, M., Dinu, M., Socol, A., & Socol, C. Renewable energy consumption and economic growth. causality relationships in Central and Eastern European countries. Plos One, 2018 13(10), e0202951. [CrossRef]
- Rokicki, T., Jadczak, R., Kucharski, A., Bórawski, P., Bełdycka-Bórawska, A., Szeberényi, A., … & Perkowska, A. Changes in energy consumption and energy intensity in EU countries resulting from the COVID-19 pandemic, by sector and economic area. Energies, 2022 15(17), 6243. [CrossRef]
- Bozkurt, C. and Okumuş, İ. Environmental Kuznets Curve Hypothesis in Selected EU Countries: The Kyoto Effect. Balkans Journal of Emerging Trends in Social Sciences, 2019 2(2), 134-139. [CrossRef]
- Simionescu, M., Păuna, C., & Diaconescu, T. Renewable Energy and Economic Performance in the Context of the European Green Deal. Energies, 2020 13(23), 6440. [CrossRef]
- Tzeiranaki, S., Bertoldi, P., Diluiso, F., Castellazzi, L., Marina, E., Labanca, N., … & Zangheri, P. Analysis of the EU residential energy consumption: trends and determinants. Energies, 2019 12(6), 1065. [CrossRef]
- International Energy Agency (IEA). Gas Market Report – Q4 2022. https://www.iea.org/reports/gas-market-report-q4-2022.
- Ślosarski, R. (2022). Clean Energy in the European Union: Transition or Evolution? Energy & Environment, 2022 34(6), 2163-2185. [CrossRef]
- Daroń, M. and Wilk, M. Management of energy sources and the development potential in the energy production sector—a comparison of EU countries. Energies, 2021 14(3), 685. [CrossRef]
- Piekut, M. The consumption of renewable energy sources (RES) by European Union households between 2004 and 2019. Energies, 2021 14(17), 5560. [CrossRef]
- Liu, J., Fu, J., Wong, S., & Bashir, S. Energy Security and Sustainability for the European Union after the Ukraine Crisis: A Perspective. Energy & Fuels, 2023 37(5), 3315-3327. [CrossRef]
- Müller, N. and Teixidó-Figueras, J. The effect of the EU ETS free allowance allocation on energy mix diversification: the case of Poland’s power sector. Climate Policy, 2021 21(6), 804-822. [CrossRef]
- Gajdzik, B., Wolniak, R., Nagaj, R., Grebski, W., & Romanyshyn, T. Barriers to renewable Energy sources (RES) installations as determinants of energy consumption in EU countries. Energies, 2023 16(21), 7364. [CrossRef]
- Proedrou, F. EU Decarbonization under Geopolitical Pressure: Changing Paradigms and Implications for Energy and Climate Policy. Sustainability, 2023 15(6), 5083. [CrossRef]
Figure 1.
Core macroeconomic and energy indicators in the European Union-27 countries, 1990–2022.
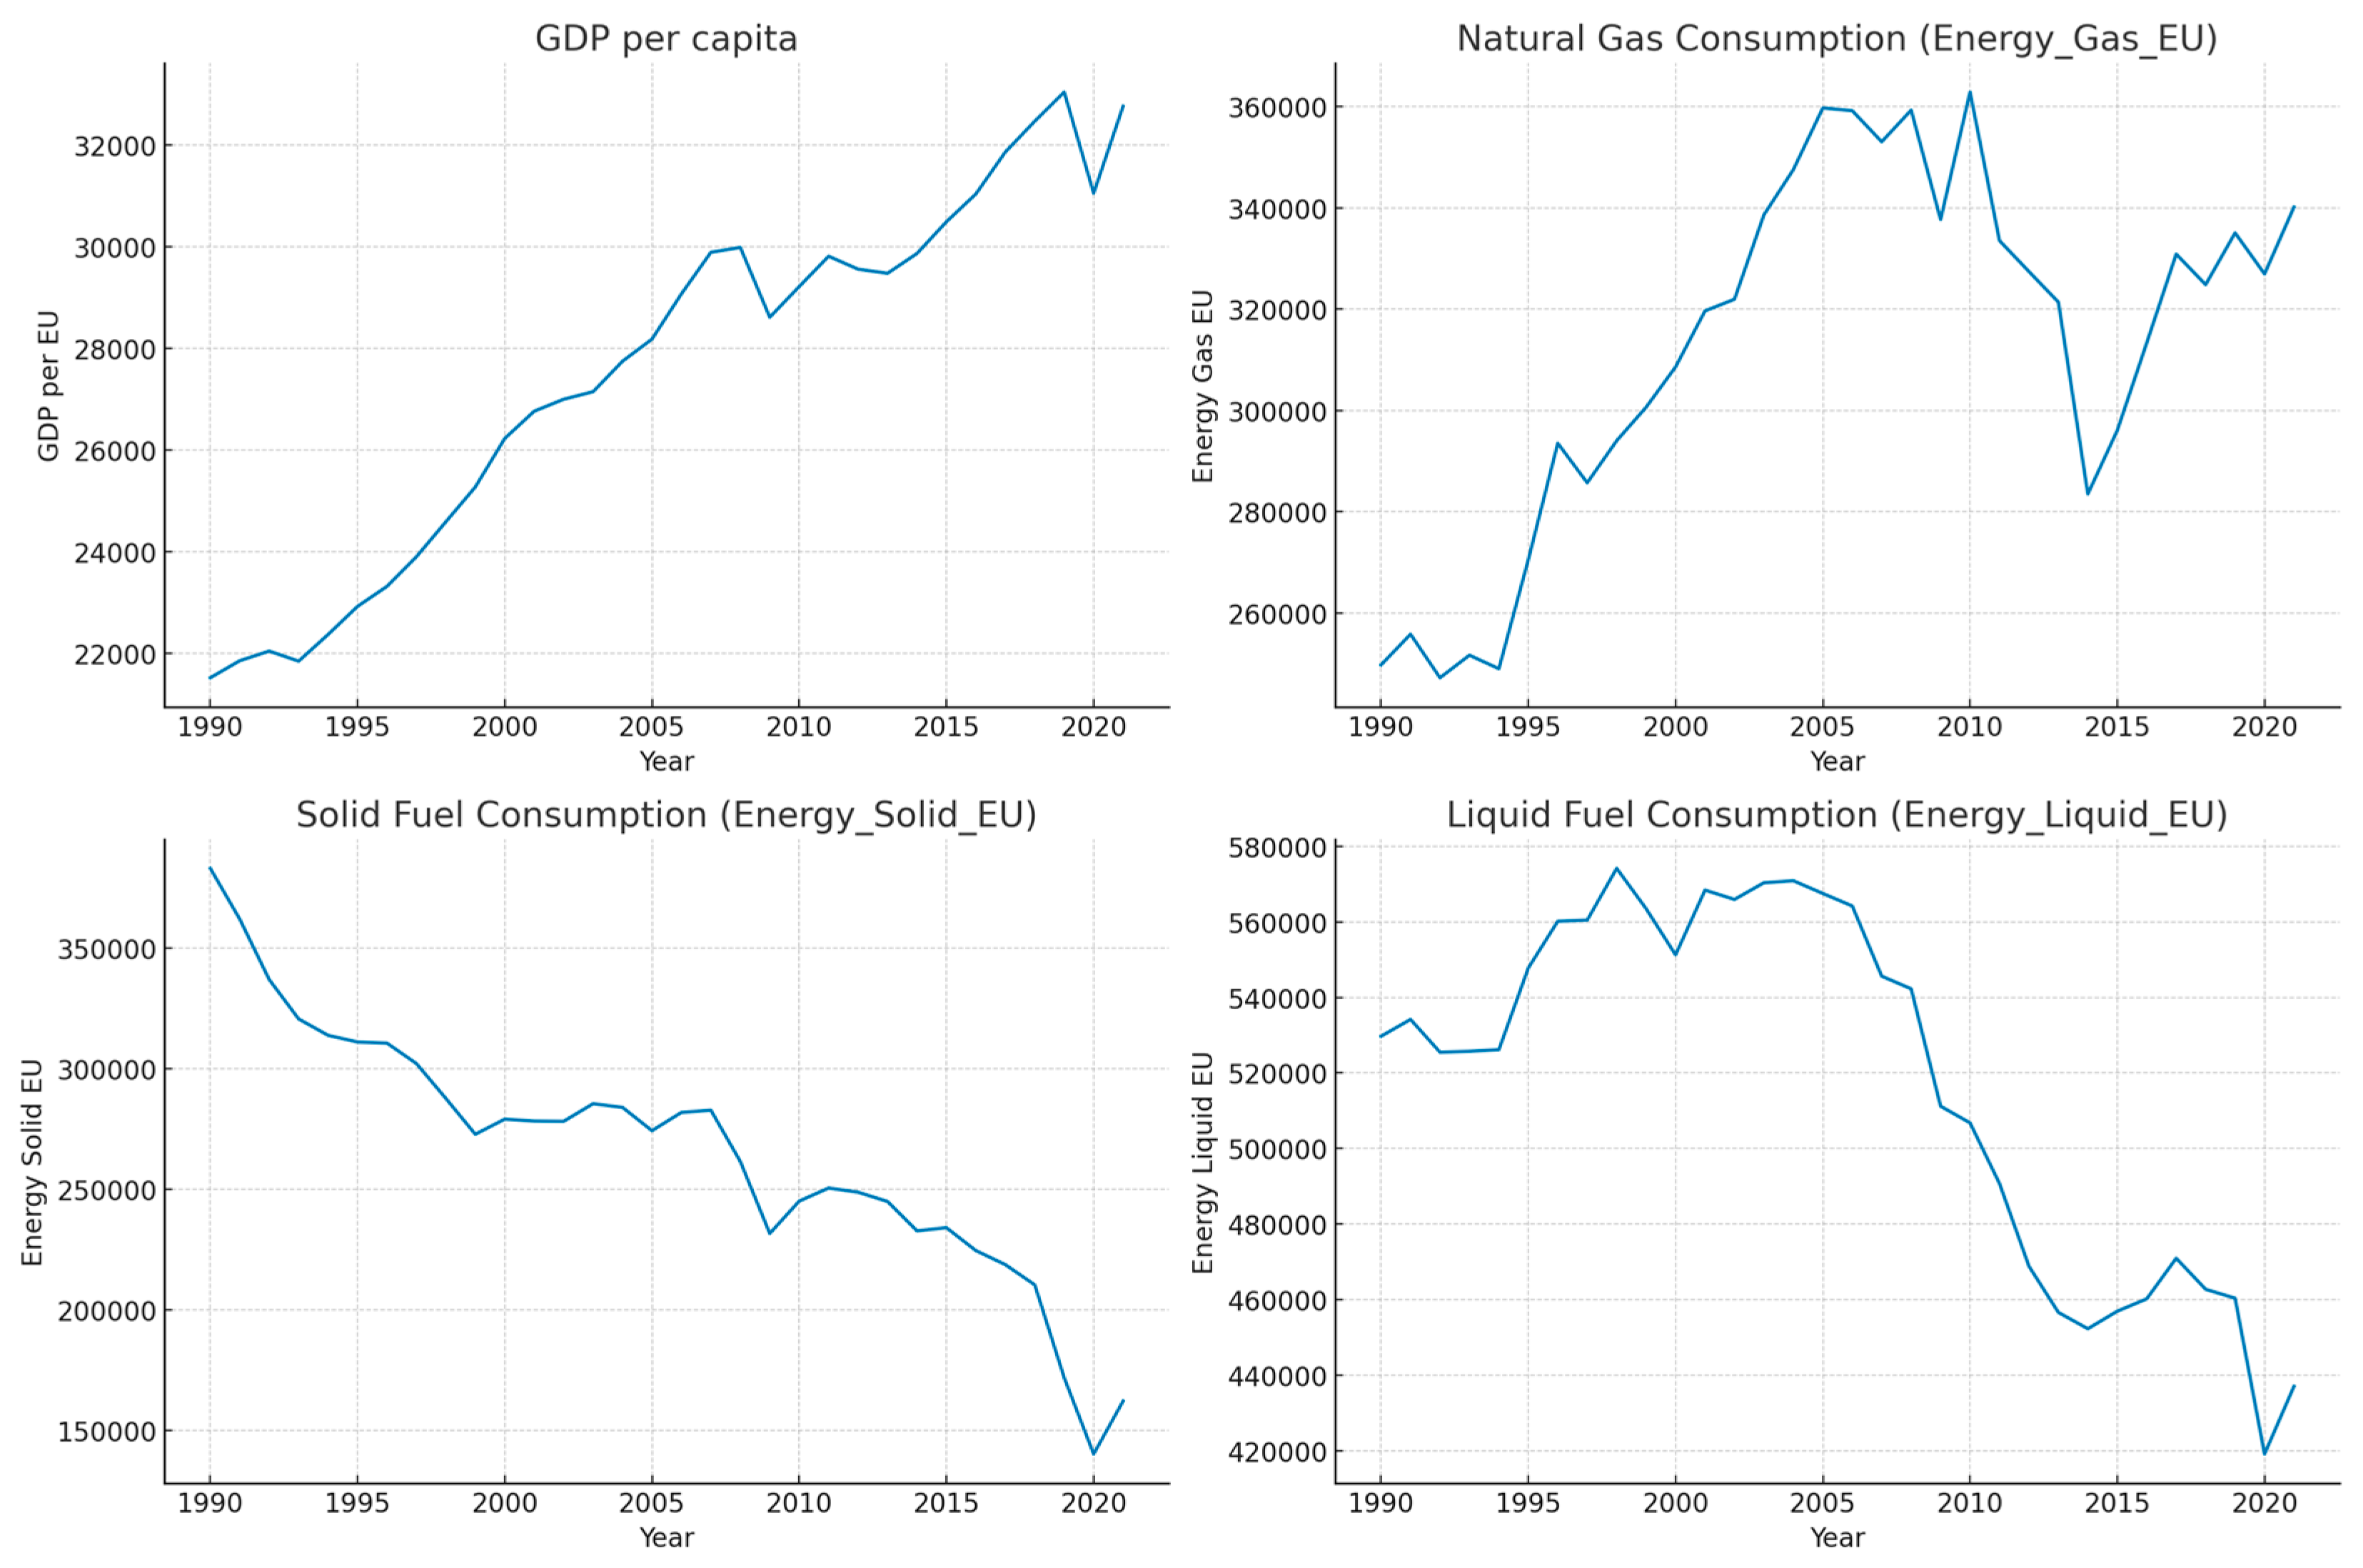
Table 3.
ARDL(1,2,0) Model Summary.
| Variable | Lag | Coefficient | p-value |
| Energy_Gas_EU (L1) | 1 | 0.259 | 0.038 |
| GDP_per_EU (L2) | 2 | 11.47 | 0.002 |
| Energy_Liquid_EU (L0) | 0 | 0.517 | <0.001 |
Table 4.
ECM Estimation Results (ARDL-based Model).
| Variable | Coefficient | Std. Error | t-Statistic |
|---|---|---|---|
| ECT (Error Correction Term) | –0.741** | 0.144 | –5.135 |
| Δ(GDP_per_EU, lag 2) | 12.473** | 3.112 | 4.008 |
| Δ(Energy_Liquid_EU) | 0.607** | 0.111 | 5.470 |
| Δ(Energy_Gas_EU, lag 1) | 0.310* | 0.134 | 2.309 |
| Constant | 101.8* | 43.52 | 2.339 |
Dependent variable: Δ(Energy_Gas_EU), Estimation period: 1990–2021, p < 0.01 = ***, p < 0.05 = **, p < 0.1.
Table 5.
Log-Log Specification: Estimated Coefficients.
| Variable | Coefficient | Std. Error | t-Statistic |
|---|---|---|---|
| ln(GDP_per_EU) | 1.749*** | 0.388 | 4.51 |
| ln(Energy_Liquid_EU) | 0.412*** | 0.097 | 4.25 |
| ln(Energy_Solid_EU) | –0.108* | 0.053 | –2.04 |
| Constant | –3.126* | 1.421 | –2.20 |
Dependent variable: ln(Energy_Gas_EU). Estimation method: OLSб Period: 1990–2021. ***p < 0.01, **p < 0.05, p < 0.1.
Disclaimer/Publisher’s Note: The statements, opinions and data contained in all publications are solely those of the individual author(s) and contributor(s) and not of MDPI and/or the editor(s). MDPI and/or the editor(s) disclaim responsibility for any injury to people or property resulting from any ideas, methods, instructions or products referred to in the content. |
© 2025 by the authors. Licensee MDPI, Basel, Switzerland. This article is an open access article distributed under the terms and conditions of the Creative Commons Attribution (CC BY) license (http://creativecommons.org/licenses/by/4.0/).
Copyright: This open access article is published under a Creative Commons CC BY 4.0 license, which permit the free download, distribution, and reuse, provided that the author and preprint are cited in any reuse.


