
Submitted:
12 June 2025
Posted:
21 June 2025
You are already at the latest version
Abstract
The aim of this study is to investigate the effects of adding game effects (multidimensionality) to the traditional dual n-back game to determine whether working memory increases or stays the same and which version is more qualitatively enjoyable. A sample of 13 adults was collected between the ages of 25-60 (53% female and 47% male; 5 White, 3 Asian-American, 1 Asian, and 4 Indian). Participants played either the original or our version of the dual-n-back game, switching to the other after 10 days. Throughout the 15 day study, they filled out three surveys at different time points that detailed their enjoyment and opinions. Our results show that our gamified version was more qualitatively enjoyable and on par with the traditional dual-n-back game in terms of accuracy and reaction time except when switching platforms. Participants who played the gamified version first were able to adjust faster to the traditional game, as the traditional game had a lesser cognitive load than our gamified version.
Keywords:
gamification
; working memory
; cognitive training game
; dopaminergic
; dual N-back task
; mesocorticolimbic
1. Introduction
Working memory is the cognitive process that retains short-term memory through the use of focus and attention. It utilizes the prefrontal cortex as an executive hub to distribute information to different areas of the brain (Funahashi, 2017) based on the type of working memory: the occipital lobe for object awareness, known as visuospatial [1]; Broca’s and Wernicke’s areas for verbal memory, known as Phonological loop [2]; and the parietal lobe for processing, called episodic buffer [3]. Information in all three of these types of working memory also passes through the attention controller before diverting into their respective processes [4], thus showing the prefrontal cortex’s crucial function as the main task encoder for working memory [5].
Working memory deficits have been linked to various neurological conditions, including schizophrenia, major depressive disorder, bipolar affective disorder, generalized/social anxiety disorder, dyslexia, ADHD, and developmental dyscalculia [6,7] Working memory deficits have demonstrated a correlation with reading difficulties [8], decision-making [9], and poor academic performance [10]. Decreased working memory has been shown to be associated with gambling and gaming disorders, and working memory training has been suggested as a form of treatment [11].
Working memory training has also been shown to affect the function and structure of the brain. Improved performance in working memory assessments has been linked to increased functional connectivity in the default mode network, which is the brain’s resting state [12].
Dual n-back training has been demonstrated to improve functional connectivity, which further strengthens working memory [12]. An n-back task is a performance test that utilizes visuospatial working memory. The task requires participants to recall information from a certain stimulus previously shown to them. More specifically, participants must recall a stimulus shown to them n-sequences-ago, or “n-stimuli-back”, where “n” is any integer greater than 0. A dual-n-back task involves the usage of two stimuli, which are often different senses or characteristics. The dual-n-back task increases cognitive complexity by adding additional stimuli [13].
It has been heavily debated whether or not the dual n-back task is a viable process to train and improve working memory. Various neuroimaging studies have demonstrated the activation of frontal and parietal cortical regions, both of which are involved in working memory. Dual n-back has also been demonstrated to improve functional connectivity, which further strengthens working memory [12,14]. However, despite neuroimaging demonstrating the potential of dual n-back, some experimental studies have shown failures in dual n-back’s ability to improve working memory [15]. A significant limitation of the traditional n-back task is the lack of participant engagement, which potentially affects motivation and task performance. This downside may undermine the very cognitive benefits the task is supposed to produce.
To address the shortcomings of traditional dual n-back tasks, in our study, we propose a gamified version of dual n-back that leverages the dopaminergic system to boost improvements to working memory. This version not only retains the cognitive demands of the traditional model but also introduces game-based elements to activate reward pathways, enhance motivation, and support working memory performance.
Gamification is hypothesized to independently increase both engagement and working memory. Gamification has already been observed to increase working memory improvements in other working memory tasks [16]. Further, game elements (e.g. progress bars, video game music, colorful buttons, etc.) are assumed to increase engagement in a task, bolstering the standard retention of n-back users. The usage of reward systems in video games has also been shown to significantly boost motivation and engagement [16]. Although there have been mixed results with gamification’s direct impact on the working memory network, the impacts on both qualitative engagement and the activation of the dopaminergic system are clear and significant [17]. Besides increasing engagement and working memory, researchers have noted the use of gamification to optimize performance that may be hindered by test anxiety [18]. Video games specifically have been noted to encourage task-directed behavior [19]. Recent research indicates that habitual video game players exhibit enhanced cognitive functions compared to non-gamers [20]. One such mechanism that is thought to underlie these enhanced cognitive functions is the dopaminergic system.
The dopaminergic system is a network of pathways that involves the production, modulation, and release of the neurotransmitter dopamine. This chemical messenger is responsible for pleasure and reward sensations, and it affects learning, motivation, memory, and attention [21]. Specifically, the mesocorticolimbic system within the dopaminergic system is responsible for the relationship between executive functions and pleasure with respect to dopamine [22]. Dopamine flows from the ventral tegmental area through two pathways: to the prefrontal cortex through the mesocortical pathway, which controls executive functions such as attention and working memory [23], and to the ventral striatum, which controls motivation and reinforcement learning [24].
Our pilot study aims to transform the ordinary dual-n-back task into an intriguing, personalized, and rewards-based game. Participants often complain that n-back and dual-n-back tasks are boring and mundane, which can disincentivize them to train their memory and cognition [25]. Thus, it is hypothesized that an increase in engagement during these cognitive tasks, via its gamification to trigger increased activity of the mesocorticolimbic system, will further increase working memory.
2. Methods
2.1. Data Collection
The pilot study contained 13 participants aged 25-60 years who fully completed the study. From these 13 participants, 53% were female and 47% were male. 23% of participants were in their 20s, 23% were in their 30s, 15% were in their 40s, and 39% were in their 50’s. Additionally, the study had 5 White, 3 Asian-American, 1 Asian, and 4 Indian participants that were all right handed. Participants initially submitted a self-reporting demographic form hosted on a HIPAA-compliant platform to confirm their eligibility before fully consenting to the study, which included questions about other common demographic information and prior experience with online games, gauged on a scale from 1-10. Important criteria besides the appropriate age were the absence of a mental disability and color-blindness.
2.2. Game Design
2.2.1. User Interface
In order to create a multidimensional game, we incorporated different genres, or different sets of images that the participant could handpick according to their interests. The six genres included were colored shapes, cars, electronics, clothes, food, and sports. The n-back task itself was just shapes in comparison. Furthermore, the user interface of the game versus the task varied greatly. The default game interface had a wider range of colors between green and teal, favicons on the sidebar, and was more aesthetically pleasing compared to the task, which was completely grey, blue, and white. Both platforms offered a support tab, performance tab, settings tab, and a log-out tab, with the exception of a store tab, coin counter, and day-by-day progress bar for the game, as shown in the screenshot below (Figure 1).
2.2.2. Reward System Game Design
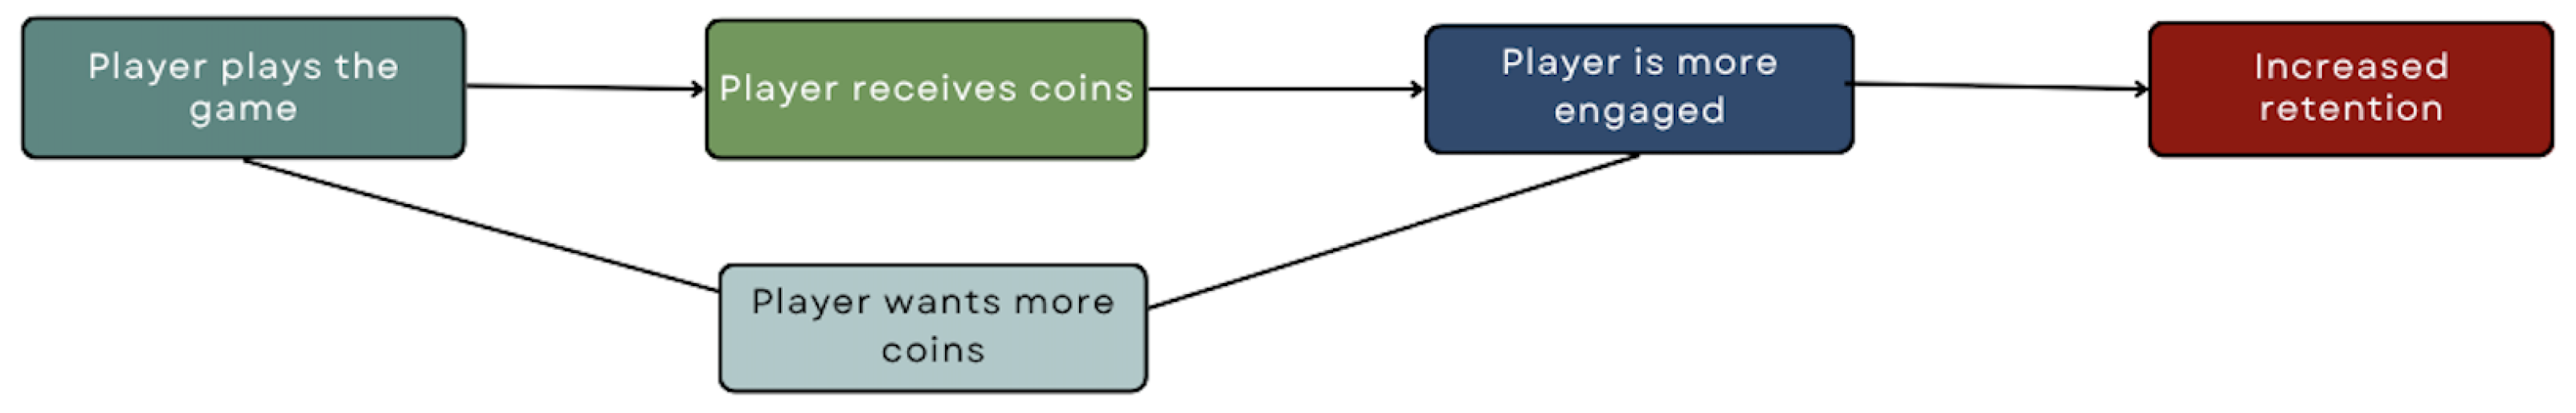
The store served as a way to encourage more playing time for participants by offering different colored themes, such as a sunset theme, blue theme, neon theme, and purple theme. In order to obtain the themes, participants used coins earned from playing the game. For every game you played, participants earned 100 coins. This method was used to enhance concentration, memory consolidation, and motivation, which increases retention while also evoking positive feelings [26].
Prior research has demonstrated that these types of reward systems can be used to significantly improve adherence among adolescents. Participants in a gamified version of the training are more likely to complete more training sessions compared to participants in non-gamified conditions, even though cognitive results were consistent among both groups. This suggests that though the reward system may not be directly responsible for increased accuracy or reaction time, it plays a crucial role in sustaining participant engagement [27].
We also developed a novel interactive element that we named “Brain Evolution,” which allowed participants to grow a brain from an embryo to age 20 and above. The more a participant played the game, the faster the brain grew. The development of the brain started as an image of an embryo, and as the user played for larger amounts of time, the embryo image would be replaced with a more developed embryo, and onwards to an aging brain of 50 years old and above. Under every new image of the brain was a fun fact about the corresponding stage in development, creating an educational element, as shown in Figure 2 below.
Figure 2.
The Brain Evolution page, based on the image above, the brain is 20 years old as a result of continuously playing the game for the entirety of the study. In the figure, there is an educational element in addition to the evolving brain that is in the form of a flashcard, which educates participants about the brain’s anatomy.
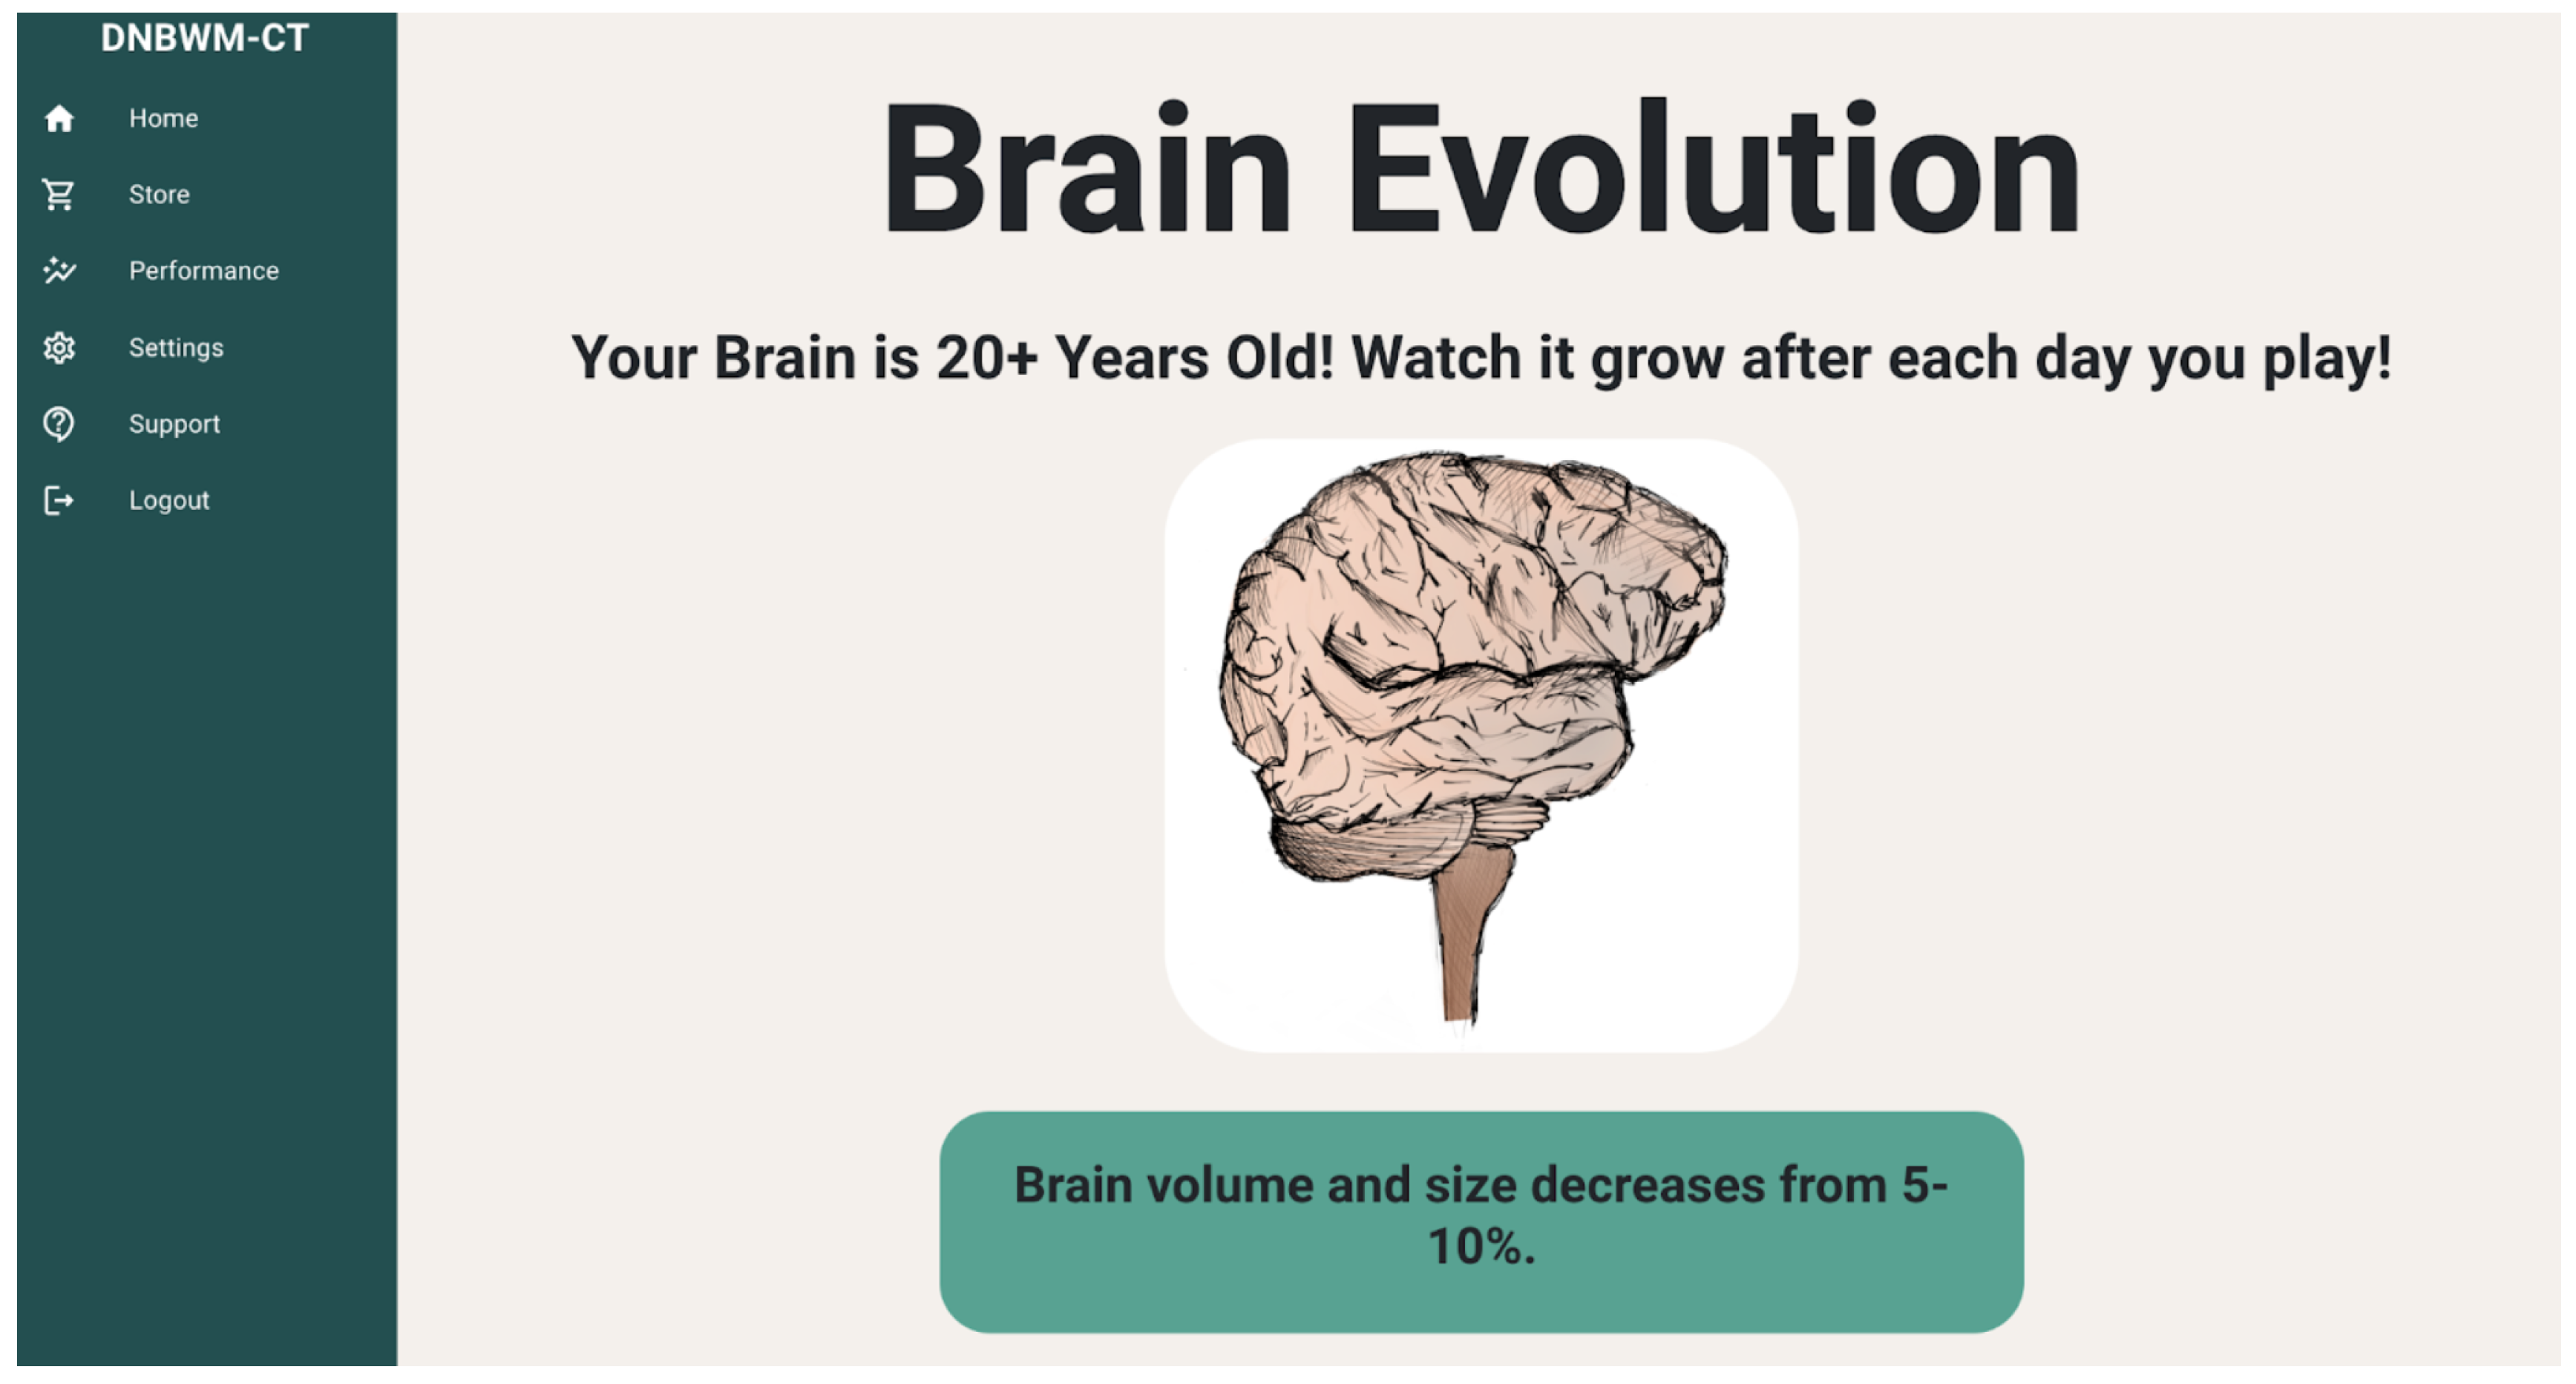
Figure 3.
The illustration of the reward system. As the player continues playing and accumulating coins, the player becomes more engaged in playing continuously to acquire more points, thus creating a reward loop.
Figure 3.
The illustration of the reward system. As the player continues playing and accumulating coins, the player becomes more engaged in playing continuously to acquire more points, thus creating a reward loop.
2.3. Technology Architecture
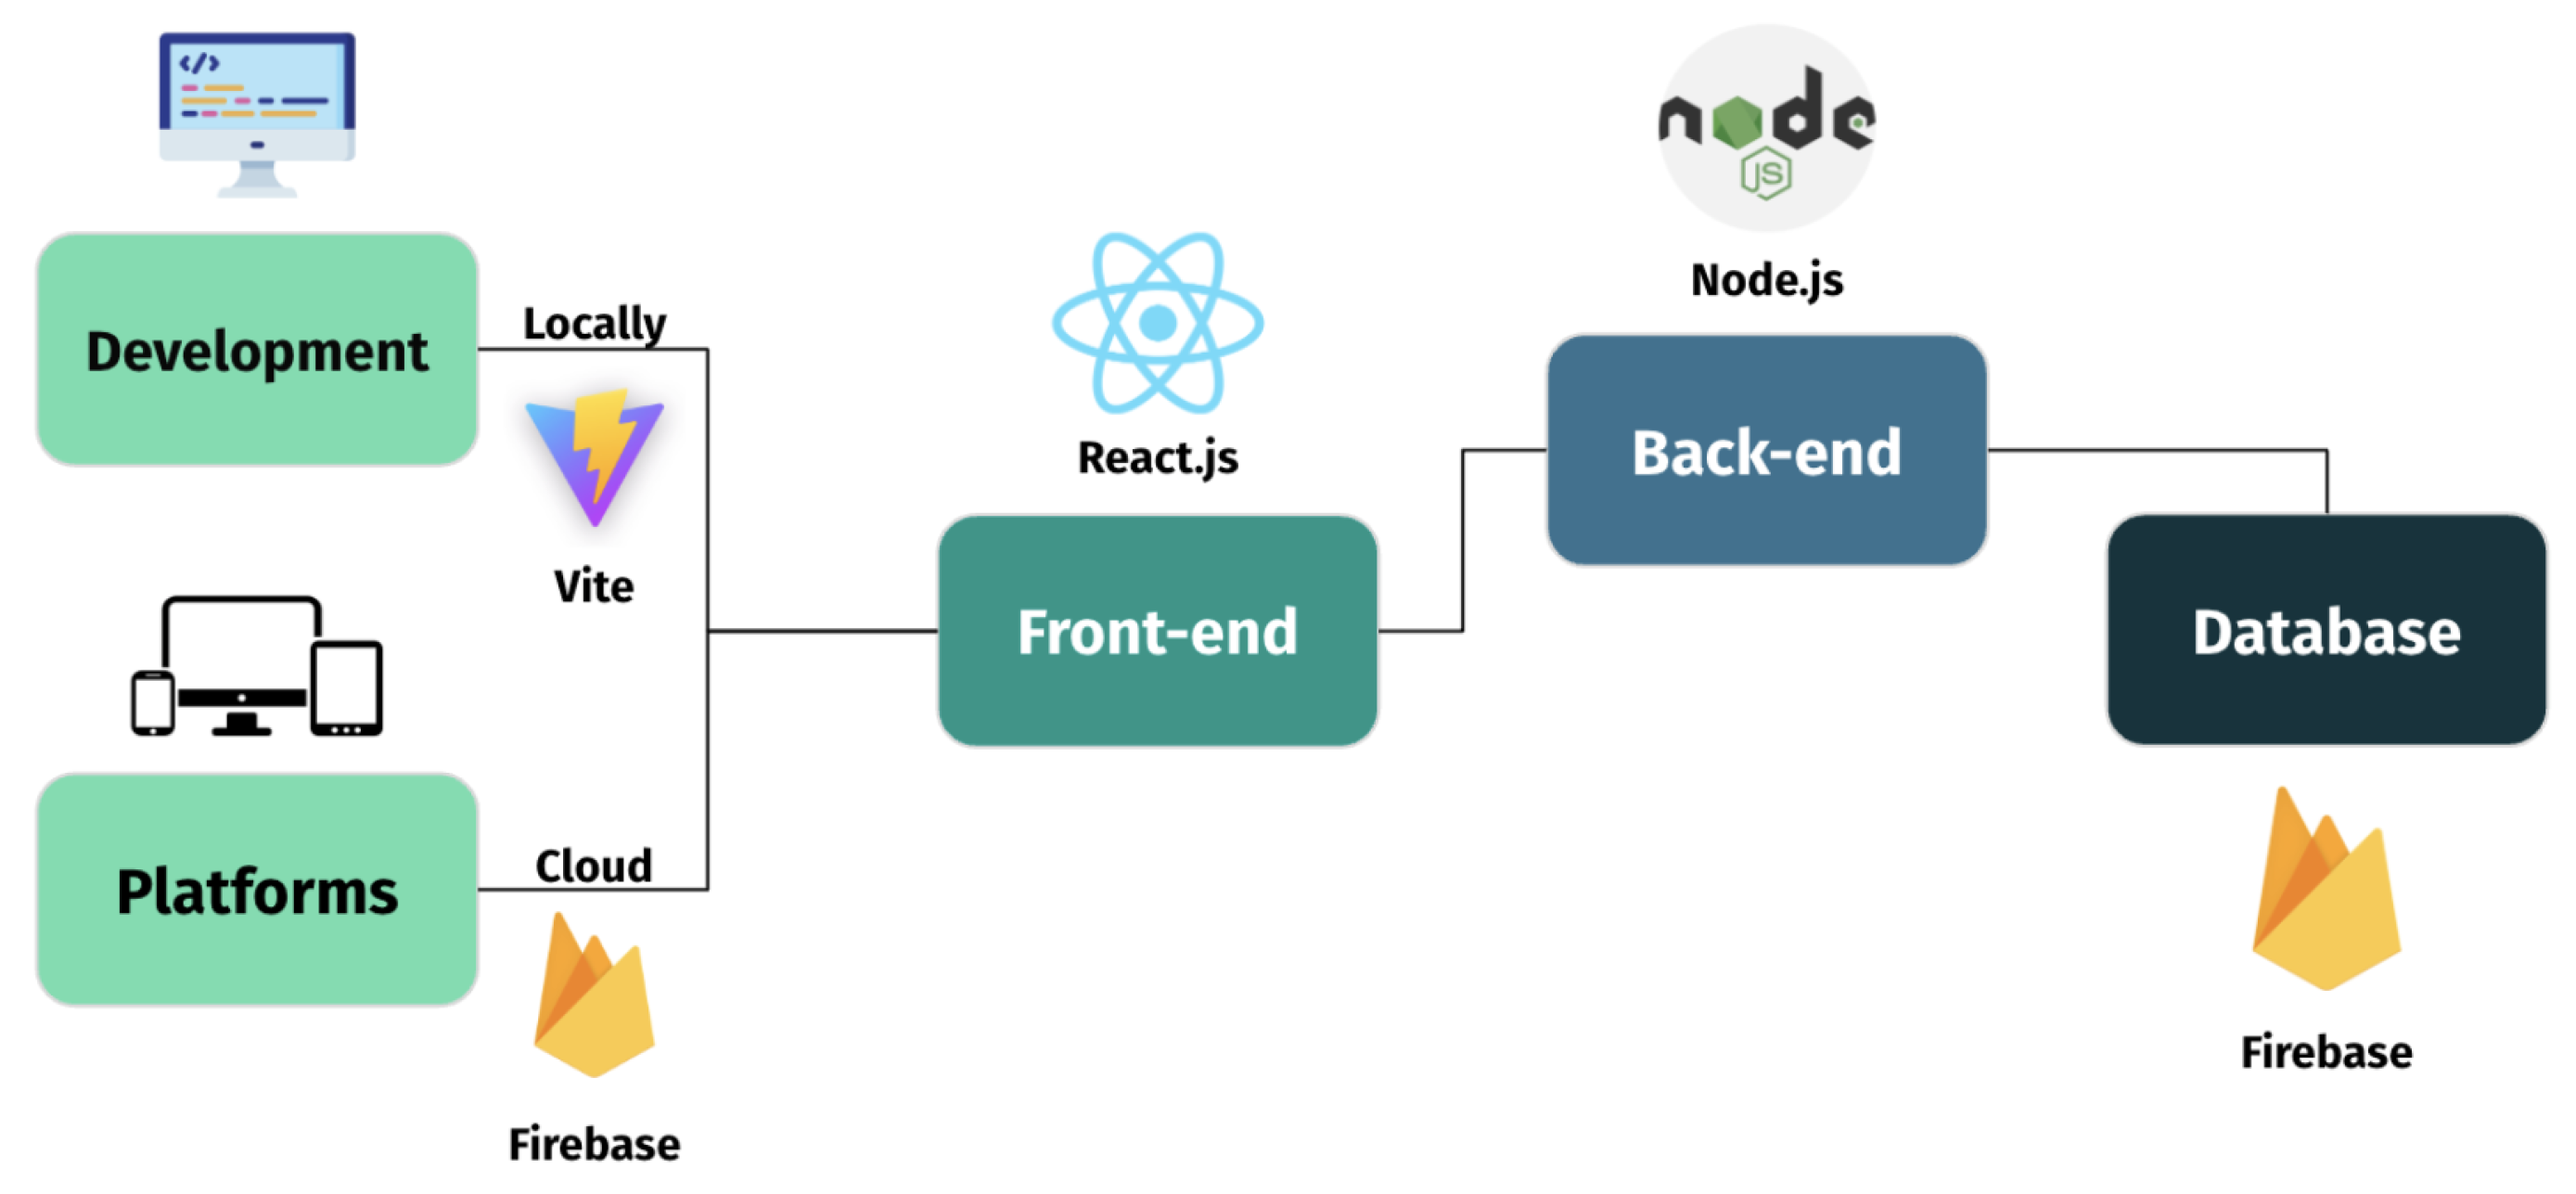
To ensure accessibility and efficient data handling, a web-based platform was developed. The front-end structure was built using React.js, an open-source JavaScript library that served as a user interface for the participants. The back-end structure was developed using Node.js, a virtual runtime environment. Firebase Realtime Database was used to record and store participant data from the platform. Vite was utilized among the developers to write and test the program, while Firebase Hosting was utilized to distribute the platform to participants. Figma was utilized to develop graphical user interface and user-experience front-end prototypes; Visual Studio Code was used to write the code; and GitHub was utilized for developer collaboration.
Figure 4.
Technology Architecture.
2.4. Methodological Trajectory
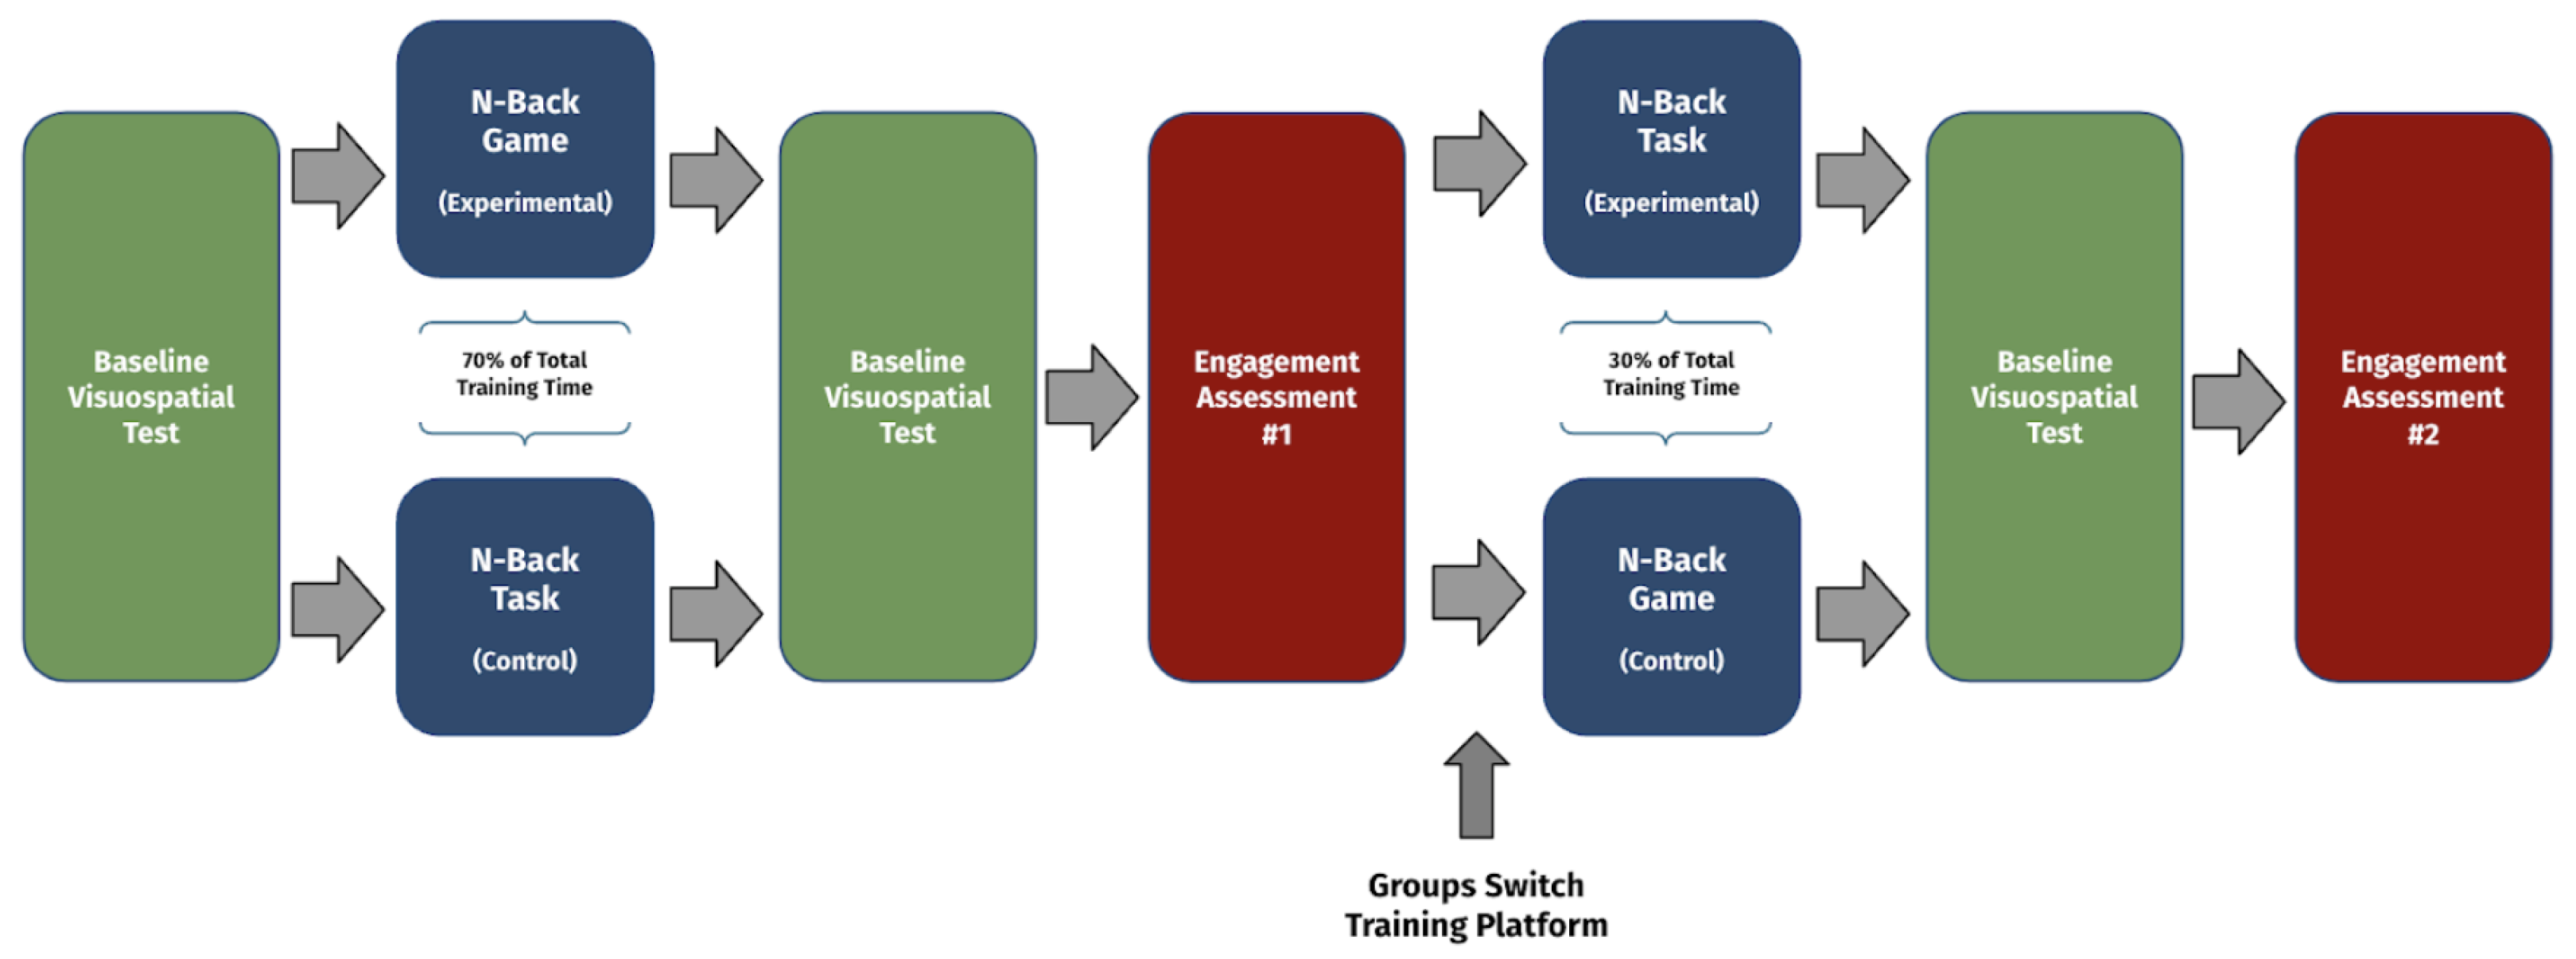
Initially, all participants completed a baseline visuospatial test to establish their pre-intervention abilities. Following this, participants were randomly divided into two groups: the experimental group and the control group. The experimental group engaged with the multidimensional n-back game for 67% of their total training time and the less cognitively demanding n-back task for the remaining 33% of the time. Conversely, the control group initially performed the task for 67% of their training time and the game for the remaining 33% of the study. After the first phase of training, which lasted 10 days, participants were re-administered the baseline test, in addition to taking an engagement assessment that was conducted using a self-reporting survey to measure participants’ interaction, engagement levels, and perceptions of task difficulty. The groups then switched tasks, with the experimental group moving to the control task and vice versa, continuing their training for 5 more days. At the end of the second phase, participants were reassessed using the baseline visuospatial test to evaluate any changes in cognitive performance. Additionally, every 5 days, the participants were individually moved up an n-level based on whether they had an average accuracy of 90% or above based on their previous 5 days of playing. This was done to continuously increase the difficulty when participants adapted to the n-level in order to cognitively challenge them. This method utilizes the mismatch model of cognitive plasticity, which suggests that increasing the demand of a cognitive process increases the resources associated with cognitive functioning [15]. A final engagement assessment at the end of the study followed, capturing how task engagement and subjective experiences evolved after the group switch. This carefully structured approach allowed for a comprehensive evaluation of the n-back game’s effects on both cognitive outcomes and participant engagement.
Figure 5.
Repeated Crossovers Experimental Design.
2.4.1. Baseline Test
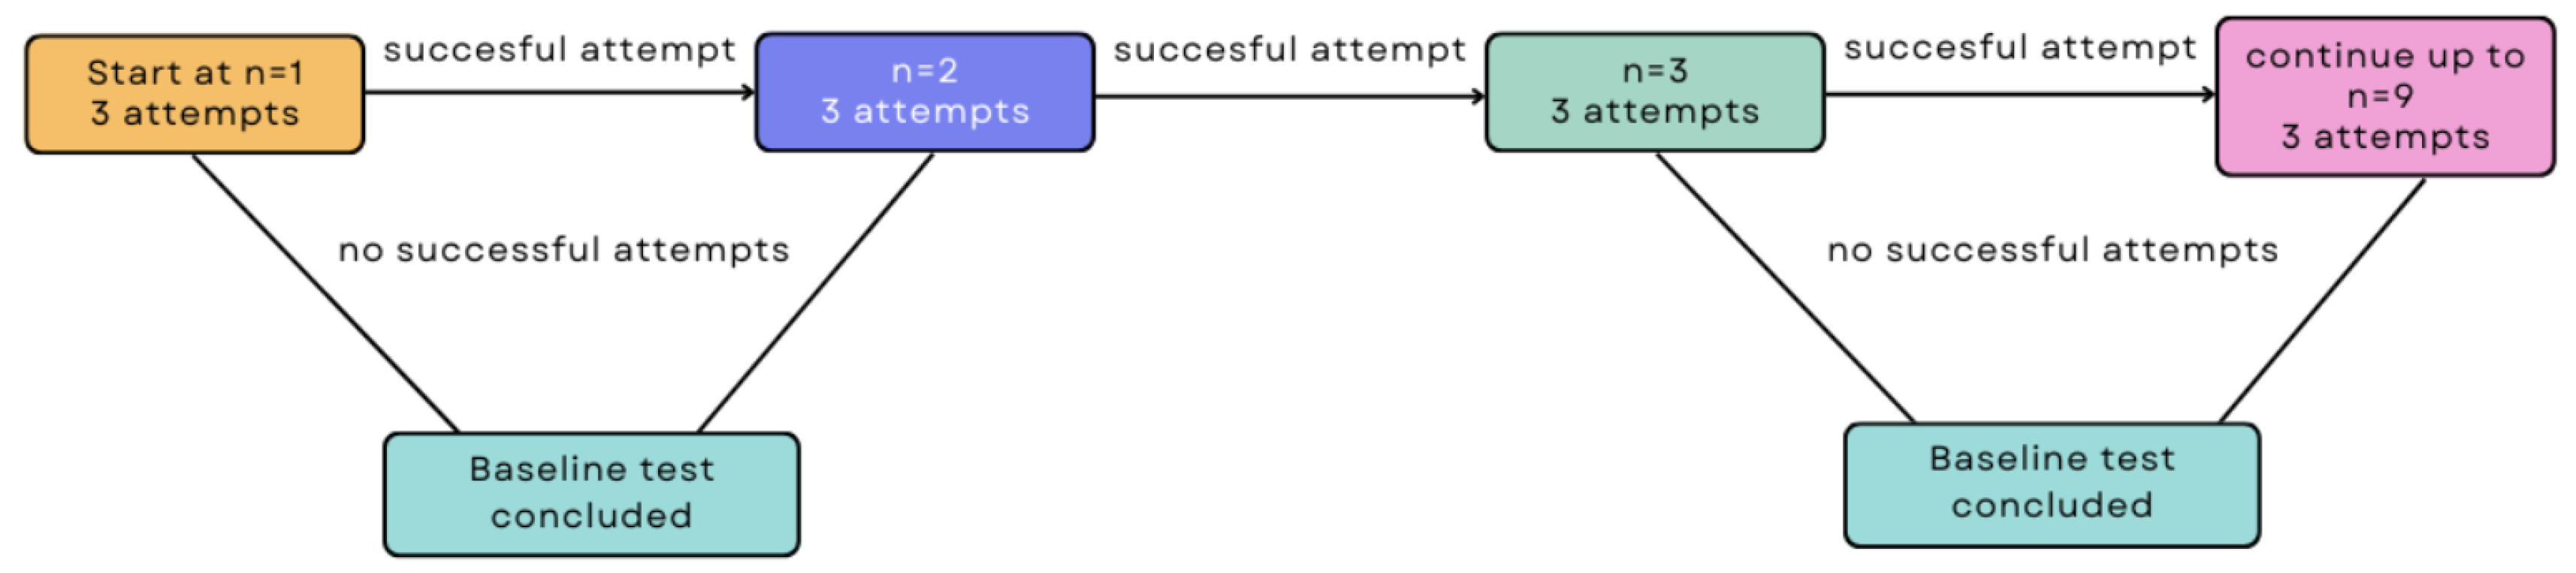
A spatial-span (SSP) baseline assessment, a psychological test which measures working memory [28], was developed and administered to all patients to assess the initial status of visuospatial working memory. The platform followed the same architectural diagram as in Figure 6. The test consisted of randomly spaced square tiles that changed color in a specific order. Participants then attempted to mimic the identical order by clicking on the tiles. If the pattern was correct, participants would move on to the next n-level by an increment of one. If the participant inputted the pattern incorrectly, they could attempt the same sequence of tiles two more times before the assessment ended. Patterns started at n=2 tiles and ended at n=9 tiles. Their score consisted of the highest tile length they could correctly replicate.
Figure 6.
Visuospatial Baseline Test
2.4.2. Training Groups: Gamified vs. Standard Training
Participants utilized two memory-training groups throughout the study: a gamified group and a standard group. Both groups consisted of the same foundational algorithm for an n-back task. Participants were presented with stimuli in a specific sequence, followed by a six-option multiple choice question asking them to recall the stimulus shown n screens earlier, with the starting n level set at a minimum of n = 2. A participant’s n level would decrease if their overall accuracy fell below 50%, remain the same if accuracy ranged between 50% and 90%, and increase if accuracy exceeded 90%. The current n level for each participant included all levels down to n = 2. Each memory training session consisted of 36 questions, divided into three rounds of 12 questions each. Participants were limited to one training session per day.
In comparison, the gamified group contained two unique aspects compared to the standard group. First, the gamified group contained multidimensional training. Participants could choose various genres aligned with their personal interests, each genre containing multiple stimuli that they needed to remember. Second, motivation was targeted through the addition of an in-game currency system. Participants earned 100 coins of in-game currency after completing each training session. During training, a unique symbol was shown at a random break screen. Participants could revisit the group website at least four hours after completing training and answer another six-choice question based on the unique symbol previously shown. If they could answer this correctly, they would gain another 400 coins worth of in-game currency.
2.4.3. Self-Reporting Engagement Assessment
Engagement was continuously monitored through HIPAA-compliant self-reporting surveys. These surveys captured participant feedback on various aspects of game functionality, including issues like lagging and bugs, and gathered personal opinions through short-answer questions. Engagement levels were also quantified using a Likert scale, and participants completed a post-study form which served as another self-reporting satisfaction survey regarding their overall engagement and participation. The data collected from these assessments provided valuable information on participant engagement, which was further analyzed in conjunction with performance improvements observed in baseline tests, Likert scale ratings, and written feedback.
2.5. Data Analysis
Prior to implementing various statistical analysis and mathematical modeling, a preliminary data analysis and data scrubbing was performed as follows.
2.5.1. Data Scrubbing
All data from the study was first de-identified and then securely stored in a Firebase real-time database. The data was subsequently scrubbed, removing all participants who played less than thirteen days, had completed less than two baseline tests out of the three, or whose baseline data was skewed due to being extreme outliers. Outliers were defined using Tukey’s method: if the data point was farther out from the outer fences (an upper or lower bound determined by the interquartile range multiplied by 3), it was considered to be an outlier in order to maintain a normal distribution suitable for statistical tests (Seo, 2006). Various statistical and analytical tests, such as Mixed ANOVA, MANOVA, and Cohen’s test, were initially used, but none of them produced a statistically significant result (data can be found in a supplementary document). For further investigation, various other statistical methods have been applied to the data, like Linear Mixed Model (LMM) and Difference-In-Difference test (DiD).
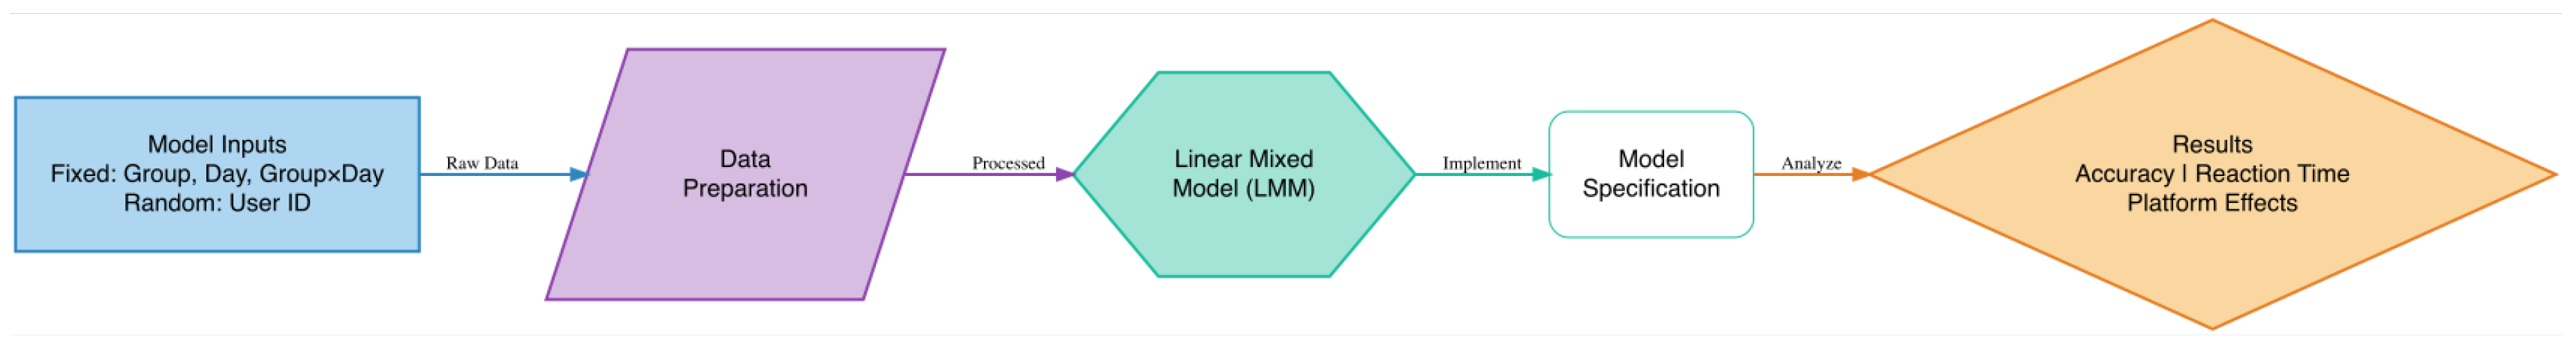
2.5.2. LMM Model
An LMM is a statistical model that extends linear regression by incorporating fixed effects (consistent among all observations) and random effects (varying among subjects) to account for data dependencies [29]. The LMM helped us analyze the performance of the experimental and control groups on a day-by-day basis by accounting for both fixed and random effects. Fixed effects in the model included group assignment (experimental or control) and the day of training, while considering the random effect of the participants to account for individual differences.
Figure 7.
Visualization of the Linear Mixed Model.
The analysis focused on key metrics such as average accuracy, response time, and n-level for both the task and game, as well as for baseline assessments. Additional metrics included elapsed time and the number of attempts per n level during the baseline assessments. Participant activity, including the number of days played, store purchases, and coins earned, was also monitored for both the game and task. Graphs illustrating average accuracy and reaction time for each group were created using Canva design software to visually represent the study’s findings.
3. Results
3.1. Linear Mixed Model: Accuracy
3.2. Linear Mixed Model Results
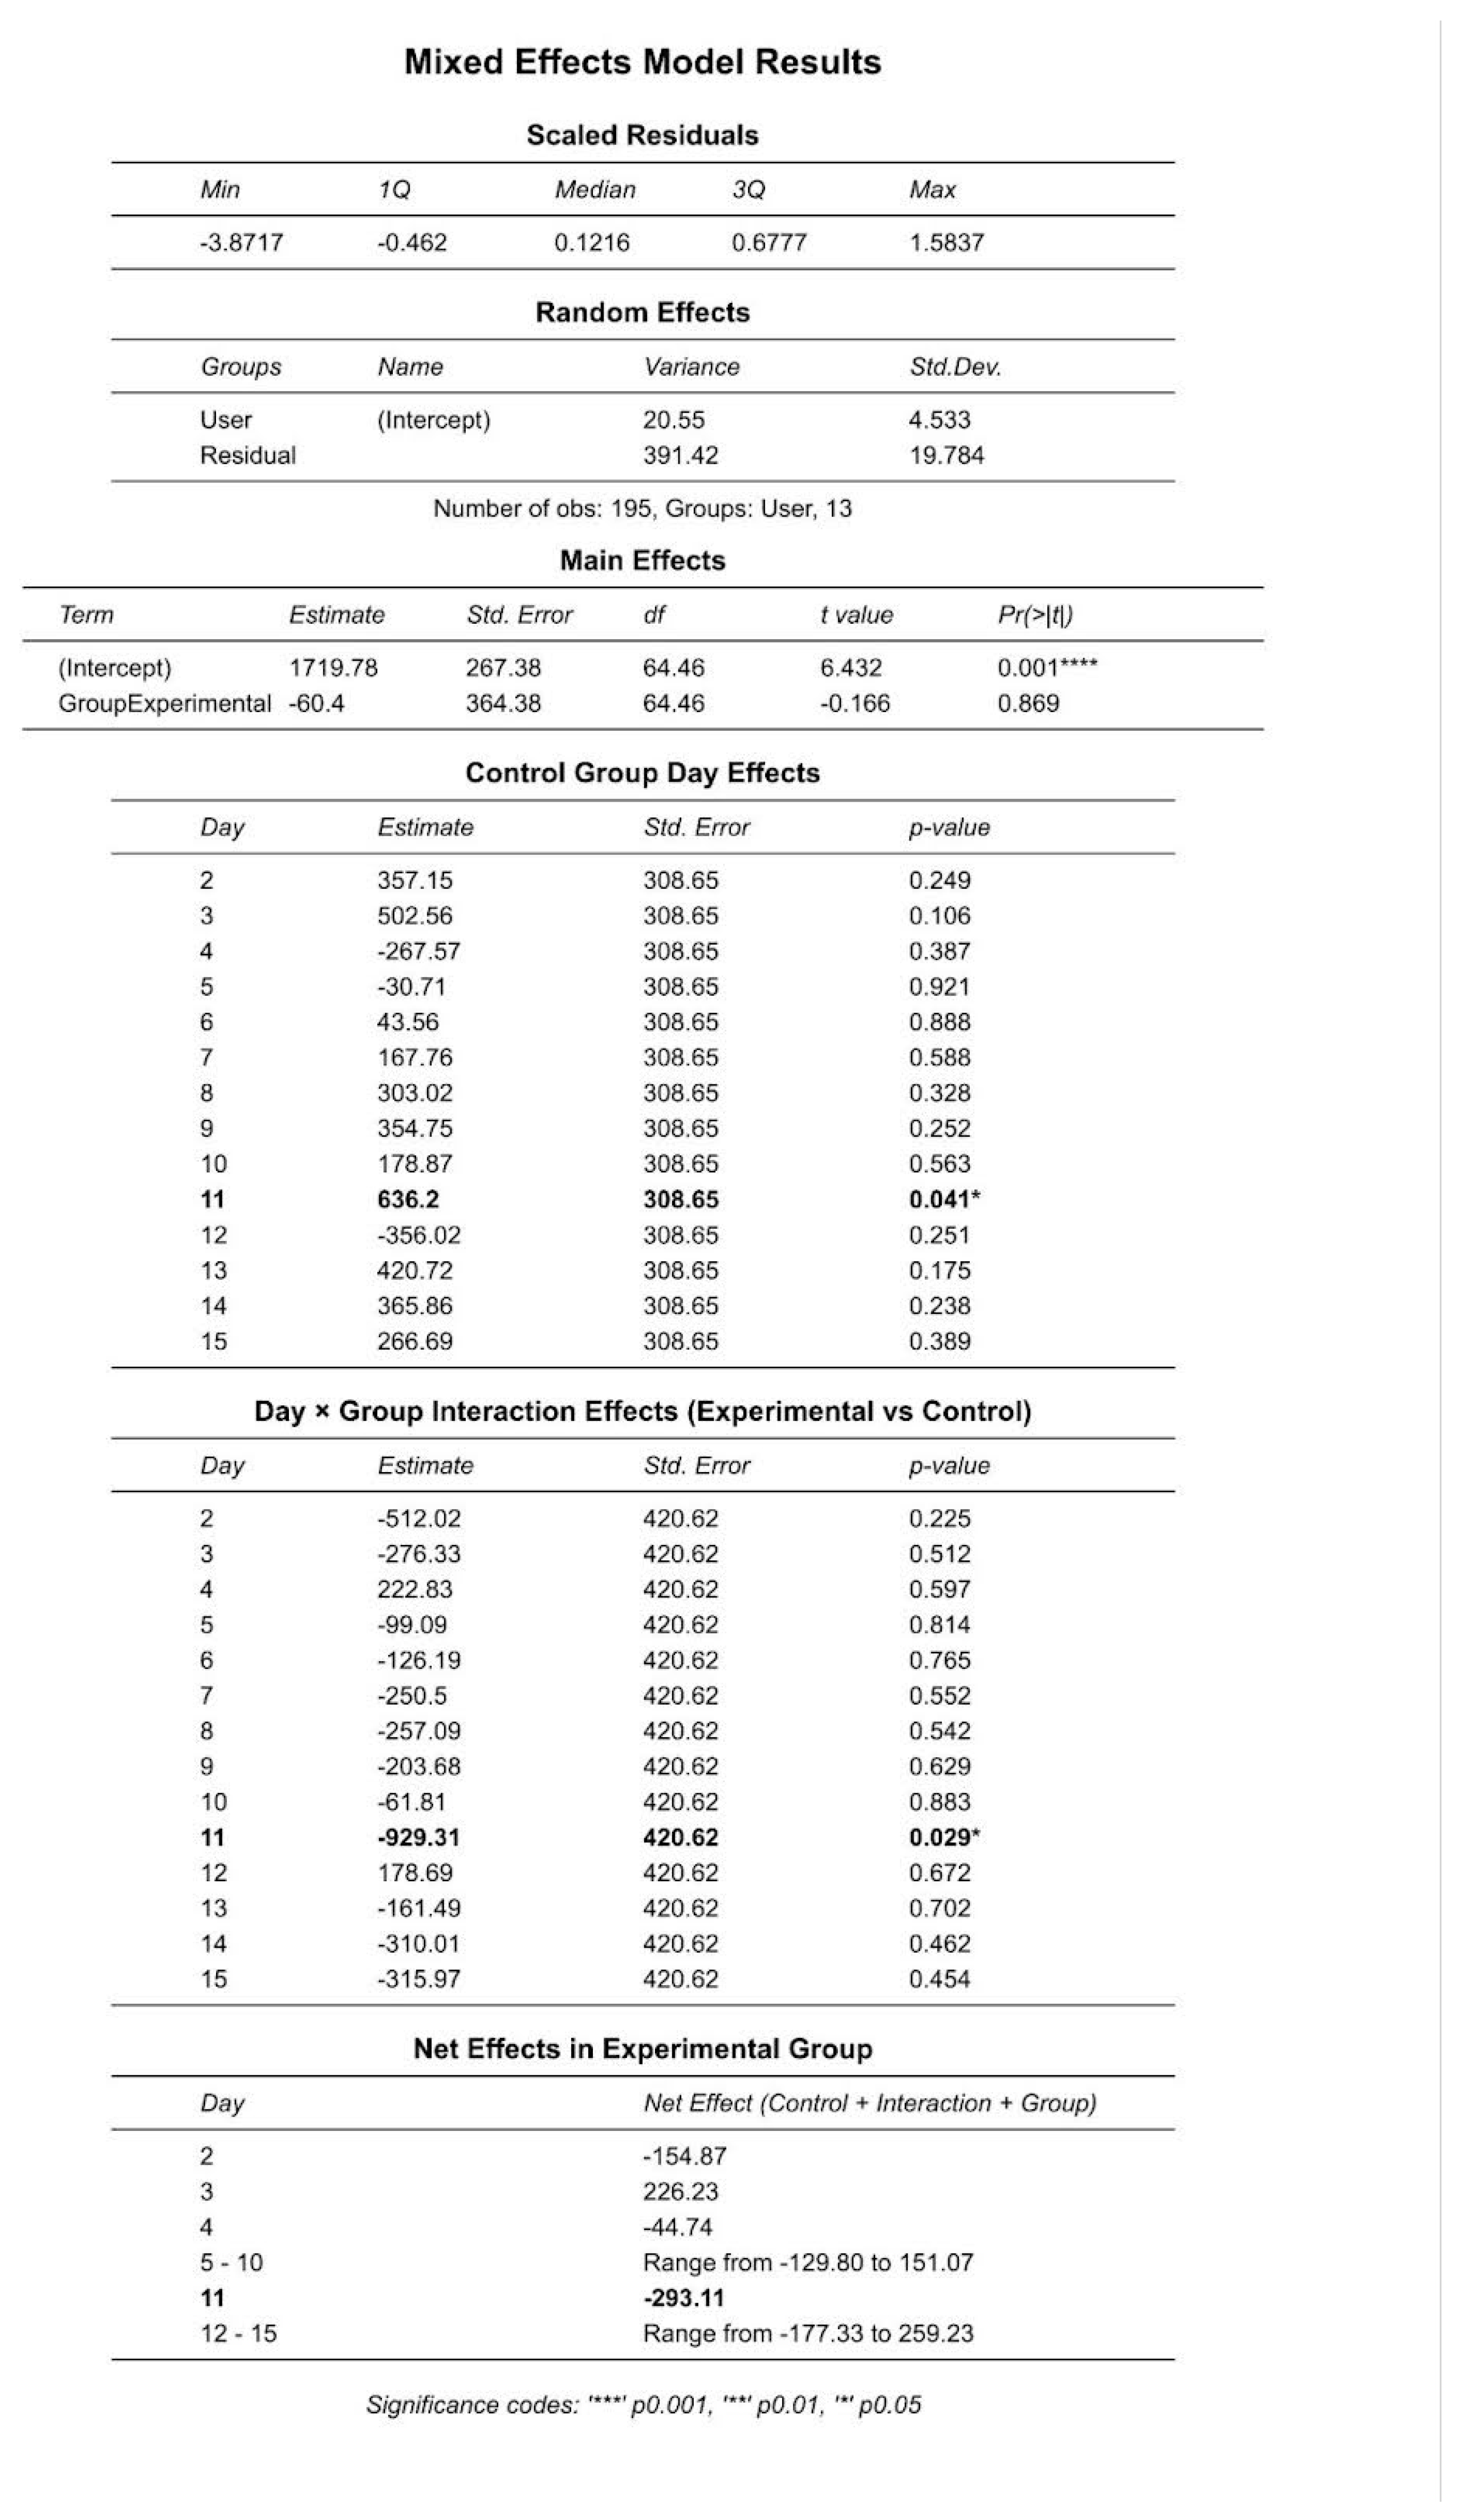
According to the LMM model’s results, the experimental group and the control group had no statistically significant difference in accuracy except on day 11 for both groups. On day 11, the experimental group moved to the task, and the control group moved to the multi-dimensional game. According to the data from days 10, 11, 12, 13, 14, and 15, accuracy decreased significantly for the experimental and control group on day 11 and then went back up the next day and proceeded to be in the same higher range for the next 4 days. Despite the experimental group moving to an easier game and having an initial decrease in accuracy, they still adjusted faster to the one-dimensional game and had a higher average accuracy than the control group for the last 5 days. Additionally, in comparison to the first 10 days, the data for the last 5 days in the study showed that the control had a bigger difference in lower average accuracies than the experimental group, further indicating that the experimental group adjusted faster to the one-dimensional game. This is a result of the game design, where the multidimensional game included multiple genres, a colorful user interface, an in-game store, and a “Brain Evolution” interactive element that allowed for increased engagement and retention. Additionally, due to continuous practice under circumstances where there were many factors for the participant to consider whilst playing, the engagement and difficulty rated higher compared to the task due to increased visual stimulation (higher complexity, visual effects, and more interacting parts) and therefore increased cognitive processing required. Furthermore, the design of the study was a repeated measures crossover where the carryover-effects of their initial group (either task or game) influenced the players’ ability to perform in the next platform. Therefore, when switching from the game to the task, the experimental group had a higher accuracy that could be attributed to their past practice with the more cognitively demanding game, making the other task far easier than it objectively was. These results are further supported via a self-reporting survey participants answered twice throughout the entirety of the experiment. The first engagement survey was taken after 10 days of playing the first group. After all participants switched to the different group than the one they started with and played for 5 days, they completed the second engagement survey, marking the end of the study. The questions in the survey asked about the difficulty participants felt, frustration levels, boredom, and confusion, as well as how often they wished to stop playing the group and what they would rate it overall. These questions were based on a scale from 1-10, with 1 being the lowest amount and 10 being the highest. There was also an optional section for participants to report any additional comments. As for the second survey, the questions remained the same, with the addition of the participant’s preferred game, most enjoyed game, and most engaging game. All the data collected from the surveys were further analyzed.
Figure 8.
Linear Mixed Model results for accuracy.
The participants took one baseline test every five days during their training. The mean difference between the first and last baseline tests for the ta group was -0.4 and 0.6 for the tb group. However, an ANOVA test showed that these differences were not significant.
Figure 9.
The leftmost graph shows the accuracies for the control over a 15-day period, while the rightmost graph shows the experimental group’s accuracies.
Figure 9.
The leftmost graph shows the accuracies for the control over a 15-day period, while the rightmost graph shows the experimental group’s accuracies.
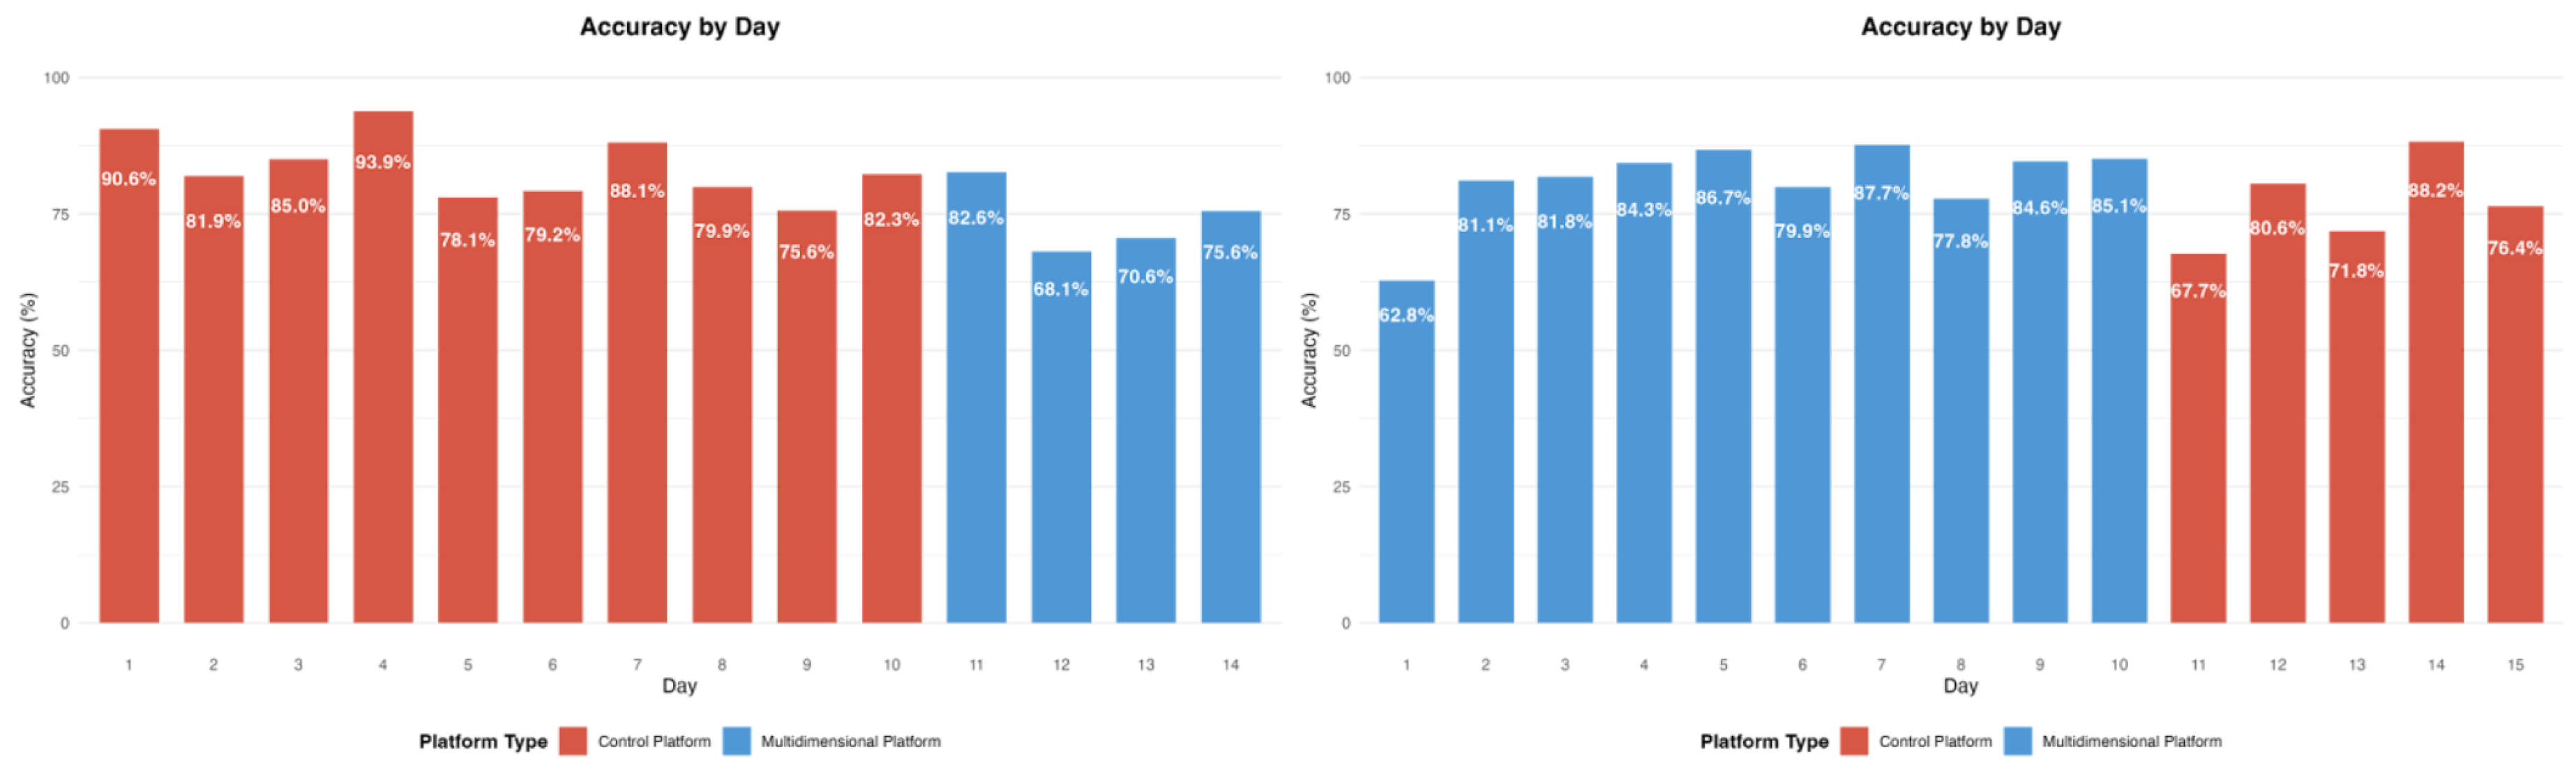
Figure 10.
Above is the average accuracy of the control and experimental groups every 5 days. Both groups start out around the same accuracy range for the first 5 days (control group is 0.91% higher), but from days 6-10 and 11-15, the experimental group has higher average accuracies by a difference of 6.95% and 5.44%, respectively.
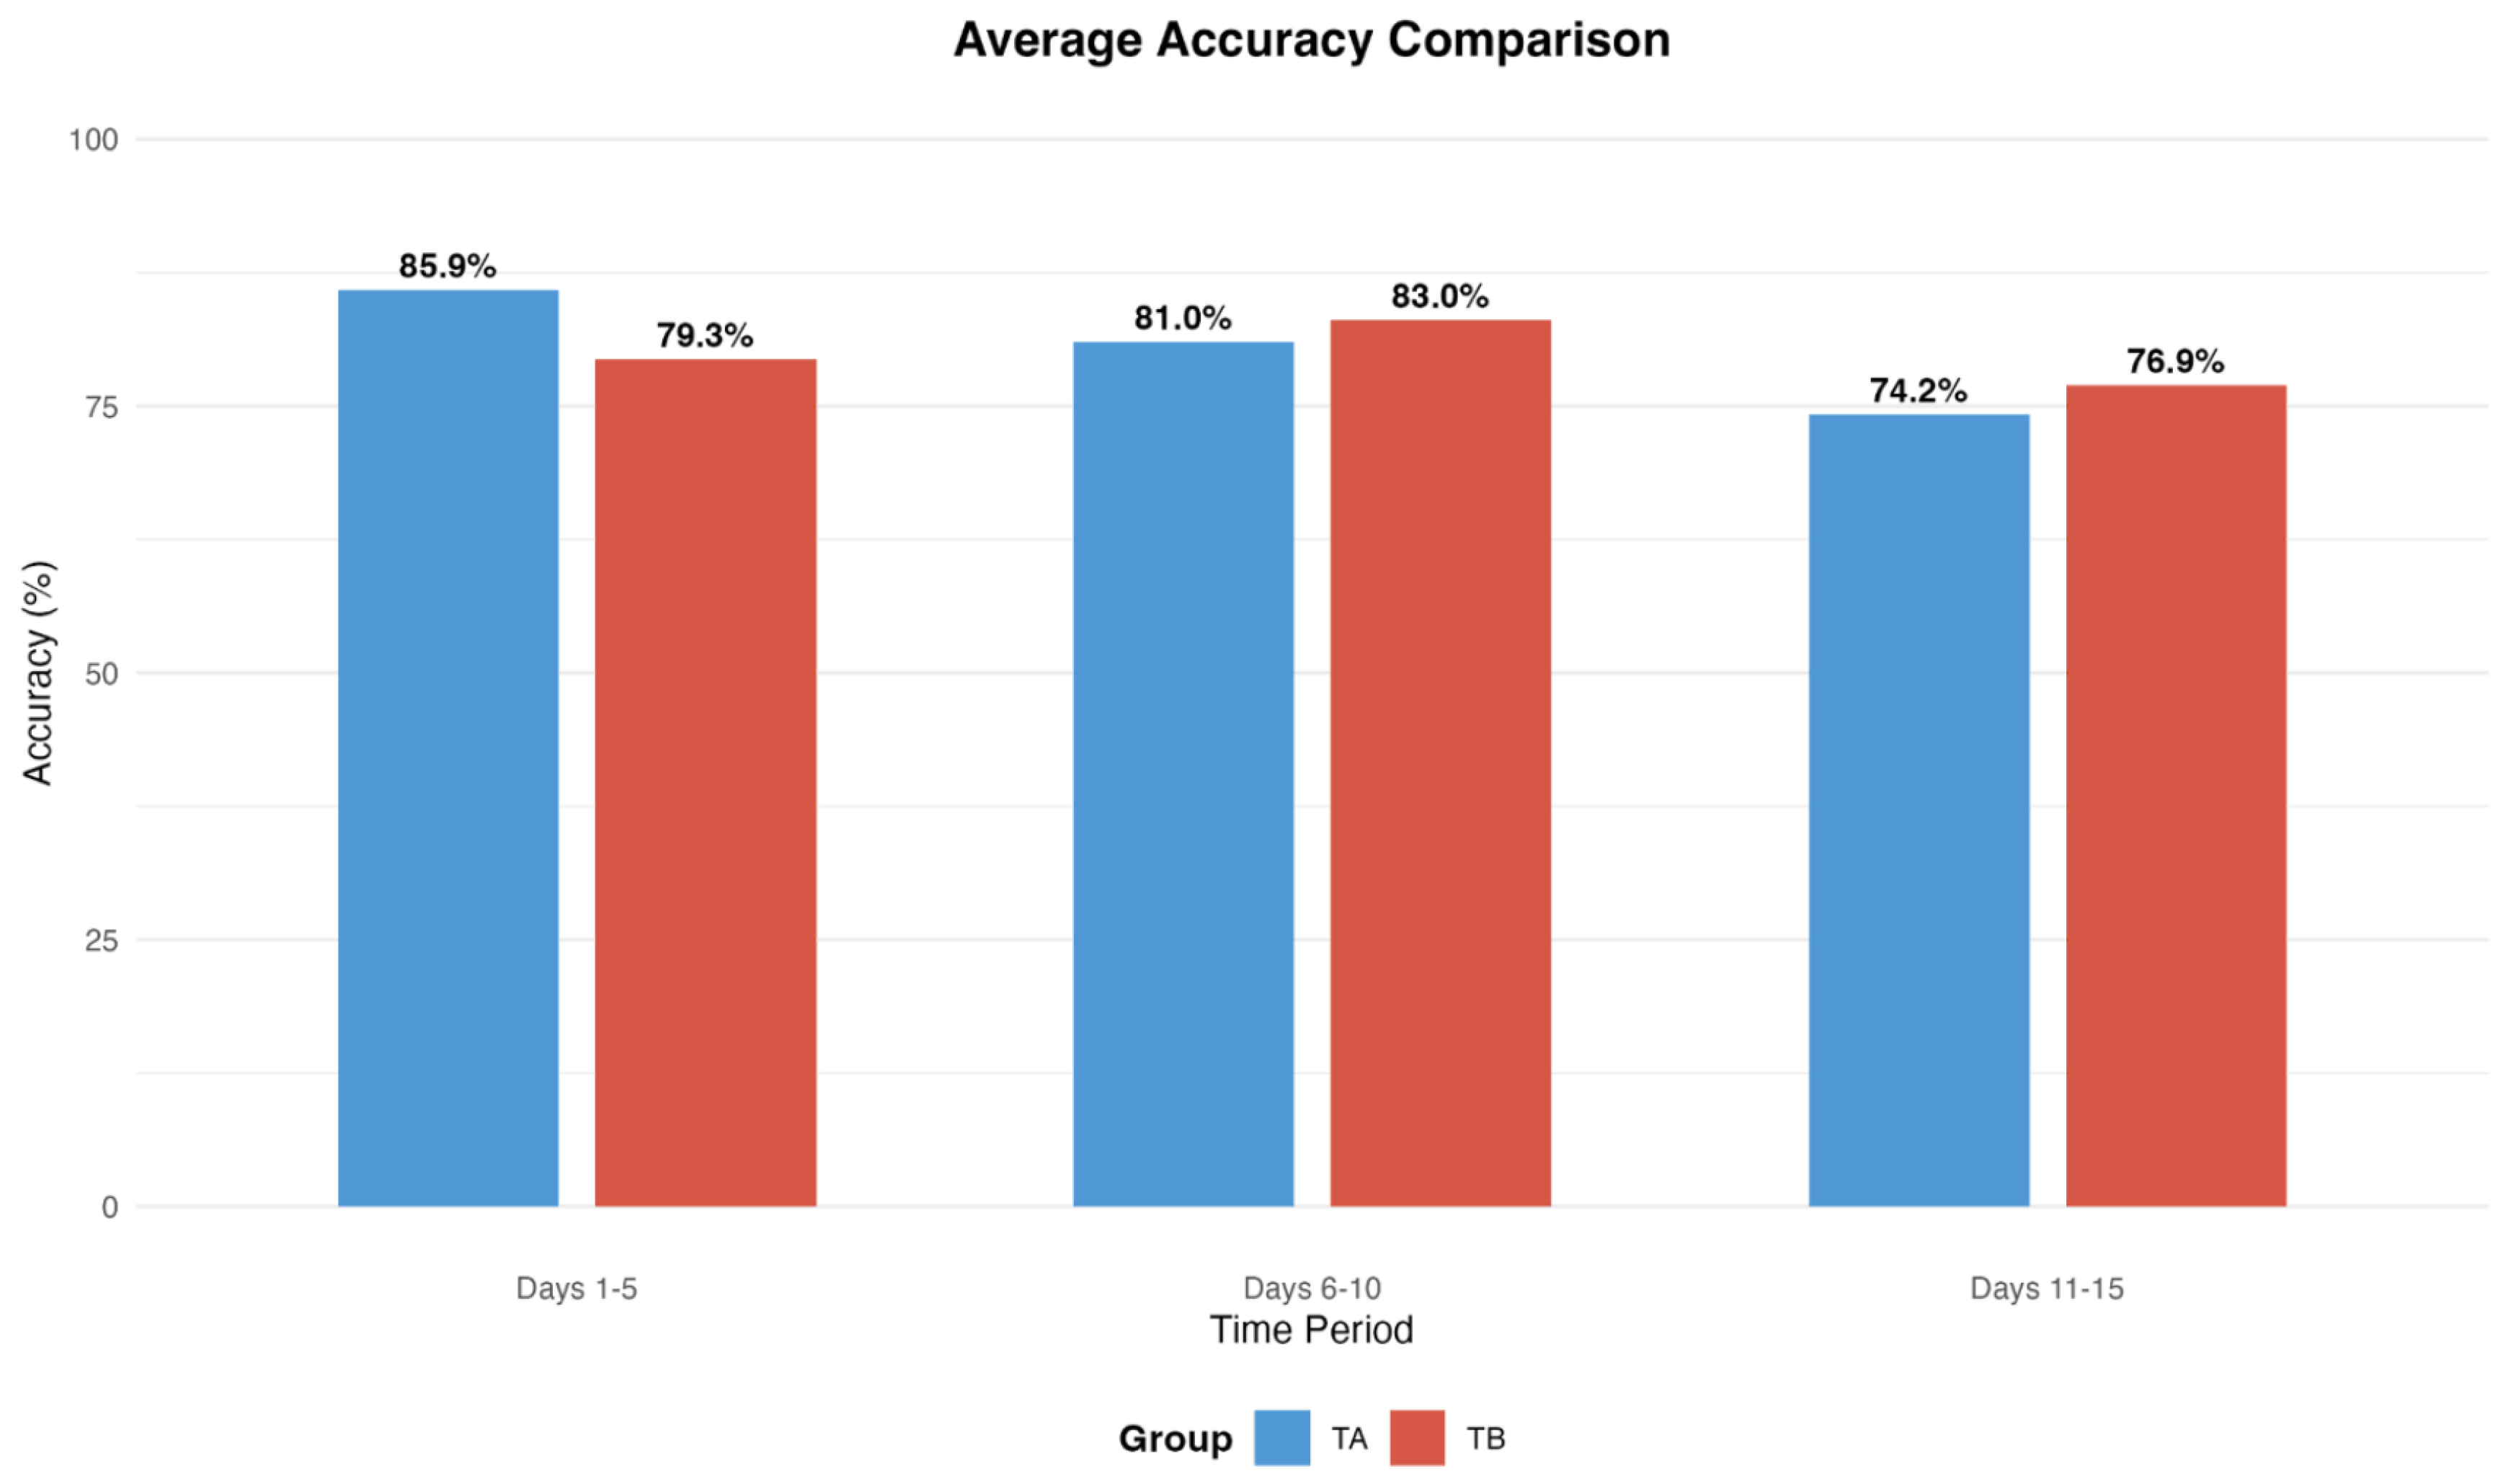
Figure 11.
Above is a Pearson’s Pairwise correlation plot comparing Accuracy and Reaction Time for participants in the TA group across their 15 days of training. The bottom row and rightmost column are blank, as some participants did not complete their final day of training. The negative correlation implies that a higher reaction time led to a lower accuracy among most TA participants.
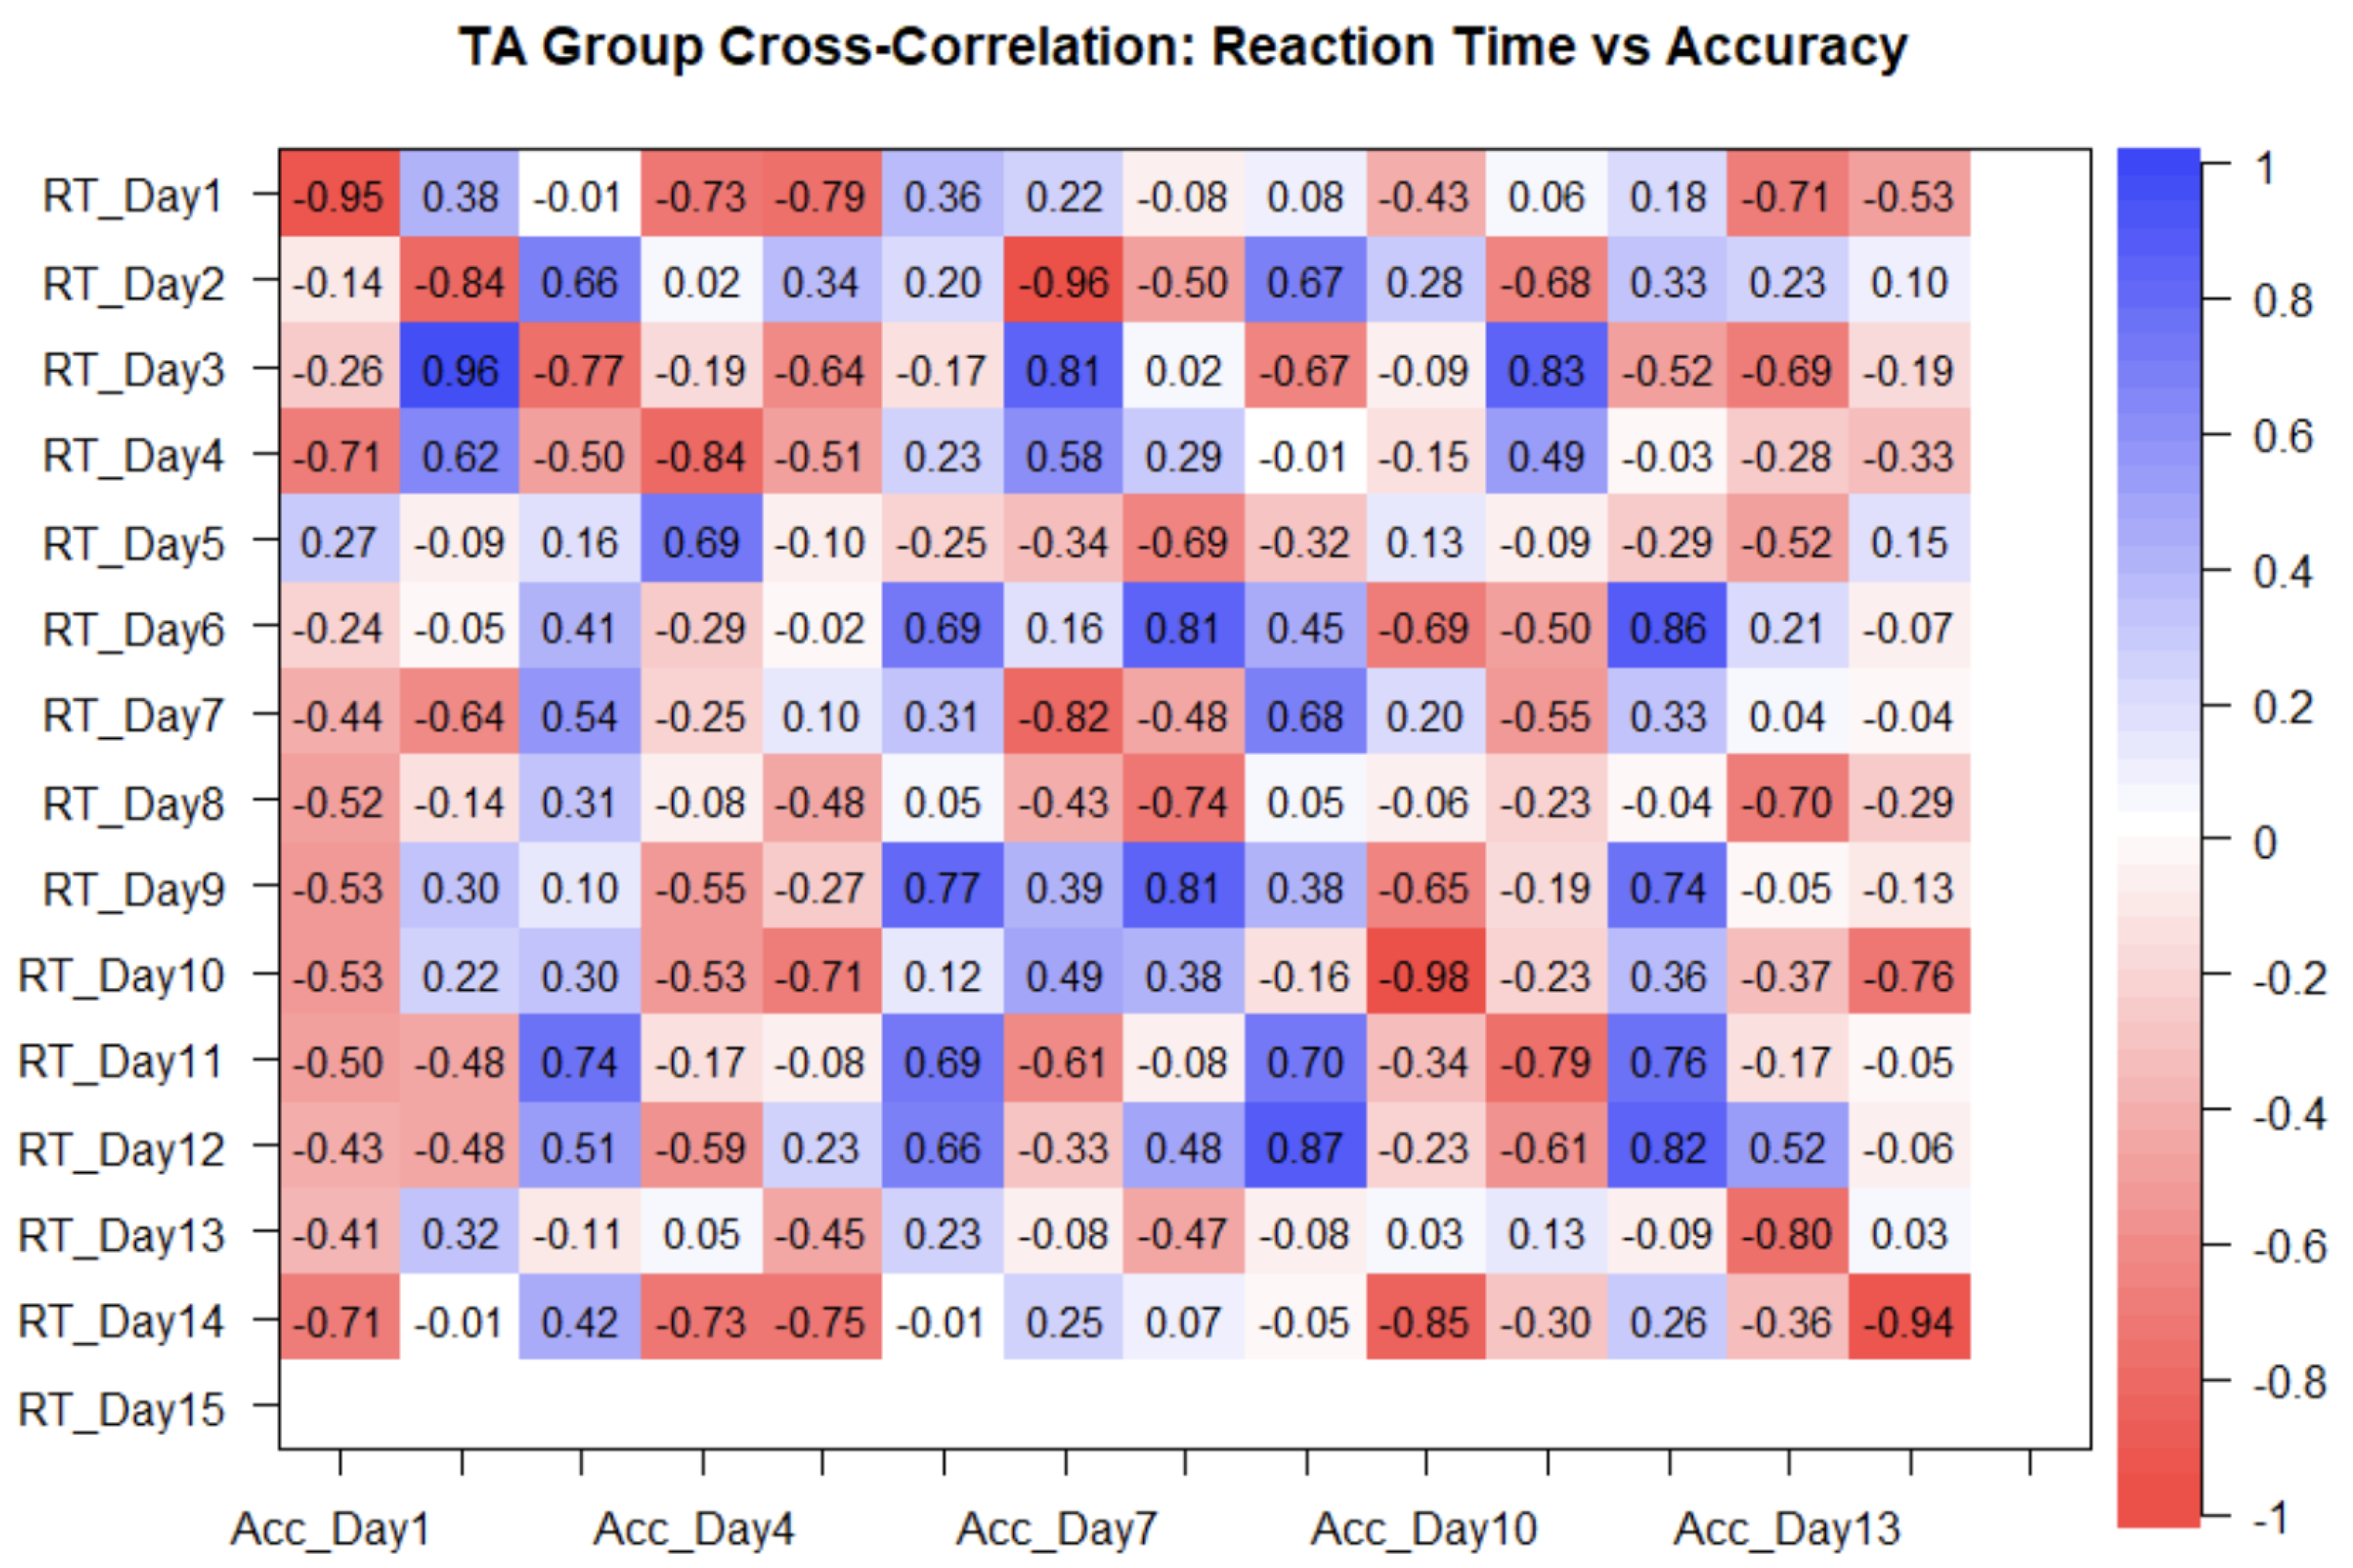
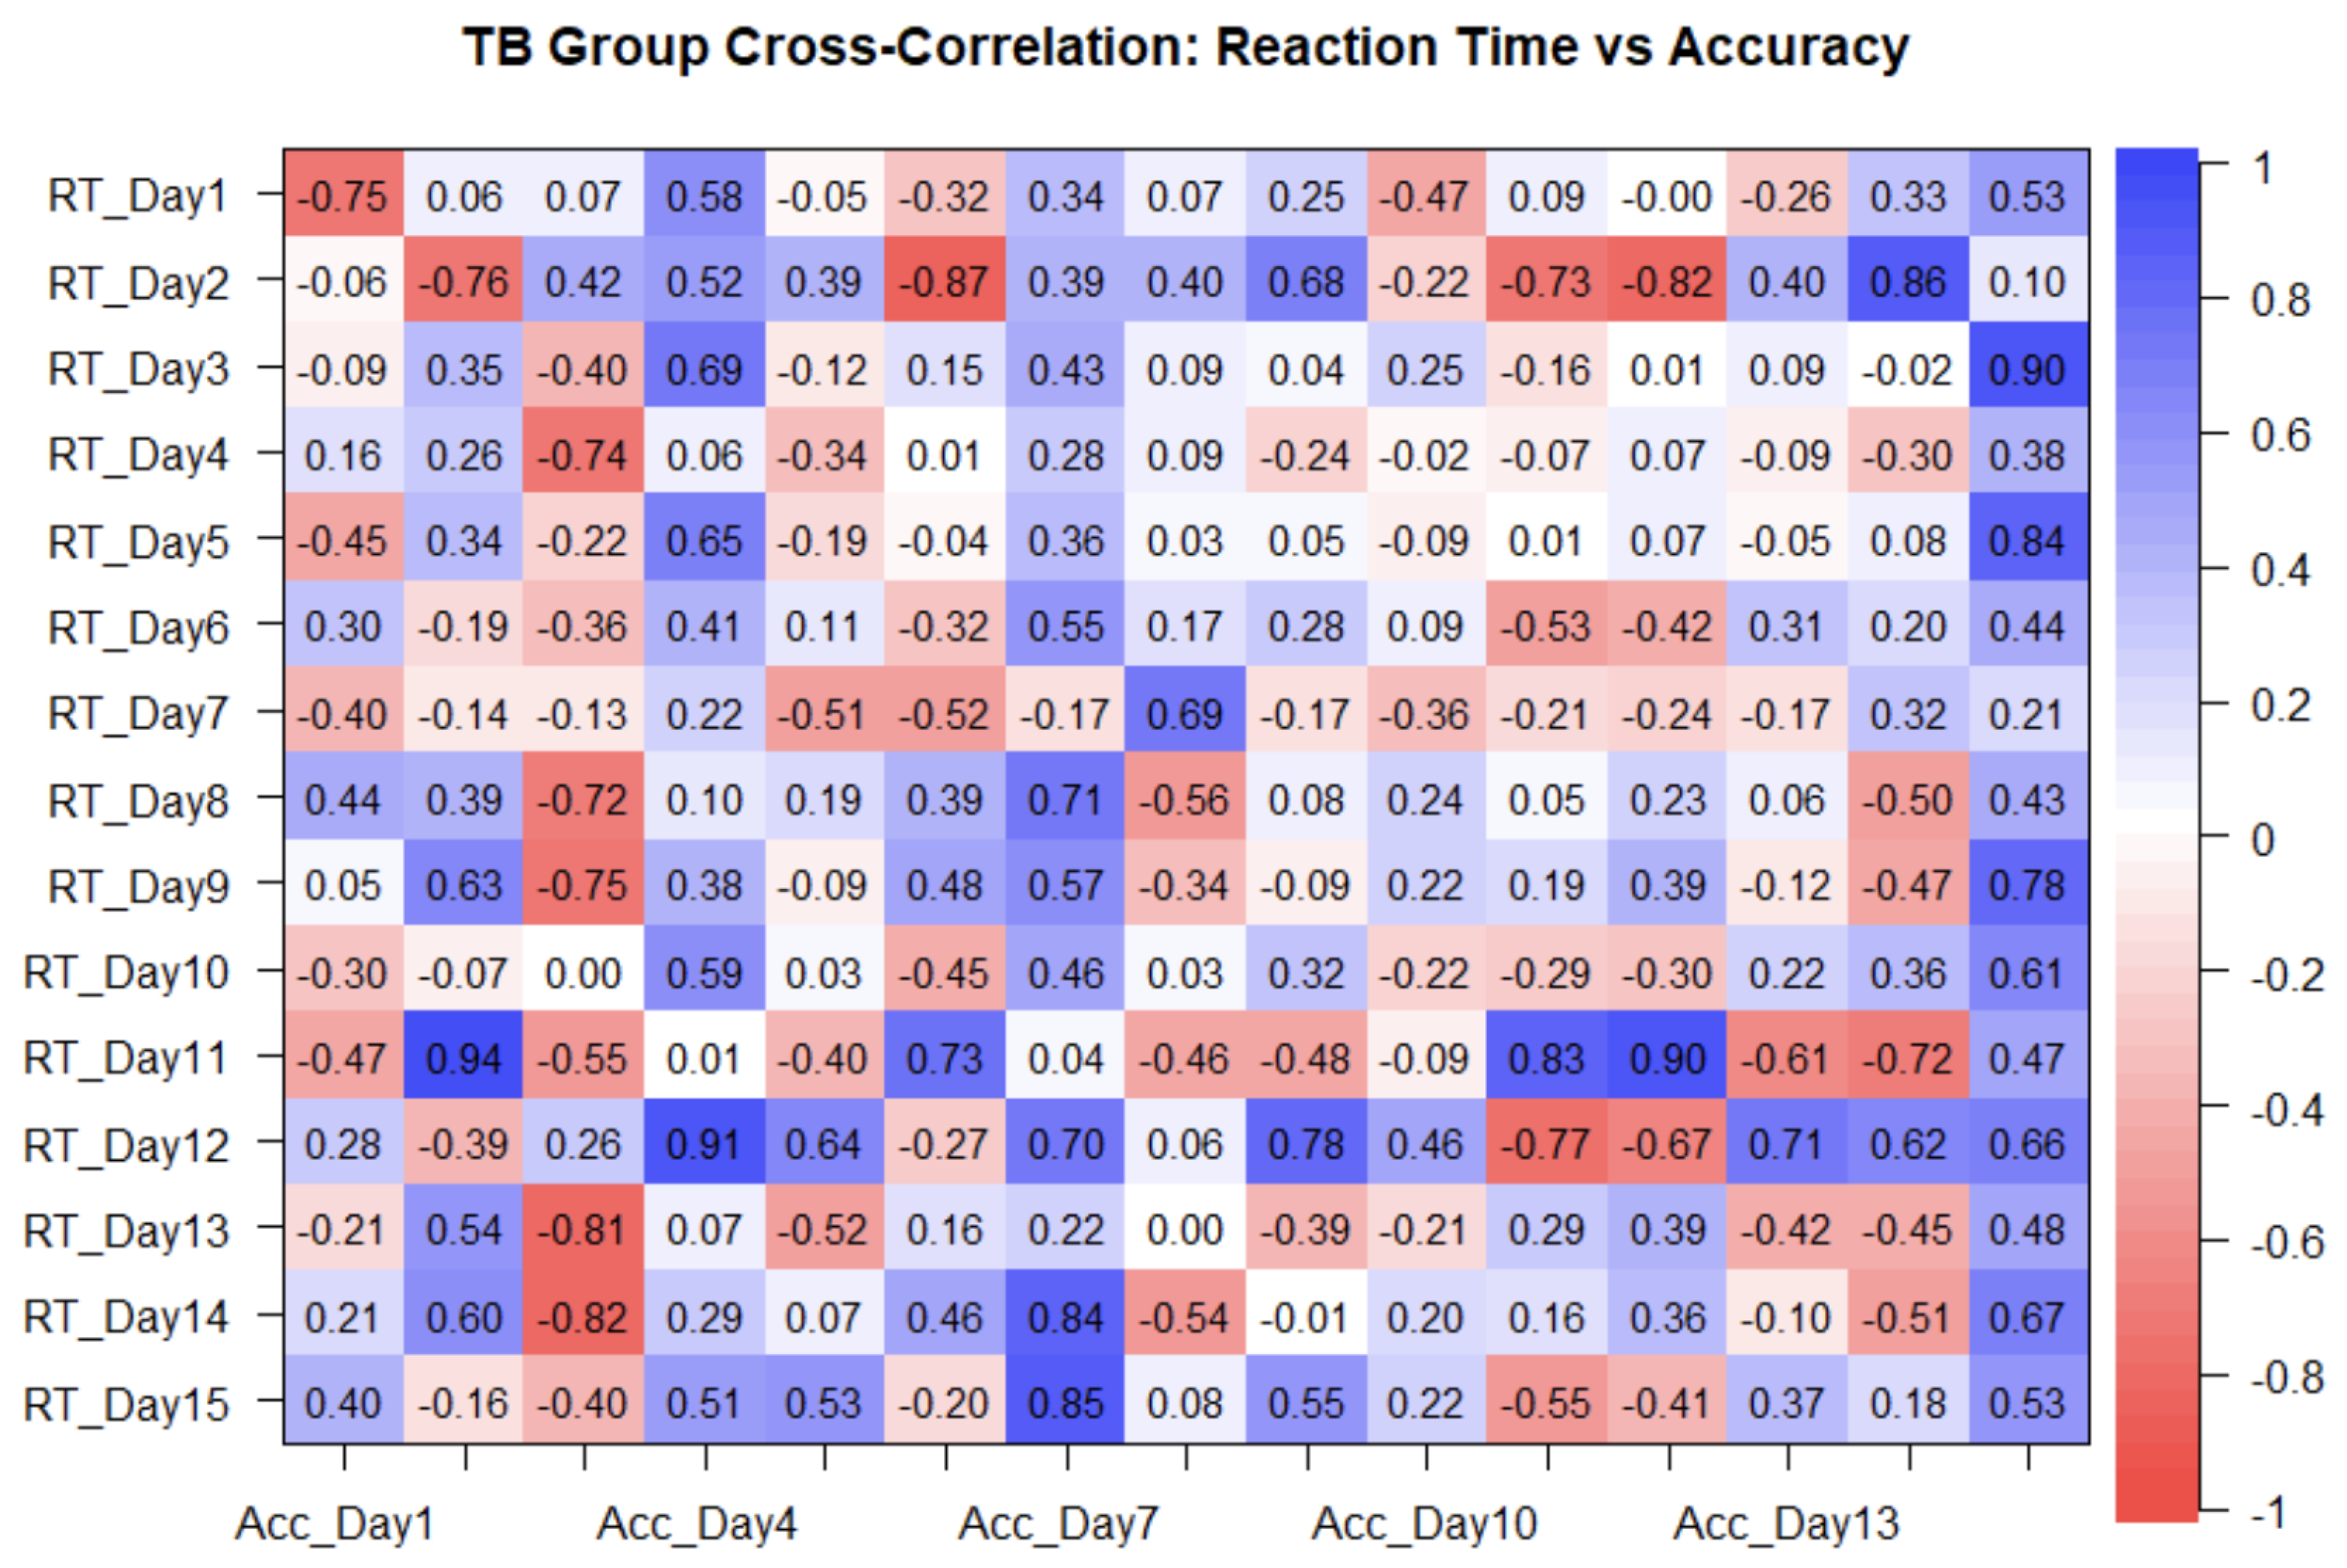
Figure 12.
Above is a correlation plot comparing Accuracy and Reaction Time for participants in the TB group across their 15 days of training. Comparing the correlation related to the TA group, the TB group demonstrated a positive correlation showing that a higher reaction time is related to higher accuracy.
3.3. Self-Reporting Data Results
From the TA Group (the control group, which consisted of 6 participants total), 33% of the participants rated the game a 7 overall and preferred the more mundane task, as the questions were easier to remember, as they were from the same genre. Similarly, 33% of participants rated the game a 5 overall and found the multi-dimensional game to be more engaging. 16% of participants reported a score of 8 for the game, but when asked which group they preferred, they were indecisive and provided no definitive answer. 16% of the TA group provided no feedback.
From the TB Group (the experimental group, which consisted of 7 participants ), 28% of participants rated the game a 5 overall and preferred the experimental game due to its engaging nature. 14% of participants in this group indicated a score of 8, and another 14% reported a score of 7, all of whom preferred the experimental game for its options. 14% of this group rated the game lower than the others with a 4, but still opted for the experimental game. A score of 6 was reported by 14%, but this participant was unaware of the two different groups, not providing sufficient feedback. The last 14% consists of a participant who provided no response. 100% of the participants in this study reported that their right hand was their dominant hand, they were comfortable with technology, and that they were fluent in English.
Figure 13.
Distribution of Reaction Time by Gender. The above violin plot depicts the variability between males and females in comparison to reaction time. Female participants show less variability compared to males and exhibit an outlier (973 ms). The median of female participants compared to male participants is slightly lower (17 ms difference), but the first quartile differs the most (195 ms difference). The box plot related to the male gender also exhibits symmetrical whiskers with no outliers, creating an approximate normal distribution spread. However, due to the shorter vertical distribution of the female distribution and wider horizontal distribution, we can conclude that female participants scored consistently for reaction time compared to the male population, which was more spread out. It is also important to note that the outlier in the female population may be skewing the reaction time, making the mean (1778 ms) lower than the median (1799 ms), thus skewing the graph left.

Additionally, we noted that a particular bias in our demographic form could have affected player accuracy and reaction time. We asked participants to rate their prior videogame experience on a scale from 1-10, with 1 being not often at all and 10 being very often. The majority of participants, 54% reported scores higher than 6, with 43% of them being female and 57% being male. 31% of participants overall self-reported scores lower than 5, with an even distribution of 50% male and 50% female. 15% of participants reported no experience, all female participants. This question could have added a bias leading to the response expectancy effect where those who rated themselves higher on the scale experienced a positive outcome (an increase in accuracy/decrease in reaction time not related to competence but rather with matching behaviors with expectancies) while those who scored lower would have experienced a negative outcome [30]. While there needs to be more research conducted on the extent of this effect on our game, this serves as a possibility to become a positive asset in our game design, where we can create an encouraging environment for participants that allows them to match their behaviors to expectancies, leading to the positive working memory outcome our study aims to address.
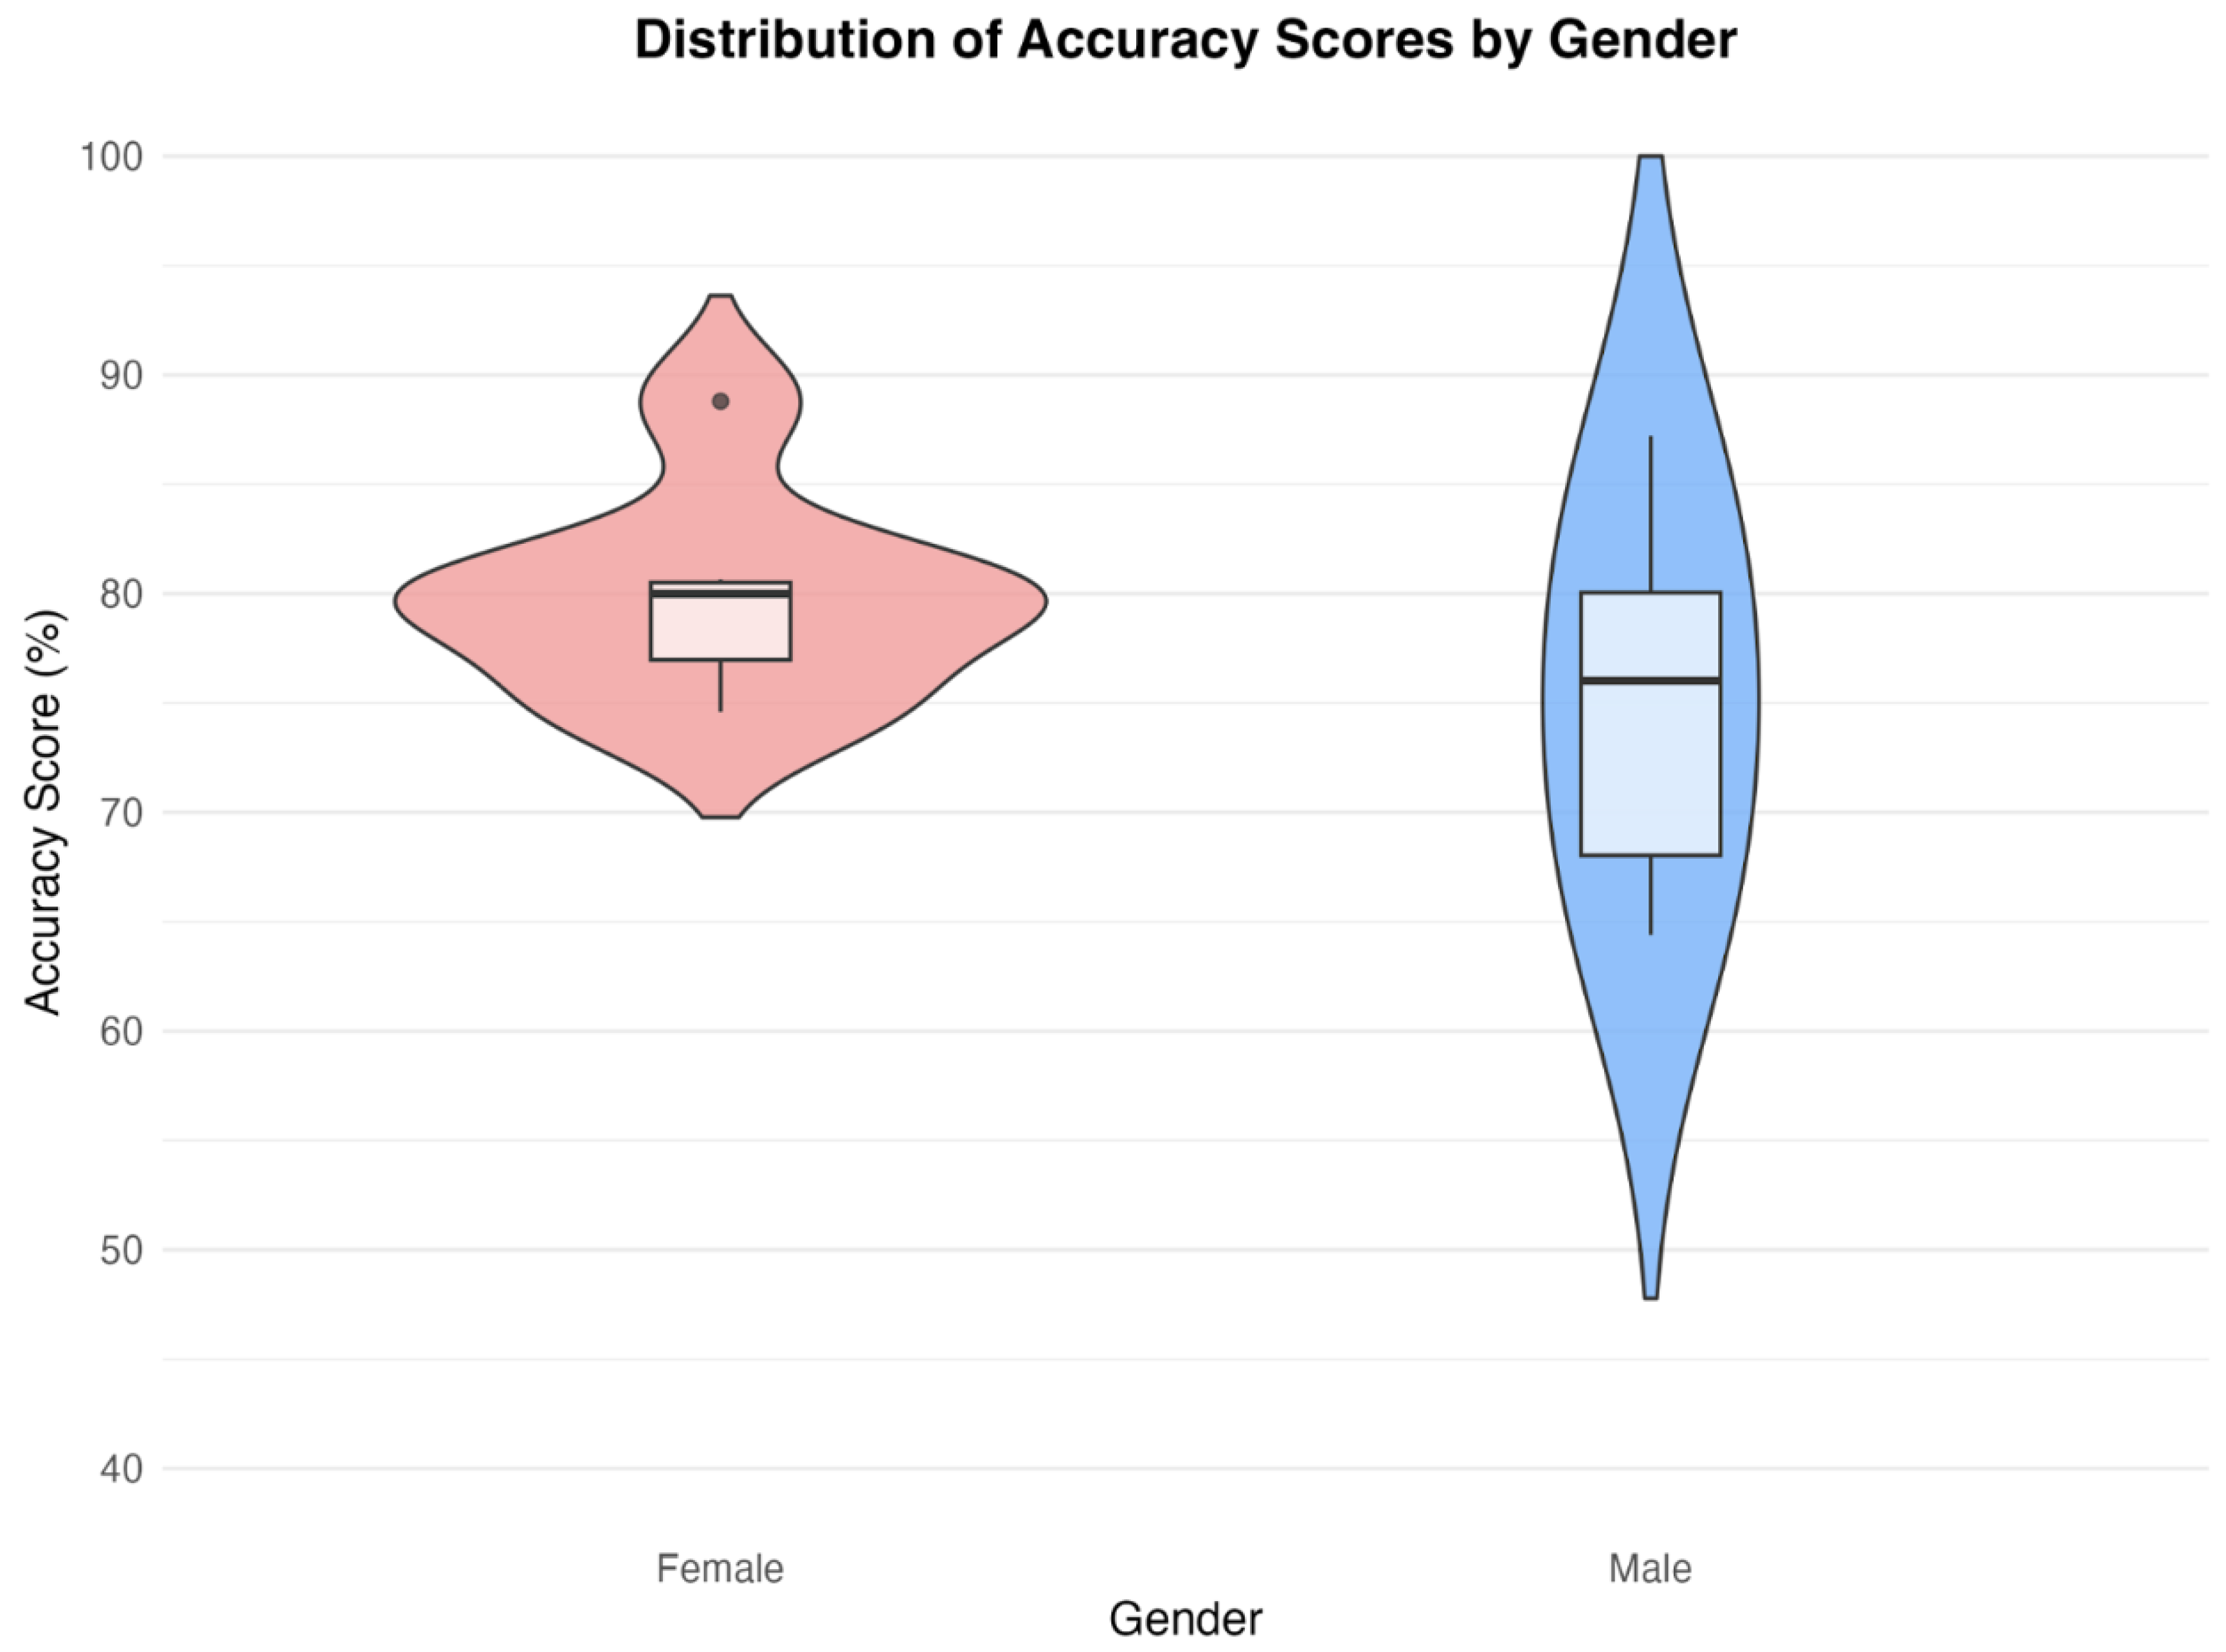
Figure 14.
Distribution of Accuracy by Gender. The above plot depicts the variability between the male and female population in comparison to their accuracies. Similar to the reaction time distribution in Figure 13, the female population has a shorter distribution, indicating more consistent accuracy scores, whereas the male population is more spread out, indicating more variability. The median of the female population (80%) was 4% higher than the male population (76%). However, the female population also exhibits an outlier (88.8%), which affects the mean (79.8%), making it less than the median (80%), negatively skewing the distribution slightly.
Along with the self-reported Jotform and LMM data, we conducted a Difference-In-Difference test to directly compare changes over time.
3.4. DiD Results
A Difference-In-Difference test was conducted to determine the possible differences in the accuracy and reaction time between groups. The pre-intervention phase represented their initial accuracy and reaction time, while the post-intervention was their ending accuracy and reaction time. We determined that, other than the pre-intervention reaction time, all other factors were not statistically significant. Furthermore, because the significant difference in reaction times was not a result of the intervention, it suggests that the experimental group, which had a lower initial reaction time than the control group, was inherently faster at the game when starting the study. Additionally, the DiD post-intervention results indicate that there was not a significant difference in reaction times, which corresponds with the results from the LMM model that also concludes that there was no significant day-by-day reaction times whatsoever. This suggests that the experimental group and control group reached similar reaction times shortly after the study commenced and maintained them throughout.
Figure 15.
Difference-in-Difference results for accuracy and reaction time.

3.5. Mathematical Modeling
To evaluate the effects of the study on accuracy, the LMM was utilized. However, to further understand why day 11 was the only statistically significant day based on the DiD result, we analyzed the fixed effect estimates associated with accuracy on this day relative to others. The model is formally expressed as follows:
where:
- represents the accuracy score of participant j on day i.
- , represents the baseline accuracy.
- accounts for the main effect of the experimental group.
- quantifies accuracy changes for each specific day relative to the baseline.
- captures the interaction effect between the experimental condition and day.
- accounts for participant-specific variability.
- represents unexplained variance in the data.
This structure allows us to predict and manipulate performance trajectories through changes in design. The coefficients d and d,Exp can be reinterpreted as day-specific intervention effects: if performance drops significantly on any given day, the respective coefficients can be used to flag it for revision. To improve both accuracy and reaction time, the model suggests we can simulate alternate intervention paths by adjusting the values of the coefficients. We can simulate how the experimental group’s accuracy would respond to a modified intervention of Day 11. If reducing the cognitive load or increasing motivation for the participants would theoretically raise accuracy, we could model this as a smaller negative interaction term. For instance, modifying d,Exp to a smaller negative term would simulate an intervention that is less disruptive, predicting a smaller drop or even a gain in accuracy.
4. Discussion
In this pilot study, we investigated whether a multidimensional n-back game would have similar or better results to a traditional n-back task in terms of accuracy and reaction time. The two groups presented were an experimental group, which initially played the gamified task for 10 days, and the control group, which played the mundane task for the same number of days. On day 11, both groups switched from either the multidimensional game to the task or vice versa and played the other platform for another 5 days. Although the accuracy and reaction time for the experimental group were consistently the same or greater than the control group, the results of the causal modeling assessment indicated that these factors were not statistically significant, except for day 11. This finding suggests that the experimental group experienced less difficulty in transitioning to the task due to their prior experience with the harder and more complex gamified task. Meanwhile, the control group experienced difficulty adjusting to the more complex multidimensional system. These results will advance future developments of working memory, as our experiment proposes a more modern approach to working memory tests through gamification in dual n-back tasks. Prior work has shown little research completed in individual studies personalized with motivational techniques [31]. This boosts participants’ engagement and mitigates boredom. Implementing a gamified, multidimensional approach could offer a more motivating and less monotonous approach to traditional working memory tasks. Due to higher reported engagement in the game, participants’ dopamine levels and focus potentially increased as well. In real-world cases, when n-back tasks are used to assess and train working memory, a gamified multidimensional system could motivate participants more to complete daily training. This system could reduce the number of participants who stop participating in the task or participate inconsistently as they would be more driven to return and potentially gain rewards through the game elements. In addition, boredom can be a factor that negatively impacts participants’ performance and the accuracy of data. This study proves that the higher engagement promoted by the multidimensional system increases participants’ flexibility in transitioning to less cognitively demanding tasks. Additionally, our study also improves their ability to apply their training to real-world scenarios. A similar study to ours showed that separately training older adults with video games helped enhance working memory, indicating that there is a degree of plasticity in older adults that can be taken advantage of to improve cognitive function [32]. In contrast to our study, the other study was conducted in the presence of an in-person experimenter for 7-8 weeks with 15 total hours of video game training, surpassing our online 15-day (15-20 minutes per day) training time (3.75 - 5 hours total).
Although this study provides useful insights, it’s crucial to note that due to the small sample size, the generalizability of this study is limited. More research must be done to further investigate the effects of multidimensionality on the dual-n-back task. Future research can explore larger sample sizes and alter game elements.
5. Conclusions
Working memory deficits are associated with a variety of neurological conditions such as mild cognitive impairment and Alzheimer’s disease [33]. Thus, our aim for the game was to introduce novel engaging elements designed to act as preventative measures for mild cognitive impairments that rivaled or outperformed the traditional dual-n-back task. We hoped that by creating a game backed by neuroscience, more adults aged 25-60 would take advantage of and utilize it as an engaging way to increase their working memory. Previous studies show that the dual n-back game is an effective method of increasing participants’ working memory. However, the task is characterized as bland [25], making participants not want to play. We hypothesized that adding more game elements to create a multidimensional game would increase engagement via increased activity in the mesocorticolimbic system, which would in turn also increase working memory.
The results of our study’s statistical testing suggested that, despite no consistent day-by-day statistical differences between the multidimensional game-first group (experimental) and the showed greater ease in adjusting to the traditional task. Performance diverged on day 11, where both groups experienced a decline in accuracy, but the experimental group rebounded stronger by day 12. This suggested improved adaptability following the cognitively demanding game with more multidimensionality. Results were obtained from various statistical testing, such as LMM and DiD tests. Overall, these results show that the multi-dimensional game is as effective as the dual-n-back game, as there were no significant differences between both groups until day 11. On day 11, participants in the experimental group adjusted more easily to the one-dimensional task than the control group did to the multidimensional game, suggesting a transfer benefit from the challenging task. Despite the increase in difficulty, the majority of participants rated the multidimensional game as more engaging and preferred it over the traditional task. This feedback describes that the change didn’t reduce motivation, but enhanced engagement. Our hypothesis that increased engagement via gamification could better support cognitive training aligned with these findings. Additionally, the statistics resulting from the game can also be further corroborated by the mathematical model.
The mathematical model suggests that a participant’s performance is not uniformly affected across time; certain days–Day 11, for instance–are particularly sensitive to intervention design. By tweaking elements of the experimental condition that correspond to large negative interaction effects (reducing cognitive load or increasing engagement on the given day), improvement in accuracy can be mathematically predicted, thus offering a future potential method of identifying how to increase working memory.
While there are no significant increases in accuracy or decreases in reaction time that could lead us to conclude our game results in higher working memory increases than the task, it is important to note that our pilot study has limitations that prevent a more accurate evaluation of the game.
Such limitations include limited participant data and uneven group sizes, which impact the individual performances of each participant having a greater effect on the data than the data would have had at a greater sample size. Furthermore, the participants struggled to complete the game in its original intention (3 separate sessions of 5 consecutive days with a 1-2 day break in between), thus creating inconsistencies that may not have been there if they followed the consecutive day scheduling. Finally, the training time was significantly reduced compared to our original one-month study plan due to the limitations of allowing participants to choose the particular time they played the game, introducing a new source of variability. Therefore, more research must be done on the dual-n-back task and how multidimensionality affects working memory, with a bigger sample size, longer duration, an in-person experimenter, and an easier schedule for participants to follow.
6. Future Work
Based on the results of our study, we are currently developing a mobile app version of our game, as the initial study was conducted solely through a web-based platform. This app aims to enhance accessibility and serve as a preventative cognitive training tool for healthy adults, as well as individuals with mild cognitive impairments (MCIs), or those seeking to improve overall cognitive performance.
Supplementary Materials
The following supporting information can be downloaded at the website of this paper posted on Preprints.org.
Funding
The authors declare that no financial support was received for the research, publication, and authorship of this article.
Acknowledgments
The authors would like to acknowledge and thank the Aspiring Scholars Directed Research Program (ASDRP) for providing this opportunity and the Olive Children Foundation for their support. The authors would also like to thank the Principal Investigator, Sahar Jahanikia, for her guidance throughout the entire process.
Portions of this manuscript were assisted by the use of generative AI. Specifically, OpenAI’s ChatGPT–version GPT-4, model: gpt-4o, source: https://chat.openai.com-was used to refine language, improve clarity, and format text. All content generated using AI has been reviewed and edited by the authors to ensure the accuracy and originality of the manuscript.
References
- Bai, S.; Liu, W.; Guan, Y. The Visuospatial and Sensorimotor Functions of Posterior Parietal Cortex in Drawing Tasks: A Review. Frontiers in Aging Neuroscience 2021, 13, 717002. [CrossRef]
- Deldar, Z.; Gevers-Montoro, C.; Khatibi, A.; Ghazi-Saidi, L. The Interaction Between Language and Working Memory: A Systematic Review of fMRI Studies in the Past Two Decades. AIMS Neuroscience 2020, 7, 395–420. [CrossRef]
- Cabeza, R.; Ciaramelli, E.; Olson, I.R.; Moscovitch, M. The Parietal Cortex and Episodic Memory: An Attentional Account. Nature Reviews Neuroscience 2008, 9, 613–625. [CrossRef]
- Cabbage, K.; Brinkley, S.; Gray, S.; Alt, M.; Cowan, N.; Green, S.; et al. Assessing Working Memory in Children: The Comprehensive Assessment Battery for Children - Working Memory (CABC-WM). Journal of Visualized Experiments: JoVE 2017, 124, 55121. [CrossRef]
- Lara, A.H.; Wallis, J.D. The Role of Prefrontal Cortex in Working Memory: A Mini Review. Frontiers in Systems Neuroscience 2015, 9, 173. [CrossRef]
- Chai, W.J.; Abd Hamid, A.I.; Abdullah, J.M. Working Memory From the Psychological and Neurosciences Perspectives: A Review. Frontiers in Psychology 2018, 9, 401. [CrossRef]
- Silver, H.; Feldman, P.; Bilker, W.; Gur, R.C. Working Memory Deficit as a Core Neuropsychological Dysfunction in Schizophrenia. American Journal of Psychiatry 2003, 160, 1809–1816. [CrossRef]
- Kofler, M.J.; Spiegel, J.A.; Soto, E.F.; Irwin, L.N.; Wells, E.L.; Austin, K.E. Do Working Memory Deficits Underlie Reading Problems in Attention-Deficit/Hyperactivity Disorder (ADHD)? Journal of Abnormal Child Psychology 2019, 47, 433–446. [CrossRef]
- Duarte, N.A.; Woods, S.P.; Rooney, A.; Atkinson, J.H.; Grant, I.; Group, T.M.A.R.C. Working Memory Deficits Affect Risky Decision-Making in Methamphetamine Users With Attention-Deficit/Hyperactivity Disorder. Journal of Psychiatric Research 2012, 46, 492–499. [CrossRef]
- Sankalaite, S.; Huizinga, M.; Warreyn, P.; Dewandeleer, J.; Baeyens, D. The Association Between Working Memory, Teacher-Student Relationship, and Academic Performance in Primary School Children. Frontiers in Psychology 2023, 14. [CrossRef]
- Ngetich, R.; Burleigh, T.L.; Czakó, A.; Vékony, T.; Németh, D.; Demetrovics, Z. Working Memory Performance in Disordered Gambling and Gaming: A Systematic Review. Comprehensive Psychiatry 2023, 126, 152408. [CrossRef]
- Salminen, T.; Forlim, C.G.; Schubert, T.; Kühn, S. Dual N-Back Training Improves Functional Connectivity of the Right Inferior Frontal Gyrus at Rest. Scientific Reports 2020, 10, 20379. [CrossRef]
- Jaeggi, S.M.; Buschkuehl, M.; Jonides, J.; Perrig, W.J. Improving Fluid Intelligence With Training on Working Memory. Proceedings of the National Academy of Sciences 2008, 105, 6829–6833. [CrossRef]
- Owen, A.M.; McMillan, K.M.; Laird, A.R.; Bullmore, E. N-Back Working Memory Paradigm: A Meta-Analysis of Normative Functional Neuroimaging Studies. Human Brain Mapping 2005, 25, 46–59. [CrossRef]
- Lawlor-Savage, L.; Goghari, V.M. Dual N-Back Working Memory Training in Healthy Adults: A Randomized Comparison to Processing Speed Training. PloS One 2016, 11, e0151817. [CrossRef]
- Ninaus, M.; Pereira, G.; Stefitz, R.; Prada, R.; Paiva, A.; Neuper, C.; et al.. Game Elements Improve Performance in a Working Memory Training Task. International Journal of Serious Games 2015, 2, 3–16. [CrossRef]
- Howard-Jones, P.A.; Jay, T.; Mason, A.; Jones, H. Gamification of Learning Deactivates the Default Mode Network. Frontiers in Psychology 2016, 6, 1891. [CrossRef]
- Lumsden, J.; Edwards, E.A.; Lawrence, N.S.; Coyle, D.; Munafò, M.R. Gamification of Cognitive Assessment and Cognitive Training: A Systematic Review of Applications and Efficacy. JMIR Serious Games 2016, 4, e11. [CrossRef]
- Przybylski, A.K.; Rigby, C.S.; Ryan, R.M. A Motivational Model of Video Game Engagement. Review of General Psychology 2010, 14, 154–166. [CrossRef]
- Chaarani, B.; Ortigara, J.; Yuan, D.; Loso, H.; Potter, A.; Garavan, H.P. Association of Video Gaming With Cognitive Performance Among Children. JAMA Network Open 2022, 5, e2235721. [CrossRef]
- Bromberg-Martin, E.S.; Matsumoto, M.; Hikosaka, O. Dopamine in Motivational Control: Rewarding, Aversive, and Alerting. Neuron 2010, 68, 815–834. [CrossRef]
- Alcaro, A.; Huber, R.; Panksepp, J. Behavioral functions of the mesolimbic dopaminergic system: An affective neuroethological perspective. Brain Research Reviews 2007, 56, 283–321. [CrossRef]
- Keyser, J.D.; Herregodts, P.; Ebinger, G. The Mesoneocortical Dopamine Neuron System. Neurology 1990, 40, 1660–1660. [CrossRef]
- Jocham, G.; Klein, T.A.; Ullsperger, M. Dopamine-Mediated Reinforcement Learning Signals in the Striatum and Ventromedial Prefrontal Cortex Underlie Value-Based Choices. Journal of Neuroscience 2011, 31, 1606–1613. [CrossRef]
- Mohammed, S.; Flores, L.; Deveau, J.; Hoffing, R.C.; Phung, C.; Parlett, C.M.; et al.. The Benefits and Challenges of Implementing Motivational Features to Boost Cognitive Training Outcome. Journal of Cognitive Enhancement 2017. [CrossRef]
- Soo, C.; Lee, J.A.C. The Psychology of Rewards in Digital Game-Based Learning: A Comprehensive Review. Journal of Cognitive Sciences and Human Development 2022, 8, 68–88. [CrossRef]
- Boendermaker, W.J.; Gladwin, T.E.; Peeters, M.; Prins, P.J.M.; Wiers, R.W. Training Working Memory in Adolescents Using Serious Game Elements: Pilot Randomized Controlled Trial. JMIR Serious Games 2018, 6, e10. [CrossRef]
- Teixeira, R.; Zachi, E.; Roque, D.; Taub, A.; Ventura, D. Memory Span Measured by the Spatial Span Tests of the Cambridge Neuropsychological Test Automated Battery in a Group of Brazilian Children and Adolescents. Dementia & Neuropsychologia 2011, 5, 129–134. [CrossRef]
- Dean, C.B.; Nielsen, J.D. Generalized Linear Mixed Models: A Review and Some Extensions. Lifetime Data Analysis 2007, 13, 497–512. [CrossRef]
- Ziv, G.; Lidor, R.; Levin, O. Reaction Time and Working Memory in Gamers and Non-Gamers. Scientific Reports 2022, 12, 6798. [CrossRef]
- Locke, H.; Braver, T.S. Motivational Influences on Cognitive Control: Behavior, Brain Activation, and Individual Differences. Cognitive, Affective, & Behavioral Neuroscience 2008, 8, 99–112. [CrossRef]
- Toril, P.; Reales, J.M.; Mayas, J.; Ballesteros, S. Video Game Training Enhances Visuospatial Working Memory and Episodic Memory in Older Adults. Frontiers in Human Neuroscience 2016, 10, 206. [CrossRef]
- Kirova, A.M.; Bays, R.B.; Lagalwar, S. Working Memory and Executive Function Decline Across Normal Aging, Mild Cognitive Impairment, and Alzheimer’s Disease. BioMed Research International 2015, 2015, 748212. [CrossRef]
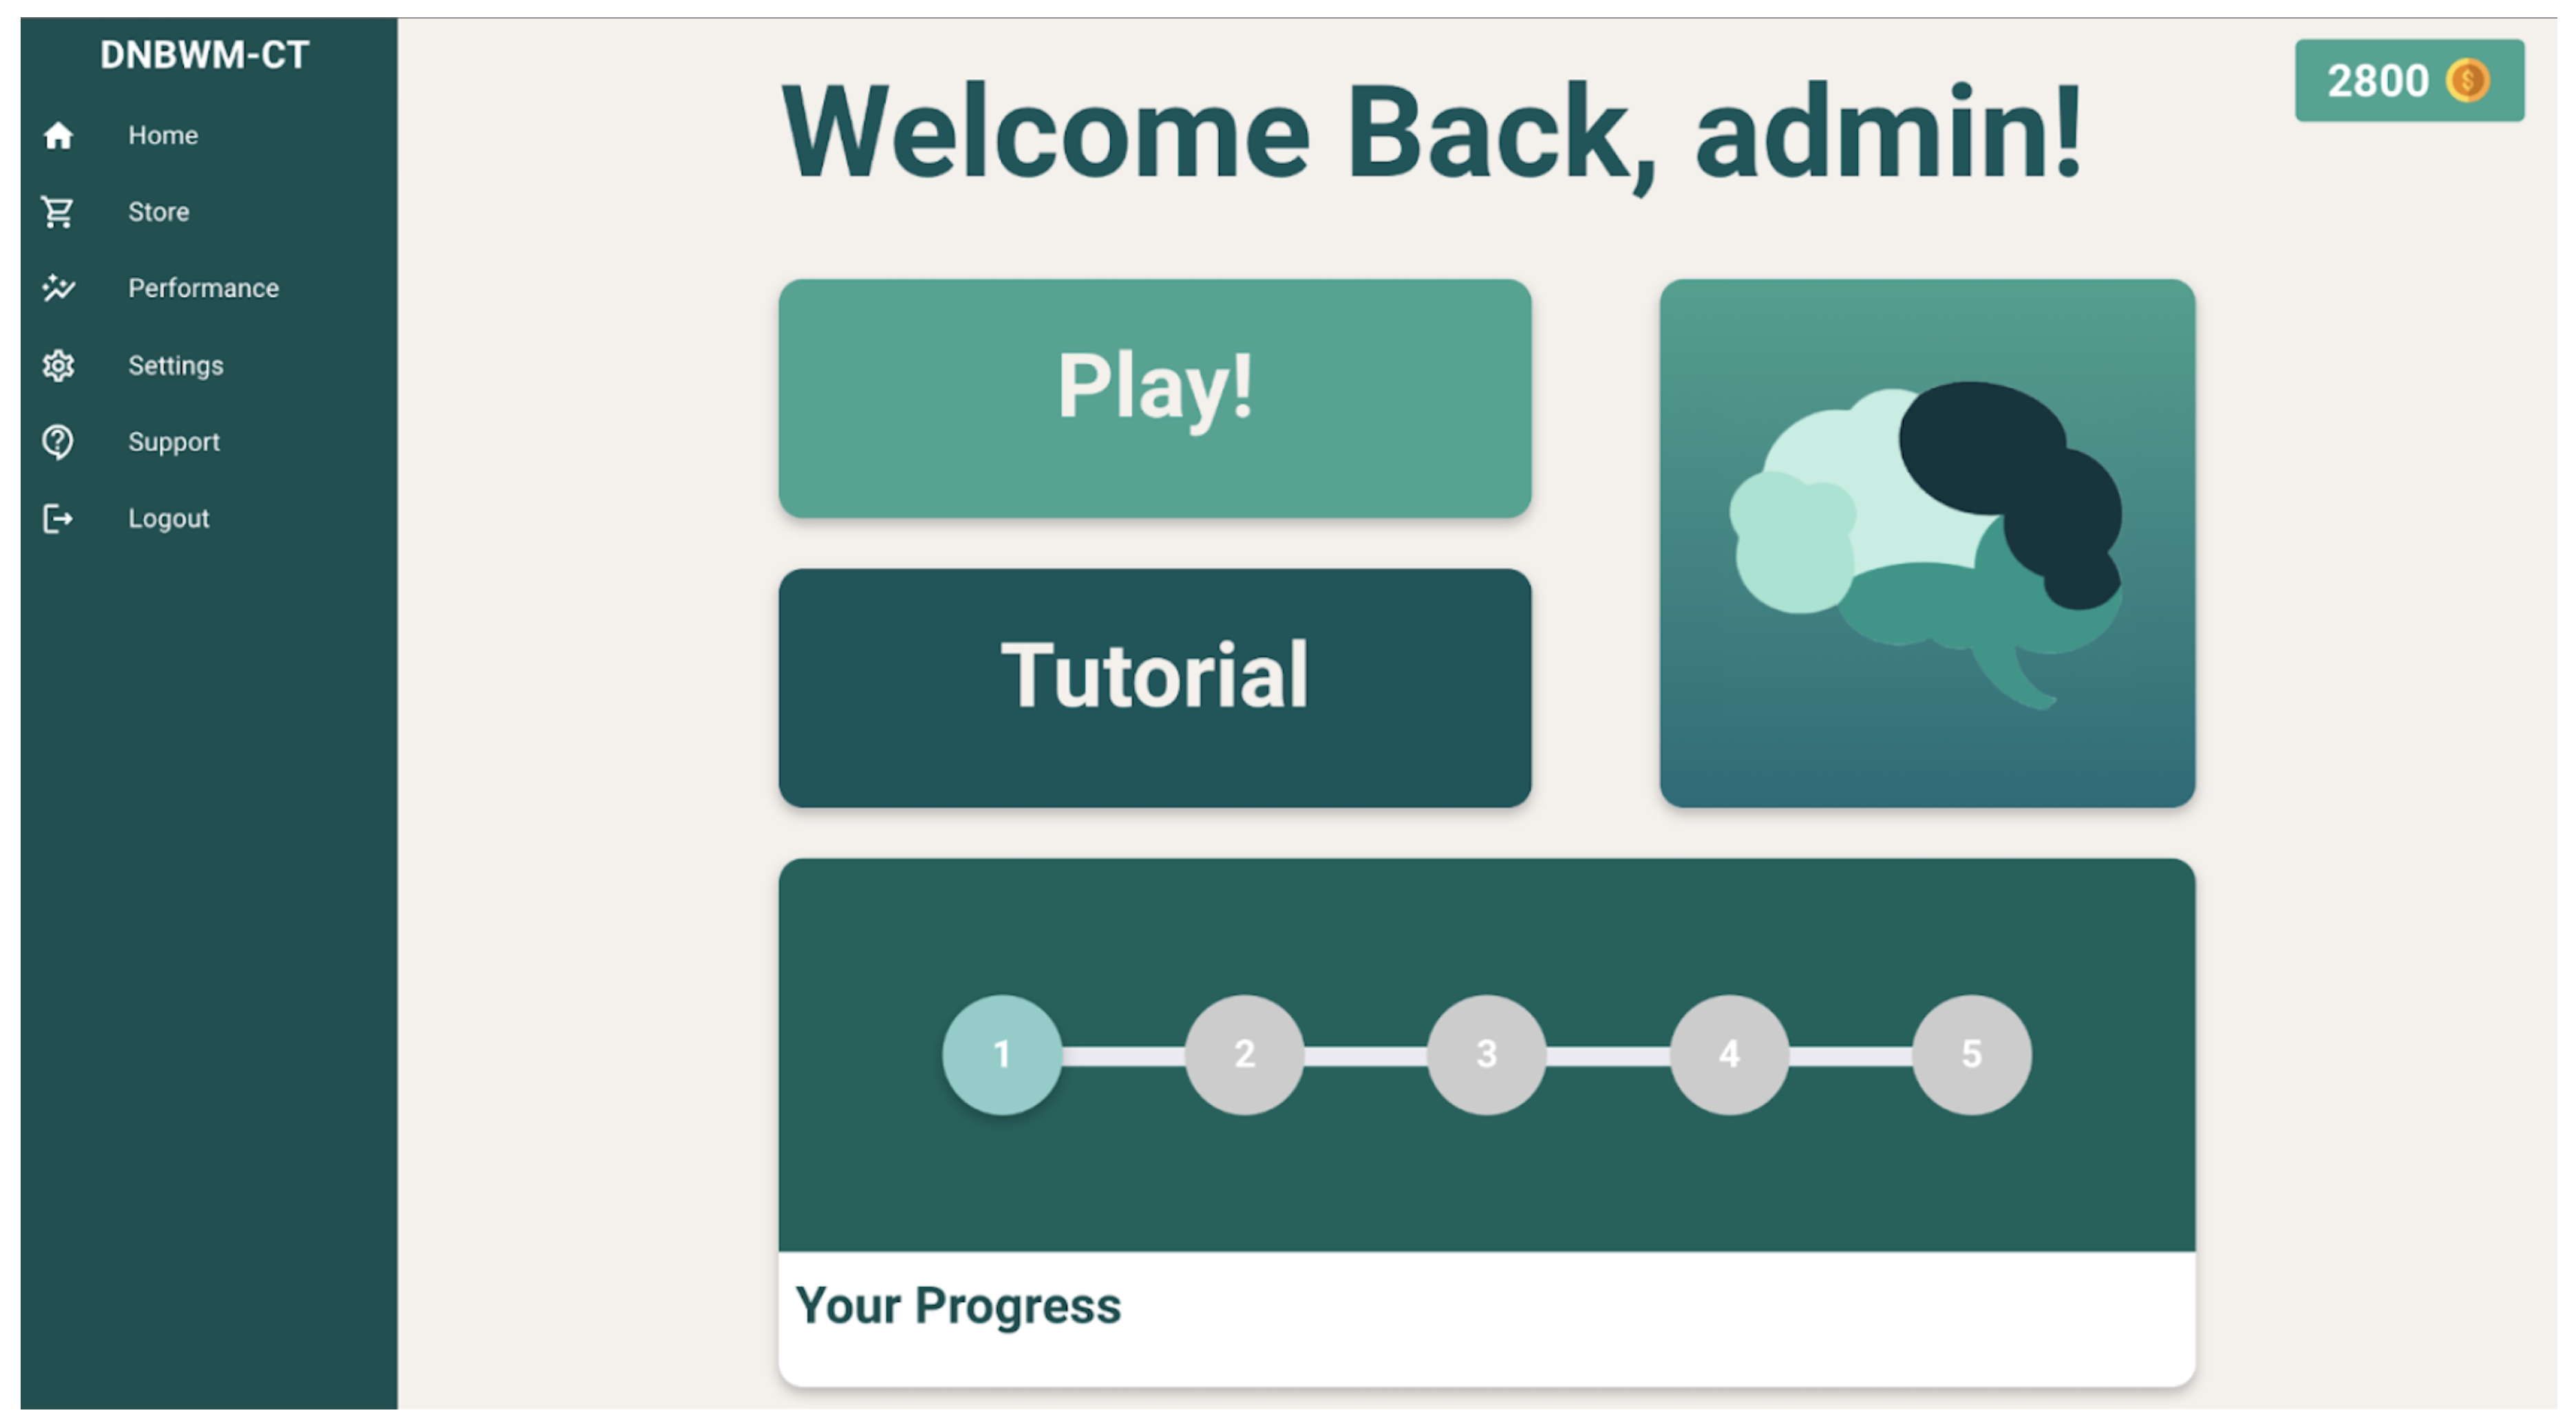
Figure 1.
This figure showcases the multidimensional game design’s homepage with its default teal color scheme, progress bar, brain evolution button, and side bar with favicons. The sidebar contains a store, a performance tab, settings, support, and a logout tab. The performance tab allows participants to view their accuracy and reaction time over the last few days they played. Settings allow them to pick and choose between different colored themes to decide how they want their homepage to look. Support allows them to contact us in case there are any issues with the game.
Disclaimer/Publisher’s Note: The statements, opinions and data contained in all publications are solely those of the individual author(s) and contributor(s) and not of MDPI and/or the editor(s). MDPI and/or the editor(s) disclaim responsibility for any injury to people or property resulting from any ideas, methods, instructions or products referred to in the content. |
© 2025 by the authors. Licensee MDPI, Basel, Switzerland. This article is an open access article distributed under the terms and conditions of the Creative Commons Attribution (CC BY) license (https://creativecommons.org/licenses/by/4.0/).
Copyright: This open access article is published under a Creative Commons CC BY 4.0 license, which permit the free download, distribution, and reuse, provided that the author and preprint are cited in any reuse.


