Submitted:
20 June 2025
Posted:
23 June 2025
You are already at the latest version
Abstract
Dosimetric analysis is a critical component in radiation therapy delivery. In radiation therapy, bolus materials are frequently used to alter the dose distribution. In this study, we used Optically Stimulated Luminescent Dosimeters (OSLDs) to carry out a thorough dosimetric examination of several bolus materials when used with high-energy photon beams. Our research aimed to assess the performance of various bolus materials in terms of dose enhancement and surface dose. The findings of this study offer important insights into choosing the best bolus material for a particular clinical situation, optimizing treatment outcomes, and ensuring proper patient care.
Keywords:
Radiotherapy
; Bolus
; Optically Stimulated Luminescent Dosimeters
; Surface dose
Introduction
This study examined the effectiveness of various bolus materials in boosting the surface dose of high-energy photon beams using optically stimulated luminescent dosimeters (OSLDs). It has been shown that OSLDs are appropriate to measure surface dose. In general, the higher the density of the bolus material, the greater the increase in the surface dose would be. The quality of the radiation beam also affects the effectiveness of a bolus material. For photon beams, the use of a bolus material is more effective at lower energies. The thickness of the bolus material also affects its effectiveness and a thicker bolus material will result in a greater increase in the surface dose.
Use of bolus to enhance the skin dose has previously been studied for chest wall applications. Andic et al. (2009) study aimed to calculate chest wall skin dose associated with different frequencies of bolus applications in post-mastectomy three-dimensional conformal radiotherapy (3D-CRT) and to provide detailed information in the selection of an appropriate bolus regimen in this clinical setting. CT-Simulation scans of 22 post-mastectomy patients were used. The chest wall for clinical target volume (CTV) and a volume including a 2-mm surface thickness of the chest wall for skin structures were delineated. The Precise PLAN 2.11 treatment planning system (TPS) was used for 3D-CRT planning. 50 Gy in 25 fractions was prescribed using tangential fields and 6-MV photons. Six different frequencies of bolus applications (0, 5, 10, 15, 20, and 25) were administered. Cumulative dose-volume histograms were generated for each bolus regimen. The minimum, maximum, and mean skin doses associated with the bolus regimens were compared. To test the accuracy of TPS dose calculations, experimental measurements were performed using EBT Gafchromic films.
Sekartaji et al. (2020) used 6 and 10 MV photon energies for dosimetry in a slab water phantom to compare a synthesized bolus with commercial boluses such as paraffin wax, paraffin, and playdough. They concluded that at 6 MV, Paraffin wax obtained a maximum surface dose of 85%, and in the case of playdough maximum surface dose was 74.85% at 10 MV.
Morris et al. (2019) study intended to develop an efficient field-in-field (FiF) planning technique using the Eclipse treatment planning system (TPS) to assess the feasibility of utilizing the Halcyon treatment delivery system for 3D treatment of breast cancer. Treatment plans were prepared on the Halcyon treatment planning system and compared to the clinically delivered TrueBeam plans of the same patients, which utilized flattened 6 MV and 10 MV beams. Patients selected for this study were treated with simple, tangential breast irradiation and did not receive radiotherapy for the supraclavicular or internal mammary lymph nodes. Planning target volumes (PTV) ranged from 519 cc to 1211 cc, with a mean target volume of 877 cc. Several planning techniques involving collimator and gantry rotation, along with the number of FiF segments, were investigated, as well as the use of the dynamically flattened beam (DFB), a predefined MLC pattern designed to provide a flattened beam profile at 10 cm depth on a standard water phantom. For comparison, the clinically delivered TrueBeam plans remained unaltered, except for normalization of the target coverage to allow a more straightforward comparison of the two treatment delivery techniques.
Method and Materials
A male Alderson Rando phantom (RSD, Long Beach, CA) was scanned using a Philips Big Bore CT scanner (Philips Medical Center, Cleveland, OH), and the images were exported to the Pinnacle treatment planning system (Philips, Milpitas, CA) for creation of treatment plans as described below.
Two two-field tangent plans were created, one using 6, and the other 10 MV on the chest area of the phantom. The plans were exported to the Mosaiq record and verify system (Elekta, Atlanta, GA) for subsequent delivery on an Elekta Synergy linear accelerator. An additional volumetric modulated arc therapy (VMAT) plan was created using three 6 MV arcs in the head and neck region for delivery on a Varian TrueBeam linear accelerator and exported to Mosaiq as well. An additional helical tomotherapy head and neck plan was generated using the Accuray Precision treatment planning system (Accuray, Sunnyvale, CA) for delivery on an Accuray Radixact unit. All the above plans were generated to mimic actual patient treatment plans, with similar dose constraints utilized for them.
For the measurements, we utilized nanodots (Landauer dosimetry, Glenwood, IL). These synthetic sapphire OSLDs consist of plastic disks infused with Aluminum oxide doped with carbon (Al2O3:C) and are enclosed in light-tight plastic holders. We employed an In-light microstar reader from Landauer dosimetry, operating in continuous wave mode with a 1-second illumination period. Before measurements, a subset of OSLDs from each batch was exposed to various known doses to establish calibration curves.
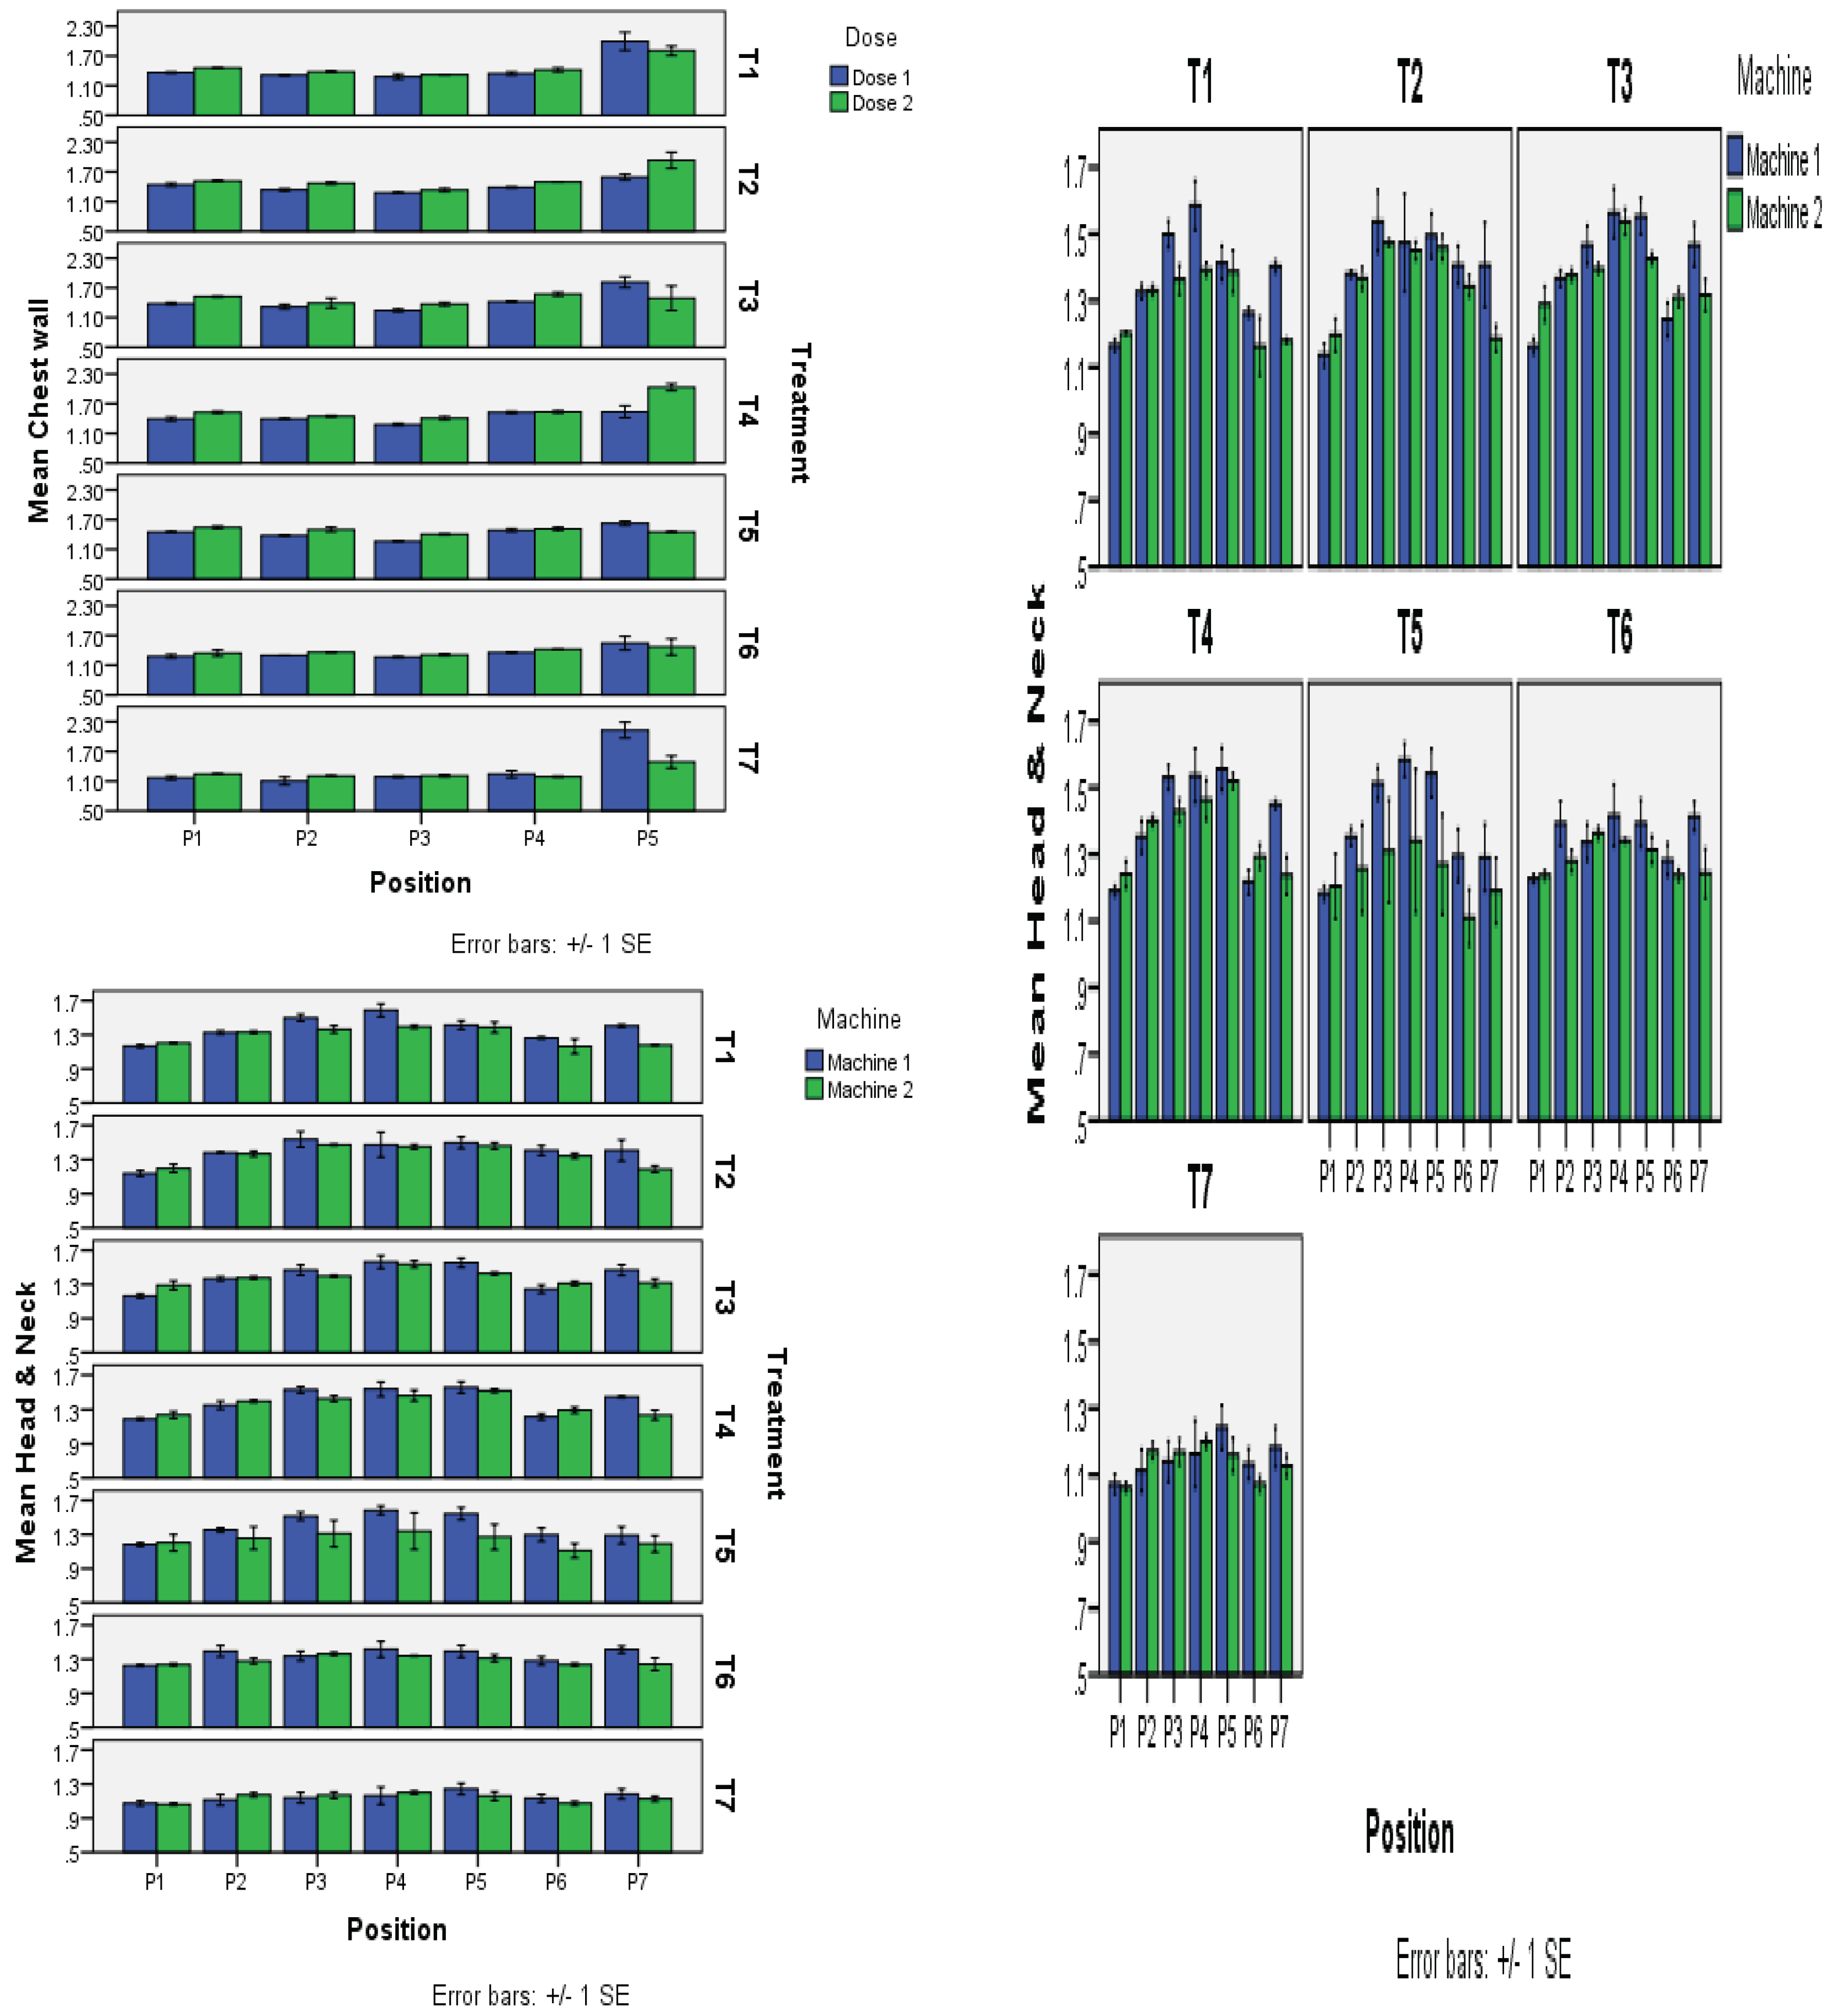
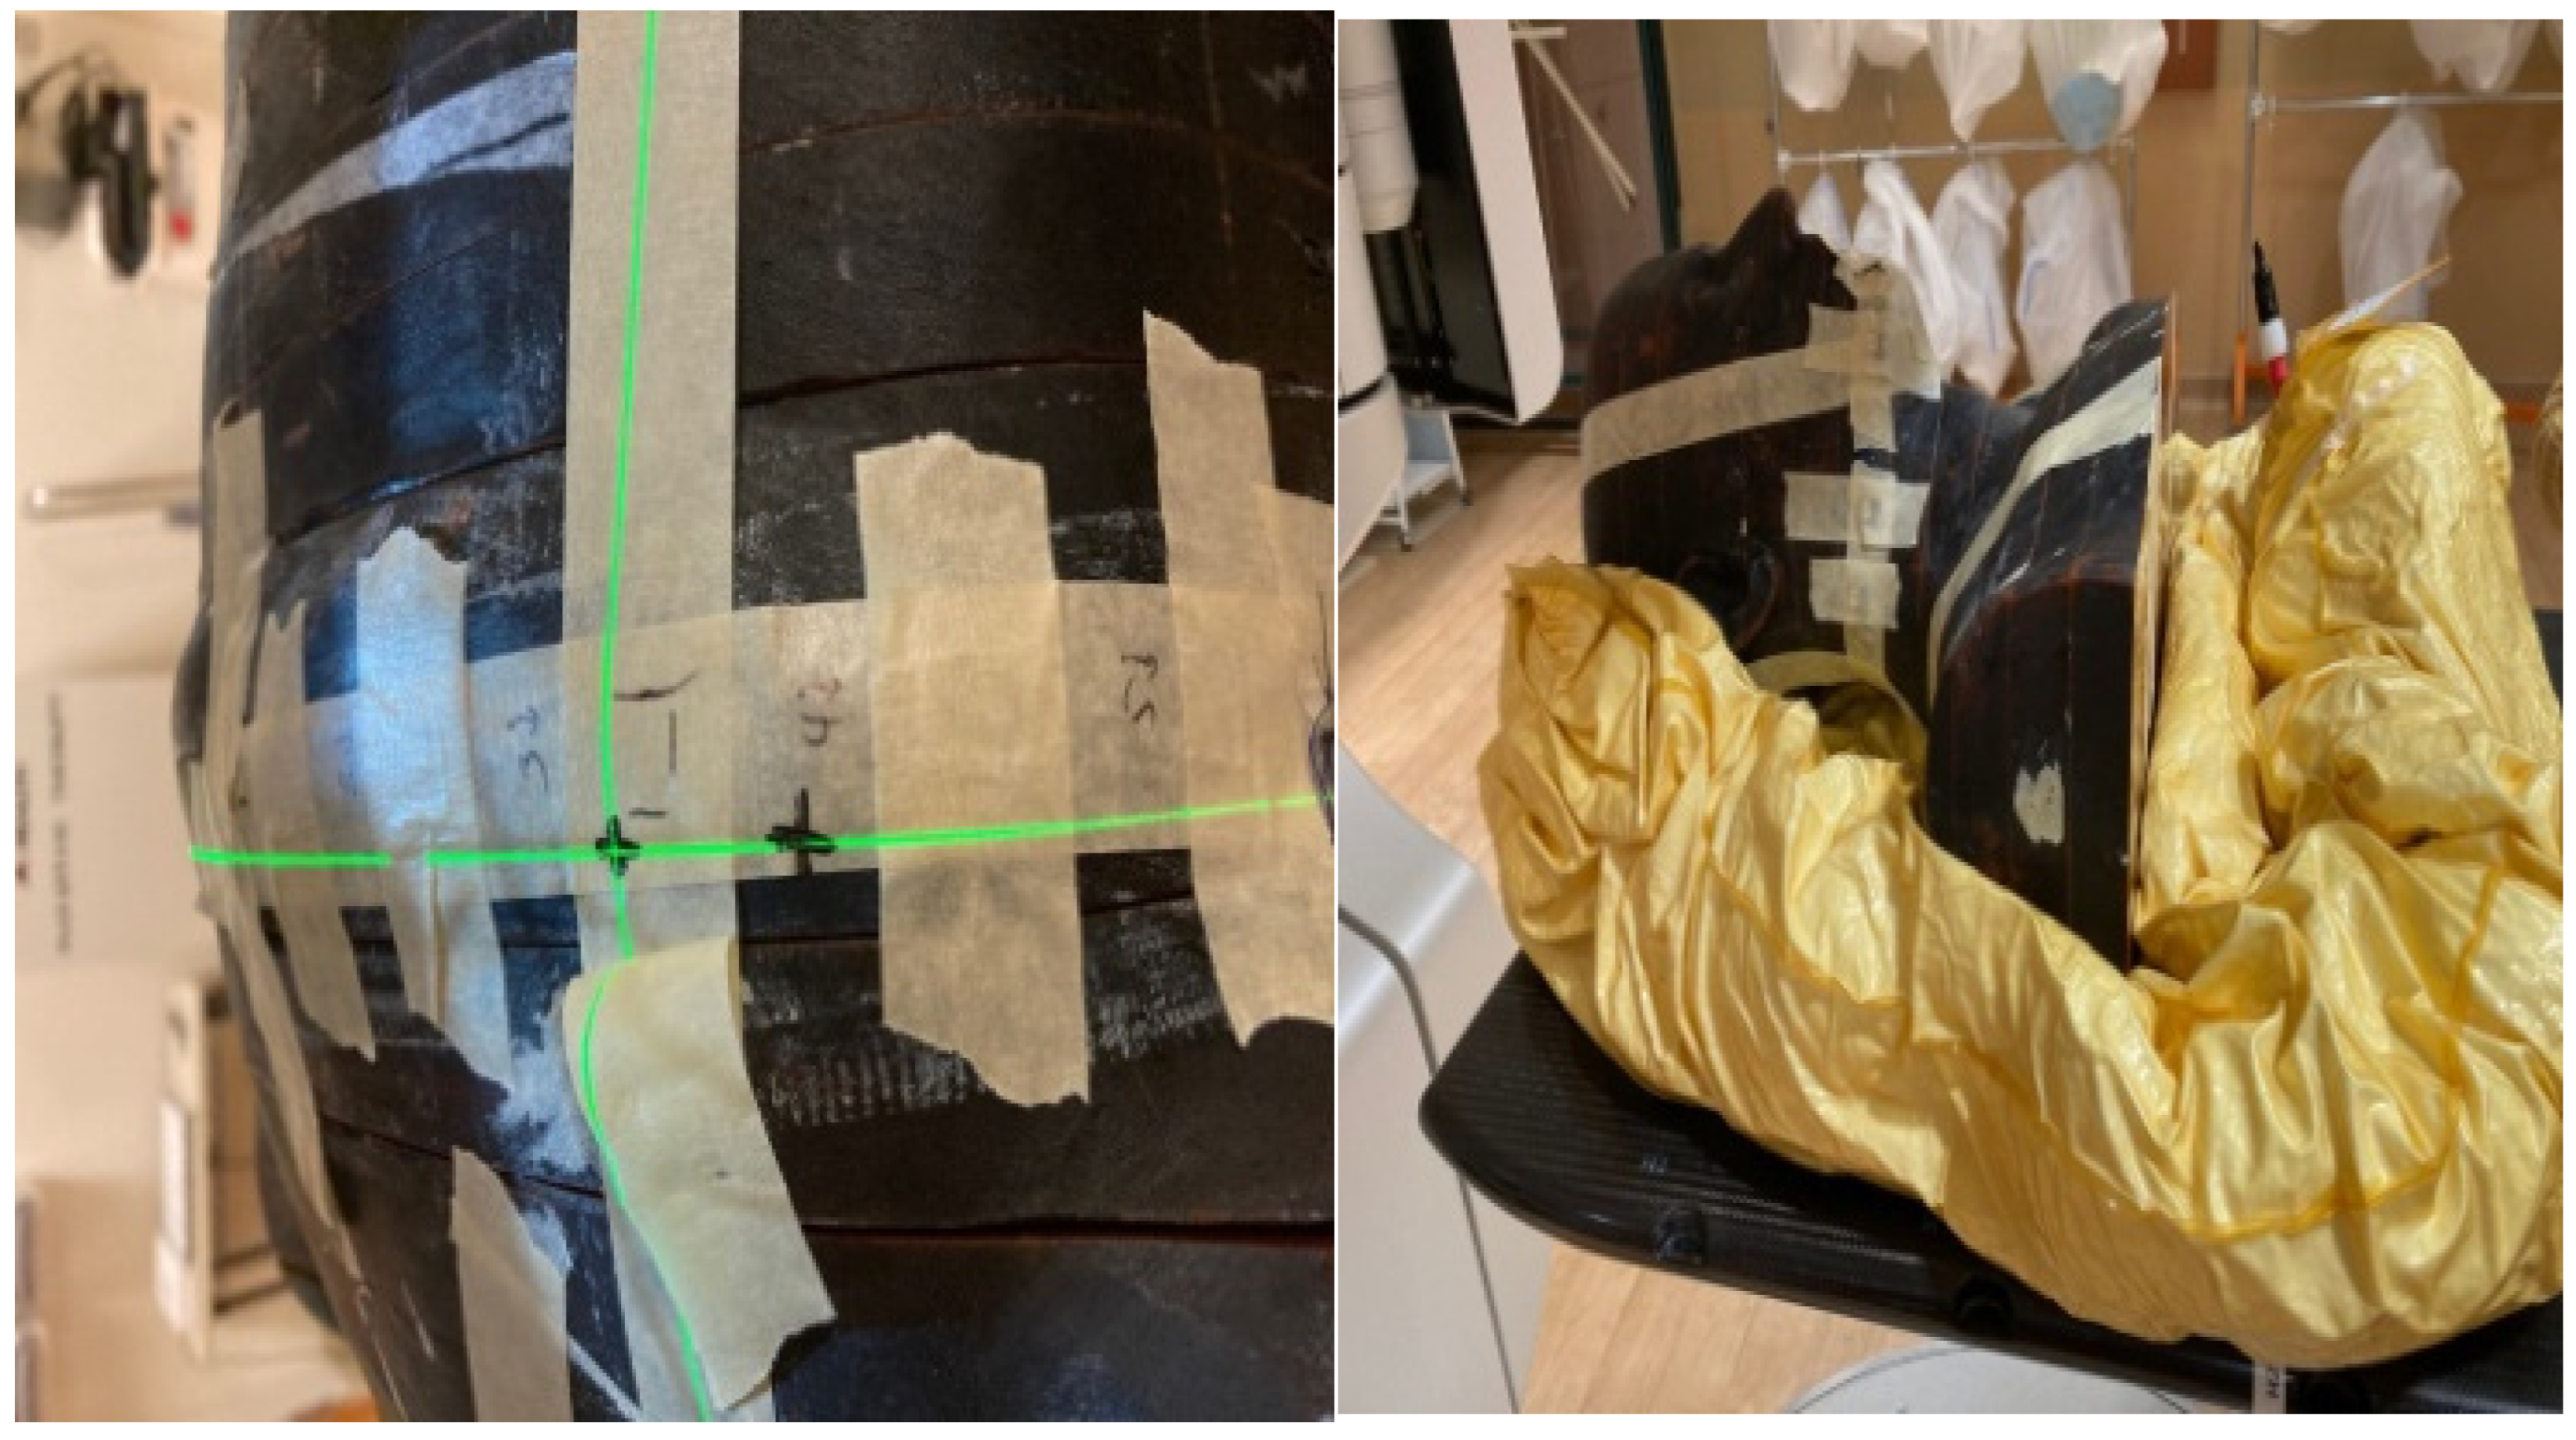
All measurements were carried out in triplicate for each bolus material, and without bolus, enabling the calculation of an average bolus-to-non-bolus ratio. In the chest wall region, we pre-selected five points from medial to lateral sides, while for the head and neck region, seven points were chosen from right to left of the phantom (Figure 1). Following each measurement, the OSLDs were annealed for 48 hours on a lightbox before reuse.
The bolus materials evaluated were Superflab (3 and 5 mm), Elastogel, solid Aquaplast, Klarity, Brass mesh, and wash cloth.
Elastogel is a silicone gel-based, low-density bolus substance. It is 0.5 cm thick, with a density of 0.2 g/cm3. (Sekartaj et al. 2023) When it comes to enhancing the surface dose of radiation therapy beams, Elastogel is less successful than Super Flab. It is less prone to trigger skin problems and is more comfortable for patients to wear. Superflab, a low-density silicone gel, offers comfort and skin adherence and has been used extensively in radiation therapy.
Benoit et al. (2009) research assessed the performance of wet gauze as a bolus material against commercial products such as Superflab. Wet gauze with a physical density of about 1.02 g/cm3 was found to be as effective as Superflab for large field sizes. Variations in wetness levels, however, influenced its performance, with both too wet (1.2 g/cm3) and less wet (0.75 g/cm3) gauze being less effective. Although this research is centered on wet gauze, it appears from the findings that wet towels, were they made up to a comparable density and thickness, might make a useful substitute in some clinical situations.
Hsu et al. (2008) study describes a thermoplastic substance called Aquaplast that can be molded to take on the form of the patient’s body. It is 0.5 cm thick, with a density of 1.0 g/cm3. Patients who need to wear a bolus material for a long time or who have irregular body shapes frequently utilize Aquaplast. However, it is more comfortable for patients to wear and it is less likely to cause skin reactions than other bolus materials. This research compared the dosimetric characteristics of different bolus materials, such as Aquaplast, used in chest wall radiotherapy. The results revealed that Aquaplast, which is a thermoplastic, can be conformed to the patient’s body and offers an effective dose buildup similar to other bolus materials. Its ability to conform means it can be used for patients with abnormal body shapes, and its characteristics may lead to greater patient comfort during treatment. Water and polyacrylamide are combined to create the bolus substance known as Klarity. It is 0.5 cm thick, with a density of 0.9 g/cm3. The surface dose of radiation therapy beams can be significantly increased with the help of Klarity. In comparison to other bolus materials, it is less prone to produce skin responses and is also quite comfortable for patients to wear.
Healy et al. (2013), Brass mesh bolus is built from a standard mesh of interconnected brass discs, which constitute a flexible material that can be used to adapt to irregular body surfaces in radiation therapy. The bolus has a physical thickness of 1.5 mm and a density of about 8.73 g/cm3. It offers a tissue-equivalent thickness of 2.0 mm to 3.0 mm. Experiments have demonstrated that a brass mesh bolus will enhance the surface dose substantially in radiation therapy and can be used for the treatment of malignancies near the body surface. Brass mesh has a thickness of 1 mm and a density of 8 g/cm3[4]. It is the most efficient bolus material for boosting the radiation beams’ surface dose to malignancies that are close to the body’s surface.
Results

Table 1.
This table shows that, because all of the major variables (Treatment, Dose, Position) and their interactions have p-values less than 0.05, they all significantly affect the outcome being examined. The strength of these effects is revealed by the F-values.
Table 1.
This table shows that, because all of the major variables (Treatment, Dose, Position) and their interactions have p-values less than 0.05, they all significantly affect the outcome being examined. The strength of these effects is revealed by the F-values.
| Source of variation | Degrees of freedom | Sum of squares | Mean squares | F-value | P-value |
|---|---|---|---|---|---|
| Treatment | 6 | 0.84690 | 0.14115 | 10.54** | 0.0000 |
| Dose | 1 | 0.11905 | 0.11905 | 8.89** | 0.0034 |
| Position | 4 | 4.29733 | 1.07433 | 80.21** | 0.0000 |
| Treatment*Dose | 6 | 0.34412 | 0.05735 | 4.28** | 0.0005 |
| Treatment*Position | 24 | 1.15051 | 0.04794 | 3.58** | 0.0000 |
| Dose*Position | 4 | 0.22856 | 0.05714 | 4.27** | 0.0027 |
| Treatment*Dose*Position | 24 | 1.09450 | 0.04560 | 3.40** | 0.0000 |
| Error | 140 | 1.87527 | 0.01339 | ||
| Total | 209 | 9.95624 |
Table 2.
Comparison of means; (A) Dose x Treatment interaction mean±SE.
| Dose | Treatment | Mean | ||||||
|---|---|---|---|---|---|---|---|---|
| T1 | T2 | T3 | T4 | T5 | T6 | T7 | ||
| Dose 1 | 1.46±0.08abc | 1.41±0.03cd | 1.43±0.06bc | 1.42±0.03bc | 1.44±0.03bc | 1.35±0.04cd | 1.37±0.11cd | 1.41±0.02B |
| Dose 2 | 1.48±0.05abc | 1.55±0.06ab | 1.47±0.05abc | 1.59±0.06a | 1.48±0.02abc | 1.38±0.03cd | 1.27±0.04d | 1.46±0.02A |
| Mean | 1.47±0.05a | 1.48±0.04a | 1.45±0.04ab | 1.51±0.04a | 1.46±0.02a | 1.36±0.02bc | 1.32±0.06c |
The effects of different dosages (Dose 1 and Dose 2) were examined across several treatments (T1 to T7), and the results are summarized in the table below. The average response to each dose across all treatments is shown in the “Mean” row. For each treatment-dose combination, the values in the table show the means along with the corresponding standard deviations (marked by). For statistically significant differences between treatments within the same dose group, the letters (a, b, c, d, A, B) are employed as indicators. Treatments that share the same letter do not differ greatly from one another. As an illustration, the means of treatments T2 and T4 in Dose 1 are similar (1.410.03cd and 1.420.03bc, respectively), as they both share the same letters “c” and “d,” indicating no discernible difference between them.
In conclusion, the table offers a clear way to contrast the results of several treatments at two distinct doses, with letters designating which treatments are statistically equivalent or dissimilar.
Table 3.
(B) Position x Treatment interaction Mean ±SE.
| Dose | Treatment | Mean | ||||||
|---|---|---|---|---|---|---|---|---|
| T1 | T2 | T3 | T4 | T5 | T6 | T7 | ||
| P1 | 1.41±0.02d-g | 1.48±0.02de | 1.45±0.03d-g | 1.46±0.04def | 1.50±0.03de | 1.31±0.04e-h | 1.21±0.02fgh | 1.40±0.02BC |
| P2 | 1.35±0.02e-h | 1.40±0.03d-h | 1.35±0.05e-h | 1.42±0.02d-g | 1.44±0.03d-g | 1.33±0.02e-h | 1.15±0.04h | 1.35±0.02CD |
| P3 | 1.30±0.03e-h | 1.31±0.02e-h | 1.31±0.03e-h | 1.34±0.03e-h | 1.33±0.03e-h | 1.29±0.02e-h | 1.20±0.01gh | 1.30±0.01D |
| P4 | 1.38±0.03e-h | 1.44±0.03d-g | 1.50±0.04de | 1.53±0.02cde | 1.50±0.02de | 1.39±0.02e-h | 1.22±0.03fgh | 1.42±0.02B |
| P5 | 1.90±0.10a | 1.76±0.11abc | 1.65±0.14a-d | 1.79±0.13ab | 1.54±0.04b-e | 1.51±0.10de | 1.81±0.17a | 1.71±0.05A |
This table displays results from an experiment in which seven treatments (T1–T7) were used to examine the effects of different dosages (Dose) given to five different groups or populations (P1–P5). The response average for each population across all treatments is shown in the “Mean” row. The values in the table represent the average outcomes for each treatment-population combination, along with the corresponding standard deviations (marked by). The following letters are used to denote statistically significant differences between treatments within the same population group: a, b, c, d, e, f, g, h, A, B, C, D. The differences between treatments beginning with the same letter are not very distinct. For instance, treatments T1, T3, and T6 in Population 1 (P1) had comparable averages (1.410.02d-g, 1.450.03d-g, and 1.310.04e-h), as they share the same letters ‘d’, ‘e’, ‘f’, ‘g’, and ‘h,’ showing no substantial difference between them. The aggregate average of each population’s responses is displayed in the “Mean” row. The mean response, for Population 1, is 1.40 0.02 BC for all treatments.
Table 4.
(C) Dose x Position x Treatment interaction Mean ±SE.
| Dose | Position | Treatment | Mean | ||||||
|---|---|---|---|---|---|---|---|---|---|
| T1 | T2 | T3 | T4 | T5 | T6 | T7 | |||
| Dose 1 | P1 | 1.36±0.01f-j | 1.44±0.04d-j | 1.38±0.03f-j | 1.39±0.04f-j | 1.45±0.01d-j | 1.28±0.04f-j | 1.17±0.04ij | 1.35±0.02BCD |
| P2 | 1.31±0.01f-j | 1.34±0.02f-j | 1.32±0.05f-j | 1.39±0.02f-j | 1.38±0.02f-j | 1.30±0.00f-j | 1.10±0.08j | 1.31±0.02CD | |
| P3 | 1.28±0.05f-j | 1.28±0.02f-j | 1.24±0.03f-j | 1.28±0.03f-j | 1.26±0.01f-j | 1.26±0.01f-j | 1.19±0.02hij | 1.26±0.01D | |
| P4 | 1.34±0.04f-j | 1.39±0.01f-j | 1.42±0.02e-j | 1.52±0.02d-i | 1.48±0.03d-j | 1.36±0.01f-j | 1.24±0.07f-j | 1.39±0.02BC | |
| P5 | 2.00±0.18ab | 1.59±0.06c-g | 1.81±0.11a-d | 1.54±0.12d-i | 1.63±0.04b-f | 1.54±0.14c-i | 2.13±0.16a | 1.75±0.06A | |
| Dose 2 | P1 | 1.46±0.01d-j | 1.52±0.01d-i | 1.52±0.01d-i | 1.53±0.02d-i | 1.54±0.03c-i | 1.34±0.06f-j | 1.24±0.01f-j | 1.45±0.03B |
| P2 | 1.38±0.01f-j | 1.47±0.02d-j | 1.39±0.10f-j | 1.45±0.01d-j | 1.50±0.05d-i | 1.36±0.01f-j | 1.20±0.01g-j | 1.39±0.02BC | |
| P3 | 1.32±0.01f-j | 1.33±0.04f-j | 1.37±0.03f-j | 1.41±0.03f-j | 1.40±0.01f-j | 1.31±0.02f-j | 1.21±0.02g-j | 1.34±0.02CD | |
| P4 | 1.42±0.04e-j | 1.50±0.00d-i | 1.57±0.04c-h | 1.53±0.02d-i | 1.51±0.03d-i | 1.42±0.01e-j | 1.19±0.01hij | 1.45±0.03B | |
| P5 | 1.81±0.10a-e | 1.93±0.16abc | 1.49±0.25d-j | 2.03±0.07a | 1.45±0.02d-j | 1.47±0.17d-j | 1.49±0.12d-j | 1.67±0.07A |
Means sharing similar letters in a row or a column are statistically non-significant (P>0.05). Small letters represent comparisons among interaction means, and capital letters are used for the overall mean.
The table displays the outcomes of an experiment in which five distinct positions each received a different dose of a treatment, and the effects were calculated across seven treatments. Which treatments are statistically comparable or different within each dose-position group are denoted by letters next to the mean values. Because they all share the same letters “d,” “f,” “g,” “h,” “i,” and “j,” treatments T2, T4, and T5 have similar means (1.440.04d-j) in Dose 1 and Position P1, showing no discernible difference between them. The “Mean” row displays the average reaction across all dose and location combinations. For instance, 1.350.02BCD is the mean response for Dose 1 and Position P1 across all treatments. In essence, the table offers a clear means of comparing the impacts of various treatments on five distinct positions for each of the two doses, with letters designating which treatments are statistically comparable or different within each dose-position group.
In conclusion, the table offers a clear method to assess the effects of various treatments on five distinct positions for each of the two dosages, with letters designating which treatments are statistically comparable or different within each dose-position group. Using concise language
Table 5.
Analysis of variance table for Head & Neck.
| Source of variation | Degrees of freedom | Sum of squares | Mean squares | F-value | P-value |
|---|---|---|---|---|---|
| Treatment | 6 | 1.85225 | 0.30871 | 26.66** | 0.0000 |
| Machine | 1 | 0.28229 | 0.28229 | 24.38** | 0.0000 |
| Position | 6 | 2.16754 | 0.36126 | 31.20** | 0.0000 |
| Treatment*Machine | 6 | 0.14921 | 0.02487 | 2.15* | 0.0497 |
| Treatment*Position | 36 | 0.43392 | 0.01205 | 1.04NS | 0.4144 |
| Machine*Position | 6 | 0.26335 | 0.04389 | 3.79** | 0.0014 |
| Treatment*Machine*Position | 36 | 0.24144 | 0.00671 | 0.58NS | 0.9734 |
| Error | 196 | 2.26933 | 0.01158 | ||
| Total | 293 | 7.65933 |
NS = Non-significant (P>0.05); * = Significant (P<0.05); ** = Highly significant (P<0.01).
According to the table’s low P-values and high F-values, the “Treatment,” “Machine,” and “Position” components, as well as their interactions (aside from “Treatment Machine Position”), have a statistically significant effect on the study’s conclusion. Both the “Treatment Machine Position” interaction and the “Treatment*Position” interaction have P-values above 0.05, thus they are not statistically significant.
Table 7.
(A) Dose x Treatment interaction Mean ± SE.
| Machine | Treatment | Mean | ||||||
|---|---|---|---|---|---|---|---|---|
| T1 | T2 | T3 | T4 | T5 | T6 | T7 | ||
| Machine 1 |
1.38±0.03ab | 1.41±0.04a | 1.40±0.04a | 1.40±0.04a | 1.39±0.04ab | 1.35±0.02ab | 1.15±0.02d | 1.36±0.01A |
| Machine 2 |
1.29±0.03bc | 1.35±0.03ab | 1.38±0.02ab | 1.37±0.03ab | 1.24±0.05cd | 1.29±0.02bc | 1.14±0.01d | 1.29±0.01B |
| Mean | 1.33±0.02ABC | 1.38±0.02ABC | 1.39±0.02A | 1.39±0.02AB | 1.32±0.03C | 1.32±0.02BC | 1.14±0.01D |
The performance of two machines (Machine 1 and Machine 2) throughout several treatments (T1 to T7) is shown in this table. The overall mean for each therapy is also shown in the table. The numbers in the table are measurements for each machine and treatment combination. Lowercase letters (a, b, c) are used to indicate statistically similar groups inside each machine, and uppercase letters (A, B, C, D) are used to indicate statistically similar groups across machines. The numbers are reported in the format “mean standard deviation.” For instance, Treatment T1 in Machine 1 has a mean of 1.38 and a standard deviation of 0.03, and it is statistically identical to Treatments T2, T3, T4, and T5 (denoted by the same letter “a”). The “Mean” column offers the average results for each procedure on both machines.
In conclusion, this table compares the performance of two machines (Machine 1 and Machine 2) under various treatments and highlights groupings of treatments that are statistically similar based on averages and standard deviations.
Table 8.
(B) Position x Treatment interaction Mean ± SE.
| Position | Treatment | Mean | ||||||
|---|---|---|---|---|---|---|---|---|
| T1 | T2 | T3 | T4 | T5 | T6 | T7 | ||
| P1 | 1.19±0.01 | 1.17±0.03 | 1.23±0.04 | 1.22±0.02 | 1.19±0.04 | 1.23±0.01 | 1.07±0.01 | 1.18±0.01D |
| P2 | 1.33±0.01 | 1.37±0.02 | 1.37±0.01 | 1.38±0.03 | 1.31±0.06 | 1.34±0.04 | 1.14±0.03 | 1.32±0.02B |
| P3 | 1.43±0.04 | 1.51±0.04 | 1.43±0.03 | 1.48±0.03 | 1.41±0.09 | 1.35±0.03 | 1.16±0.03 | 1.40±0.02A |
| P4 | 1.49±0.06 | 1.46±0.07 | 1.55±0.04 | 1.50±0.05 | 1.46±0.11 | 1.38±0.05 | 1.18±0.05 | 1.43±0.03A |
| P5 | 1.40±0.04 | 1.48±0.03 | 1.49±0.04 | 1.54±0.03 | 1.41±0.10 | 1.35±0.04 | 1.20±0.04 | 1.41±0.02A |
| P6 | 1.21±0.05 | 1.38±0.03 | 1.28±0.03 | 1.26±0.03 | 1.20±0.07 | 1.26±0.03 | 1.10±0.03 | 1.24±0.02CD |
| P7 | 1.29±0.05 | 1.30±0.08 | 1.39±0.05 | 1.34±0.05 | 1.24±0.07 | 1.33±0.05 | 1.16±0.03 | 1.29±0.02BC |
Data for various positions (P1 to P7) and their performance across various treatments (T1 to T7) are shown in the table below. The performance of a particular position under a certain treatment is represented in each table cell by a mean value with a standard deviation. Based on averages and standard deviations, uppercase letters (A, B, C, and D) are used to denote statistically related groups of positions. Positions P3, P4, P5, and P6 have statistically identical performance, which is denoted by the letters “A” for P3, P4, and P5, and “CD” for P6. The “Mean” row displays the overall means for each therapy, taking into account all positions.
Table 9.
(C) Dose x Position x Treatment interaction Mean ± SE.
| Dose | Position | Treatment | Mean | ||||||
|---|---|---|---|---|---|---|---|---|---|
| T1 | T2 | T3 | T4 | T5 | T6 | T7 | |||
| M1 | P1 | 1.17±0.02 | 1.14±0.03 | 1.16±0.02 | 1.19±0.02 | 1.18±0.02 | 1.23±0.01 | 1.07±0.03 | 1.16±0.01H |
| P2 | 1.33±0.02 | 1.38±0.01 | 1.37±0.02 | 1.35±0.05 | 1.35±0.03 | 1.39±0.07 | 1.11±0.06 | 1.33±0.02C-F | |
| P3 | 1.50±0.04 | 1.54±0.09 | 1.47±0.06 | 1.53±0.04 | 1.51±0.05 | 1.34±0.05 | 1.14±0.06 | 1.43±0.04ABC | |
| P4 | 1.59±0.07 | 1.47±0.15 | 1.56±0.08 | 1.54±0.08 | 1.58±0.05 | 1.42±0.09 | 1.16±0.10 | 1.47±0.04A | |
| P5 | 1.41±0.05 | 1.50±0.07 | 1.55±0.05 | 1.56±0.06 | 1.54±0.07 | 1.39±0.07 | 1.24±0.07 | 1.46±0.03AB | |
| P6 | 1.26±0.01 | 1.41±0.06 | 1.24±0.05 | 1.22±0.04 | 1.30±0.08 | 1.28±0.05 | 1.13±0.05 | 1.26±0.02E-H | |
| P7 | 1.40±0.02 | 1.41±0.13 | 1.47±0.06 | 1.45±0.01 | 1.29±0.10 | 1.41±0.04 | 1.18±0.06 | 1.37±0.03A-E | |
| M2 | P1 | 1.20±0.00 | 1.20±0.05 | 1.29±0.05 | 1.24±0.04 | 1.20±0.10 | 1.24±0.01 | 1.06±0.01 | 1.20±0.02GH |
| P2 | 1.33±0.02 | 1.37±0.03 | 1.38±0.02 | 1.40±0.02 | 1.26±0.13 | 1.28±0.03 | 1.17±0.02 | 1.31±0.02D-G | |
| P3 | 1.36±0.04 | 1.47±0.01 | 1.40±0.01 | 1.43±0.04 | 1.31±0.16 | 1.36±0.02 | 1.17±0.04 | 1.36±0.03B-E | |
| P4 | 1.39±0.02 | 1.45±0.03 | 1.54±0.04 | 1.46±0.06 | 1.34±0.22 | 1.34±0.01 | 1.20±0.02 | 1.39±0.04A-D | |
| P5 | 1.39±0.06 | 1.46±0.04 | 1.43±0.02 | 1.52±0.02 | 1.27±0.15 | 1.31±0.04 | 1.16±0.05 | 1.36±0.03B-E | |
| P6 | 1.16±0.09 | 1.34±0.03 | 1.31±0.03 | 1.29±0.04 | 1.11±0.08 | 1.24±0.02 | 1.07±0.02 | 1.22±0.03FGH | |
| P7 | 1.18±0.01 | 1.19±0.04 | 1.32±0.05 | 1.24±0.06 | 1.19±0.10 | 1.24±0.07 | 1.13±0.03 | 1.21±0.02GH |
Means sharing similar letters in a row or a column are statistically non-significant (P>0.05). Small letters represent comparisons among interaction means, and capital letters are used for the overall mean. The information in this table pertains to multiple placements (P1 to P7), two machines (M1 and M2), and a range of treatments (T1 to T7) and doses. Each cell’s numbers show the average performance along with its standard deviation. Positions with statistically similar performance are grouped using uppercase letters (A, B, C, D, etc.) based on their means and standard deviations. It enables comparison of the effects of various settings, tools, therapies, and dosages on performance. The “Mean” row displays the treatment-specific average values across all placements and dosages.
In conclusion, the table indicates statistically similar groups among positions and aids in the analysis of how various factors affect performance across positions, treatments, and doses.
Figure 2.
Conclusions
This study was designed to investigate the effect of various bolus materials in enhancing the skin dose of applied radiation/photon beams to irradiate the local surface, while controlling access of radiation to the non-target vital internal organs. Two study locations on Rando phantom included chest wall and head & neck. All seven bolus materials, including Superflab 5mm, Superflab 3 mm, Brass mesh, Aquaplast, Elastogel, Klarity and wash cloth, were subjected to three sources of radiation/machines, namely, Electra (linac), True beam (linac) and Radixact (Tomo). The Electra was selected while studying the chest wall therapy with high-energy photon beams of 6 and 10 MV from medial to lateral tangent plan. The other two machines, true beams and Radixact, were operated on only a single energy level of 6 MV for the more sensitive area of head & neck. The results were recorded in triplicate to obtain the average of the bolus-to-non-bolus ratio for skin dose enhancement. On the chest wall, five points were pre-selected from medial to lateral side, while seven points were chosen from nose to nose for the head & neck region, for studying the total absorbed dose by the OSLDs. Afterwards, the OSLDs were carried to the dosimeter for quantification purposes to reach the final bolus-to-non-bolus ratio of skin dose from the applied radiation. The results so obtained for the chest wall showed that not all the studied boluses provided a significant increase in skin dose by increasing the applied radiation level. The highest skin dose of 1.55 on the chest wall was obtained when Superflab 5mm was used against a 10 MV energy level. While Superflab 3mm and Klarity were found equally good, providing the second highest ratio of 1.48 for skin dose, being closely followed by Aquaplast, giving a reading of 1.47 at 10 MV, and Superflab 3mm with a measurement of 1.46 (6 MV). For True beam using 6 MV radiation dose, the Aquaplast provided the highest bolus-to-no-bolus ratio of 1.42 for skin dose, but all the rest also followed very closely and did not differ significantly for the intended purpose of skin dose enhancement. The washing cloth recorded the least ratio of 1.15. So, the overall descending order of all the studied bolus materials could be found as follows: Aquaplast (1.42)>Superflab 5mm (1.4) ≈Elastogel (1.4) >Klarity (1.39) >Superflab 3 mm (1.38) >Brass mesh (1.35) > Washing cloth (1.15). Almost the same results were recorded with Radixact too on 6 MV level, where the descending order for bolus to no bolus ratio for skin dose could be arranged as; Aquaplast (1.38)>Elastogel (1.37) >Superflab 5mm (1.36) >Klarity (1.35) >Superflab 3 mm (1.29) ≈ Brass mesh (1.29) > Washing cloth (1.12).
Key Points:
Non-significant increase in skin dose enhancement by increasing energy level from 6 MV to 10 MV on the chest wall through Electra. A thickness of Superflab material up to 5 mm could not bring a promising enhancement in skin dose over what was already obtained with a 3mm thickness. All the studied bolus materials did not differ much in the intended purpose of enhancing the skin dose application. Aquaplast recorded the consistent results over the entire study setup. While the wash cloth came out to be the least effective one for skin dose on all the treatments.
| Bolus/no bolus Ratio | |||||||
|---|---|---|---|---|---|---|---|
| Superflab 5mm | Superflab 3mm | Brass mesh | Aquaplast | Elastogel | Klarity | Washing cloth/Wet towel | |
| Chest Wall: | |||||||
| 6MV Tangent | 1.41(0.04) | 1.46(0.06) | 1.40(0.02) | 1.43(0.02) | 1.43(0.03) | 1.44(0.03) | 1.37(0.02) |
| 10MV Tangent | 1.55(0.04) | 1.48(0.02) | 1.38(0.04) | 1.47(0.05) | 1.45(0.06) | 1.48(0.04) | 1.26(0.03) |
| Head & Neck: | |||||||
| 6 MV True beam | 1.4(0.06) | 1.38(0.03) | 1.35(0.03) | 1.42(0.04) | 1.4(0.02) | 1.39(0.01) | 1.15(0.01) |
| 6MV Radixact | 1.36(0.03) | 1.29(0.02) | 1.29(0.01) | 1.38(0.00) | 1.37(0.04) | 1.35(0.04) | 1.12(0.02) |
Measure the dose by exposing the phantom that contains the bolus to the radiation beam. Using the OSLDs, note the dose received at various depths below the bolus material. You will receive a dose-depth curve for each bolus item as a result. To calculate the dosage distribution under each bolus material, analyze the data from the OSLDs. To evaluate the success of various bolus materials in obtaining the intended dose distribution, compare the dose-depth curves for each material. For each bolus material, compute metrics including dose build-up, dose uniformity, and skin dose enhancement. Consider criteria including dosage coverage, skin sparing, and treatment efficacy as you interpret the results to choose the bolus material that best satisfies the therapy objectives. Think about the trade-offs between various bolus materials, such as usability, such as skin sparing, dosage coverage, and therapy effectiveness. Think about the compromises made by various bolus materials, such as usability, patient comfort, and reproducibility. Record the findings, being sure to include dose-depth curves and contrasts between bolus materials. To maintain traceability and reproducibility, keep records of the experimental configuration, beam specifications, and OSLD calibration. Quality control puts quality control mechanisms in place to guarantee the dependability and accuracy of the dosimetric analysis. This could involve phantom setup verification and routine OSLD calibration checks.
Clinical Relevance: Choose the best bolus material for the particular clinical situation based on the results and include it in the treatment plan. Create a report that includes a summary of the dosimetric study, the material for the chosen bolus, and its justification. This document could be used to guarantee safe and efficient patient care. Dosimetric analysis utilizing OSLDs for bolus materials is a crucial step in optimizing radiation therapy treatment programs. The dosage distribution and therapeutic results might be considerably impacted by the bolus material selected.
The comparison between in-vivo readings made with the optically stimulated luminescent dosimeter (OSLD) and the projected dosage obtained from the radiation treatment planning system is covered in the article. In comparison to the dosage projected by the system at the surface, the OSLD measured greater dose values, showing that the OSLD can be a helpful instrument for evaluating radiation impacts on the chest and neck. With the aid of this knowledge, therapies potential for radiation therapy to cause acute skin responses and long-term skin toxicity can be avoided and managed.
Discussion
Choice of Bolus Materials: Choosing the right bolus materials is a crucial aspect of radiation therapy. The dosage distribution is changed by bolus materials, which raise the surface dose. This study evaluated several bolus materials, such as plastic, Superflab, and wax. The enhancement of the surface dose is influenced by the various physical properties of each substance.
Surface Dose Boosting: The study indicates that the employment of bolus materials in radiation causes a visible increase in surface dosage. This higher dosage at the skin’s surface is especially important when the tumor is close to the skin or when it is essential to protect healthy tissues beneath the skin.
OSLDs (Optically Stimulated Luminescent Dosimeters): A great tool for measuring radiation exposure. They provide doses instantly. Data makes accurate dosage verification and assessment possible. Impact of bolus material on dispersion of dose. In this experiment, OSLDs were utilized to ensure reliable data collection. Dosimetric studies reveal that different bolus materials cause varying degrees of surface dose increase. When plastic and Superflab bolus materials are compared to wax, the findings show that the former increases surface dosage more than the latter. The clinician’s capacity to apply this knowledge will determine which bolus material is best.
Clinical Consequences: The choice of the bolus material directly affects the safety and efficacy of the treatment. Using the results of this study as a guide, physicians may select the most appropriate bolus material for a particular clinical situation. Not only does it guarantee that the targeted dosage distribution is attained, but it also prevents the possibility of either underdosing the targeted volume or overdosing the skin.
Treatment Optimization: Reducing possible skin toxicity or underdosage while accurately administering the prescribed dose to the target is part of optimizing treatment regimens. Comprehending the dosimetric characteristics of several bolus materials enables this. When handling irregular treatment surfaces or superficial cancers, this is essential. Lastly, the dosimetric assessment of various bolus materials for high-energy beams with OSLDs provides significant new insights into the augmentation of surface dosage and its useful applications. The study emphasizes the importance of carefully selecting and optimizing bolus material in radiation therapy to maximize positive treatment outcomes and minimize adverse effects on the skin and surrounding healthy tissues.
References
- Yusof, F.H.; Ung, N.M.; Wong, J.H.D.; Jong, W.L.; Ath, V.; Phua, V.C.E.; Heng, S.P.; Ng, K.H.; Tang, C.-H. On the Use of Optically Stimulated Luminescent Dosimeter for Surface Dose Measurement during Radiotherapy. PLOS ONE 2015, 10, e0128544. [Google Scholar] [CrossRef] [PubMed]
- Miéville, F.A.; Pitteloud, N.; Achard, V.; Lamanna, G.; Pisaturo, O.; Tercier, P.-A.; Allal, A.S. Post-mastectomy radiotherapy: Impact of bolus thickness and irradiation technique on skin dose. Z. Fur Med. Phys. 2023, 34, 542–554. [Google Scholar] [CrossRef] [PubMed]
- Wooding, H.; Yan, J.; Yuan, L.; Chyou, T.-Y.; Gao, S.; Ward, I.; Herst, P.M. The effect of Mepitel Film on acute radiation-induced skin reactions in head and neck cancer patients: a feasibility study. Br. J. Radiol. 2017, 91, 20170298–20170298. [Google Scholar] [CrossRef] [PubMed]
- Tino, RB. Additive manufacture of phantoms for radiation dosimetry in lung lesions (Doctoral dissertation, RMIT University).
- Van Vloten, W.A.; Hermans, J.; Van Daal, W.A.J. Radiation-induced skin cancer and radiodermatitis of the head and neck. Cancer 1987, 59, 411–414. [Google Scholar] [CrossRef] [PubMed]
- Jursinic, P.A.; Yahnke, C.J. In vivodosimetry with optically stimulated luminescent dosimeters, OSLDs, compared to diodes; the effects of buildup cap thickness and fabrication material. Med Phys. 2011, 38, 5432–5440. [Google Scholar] [CrossRef] [PubMed]
- A Hälg, R.; Besserer, J.; Boschung, M.; Mayer, S.; Lomax, A.J.; Schneider, U. Measurements of the neutron dose equivalent for various radiation qualities, treatment machines and delivery techniques in radiation therapy. Phys. Med. Biol. 2014, 59, 2457–2468. [Google Scholar] [CrossRef] [PubMed]
- Tang, R.; Li, A.; Li, Y.; Deng, G.; Wang, Y.; Xiao, Q.; Zhang, L.; Luo, Y. Dosimetric comparison of two dose expansion methods in intensity modulated radiotherapy for breast cancer. Radiat. Oncol. 2023, 18, 1–7. [Google Scholar] [CrossRef] [PubMed]
- Andic, F.; Ors, Y.; Davutoglu, R.; Cifci, S.B.; Ispir, E.B.; Erturk, M.E. Evaluation of skin dose associated with different frequencies of bolus applications in post-mastectomy three-dimensional conformal radiotherapy. J. Exp. Clin. Cancer Res. 2009, 28, 41–41. [Google Scholar] [CrossRef] [PubMed]
- Manger, R.; Paxton, A.; Cerviño, L. Dosimetric assessment of brass mesh bolus for postmastectomy photon radiotherapy. J. Appl. Clin. Med Phys. 2016, 17, 86–96. [Google Scholar] [CrossRef] [PubMed]
- Sekartaji, G.; Aisyah, S.; Carina, C.; Nazara, T.; Nainggolan, A. ; Endarko Comparison of Dosimetry Characteristics from Some Bolus Materials for 6 and 10 MV Photons Beam Radiation Therapy.CONFERENCE NAME, LOCATION OF CONFERENCE, COUNTRYDATE OF CONFERENCE;
- Morris, R. , Laugeman, E., Hilliard, J., Zoberi, I., Heerman, A., Hugo, G.,... & Cai, B. (2019). Field-in-field breast planning for a jawless, double-stack MLC LINAC using flattening-filter-free beams. Journal of applied clinical medical physics, 20(11), 14-26.
- Boopathi, M.; Khanna, D.; Venkatraman, P.; Varshini, R.; Sureka, C.S.; Pooja, S. Fabrication and Dosimetric Characteristics of Silicon Elastomer-Based Bolus Using External Beam Radiotherapy. Asian Pac. J. Cancer Prev. 2023, 24, 141–147. [Google Scholar] [CrossRef] [PubMed]
- Benoit, J.; Pruitt, A.F.; Thrall, D.E. EFFECT OF WETNESS LEVEL ON THE SUITABILITY OF WET GAUZE AS A SUBSTITUTE FOR SUPERFLAB® AS A BOLUS MATERIAL FOR USE WITH 6 MV PHOTONS. Veter- Radiol. Ultrasound 2009, 50, 555–559. [Google Scholar] [CrossRef] [PubMed]
- Hsu, S.-H.; Roberson, P.L.; Chen, Y.; Marsh, R.B.; Pierce, L.J.; Moran, J.M. Assessment of skin dose for breast chest wall radiotherapy as a function of bolus material. Phys. Med. Biol. 2008, 53, 2593–2606. [Google Scholar] [CrossRef] [PubMed]
- Healy, E.; Anderson, S.; Cui, J.; Beckett, L.; Chen, A.M.; Perks, J.; Stern, R.; Mayadev, J. Skin dose effects of postmastectomy chest wall radiation therapy using brass mesh as an alternative to tissue equivalent bolus. Pr. Radiat. Oncol. 2013, 3, e45–e53. [Google Scholar] [CrossRef] [PubMed]
- American Psychiatric Association. (2013). Diagnostic and Statistical Manual of Mental Disorders (5th ed.). Washington, DC: APA Publishing.
- Lyon, G.R.; Shaywitz, S.E.; Shaywitz, B.A. A definition of dyslexia. Ann. Dyslexia 2003, 53, 1–14. [Google Scholar] [CrossRef]
Figure 1.
Placement of OSLDs on the Rando phantom.
Disclaimer/Publisher’s Note: The statements, opinions and data contained in all publications are solely those of the individual author(s) and contributor(s) and not of MDPI and/or the editor(s). MDPI and/or the editor(s) disclaim responsibility for any injury to people or property resulting from any ideas, methods, instructions or products referred to in the content. |
© 2025 by the authors. Licensee MDPI, Basel, Switzerland. This article is an open access article distributed under the terms and conditions of the Creative Commons Attribution (CC BY) license (http://creativecommons.org/licenses/by/4.0/).
Copyright: This open access article is published under a Creative Commons CC BY 4.0 license, which permit the free download, distribution, and reuse, provided that the author and preprint are cited in any reuse.


