
Submitted:
21 November 2024
Posted:
25 November 2024
You are already at the latest version
Abstract
Effective dose calculation is essential for optimizing Gamma Knife (GK) stereotactic radiosurgery (SRS) treatment plans. Modern GK systems allow independent sector activation, enabling complex dose distributions per shot. This study presents a dose approximation method designed to account for shot flexibility and generate 3D dose external to GammaPlan. A treatment plan was created with the TMR10 calculation for individual sector activations using a Radiosurgery Head Phantom. The resulting dose arrays established a basis set of sector-specific distributions, which were then refer-enced by shot parameters from the plan, allowing dose accumulation through superposition. This superposition approximation (SA) was compared to the original TMR10 using Dice Similarity Co-efficient (DSC), 95% Hausdorff Distance (HD95), and GK deliverability metrics: coverage, selec-tivity, and gradient index, across an isodose normalization range from 10% to 90%. In a cohort of 30 patients with 71 targets, strong agreement was observed between TMR10 and SA in the clinically used 50-60% isodose range, with DSC above 85% and HD95 under 2.18mm. Average differences for coverage, selectivity, and gradient index were 0.014, 0.008, and 0.118, respectively. This method accurately approximates TMR10 calculations within clinically relevant ranges, offering an external tool to assess 3D dose distributions for GK treatment plans.
Keywords:
gamma knife
; dose approximation
; TMR10 calculation
; treatment planning optimization
; superposition approximation (SA)
1. Introduction
Optimizing treatment plans in radiation therapy is a challenging task across many modalities. Depending on the optimizer, this process often requires multiple dose calculations at various stages. Iterative optimizers, commonly employed in clinical practice, perform simplified dose calculations between iterations to evaluate the plan’s progress toward achieving treatment objectives [1]. For this reason, dose calculation approximations, especially those capable of calculating 3D dose distributions, are necessary to continue development of plan optimization systems. In this study, a simplified dose calculation method is developed to approximate 3D dose distributions from plans generated for the Leksell Gamma Knife Icon (Elekta AB, Stockholm, Sweden).
Gamma Knife stereotactic radiosurgery (GK-SRS) is commonly used to treat small targets, such as brain metastases, with doses ranging from 18-24 Gy prescribed to the 50-60% isodose line. Larger targets, such as meningiomas, can be treated with lower doses of 12 or more Gy for patients that are not surgical candidates [2]. Very high doses of 80 Gy or more may be used to provide relief to patients from function disorders like trigeminal neuralgia [3].
GK-SRS systems are designed with submillimeter precision. It utilizes 192 cobalt-60 (Co-60) sources, each individually collimated in a non-coplanar configuration around the patient’s head. These sources are grouped into eight sectors, with each sector capable of collimating its sources independently of the other sectors. Each sector can be blocked or opened to one collimation size of 4, 8, or 16 mm [4]. At the isocenter, the convergence of the 192 beamlets results in a highly focused dose, delivered with an accuracy of 0.15 mm. During treatment, the combination of machine parameters for patient position relative to isocenter, sector activation of the sources, and beam-on time at that position form what is known as a “shot”. A GK treatment plan contains the collection of this information for all the shots required to treat that patient. The optimal arrangement of these plan parameters, namely the number of shots, shot position, sector activation, and shot weighting allows GK to achieve the core concept of SRS: precisely delivering high doses of radiation to each target lesion, often in a single fraction (SRS), or fractionated stereotactic radiotherapy (SRT), while simultaneously sparing surrounding healthy tissues [5, 6].
Previous versions of the GK system lacked the flexibility of the modern Perfexion, Icon, and Esprit models. Rather than controlling each sector individually, large single-size collimator helmets were required to be manually plugged prior to shot delivery, resulting in treatment plans composed almost entirely of what modern systems now refer to as "classic shots” [7-9]. To enhance optimization routines in treatment planning, algebraic approximations leveraged this simpler delivery method of older GK systems by first approximating the dose distribution as spherically symmetric [10, 11]. These approximations were then improved by shifting from spherical to ellipsoidal distributions [12]. While these geometric methods remain useful for approximating dose distributions in classic shots, the independent sector activations introduced by the modern models complicate the process of approximating their resultant dose distributions.
Dose calculation efforts have also explored the option of modeling all sources and collimation options individually, either summing their contributions or via Monte Carlo simulations [13-16]. In this work, we have developed a method capable of producing clinically relevant dose approximations for modern GK systems utilizing a dose distribution superposition approach which relies on fewer individual models without the computational cost of Monte Carlo. This tool provides a simple approach to calculating dose based on key machine parameters - patient position, sector activations, and beam-on time - enhancing our understanding of the dose distributions produced by planning optimizations and automation approaches in GK treatment planning.
2. Materials and Methods
2.1. Data Acquisition and Preparation
Dose arrays and their associated machine parameters were exported from the Leksell GammaPlan (Leksell GammaPlan, Version 11, Elekta AB, Stockholm, Sweden) treatment planning system (TPS) for the Gamma Knife Icon unit. Each dose array consists of a 448x448x448 array with a pixel spacing of 0.5mm per voxel. The GammaPlan TMR10 algorithm uses a homogenous dose calculation where the patients’ anatomy is considered as water. TMR10 accounts for the divergence of each Co-60 beamlet with the inverse square law, exponential attenuation of each beamlet as they traverse the assumed water environment, differences in dose deposition rate between collimation size with output factors, and depth variations with a scaling distance. Any heterogeneities within the volume bounded by the external boundary are not accounted for with the standard TMR10 dose calculation [17]. This information is also available in documents typically associated with the Written Directive for the treatment unit, such as the GK Details Document and the Operator’s Report.
A dataset of 30 anonymized patients, previously treated with the GK system at the Mary Bird Perkins Cancer Center/Our Lady of the Lake, was curated for this study. This cohort consisted of patients with a variety of lesions treatable by GK, including 15 patients receiving treatment for multiple metastases, 5 for meningiomas, 3 for single metastases, 3 for pituitary adenomas, 3 for glioblastomas, and 1 for an oligodendroglioma [6]. The total target number among this patient cohort was 71. The physician-defined contours for each of these targets were also exported for calculation of deliverability metrics.
A standard dose distribution base set for each collimation setting of each sector was calculated within GammaPlan using the Radiosurgery Head Phantom CIRS Model 605. The planning position was set as the (100, 100, 100) point in the GammaPlan coordinate system, corresponding to an axial plane 80mm inferior to the apex of the phantom’s external contour. The position was roughly centered in the axial slice along GammaPlan-measured lengths of 202mm in the anterior-posterior direction and 156mm in the medial-lateral direction. This base set is composed of three sizes (4, 8, and 16mm) for each of the eight sectors, resulting in 24 single-sector dose arrays. After exporting from GammaPlan, the resulting arrays were cropped to 148x148x148 voxels for the 4mm and 8mm activations, and 224x224x224 voxels for the 16mm activations. This was done to optimize storage and processing demands, and the size of each cropped array was chosen to maintain the sub-10% low-dose region.
2.2. Sector Activation Superposition
An empty array is initialized to the same dimensions and spacing as the CBCT used to establish the patient’s stereotactic treatment space. This array is 448x448x448 voxels with 0.5 mm/voxel spacing in all three dimensions. The origin coordinate for the stereotactic treatment space is the ImagePositionPatient metadata entry for the first slice of the patient’s CBCT. Each patient’s target is accessed sequentially. For each shot in a target, the shot’s position relative to the origin coordinate is calculated. The routine then loops through each of the shot’s sector activations, retrieving the corresponding dose contributions from the base set. These contributions are scaled by their shot weighting parameter and superimposed into the global patient array at the calculated position relative to the stereotactic treatment space origin coordinate. This process is repeated for all shots in the current target before moving to the next target, if the patient was treated for multiple targets.
A mathematical representation of the accumulation is provided below:
where the process is presented in two steps. The first step, d((x, y, z), w, S), is an accumulation of a single target’s dose distribution as a function of all shots, indexed by j, in the target with individual center positions (xj, yj, zj), shot weighting (wj), and the eight sector activations Kj(Si). Dose is accumulated for each shot one sector at a time, from i=1 to i=8, by summing the appropriate dose contribution kernel from the basis set at the (xj, yj, zj) position of the accumulation array. This is repeated for each individual shot, from j=1 to j=m, where m is the total number of shots in the target’s plan. The second step then accumulates all target contributions, indexed by t, after normalizing the dose distribution for the target and scaling it to units of Gray. The scaling value, Dmax, is equal to the prescription dose [Gy] divided by the fractional planning isodose level.
Using Figure 1 as an example, the inputs required to achieve Figure 1.B would be d([(70,70,70), 1, (8,8,8,8,8,8,8,8)]) and D(40), where the (70,70,70) position is the center of the array in voxel coordinates. Similarly, Figure 1.C would correspond to inputs of d([(70,70,70), 1, (8,4,0,16,0,4,8,4)]) and D(40). Finally, Figure 1.D would require the information of both shots separated by a distance of 1 cm (20 voxels) along the x-axis, corresponding to inputs of d([(60,70,70), 1, (8,8,8,8,8,8,8,8)], [(80,70,70), 1, (8,4,0,16,0,4,8,4)]) and D(40).
After producing the superposition approximation (SA) dose arrays for each of the 30 patients, the original and recreated full-size arrays were cropped into additional target-centered arrays. This resulted in 71 arrays, each cropped to match the dimensions of the target box used during the original GammaPlan treatment planning. These arrays were compared in absolute dose or normalized to their maximum for relative dose comparisons. Both approaches are illustrated in Figure 2, which provides an example of using the SA method to recreate an entire target’s 3D dose. Figure 2A and 2B share a color bar which represents absolute dose in Gy. Figure 2A shows the dose distribution for a meningioma as calculated with TMR10. Figure 2B shows the result of the SA method for the same target. The black isodose lines in both figures represent the 52% prescription isodose volume. Pairwise comparisons and deliverability metrics were then calculated using these binary volumes. Figure 2C overlaps those volumes along the target’s central axial slice, with the TMR10 calculation shown in green, the SA method in magenta, and their intersection in white.
2.3. Approximation Evaluation
Dose arrays were approximated for all 71 targets from the 30-patient cohort. The performance of the SA was evaluated by comparing these approximations to the original TMR10 dose arrays obtained from the GammaPlan system. These pairwise comparisons involved the following metrics:
2.3.1. Pairwise Comparisons
Dice Similarity Coefficient (DSC), first proposed by Dice [18], is a measure of overlap between two sets. It has commonly been used to evaluate image segmentations [19, 20] and is defined for a 3D implementation in this work as:
where VTMR10 and VSA refer to the binary volumes produced by the GammaPlan TMR10 calculation and SA, respectively. DSC ranges from 0 to 1, with high values indicating higher similarity between the sets. The metric is sensitive to differences between the sets in both size and position [21]. Figure 2C shows two sets which achieved a high 3D DSC of 0.939 at the prescription line used in planning, indicating very strong agreement between the two dose distributions for this target.
Hausdorff Distance (HD) provides a measure of the maximum distance between two sets [22]. It is defined as:
where x and y represent a point along the surface of the volume created by thresholding the TMR10 and SA dose arrays, respectively. Following this, d(x, SA) and d(y, TMR10) represent the minimum distance from a point x or y to a point on the surface of the thresholded SA or TMR10 volume, respectively. Essentially, HD represents the largest minimum distance between the surfaces of the SA and TMR10 distributions when each is thresholded to the same percentage.
In this study, we use 95% Hausdorff Distance (HD95), which reports the 95th percentile of the distances between points in two sets, rather than the maximum distances. By excluding the largest 5% of distances, HD95 is more robust and outlier-resistant than the traditional HD metric [23].
2.3.2. Deliverability Metrics
The GammaPlan TPS reports three metrics commonly used to evaluate the quality of a GK treatment plan. These are coverage, selectivity, and gradient index [24], each of which is defined as follows:
where PIV refers to the prescription isodose volume, GTV refers to the physician-defined gross target volume, TTV refers to the treated target volume (or the fraction of GTV receiving PIV), and PIV50% refers to the volume bounded by the isodose line at 50% of the prescription dose. Coverage describes how well the prescribed dose covers the target and ranges from 0 to 1. It has an ideal value of 1, with lower values representing an underdosing of the TV. Selectivity describes how well the prescribed dose is limited to the TV. It shares a range and ideal value with coverage, with lower values representing an overdosing of healthy tissue surrounding the TV. Gradient index quantifies the steepness of the dose gradient, specifically from the prescription dose to 50% of that value. Lower values indicate a steeper dose gradient and better sparing of healthy tissues.
3. Results
3.1. Pairwise Comparisons
Thresholds were applied to the normalized dose arrays in 10% increments of the isodose volumes for each of the 71 targets, starting from 10% and continuing to 90% of the maximum dose. Each target was also thresholded to its specific prescription isodose value. Using these thresholded binary volumes, the DSC and HD95 were calculated between the TMR10-calculated isodose volume and the corresponding SA isodose volume. Figure 3 displays the average and standard deviation in DSC and HD95 for all 71 targets at each threshold level. The left axis corresponds to DSC values, indicated by the black circles and bars, while the right axis corresponds to HD95 values, indicated by the cyan diamonds and bars. Threshold levels ranging from 20-60% demonstrate strong agreement in DSC, with values above 0.85 (indicated by a black dashed line) [19]. This range includes the prescription isodose used for treatment planning, denoted as “Rx”, where a typical Gamma Knife target is prescribed 18-24 Gy to an isodose line between 50-60% [2]. The HD95 values also shows the strongest agreement in the 50-60% range, with a maximum discrepancy of 2.18mm. At the prescription (Rx) isodose level, the maximum HD95 value reaches 2.24 mm, marked by a cyan dashed line in Figure 3.
3.2. Deliverability Metrics
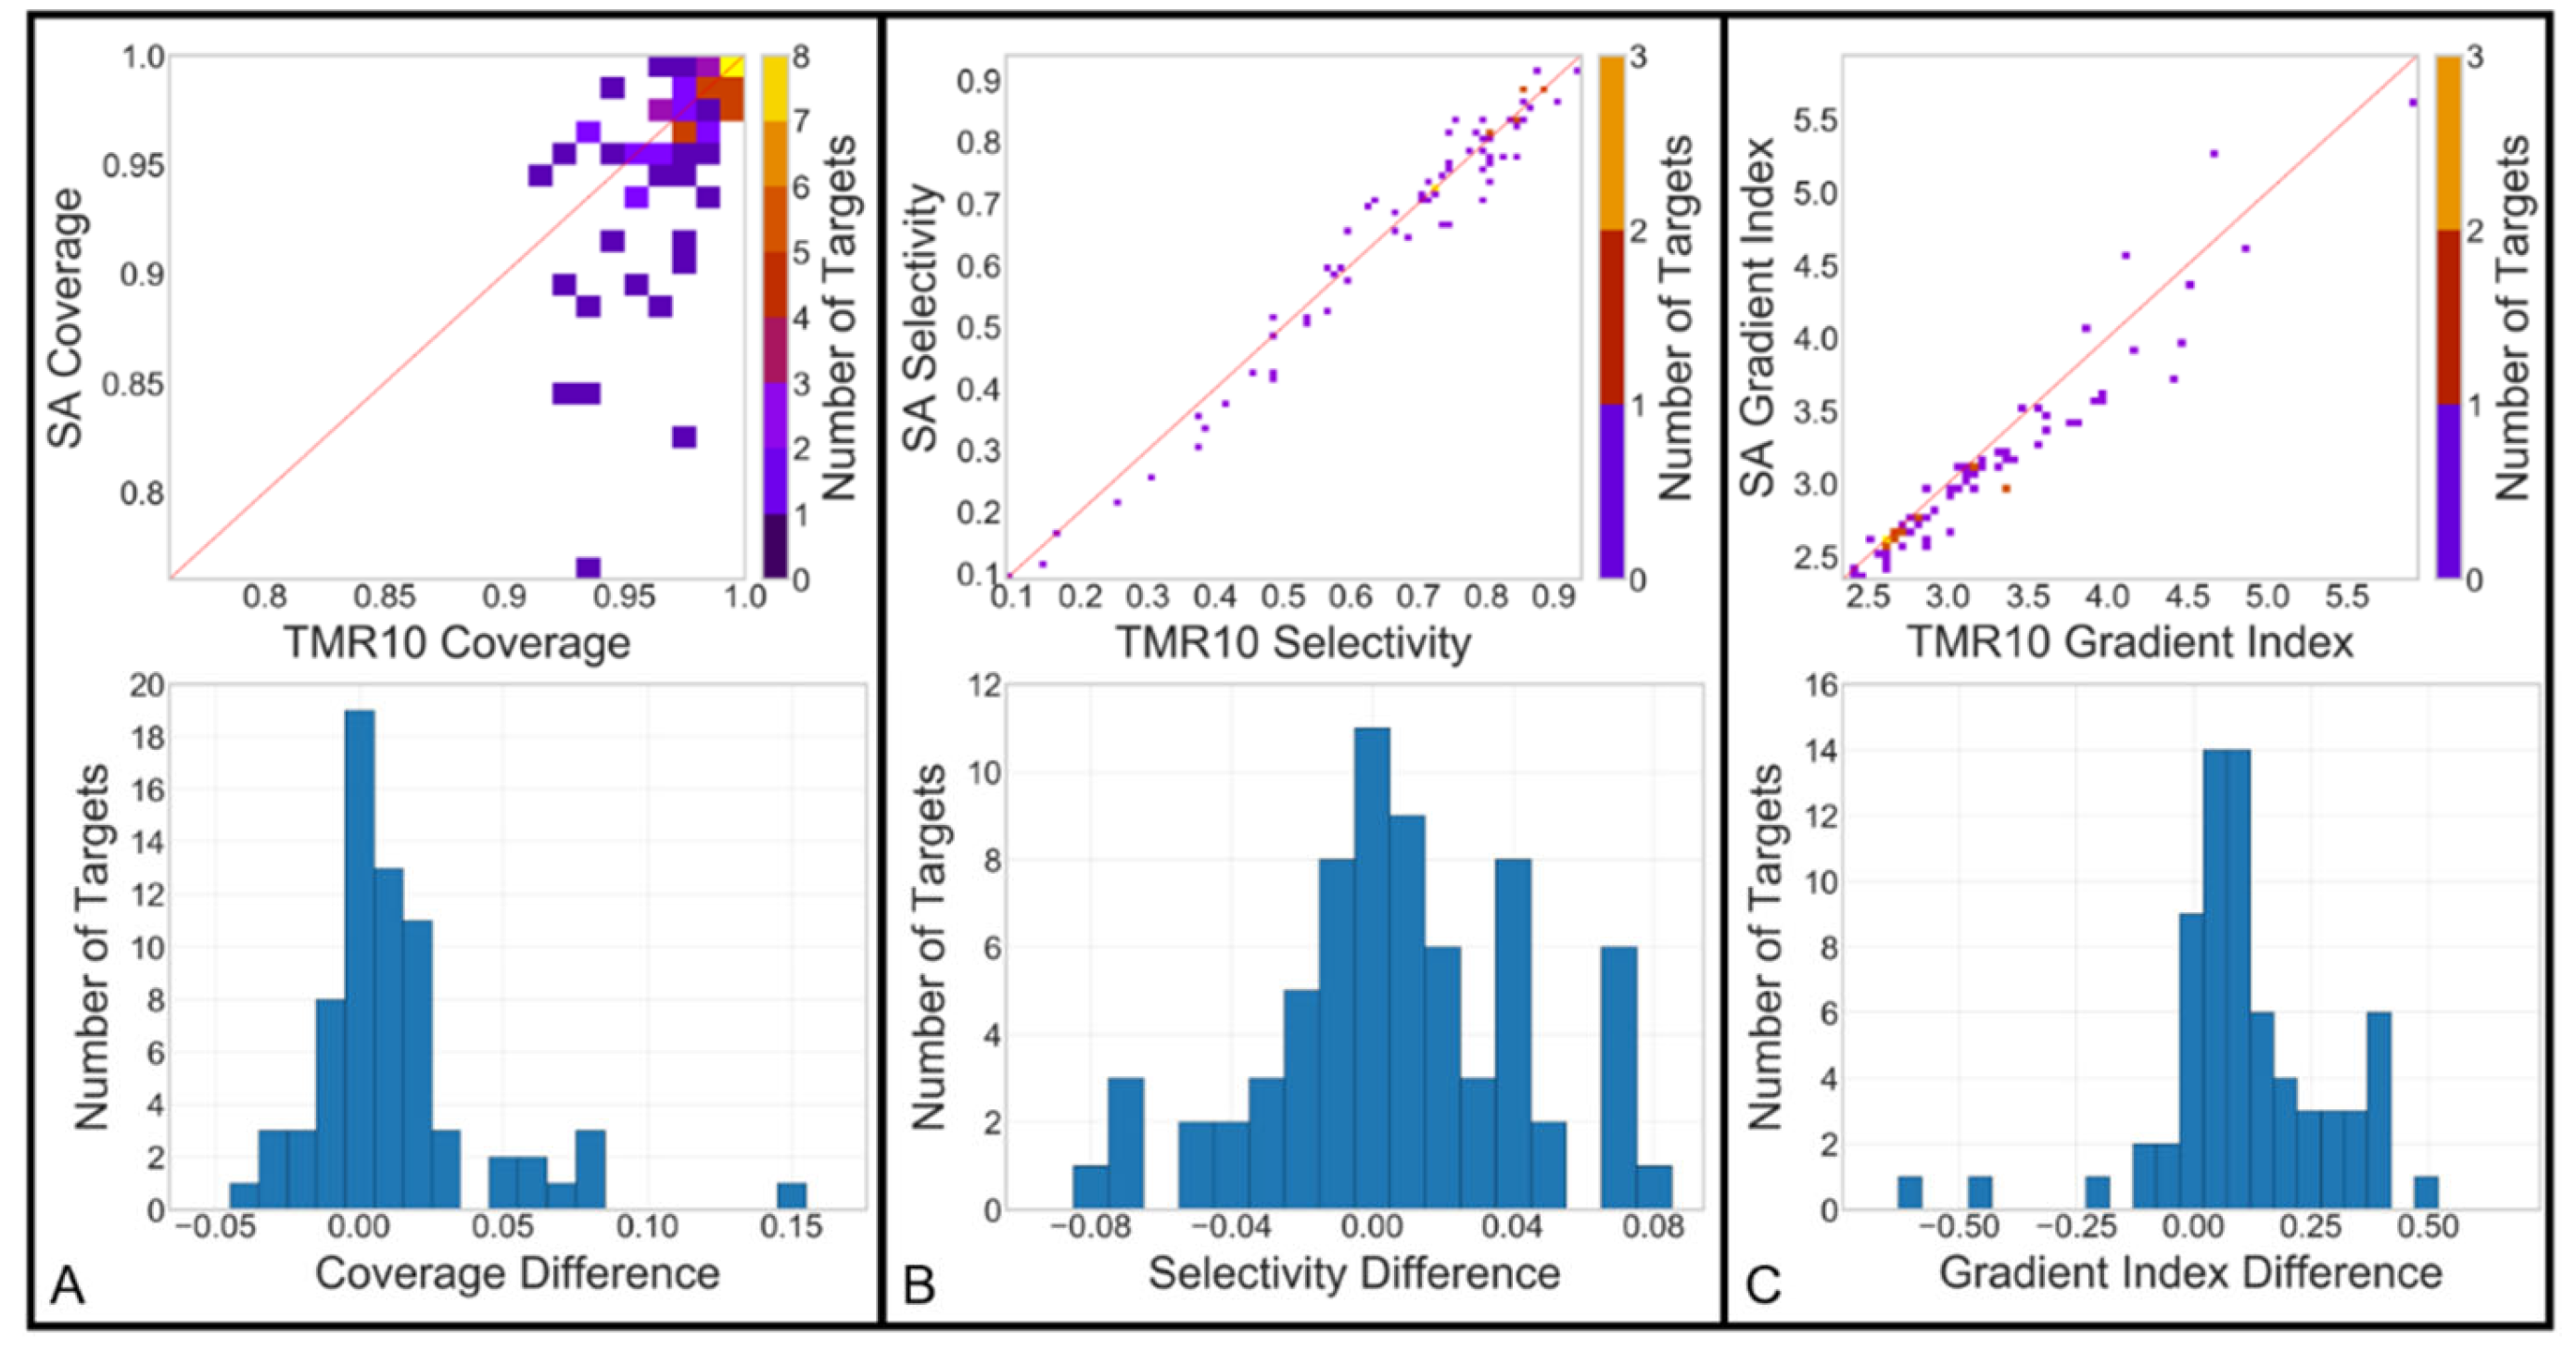
The same prescription isodose binary volumes used to generate the DSC and HD95 values in the 'Rx' column of Figure 3 were also used to calculate the deliverability metrics: coverage, selectivity, and gradient index, for both the original and approximated dose arrays. For coverage and selectivity, the cropped and binarized dose arrays were compared to their respective physician-defined target contours. To calculate gradient index, additional binaries were generated at 50% of the prescribed dose level (25% of maximum dose). Figure 4 (top row) illustrates a 2D histogram comparison of these deliverability metrics between the GammaPlan calculation and the SA. Coverage shows a close agreement between the datasets, with a TMR10 mean value of 0.973 (±0.021) and a SA mean of 0.959 (±0.044). Selectivity (0.674±0.193 vs. 0.666±0.202) and gradient index (3.218±0.667 vs. 3.101±0.642) also demonstrate strong similarity. The distributions of differences between the two calculations are included as 1D histograms in Figure 4 (bottom row). Mean and standard deviation for coverage difference (0.014 ± 0.035), selectivity difference (0.008 ± 0.037), and gradient index difference (0.118 ± 0.192) were also calculated.
4. Discussion
We propose a method for recreating Gamma Knife Icon dose distributions using treatment plan parameters. By superimposing and summing sector-specific dose arrays from the base set into the positions defined within those plan parameters, dose contributions for any shot can be accumulated into a full-sized 448x448x448 array. Dose arrays created with this method were compared with the original, TMR10-calculated dose arrays using pairwise comparisons for similarity between binarized arrays and the deliverability metrics reported by GammaPlan during the planning process.
The superposition dose approximation method produced dose arrays closely resembling the TMR10 distributions, especially within the isodose normalization ranges commonly used in treatment planning (50-60%). In this isodose range, the DSCs exceeded 85% and the HD95s were below 2.18mm. A similar pattern is seen at the prescription (Rx) isodose level, with the maximum HD95 value of 2.24 mm (Figure 3). This strong agreement is further supported by the similarity in deliverability metrics between the two dose array sets, with minimal average differences observed (Figure 4, bottom).
Differences in low- and very high-dose regions arise primarily from two factors: the absence of depth correction in the SA and the exclusion of very low-dose regions from the base set arrays. GammaPlan uses the TMR10 dose calculation algorithm to account for attenuation, scatter, and beamlet divergence across the volume within the external boundary [15]. In contrast, our method superimposes sector activations based on the same reference depth for each sector in the base set. This introduces a limitation to the superposition approximation, since regions with dose levels significantly above or below the Rx dose may not accumulate accurately.
5. Conclusions
In conclusion, we introduce a new method for approximating Gamma Knife dose distributions external to the GammaPlan treatment planning software. This method works by superimposing sector-specific dose distributions into the correct positions, using the machine parameters associated with the original treatment plan. Our evaluation demonstrates that this method yields dose distributions comparable to those produced by GammaPlan within clinically relevant dose levels, though some differences were noted in the positioning and size of hotspots and low-dose regions. This tool offers a simple calculation approach that enhances understanding of dose distributions produced by planning optimizations and lays the groundwork for future automation approaches to GK treatment planning. In future work, this dose approximation can be deployed to auto-generate simulated GK plan data and associated dose distributions for use in AI development for plan parameter prediction models.
Author Contributions
Conceptualization, P.S., J.D., C.C., D.N., and D.S.; methodology, P.S., R.R., C.C., D.N., and D.S.; software, P.S., L.L., R.R., and D.S.; validation, P.S., L.L. and D.S.; formal analysis, P.S., L.L., and D.S.; investigation, P.S., L.L., R.R., C.C., D.N., J.D., and D.S; data curation, P.S., R.R., and D.S.; writing—original draft preparation, P.S., L.L. and D.S.; writing—review and editing, P.S., L.L., J.D., C.C., D.N., and D.S.; visualization, P.S., L.L. and D.S.; project administration, D.S.. All authors have read and agreed to the published version of the manuscript.
Funding
This research was supported in part by the Dr. Charles M. Smith Medical Physics Research Endowment. This work was also partially funded by the National Science Foundation through the REU Site in Physics & Astronomy, NSF grant #1852356, at Louisiana State University.
Institutional Review Board Statement
The study was conducted in accordance with the Declaration of Helsinki, and approved by the Institutional Review Board of Louisiana State University (protocol code E11732 approved on May 30, 2019 as Exempt, category 4b).
Informed Consent Statement
Not applicable because of the retrospective nature and the absence of patient risk in this research. All potentially identifiable information has been anonymized, in line with the above IRB exemption
Data Availability Statement
The data presented in this study are available on request from the corresponding author.
Acknowledgments
We extend our gratitude to Mary Bird Perkins Cancer Center for their ongoing support and to Jonas Fontenot for facilitating the IRB exemption.
Conflicts of Interest
The authors declare no conflicts of interest.
References
- Li, Y., et al., Impact of dose calculation accuracy during optimization on lung IMRT plan quality. J. Appl. Clin. Med. Phys., 2015. 16(1): p. 5137.
- Ashley Wackym, P., C.L. Runge-Samuelson, and D.R. Friedland, Chapter 65 - Stereotactic Radiosurgery of Skull Base Tumors, in Otologic Surgery (Third Edition), D.E. Brackmann, C. Shelton, and M.A. Arriaga, Editors. 2010, W.B. Saunders: Philadelphia. p. 785-798.
- Boling, W., et al., Gamma Knife Radiosurgery for Trigeminal Neuralgia: A Comparison of Dose Protocols. Brain sciences, 2019. 9(6): p. 134.
- Liu, H., et al., Plan Quality and Treatment Efficiency for Radiosurgery to Multiple Brain Metastases: Non-Coplanar RapidArc vs. Gamma Knife. Front. Oncol., 2016. 6.
- Schell, M.C., et al., AAPM Report No. 54 Stereotactic Radiosurgery. 1995, American Association of Physicists in Medicine.
- Desai, R. and K.M. Rich, Therapeutic Role of Gamma Knife Stereotactic Radiosurgery in Neuro-Oncology. Mo. Med., 2020. 117(1): p. 33-38.
- Lindquist, C. and I. Paddick, The Leksell Gamma Knife Perfexion and comparisons with its predecessors. Neurosurgery, 2007. 61(3 Suppl): p. 130-40; discussion 140-1.
- Novotny, J., et al., Dosimetric comparison of the Leksell Gamma Knife Perfexion and 4C. J. Neurosurg., 2008. 109 Suppl: p. 8-14.
- Asgari, S., N. Banaee, and H. Nedaie, Comparison of full width at half maximum and penumbra of different Gamma Knife models. J. Cancer Res. Ther., 2018. 14(2): p. 260-266.
- Shepard, D.M., et al., Inverse treatment planning for Gamma Knife radiosurgery. Med. Phys., 2000. 27(12): p. 2748-56.
- Shepard, D.M., et al., Clinical implementation of an automated planning system for gamma knife radiosurgery. International Journal of Radiation Oncology*Biology*Physics, 2003. 56(5): p. 1488-1494.
- Ferris, M.C.L.J.S.D.M., Radiosurgery treatment planning via nonlinear programming, in Data Mining Institute Technical Report. 2001, University of Wisconsin: Wisconsin.
- Li, K. and L. Ma, Selective source blocking for Gamma Knife radiosurgery of trigeminal neuralgia based on analytical dose modelling. Phys. Med. Biol., 2004. 49(15): p. 3455-3463.
- Moskvin, V., et al., Monte Carlo simulation of the Leksell Gamma Knife®: II. Effects of heterogeneous versus homogeneous media for stereotactic radiosurgery. Phys. Med. Biol., 2004. 49(21): p. 4879-4895.
- Xiong, W., et al., Implementation of Monte Carlo Simulations for the Gamma Knife System. Journal of Physics: Conference Series, 2007. 74: p. 021023.
- Yuan, J., et al., Development of a Monte Carlo model for treatment planning dose verification of the Leksell Gamma Knife Perfexion radiosurgery system. J. Appl. Clin. Med. Phys., 2016. 17(4): p. 190-201.
- Xu, A.Y., et al., Dose differences between the three dose calculation algorithms in Leksell GammaPlan. J. Appl. Clin. Med. Phys., 2014. 15(5): p. 4844.
- Dice, L.R., Measures of the Amount of Ecologic Association Between Species. Ecology, 1945. 26(3): p. 297-302.
- Zou, K.H., et al., Statistical validation of image segmentation quality based on a spatial overlap index. Acad. Radiol., 2004. 11(2): p. 178-189.
- Taha, A.A. and A. Hanbury, Metrics for evaluating 3D medical image segmentation: analysis, selection, and tool. BMC Med. Imaging, 2015. 15: p. 29-29.
- Zijdenbos, A.P., et al., Morphometric analysis of white matter lesions in MR images: method and validation. IEEE Trans. Med. Imaging, 1994. 13(4): p. 716-724.
- Porter, E., et al., Effect of Loss Functions in Deep Learning-Based Segmentations, in Auto-Segmentation for Radiation Oncology State of the Art, J. Yang, G.C. Sharp, and M.J. Gooding, Editors. 2021, CRC Press: Boca Raton. p. 133-149.
- Chollet, F., Deep learning with Python. 2021: Simon and Schuster.
- Torrens, M., et al., Standardization of terminology in stereotactic radiosurgery: Report from the Standardization Committee of the International Leksell Gamma Knife Society: special topic. J. Neurosurg., 2014. 121 Suppl: p. 2-15.
Figure 1.
Example sector activations and shot interactions created using the superposition method. Figure 1A is an example of only sector 1 being active to 8mm, as indicated by the key in the top right of the image. Figure 1B shows all 8 sectors activated to the same collimation setting of 8mm, forming a classic 8mm shot. In Figure 1C, an example shot with mixed activations is displayed. Figure 1D shows the interaction of the shots in 1B and 1C when separated by a horizontal distance of 1cm, with the 50% isodose line shown in black. “x” and “+” indicate the shot positions for the shot shown in Figure 1B and Figure 1C, respectively.
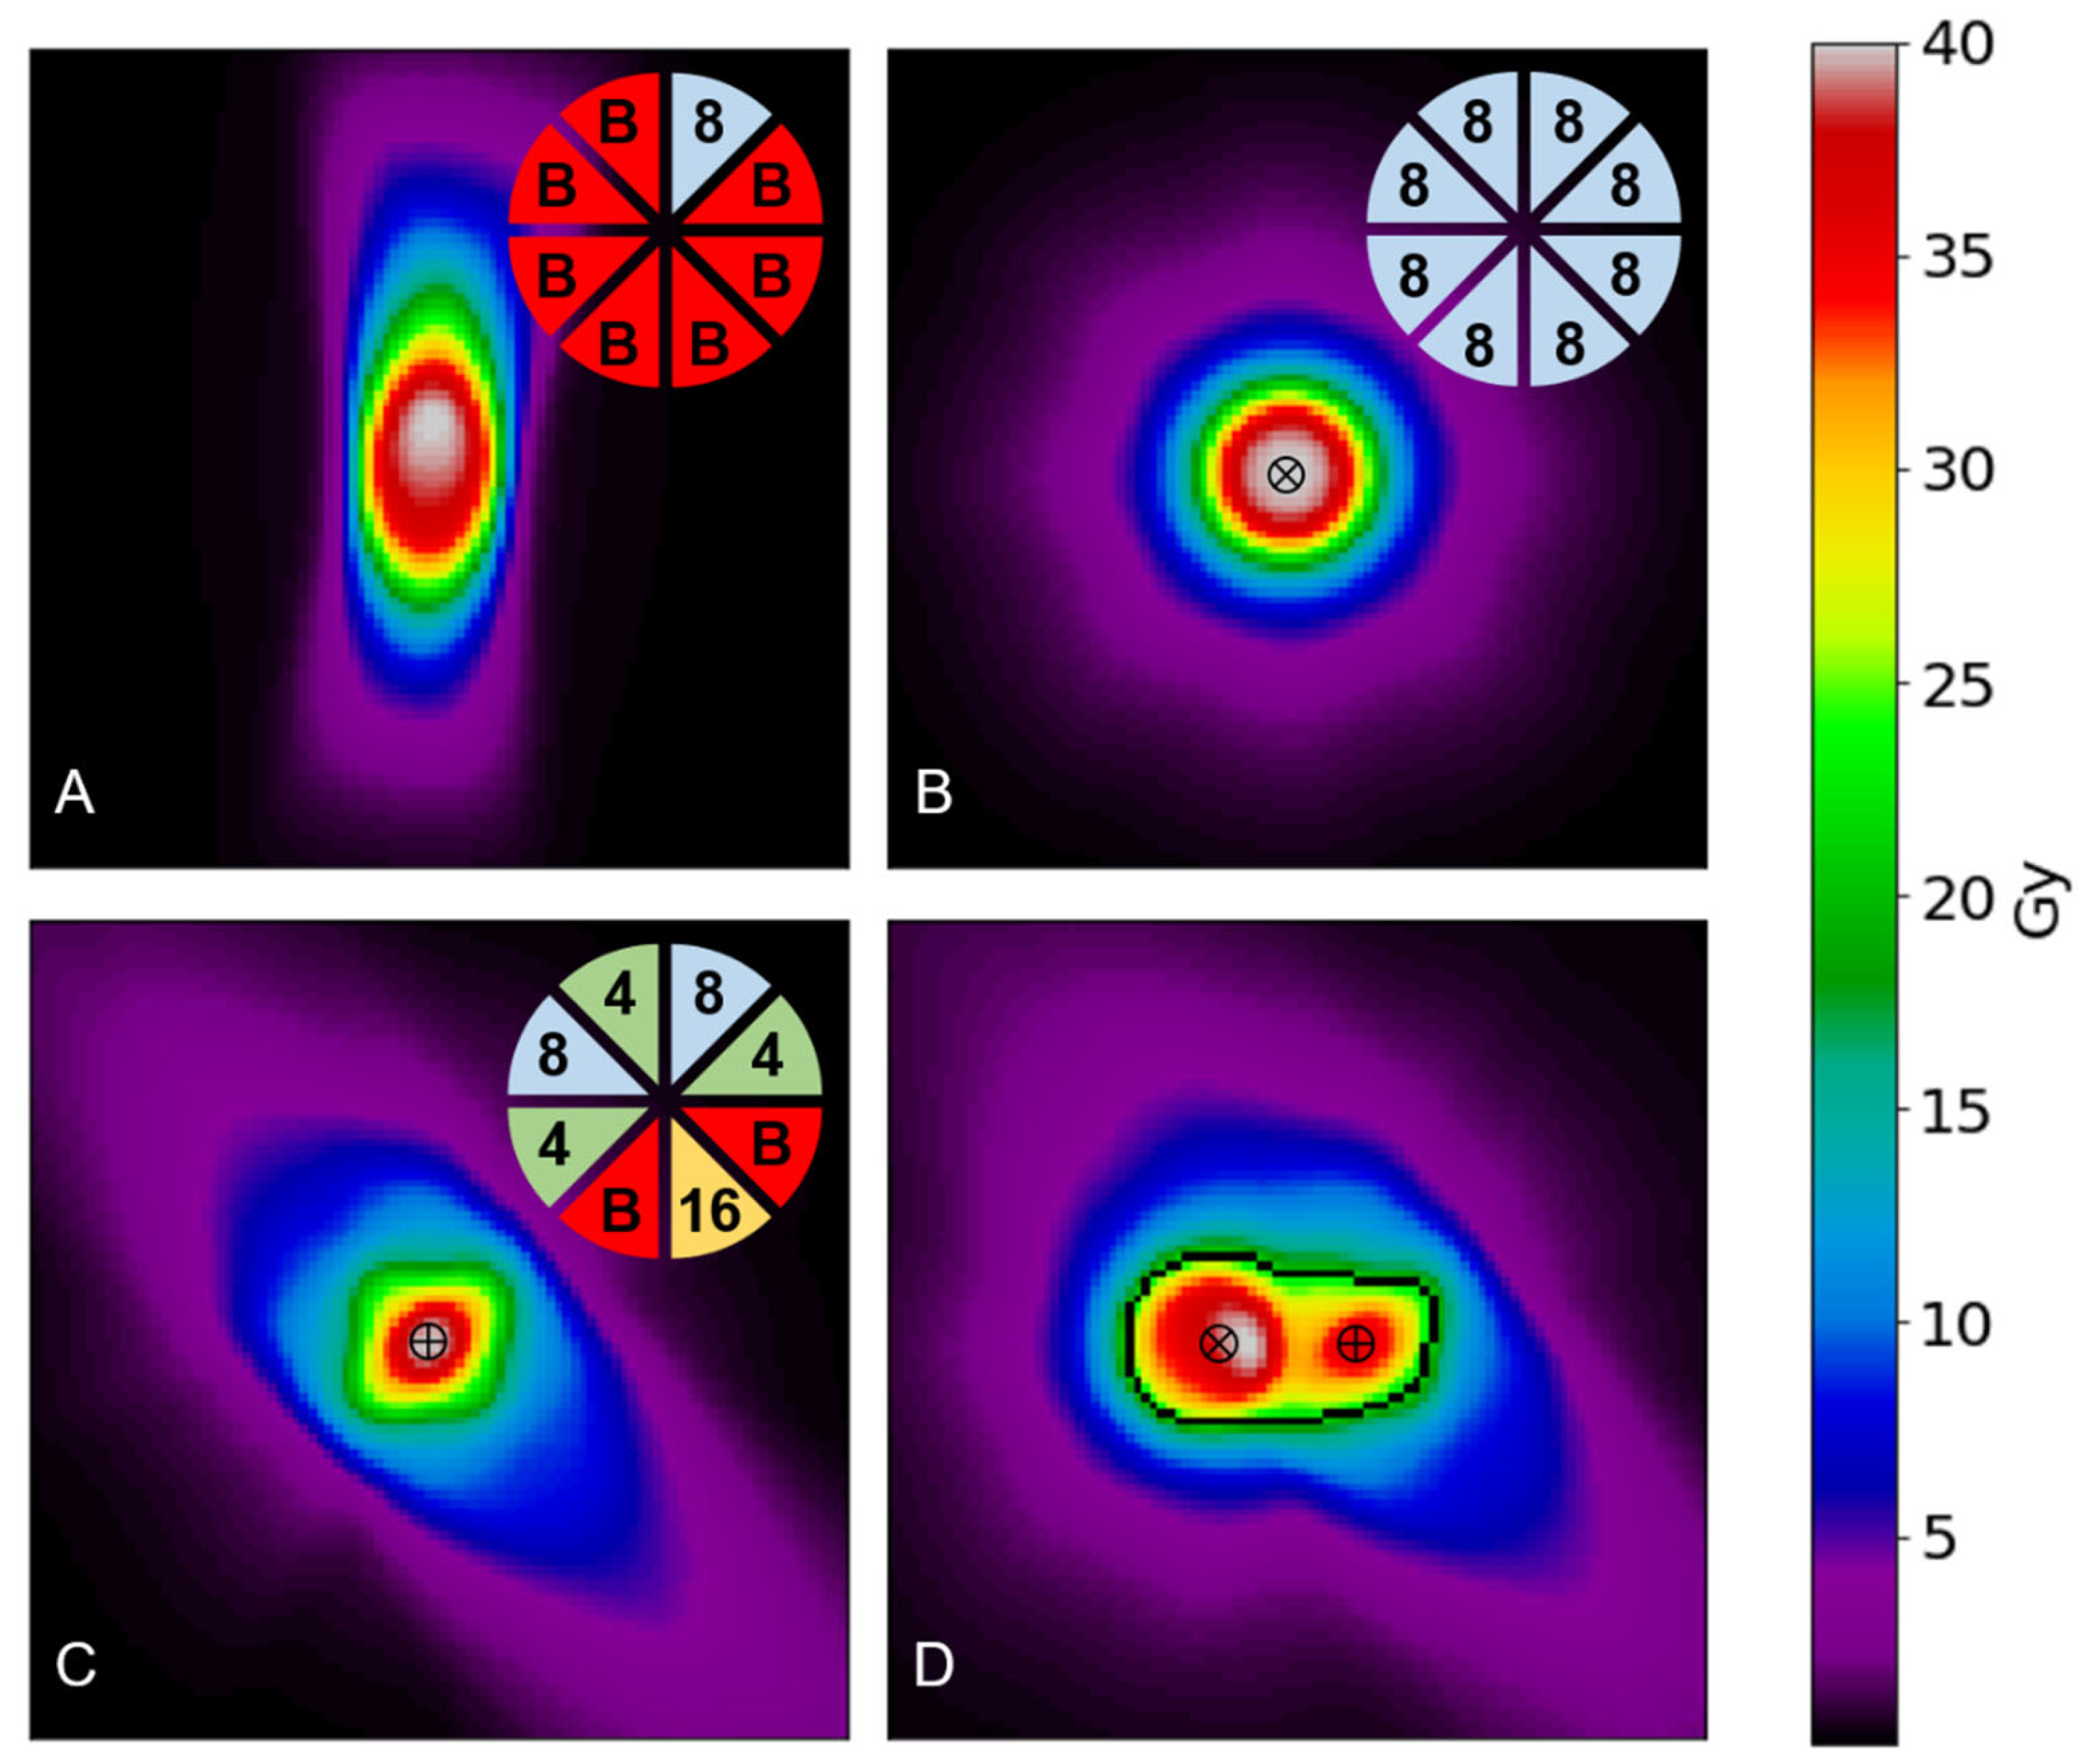
Figure 2.
An example of full target reconstruction of the dose array using the superposition method. Fig 2A is the TMR10-produced dose array for the treatment of a meningioma. Figure 2B shows the superposition approximation. The black isodose line shown in both Figure 2A and 2B highlights the prescription isodose of 52% for each dose distribution. Figure 2C highlights differences between the prescription iso-volumes of A and B (shown in black) as an RGB formatted fusion, where green is the TMR10-calculated iso-volume, magenta is the superposition approx. iso-volume, and white is their intersection. The shown Dice Similarity Coefficient is the result of a 3D comparison for this target with these prescription volumes.
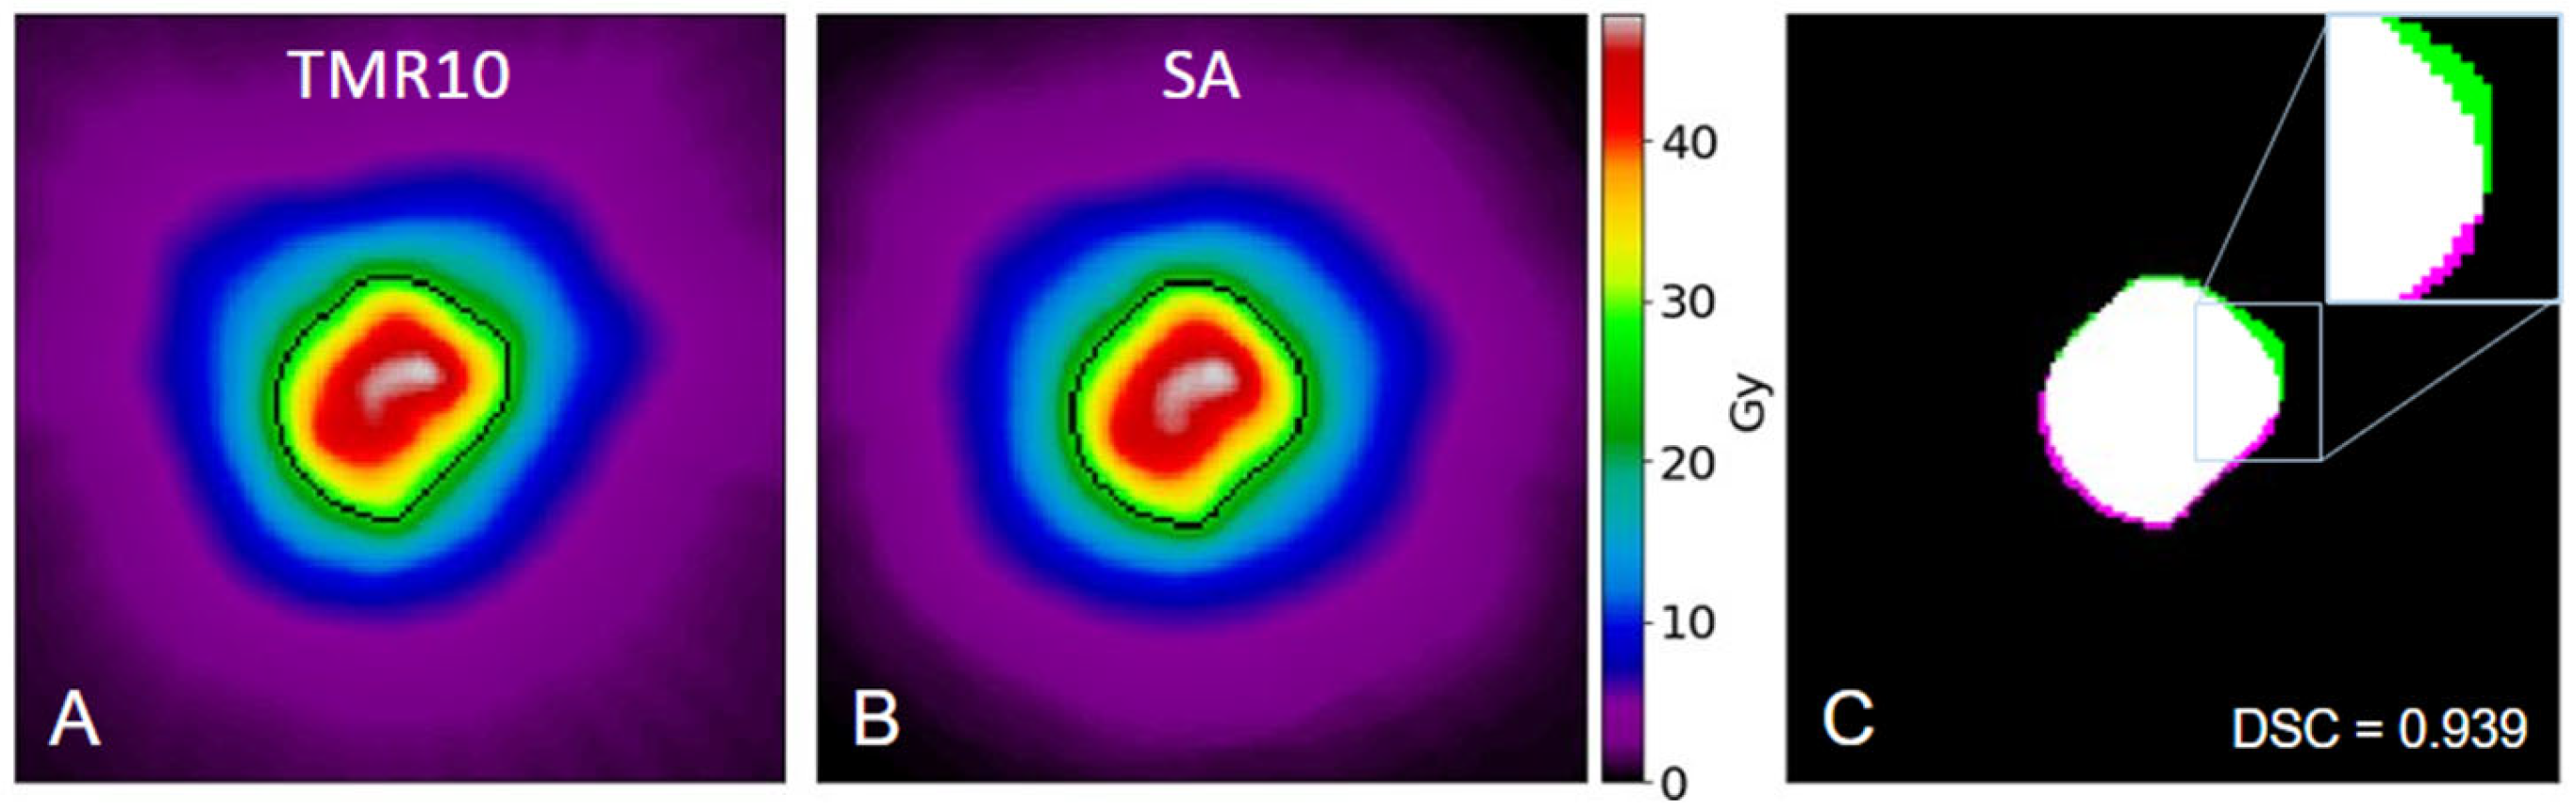
Figure 3.
Average Dice Similarity Coefficient (DSC) and 95th percentile Hausdorff Distance (HD95) comparisons between the original (TMR10-produced) dose arrays and the superposition approximation (SA) dose arrays for 71 targets at 10 threshold levels. Both metrics are reported at each 10% isodose threshold between 10% and 90%, as well as at each target’s respective prescription isodose level, denoted as “Rx”. The DSC, aligned with the left vertical axis, is shown using black circles and error bars, with a black dashed line marking the 0.85 DSC level. HD95, aligned with the right vertical axis, is illustrated by cyan diamonds and error bars, with a cyan dashed line marking the maximum HD95 value at the prescription (Rx) level. Higher DSC values and lower HD95 scores indicate a closer match between the SA-produced dose and the TMR10-produced dose.
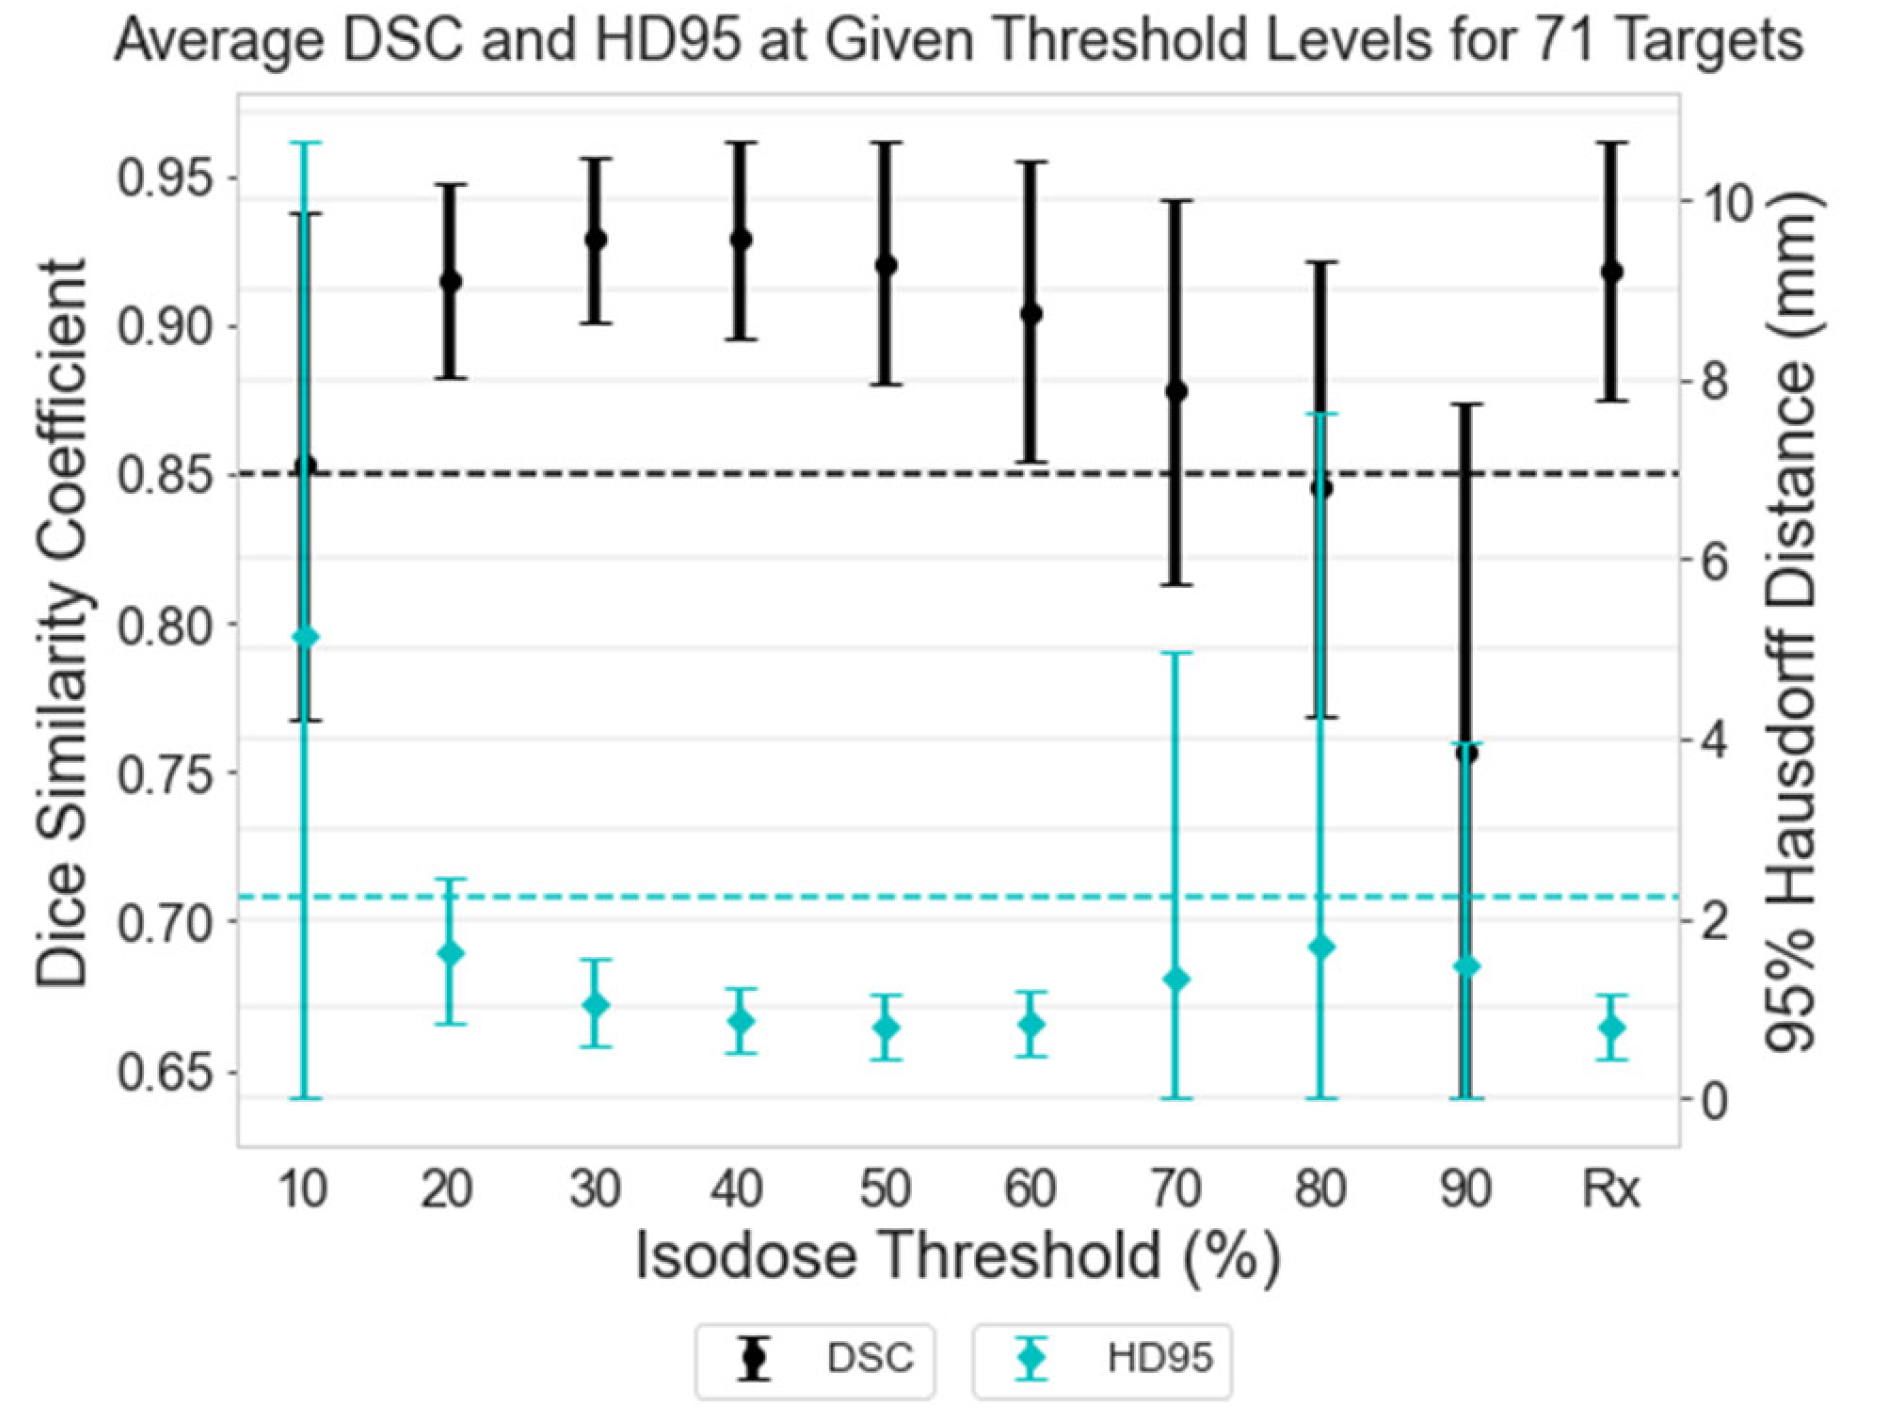
Figure 4.
(Top row) 2D histograms for the deliverability metric scores achieved by each dose distribution, with the red line representing 1-to-1 correlation. The x-axis corresponds to the original TMR10-produced dose array, while the y-axis corresponds to the SA-produced dose array. (Bottom row) 1D histograms for the target-to-target difference for each of the three metrics. For coverage (A) and selectivity (B), binning was selected as every 1%. For gradient index (C), bins were assigned every increment of 0.05.
Disclaimer/Publisher’s Note: The statements, opinions and data contained in all publications are solely those of the individual author(s) and contributor(s) and not of MDPI and/or the editor(s). MDPI and/or the editor(s) disclaim responsibility for any injury to people or property resulting from any ideas, methods, instructions or products referred to in the content. |
© 2024 by the authors. Licensee MDPI, Basel, Switzerland. This article is an open access article distributed under the terms and conditions of the Creative Commons Attribution (CC BY) license (http://creativecommons.org/licenses/by/4.0/).
Copyright: This open access article is published under a Creative Commons CC BY 4.0 license, which permit the free download, distribution, and reuse, provided that the author and preprint are cited in any reuse.


