
Submitted:
10 September 2025
Posted:
10 September 2025
You are already at the latest version
Abstract
This study aimed to evaluate the impact of air bubbles, thickness variations, and density differences occurring during the fabrication of 3D-printed silicone boluses on radiation dose distribution, thereby providing evidence for clinical quality assurance. Custom silicone boluses were fabricated using 3D-printed molds with varying vacuum degassing times (1, 5, and 10 minutes). Air bubble size and depth were quantified using scanner image analysis, while density and Hounsfield unit (HU) values were compared with a commercial bolus. Dosimetric evaluation was performed using a VitalBeam linear accelerator (6 MV photons) and a MatriXX 2D detector, comparing treatment planning system (TPS) calculated doses with measured doses across a 3×3 grid. Surface dose distributions were further analyzed using EBT3 film. Results showed that bubble size increased with longer vacuum times, interpreted as coalescence due to limited degassing and silicone viscosity. The density of 3D boluses ranged from 0.980–1.104 g/cm³ (commercial: 0.988 g/cm³), with HU values of +240 to +250 (commercial: −110). In point-wise comparisons, mean dose differences were less than 1% for 1- and 5-minute samples, and approximately 1% for 10 minutes, with all conditions within |Δ| ≤ 3%. Film analysis confirmed equivalent surface dose distributions. These findings suggest that 3D-printed silicone boluses are clinically feasible without complex degassing procedures.
Keywords:
patient-specific silicone bolus
; radiotherapy
; bolus dose evaluation
; air bubbles
1. Introduction
In radiotherapy, a bolus is used to compensate for the skin dose deficit caused by the build-up effect of megavoltage photon beams, thereby ensuring adequate dose delivery to the skin and superficial tissues[1,2,3]. Alt-hough commercial sheet-type boluses are standardized and easy to use, they have limitations in regions with complex body contours, where the formation of air gaps between the bolus and the skin can result in dose re-ductions of approximately 3–17%[4,5].
To address these limitations, patient-specific silicone boluses fabricated using 3D-printing technology have been developed, offering optimized conformity to individual anatomical structures[6,7]. However, custom boluses may be subject to fabrication-related uncertainties, including thickness irregularities, residual air bubbles, and density variations. In particular, internal air bubbles may not be detectable in Computed Tomography (CT)-based treatment planning and therefore might not be accounted for in dose calculations. Previous studies have primarily focused on macroscopic air gaps between the bolus and the skin, whereas the dosimetric impact of microscopic air bubbles within the bolus has not yet been systematically investigated.
Therefore, this study quantitatively analyzes the effects of air bubbles, thickness irregularities, and density dif-ferences arising during the fabrication of 3D-printed silicone boluses on radiation dose distribution, with the aim of providing fundamental data for establishing quality assurance standards to ensure the clinical safety and reli-ability of patient-specific boluses.
2. Materials and Methods
In order to apply a patient-specific silicone bolus, two CT simulations (CT-sims) are generally required (Figure 1). The first CT-sim is used for treatment planning, while the second CT-sim is acquired with the fabricated bolus applied to the patient, enabling dose recalculation that reflects fabrication-related variables such as thickness irregularities and residual air bubbles. This approach allows consideration of the physical characteristics of the bolus in the actual treatment dose distribution and provides the advantage of verifying patient setup reproduci-bility. However, this process requires three hospital visits in total (two CT-sims and one for treatment initiation) and extends the preparation period to an average of 7–8 days.
In this study, an alternative treatment planning process was proposed that omits the second CT-sim (Figure 1). This approach reduces the number of hospital visits and shortens the preparation period to 3–4 days. Further-more, the present work quantitatively evaluated the impact of thickness irregularities and residual air bubbles in the fabricated patient-specific silicone bolus on dose distribution, in order to verify whether clinically reliable planning can be achieved with a single CT-sim. To assess the effect of this simplified workflow on treatment accuracy, phantom-based experiments were conducted to explore its feasibility.
2.1. Fabrication of Patient-Specific Silicone Bolus
The fabrication process of the patient-specific silicone bolus is illustrated in Figure 2. CT images were import-ed into the treatment planning system (TPS) to define the target region and desired thickness, after which a virtual bolus was generated and exported in STereoLithography (STL) file format. The STL file was then convert-ed into slicing data for 3D printing to create a plastic mold, into which liquid silicone was cast to form the final bolus[8,9].
The fabrication process begins by importing CT images into the TPS to define the region of interest and de-sired thickness, thereby generating a virtual bolus. This virtual bolus is converted into STL file format and further processed into slicing data for 3D printing. A plastic mold is then produced using the 3D printer, and liquid sili-cone is cast into the mold to form the final bolus (Figure 2b). Clinical reports have demonstrated that this 3D printing–based mold fabrication method can be applied even to irregular anatomical sites such as the ear or nose, providing superior conformity to the skin surface compared to commercial boluses and improving work-flow efficiency[10,11].
A 3D printer (Ultimaker S5, Ultimaker B.V., Utrecht, Netherlands) was used, with a maximum build volume of 330 × 240 × 300 mm and axis precision of 6.9, 6.9, and 2.5 μm for the X, Y, and Z axes, respectively. Molds were fabricated using a 0.4 mm nozzle and 2.85 mm diameter PLA filament, with a wall thickness of 0.8 mm. Each mold was designed in three separable parts with an open upper surface to facilitate silicone pouring. A two-component addition-cure liquid silicone was used to produce the final bolus.
Potential sources of error during the fabrication process included inaccuracies in mold geometry due to me-chanical tolerances of the 3D printer and thickness irregularities of the bolus. In addition, microbubbles could form during the mixing and casting of silicone, and shrinkage during curing could alter the size and location of the bubbles. Such bubbles may not be detectable in CT images and therefore might not be reflected in dose calculations, which motivated this study to evaluate their dosimetric impact.
2.2. Fabrication of Sheet-Type Silicone Boluses
To quantitatively evaluate the effect of air bubbles on dose distribution, standardized silicone sheet specimens measuring 10 × 10 × 1 cm³ were fabricated (Figure 3). Three molds of identical dimensions were produced using a 3D printer, and liquid silicone was poured under identical conditions.
Vacuum degassing was applied to control the amount of entrapped air, with treatment times set to 1, 5, and 10 minutes, respectively, in order to produce samples with varying bubble densities. A household vacuum seal-ing system was employed to reflect a practical and clinically accessible method. By varying the degree of air re-moval during silicone curing, differences in the size and distribution of microbubbles were intentionally induced.
The fabricated specimens were designed to simulate a range of air bubble conditions that may occur during the production of patient-specific boluses, and were subsequently used to compare and analyze their dosimetric effects.
2.3. Analysis of Air Bubble Size and Density
High-resolution cross-sectional images of each specimen were acquired using a flatbed scanner (Epson Ex-pression 13000XL, Seiko Epson Corp., Nagano, Japan). Image analysis was performed with ImageJ, and the di-ameter and depth (from the surface) of air bubbles were measured within ten systematically selected regions of interest (ROIs, 20 × 20 mm²) per sample. Up to four bubbles were extracted per ROI, resulting in a total of 40 measurements for each condition (1, 5, and 10 minutes). Due to the inherent limitations of cross-sectional im-age-based evaluation, some discrepancies from the true three-dimensional bubble geometry may exist. To en-sure consistency, all measurements were performed by the same investigator.
For data analysis, the mean ± standard deviation, minimum–maximum values, coefficient of variation (CV%), and standard error (SE = SD/√n) were calculated for each condition. In addition, 95% confidence intervals were estimated using the t-distribution with 39 degrees of freedom.
To assess statistical differences among the three conditions, the Shapiro–Wilk test was first performed to test normality. If normality was satisfied, one-way analysis of variance (ANOVA) was conducted, and Tukey’s HSD post-hoc test was applied when significant differences were observed. If normality was not met, the Kruskal–Wallis test was used instead. A p-value < 0.05 was considered statistically significant.
For density evaluation of the commercial bolus and the fabricated 3D-printed silicone boluses, the mass of each specimen was measured using an electronic balance (Mettler Toledo, Greifensee, Switzerland). Volumes were calculated from CT images (SOMATOM Definition AS, Siemens Healthineers, Erlangen, Germany) using segmentation, and density (g/cm³) was derived by dividing mass by volume. In addition, Hounsfield unit (HU) values of each bolus were extracted from CT images for comparison of physical properties.
2.4. Dosimetric Analysis
To evaluate the dose reproducibility of commercial boluses and 3D-printed patient-specific silicone boluses, two-dimensional dose distributions of the calculated dose from the TPS and the measured dose were compared. All experiments were performed using a VitalBeam linear accelerator (Varian Medical Systems, Palo Alto, CA, USA) with a 6 Megavoltage (MV) photon beam. Beam parameters were set to a 10 × 8 cm² field size with 200 monitor units (MUs).
Dose measurements were performed using a MatriXX FFF 2D ionization chamber array detector (IBA Dosime-try, Schwarzenbruck, Germany). A 2 cm-thick RW3 phantom was placed above the detector, and the bolus un-der evaluation was positioned such that its center aligned with the isocenter. Corresponding calculated dose distributions for the same measurement plane were generated in the TPS.
Data analysis was conducted using an in-house Python-based program. After registering both distributions to a common coordinate system, point-by-point dose differences were calculated at nine grid points (3 × 3 array within ±20 mm from the isocenter) using the formula Δ = (measured − planned) / planned × 100 (%). Evalua-tion metrics included mean, standard deviation, and root mean square (RMS) differences. Additionally, the pro-portion of points satisfying |Δ| ≤ 1% and |Δ| ≤ 2% was reported according to commonly applied clinical toler-ance criteria.
For assessment of surface dose distribution, each bolus was placed on a cylindrical phantom with a radio-chromic film (EBT3, Ashland Advanced Materials) positioned between the phantom and the bolus. Irradiation was delivered with a 3 × 3 cm² field at 100 monitor units, and the resulting isodose distributions were analyzed.
3. Results
3.1. Measurement of Air Bubble Size
Based on the analysis of Figure 4, bubble size was observed to increase with longer vacuum treatment times. This finding can be interpreted as incomplete removal of microbubbles under limited vacuum conditions, with smaller bubbles gradually coalescing over time to form larger bubbles. The high viscosity of silicone is also con-sidered to contribute to the incomplete expulsion of bubbles. The mean bubble size was 0.21 ± 0.05 mm (95% CI: 0.20–0.23) at 1 minute, 0.28 ± 0.16 mm (95% CI: 0.23–0.33) at 5 minutes, and 0.34 ± 0.12 mm (95% CI: 0.30–0.38) at 10 minutes. One-way ANOVA confirmed statistically significant differences among groups (F = 12.32, p < 0.001; Kruskal–Wallis, H = 32.56, p < 0.001). Post-hoc analysis showed significant differences between 1 min and 5 min (p = 0.025) and between 1 min and 10 min (p < 0.001), whereas the difference between 5 min and 10 min was marginally significant (p = 0.059).

Table 1.
Extended statistical summary of air bubble size and depth (mm) across three time conditions. Values are presented as mean ± SD [min–max], coefficient of variation (CV%), and 95% confidence interval (CI).
Table 1.
Extended statistical summary of air bubble size and depth (mm) across three time conditions. Values are presented as mean ± SD [min–max], coefficient of variation (CV%), and 95% confidence interval (CI).
| Parameter | Condition |
Mean ± SD (mm) [Min–Max] |
CV (%) | 95% CI (mm) |
ANOVA p-value |
Tukey HSD (significant) |
| Size | 1 min (n=40) | 0.21 ± 0.05 [0.12–0.33] | 22.3 | [0.20 – 0.23] | <0.001 | 1 vs 5 (p=0.025); 1 vs 10 (p<0.001) |
| 5 min (n=40) | 0.28 ± 0.16 [0.15–1.19] | 55.7 | [0.23 – 0.33] | |||
| 10 min (n=40) | 0.34 ± 0.12 [0.13–0.55] | 35.4 | [0.30 – 0.38] | |||
| Depth | 1 min (n=40) | 2.72 ± 1.84 [0.04–6.88] | 67.6 | [2.13 – 3.31] | <0.001 | 1 vs 10 (p=0.019); 5 vs 10 (p<0.001) |
| 5 min (n=40) | 3.38 ± 1.83 [0.06–6.68] | 54.3 | [2.79 – 3.97] | |||
| 10 min (n=40) | 1.71 ± 1.20 [0.05–4.70] | 70.2 | [1.32 – 2.09] |
SD = standard deviation; CV = coefficient of variation; CI = confidence interval. ANOVA = one-way analysis of variance. Post-hoc comparisons were conducted using Tukey’s HSD test.
For bubble depth, the mean value was greatest under the 5-minute condition. The mean depth was 2.72 ± 1.84 mm (95% CI: 2.13–3.31) at 1 minute, 3.38 ± 1.83 mm (95% CI: 2.79–3.97) at 5 minutes, and 1.71 ± 1.20 mm (95% CI: 1.32–2.09) at 10 minutes. Intergroup differences were statistically significant (ANOVA, F = 10.42, p < 0.001; Kruskal–Wallis, H = 16.20, p = 0.0003). Post-hoc testing revealed significant differences between 1 min and 10 min (p = 0.019) and between 5 min and 10 min (p < 0.001), whereas the difference between 1 min and 5 min was not significant (p = 0.180).
In summary, microbubble size tended to increase significantly with longer vacuum treatment, with a statisti-cally significant difference observed at 10 minutes. In contrast, bubble depth was greatest under the 5-minute condition but decreased significantly at 10 minutes.
3.2. Measurement of Density and HU Values
The physical properties of the fabricated 3D-printed silicone boluses were compared with those of a commer-cial bolus used as a control. Density measurements showed that the commercial bolus had a density of 0.988 g/cm³, whereas the 3D-printed boluses exhibited a range of 0.980–1.104 g/cm³.
On CT imaging, the HU values were −110 HU for the commercial bolus and +240 to +250 HU for the 3D-printed silicone boluses. These differences in HU values are attributable to the inherent physical properties and density variations of the two bolus materials, reflecting their distinct radiation attenuation characteristics.
Figure 5.
Experimental setup for measuring the density of bolus samples. Each silicone sheet was placed on an electronic balance to determine its mass, and the measured values, combined with the sample dimensions, were used to calculate density.
Figure 5.
Experimental setup for measuring the density of bolus samples. Each silicone sheet was placed on an electronic balance to determine its mass, and the measured values, combined with the sample dimensions, were used to calculate density.

3.3. Dosimetric Analysis
The quantitative results of the dose distribution comparison in Figure 6 are summarized in Table 2. For each condition (commercial bolus and 3D-printed silicone boluses fabricated with 1-, 5-, and 10-minute vacuum treatments), the differences between measured and TPS-calculated doses were evaluated at nine grid points (3 × 3 array within ±20 mm of the isocenter).
For the commercial bolus, the mean Δ was −0.34%, and all measurement points fell within |Δ| ≤ 2%, demon-strating excellent agreement with the planned dose. For the 3D-printed boluses, the mean Δ gradually in-creased with longer vacuum treatment times: +0.51% at 1 minute, +0.67% at 5 minutes, and +0.95% at 10 minutes.
In particular, under the 10-minute condition, the mean Δ rose to approximately +1%, and the RMS value in-creased to 1.22%. At this condition, two of the nine grid points exceeded |Δ| > 2% (7/9 points passed). Never-theless, all bolus conditions satisfied the clinical tolerance of |Δ| ≤ 3%.
Overall, both the commercial and 3D-printed boluses showed agreement between TPS and measured dose distributions within the clinically acceptable error margin (±3%). However, in the case of 3D-printed boluses, a slight tendency was observed for the measured dose to exceed the planned dose as vacuum time increased, which may be associated with the characteristics of microbubbles generated during the fabrication process.
3.3. Surface Dose Distribution
Figure 7 compares the measured dose profiles of a commercial bolus and custom 3D-printed silicone boluses fabricated with different vacuum treatment times (1, 5, and 10 minutes). Under all conditions, the dose near the isocenter (0 mm) was consistently observed at approximately 67 cGy, demonstrating excellent reproducibility of central dose delivery regardless of bolus type under identical irradiation conditions.
Toward the lateral edges of the profile (±20 mm), the dose gradually decreased to about 59–60 cGy, consistent with the expected dose fall-off at the beam field boundary. The dose profiles for the commercial bolus and the 1- and 5-minute silicone boluses were nearly superimposed across the entire curve, confirming the consistency of dose delivery. In contrast, the 10-minute condition showed a slightly lower dose pattern in the ±15–20 mm region; however, the difference was within 2 cGy, which remains clinically acceptable.
4. Discussion
In this study, the effects of residual air bubbles, thickness irregularities, and differences in density and HU val-ues arising during the fabrication of 3D-printed silicone boluses on radiation dose distribution were evaluated. The analysis confirmed the presence of some air bubbles (maximum diameter approximately 1 mm, depth up to 7 mm) and thickness variations; however, the differences between planned and measured doses remained with-in clinically acceptable limits (±3–5%) (Table 2, Figure 6). These results comply with the commonly applied quality assurance (QA) tolerance in radiotherapy of a 3% dose error and 3 mm spatial error. Furthermore, film-based surface dose analysis demonstrated that the 3D-printed boluses achieved an equivalent performance level to that of commercial boluses (Figure 7).
Previous studies have primarily evaluated the effect of air gaps between the bolus and the skin on surface dose. Butson et al. [4] reported that a 10 mm air gap under 6 MV photon irradiation could reduce the surface dose by approximately 10%. Boman et al.[5] found that in VMAT, a 10 mm air gap resulted in a 13.6% reduction, whereas the decrease was limited to ≤2.6% when using the field-in-field technique. Dilson et al.[1] reported that uniform air gaps of 5–15 mm caused a 5–18% dose reduction, while non-uniform air gaps led to smaller reduc-tions of around 3–3.5%. In addition, Khan et al.[12] demonstrated that significant dose reduction (~10%) occurred when air gaps exceeded 5 mm. Collectively, these studies highlight the negative impact of air gaps on treat-ment accuracy.
Meanwhile, recent studies have highlighted the advantages of patient-specific or 3D-printed boluses. Wang et al.[6] reported that silicone custom boluses significantly reduced the air gap volume and the discrepancy between planned and measured doses compared with commercial boluses. Kim et al.[13] demonstrated that patient-specific boluses reduced the air gap volume by more than 77% and improved both the mean dose error and standard deviation in 3D-CRT and VMAT. In addition, Chatchumnan et al.[14] reported that silicone boluses fabri-cated for head and neck treatments exhibited HU values, density, and thickness characteristics equivalent to those of commercial boluses, and showed comparable or even superior results in dose profiles and gamma analysis.
In contrast, the present study quantitatively analyzed the impact of air bubbles located within the bolus on dose distribution. While previous reports have only mentioned the possibility of bubble formation, few studies have systematically correlated the actual size and depth distribution of bubbles with corresponding dose varia-tions. This study addresses that gap and demonstrates that microbubbles generated during the fabrication of custom boluses have only a limited effect on delivered dose.
Several clinical considerations should be noted. First, the study was conducted using a homogeneous phan-tom, which cannot fully replicate the complex anatomical structures and tissue heterogeneity of actual patients. Second, the detection of air bubbles may be underestimated due to the spatial resolution limitations of CT im-aging, particularly for bubbles smaller than 1 mm in diameter. Third, in advanced techniques such as Intensity-Modulated Radiation Therapy (IMRT), VMAT, and Stereotactic Body Radiation Therapy (SBRT), small fields and high dose rates are employed; under these conditions, repeated beam intersections with bolus-entrapped bub-bles could induce local dose inhomogeneities (hotspots). This effect may be particularly significant in SBRT, where cumulative errors could have clinically meaningful consequences. Therefore, extended validation with di-verse treatment techniques and patient datasets is required before these findings can be generalized to clinical practice. Such follow-up investigations will support both the optimization of bolus fabrication processes and the establishment of clinical reliability.
From a QA perspective, setting fabrication conditions to minimize bubble formation and implementing CT-based verification procedures may be beneficial. Although complete elimination of bubbles through vacuum or pressurization could be ideal (An et al., 2019; Hobbis et al., 2024), the present findings indicate that the ob-served level of bubbles did not produce clinically significant dose deviations. Thus, custom boluses fabricated under appropriate QA can provide clinically acceptable reliability without requiring complex additional proce-dures.
In conclusion, this study systematically evaluated the effect of internal air bubbles within patient-specific sili-cone boluses on dose delivery in radiotherapy. The observed levels of bubbles resulted in dose reproducibility within clinically acceptable limits in the phantom setting. Nevertheless, further prospective clinical validation and expanded assessments across different treatment modalities are necessary for clinical translation. Such efforts will contribute not only to the optimization of fabrication processes but also to potential workflow simplification in the future.
5. Conclusion
This study represents one of the first attempts to quantitatively verify the impact of internal air bubbles within patient-specific silicone boluses on radiation dose delivery, highlighting its clinical significance. The levels of bubbles observed in this study demonstrated dose reproducibility largely within clinically acceptable limits; how-ever, it would be more appropriate to interpret this as conditional safety rather than concluding that bubble removal processes are unnecessary.
For clinical implementation, it is essential to establish individualized QA criteria that take into account each institution’s equipment environment, treatment objectives, and patient characteristics. Continuous monitoring and verification are required to ensure safety. Such a cautious approach will not only maximize the clinical utility of patient-specific silicone boluses but also contribute to ensuring patient safety.
In the future, multicenter validation studies based on real patient data are expected to facilitate workflow opti-mization and the establishment of standardized clinical guidelines.
Funding
This research received no external funding.
Institutional Review Board Statement
Not applicable.
Data Availability Statement
Not applicable.
Acknowledgments
The authors would like to thank the Department of Radiation Oncology at Keimyung University Dongsan Medi-cal Center for supporting this research.
Conflicts of Interest
The authors declare no conflict of interest.
References
- Dilson, L.; Challapalli, S.; Sourjya, B.; Athiyamaan, M.S.; Ramamoorthy, R.; Johan, S.; Abhishek, K. Estimation of Surface Dose in the Presence of Unwanted Air Gaps under the Bolus in Postmastectomy Radiation Therapy: A Phantom Dosimetric Study. Asian Pac. J. Cancer Prev. 2022, 23, 2973–2981. [Google Scholar] [CrossRef] [PubMed]
- Vyas, V.; Palmer, L.; Mudge, R.; Jiang, R.; Fleck, A.; Schaly, B.; Osei, E.; Charland, P. On bolus for megavoltage photon and electron radiation therapy. Med Dosim. 2013, 38, 268–273. [Google Scholar] [CrossRef] [PubMed]
- Li, F.; Hu, W.; Li, H.; Li, B.; Wang, Y. Bolus Use in Postmastectomy Radiation Therapy for Breast Cancer: A Systematic Literature Review. Technol. Cancer Res. Treat. 2025, 24. [Google Scholar] [CrossRef] [PubMed]
- Huang, C.-Y.; Yang, B.; Lam, W.W.; Tang, K.K.; Li, T.C.; Law, W.K.; Cheung, K.Y.; Yu, S.K. Effects on skin dose from unwanted air gaps under bolus in an MR-guided linear accelerator (MR-linac) system. Phys. Med. Biol. 2021, 66, 065021. [Google Scholar] [CrossRef] [PubMed]
- Boman, E.; Ojala, J.; Rossi, M.; Kapanen, M. Monte Carlo investigation on the effect of air gap under bolus in post-mastectomy radiotherapy. Phys. Medica 2018, 55, 82–87. [Google Scholar] [CrossRef] [PubMed]
- Wang, K.M.; Rickards, A.J.; Bingham, T.; Tward, J.D.; Price, R.G. Technical note: Evaluation of a silicone-based custom bolus for radiation therapy of a superficial pelvic tumor. J. Appl. Clin. Med Phys. 2022, 23, e13538. [Google Scholar] [CrossRef] [PubMed]
- Gugliandolo, S.G.; Pillai, S.P.; Rajendran, S.; Vincini, M.G.; Pepa, M.; Pansini, F.; Zaffaroni, M.; Marvaso, G.; Alterio, D.; Vavassori, A.; et al. 3D-printed boluses for radiotherapy: influence of geometrical and printing parameters on dosimetric characterization and air gap evaluation. Radiol. Phys. Technol. 2024, 17, 347–359. [Google Scholar] [CrossRef] [PubMed]
- Hobbis, D.; Armstrong, M.D.; Patel, S.H.; Tegtmeier, R.C.; Laughlin, B.S.; Chitsazzadeh, S.; Clouser, E.L.; Smetanick, J.L.; Pettit, J.; Gagneur, J.D.; et al. Comprehensive clinical implementation, workflow, and FMEA of bespoke silicone bolus cast from 3D printed molds using open-source resources. J. Appl. Clin. Med Phys. 2024, 25, e14498. [Google Scholar] [CrossRef] [PubMed]
- Hobbis, D.; Armstrong, M.D.; Patel, S.H.; Tegtmeier, R.C.; Laughlin, B.S.; Chitsazzadeh, S.; Clouser, E.L.; Smetanick, J.L.; Pettit, J.; Gagneur, J.D.; et al. Comprehensive clinical implementation, workflow, and FMEA of bespoke silicone bolus cast from 3D printed molds using open-source resources. J. Appl. Clin. Med Phys. 2024, 25, e14498. [Google Scholar] [CrossRef] [PubMed]
- Huang, C.-Y.; Yang, B.; Lam, W.W.; Tang, K.K.; Li, T.C.; Law, W.K.; Cheung, K.Y.; Yu, S.K. Effects on skin dose from unwanted air gaps under bolus in an MR-guided linear accelerator (MR-linac) system. Phys. Med. Biol. 2021, 66, 065021. [Google Scholar] [CrossRef] [PubMed]
- Bochyńska, A.; Zawadzka, A.; Kukołowicz, P.; Spałek, M.J. Application of 3D printing for personalized boluses in radiotherapy: a systematic review. Rep. Pr. Oncol. Radiother. 2025, 30, 100–113. [Google Scholar] [CrossRef] [PubMed]
- Khan, Y.; Villarreal-Barajas, J.E.; Udowicz, M.; Sinha, R.; Muhammad, W.; Abbasi, A.N.; Hussain, A. Clinical and Dosimetric Implications of Air Gaps between Bolus and Skin Surface during Radiation Therapy. J. Cancer Ther. 2013, 04, 1251–1255. [Google Scholar] [CrossRef]
- Kim, J.; Park, J.; Park, B.; Park, B.; Kim, T.-G. Feasibility of a Patient-Specific Bolus Using the Life-Casting Method for Radiation Therapy. Appl. Sci. 2023, 13, 9977. [Google Scholar] [CrossRef]
- Chatchumnan, N.; Kingkaew, S.; Aumnate, C.; Sanghangthum, T. Development and dosimetric verification of 3D customized bolus in head and neck radiotherapy. J. Radiat. Res. 2022, 63, 428–434. [Google Scholar] [CrossRef] [PubMed]
- An, H.J.; Kim, M.S.; Kim, J.; Son, J.; Choi, C.H.; Park, J.M.; Kim, J.-I. Geometric Evaluation of Patient-Specific 3D Bolus from 3D Printed Mold and Casting Method for Radiation Therapy. Prog. Med Phys. 2019, 30, 32–38. [Google Scholar] [CrossRef]
Figure 1.
Comparison of workflows for the fabrication of patient-specific boluses.
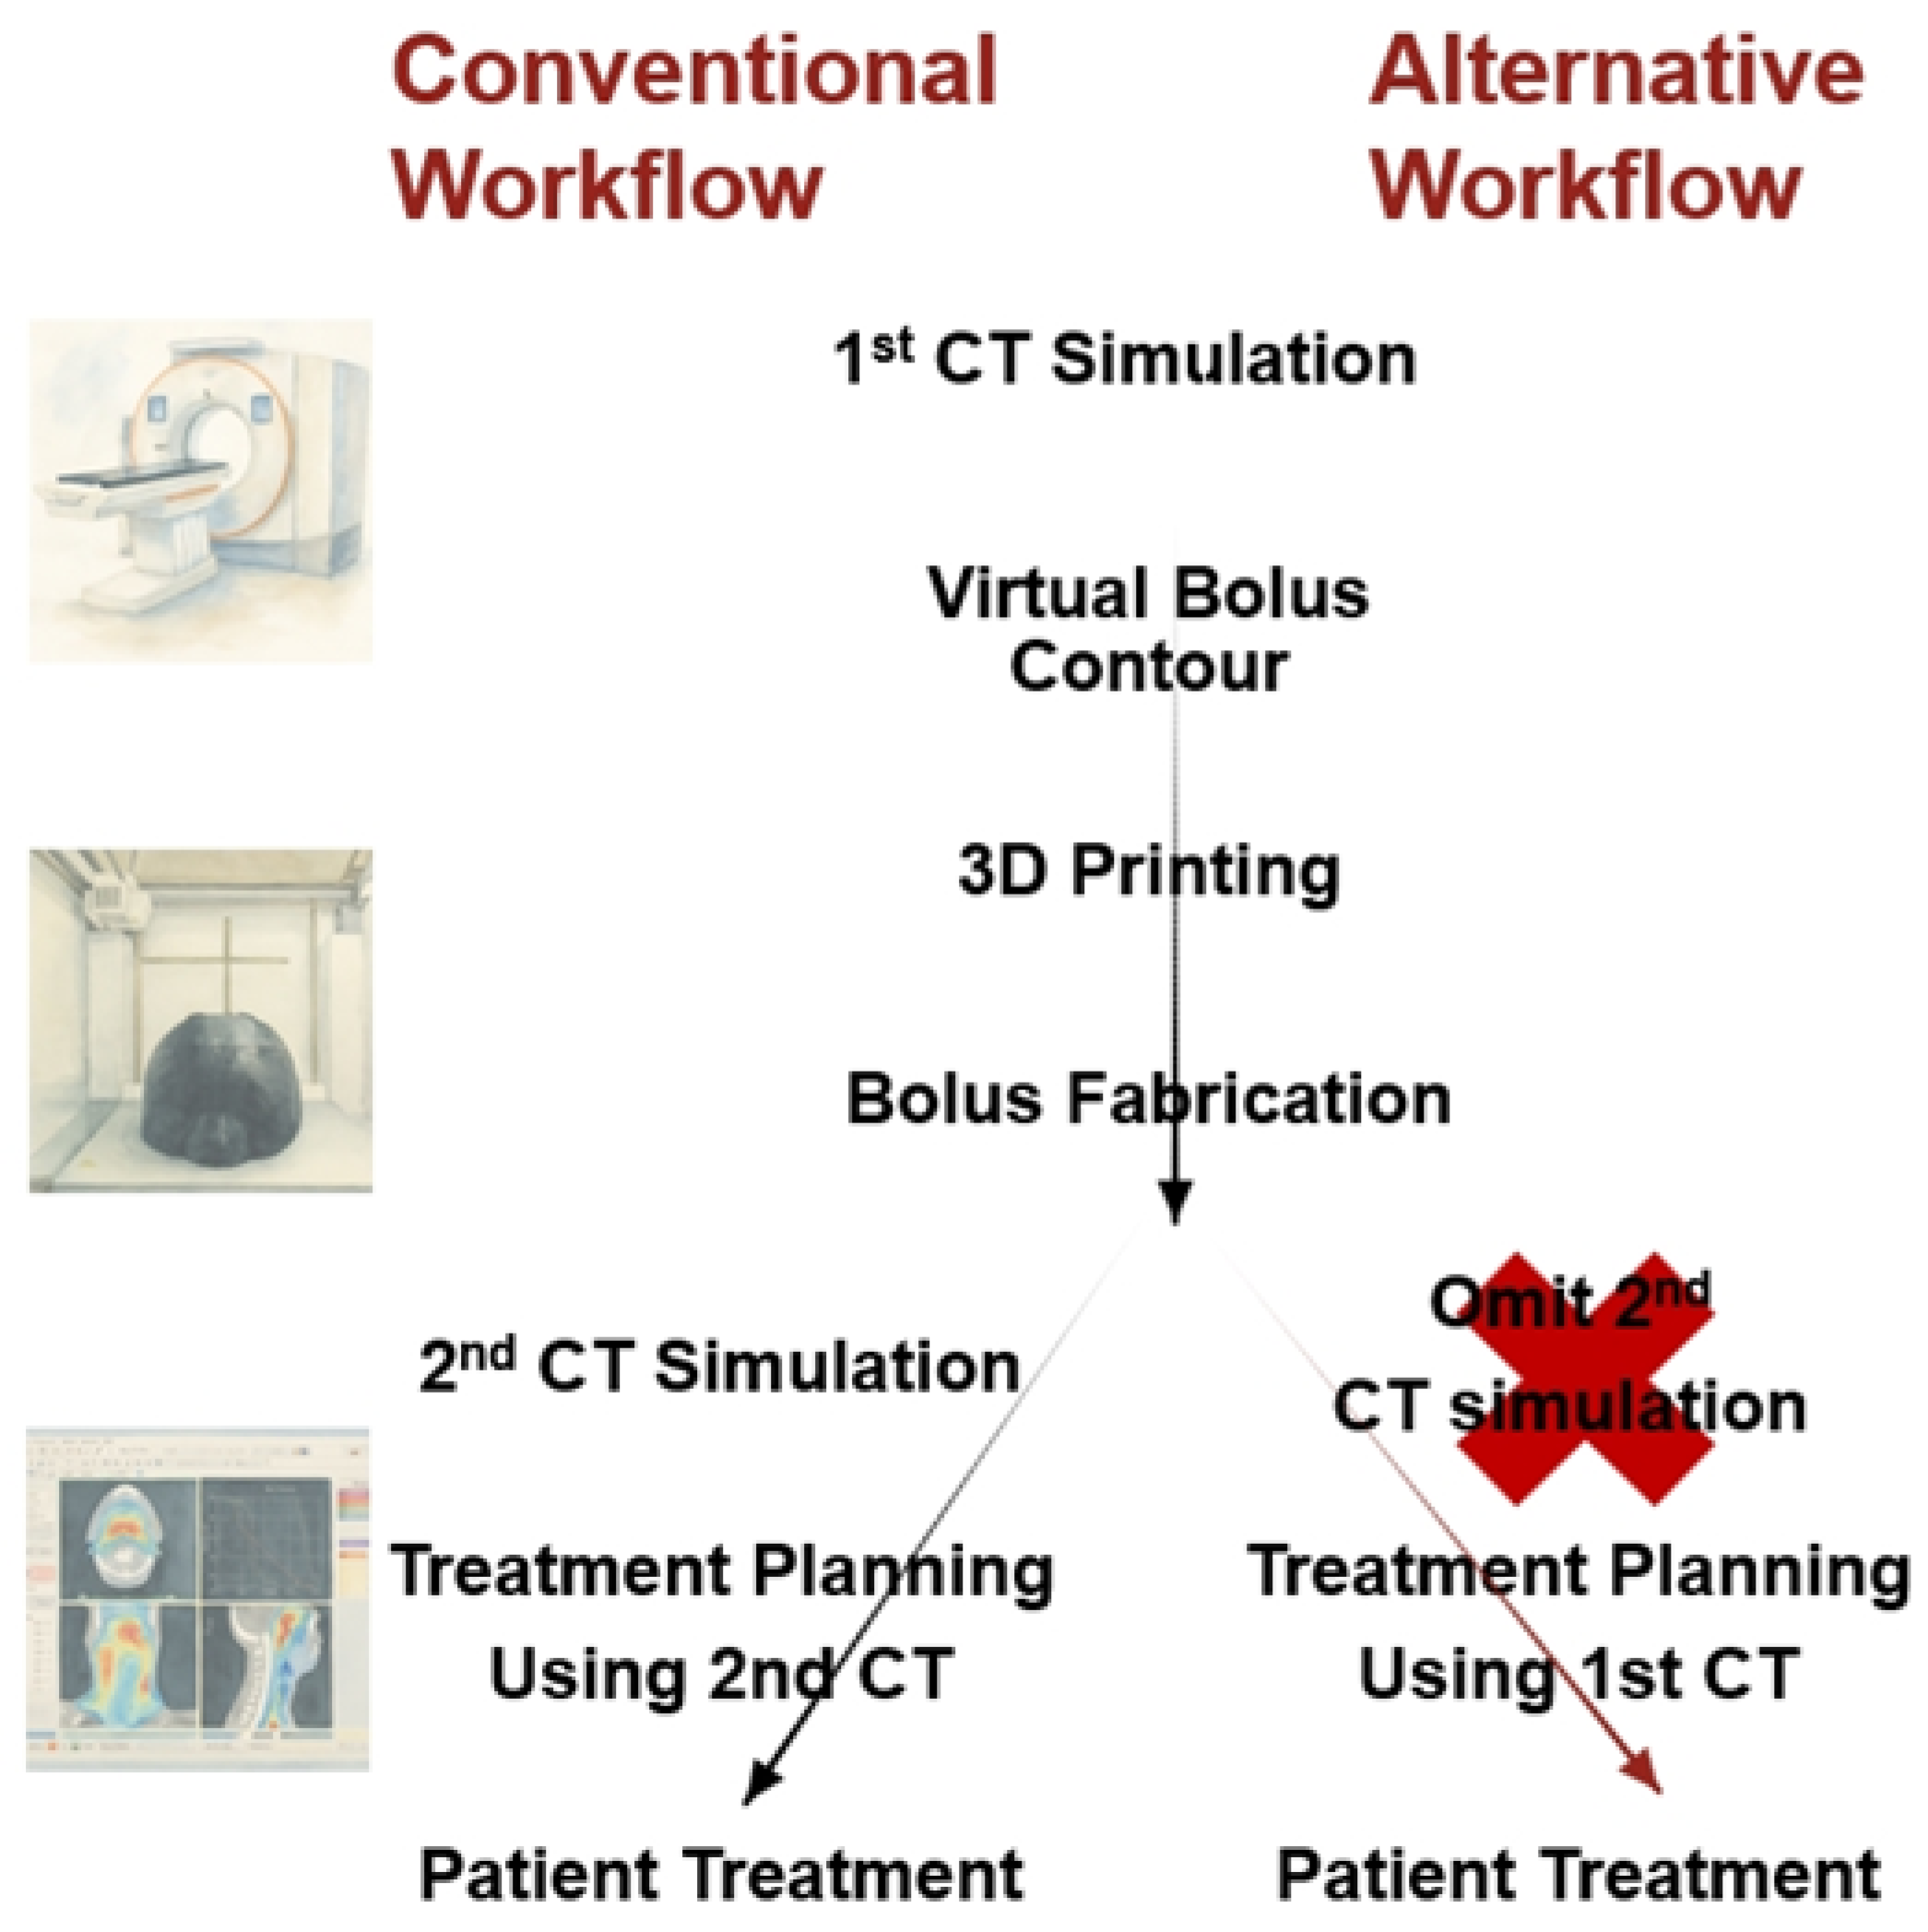
Figure 2.
Examples of applying patient-specific silicone boluses fabricated with a 3D printer for different clinical cases. (a) A patient with systemic lymphoma treated to the facial region using Volumetric Modulated Arc Thera-py (VMAT); a customized facial bolus was fabricated to ensure adequate dose coverage. (b) A cervix cancer pa-tient with a vulvar tumor protruding externally; a conformal bolus was designed to precisely match the tumor surface, and treatment was delivered using 3D conformal radiotherapy. (c) A patient with lymphoma of the low-er extremity; a foot-shaped bolus was created to enable VMAT delivery adapted to the contour of the limb.
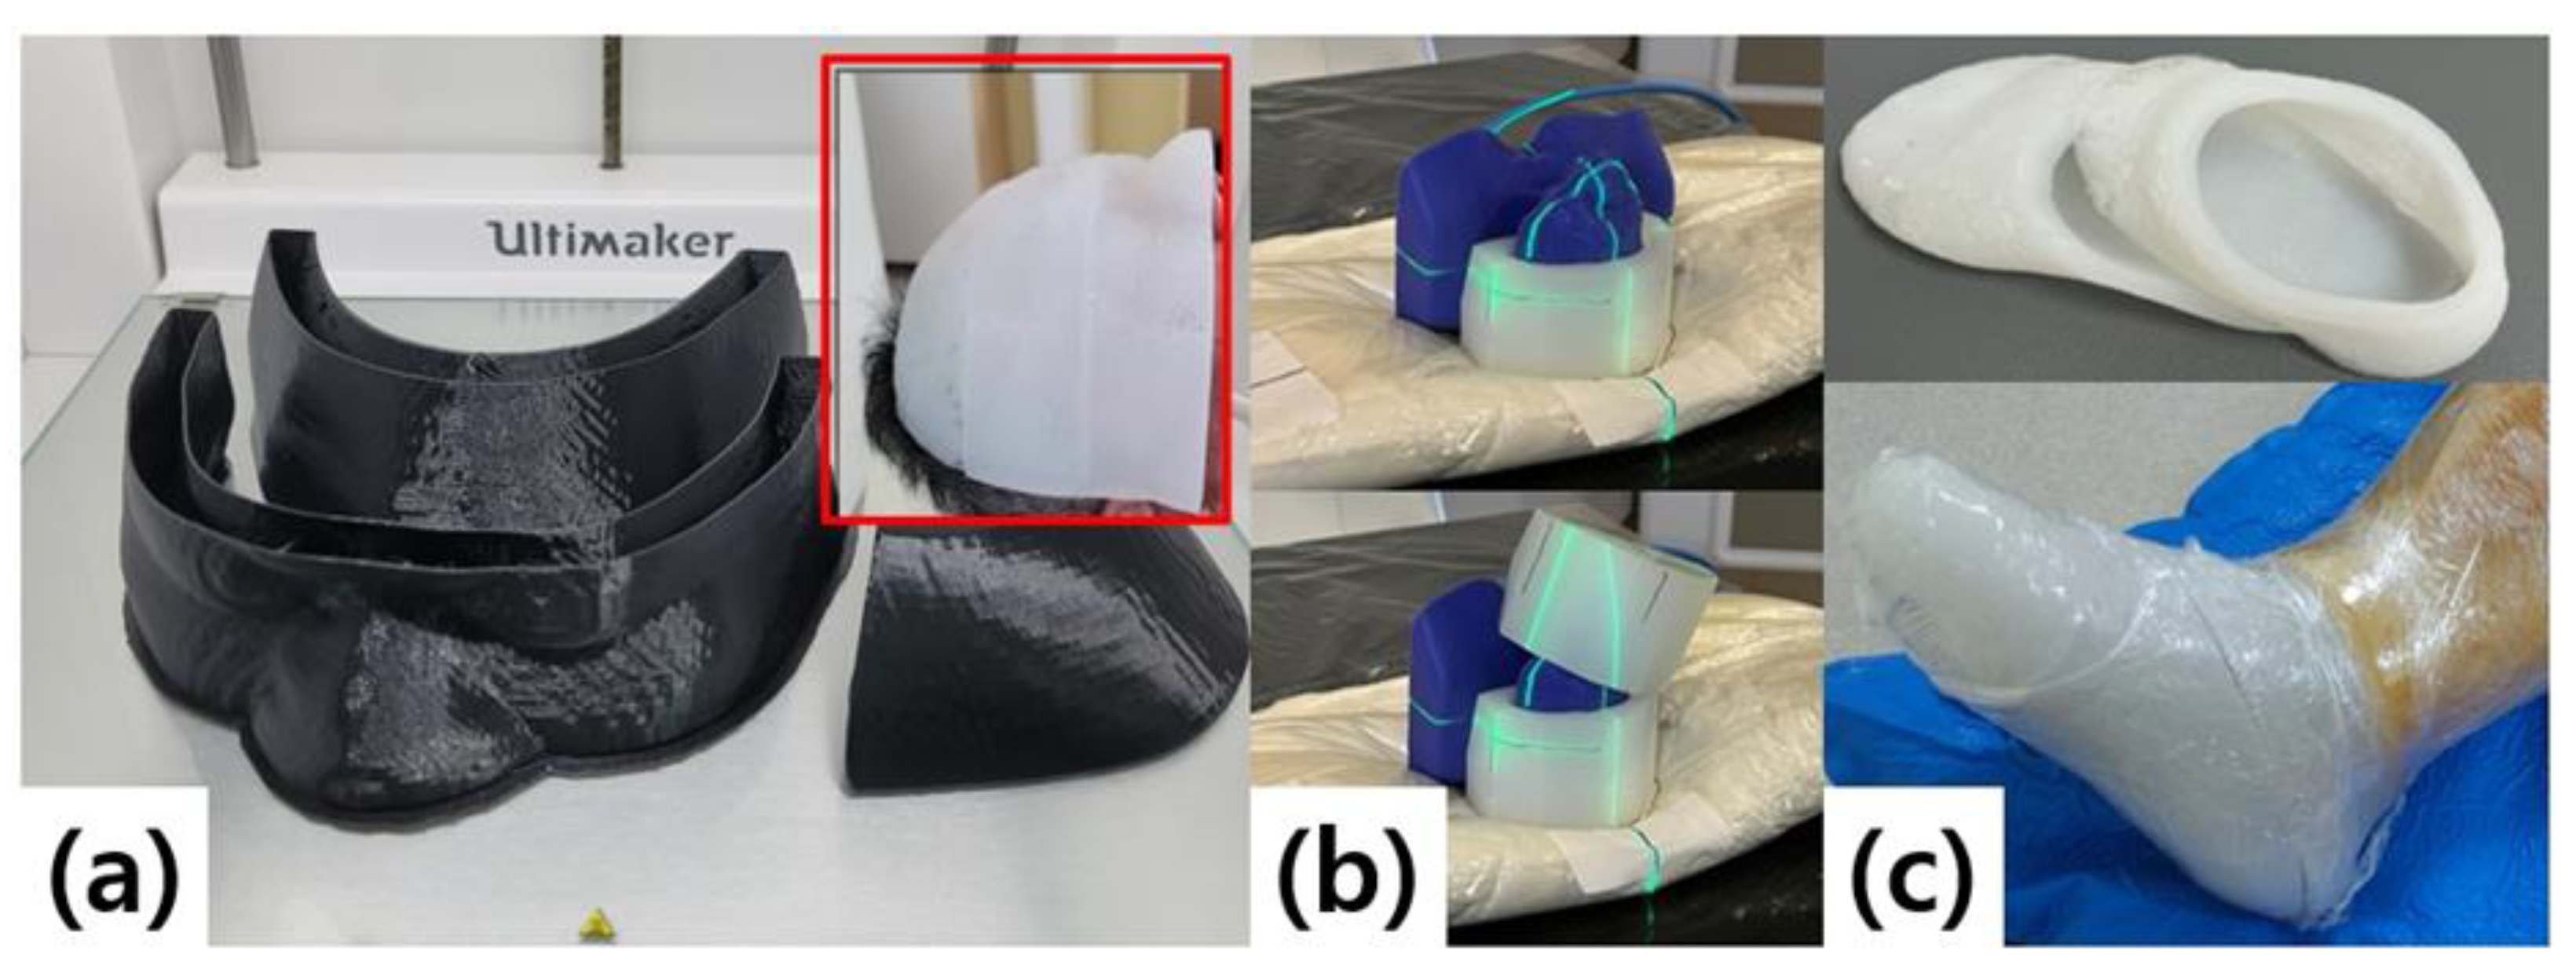
Figure 3.
Fabrication process of sheet-type silicone boluses. (a) Preparation of a rectangular silicone mold (10 × 10 × 1 cm³) using 3D printing and pouring of silicone solution. (b) Vacuum sealing procedure to control the amount of entrapped air during curing.
Figure 3.
Fabrication process of sheet-type silicone boluses. (a) Preparation of a rectangular silicone mold (10 × 10 × 1 cm³) using 3D printing and pouring of silicone solution. (b) Vacuum sealing procedure to control the amount of entrapped air during curing.
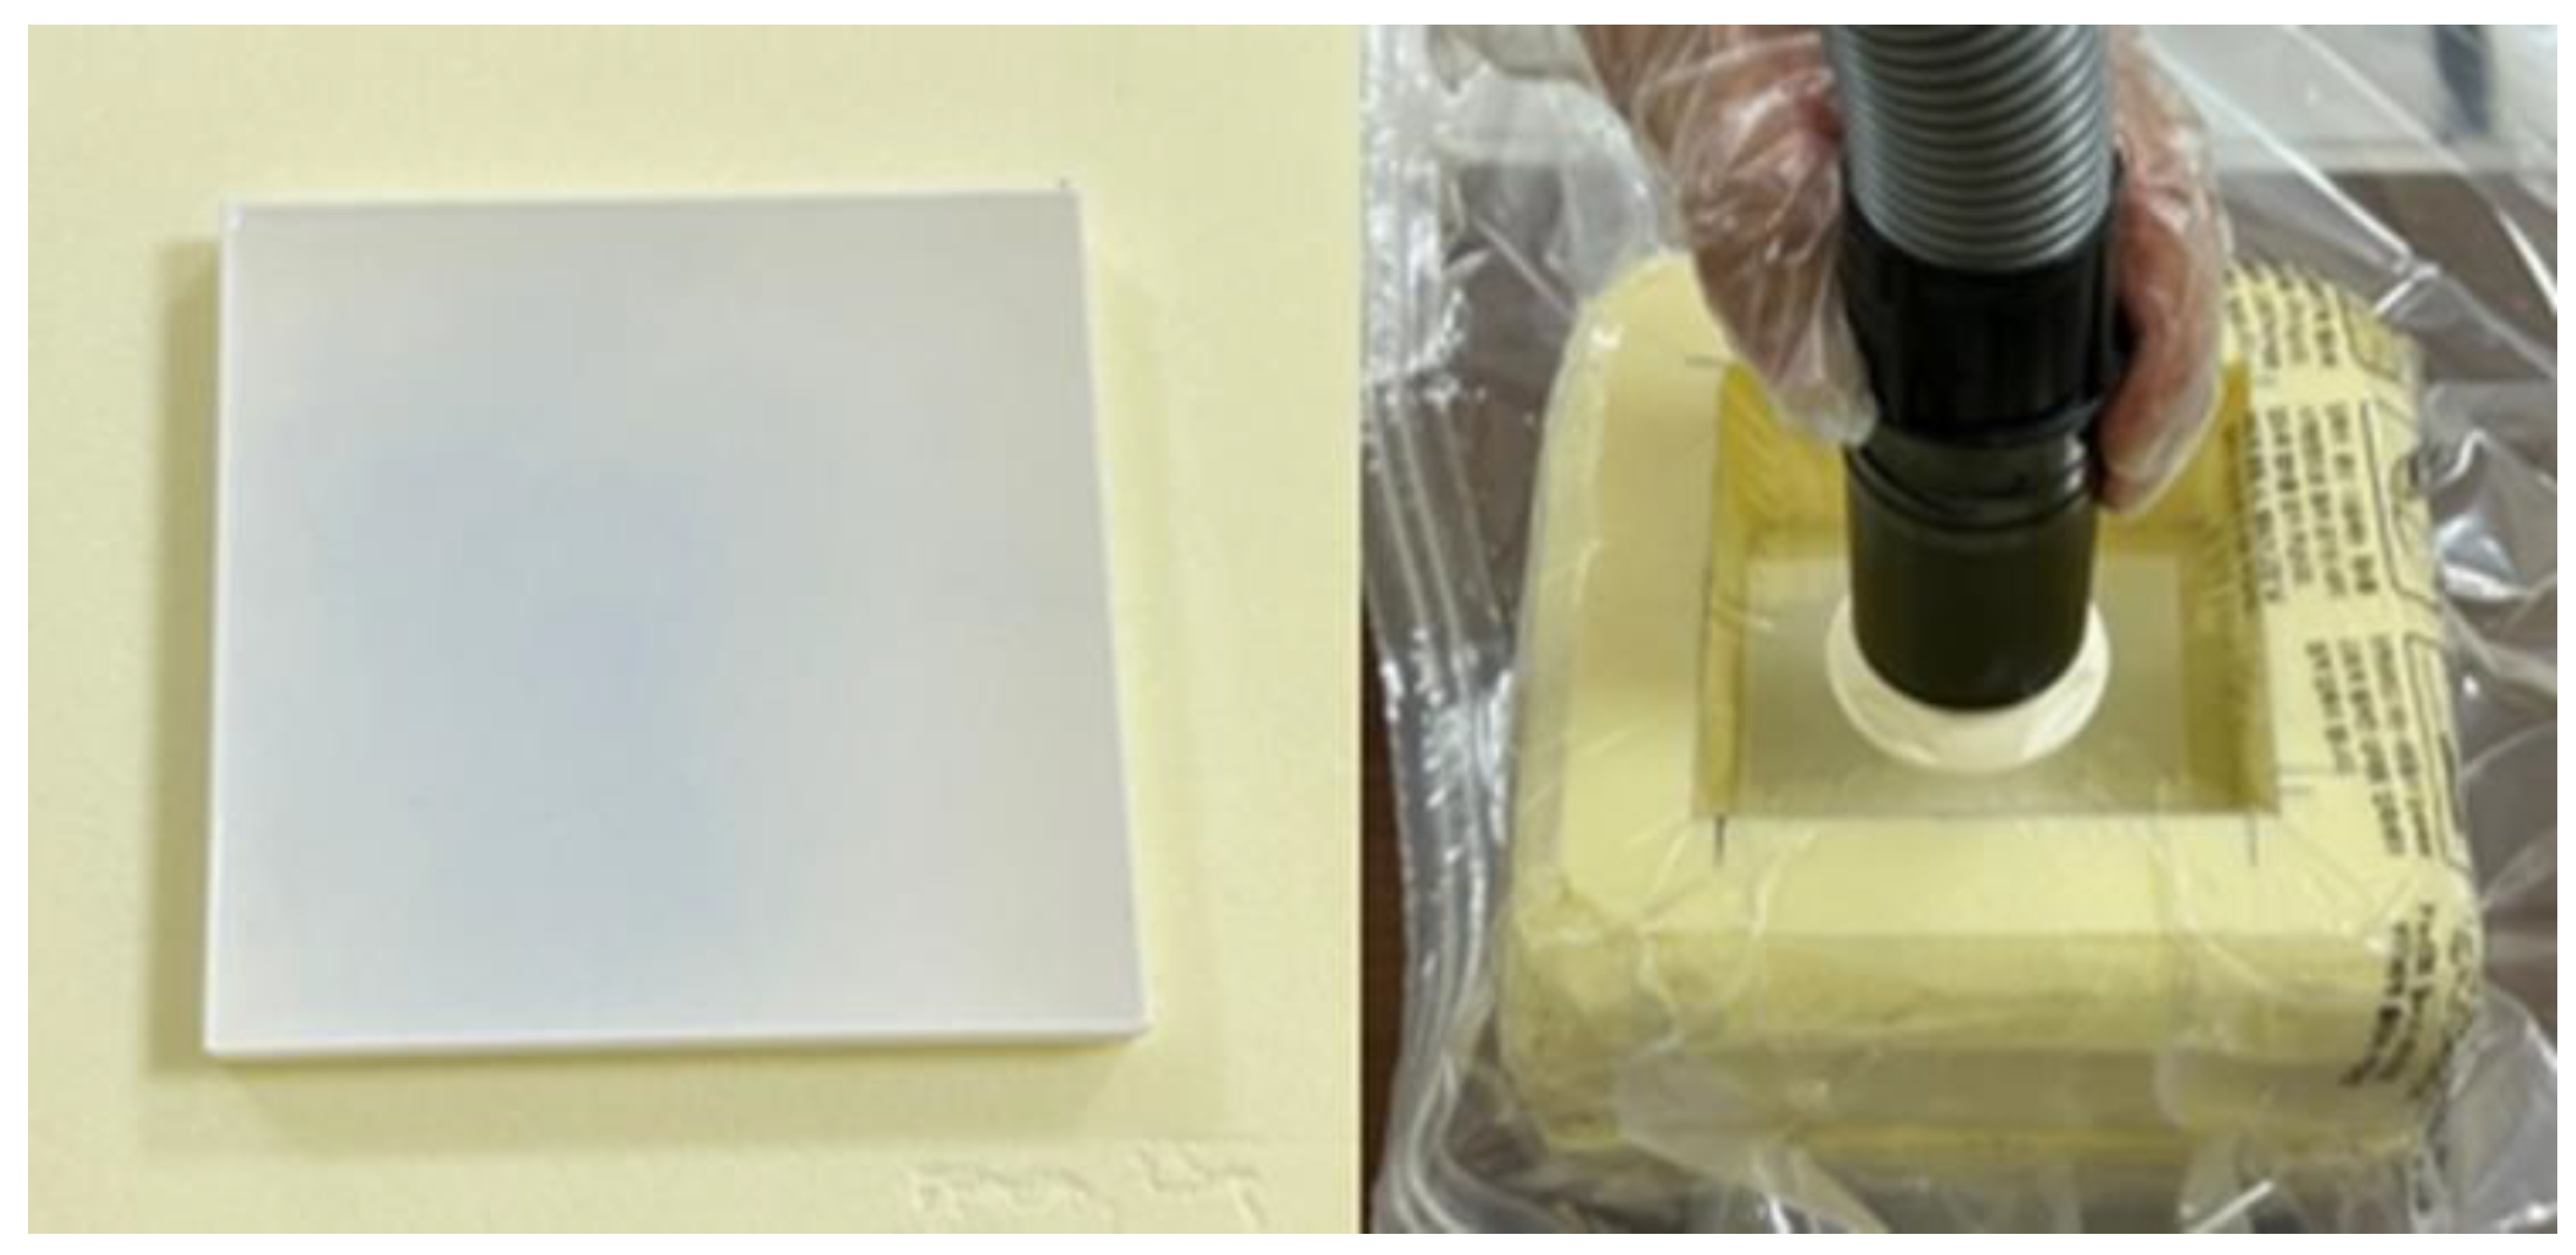
Figure 4.
Cross-sectional scans of silicone sheets fabricated with identical thickness and subjected to different vacuum treatment times (1, 5, and 10 min). Each sample was cut and scanned using a flatbed scanner. A ruler was included in the image to provide a reference for thickness measurement and to visualize the variation in entrapped microbubbles according to the vacuum duration.

Figure 6.
Comparison of two-dimensional dose distributions between TPS (Planned, background) and measurement with MatriXX FFF (contours) for a commercial bolus (a) and a custom 3D-printed silicone bolus under three delivery conditions (1, 5, and 10 min; b–d). Profiles along the central crosshairs and point-wise dose differences (3×3 grid at ±20 mm from isocenter) were extracted and analyzed using an in-house Python code. Each distribution is normalized to its maximum dose.
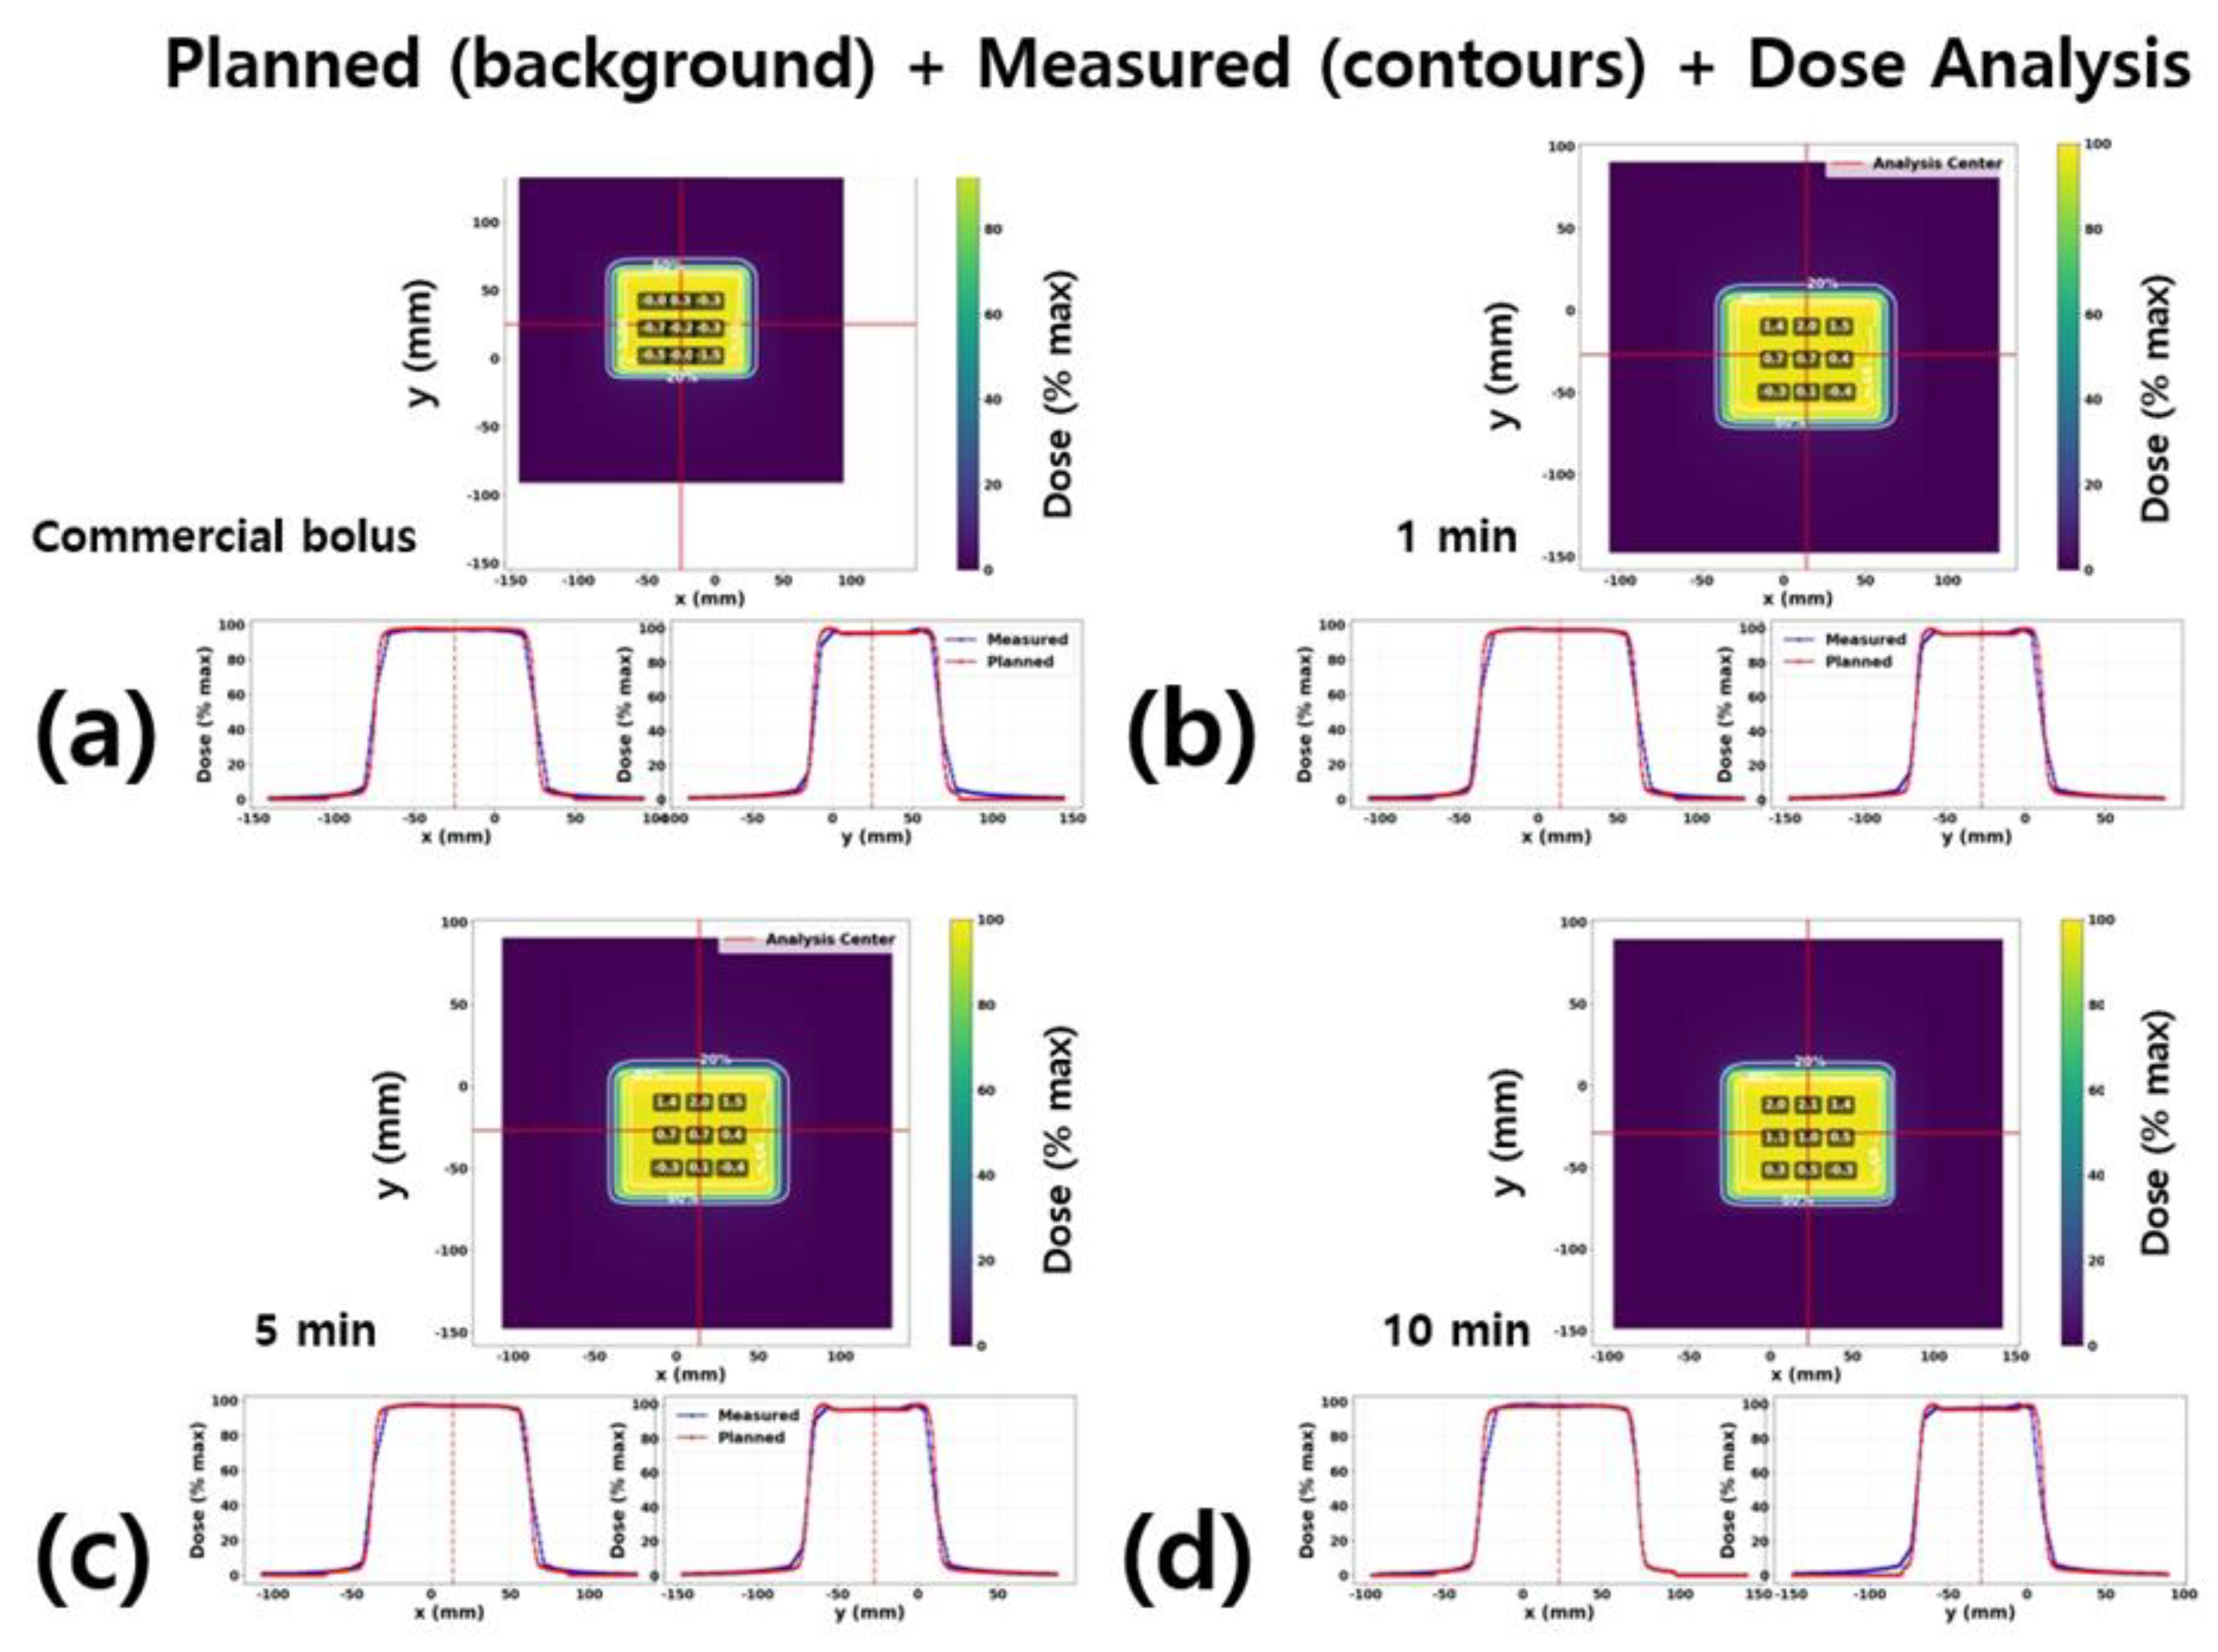
Figure 7.
Dose measurement using EBT3 film on a cylindrical phantom. A commercial bolus and a custom 3D-printed silicone bolus were individually placed on the phantom surface and irradiated under identical beam set-tings (3 × 3 cm² field, 100 MU). The resulting film dose distributions were analyzed to evaluate the surface dose characteristics for each bolus.
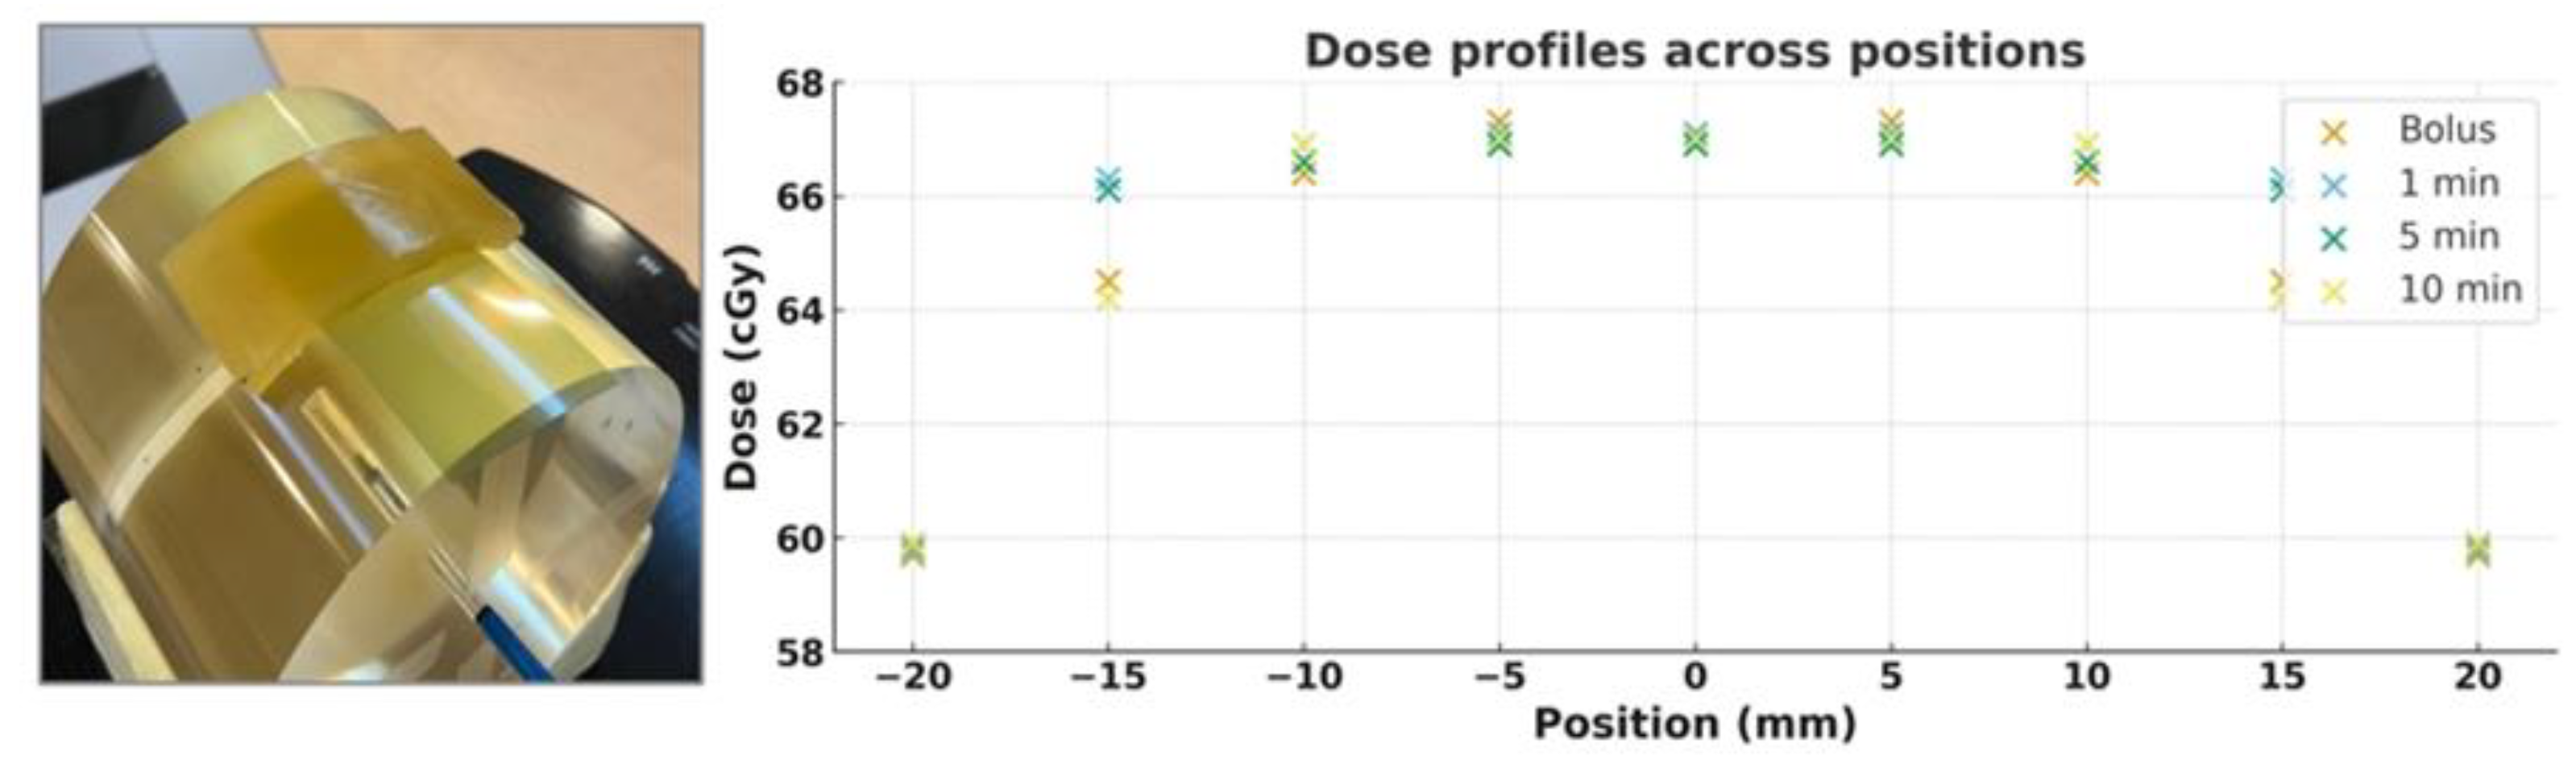
Table 2.
Point-wise dose differences (Measured − Planned, %) for a commercial bolus and custom 3D-printed silicone boluses fabricated with different vacuum degassing times (1, 5, and 10 min). Values are based on 9 points per case (3 × 3 grid within ±20 mm). RMS = √(mean(Δ²)) across the 9 points.
Table 2.
Point-wise dose differences (Measured − Planned, %) for a commercial bolus and custom 3D-printed silicone boluses fabricated with different vacuum degassing times (1, 5, and 10 min). Values are based on 9 points per case (3 × 3 grid within ±20 mm). RMS = √(mean(Δ²)) across the 9 points.
| Case | Mean Δ (%) | Median Δ (%) | SD (%) | Max Δ (%) | Min Δ (%) | RMS Δ (%) | ≤±1% (n/N) | ≤±2% (n/N) |
| Commercial Bolus |
−0.34 | −0.27 | 0.48 | 0.31 | −1.46 | 0.59 | 8/9 | 9/9 |
| 1 min | 0.51 | 0.58 | 0.71 | 1.58 | −0.53 | 0.87 | 7/9 | 9/9 |
| 5 min | 0.67 | 0.65 | 0.78 | 2 | −0.41 | 1.03 | 6/9 | 9/9 |
| 10 min | 0.95 | 1.01 | 0.76 | 2.13 | −0.30 | 1.22 | 4/9 | 7/9 |
Δ (%) = Measured − Planned (positive values indicate measured > planned). SD = standard deviation. RMS = √mean(Δ²) across 9 points. 95% CI for mean differences calculated using Student’s t (df = 8), not tabulated. n/N = number of points satisfying the criterion out of 9 total points.
Disclaimer/Publisher’s Note: The statements, opinions and data contained in all publications are solely those of the individual author(s) and contributor(s) and not of MDPI and/or the editor(s). MDPI and/or the editor(s) disclaim responsibility for any injury to people or property resulting from any ideas, methods, instructions or products referred to in the content. |
© 2025 by the authors. Licensee MDPI, Basel, Switzerland. This article is an open access article distributed under the terms and conditions of the Creative Commons Attribution (CC BY) license (http://creativecommons.org/licenses/by/4.0/).
Copyright: This open access article is published under a Creative Commons CC BY 4.0 license, which permit the free download, distribution, and reuse, provided that the author and preprint are cited in any reuse.


