
Submitted:
17 June 2025
Posted:
19 June 2025
You are already at the latest version
Abstract
Background: This study aimed to assess the cranial morphometric features of patients with idiopathic syringomyelia by conducting comparative analyses with individuals diagnosed with Chiari Type I, Chiari Type I accompanied by syringomyelia, and healthy controls, in order to elucidate the potential structural contributors to the pathogenesis of idiopathic syringomyelia. Methods: In this retrospective and comparative study, a total of 172 patients diagnosed with Chiari Type I and/or syringomyelia between 2016 and 2024, along with 156 radiologically normal individuals, were included. Participants were categorized into four groups: healthy controls, Chiari Type I, Chiari Type I with syringomyelia, and idiopathic syringomyelia (defined as syringomyelia without an identifiable cause). Midline sagittal T1-weighted MR images were used to obtain quantitative measurements of the posterior fossa, cerebellum, intracranial area, and foramen magnum. All measurements were stratified and statistically analyzed by sex. Results: In cases with idiopathic syringomyelia, both the posterior fossa area and the cerebellum/posterior fossa ratio differed significantly from those of healthy controls. In male patients, the foramen magnum diameter was significantly larger in the Chiari + syringomyelia group compared to the idiopathic group. A significant correlation was found between the degree of tonsillar descent and selected morphometric parameters in female subjects, whereas no such correlation was observed in males. Both Chiari groups exhibited significantly smaller posterior fossa dimensions compared to the healthy and idiopathic groups, indicating greater neural crowding. Additionally, a paradoxical decrease in syringomyelia incidence was observed with increasing tonsillar descent in Chiari Type I cases. Conclusions: Anatomical variations such as a reduced posterior fossa area or altered foramen magnum diameter may contribute to the pathogenesis of idiopathic syringomyelia. Cranial morphometric analysis appears to offer diagnostic value in these cases. Further prospective, multicenter studies incorporating advanced neuroimaging modalities, particularly those assessing cerebrospinal fluid dynamics, are warranted to better understand the mechanisms underlying syringomyelia of unknown etiology.
Keywords:
idiopathic syringomyelia
; Chiari Type 0
; Chiari Type I
; posterior fossa
; morphometric analysis
; magnetic resonance imaging
1. Introduction
Syringomyelia is a rare neurological disorder characterized by the formation of fluid-filled cystic cavities (syrinx) within the spinal cord. In the general population, its prevalence is estimated at approximately 8–10 cases per 100,000 individuals [1]. Syringomyelia commonly develops secondary to conditions such as Chiari Type I malformation, spinal trauma, tumors, or infections. However, in some cases, no structural cause can be identified; such instances are classified as “idiopathic syringomyelia.” Etiology-based management strategies are generally more effective than symptomatic treatments and are associated with reduced morbidity and mortality rates, leading to more favorable clinical outcomes [2,3].
Recent studies have highlighted the significance of anatomical parameters—such as posterior fossa volume, cerebellar area, and foramen magnum diameter—in the pathogenesis of Chiari Type I malformation, which typically involves the herniation of the cerebellar tonsils through the foramen magnum [4]. The incidence of syringomyelia in patients with Chiari Type I has been reported to be as high as 50% [5]. However, the fact that syringomyelia does not develop in all Chiari cases suggests the presence of other, yet unidentified, intracranial morphometric determinants.
Cases exhibiting Chiari-like symptoms and syringomyelia in the absence of significant tonsillar descent have been defined as “Chiari Type 0.” In these patients, posterior fossa crowding is thought to play a key role [6]. Nevertheless, the contribution of intracranial morphometric structures in idiopathic syringomyelia remains unclear.
The aim of this study is to evaluate the morphometric features of the posterior fossa and cerebellar structures in individuals with idiopathic syringomyelia who do not exhibit cerebellar tonsil herniation and have no identifiable etiological factor. Additionally, by comparing these individuals with healthy controls and those with Chiari Type I-associated syringomyelia, the study seeks to identify morphometric parameters that may have diagnostic and etiological significance, with a particular focus on their distinction from Chiari Type 0 cases.
2. Materials and Methods
2.1. Study Design and Participants
This retrospective, observational, and comparative study was conducted using patient data from the Department of Neurosurgery at Alanya Alaaddin Keykubat University, between 2016 and 2024. The study group included patients diagnosed with Arnold Chiari malformation and/or syringomyelia, while the control group consisted of individuals with normal brain and spinal MRI findings. Data were retrieved from the institutional hospital information system.
2.2. Inclusion and Exclusion Criteria
Individuals aged between 18 and 60 years with complete and high-quality MRI scans of the brain and spinal cord were included. Chiari Type I diagnosis was based on cerebellar tonsil herniation of ≥5 mm below the foramen magnum [7]. Syringomyelia was diagnosed when a centrally located, cerebrospinal fluid-isointense intramedullary cyst ≥2 mm in diameter was observed on T2-weighted images [1]. The control group consisted of individuals without any pathological findings on brain or spinal imaging.
In idiopathic syringomyelia cases, individuals presenting with brainstem-related symptoms commonly associated with Chiari Type 1 (such as headache, dysphagia, dysarthria, and respiratory disturbances) were excluded from the study in order to rule out the possibility of Chiari Type 0.
Across all groups, the following conditions were defined as exclusion criteria: spinal deformities, spina bifida, tethered cord, history of spinal trauma, infections such as arachnoiditis, severe discopathy, spinal stenosis, multiple sclerosis or other neurodegenerative diseases, hydrocephalus, prior spinal surgery, craniovertebral junction anomalies, intramedullary tumors, intracranial mass lesions, pathologies associated with altered intracranial pressure (e.g., pseudotumor cerebri), endocrine or metabolic disorders affecting CSF circulation, presence of severe systemic disease, metallic implants or devices that may cause artifacts during MRI, and inadequate image quality [8,9].
2.3. Data Collection and Imaging Parameters
All subjects underwent analysis of mid-sagittal T1-weighted brain MRI, the standard imaging modality for assessing Chiari malformations [4,11,12]. Scans were acquired on a 1.5 Tesla Siemens Magnetom Altea scanner (Erlangen, Germany). Morphometric measurements were obtained from the largest sagittal slice of each structure, including the foramen magnum, tonsillar herniation, cerebellum, posterior fossa, and intracranial area.
Imaging Parameters:
- T1-weighted: TR 250 ms, TE 4.76 ms
- T2-weighted: TR 3000–4000 ms, TE 100–120 ms
- Slice thickness: 3 mm, Inter-slice gap: 0.5 mm
- Field of view: 230–280 mm
- Matrix: 205×256 (T1) and 320×320 (T2)
All images were manually reviewed and evaluated by board-certified neurosurgeons using Sectra IDS7 Workstation (Edition 24.2.16.6066, 2023).
Morphometric Parameters Measured:
- Diameter of the foramen magnum
- Degree of tonsillar descent (for Groups 2 and 3)
- Area and perimeter of the posterior fossa
- Area and perimeter of the cerebellum
- Area and perimeter of the intracranial cavity
- Ratios: cerebellum/posterior fossa, posterior fossa/intracranial area, cerebellum/intracranial area (Figure 1)
In syringomyelia cases, lesion location (cervical, thoracic, etc.), size, and longitudinal extent were recorded in three planes. Contrast-enhanced MRI was performed in selected cases to rule out accompanying pathologies.
2.4. Group Classification
- Group 1 (Control): Healthy individuals with no pathological findings on brain or spinal MRI
- Group 2 (Chiari): Patients with ≥5 mm cerebellar tonsil herniation
- Group 3 (Chiari + Syringomyelia): Patients with both tonsillar herniation and syringomyelia
- Group 4 (Idiopathic Syringomyelia): Patients who met criteria for idiopathic syringomyelia
2.5. Statistical Analysis
All statistical analyses were performed using R statistical software. The Kolmogorov-Smirnov test was used to assess normality. For normally distributed continuous variables, one-way ANOVA was applied, while the Kruskal-Wallis test was used for non-normally distributed variables. Post hoc analyses were performed using Bonferroni correction or the Mann-Whitney U test for multiple comparisons.
Spearman’s correlation coefficient was used to examine associations between tonsillar descent and morphometric parameters. Given known anatomical volume differences between sexes, all morphometric comparisons were stratified by gender and supplemented with descriptive statistics.
3. Results
3.1. Participants
A total of 328 individuals were included in the study: 156 healthy controls (Group 1), consisting of 93 females (59%) and 63 males (41%); 79 patients with Chiari Type I (Group 2), including 54 females (68%) and 25 males (32%); 39 patients with Chiari + syringomyelia (Group 3), including 25 females (64%) and 14 males (36%); and 54 patients with idiopathic syringomyelia (Group 4), including 30 females (55%) and 24 males (45%).
Mean ages of male participants were:
- Group 1: 36.83 years (range: 18–60),
- Group 2: 34.08 years (19–60),
- Group 3: 42.36 years (24–60),
- Group 4: 41.08 years (18–60).
Mean ages of female participants were:
- Group 1: 37.97 years (range: 18–60),
- Group 2: 38.74 years (18–60),
- Group 3: 42.84 years (23–60),
- Group 4: 34.57 years (18–60) (Figure 2).
3.2. Morphometric Analysis in Female Participants
No statistically significant differences were found among groups in terms of foramen magnum diameter, intracranial area, or its perimeter (p > 0.05). The posterior fossa perimeter was significantly higher in Group 1 compared to Groups 2, 3, and 4 (p < 0.001). The cerebellar perimeter was significantly larger in Groups 2 and 3 compared to Group 4 (p < 0.001) (Figure 3). Posterior fossa area was significantly larger in Groups 1, 2, and 3 compared to Group 4 (p < 0.05), and Group 3 had a significantly larger posterior fossa area than Group 2 (p < 0.05). Cerebellum area was significantly greater in Groups 2 and 3 than in Groups 1 and 4 (p < 0.05) (Figure 4).
Ratio analyses revealed:
- Posterior fossa/intracranial area ratio was higher in Group 1 than in Groups 2 and 3; and higher in Group 3 than Group 2 (p < 0.05).
- Cerebellum/posterior fossa ratio was significantly higher in Groups 2 and 3 compared to Group 1 (p < 0.05).
3.3. Morphometric Analysis in Male Participants
No significant differences were observed in intracranial area and perimeter parameters among groups. The foramen magnum diameter was significantly larger in Group 3 compared to Group 4 (p < 0.05). The cerebellar perimeter was significantly greater in Group 3 compared to Groups 1 and 4 (p < 0.05) (Figure 6). Regarding cerebellum area, Group 2 showed significantly larger values than Groups 1 and 4; Group 3 was significantly larger than Group 1 (p < 0.05). Posterior fossa perimeter and area were significantly higher in Group 1 than all other groups (p < 0.05) (Figure 7).
Further ratio analysis showed:
- Cerebellum/posterior fossa ratio was lowest in Group 1 and significantly higher in Groups 2 and 3 (p < 0.05).
- Posterior fossa/intracranial area ratio was significantly higher in Group 1 than all other groups; and in Group 4 compared to Group 2 (p < 0.05).
3.4. Tonsillar Herniation and Correlation Analysis
In both sexes, Group 2 showed significantly more tonsillar herniation than Group 3 (p < 0.05) (Figure 9). In female participants, a weak but significant positive correlation was found between tonsillar descent and both cerebellar perimeter (r = 0.372, p = 0.001) and cerebellum/posterior fossa ratio (r = 0.359, p = 0.001). No significant correlation was observed in male participants.
3.5. Syrinx Location and Distribution
In Group 3 (Chiari + syringomyelia), syrinx localization was as follows: 2 bulbar, 17 cervical, 9 cervicothoracic, 4 thoracic, 1 thoracolumbar, and 2 cervicothoracolumbar.
In Group 4 (idiopathic syringomyelia), 30 cervical, 9 cervicothoracic, 10 thoracic, and 3 thoracolumbar localizations were observed. No statistically significant difference in syrinx distribution was found between Group 3 and Group 4.
4. Discussion
Etiologically, approximately 50–70% of syringomyelia cases are associated with Chiari Type I malformation, 10–15% with spinal trauma, 5–10% with intramedullary tumors, and 2–5% with infections or arachnoiditis. The remaining 10–15% are considered idiopathic, with no identifiable structural pathology [12,13]. Targeted treatment addressing the underlying cause is more effective in reducing morbidity and mortality compared to symptomatic management, leading to better clinical outcomes and lower recurrence rates [2,3]. This study aimed to investigate the etiopathogenesis of idiopathic syringomyelia by evaluating morphometric parameters.
Chiari Type I malformation is the most frequently observed cause of syringomyelia. It is defined by a ≥5 mm descent of the cerebellar tonsils through the foramen magnum due to underdevelopment of the posterior fossa. This finding has high sensitivity and specificity when evaluated via MRI [4]. However, several studies report that tonsillar herniation alone is not sufficient for diagnosis and that posterior fossa morphometry is a more critical determinant [14]. The exact morphometric basis for why only a subset of Chiari cases develop syringomyelia remains unclear.
With the recognition of Chiari Type 0, it has become evident that syringomyelia and Chiari-like symptoms can occur even without tonsillar descent. In such cases, anatomical crowding and impaired CSF flow may independently drive pathogenesis [15], suggesting that intracranial morphometric differences could play a significant role in syringomyelia development.
Intracranial structures undergo volumetric changes due to growth, degeneration, and aging. Previous studies suggest that measurements remain stable between the ages of 18 and 60, which defined our inclusion criteria [16,17].
It is well-established that healthy males tend to have larger posterior fossa, cerebellar, and intracranial volumes, as well as a greater foramen magnum diameter, compared to females [18,19]. Accordingly, gender-based stratification is essential in morphometric assessments. The predominance of females in both our Chiari and syringomyelia groups aligns with prior studies showing higher prevalence among women. The significant correlations found in females in our study are consistent with previous research indicating that smaller posterior fossa volumes and foramen magnum diameters in women may increase susceptibility to Chiari I and syringomyelia [20,21,22].
No significant differences were found between males and females in terms of intracranial area and perimeter, suggesting balanced group distributions and appropriate comparability.
Interestingly, in idiopathic syringomyelia cases—where classical Chiari Type I features (i.e., ≥5 mm tonsillar descent) were absent—significant differences in posterior fossa and cerebellar areas were still observed. This implies that cranial morphometry may still be relevant even in the absence of tonsillar herniation.
In female participants, posterior fossa area and perimeter were significantly greater in healthy controls than in any of the pathological groups. This aligns with literature suggesting a developmentally smaller posterior fossa in Chiari patients [2,15]. The larger cerebellar area and perimeter in Groups 2 and 3 compared to Group 4 may indicate that tonsillar descent is a response to posterior fossa crowding [5]. Studies of CM0 cases have similarly shown that posterior fossa crowding, obex positioning, and cervical canal morphometry can be key diagnostic indicators [14,22], supporting our findings of morphometric changes in idiopathic cases even without tonsillar descent. Moreover, the inverse relationship between the degree of tonsillar herniation and syringomyelia occurrence (Group 2 > Group 3) suggests that hydrodynamic factors may also be involved.
Elevated cerebellum/posterior fossa and cerebellum/intracranial area ratios in both idiopathic and Chiari groups may reflect cerebellar crowding in a compact posterior fossa and could serve as potential diagnostic markers [23]. However, these ratios were lower in the idiopathic group than in the Chiari group, suggesting that cerebellar compression may be less pronounced in idiopathic cases [24].
In male participants, findings largely mirrored those in females; Group 1 had significantly greater posterior fossa dimensions than all other groups. However, differences in cerebellar area and ratios were more limited, possibly indicating greater compensatory volume capacity in males [16]. The significantly larger foramen magnum diameter in Group 3 compared to Group 4 may reflect an adaptive or associated anatomical change in Chiari + syringomyelia cases [25].
Regarding tonsillar herniation and correlation analyses, weak but statistically significant associations were observed in females between tonsillar descent and both cerebellar perimeter and cerebellum/posterior fossa ratio. No similar relationships were noted in males, possibly due to gender-based differences in cranial volume and structure [26].
Syrinx distribution analysis showed that the majority of Group 3 lesions were located in the cervical spine, consistent with literature highlighting the impact of Chiari Type I on cervical CSF flow [27]. Similarly, idiopathic syringomyelia cases most frequently exhibited cervical localization, indicating that upper spinal segments may be particularly vulnerable even in the absence of Chiari malformation. However, there is no consensus in the literature—some studies report thoracic dominance [18], while others support cervical predominance [28]. These discrepancies may reflect differences in patient populations, diagnostic criteria, imaging techniques, or classification schemes.
The findings of our study suggest that posterior fossa morphometry is relevant not only in Chiari Type I, but also in idiopathic syringomyelia where tonsillar descent is absent. Saygı et al. reported that posterior fossa narrowing is more pronounced in Chiari Type I patients with syringomyelia and that cervical spinal canal narrowing at C1–C4 and C1–C7 levels may also be contributory. They further proposed that both morphometric measurements and structural configurations must be considered [29]. In our study, no significant difference was observed between Chiari and idiopathic groups in terms of posterior fossa area, suggesting that posterior fossa anatomy plays a fundamental role in the pathophysiology of syringomyelia.
5. Conclusions
This study demonstrates that focusing solely on tonsillar herniation in patients with Chiari Type I and syringomyelia may be insufficient, and that structural parameters such as posterior fossa and cerebellar volume play a significant role in diagnosis and treatment planning. Notably, individuals without tonsillar descent but with syringomyelia exhibited significant cranial morphometric differences, indicating that these measurements may serve as potential biomarkers in differential diagnosis.
Measurements of posterior fossa area, cerebellar dimensions, and their ratios provide valuable insights into the structural background of syringomyelia. Furthermore, consideration of gender-based anatomical differences is essential for a personalized approach.
Limitations of this study include its retrospective design, possible measurement biases due to imaging quality, and small subgroup sample sizes. Future prospective, multicenter studies with larger cohorts and advanced cerebrospinal fluid flow analyses are needed to better differentiate between Chiari Type 0 and idiopathic syringomyelia. Additionally, the integration of 3D volumetric analysis techniques may improve the accuracy of morphometric evaluations.
In conclusion, detailed assessment of cranial morphometric structures may serve as a valuable clinical tool for diagnosis, prognosis, and treatment planning in syringomyelia.
Supplementary Materials
The following supporting information can be downloaded at: https://www.mdpi.com/article/doi/s1, Figure S1: title; Table S1: title; Video S1: title.
Author Contributions
For research articles with several authors, a short paragraph specifying their individual contributions must be provided. The following statements should be used “Conceptualization, B.Ö. and H.Ö.; methodology, B.Ö.; software, B.Ö. and H.Ö.; validation, B.Ö. and H.Ö.; formal analysis, B.Ö.; investigation, B.Ö.; resources, B.Ö. and H.Ö.; data curation, B.Ö. and H.Ö.; writing—original draft preparation, B.Ö. and H.Ö.; writing—review and editing, B.Ö.; visualization, B.Ö. and H.Ö.; supervision, B.Ö.; project administration, B.Ö.; funding acquisition, B.Ö. All authors have read and agreed to the published version of the manuscript.” Please turn to the CRediT taxonomy for the term explanation. Authorship must be limited to those who have contributed substantially to the work reported.
Funding
This research received no external funding. The APC was funded by B.Ö.
Institutional Review Board Statement
The study was conducted in accordance with the Declaration of Helsinki and was approved by the Ethics Committee of Alanya Alaaddin Keykubat University (approval number: 09-07, date of approval: 21 May 2025).
Informed Consent Statement
Informed consent was obtained from all subjects involved in the study.
Data Availability Statement
The data that support the findings of this study are available from the corresponding author upon reasonable request. Due to ethical and privacy restrictions, the data are not publicly available.
Acknowledgments
The authors would like to thank the radiology and neurosurgery departments of Alanya Alaaddin Keykubat University for their support during the imaging and data collection processes.
Conflicts of Interest
The authors declare no conflicts of interest.
Abbreviations
The following abbreviations are used in this manuscript:
| Fossa | Posterior Fossa Area |
| Int. Cr. | İntracranial area |
References
- Toh, CH.; Wong, AM-C.; Ng, SH.; Cheung, Y-C.; Wai, YY.; Ng, KK. Syringomyelia: MR Imaging Features and Correlation with Etiology and Clinical Presentation. AJNR Am J Neuroradiol. 2010, 31(5), 912–919. [CrossRef]
- Klekamp, J. Treatment of syringomyelia. Handb Clin Neurol. 2018, 155, 195-215. [CrossRef]
- Flint, G. Syringomyelia: diagnosis and management. Practical neurology 2021, 21(5), 403-411. [CrossRef]
- Costa, F.; Ait Benali, S.; Dantas, F.; Restelli, F.; Mazzapicchi, E.; Baeesa, S.; Yaman, O.; Sharif, S.; Alves, O.L.; Zileli, M.; Botelho, R. Chiari Malformation: Diagnosis, Classifications, Natural History, and Conservative Management. World Federation of Neurosurgical Societies Spine Committee Recommendations. Spine. 2025,50(11), 767-778. [CrossRef]
- Tubbs, R.S.; Oakes WJ. Chiari I malformations and syringomyelia. Semin Pediatr Neurol. 2005, 12(3), 176–181. [CrossRef]
- Tubbs, R.S.; Elton, S.; Grabb, P.; Dockery, D.; Bartolucci, A.A.; Oakes, W.J.; Analysis of the posterior fossa in children with the Chiari 0 malformation. J Neurosurg. 2004, 100(5 Suppl Pediatrics), 445–450. [CrossRef]
- Kular, S.; Cascella, M. Chiari Malformation Type 1. [Updated 2024 Feb 9]. In: StatPearls [Internet]. Treasure Island (FL): StatPearls Publishing; 2025 Jan-. Available from: https://www.ncbi.nlm.nih.gov/books/NBK554609/.
- Munakomi, S.; Sampath, R. Syringomyelia. In: StatPearls [Internet]. Treasure Island (FL): StatPearls Publishing; 2024 Jan–. Available from: https://www.ncbi.nlm.nih.gov/books/NBK537110/.
- Cleveland Clinic. Syringomyelia: What It Is, Symptoms, Causes & Treatment. Cleveland Clinic. 2024. Available from: https://my.clevelandclinic.org/health/diseases/6126-syringomyelia.
- Sharawat, I.K.; Panda, P.K.; Dawman, L.; Panda, P. MRI Insights in Chiari Malformation Type 1 and Variations With Hydrosyringomyelia. Cureus. 2023, 15(3), e35891. [CrossRef]
- Meziani, S.; Handis, C.; Felissi, Y.; Bouchekoura, H.; Morsli, A.; Diagnosis and surgical management of Chiari malformation type I. SVOA Neurology. 2023, 4(5), 134-142. [CrossRef]
- Heiss, J.D.; Patronas, N.; DeVroom, H.L.; Shawker, T.; Ennis, R.; Kammerer, W.; Eghbal, R.; Oldfield, E.H. Elucidating the pathophysiology of syringomyelia. J Neurosurg. 1999, 91(4), 553–562. [CrossRef]
- Milhorat, T. H.; Chou, M. W.; Trinidad, E. M.; Kula, R. W.; Mandell, M.; Wolpert, C.; Speer, M. C. Chiari I Malformation Redefined: Clinical and Radiographic Findings for 364 Symptomatic Patients. Neurosurgery 1999, 44(5), 1005–1017. [CrossRef]
- Bogdanov, E. I.; Faizutdinova, A. T.; Heiss, J. D. Posterior Cranial Fossa and Cervical Spine Morphometric Abnormalities in Symptomatic Chiari Type 0 and Chiari Type 1 Malformation Patients with and without Syringomyelia. Acta Neurochir. 2021, 163, 3051–3064. [CrossRef]
- Tubbs, R. S.; Elton, S.; Grabb, P.; Dockery, D.; Bartolucci, A. A.; Oakes, W. J. Analysis of the Posterior Fossa in Children with the Chiari 0 Malformation. J. Neurosurg. 2004, 100(5 Suppl Pediatrics), 445–450. [CrossRef]
- Giedd, J. N.; Blumenthal, J.; Jeffries, N. O.; Castellanos, F. X.; Liu, H.; Zijdenbos, A.; Paus, T.; Evans, A. C.; Rapoport, J. L. Brain Development during Childhood and Adolescence: A Longitudinal MRI Study. Nat. Neurosci. 1999, 2(10), 861–863. [CrossRef]
- Sowell, E. R.; Thompson, P. M.; Holmes, C. J.; Jernigan, T. L.; Toga, A. W. Mapping Cortical Change across the Human Life Span. Nat. Neurosci. 2003, 6(3), 309–315. [CrossRef]
- Tubbs, R. S.; Elton, S.; Grabb, P. A.; Dockery, S. E.; Bartolucci, A. A.; Oakes, W. J. Analysis of the Posterior Fossa in Children with the Chiari 0 Malformation. J. Neurosurg. Pediatr. 2011, 7(1), 30–36. [CrossRef]
- Uysal, S.; Dursun, N.; Aydin, O. A Rare Cause of Sudden Death: Chiari Malformation Type 1 Associated with Syringomyelia. J Forensic Sci Med. 2016, 2(3), 126-129.
- Öktem, H.; Dilli, A.; Kürkçüoğlu, A.; Soysal, H.; Yazıcı, C.; Pelin, C. Prevalence of Chiari Type I Malformation on Cervical Magnetic Resonance Imaging: A Retrospective Study. Anatomy 2016, 10(1), 40–45.
- Houston, J. R.; Mueller, D. M.; Bapuraj, J. R.; et al. Gender-Specific Differences in Adult Type I Chiari Malformation Morphometrics. Neurology 2016, 86(16 Suppl), Abstract P4.174. Abstract available from: https://www.researchgate.net/publication/313043183.
- Bogdanov, E. I.; Faizutdinova, A. T.; Heiss, J. D. The Small Posterior Cranial Fossa Syndrome and Chiari Malformation Type 0. J. Clin. Med. 2022, 11(18), 5472. [CrossRef]
- Allen, P. A.; O'Connell, M. A.; Kiernan, C.; McGinnity, T. M.; O'Keeffe, F. Intracranial Morphology in Chiari I Malformation: A Volumetric MRI Study. Neurosurg. Rev. 2012, 35(2), 235–242.
- Tubbs, R. S.; McGirt, M. J.; Oakes, W. J. Chiari 0 Malformation: An Explanation of Syringomyelia without Tonsillar Descent. Child’s Nerv. Syst. 2004, 20(7), 440–443. [CrossRef]
- Nishikawa, M.; Sakamoto, H.; Hakuba, A.; Nakanishi, N.; Inoue, Y. Morphometric Analysis of the Posterior Fossa in Patients with Chiari Malformation. Neurosurgery 1997, 40(3), 555–561. [CrossRef]
- Kennedy, D. N.; O'Craven, K. M.; Ticho, B. S.; Goldstein, A. M.; Makris, N.; Henson, J. W.; Caviness, V. S.; Harris, G. J. Gender Differences in Regional Cerebral Volume: A Quantitative MRI Study. Cereb. Cortex 1999, 9(6), 617–629. [CrossRef]
- Heiss, J. D.; Suffredini, G.; Bakhtian, K. D.; Sarntinoranont, M.; Oldfield, E. H. Spinal Cord Syrinx Extent in Patients with Chiari I Malformation: Association with Symptom Severity. J. Neurosurg. Spine 2010, 13(6), 577–582. [CrossRef]
- Oh, C. H.; Lee, M. S.; Kim, Y. J.; Yoon, S. H.; Park, H. C.; Park, C. O. Increased Detection Rate of Syringomyelia by Whole Spine Sagittal Magnetic Resonance Images: Based on the Data from Military Conscription of Korean Young Males. J. Korean Soc. Radiol. 2012, 67(3), 149–156. [CrossRef]
- Saygı, T.; Kayhan, A.; Demirel, N. Morphometric Analysis of the Posterior Fossa and Cervical Spinal Canal in Type 1 Chiari Malformation and Its Effects on Syringomyelia Development. Istanbul Med. J. 2024, 25(3), 207–213. [CrossRef]
Figure 1.
Representative mid-sagittal T1-weighted brain MRI demonstrating cranial morphometric measurements used in the study. Traced regions include the intracranial area (red), posterior fossa (yellow), and cerebellum (blue). Quantitative measurements include area and perimeter of each region, foramen magnum diameter (white ), and degree of cerebellar tonsillar descent (black).
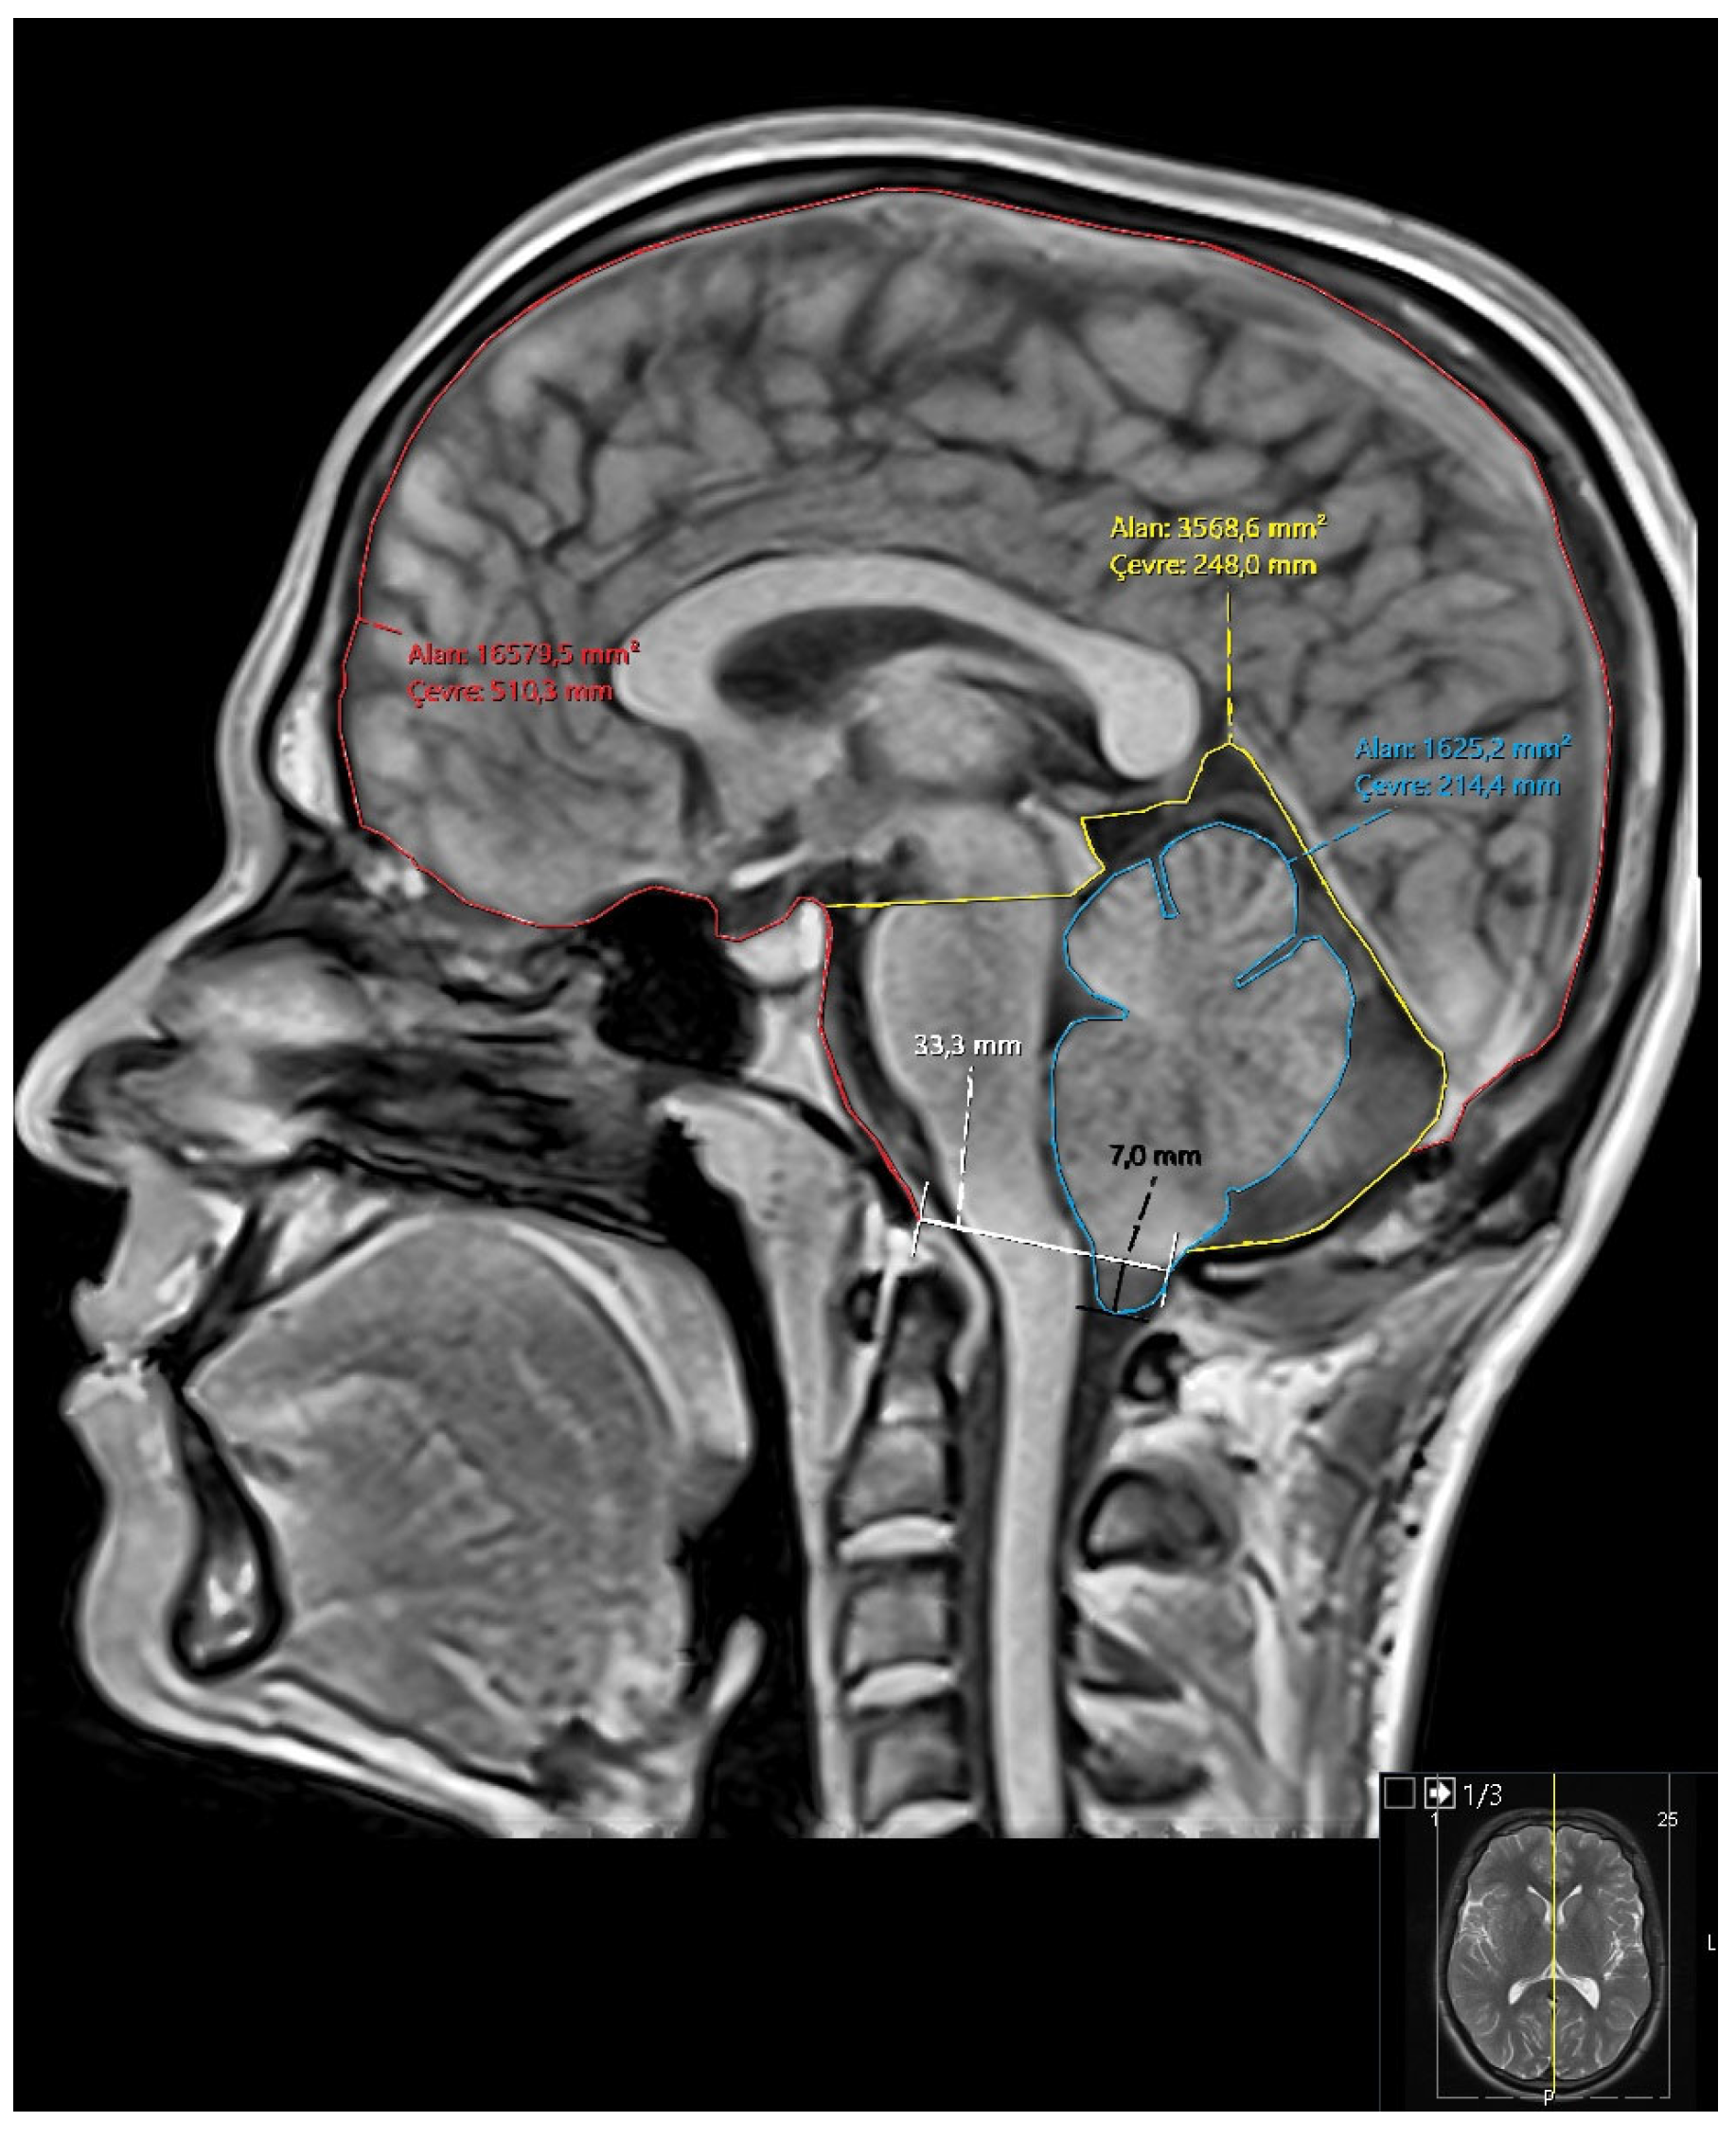
Figure 2.
Mean age by sex across four participant groups. Blue bars represent male participants, and red bars represent female participants. Sample sizes (n) are indicated above each bar. While mean ages are generally similar between sexes within each group, Group 3 displays the highest mean age values for both males and females.
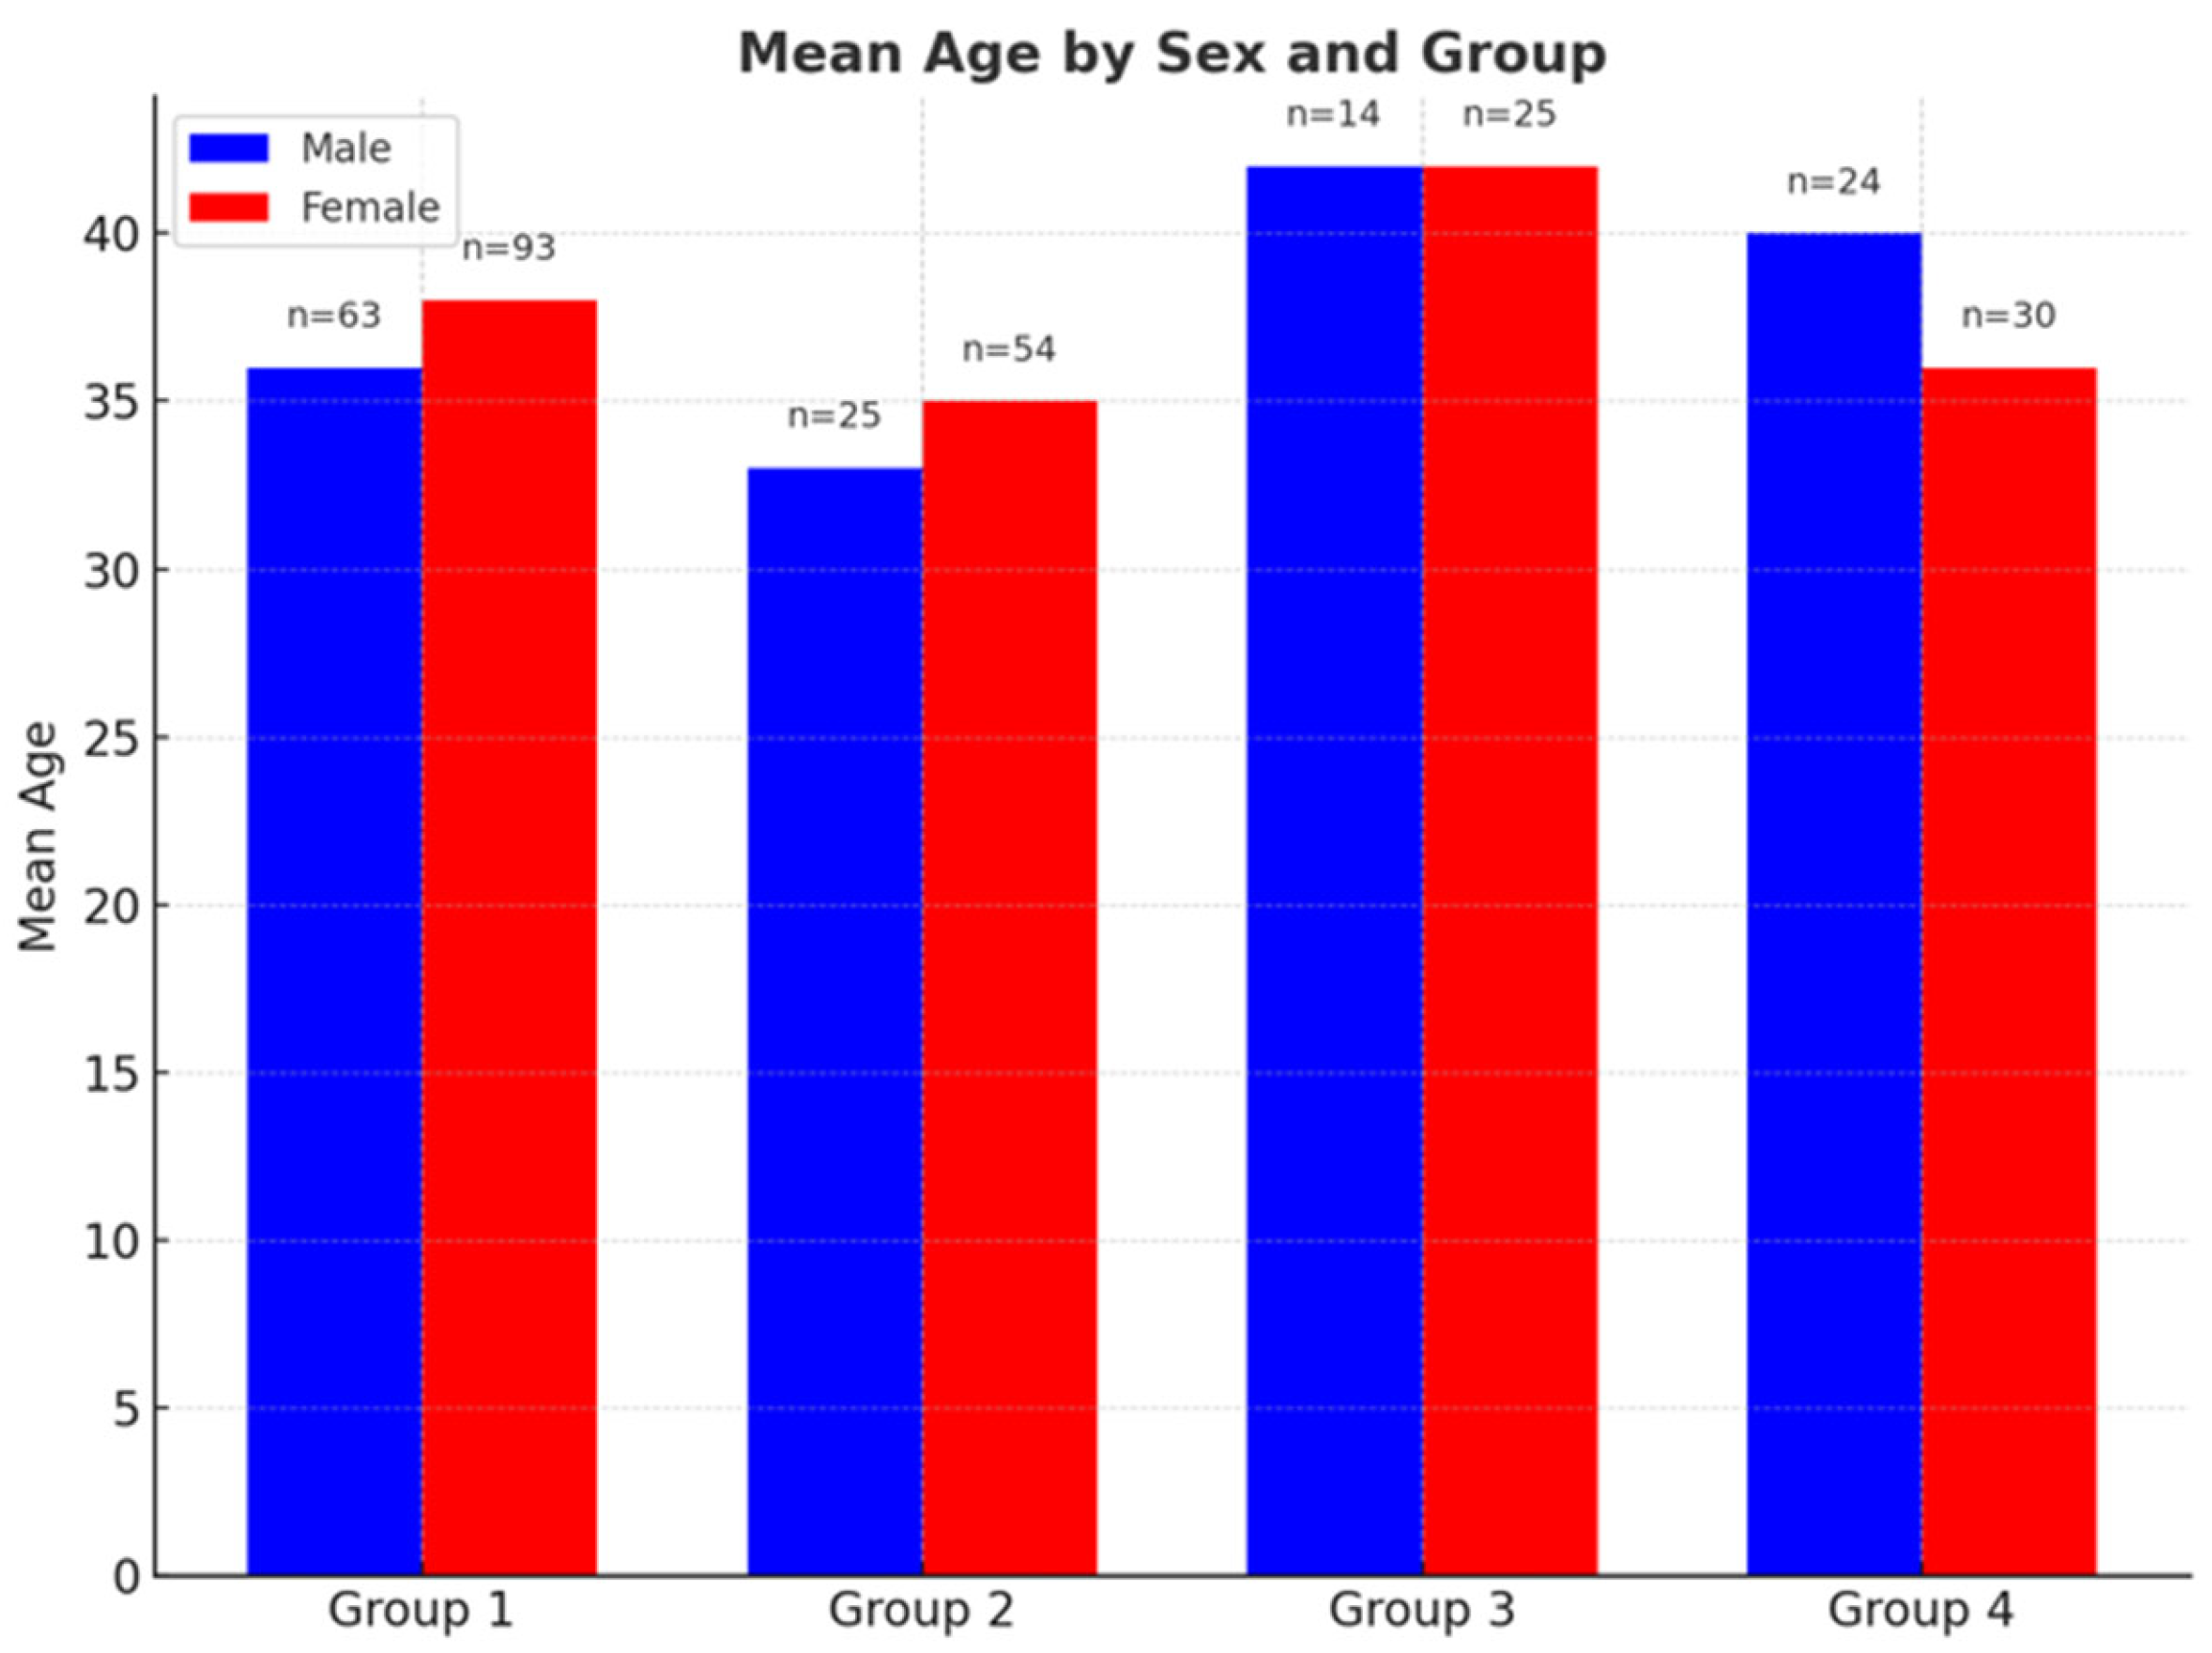
Figure 3.
Mean values of cerebellum perimeter and posterior fossa perimeter in four female subgroups: Healthy, Chiari, Chiari with syringomyelia, and Idiopatic Syringomyelia. Posterior fossa perimeter was highest in the Healthy group, whereas cerebellum perimeter was greater in the Chiari and Chiari + Syringomyelia groups.
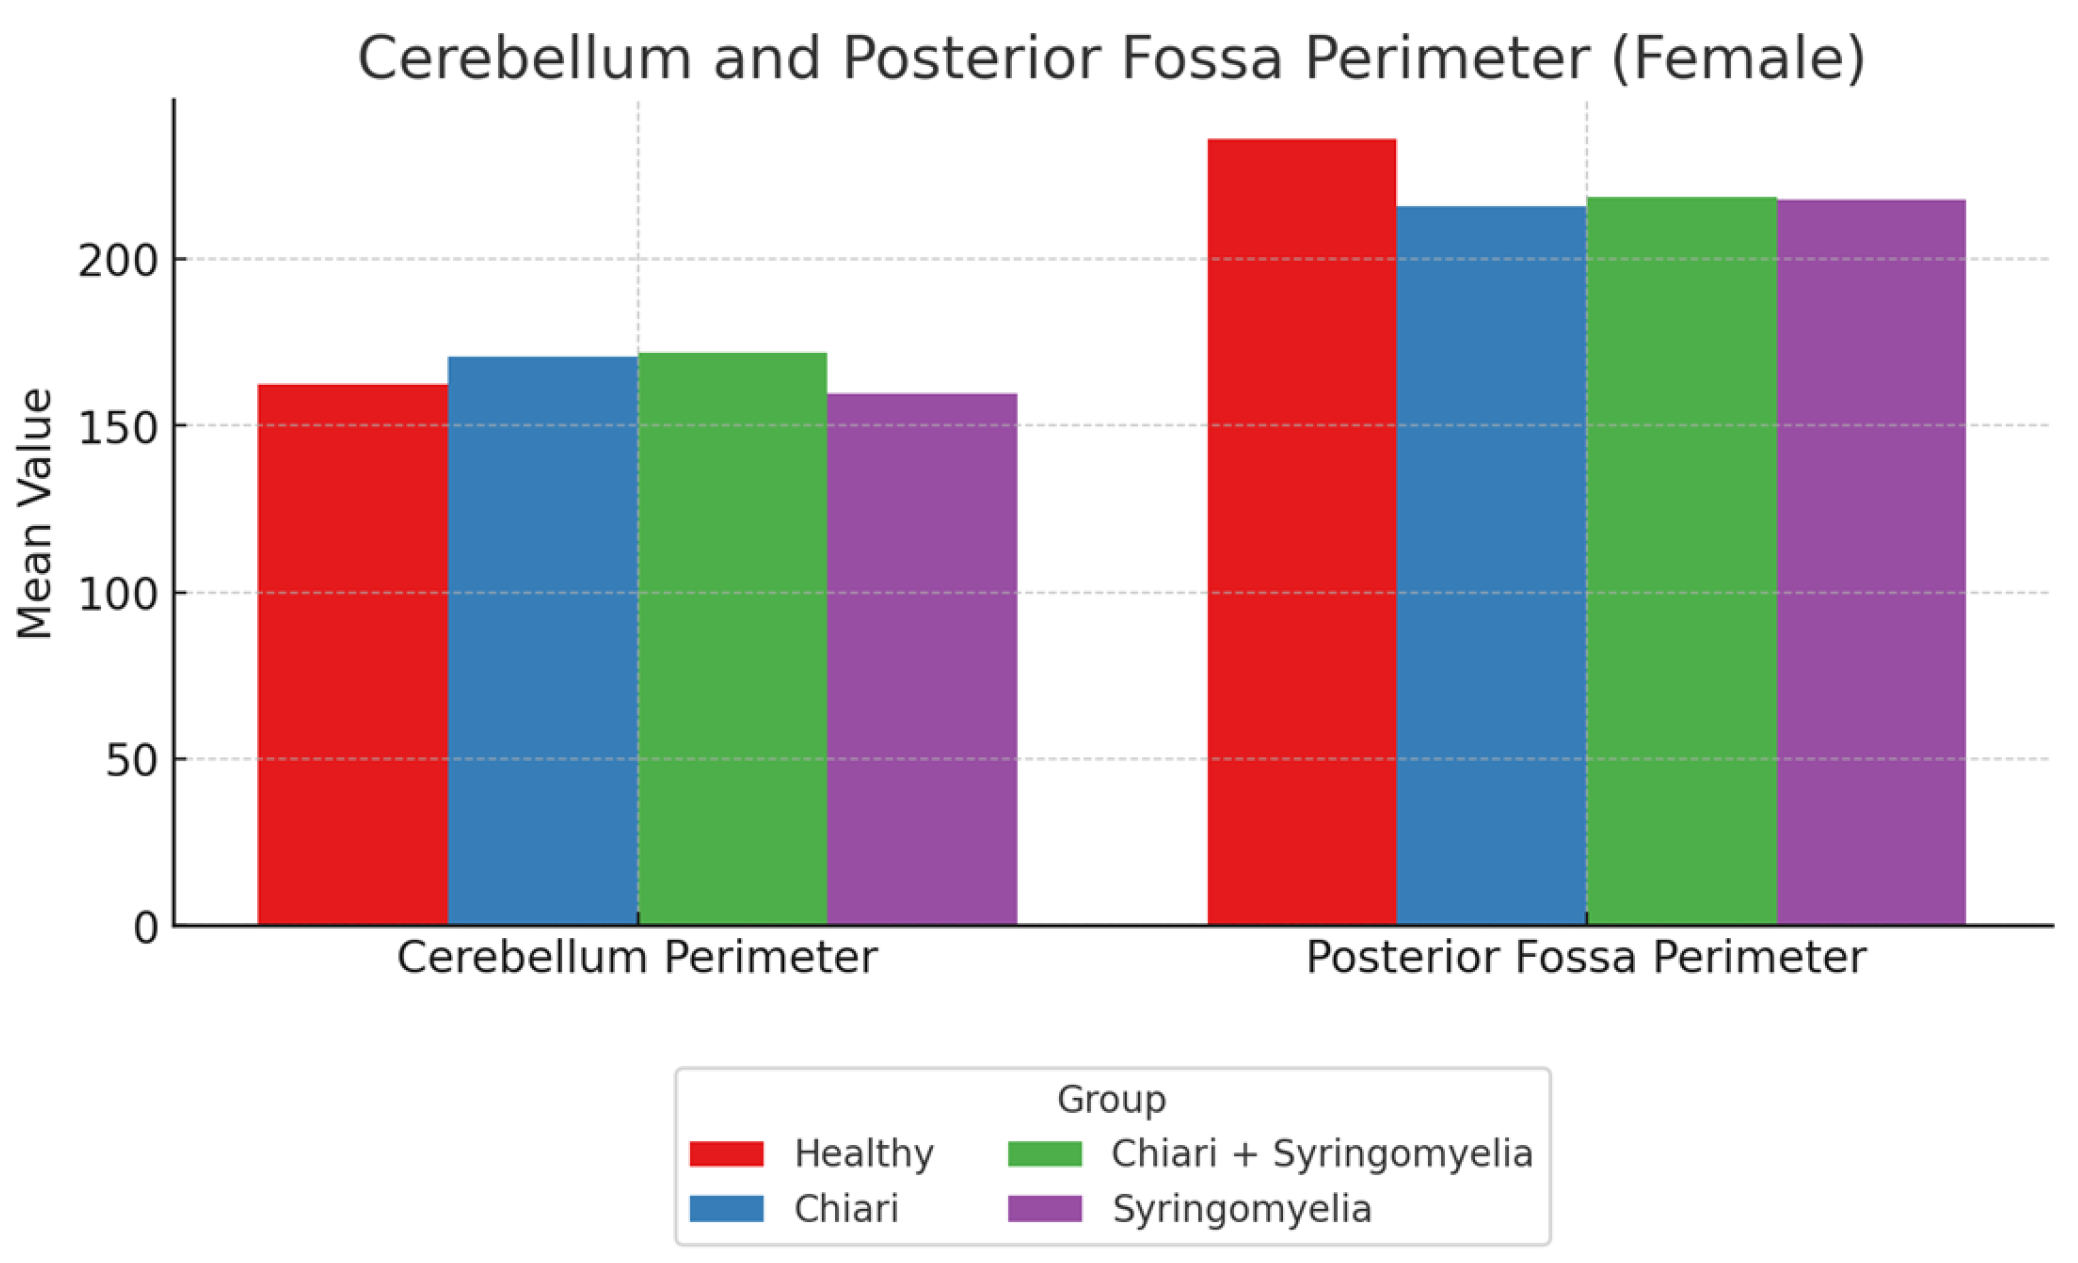
Figure 4.
Comparison of cerebellum area and posterior fossa area measurements across four female subgroups: Healthy, Chiari, Chiari with syringomyelia, and Idiopatic Syringomyelia. Data represent mean values. The Chiari + Syringomyelia group showed the highest posterior fossa area, while cerebellum area varied less across groups.
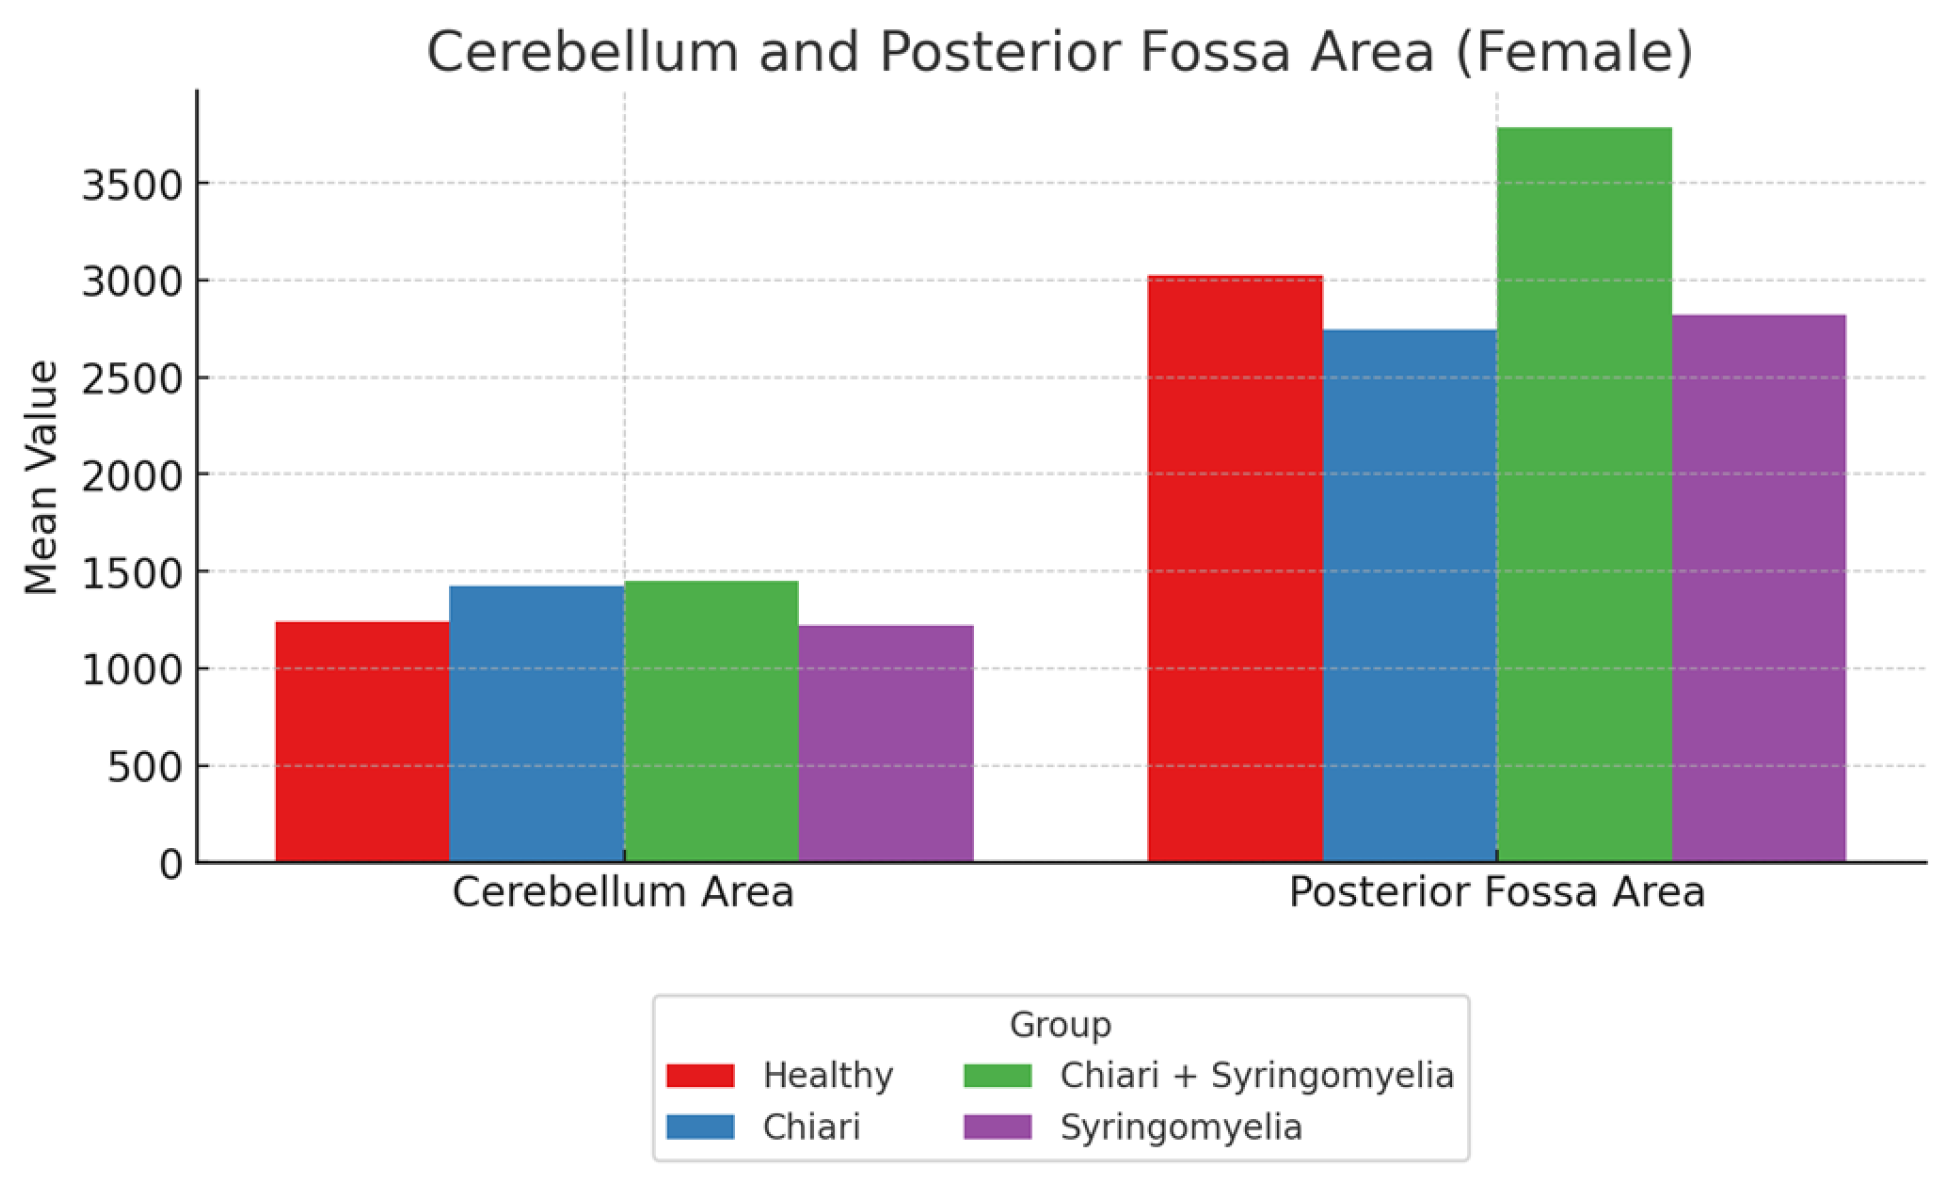
Figure 5.
Comparison of ratio-based morphometric values among female subgroups: Healthy, Chiari, Chiari with syringomyelia, and Idiopatic Syringomyelia. The graph illustrates three key ratios: Cerebellum/Brain, Cerebellum/Fossa, and Fossa/Brain. The Chiari group showed the highest Cerebellum/Fossa ratio, while Cerebellum/Brain ratio peaked in the Chiari + Syringomyelia group. Cerebellum:Cerebellum area, Int.Cr.:Intracranial area, Fossa: Posterior fossa area.
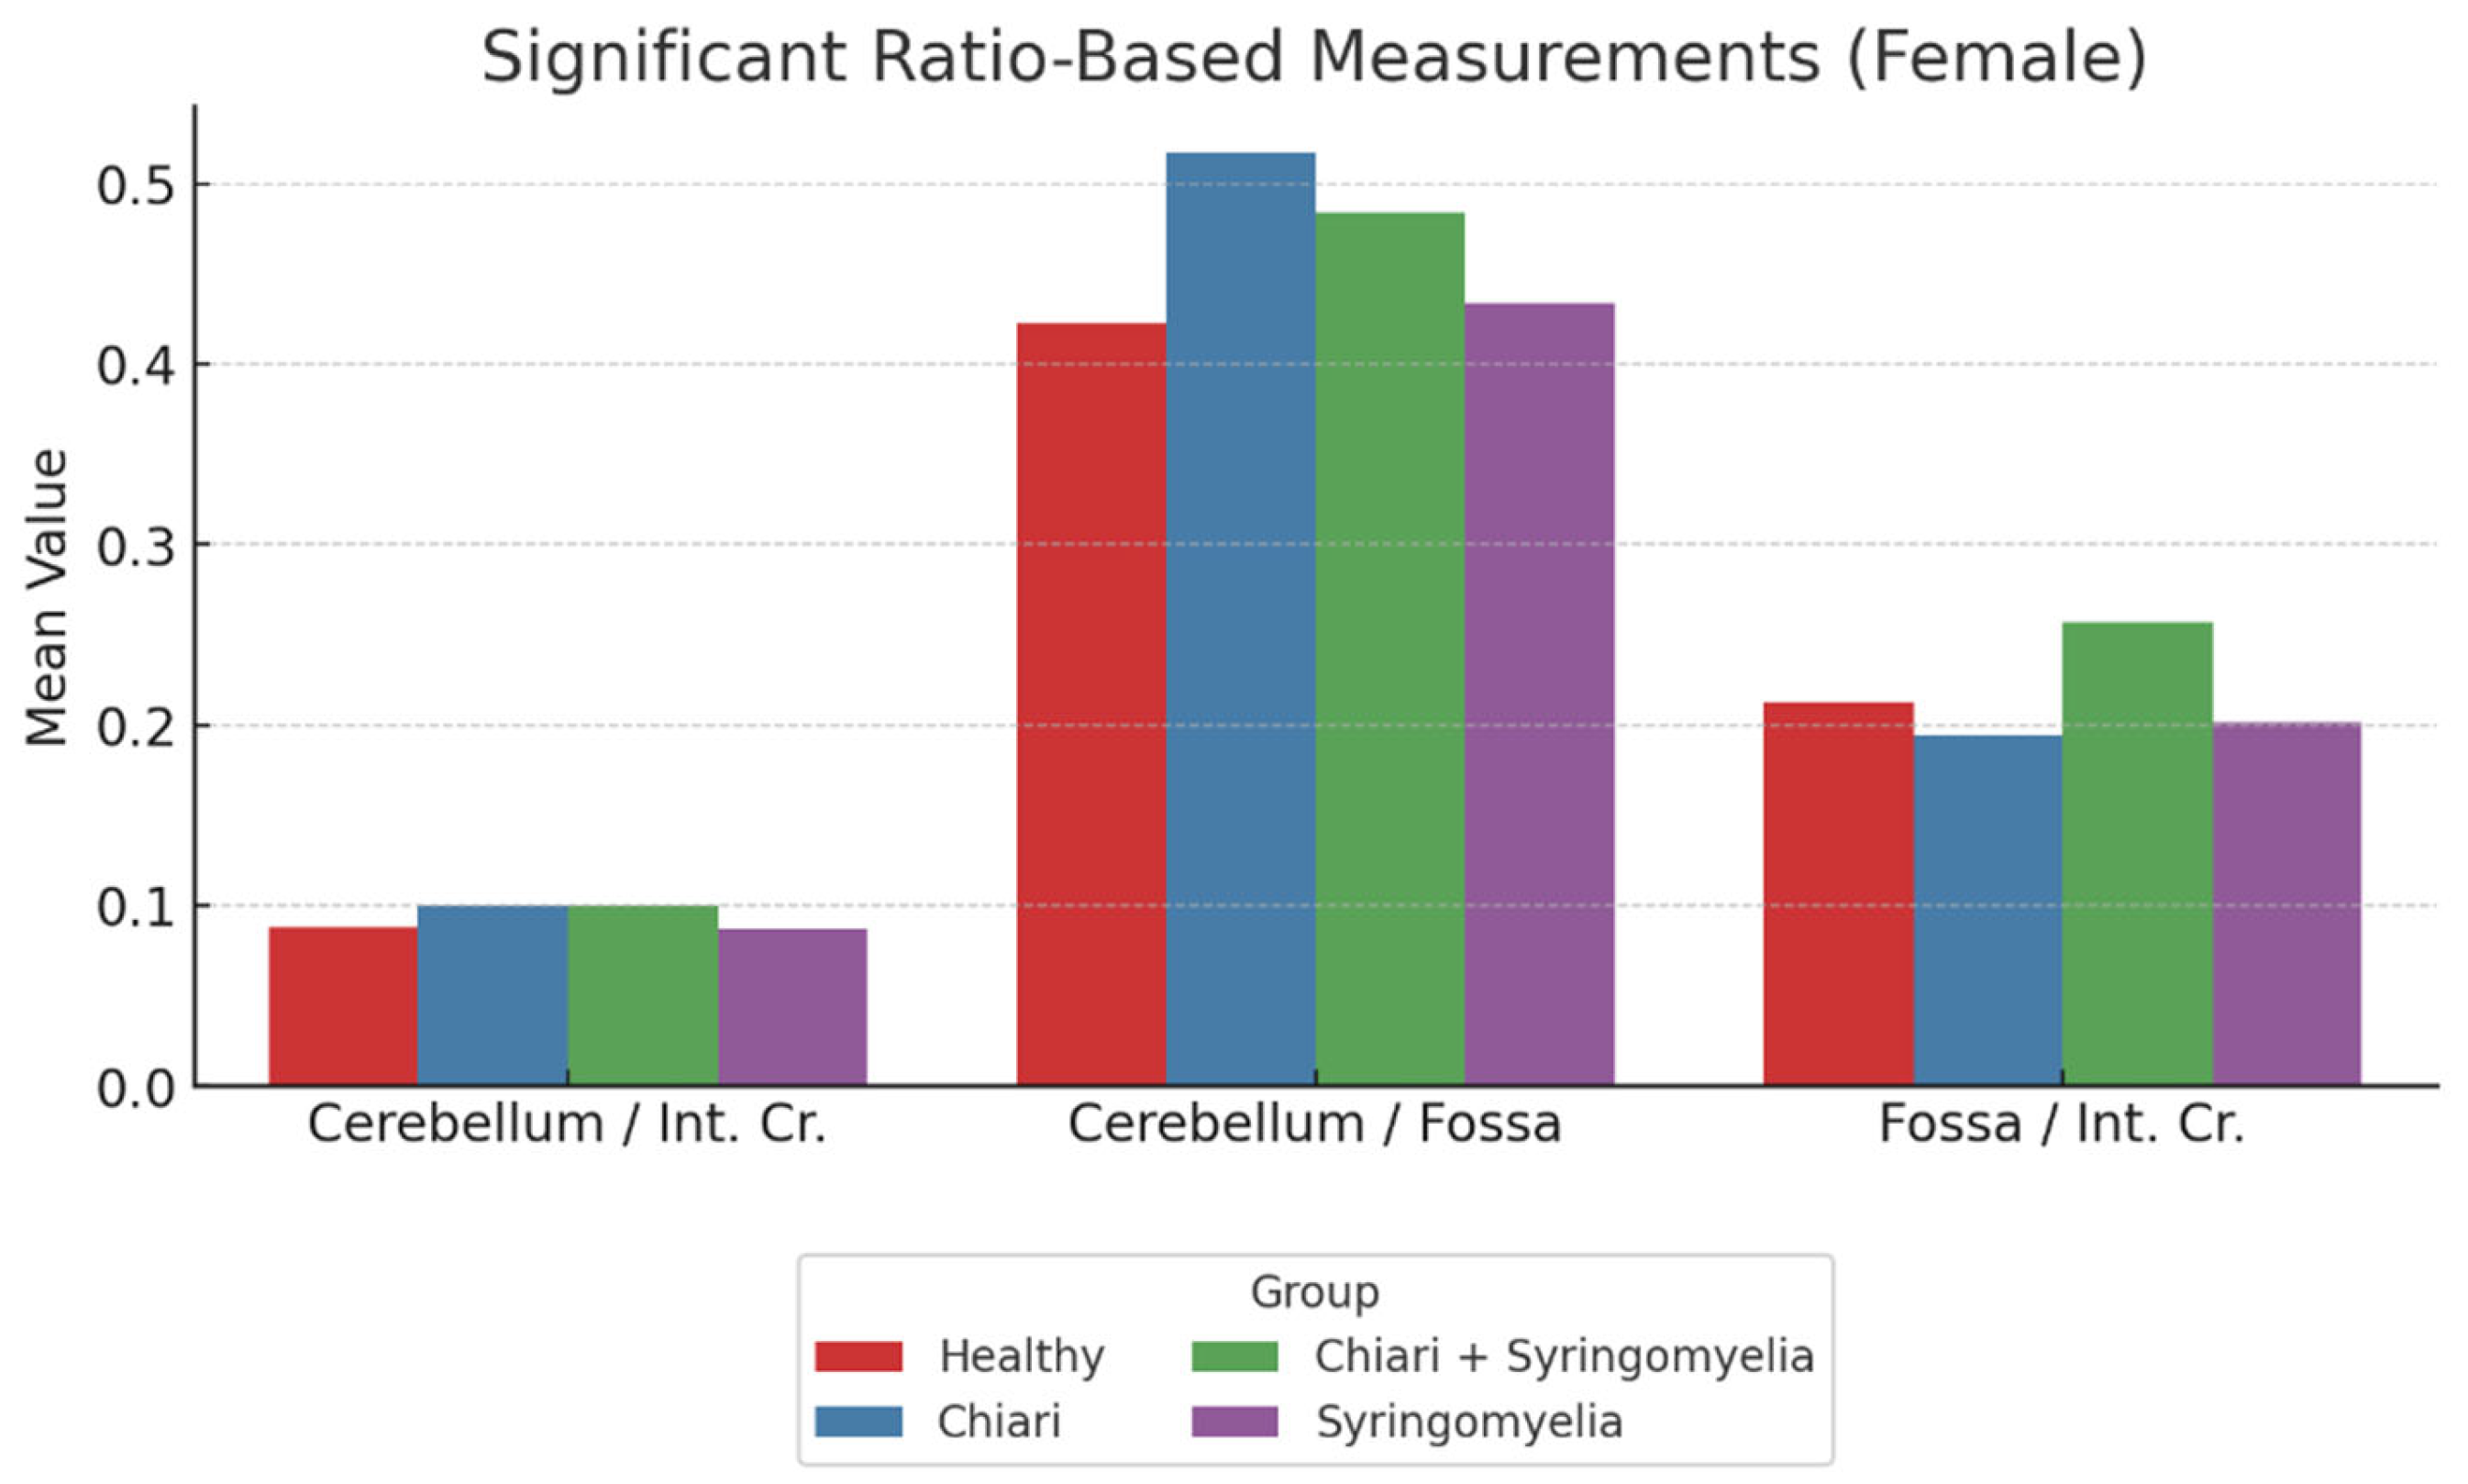
Figure 6.
Group-wise comparison of cerebellum and posterior fossa perimeter among male participants. The Healthy group exhibited the highest posterior fossa perimeter, while the cerebellum perimeter was greater in the Chiari and Chiari + Syringomyelia subgroups.
Figure 6.
Group-wise comparison of cerebellum and posterior fossa perimeter among male participants. The Healthy group exhibited the highest posterior fossa perimeter, while the cerebellum perimeter was greater in the Chiari and Chiari + Syringomyelia subgroups.
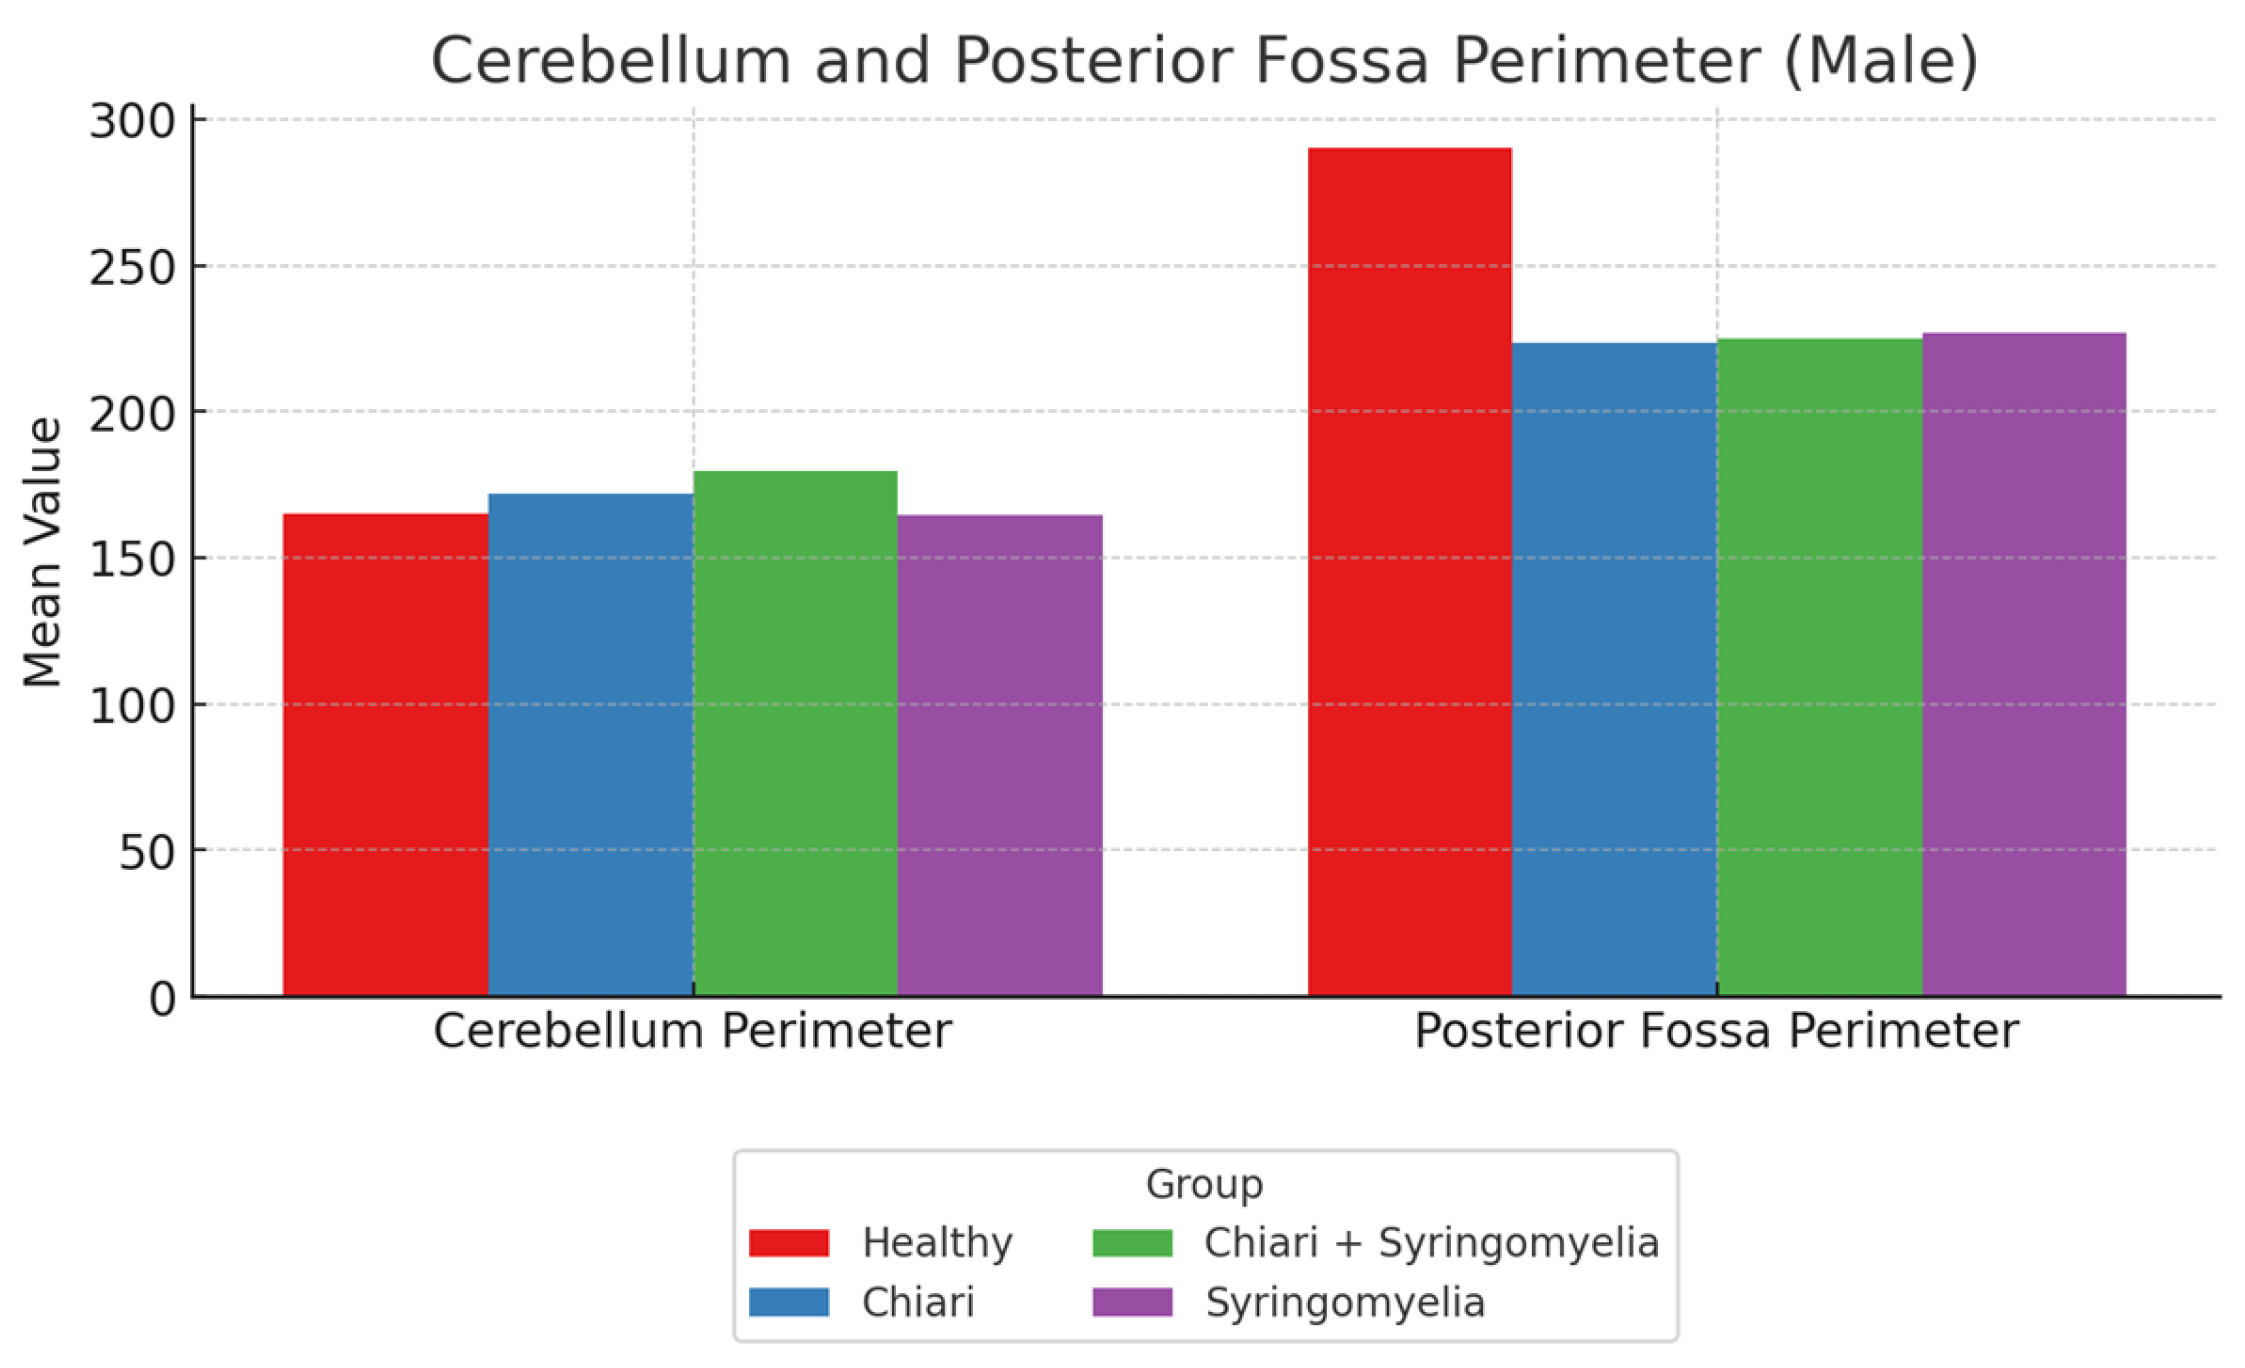
Figure 7.
Mean values of cerebellum area and posterior fossa area among male subgroups: Healthy, Chiari, Chiari with syringomyelia, and Idiopatic Syringomyelia. While cerebellum area was relatively consistent across groups, posterior fossa area showed slightly higher values in the Healthy and Syringomyelia groups.
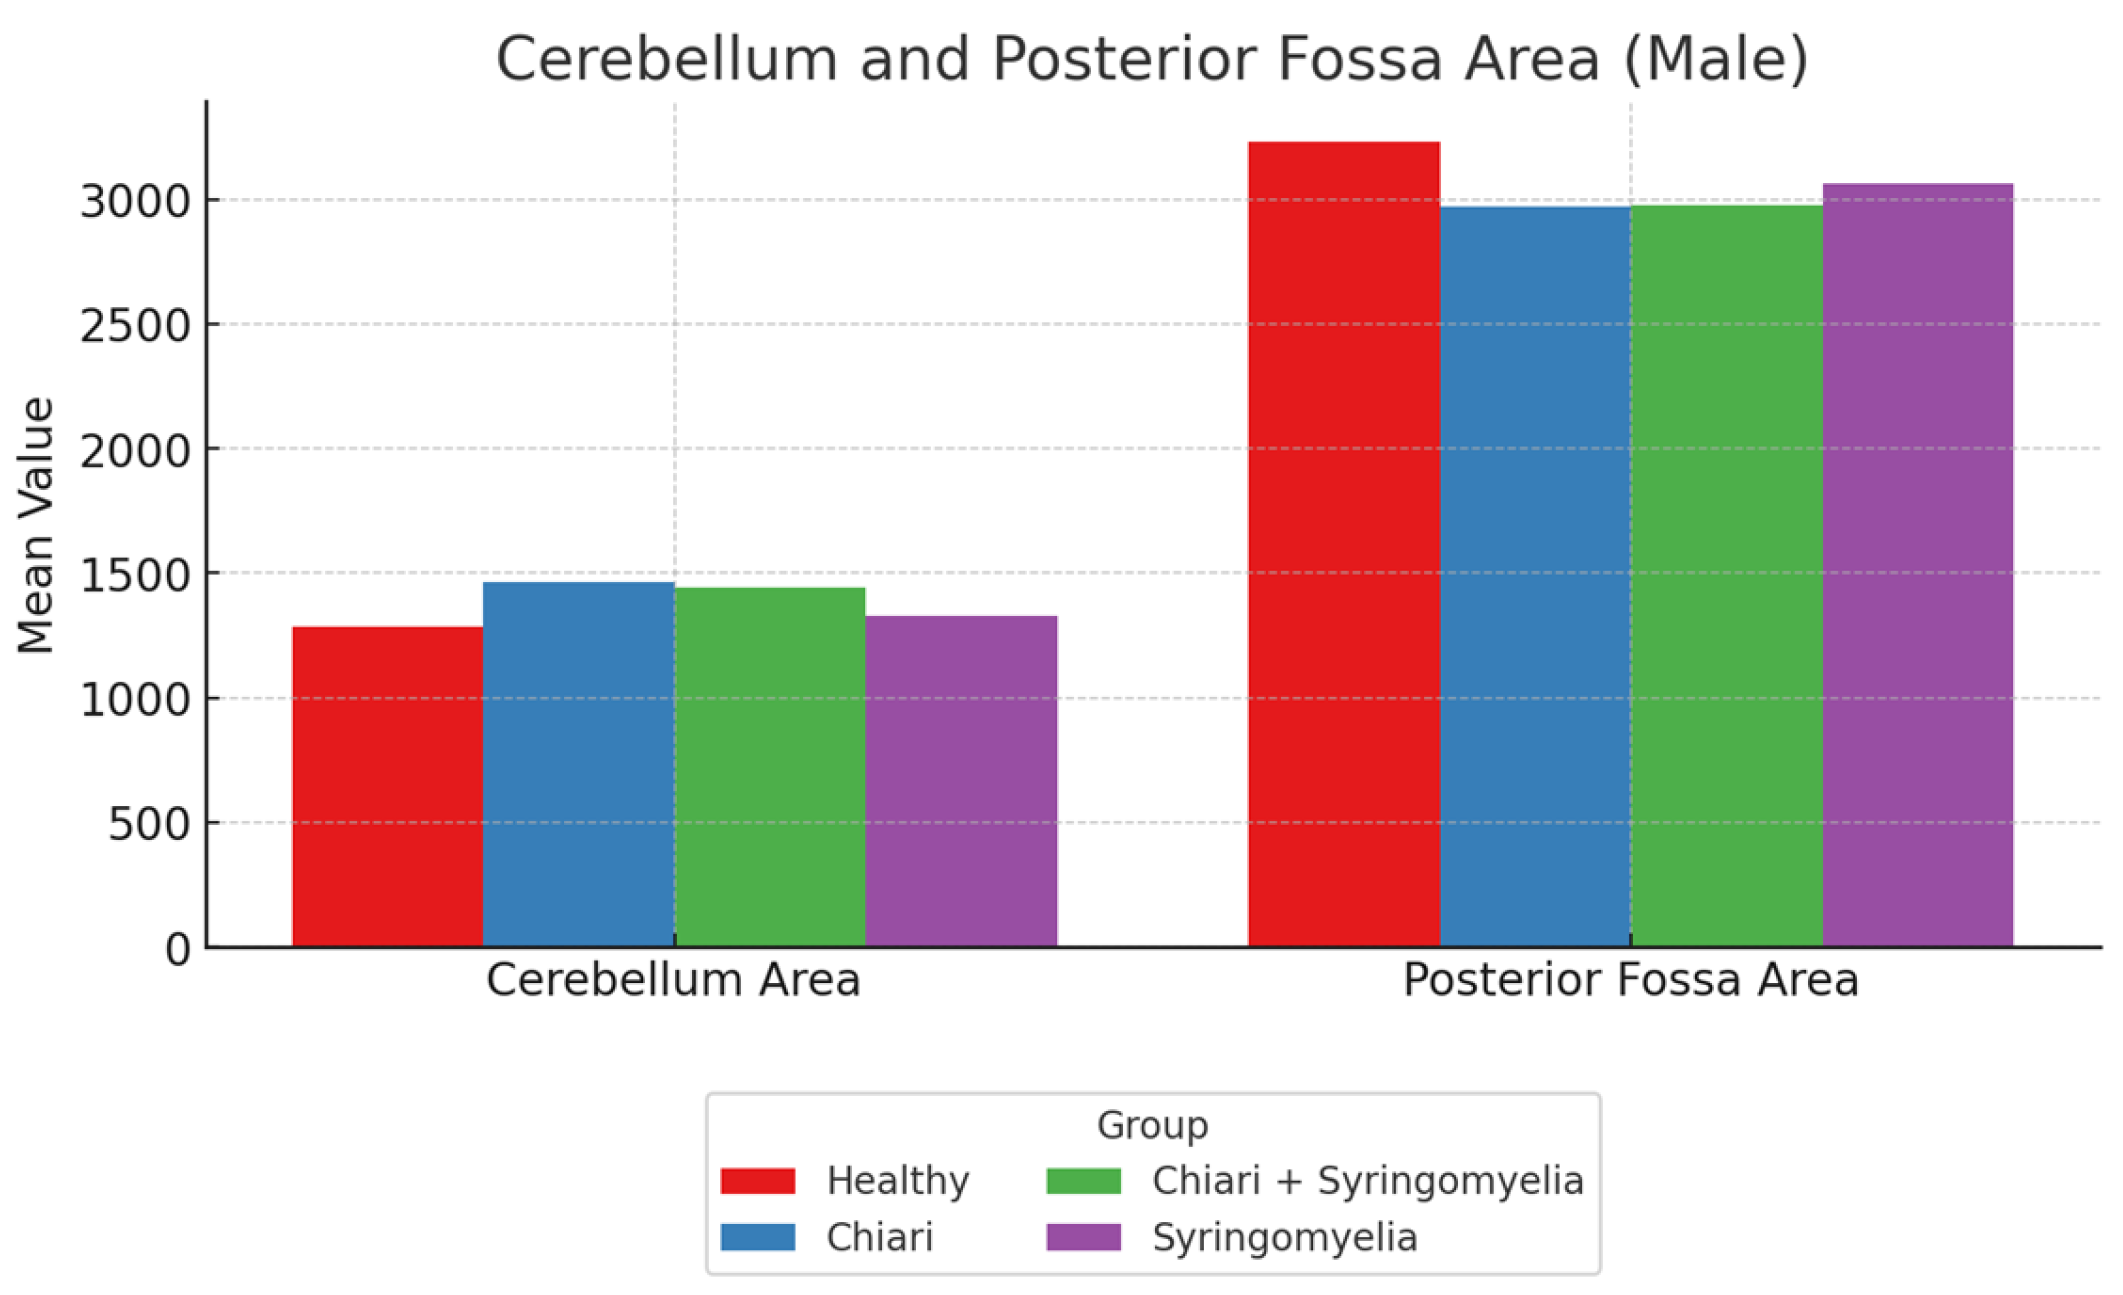
Figure 8.
Comparison of cerebellum/brain, cerebellum/fossa, and fossa/brain ratios among male subgroups. The Chiari + Syringomyelia group demonstrated the highest cerebellum/brain and fossa/brain ratios, whereas cerebellum/fossa ratio peaked in the Chiari group. Cerebellum:Cerebellum area, Int.Cr.:Intracranial area, Fossa: Posterior fossa area.
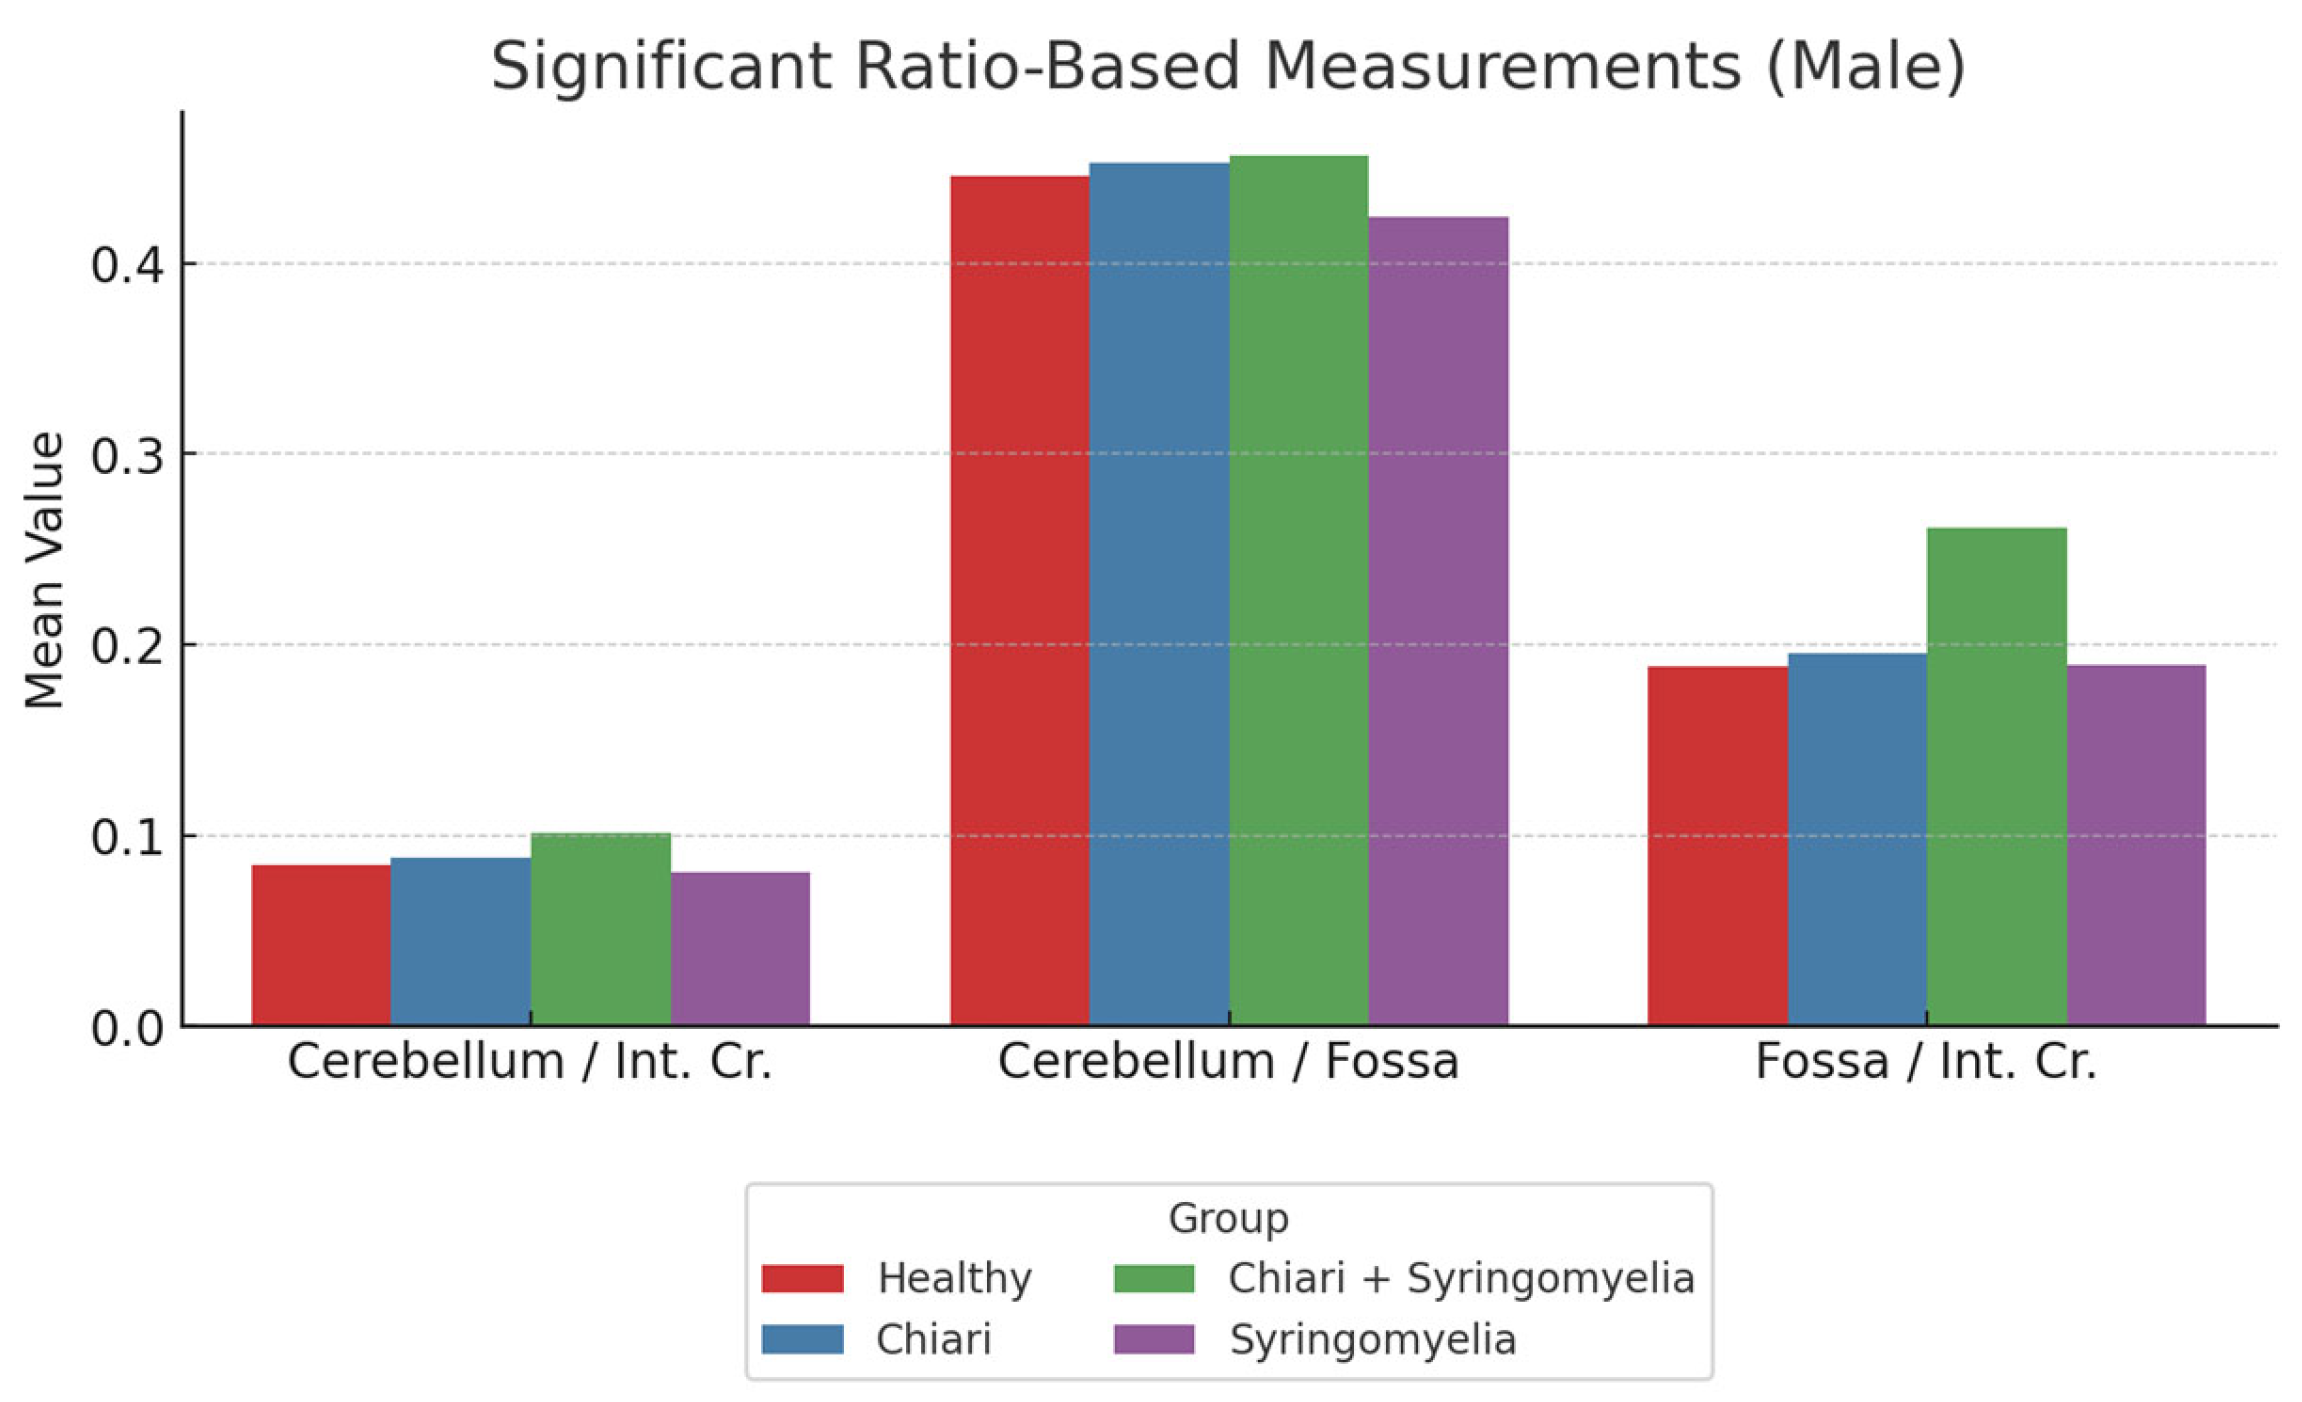
Figure 9.
Comparison of mean tonsillar descent (in mm) between Chiari and Chiari + Syringomyelia groups in male and female participants. Female participants in the Chiari group exhibited significantly greater tonsillar descent compared to those in the Chiari + Syringomyelia group (p = .014). Although the male Chiari group showed a higher mean descent than the Chiari + Syringomyelia group, the difference was not statistically significant (p = .403). Error bars represent standard deviation.
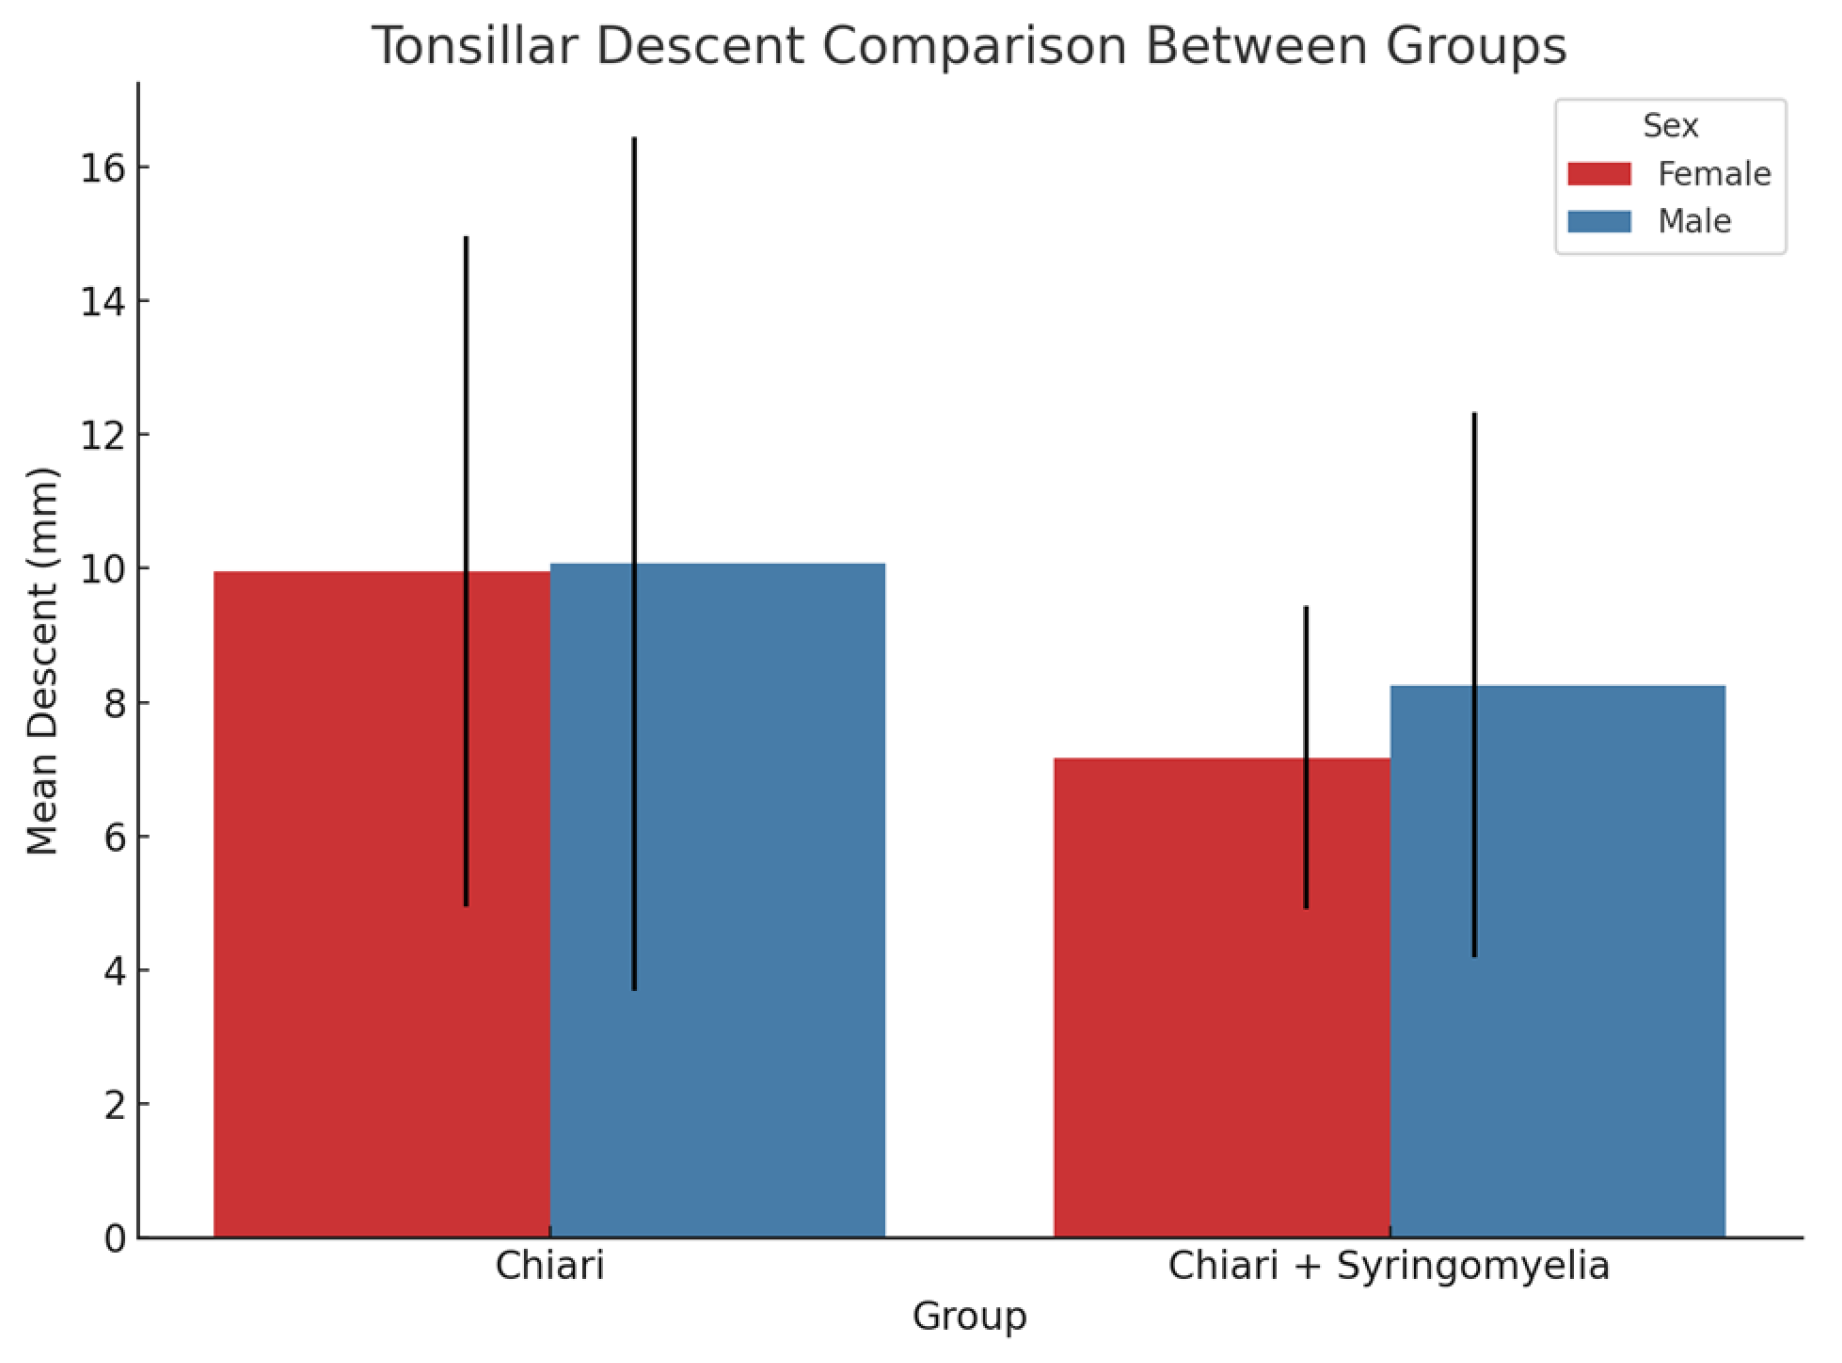

Table 1.
Descriptive statistics (Mean ± SD) of cranial morphometric measurements in female participants, grouped by diagnosis: Healthy, Chiari, Chiari with Syringomyelia, and Idiopatic Syringomyelia. Measurements are categorized into perimeter, area, and ratio-based parameters. Data reflect the mean anatomical characteristics within each subgroup.
| Measurement | Healthy (Mean ± SD) | Chiari (Mean ± SD) | Chiari + Syringomyelia (Mean ± SD) | Idiopatic Syringomyelia (Mean ± SD) |
| Foramen Magnum Diameter | 34.19 ± 2.78 | 34.63 ± 4.77 | 35.29 ± 4.65 | 33.82 ± 3.02 |
| intracranial Perimeter | 466.74 ± 15.19 | 465.59 ± 19.83 | 470.42 ± 17.34 | 462.73 ± 12.93 |
| Posterior Fossa Perimeter | 235.93 ± 13.70 | 215.68 ± 9.36 | 218.40 ± 10.76 | 217.82 ± 9.21 |
| Cerebellum Perimeter | 162.22 ± 14.91 | 170.69 ± 13.70 | 171.66 ± 13.93 | 159.49 ± 17.25 |
| İntracranial Area | 14230.10 ± 874.84 | 14207.31 ± 1133.66 | 14480.87 ± 1124.79 | 14042.73 ± 889.31 |
| Posterior Fossa Area | 3025.94 ± 287.07 | 2748.22 ± 235.44 | 3787.49 ± 4497.64 | 2824.09 ± 185.54 |
| Cerebellum Area | 1242.60 ± 241.88 | 1421.41 ± 171.25 | 1450.79 ± 214.13 | 1223.66 ± 187.90 |
| Cerebellum / Fossa. Ratio | 0.423 ± 0.199 | 0.517 ± 0.042 | 0.484 ± 0.103 | 0.434 ± 0.064 |
| P.Fos / int. Cr. Ratio | 0.213 ± 0.018 | 0.194 ± 0.017 | 0.257 ± 0.283 | 0.202 ± 0.016 |
| Cerebellum / int. Cr. Ratio | 0.088 ± 0.017 | 0.100 ± 0.012 | 0.100 ± 0.013 | 0.087 ± 0.012 |
Fossa: Posterior Fossa Area, int. Cr.: İntracranial Area.
Table 2.
Descriptive statistics (Mean ± SD) of cranial morphometric measurements in male participants, categorized into perimeter, area, and ratio-based parameters. Values are presented for four diagnostic subgroups: Healthy, Chiari, Chiari with Syringomyelia, and Idiopatic Syringomyelia.
Table 2.
Descriptive statistics (Mean ± SD) of cranial morphometric measurements in male participants, categorized into perimeter, area, and ratio-based parameters. Values are presented for four diagnostic subgroups: Healthy, Chiari, Chiari with Syringomyelia, and Idiopatic Syringomyelia.
| Measurement | Healthy (Mean ± SD) | Chiari (Mean ± SD) | Chiari + Syringomyelia (Mean ± SD) | Idiopatic Syringomyelia (Mean ± SD) |
| Foramen Magnum Diameter | 36.02 ± 2.70 | 35.38 ± 3.76 | 37.61 ± 4.91 | 34.41 ± 4.06 |
| İntracranial Perimeter | 487.22 ± 16.20 | 487.45 ± 18.54 | 484.16 ± 25.01 | 479.25 ± 42.49 |
| Posterior Fossa Perimeter | 290.17 ± 386.09 | 223.51 ± 13.38 | 224.97 ± 10.26 | 226.88 ± 15.31 |
| Cerebellum Perimeter | 165.15 ± 12.66 | 172.02 ± 14.64 | 179.86 ± 16.50 | 164.48 ± 13.62 |
| İntracranial Area | 15238.88 ± 1051.16 | 15385.07 ± 1322.68 | 14553.84 ± 4049.92 | 15153.08 ± 1150.84 |
| Posterior Fossa Area | 3231.17 ± 465.48 | 2971.29 ± 300.12 | 2978.95 ± 251.44 | 3065.40 ± 217.21 |
| Cerebellum Area | 1286.03 ± 130.95 | 1463.55 ± 168.59 | 1441.55 ± 139.99 | 1328.27 ± 188.41 |
| Cerebellum / Fossa Ratio | 0.474 ± 0.645 | 0.494 ± 0.052 | 0.485 ± 0.041 | 0.434 ± 0.054 |
| Fossa / int.Cr. Ratio | 0.212 ± 0.030 | 0.193 ± 0.012 | 0.347 ± 0.575 | 0.203 ± 0.015 |
| Cerebellum / int.Cr Ratio | 0.085 ± 0.010 | 0.095 ± 0.008 | 0.162 ± 0.253 | 0.088 ± 0.012 |
Fossa: Posterior Fossa Area, int. Cr.: İntracranial Area.
Disclaimer/Publisher’s Note: The statements, opinions and data contained in all publications are solely those of the individual author(s) and contributor(s) and not of MDPI and/or the editor(s). MDPI and/or the editor(s) disclaim responsibility for any injury to people or property resulting from any ideas, methods, instructions or products referred to in the content. |
© 2025 by the authors. Licensee MDPI, Basel, Switzerland. This article is an open access article distributed under the terms and conditions of the Creative Commons Attribution (CC BY) license (http://creativecommons.org/licenses/by/4.0/).
Copyright: This open access article is published under a Creative Commons CC BY 4.0 license, which permit the free download, distribution, and reuse, provided that the author and preprint are cited in any reuse.


