
Submitted:
17 June 2025
Posted:
19 June 2025
You are already at the latest version
Abstract
The increasing recognition of historical emissions and uneven capacities among developed and developing nations have highlighted the need to look for equity and fairness into global climate action. This study explored various methods and indices used to measure the progress of energy transition efforts. This study revisits the concept of fairness in greenhouse gas emission distribution and climate change as well as the definition of energy transition to clearly define fairness in energy transition. An analysis was done between representative countries from developed and developing. The findings underscored the differences in energy transition achievement, pledged and deposited funds between target countries. The results demonstrate disproportionate burden experienced by lower-income nations and depicts the ongoing challenges in translating principles of “common but differentiated responsibilities” into concrete outcomes. The study provides an open-source and data-driven perspective that highlights the necessity of change in global policy discourse and also advocates the creation of more nuanced, just, and effective approaches for accelerating the clean energy transition worldwide.
Keywords:
fairness
; historical responsibility
; energy transition
1. Introduction
The influence of anthropogenic CO2 emissions to Earth’s temperature raise was proposed as early as 1938 by Callendar [1] then in 1955, Plass proposed the carbon dioxide theory for climate change [2]. However, it was in 1992 that climate change by anthropogenic emissions globally recognized as a “common concern of humankind” in the Rio Convention at the United Nations Conference on Environment and Development [3]. This convention, despite not addressing the funding consequences of the required mitigation efforts [4], acknowledged that the largest share of historical and amount of global emissions has originated in developed countries, but the protection of climate system is a global responsibility and is conducted on the basis of equity with “common but differentiated” responsibilities and capabilities [3]. For this reason, immediate action was emphasized in developed countries (i.e. Annex I countries). This indicates that fairness and justice among countries has already been part of consideration for the required global effort.
Following this convention, Brazil delegation proposed an approach for the burden sharing based on historical emissions, its consequences to the global temperature according to the climate model that they propose, and “polluter pays” principle [5] (so called Brazilian Proposal [6]). This proposal found the support of many countries from the Global South (which for the scope of this paper includes countries not listed in the Annex I of the climate agreements). The Global North, represented in the Annex I countries, rejects this proposal and defend themselves arguing that climate consequences of anthropogenic CO2 emissions was not known before and they must not be judged by their historical emissions [6,7,8], despite ironically their legal systems in general adopt the principle of "ignorantia juris non excusat (ignorance of the law does not excuse)" or commonly known as “objective responsibility” [6,7,8,9]. In addition, they pointed scientific inaccuracies in the proposal and judged it as “biased” [6]. Along the process, this debate shows the dispute and disparity between the interests of the Global North and the Global South. This proposal was eventually not adopted in the Kyoto Protocol and the year 1990 was taken as the basis of responsibility and emission reduction as discussed extensively in [6,7,8]. Despite this, the proposal indirectly resulted to the establishment of Clean Development Mechanism (CDM) for funding mechanism and triggered further development of climate change models [6,7,8]. In addition, the science-driven nature of the proposal is also considered to be advantageous during the highly political negotiations in Kyoto and successful to attract both Annex I and non-Annex I, to contribute to the global effort for tackling climate change [6].
From the sectoral perspective, energy consumption in general (including use in transportation, industry, and residential) has been consistently made up around three-quarters of global anthropogenic emissions [10,11,12,13]. However, the energy sector is associated with electricity generation which roughly contributes to around one-third of global greenhouse gas (GHG) emissions. This share emphasize the significant role of the decarbonization of the energy sector in climate mitigation.
The 26th Commission-of-Party (COP) announced “Just Energy Transition Partnership” or JETP between France, Germany, UK, US, and EU for South Africa [14] as financial and technical assistance from the Global North to the Global South primarily on coal phasing out. It is then also implemented to other countries including Indonesia [15], Vietnam [16], and Senegal [17]. Sharing a similar goal, Asian Development Bank (ADB) launched its Energy Transition Mechanism (ETM) in 2021 targeting Indonesia, Vietnam and the Philippines [18]. However, these recent approaches remain criticised for its specific attention towards coal, debt creating [19], and paying the ‘polluters’ (i.e., the coal power plant corporates) [20] instead of providing incentives to clean energy industries.
Quantifying the “fair share” has been demonstrated to be a difficult task and can be strongly political. This is due to the fact that the perception of what is considered to be a “fair share” observed to be different between parties in the first place [7]. One approach that is commonly used as a benchmark for a fairness in climate effort is through quantitative indices. In the context of climate mitigation and adaptation (including energy transition), several indices exist to assist policy makers keep track of their target which is typically reflected in the Nationally Determined Contributions (NDC). As different indexes may be developed for different purposes and help understanding different trends, a consensus on a single index or methodology that focuses on energy transition or climate fairness is yet to be found. This is perhaps due to the fact that energy decarbonization is considered as only one aspect of climate mitigation, hence it is embedded rather than stand by its own. However, with the emergence of specialized funding for energy transition with a just principle, it is worth looking back whether these means that both Global North and South has fulfilled their fair share in energy transition.
This research aimed at reviewing the existing methodologies for the analysis and quantification of the fairness in the energy transition required to tackle climate change globally (i.e., available indices and methods derived for appraising those trends in the status of the fair transition), identifying their shortcomings and blackspots and presenting methodological enhancements to address those weak points. The proposed methodology enhancements are applied to four countries to show its usability and the results of its application in different contexts. Finally, we draw data-grounded conclusions on the state of fairness in global energy transition.
2. Fairness, Climate, and Energy Transition
2.1. Climate and Fairness in Emission Distribution
The discourse of justice, equality, equity, and fairness has been part of discussion and debates in climate change issues for quite a while. Responsibility plays a pivotal role in such discourses. However, according to our knowledge, there is no one single definition of climate responsibility. Here we consider responsibility in terms of historic contribution to the global carbon emissions and discuss some of the major frameworks for appraising it. The debate emerges, even before the 1997 Kyoto protocol [6,7] as mentioned above. Developed countries (especially the US) demanded that the responsibility needs to be shared, and no country shall be pardoned since developed countries have higher efficiency to generate GDP for the same amount of GHG emission, while the developing countries see that the problem of climate change is caused by developed countries and therefore it is their responsibility [21]. This problem is basically centred around the basis for emission allocation or ‘right-to-pollute.’ Table 1 summarizes four emission allocation schemes that have been proposed as a result of that debate.
The discourse getting even more sensitive when entangled with the issue of which countries have the responsibility to pay, and which have the capacity to work for the climate remedies. Smith, et al. [22] suggested a matrix to evaluate between ability (“who can”) and responsibility (“who should”) against the implementers of climate action and payment bearer countries called matrix of accountability. This matrix classifies countries into four groups: Who can pay, Who should pay, Who can do, and Who should do. The matrix splits the accountability in terms of financial resources, responsibility, and opportunity. This matrix is helpful, considering some Annex-I countries are wealthy but not highly responsible for the current climate state (e.g. Luxembourg and Iceland). In addition, a clear and objective distinction between “who” should do “what” effectively and efficiently can be theoretically made [22].
Caney [23] uses a different approach to classify methods for the distribution of GHG emissions. The first distribution is called “grandfathering” in which the country that historically has large emissions are privileged to maintain their emissions while the new convention on limiting GHG emissions will apply to the remaining countries. The second distribution is the equal per capita distribution which possess egalitarian views that every person has the same amounts of rights toward atmosphere or emission, just like other natural resources. The third is the historical distribution which views that responsibility to climate mitigation is proportional to their historical contribution in terms of cumulative national carbon emissions. In his defence, the first distribution is clearly unjust and not supported by any moral and political philosopher, the second distribution is deemed to have a partial perspective on climate change, while the latest is regarded insufficient on its own to describe the distribution of emissions [23].
The historical responsibility approach, supported among others by the “Brazilian proposal”, is grounded on the fact that the historical emissions can be translated into a contribution to temperature increase by a climate model [5]. This argument simply says that the consequences of past emissions can be quantified objectively. From a philosophical approach, Zellentin [24] supports historical responsibility by two arguments: 1) the action in the past done by industrialized countries upon the ignorance of the possible consequence is considered as deliberate action and 2) standards with uncertain consequences are more stringent than that of known consequences. From the environmental activist perspective, this historical responsibility is viewed as “ecological debt” that the polluters owe to nature [25,26]. In this study, we use the historical responsibility approach based on the arguments mentioned above. Highlighting those arguments, we build upon the fact that is the total amount of cumulative emissions in the atmosphere which determines the severity and scope of global climate change and its consequences. Extensive data supports the historical correlation existing between the GDP of a country and its carbon emissions (e.g. CO₂ emissions per capita vs. GDP per capita [27]). On that basis, we argue that developed countries benefited from their past emissions, and therefore they are in the state of higher ability and opportunity to fund and implement measures for the energy transition and climate mitigation globally. Hence, principle of “objective responsibility” is legitimate to be applied.
2.2. Fairness in Energy Transition
The definitions of energy transition given in different references are summarized in Table 2. In general, they all have something in common: energy transition is a process that involves changes or shifts from one major source of energy to other source of energy and the associated technologies to yield the benefits from the new energy sources, followed by changes in the support systems.
There are several dimensions or aspects that need to be tackled within the energy transition. In general, these dimensions can be clustered by fuel source, conversion technology, energy utilization, system, causes or prime mover, temporal, and social behaviour. Fuel source deals with the shift in raw material of source of energy (i.e., primary energy) from one to another. Conversion technology deals with change in the technological device for getting the energy in the new fuel into the useful form. Energy utilization can be understood as how the energy is used. System defines the change in the energy industry supply-chain. Temporal indicates the time needed in the energy transition. While social behaviour is related to the change of habits of the end user of the final energy form.

Table 3.
Aspects of energy transition comparison from various sources.
| Author | Fuel Source | Conversion Technology | Energy Utilization |
System | Temporal | Social Behavior |
|---|---|---|---|---|---|---|
| Hirsch and Jones [29] | ✓ | ✓ | ||||
| Miller et al. [30] | ✓ | ✓ | ✓ | |||
| O’Connor [31] | ✓ | ✓ | ✓ | |||
| Fouquet and Pearson [32] | ✓ | ✓ | ✓ | |||
| Smil [33] | ✓ | ✓ | ✓ |
Several approaches have been used to quantify this gradual process of energy transition. Smil [33] considers 25% as the minimum threshold to be said transitioned to a new energy source, meanwhile Grübler [28] uses 50% as the minimum threshold for the criteria. It has been highlighted by many literature (Smil [33], Fouquet [34], Sovacool [35]) that, historically, energy transitions take decades before a new energy source reaches the minimum threshold. Sovacool [35] states that this transition will follow a punctuated equilibrium pattern, rather than exponential. In terms of the second aspect, Sovacool [35] shows that the past energy transitions require around 80-100 years. However, in the context of energy sector decarbonization, 25% (or even 50%) transition to renewable in 80-100 years might be not enough. Therefore, an accelerated transition with higher share of low carbon energy source is required.
Baker et al. [36] defined energy justice as a transition that emphasizes to achieve equity in both social and economic participation in the energy system. It should be done in tandem with addressing burdens historically borne by frontline communities. This idea highlights the necessity for equitable access to energy that should be affordable, safe, and sustainable for all nations. Heffron et al. [37] define “just energy investments,” as investments that are aligned with societal energy and climate goals, aiming at promoting a just transition to a low-carbon economy. These perspectives underscore the need for inclusive economic development within a fair energy transition. The notion of energy democracy highlights the idea that communities should have a stake in shaping their energy futures [36]. Additionally, procedural justice focuses on the inclusivity and fairness of decision-making processes in the energy sector [38]. These concepts are integral to ensuring that all stakeholders have a voice in the transition process, thereby ensuring procedural fairness in our definition.
Climate justice and environmental justice emphasizes the necessity of addressing the disproportionate impacts of climate change and environmental degradation on marginalized communities [36]. Recognition justice included in this context also requires an understanding of historical and ongoing inequalities [38]. Finally, the importance of monitoring and evaluation is implied in the need for a Just Energy Transition, continuous assessment is required to make sure that policies and investments remain aligned with principles of fairness. Establishing robust mechanisms to track progress towards achieving fairness over time is important to make sure that accountability and transparency are maintained in the transition process.
Drawing on these previous definitions, this research will consider fair energy transition as transition in the energy sector from high to lower, neutral or zero carbon intensity energy source that considering historical responsibility, financial capacity, and country-specific opportunities to support global climate mitigation effort.
2.3. Indexes in Presenting State of Climate Action
An index (also called composite index, composite indicator, or social indicator) is a typical measure that is employed to summarize a specific aspect or issue that consists of multiple variables of statistical data [39]. The analysis of a fair and global energy transition is a multidimensional field which may involve a wide range of disciplines with different measurement units and magnitudes [46]. Composite indicators, depicting and aggregating trends in variables from different disciplines and fields, can be useful to reduce complexity, ease interpretation of the existing data, assess progress of the variables studied over time, and facilitate communication to general audience [40]. Such indexes are also regarded to be useful in medium to long-term planning [39]. However, the authors also emphasize that poorly constructed or misinterpreted indexes can leads to misleading policy. Therefore, such index must be treated as a trigger to initiate discussion and public interest [40].
This section presents a literature review highlighting and describing the main methodologies that can be used for the above-mentioned purpose (of analysing the global fairness in the energy transition) through an index as a proxy. To make clear the usefulness and trends that can be observed with the different indexes, their concrete values for six different countries are shown. The six countries represent a typical situation for highly industrialized rich countries (USA and Germany), emerging economies (China and Brazil) and poorer global south countries (Pakistan). The performance of target countries according to the various indexes studied is shown in Table 4. These countries are used as a concrete case study to show the scope of existing approaches and how the approach we propose here builds upon and complements them.
2.3.1. Greenhouse Development Rights (GDR) Framework
The Greenhouse Development Rights (GDR) framework is a metric developed by Paul Baer et al. [41] with a simple proposition “that the poor must, at minimum be spared the burdens of the climate transition.” This framework summarizes the burden of climate transition in terms of Responsibility-Capacity Index (RCI). This framework is characterized by 4 (four) elements: 1). Development threshold, 2). Responsibility Index, 3). Capacity Index, and 4). Responsibility-Capacity Index.
Development threshold defined as the minimum level of welfare which people are expected to have the capability and share of responsibility in climate transition [41]. Below of this level, people (or countries) are then spared from climate transition responsibility and not expected to share the costs of the climate transition simply because they have survival and development as their priorities and the little capacity to invest in solving climate issues. On the other side, countries above this threshold are considered wealthy enough to bear the burdens of the climate transition and hence possess progressive sharing costs of curbing the emissions associated with their own consumption.
Capacity index is defined by income that excludes expenses for basic necessities for life i.e., excluding the development threshold. Therefore, a country’s capacity does not mean the total GDP of the country, but rather the remaining GDP that reduced with the development threshold. Responsibility index is defined as contribution to the climate problem, i.e., cumulative emissions, excluding emissions that correspond to consumption below the development threshold. Responsibility-Capacity Index is then taken simply as the average between capacity index and responsibility index without specific weighting. Index can be further translated in terms of the amount of fund that has to be paid to finance global climate action.
The defined metrics are quite objective in defining the RCI in terms that countries with higher CI, which usually corresponds to higher RI, are having higher share and burden in climate transition. While countries with lower CI, which generally corresponds lower RI, are having smaller share and burden in climate transition.
2.3.2. Green Future Index (GFI)
Green Future Index (GFI) is an index developed by MIT Technology Review Insights to rank the progress and commitment of 76 countries on low-carbon development. The methodology was first introduced in 2021 [42] and is currently on its third report [43]. Five elements assessed to calculate this index are carbon emissions, energy transition, green society, clean innovation, and climate policy.
This index sets the first four elements as measure of progress that each country has made (altogether weighting 60%), while the last element as measure of ambition towards climate transition (weighting 40%) [42]. The obtained score is then used to group the evaluated countries into four categories: 1). Green Leaders (20 countries that perform the most progress and commitment in low-carbon development), 2). Greening Middle (20 countries that make progress or commitment in low carbon development), 3). Climate Laggards (20 countries that make slow and uneven progress or commitment in low carbon development), 4). Climate Abstainer (the remaining 16 countries that are left behind in the “green future” due to their lack of progress and commitment in low-carbon development).
While this index provides a relatively good measure on current performance, it does not, take into account their historical responsibility of national GHG emissions that have led to the current climate state. This is reflected in the carbon emissions element where only current carbon emission and carbon emission growth per GDP are assessed.
Furthermore, the scoring metrics are normalized in terms of GDP or population, which may impose injustice in terms of absolute climate responsibility when scoring the GHG emissions. If two countries emit the same amount GHG, the country with higher GDP obtains better index than that of lower GDP. Despite being a good approximation to compare the carbon intensity of different countries, this approach overlooks the contribution of cumulative historical GHG emissions to reach that level of GDP. This bias is reflected by the overall ranking where the Green Leaders and Greening Middle group are dominated by developed countries of the northern hemisphere. On the other side of the equation, the Climate Laggards and Climate Abstainer are dominated by developing and low economies of the southern hemisphere, since these economies are obviously lack of the financial capacity to do the necessary climate action. Simply put, this index emphasizes the world’s state of inequality but specifically contextualized in climate action.
2.3.3. Climate Change Performance Index (CCPI)
Climate Change Performance Index (CCPI) is developed by Germanwatch as an instrument of international transparency in climate politics by comparing the performance of countries reducing GHG emissions as compared to the 1990 level to reach the goal of limiting 2 °C warming [44]. Introduced in 2005, this index was initially focused on 56 countries considered to be responsible for 90% of global emission [44], then extended to 63 countries plus the EU as of 2024 [44]. The composite index is being refined over time. Initially consisted of 3 sub-dimensions (emission trends by sector, emission level, and climate policy) and 11 metrics [44], now it consists of 4 dimensions (GHG emissions, renewable energy, energy use, and climate policy) and 14 metrics [45]. The final composite index is presented in 100 scale and is grouped into five different ratings from best to worst: very high (>76), high (64 to 76), medium (58 to 64), low (45 to 58), and very low (< 45) [45].
2.3.4. Energy Transition Index (ETI)
Energy Transition Index (ETI) is developed by World Economic Forum (WEF) to track countries’ performance of energy system and its readiness to energy transition [46]. It was formerly called Energy Architecture Performance Index (EAPI) [47] and changed as ETI in 2018 [48]. The index consists of two main dimension, system performance (60% weight; 3 sub-dimensions and 24 metrics) and transition readiness (40% weight; 5 sub-dimensions and 22 metrics), with 46 metrics as the basis [46].
System performance consists of equity, security, and sustainability. While transition readiness consists of regulations & political commitment, finance & investment, education & human capital, infrastructure, and innovation. Among the metrics used in this index, it considers CO2 emissions per capita, CO2 intensity of total primary energy supplied, and share of clean energy in final energy consumption. In addition, this index also use score from other index (i.e. Regulatory Indicators for Sustainable Energy (RISE)) in their source [46].
2.3.5. Net Zero Economy Index (NZEI)
Net Zero Economy Index (NZEI) is an indicator developed by PricewaterhouseCooper LLP (PwC) to track economy decarbonization and reducing CO2 emissions in the energy sector. The index was initially called Low Carbon Economy Index (LCEI) [49] before changed to NZEI in 2021 [50] which focuses on G20 economies. This index reports in terms of percent per year (%/year) the progress made to reach the decarbonization target based on the global carbon budget. This index consists of three metrics: carbon intensity (in tCO2/$million GDP), fuel factor (in tCO2/TJ), and energy intensity (in TJ/GDP) [51].
In this index, a country is encouraged to achieve lower carbon intensity per GDP by lowering the fuel factor (by transition to clean energy) and energy intensity (by increasing energy efficiency). The studied countries are divided into four quadrants with energy intensity as the vertical axis and fuel factor as the horizontal axis: high fuel factor-high energy intensity (top-right quadrant), high fuel factor-low energy intensity (bottom-right quadrant), low fuel factor-high energy intensity (top-left quadrant), and low fuel factor-low energy intensity (bottom-left quadrant). Thus, the target countries are encouraged to achieve the lower left quadrant. By 2024, this target quadrant is achieved by European Union, United Kingdom, Germany, Italy, and France.
2.3.6. Regulatory Indicators for Sustainable Energy (RISE)
This indicator was launched by the World Bank Group (WB) in 2017. It assesses 111 countries’ sustainable energy performance from the regulatory aspect. Policies, regulations, and administrative procedures relevant in energy access, energy efficiency, and renewable energy are evaluated through 27 indicators and 80 sub-indicators [52]. It aims at presenting the state of policy makers in achieving global goals in sustainable energy as compared to its peers and suggests further improvement [52]. Since this index purely evaluates the policy field, it does not take into account technical achievement (e.g., capacity of renewable energy installed or the associated energy generation.).
Criticism to this indicator is given by Urpelainen [53] which argues that this index neglects the fundamental aspect of policy: the context in which the policy is implemented. This index is considered to judge countries by ‘one-size-fits-all’ approach where to improve their score, countries are motivated to adopt policies being labelled as ‘good’ by RISE. As consequence, all countries achieve good score if they have the same ‘good’ policies and does not expect different policy measures to achieve the same positive outcome in terms of e.g. renewable energy installed capacity or clean energy access. This is considered to be problematic since social context may affect the adoption and implementation of a regulation [54].
3. Methods
3.1. General Approach
The steps followed in this research are shown graphically in Figure 1. As a first step we carried an extensive literature review as presented in Chapter 2 on the concept of fairness in the context of the energy transition. Then we reviewed methods available and used by academia, practitioners, and organizations actively engaged in climate mitigation to present the current state of international climate action. In Chapter 3, we appraise these indexes, discuss the advantages and disadvantages, and used it as a basis to develop our method. Then we discuss in detail the approach that we took to assess the state of fairness in global energy transition.
In section 4 we applied our method to 6 different countries selected as case studies: United States, United Kingdom, and Germany (representing the Annex I countries), then Brazil, India, and Pakistan (representing non-Annex I countries). The chosen countries allow deriving first data-grounded conclusions on the fairness of the global state of the energy transition, both from an ecological and economic perspective. We also discuss how climate related disasters costs these countries against its GDP. To developing economies this can increase the financial challenges to finance their transition to clean energy sources.
3.2. Fairness Indexes
There are a great variety of indexes for evaluating different aspects of the national energy transitions (see section 2.3). Many of them (e.g. GFI, CCPI, ETI, NZEI, and RISE) focus on the current state of different variables, e.g. annual carbon emissions or GDP. However, in this paper we follow a definition of a fair energy transition (see end of section 2.2), aligned with many other scholars [21,22,23], in which current and future developments as well as the historical development of those indicators is of outmost importance. On the other side, the methodology should include a minimum number of indicators in order to increase transparency and communication easiness. The Greenhouse Development Rights (GDR) framework [41] (see section 2.3.1) fulfils both requirements and is taken in this paper as a first basis for analysis. In the following sections, the core parts of the GDR methodology are shown. Amendments and modifications to the original GDR methodology are introduced, discussed and applied to the country cases in order to show the differences and consequences of the modifications. This amendment includes defining energy transition index, since the GDR framework itself is not originally intended to focus on climate change, but rather on the general aspects of emission distribution and the associated financing contribution needed from each country. The comparison between this work and the original GDR framework is summarised in Table 5 and discussed in detail in the following subsections.
RISE’s methodology is not adopted since its primary focus is on regulatory readiness, does not consider any technical metrics such as CO2 emission (see Section 3.3.6). While GFI, CCPI, ETI, and NZEI considers renewable energy shares in a country’s energy mix as part of their methodology, these indexes does not consider historical emission (see Section 3.3.2-3.3.5). Therefore, our methodology serves as an intermediary between the existing indexes.
3.2.1. Adjusted Responsibility Index (RI)
The responsibility index as defined by the GDR framework “Responsibility, by which we mean contribution to the climate problem, can similarly be defined as cumulative emissions (since some agreed starting year) excluding emissions that correspond to consumption below the development threshold” (1126, pp). Mathematically, this can be stated as,
The GDR framework aligns with the spirit of Brazilian proposal building upon the argument that historical emission share matters to be considered in calculating shares in climate financing. The responsibility and capacity index (RI and CI) are core metrics in the GDR method. They are calculated on the basis of the cumulative emissions since 1990 or annual economic wealth per capita. The authors themselves question that date as starting point for the responsibility index stating “Indeed, a 1990 start date ‘forgives’ approximately two-thirds of historical emissions of industrialized countries, but only one-third of historical developing country emissions” (54, pp.) and arguing that it shifts the responsibility to the less wealthy countries. For both metrics a threshold of minimum carbon emissions or GDP for economic development is included as a reduction in the actual emissions or national wealth. As a result, the RI and CI can bias for largely populated countries such as China, India, and Indonesia, making a fair comparison between countries difficult. In addition, low and lower-middle income countries collectively account for 5.9 GtCO2e or 16.3% of global emission in 2022 [61] representing a relevant push for further global temperature increase. For this reason, we exclude the development emission threshold and define the responsibility index as
3.2.2. Capacity Index (CI)
The GDR framework, put the capacity index as “We take capacity to mean income that is not demanded by the basic necessities of everyday life; … In turn, a nation’s aggregate capacity is defined as the sum of all individual income above the development threshold.” (1126, pp.). In this aspect, the Capacity Index is calculated according to eq. (3) based on GDP per capita shows the quantitative possibility of each country to participate in efforts of climate change mitigation and adaptation through time. This can be mathematically expressed as
Directly using this expression will causes country with GDP per capita below the development threshold to have negative capacity index. The capacity index we calculate is then based on the following formula,
The implication of this index is that it goes beyond historical responsibility to consider current economic and technological capacity for those countries to be able to respond to the challenge of climate change.
The GDR framework argues that global poverty line of USD 1/day does not adequately reflects the development threshold, and this threshold shall reflect a level of welfare beyond basic needs. Therefore, the framework employs the Pritchett threshold of about USD 16/day then takes 25% above this threshold [41] which translates to USD 20/day (the Pritchett threshold is the level where classic plagues of poverty (e.g., malnutrition, high infant mortality, low education, high relative food expenditure) begin to disappear.). Using this value, the development threshold corresponds to USD 7,500/capita/year. This threshold is found to be correlates well with middle class level of the global south that ranges between USD 3000 and 11,250/capita/year [55].
3.2.3. Responsibility-Capacity Index (RCI)
The responsibility and capacity index are then combined to obtain the responsibility-capacity index [41], (similar to the original GDR framework) defined as
The RCI then can be used to calculate the associated financing requirements for climate action.
3.2.4. Transition Index
In this study, we compare four different ways to define the transition index. To begin with, we use the share of fossil fuelled energy supply in the energy mix (Eq. 6). The use of fossil fuel share in the energy mix, makes renewable and nuclear energy in the same position and does not discriminate nuclear since it also produces low carbon energy. In other words, the transition index in this definition also equivalents as decarbonization index.
Then the use of energy supply, instead of installed capacity, ensures that the considered transition index resulted from the emission of burned fossil fuel. As a matter of fact, each power plant has its own energy generation capacity factor. For example, if we use the number of installed capacities of renewable power plant, it is possible that it operates at low capacity factor while the fossil fuelled power plant operates at higher capacity factor.
In this model, lower index translates to lower fossil fuel or higher transition to low carbon energy sources. The advantage of this method is the simplicity, and it reflects directly the fossil fuel share (emission) in the country’s energy mix. However, this index puts the transition achieved by countries of the lower responsibility or share to the world’s energy consumption at the same level as those with higher responsibility or share to the world’s energy consumption. As a consequence, this method would impose unfairness to lower responsibility countries. For the reason of this drawback, we define responsibility-adjusted transition index (R-TI) as an alternative (Eq. 7). By weighing the simple transition index with the responsibility index.
Responsibility index (RI) as a multiplication factor in the transition index implies that the transition of countries of higher responsibility matters more than that of lower responsibility. This is to say countries with higher responsibility should take care more urgently about their transition and decarbonization, since they have a greater share on the climate change related emissions in the atmosphere. Hence their 1% decrease in transition towards clean energy source creates bigger impacts (hence steeper curve for the US) than that of lower responsibility countries (e.g. Brazil and Pakistan which close to 0). Despite this method may provide justice to lower responsibility countries and puts more emphasize to higher responsibility countries. However, the sum of R-TI for all countries does not add up to the world’s R-TI since it is calculated on cumulative country emission and not fossil fuel energy consumption. In addition, countries with higher responsibility but lower share to world’s energy consumption (i.e., early industrialized but small countries) would receive an injustice. On the other side, countries with lower responsibility index but higher share to world’s energy consumption (late industrialized but big countries) may take advantage of this ‘opportunity’ to remain increase its fossil fuel consumption for the energy sector.
To avoid the issue of the previous method, we define global energy share-adjusted transition index (GES-TI) by multiplying the simple transition index to its share of world energy consumption at a given year (Eq. 8).
In this approach, the global share as weighing factor implies the energy transition of countries with higher global share is more important than transition of countries with lower global share. The advantage of this approach is that it does not promote late industrialized countries to ramp up their fossil fuelled energy supply if their global share is large. This is important since avoiding future emission is as important to climate mitigation, while past emissions are naturally slowly absorbed by nature [56].
In alternative, we define inverted global energy share-adjusted transition index (IGES-TI) in Eq. (9). In contrast to other defined indices which to motivate to go (or close) to 0 as an indication of fully transitioned or fully decarbonized, this method suggests countries to maintain their index to go to 1 (1 = fully transitioned, 0 = fully fossil based energy).
3.3. Sources of Data
The historical emissions data that we use for assessing responsibility index can be found from [57]. As for capacity index, we use the data of countries’ GDP from the World Bank [58,59]. The energy supply data to assess transition index is obtain from IRENASTAT [60]. Then costs of disasters are from [61]. Lastly, the pledged and contributed data are from [62,63] and the required climate finance data is obtained from country’s respective Nationally Determined Contribution (NDC) [64,65,66,67,68,69]
4. State of Fairness in Energy Transition
4.1. State of Responsibility, Capacity, and Transition
4.2.1. Adjusted Responsibility Index (RI)
As of 2022 (Figure 2(a)), US’ cumulative emission has reached 426.9 Gigatonnes CO2 (responsible for 24.08% of world’s cumulative emission), followed by China that reached 260.6 Gigatonnes CO2 (responsible for 14.7% of world’s cumulative emission), then followed by Germany at 94 Gigatonnes CO2 (responsible for 5.3% of world’s cumulative emission). While Brazil and Pakistan cumulative emission only reach 17.2 Gigatonnes (0.97%) and 5.5 Gigatonnes (0.31%), respectively.
As shown, all target countries’ cumulative emission is increasing at different pace. While cumulative emission from Germany, UK, Brazil and Pakistan are increasing relatively linear, China’s and United States’ cumulative emission is apparent to be exponential. Despite the emission increase, UK, US and Germany responsibility index have passed their peak and is now decreasing while other target countries are still increasing (Figure 2(b)). This result is in agreement that the remaining target countries are still ramping up their economy.
4.2.2. Adjusted Capacity Index (CI)
Financially, high scores in CI (Figure 3(a)) show that the US has adequate financial means and technological capacities, far higher than Germany and UK, to assume the global leadership in low-emission development and to move towards a sustainable energy system. Germany and the United Kingdom also demonstrates a positive CI value, showing good economic and technological backgrounds of these countries to become leaders in global climate efforts. However, the data for China in CI speaks differently: within just 3 decades, it manages to flip its capacity index from negative value to positive. China reaches its development threshold as of 2008, and in the following years, it is considered to possess sufficient resources to support global climate financing. However, even if increased along with its very strong economic growth, it stands still below that of the USA; that is, it catches up in the overall ability to invest and be able to carry out large-scale climate solutions.
However, in this case, Pakistan and Brazil have substantially negative values for CI, characteristic of relatively low economic resources and technological capacities. This means that these countries still need to meet their development threshold. These countries will thus have relatively colossal challenges in the initiation of sorting out issues related to climate change on an individual basis, so they will greatly require support from abroad. This capacity disparity highlights the importance of international cooperation and financial and technological facilitation to developing countries.
4.2.3. Responsibility-Capacity Index
Of the greatest importance is the Responsibility-Capacity Index (RCI), for this integrates both the Responsibility Index and the Capacity Index to have a more rounded view of which countries should be taking global leadership in relation to efforts over climate change. The RCI (Figure 3(b)) shows that despite the slight decrease of RCI, the United States remains number one in the world in terms of both responsibility and capacity. This indicates that the U.S. has a responsibility and the capacity to lead the rest of the world on the issue of climate action.
On the contrary, the country's increasing RCI of China illustrates a growing responsibility with increasing emissions and its newly developing capability in dealing with those emissions, thrusting it into an important position in this world of climate negotiations. RCI values, on the other hand, for countries such as Pakistan and Brazil are much lower (very close to zero)—reaffirming the fact that while they may be under the influence of climate change, they do not hold the capacity to act upon large-scale mitigation measures independently. This data highlights the need for a just transition with huge support from the wealthier nations going to those with lower capacity.
4.2.4. Transition Index (TI)
In this section, we demonstrate the implications of the various transition indexes defined in section 3.2.4. In Figure 4 we presented the share to global consumption from the target countries. The United States were initially dominating world energy consumption from 1960s to early 2000s. However, since early 2000s, China quickly industrialized and increase its share and is now consume of more than a quarter of global energy consumption. As for other target countries, the where is relatively smaller than the first two. This will be relevant to the subsequent transition index result as a weighing factor.
First method is simply using the country’s share of fossil energy or simple TI (Eq. 6). The result is shown in Figure 5(a). This figure shows that all target countries are generally decarbonizing, indicated by the lower simple-TI value year by year. However, the remaining formulation of transition index shows a different result.
The responsibility adjusted transition index (Eq. 7) result is shown in Figure 5(b). This method resulted in the annual index of the US is steeper as compared to simple TI method. As for China, the index has now changed to increase, instead of decrease. This implies that China, despite has the fastest renewable energy installed capacity, is still ramping up its fossil fuel consumption. In fact, its energy consumption is accounted for 26.4% of world’s energy consumption in 2022 (Figure 4). Meanwhile, the US’ energy consumption, despite has the largest responsibility, is only accounted for 15.9% of the world’s energy consumption.
By weighing with share to global energy consumption (Eq. (8)), the result is shown in Figure 5(c). As compared to R-TI, this model emphasizes that the transition of country with higher share to global energy consumption matters more than that of lower share to global energy consumption. In this method, Brazil and Pakistan remain close to 0 since their energy consumption represents merely 2.2% and 0.5% of the world’s energy consumption, respectively. Germany, despite having an RI of 5% amounts merely 2.0% to world’s energy consumption, being therefore at the bottom of the chart. However, considering the Meanwhile, between the US and China, this method implies that the energy transition done by the US is undone by China. Their GES-TI is shown to crossed each other in 2008, so the effort done by the US since this year is practically cancelled by China’s fossil fuelled power plant ramping-up. The inverted global energy share-adjusted transition index (IGES-TI) that follows Eq. (9) is then shown in Figure 5(d). The main message remains the same as in the GES-TI method.
4.2.5. Energy Transition Progress
Lastly, we plotted in Figure 6 the resulted various schemes of transition indexes (TIs) against the responsibility-capacity index (RCI) from 1990 to 2022 to evaluate the fairness in energy transition progress made by target countries. The point of starting year of 1990 and the point of end year of 2022 is indicated in the plot. Additionally, a trendline is shown to indicate the direction. This plot shows how the energy transition state changes dynamically as each country’s change in terms of capacity and cumulative emission in annual basis.
These plots give an insight that China is going in the wrong direction of energy transition. Despite the share of fossil fuel consumption is reduced annually, its domestic energy consumption is increasing and as a result remains ramping up its CO2 emission. Brazil and Pakistan are both also in the wrong direction of energy transition, however their responsibility and share in global energy consumption are small. Despite the small amount, when other small countries with similar profile remains on the same pathway, the cumulative effect is not negligible. UK and Germany are both in the right direction, however their share in global energy consumption is smaller relative to US and China. Hence, their energy transition can become pointless if China remains in its current path. The US is going in the right direction.
It is shown that simple-TI is not a sufficient as an approach to evaluate the fairness of energy transition plotted against RCI. This is due to the fact that simple-TI simply use the fraction of fossil fuel from domestic energy consumption and does not weigh with metrics that considering its position in the global context.
4.2. Costs of Climate Disasters
Developing countries are generally the most affected by the aftereffects of climate change, although they have contributed the least to its genesis. These economic costs of disasters add extra burdens and complexity to investment in developing countries in climate mitigation and adaptation. This data would only enhance the argument for international climate finance mechanisms, such as the Green Climate Fund (GCF), which aims to provide financial assistance to countries that are least responsible for climate change but most affected by its impacts.
The determination of the cost imposed by climate-related disasters in Figure 7(a) brings out sharply the economic impact of climate change on different countries. The data shows that while absolute costs from disasters are much higher for developed countries like the United States and Germany, the relative impact on GDP is much higher for developing countries. For instance, a country like Pakistan has faced several extraordinary climate hazards causing enormous economic loss in the country due to floods and heatwaves. The cost of these disasters [61], when normalized to GDP, is shown in Figure 7(b). So, equity in energy transition has a very crucial component, which will see Pakistan and other similar nations completely miss out on its benefits.
Even though disaster costs in China are high, it is easier to cope with the fact that they have a growing and huge economy. However, data indicates that once climate-induced risk grows up to a certain level in China, the economic effect of disaster is likely to become more prominent than before. The implication, therefore, is that China needs to balance rapid industrial growth with investments in climate resilience and sustainable infrastructure. Developed nations, such as United States and Germany among others, are normally affected by higher absolute costs as their infrastructure is well developed; however, they have a high capacity for shock absorption since their economies are much stronger, as it can be seen in Figure 7.
Combining the trend in Figure 7 with the result from our proposed methodology above (section 4.1.) demonstrates wealthier countries (among all the USA) have a higher responsibility and capacity indexes, while also requiring a smaller share of their national GDP for climate mitigation costs. In turn, countries from the global south – e.g. Pakistan – burden a much lower responsibility (see Figure 2(b)) and are less capable of economically funding their domestic energy transition while suffering a much bigger economic pressure for funding climate-related disaster mitigation.
4.3. State of Climate Financing
4.3.1. Financing Received vs Required
As regards global climate finance, it is important to understand the levels of funding that different countries have accessed. Figure 8(a) shows the aggregates accessed by three large nations: Brazil, China, and Pakistan. In first place, we have Brazil with nearly USD 1.2 billion; in second place, China is receiving around USD 600 million, while Pakistan is poor with slightly above USD 200 million [62].
That discrepancy in shares should be expected: Brazil is a big player in global climate initiatives, whereas China enjoys a strong but somewhat lesser financial inflow, which might be due to growing economic self-reliance. The lower figure for Pakistan underscores the difficulties that many developing countries face: They are often more vulnerable to the impacts of climate change but less able to attract such large-scale investments.
Figure 8(b) represents the financial expectations mentioned in the respective nationally determined contributions (NDCs) to climate-related work for different countries. In this case, the climate finance expected for China exceeds others' expectations, which is far much higher than what is expected for the rest of the countries in the chart, such as the United Kingdom (UK), United States (US), Brazil, Pakistan, and Germany.
These figures indicate that an extremely large scale of climate-related challenges lie ahead in China, which would need huge financial investments to achieve climate goals. The UK and US are two other instances of developed countries showing a similarly high financial need, indicative of extensive climate action they continue to commit to for transition to climate neutrality. The much lower figure for countries such as Pakistan and Brazil further emphasize the difference in financial needs between developed and developing countries.
4.3.2. Pledged vs Deposited
Figure 9 shows the amount pledged by countries to global climate finance initiatives compared to amounts actually deposited. One striking point to note here is the remarkable difference in amounts between what has been pledged and actually deposited, particularly for big players like the US and UK. For example, whilst the US has pledged over USD 10 billion, it has merely deposited around half of that. At the same time, the UK, with a large pledge, has a gap of around 22.7% in deposited funds. A different approach using numeration based on fair share US$ 100 billion goal in [70], confirms the similar result: the US only contribute as much as 38%, and UK has contributed 68%. However, for Germany, it is reported to has contribute up to 173% to its fair share.
This gives rise to concerns that many industrialized countries may not show much commitment in delivering on climate finance, as has been recently seen in the COP29 held in Baku. The US’ fulfilment to its fair share may even get more concerning upon its second withdrawal from the Paris Agreement [71].
This clearly calls for monitoring and accountability mechanisms of critically important standards to ensure funds pledged become funds contributed. This underfunding has serious implications for the Global South, for which these funds are most needed, as shown in the cases of Brazil, China, and Pakistan, whose gaps, though smaller, are still very significant.
An interesting observation is made when the total pledges and deposits made by a selected group of countries in Figure 9 are seen in contrast with the RCI of countries in Figure 3(b). The US, while being in a much higher position than Germany and the United Kingdom in RCI, pledged almost the same as Germany and the UK and deposited even less than the deposits made by these countries. China, emerging as a rising entity in RCI in recent years, deposited very minimal amounts. This shows unfairness in terms of pledges and deposits made by countries.
An adjustment is made to put Germany’s contribution as the baseline for deposits made by the countries. The deposits of other countries are then defined in proportion to their RCI score relative to Germany. The result is shown in Figure 10. An interesting feature emerged: the UK’s deposits were reduced by a small margin in relation to its actual deposits because the UK sat at a lower position than Germany in RCI score.
5. Conclusions
Our analysis reveals critical insights into the state of responsibilities, capacities, energy transition and economic impacts associated with climate change across targeted countries. The analysis of financial data highlights the disparity between pledged and deposited funds, exposing significant funding gaps that hinder climate action. Additionally, an assessment of the required and received amounts by each country reveals discrepancies in the financial support for vulnerable nations compared to their actual needs. Lastly, an evaluation of the economic cost of climate-related disasters underscores the pressing need for greater resilience. The data, presented as both absolute figures and as a percentage of GDP, demonstrates the disproportionate burden on lower-income countries, accentuating the urgency of enhanced global cooperation and support. Together, these findings present a holistic view of climate responsibility, financial commitment, and economic vulnerability, underscoring the critical areas for action and support to mitigate future climate risks.
5.1. Implications to Global Climate Policy
The data in results section bears great relevance with respect to global climate policy. First and foremost, these dramatic differences in cumulative emissions and responsibility underline the necessity for leading developed nations to take a lead role in addressing these problems. A high Responsibility Index, such as the United States or Germany, would then give way to the argumentation for them to deeply reduce the volume of their present emissions and also financially and technologically support developing countries.
Second, the Capacity Index clearly suggested the necessity for a differentiated approach to climate action. Those developed countries or with higher capacity, including the United States, Germany, and China, should, for reasons of responsibility in historical and contemporary times, be ready to contribute more by their own volition towards global efforts to fight climate change. It means the principle of common but differentiated responsibilities and respective capabilities enshrined in the Paris Agreement.
Third, estimation of the costs of disaster further elucidates the extent to which developing countries are vulnerable to climate change. The economic cost of climate-related disasters in countries such as Pakistan and Brazil serve as a further imperative for climate finance mechanisms to provide these countries with resources for use in disaster recovery and insulating them from future damages. This is particularly necessary to make the energy transition just and, at the same time, effective in attending to the needs of the most vulnerable.
5.2. Implications to International Climate Finance
The key takeaways for international climate finance from the analysis in last section are on the received, required, pledged versus deposited amounts. Very clearly, the data shows a mismatch between financial needs and received amounts in developing countries. This also denotes a clear shortfall of the pledged and deposited funds by developed countries, raising questions regarding the effectiveness and reliability of the current climate finance mechanisms.
It is imperative for developed countries to enhance their pledges and ensure that the pledged amounts are delivered with due care for the energy transition to be fair, effective, and successful. Issues of financial needs in countries like China, the existing and developing gap of disparities between developing nations such as Pakistan, Brazil, and others have to be met with enhanced financial mechanisms. All such measures need to be undertaken, since the finance required for climate action to meet any target globally cannot be met from the sources that are currently mobilized.
Author Contributions
Conceptualization, Jihan Ahmad As-Sya’bani, Muhammad Zubair Abbas and Herena Torio; methodology, Jihan Ahmad As-Sya’bani, Muhammad Zubair Abbas; validation, Herena Torio; formal analysis, Jihan Ahmad As-Sya’bani, Muhammad Zubair Abbas; resources, Alzobaer Alshaeki; data curation, Alzobaer Alshaeki; writing—original draft preparation, Jihan Ahmad As-Sya’bani, Muhammad Zubair Abbas, Alzobaer Alshaeki; writing—review and editing, Jihan Ahmad As-Sya’bani, Herena Torio; visualization, Jihan Ahmad As-Sya’bani and Muhammad Zubair Abbas; supervision, Herena Torio; project administration, Herena Torio; funding acquisition, Herena Torio. All authors have read and agreed to the published version of the manuscript.
Funding
This research was funded through forschen@studium programme of the Carl von Ossietzky University of Oldenburg year 2024.
Data Availability Statement
All data used in this research is based on publicly available data sources as indicated in section 3.3.
Acknowledgments
This work is supported by Carl von Ossietzky University of Oldenburg under project number 02_SQFL_SoSe2024_STUD_PHY.
Conflicts of Interest
The authors declare no conflicts of interest. The funders had no role in the design of the study; in the collection, analyses, or interpretation of data; in the writing of the manuscript; or in the decision to publish the results.
Abbreviations
The following abbreviations are used in this manuscript:
| ADB | Asian Development Bank |
| CCPI | Climate Change performance Index |
| CDM | Clean Development Mechanism |
| COP | Commissions of Party |
| EAPI | Energy Architecture Performance Index |
| ETI | Energy Transition Index |
| ETM | Energy Transition Mechanism |
| EU | European Union |
| GCF | Green Climate Fund |
| GDP | Gross Domestic Product |
| GDR | Greenhouse Development Rights |
| GES-TI | Global Energy Share-Transition Index |
| GFI | Green Future Index |
| GHG | Greenhouse Gas |
| IGES-TI | Inverted Global Energy Share-Transition Index |
| JETP | Just Energy Transition Partnership |
| LCEI | Low Carbon Economy Index |
| NDC | Nationally Determined Contribution |
| NZEI | Net Zero Emission Index |
| RCI | Responsibility-Capacity Index |
| RI | Responsibility Index |
| RISE | Regulator Indicators for Sustainable Energy |
| TI | Transition Index |
| TJ | Terrajoules |
| UK | United Kingdom |
| US | United States of America |
| WB | World Bank |
| WEF | World Economic Forum |
References
- Callendar, G.S. The artificial production of carbon dioxide and its influence on temperature. Quarterly Journal of the Royal Meteorological Society 1938, Vol. 64 (275), pp. 223-240, . [CrossRef]
- Plass, G.N. The Carbon Dioxide Theory of Climatic Change. Tellus A 1956, Vol. 8(2), pp. 140-154, . [CrossRef]
- UNCED. 1992 United Nations Framework Convention on Climate Change. United Nations Conference on Environment and Development: Rio de Janeiro, Brazil, 1992, https://www.un.org/en/conferences/environment/rio1992.
- Hayes, P; Smith, K.R. Introduction. In The global greenhouse regime – Who pays?, 3rd ed.; Hayes, P., Smith, K.R; Earthscan: Abingdon, UK, 2013, pp. 3–19.
- Proposed Elements of a Protocol to the United Nations Framework Convention on Climate Change, Presented by Brazil in Response to the Berlin Mandate, Available online: https://unfccc.int/resource/docs/1997/agbm/03b.pdf (Accessed 17 April 2024).
- La Rovere, E.L.; de Macedo, L.V.; Baumert, K.A. 7. The Brazilian Proposal on Relative Responsibility for Global Warming. In Building on the Kyoto Protocol: Options for Protecting the Climate; Baumert, K.A., Blanchard, O., Llosa, S., Perkaus, J.F.; World Resources Institute: Washington DC, USA, 2002, Available online: https://www.wri.org/research/building-kyoto-protocol (Accessed on 21 April 2024).
- Friman, M.; Historical Responsibility in the UNFCCC, Centre for Climate Science and Policy Research: Linköping, Sweden, 2007. Available online: https://liu.diva-portal.org/smash/record.jsf?pid=diva2%3A233089&dswid=-9719 (accessed: 24 April 2024).
- Rosa, L.P.; Muylaert, M.P.; de Campos, C.P. The Brazilian Proposal and its Scientific and Methodological Aspects. International Virtual Institute for Sustainable Development: Manitoba, Canada, 2013. Available online: http://www.gci.org.uk/Documents/brazil.pdf (accessed on 20 April 2024).
- von Danwitz, T.; Ignorantia Legis Non Excusat, editorial, Journal of European Competition Law & Practice 2013, Vol. 4 (5), pp. 389–390, . [CrossRef]
- Crippa, M.; Guizzardi, D.; Pagani, F.; Banja, M.; Muntean, M.; Schaaf, E.; Monforti-Ferrario, F.; Becker, W.E.; Quadrelli, R.; Risquez Martin, A.; Taghavi-Moharamli, P.; Köykkä, J.; Grassi, G.; Rossi, S.; Melo, J.; Oom, D.; Branco, A.; San-Miguel, J.; Manca, G.; Pisoni, E.; Vignati, E. and Pekar, F. GHG emissions of all world countries, Publications Office of the European Union, Luxembourg, 2024, . [CrossRef]
- Ritchie, H.; Rosado, P; Roser, M; Breakdown of carbon dioxide, methane and nitrous oxide emissions by sector. Available online: https://ourworldindata.org/emissions-by-sector (accessed on 25 May 2024).
- Climate Watch Historical GHG Emissions, 2022, Washington, DC: World Resources Institute. Available online: https://www.climatewatchdata.org/ghg-emissions (Accessed on 25 May 2024).
- Dhakal, S., J.C. Minx, F.L. Toth, A. Abdel-Aziz, M.J. Figueroa Meza, K. Hubacek, I.G.C. Jonckheere, Yong-Gun Kim, G.F. Nemet, S. Pachauri, X.C. Tan, T. Wiedmann, 2022: Emissions Trends and Drivers. In IPCC, 2022: Climate Change 2022: Mitigation of Climate Change. Contribution of Working Group III to the Sixth Assessment Report of the Intergovernmental Panel on Climate Change [P.R. Shukla, J. Skea, R. Slade, A. Al Khourdajie, R. van Diemen, D. McCollum, M. Pathak, S. Some, P. Vyas, R. Fradera, M. Belkacemi, A. Hasija, G. Lisboa, S. Luz, J. Malley, (eds.)]. Cambridge University Press, Cambridge, UK and New York, NY, USA. [CrossRef]
- European Commission, France, Germany, UK, US and EU launch ground-breaking International Just Energy Transition Partnership with South Africa, Press Release 2021, https://ec.europa.eu/commission/presscorner/detail/en/ip_21_5768 (accessed on 15 September 2024).
- European Commission, The EU and International Partners launch ground-breaking Just Energy Transition Partnership with Indonesia, Press Release 2022, https://ec.europa.eu/commission/presscorner/detail/en/ip_22_6926 (accessed on 15 September 2024).
- European Commission, Joint Statement on the Launch of the Resource Mobilisation Plan for the Just Energy Transition Partnership with Viet Nam*, Press Release 2023, https://ec.europa.eu/commission/presscorner/detail/en/statement_23_6243 (Accessed: 15 September 2024).
- European Commission, The EU and the International Partners Group announced a Just Energy Transition Partnership with Senegal combining climate and development goals, Press Release 2023, https://ec.europa.eu/commission/presscorner/detail/en/ip_23_3448 (Accessed: 15 September 2024).
- Tharakan, P.; ETM Introduction, Asian Development Bank 2022, https://www.iges.or.jp/sites/default/files/inline-files/2_Tharakan_ETM%20Introductory%20Presentation%20External%20Feb%202022_IGES_Tharakan.pdf (Accessed 15 October 2024).
- Chennamaneni, L.; Schwarz, R. True Partnerships with India for a just transition, Policy Brief, Germanwatch: Bonn, Germany, 2023, https://www.germanwatch.org/de/89600.
- Sausmikat, N.; Polluters getting paid: The ADB’s Energy Transition Mechanism, Policy Brief, urgewald: Sassenberg, Germany, 2024, https://www.urgewald.org/en/shop/adb-etm.
- Jamieson, D. Climate Change and Global Environmental Justice. In Changing the Atmosphere: Expert Knowledge and Environmental Governance. Miller, C. A., Edwards, P. N., Eds; The MIT Press: Cambridge, MA, 2001, pp. 287-307. [CrossRef]
- Smith, K. R.; Swisher, J.; Ahuja, D. R.; Who pays (to solve the problem and how much)? In The global greenhouse regime - Who pays?, Hayes, P., Smith, K. Eds.; Earthscan: Oxon, UK, 1993.
- Caney, S. Justice and the distribution of greenhouse gas emissions. Journal of Global Ethics 2009, Vol. 5(2), pp.125-146. [CrossRef]
- Zellentin, A. Compensation for Historical Emissions and Excusable Ignorance. Journal of Applied Philosophy 2014, Vol. 32(3), pp. 258-274. [CrossRef]
- Godard, O. Ecological Debt and Historical Responsibility Revisited – The Case of Climate Change. EUI Working Paper RSCAS 2012/46; European University Institute: San Domenico di Fiesole, Italy, 2012. Available online: https://cadmus.eui.eu/handle/1814/23430.
- i Manzano, J. J.; Cardesa-Salzmann, A.; Pigrau, A.; Borras, S. Measuring environmental injustice: how ecological debt defines a radical change in the international legal system. Journal of Political Ecology 2016, Vol. 23(1), pp. 328-491. [CrossRef]
- CO₂ emissions per capita vs. GDP per capita, 2022. Available online: https://ourworldindata.org/grapher/co2-emissions-vs-gdp (Accessed 15 December 2024).
- Grüblr, A. Diffusion: Long-term patterns and discontinuities. Technological Forecasting and Social Change 1991, Vol. 39(1–2), pp.159–180. [CrossRef]
- Hirsh, R. F.; Jones, C. F. History’s contributions to energy research and policy. Energy Research & Social Science 2014, Vol.1, pp. 106–111. [CrossRef]
- Miller, C. A., Richter, J., & O’Leary, J. Socio-energy systems design: A policy framework for energy transitions. Energy Research & Social Science 2015, Vol. 6, pp. 29–40. [CrossRef]
- O’Connor, P. A. Energy Transitions. The Pardee Papers/No. 12/November 2010, Boston University The Frederick S. Pardee Center for the Study of the Longer-Range Future: Boston, USA, 2010; pp. 8-9. Available online: https://www.bu.edu/pardee/pardee-paper-012-energy/.
- Fouquet, R., & Pearson, P. J. G. Past and prospective energy transitions : Insights from history. Energy Policy 2012, Vol. 50, pp.1–7. [CrossRef]
- Smil, V. Energy Myths and Realities: Bringing Science to the Energy Policy Debate. The AEI Press: Washington, D.C., USA, 2010. p.138. https://www.aei.org/wp-content/uploads/2019/02/Energy-Myths-and-Realities.pdf.
- Fouquet, R. Historical energy transitions: Speed, prices and system transformation. Energy Research & Social Science 2016, Vol. 22, pp. 7–12. [CrossRef]
- Sovacool, B. K. How long will it take? Conceptualizing the temporal dynamics of energy transitions. Energy Research & Social Science 2016, Vol. 13, pp.202–215. [CrossRef]
- Baker, S.; DeVar, S.; Prakash, S. The Energy Justice Workbook. Initiative for Energy Justice: Boston, USA, 2019. https://iejusa.org/workbook/.
- Heffron, R.J.; Merdekawati, M.; Suryadi, B.; Yurnaidi, Z. Defining a ‘Just Energy Investment’ for the ASEAN Just Transition. Environmental and Sustainability Indicators 2024, Vol. 22, pp. 1-11. [CrossRef]
- Carley, S.; Konisky, D.M. The justice and equity implications of the clean energy transition. Nature Energy 2020. Vol. 5, pp. 569–577. [CrossRef]
- Moser, S.C., SOCIAL INDICATORS—SYSTEMS, METHODS AND PROBLEMS. The Review of Income & Wealth 1973, Vol. 19(2), pp. 133-141. [CrossRef]
- OECD, European Union and European Commission, Joint Research Centre. Handbook on Constructing Composite Indicators: Methodology and User Guide. OECD Publishing: Paris, France. 2008. [CrossRef]
- Baer, P.; Kartha, S.; Athanasiou, T.; Kemp-Benedict, E. The Greenhouse Development Rights Framework: Drawing Attention to Inequality within Nations in the Global Climate Policy Debate. Development and Change 2009, 40(6), pp. 1121–1138. [CrossRef]
- O’Brien, R.; Beatty, C.; Ruma, L.; Crepaldi, N. The Green Future Index 2021. MIT Technology Review: Massachusetts, USA, 2021. Available online: https://www.technologyreview.com/2021/01/25/1016648/green-future-index/.
- O’Brien, R.; Brosnahan, M.; Crepaldi, N.; Conteh, N. The Green Future Index 2023. MIT Technology Review Insights: Cambridge, Massachusetts, USA, 2023 Available online: https://www.technologyreview.com/2023/04/05/1070581/the-green-future-index-2023/ (accessed 7 May 2024).
- Burck, J.; Bals, C.; Wittger, B.; Beck M. The Climate Change Performance Index. Germanwatch: Berlin, Germany, 2007. Available online: https://ccpi.org/download/climate-change-performance-index-2007/ (Last accessed: 15 July 2024).
- Burck, J.; Uhlich T.; Höhne, N.; Bals, C.; Nascimento, L. Background and Methodology. Germanwatch: Berlin, Germany, 2023. Available online: https://ccpi.org/methodology/ (Last accessed: 12 July 2024).
- World Economic Forum. Fostering Effective Energy Transition 2024. World Economic Forum: Geneva, Switzerland, 2024, Available online: https://www3.weforum.org/docs/WEF_Fostering_Effective_Energy_Transition_2024.pdf (accessed: 13 September 2024).
- World Economic Forum. Global Energy Architecture Performance Index Report 2013. World Economic Forum: Geneva, Switzerland, 2013. Available online: https://www.weforum.org/publications/global-energy-architecture-performance-index-report-2013 (Last access: 13 Jun. 2024).
- World Economic Forum. Fostering Effective Energy Transition. World Economic Forum: Geneva, Switzerland, 2018. Available online: https://www.weforum.org/publications/fostering-effective-energy-transition (Last access: 13 Jun. 2024).
- PwC. Low Carbon Economy Index. PricewaterhouseCoopers LLP: London, UK, 2009. Available online: https://www.pwc.com/gx/en/sustainability/publications/low-carbon-economy-index/assets/low-carbon-economy-index.pdf (Last accessed: 9 July 2024).
- Cox, E.; Dowling, D.; King, J.; Huntley, J.; Agu, F.; Hadjichristou, C. Net Zero Economy Index 2021, Code Red To Go Green. PricewaterhouseCoopers LLP: London, UK, 2019. Available online: https://www.pwc.co.uk/sustainability-climate-change/pdf/net-zero-economy-index-2021.pdf (accessed: 9 August 2024).
- PwC. Net Zero Economy Index 2023. PricewaterhouseCoopers LLP: London, UK, 2023. Available online: https://www.pwc.co.uk/services/sustainability-climate-change/insights/net-zero-economy-index.html (Last Access: 9 Jun 2024).
- Banerjee, S.G.; Moreno, A.; Sinton, J.; Primiano, T.; Seong, J. Regulatory Indicators for Sustainable Energy - A Global Scorecard for Policy Makers. World Bank Group: Washington DC, USA, 2017. Available online: http://documents.worldbank.org/curated/en/538181487106403375/Regulatory-indicators-for-sustainable-energy-a-global-scorecard-for-policy-makers.
- Urpelainen, J. RISE to the occasion? A critique of the World Bank’s Regulatory Indicators for Sustainable Energy. Energy Reserach & Social Science 2018, Vol. 39, pp. 69-73. [CrossRef]
- Radaelli, C. M. Diffusion without convergence – How political context shapes the adoption of regulatory impact assessment. In Cross-national Policy Convergence. Knill, C. Eds.; Routledge: London, UK, 2006; [CrossRef]
- Short, J. R.; Martinez, L. The urban effects of the emerging middle class in the global south. Geography Compass 2020. Vol. 14(4). P.e12484. [CrossRef]
- Ballantyne, A.P.; Alden, C.B.; Miller, J.B. ; Tans, P. P.; White W.C. Increase in observed net carbon dioxide uptake by land and oceans during the past 50 years. Nature 2012, Vol. 488, pp. 70-72. [CrossRef]
- Ritchie, H.; Roser, M. CO2 emissions, Our World in Data 2020.Available online: https://ourworldindata.org/co2-emissions (accessed on 21 Apr. 2024).
- GDP per capita (current US$). Available online: https://data.worldbank.org/indicator/NY.GDP.PCAP.CD (accessed 21 Apr. 2024).
- GDP (current US$). Available online: https://data.worldbank.org/indicator/NY.GDP.MKTP.CD (accessed 21 Apr. 2024).
- IRENASTAT. Available online: https://www.irena.org/Data/Downloads/IRENASTAT (accessed 27 Apr. 2024).
- Disaster Costs. Available online: https://public.emdat.be/data (accessed 8 June 2024).
- GCF Funded Activities. Available online: https://data.greenclimate.fund/public/data/projects (accessed 1 may 2024).
- Climate Funds Data Dashboard. Available online: https://climatefundsupdate.org/data-dashboard/ (accessed 9 July 2024).
- The update of the nationally determined contribution of the European Union and its Member States, Available online:https://unfccc.int/sites/default/files/NDC/2023-10/ES-2023-10-17%20EU%20submission%20NDC%20update.pdf (accessed).
- Pakistan Updated Nationally Determined Contributions, Available online: https://unfccc.int/sites/default/files/NDC/2022-06/Pakistan%20Updated%20NDC%202021.pdf (accessed ).
- Brazil’s NDC – National determination to contribute and transform, available online: https://unfccc.int/sites/default/files/2024-11/Brazil_Second%20Nationally%20Determined%20Contribution%20%28NDC%29_November2024.pdf.
- The United States of America Nationally Determined Contribution – Reducing Greenhouse Gases in the United States: A 2030 Emissions Target. Available online: https://unfccc.int/sites/default/files/NDC/2022-06/United%20States%20NDC%20April%2021%202021%20Final.pdf.
- United Kingdom of Great Britain and Northern Ireland’s Nationally Determined Contribution. Available online: https://unfccc.int/sites/default/files/NDC/2022-09/UK%20NDC%20ICTU%202022.pdf.
- China’s Achievements, New Goals and New Measures for Nationally Determined Contributions (unofficial translation). Available online: https://unfccc.int/sites/default/files/NDC/2022-06/China%E2%80%99s%20Achievements%2C%20New%20Goals%20and%20New%20Measures%20for%20Nationally%20Determined%20Contributions.pdf.
- Pettinotti, L., Kamninga, T. and Colenbrander, S. (2024) A fair share of climate finance? The collective aspects of the New Collective Quantified Goal. ODI Working Paper. London: ODI (https://odi.org/en/publications/a-fair-share-of-climate-finance-the-collective-aspects-of-the-ncqg).
- Lazarou, E., Leclerc, G. US withdrawal from the Paris Climate Agreement and from the WHO. EPRS - European Parliamentary Research Service No. PE 767.230 – February 2025. Available online: https://www.europarl.europa.eu/RegData/etudes/ATAG/2025/767230/EPRS_ATA(2025)767230_EN.pdf (Last Access: 28 February 2024).
Figure 1.
Research flow in the assessment of global fairness in energy transition.
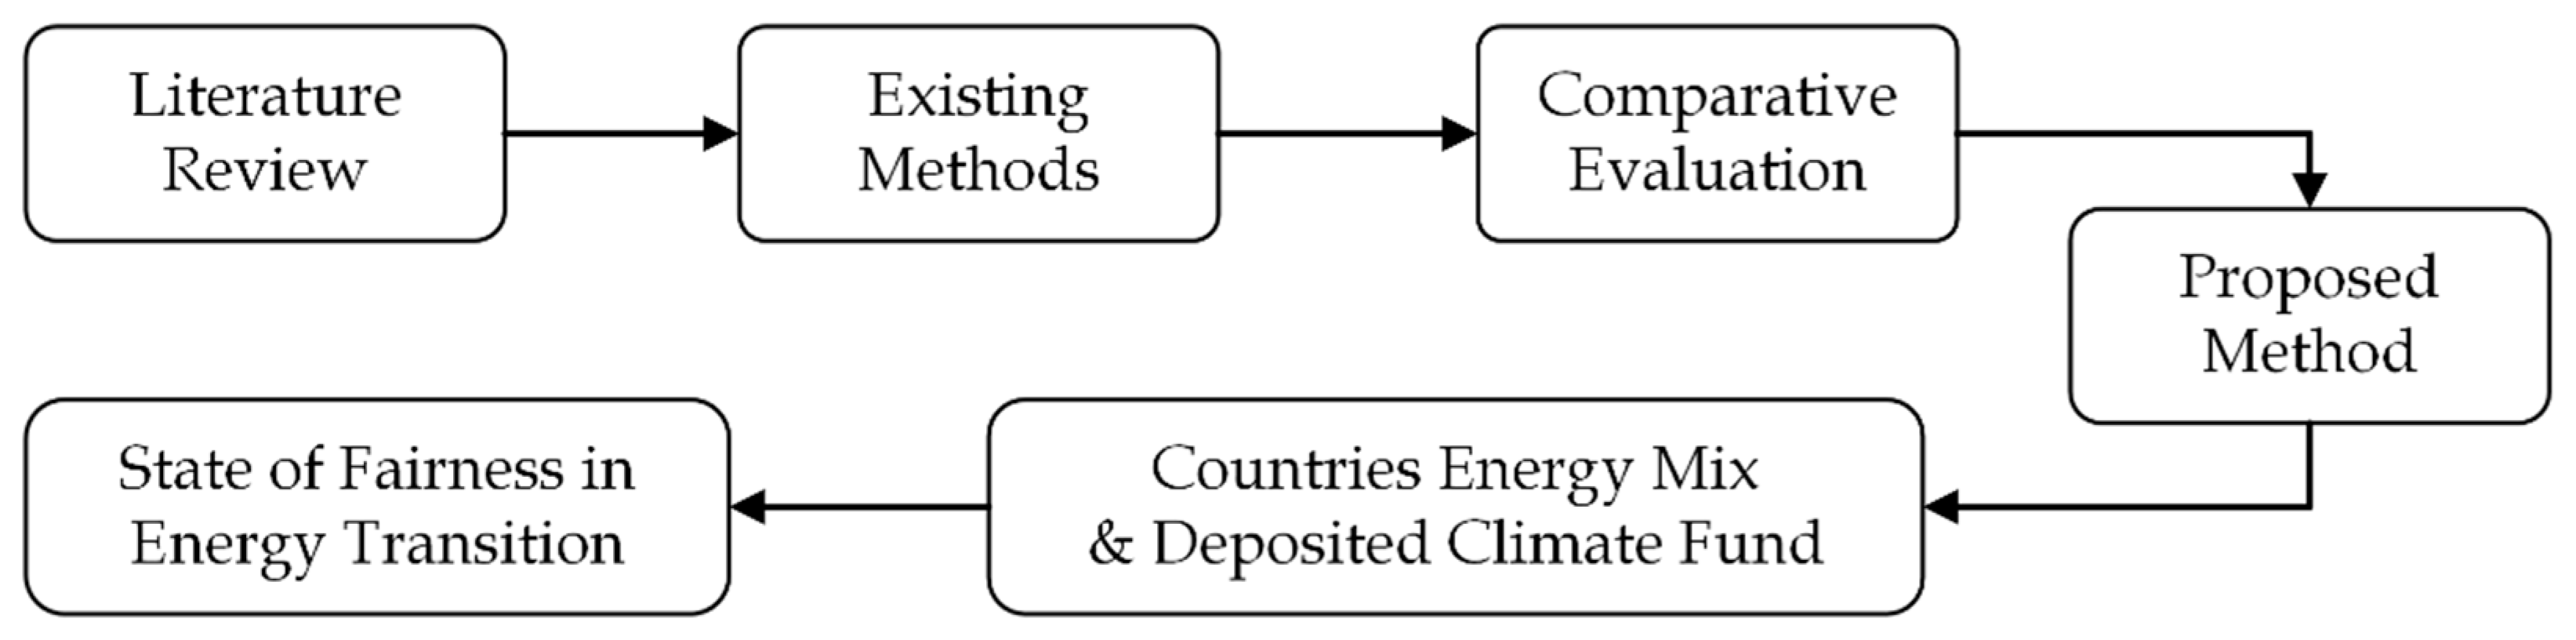
Figure 2.
(a) Recorded cumulative emission (Reprinted from ref. [57]) and (b) the associated responsibility index from Eq. 2 for United States, China, Germany, Brazil, Pakistan, and United Kingdom from 1800 to 2022.
Figure 2.
(a) Recorded cumulative emission (Reprinted from ref. [57]) and (b) the associated responsibility index from Eq. 2 for United States, China, Germany, Brazil, Pakistan, and United Kingdom from 1800 to 2022.
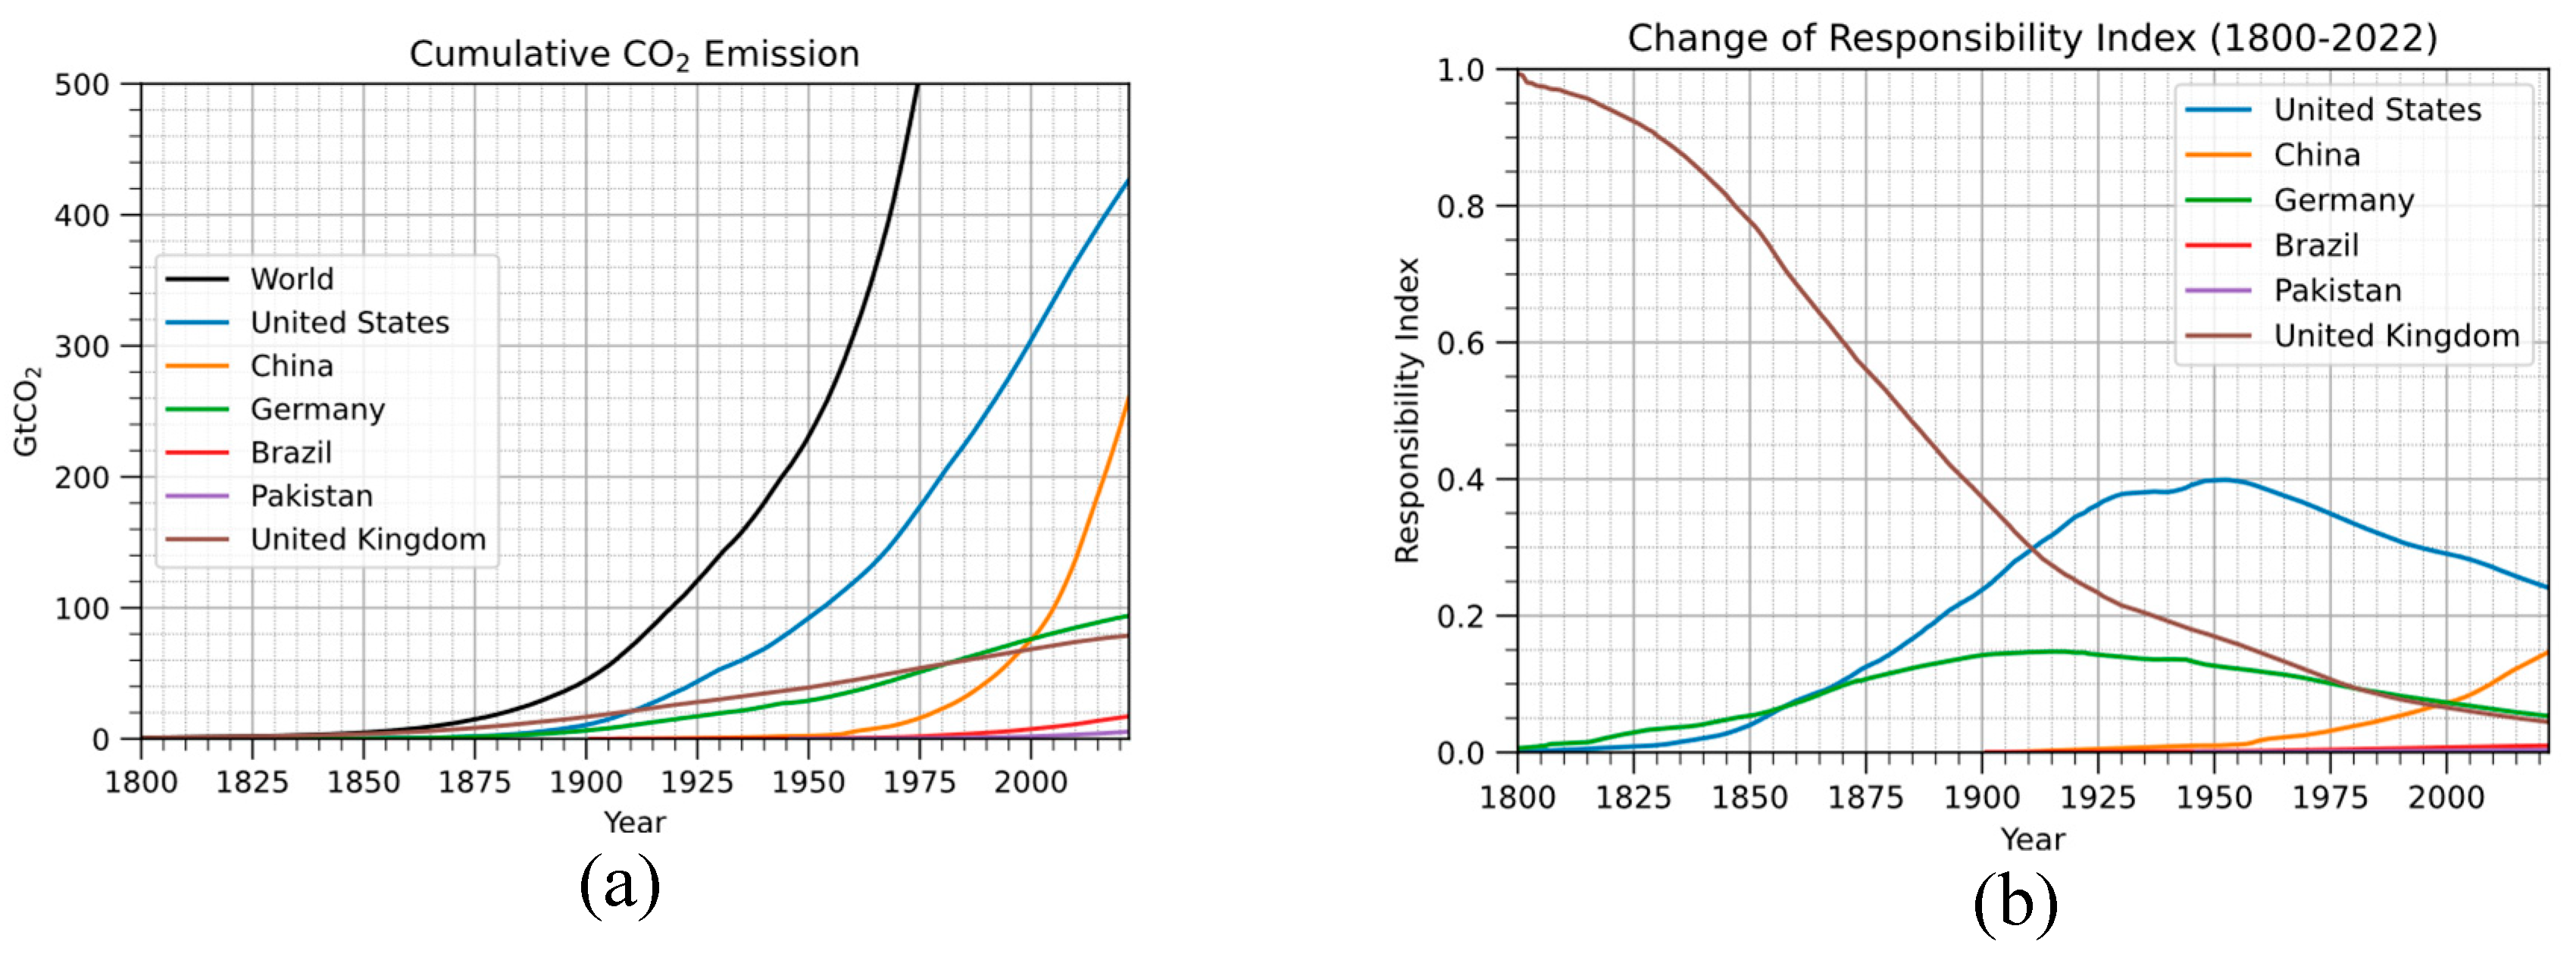
Figure 3.
(a) Adjusted Capacity Index for selected group of countries based on Eq. (4), (b) Responsibility-Capacity Index for selected group of countries based on Eq. (5).
Figure 3.
(a) Adjusted Capacity Index for selected group of countries based on Eq. (4), (b) Responsibility-Capacity Index for selected group of countries based on Eq. (5).
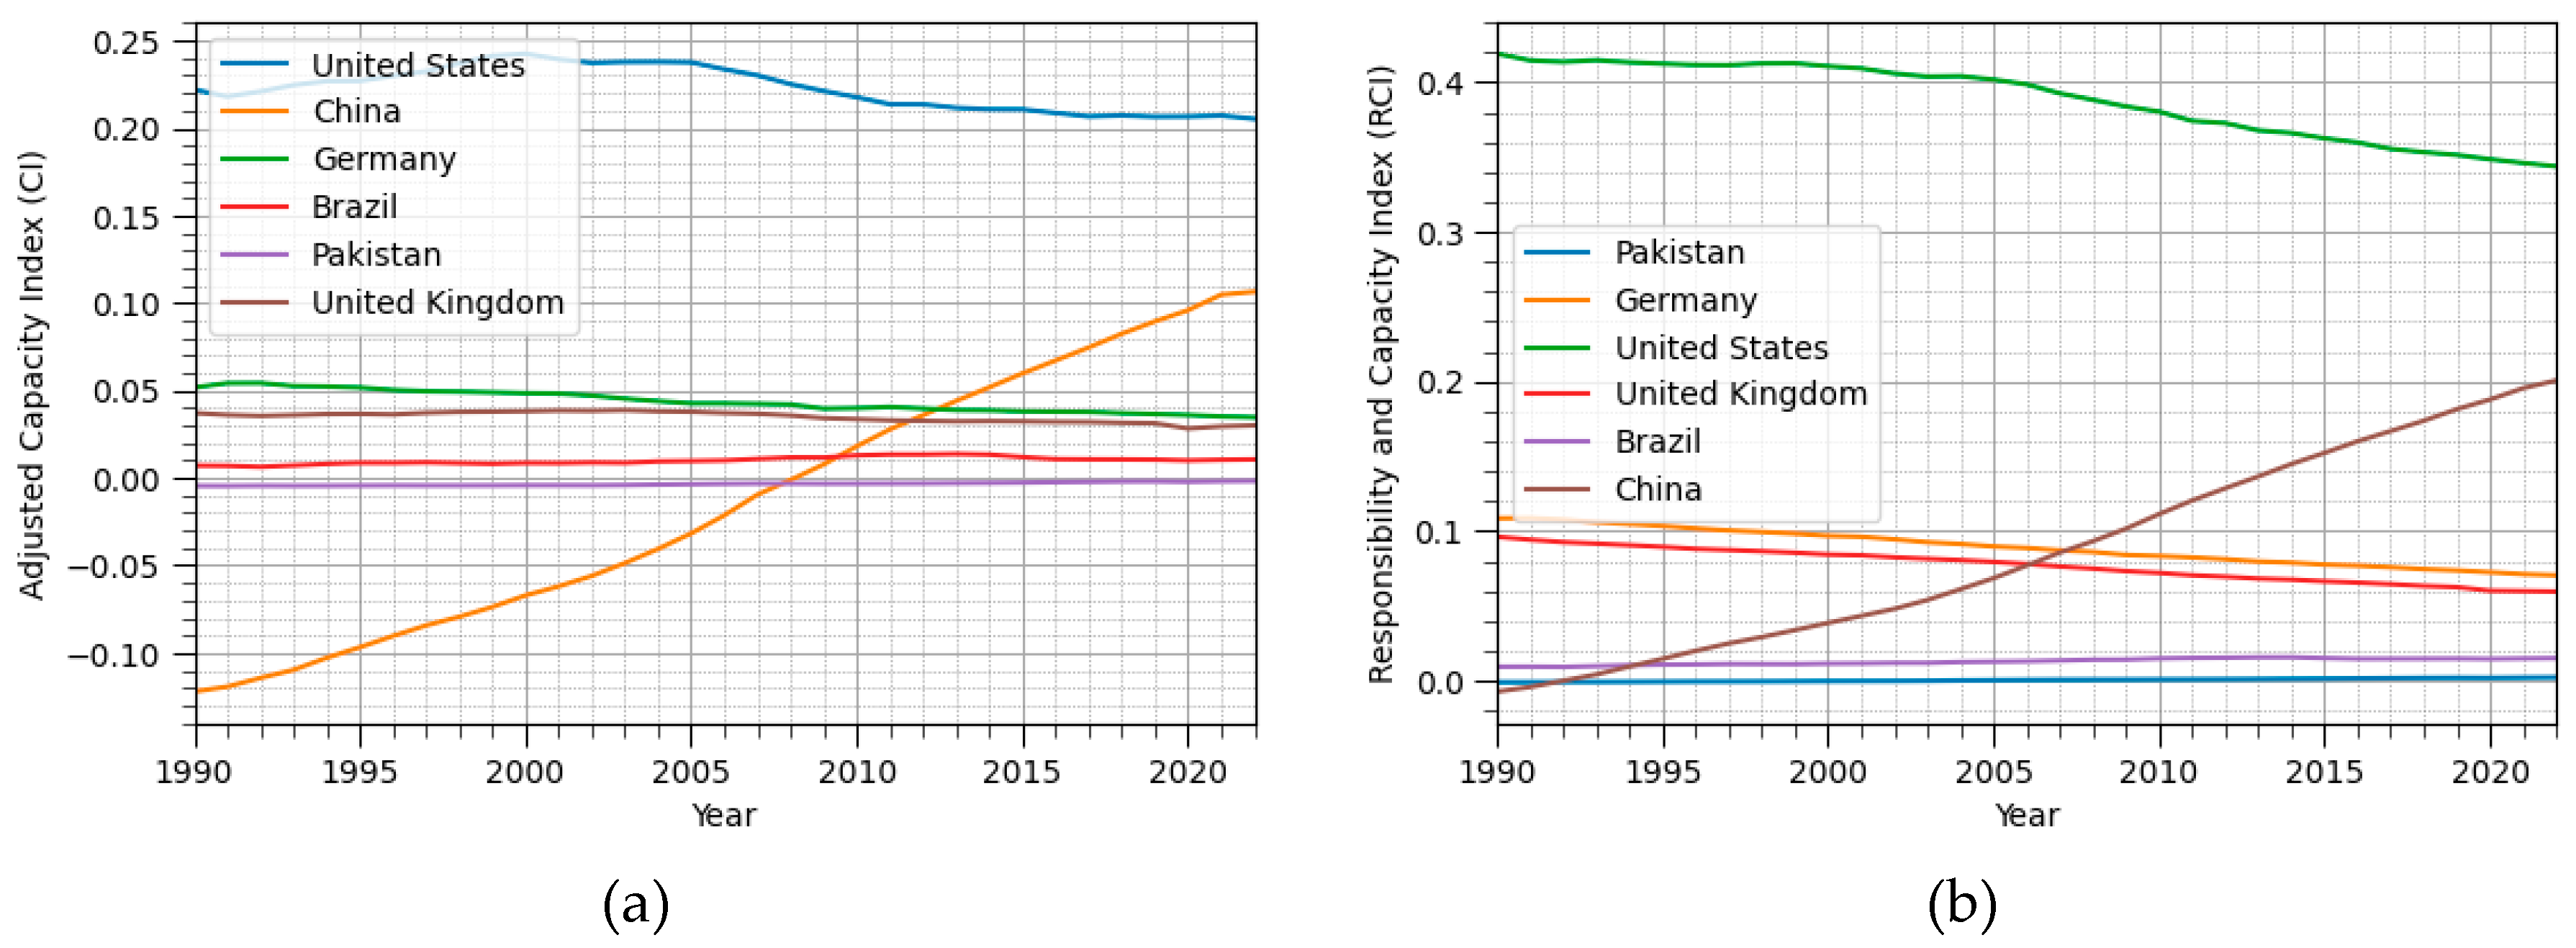
Figure 4.
Share to world energy consumption from each target country (Reprinted from ref. [60]).
Figure 4.
Share to world energy consumption from each target country (Reprinted from ref. [60]).
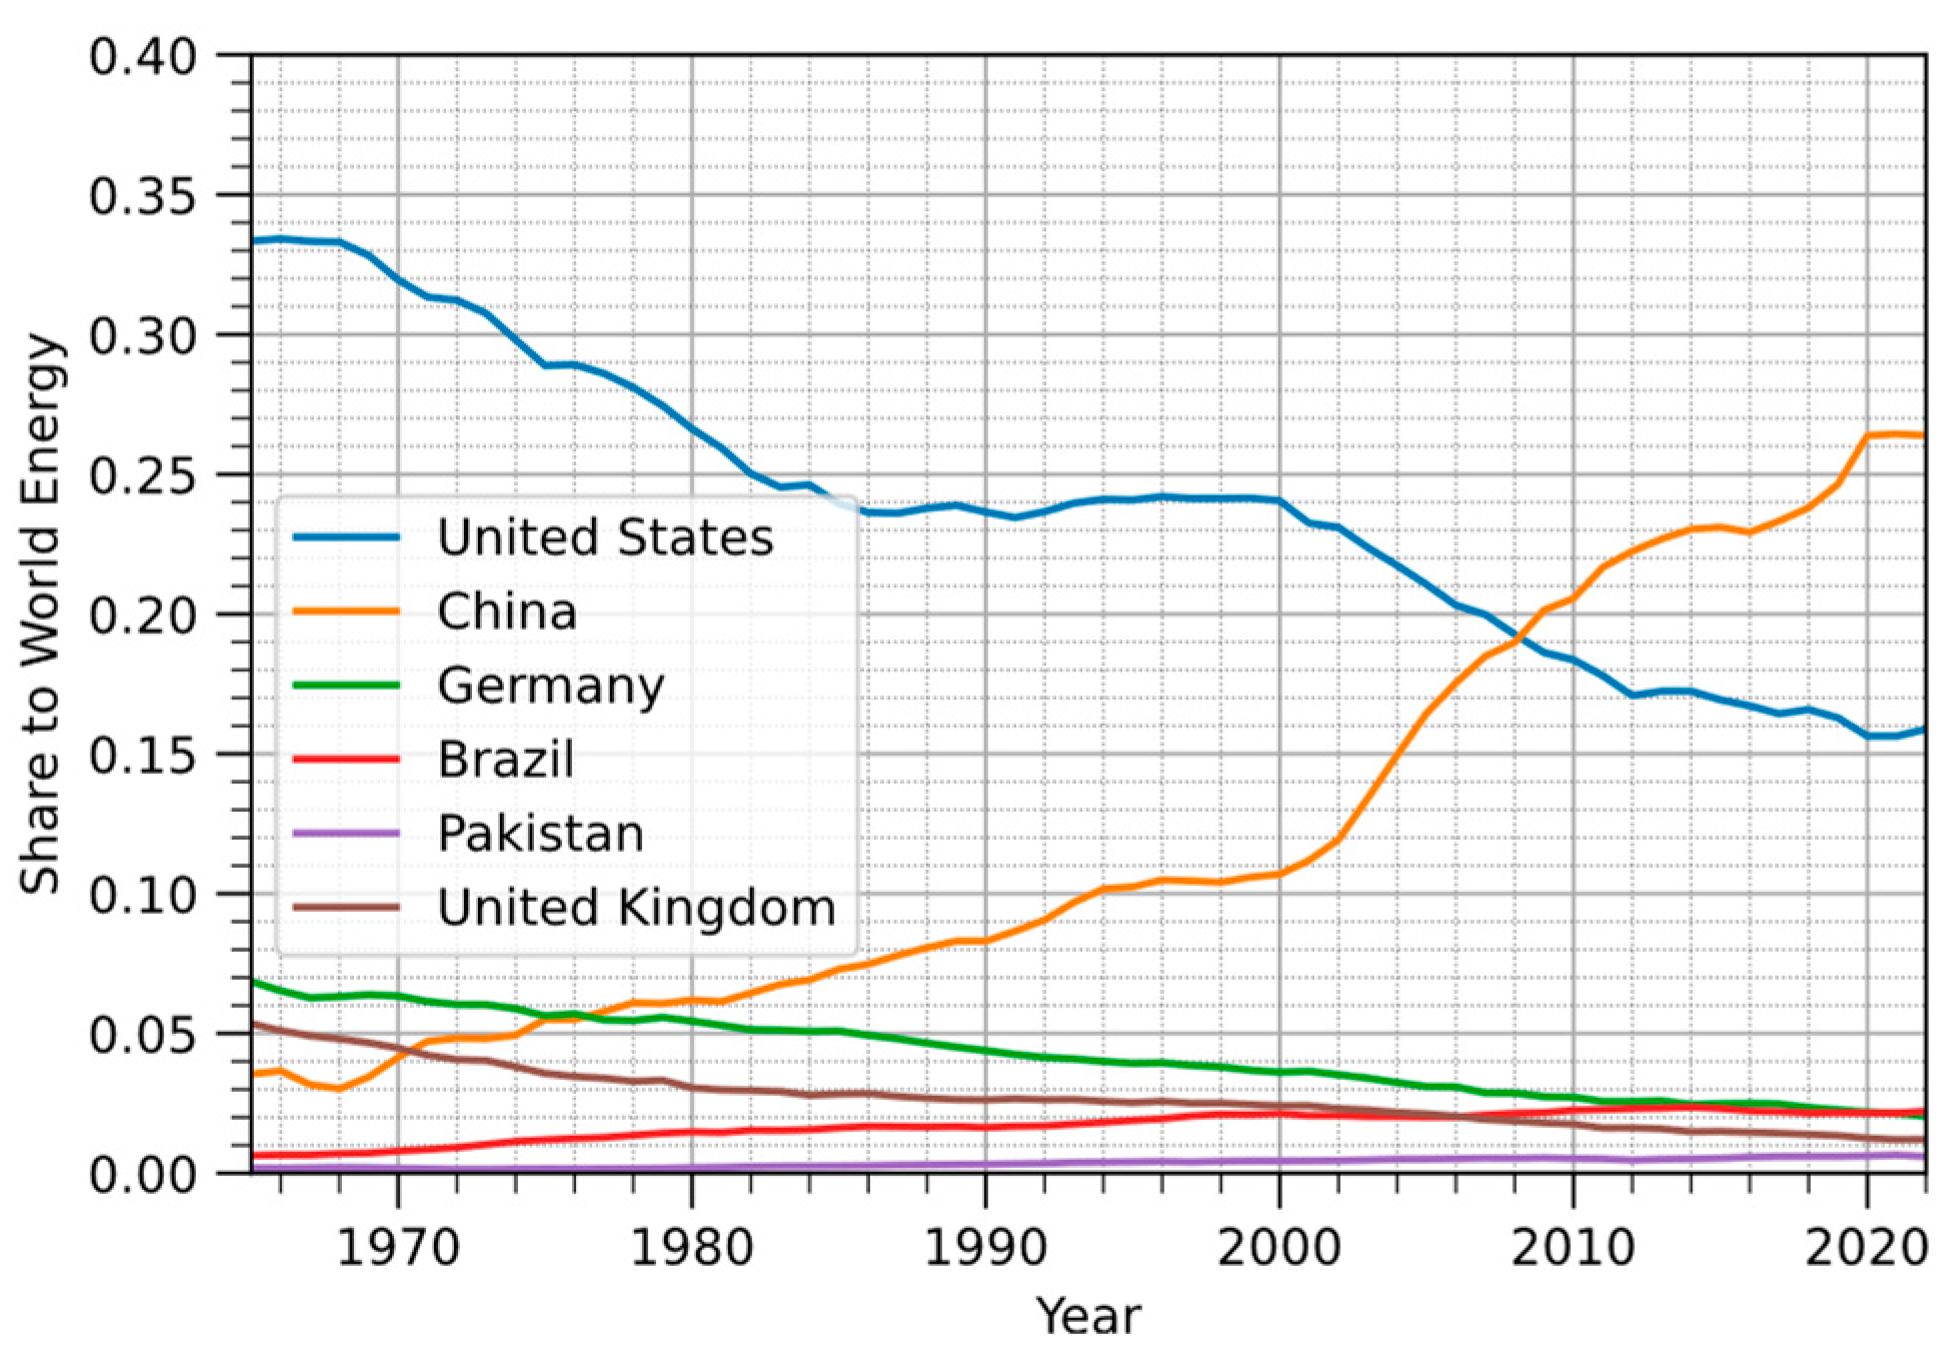
Figure 5.
Comparison of various transition index model: (a) simple TI, (b) responsibility-adjusted (R-TI), (c) global energy share-adjusted (GES-TI), and (d) inverted global energy share-adjusted (IGES-TI).
Figure 5.
Comparison of various transition index model: (a) simple TI, (b) responsibility-adjusted (R-TI), (c) global energy share-adjusted (GES-TI), and (d) inverted global energy share-adjusted (IGES-TI).
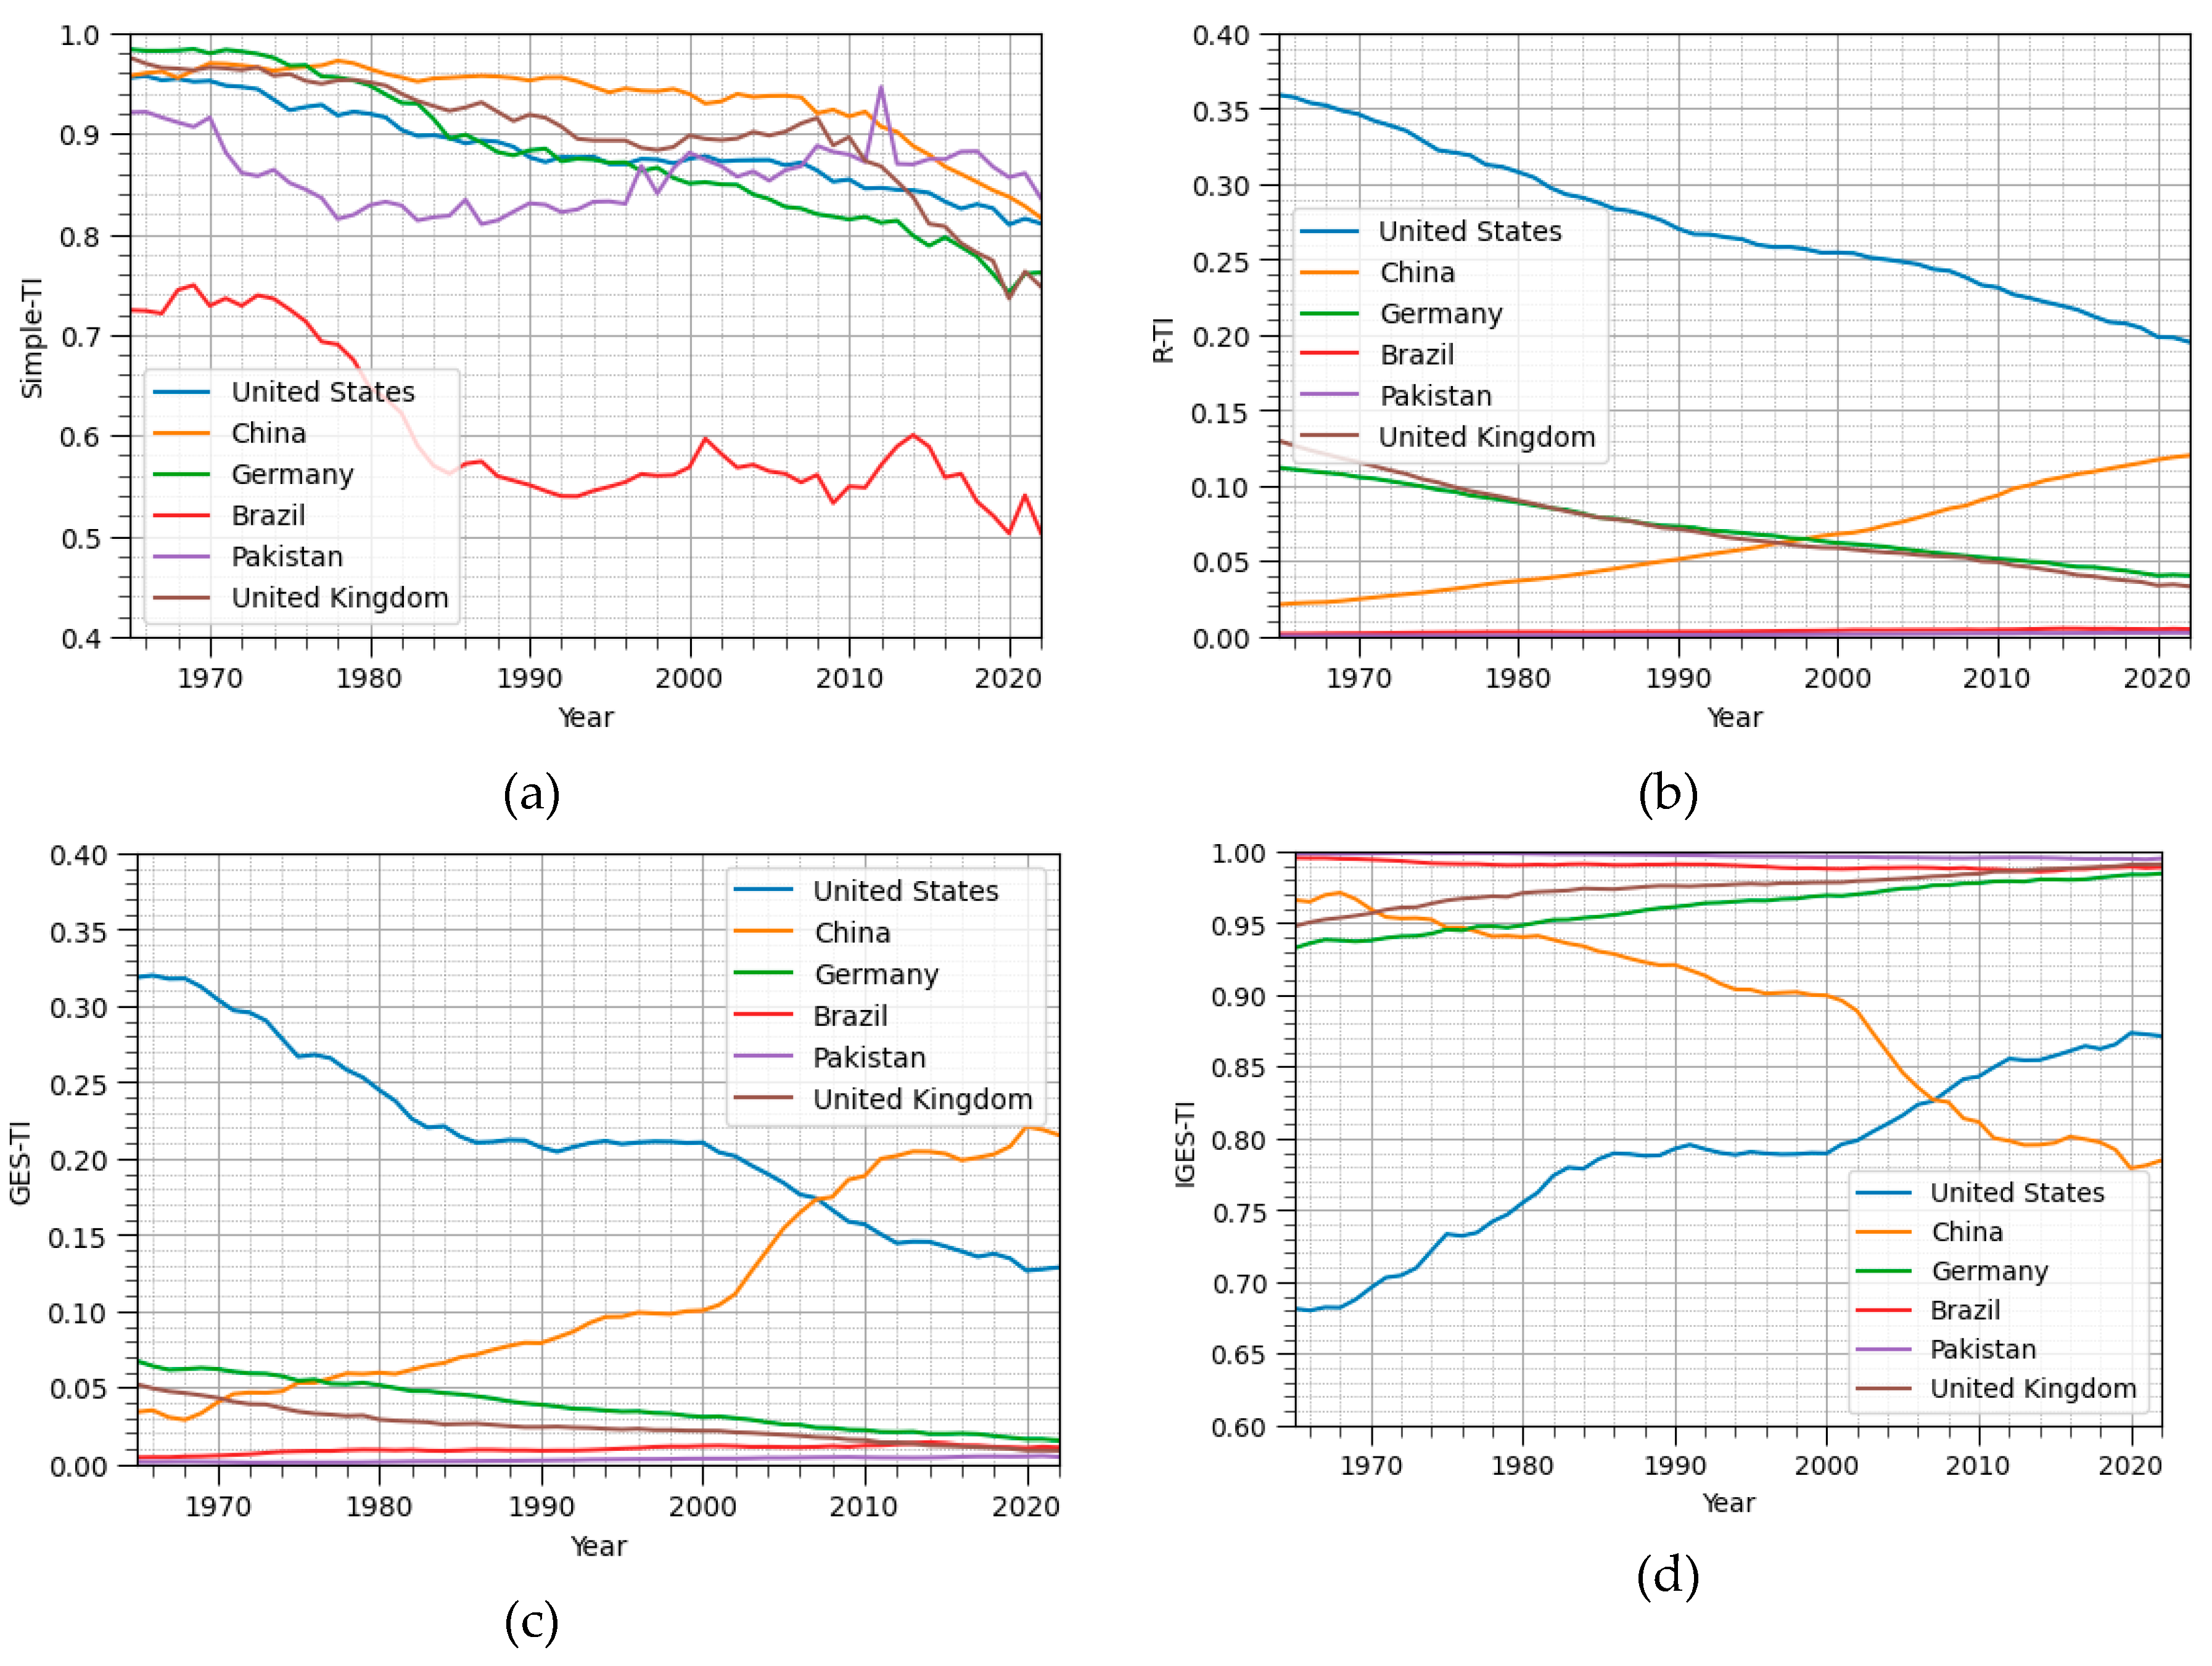
Figure 6.
Various transition index schemes against responsibility-capacity index (RCI).
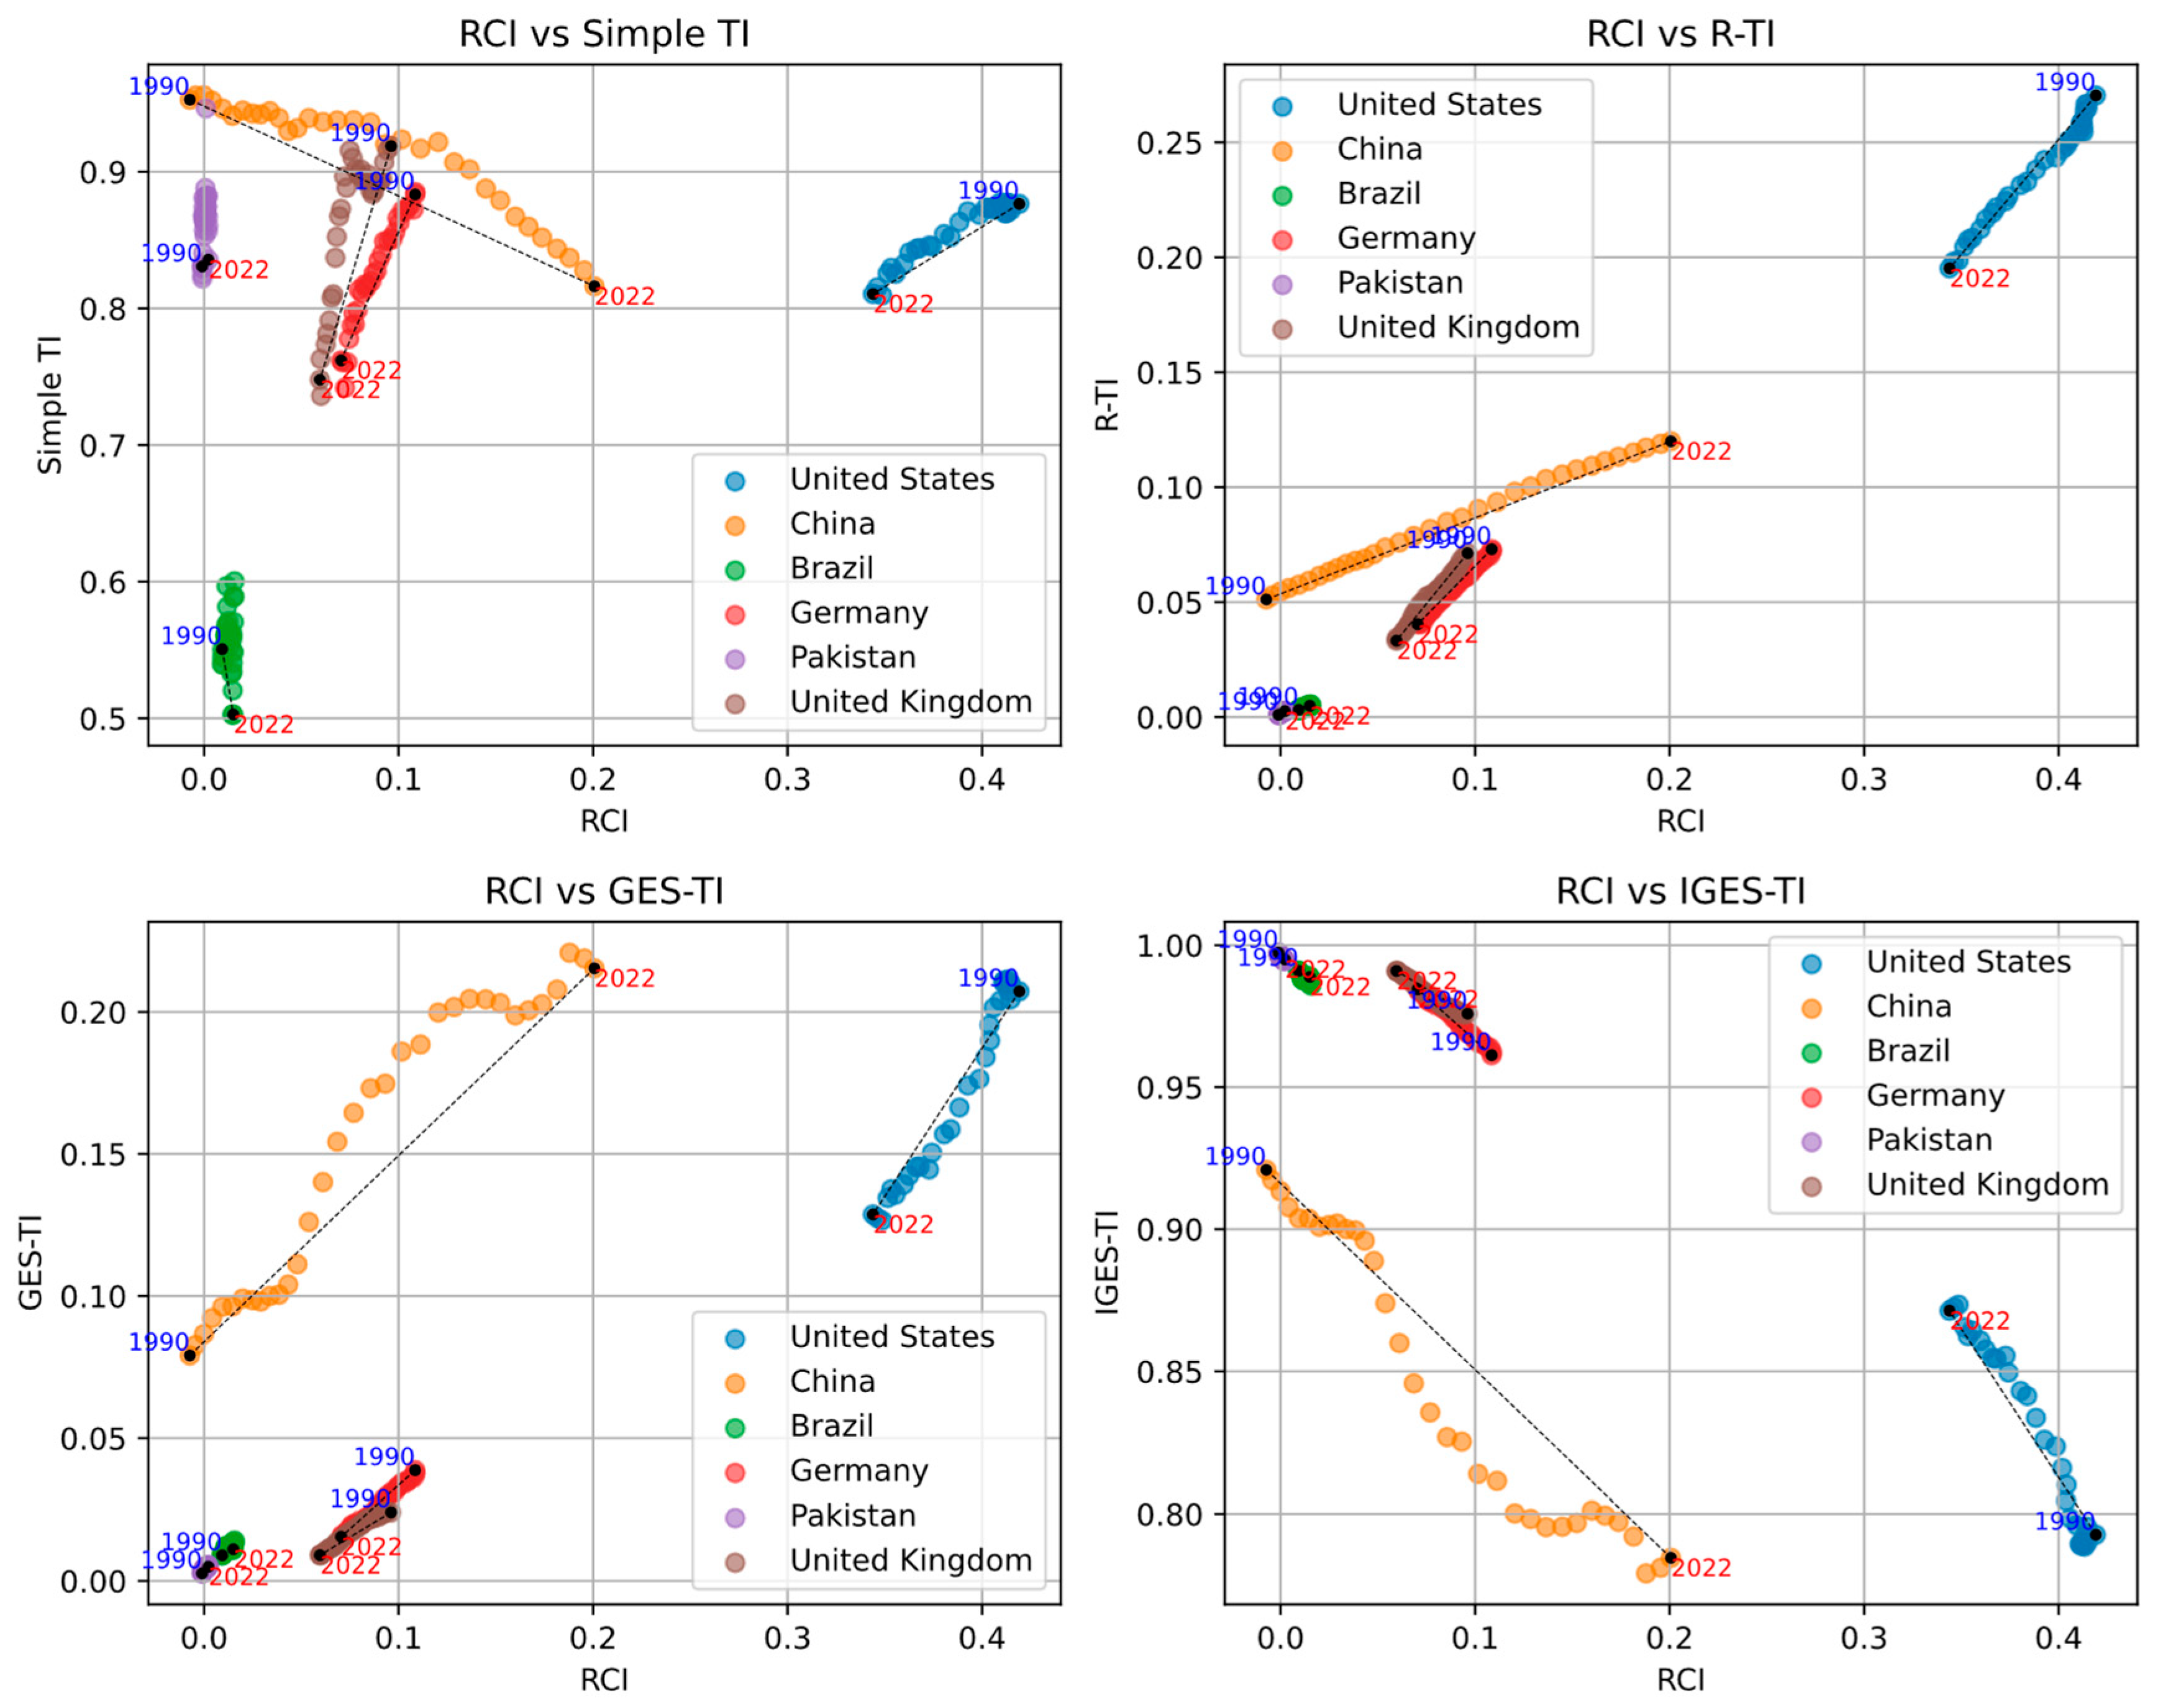
Figure 7.
Costs of disasters over the years in selected groups of countries: (a) in USD (Reprinted from ref. [61]) and (b) as percentage of GDP.
Figure 7.
Costs of disasters over the years in selected groups of countries: (a) in USD (Reprinted from ref. [61]) and (b) as percentage of GDP.
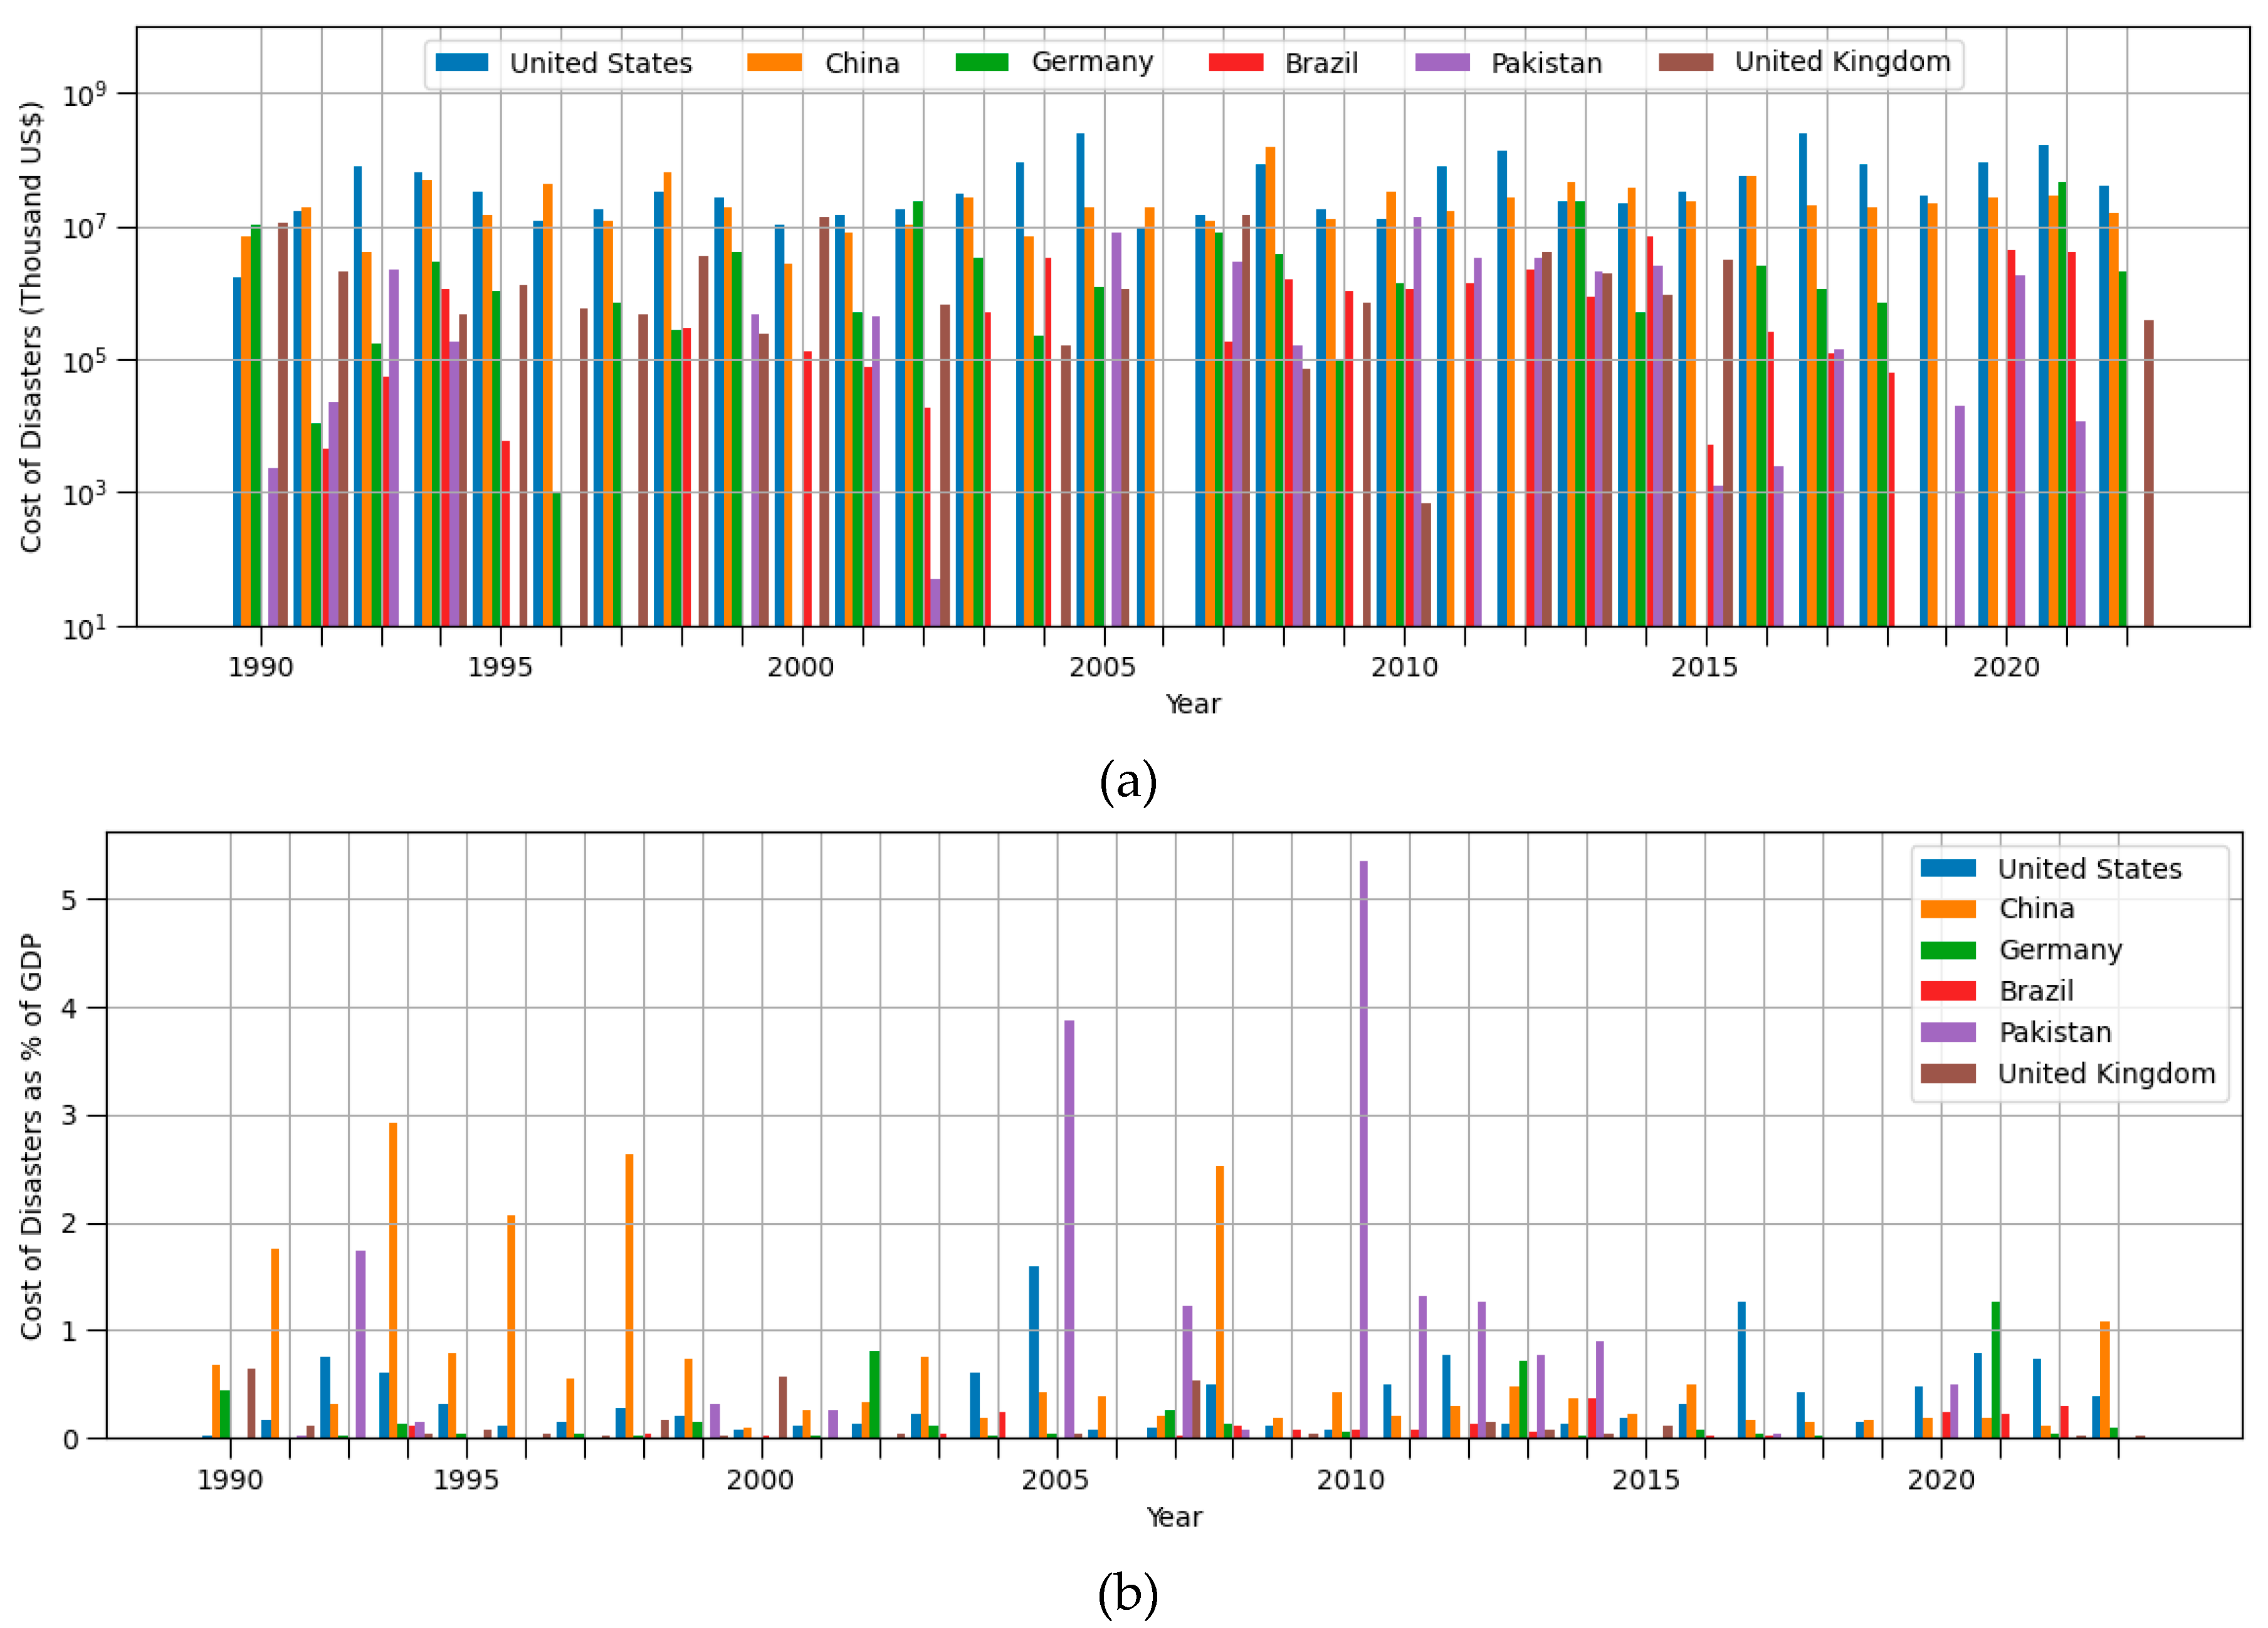
Figure 8.
(a) Total received amounts by country through Green Climate Fund (GCF) (Reprinted from ref. [62]) and (b) Financing needed for climate mitigation (Reprinted from ref. [65,66,67,68,69]).
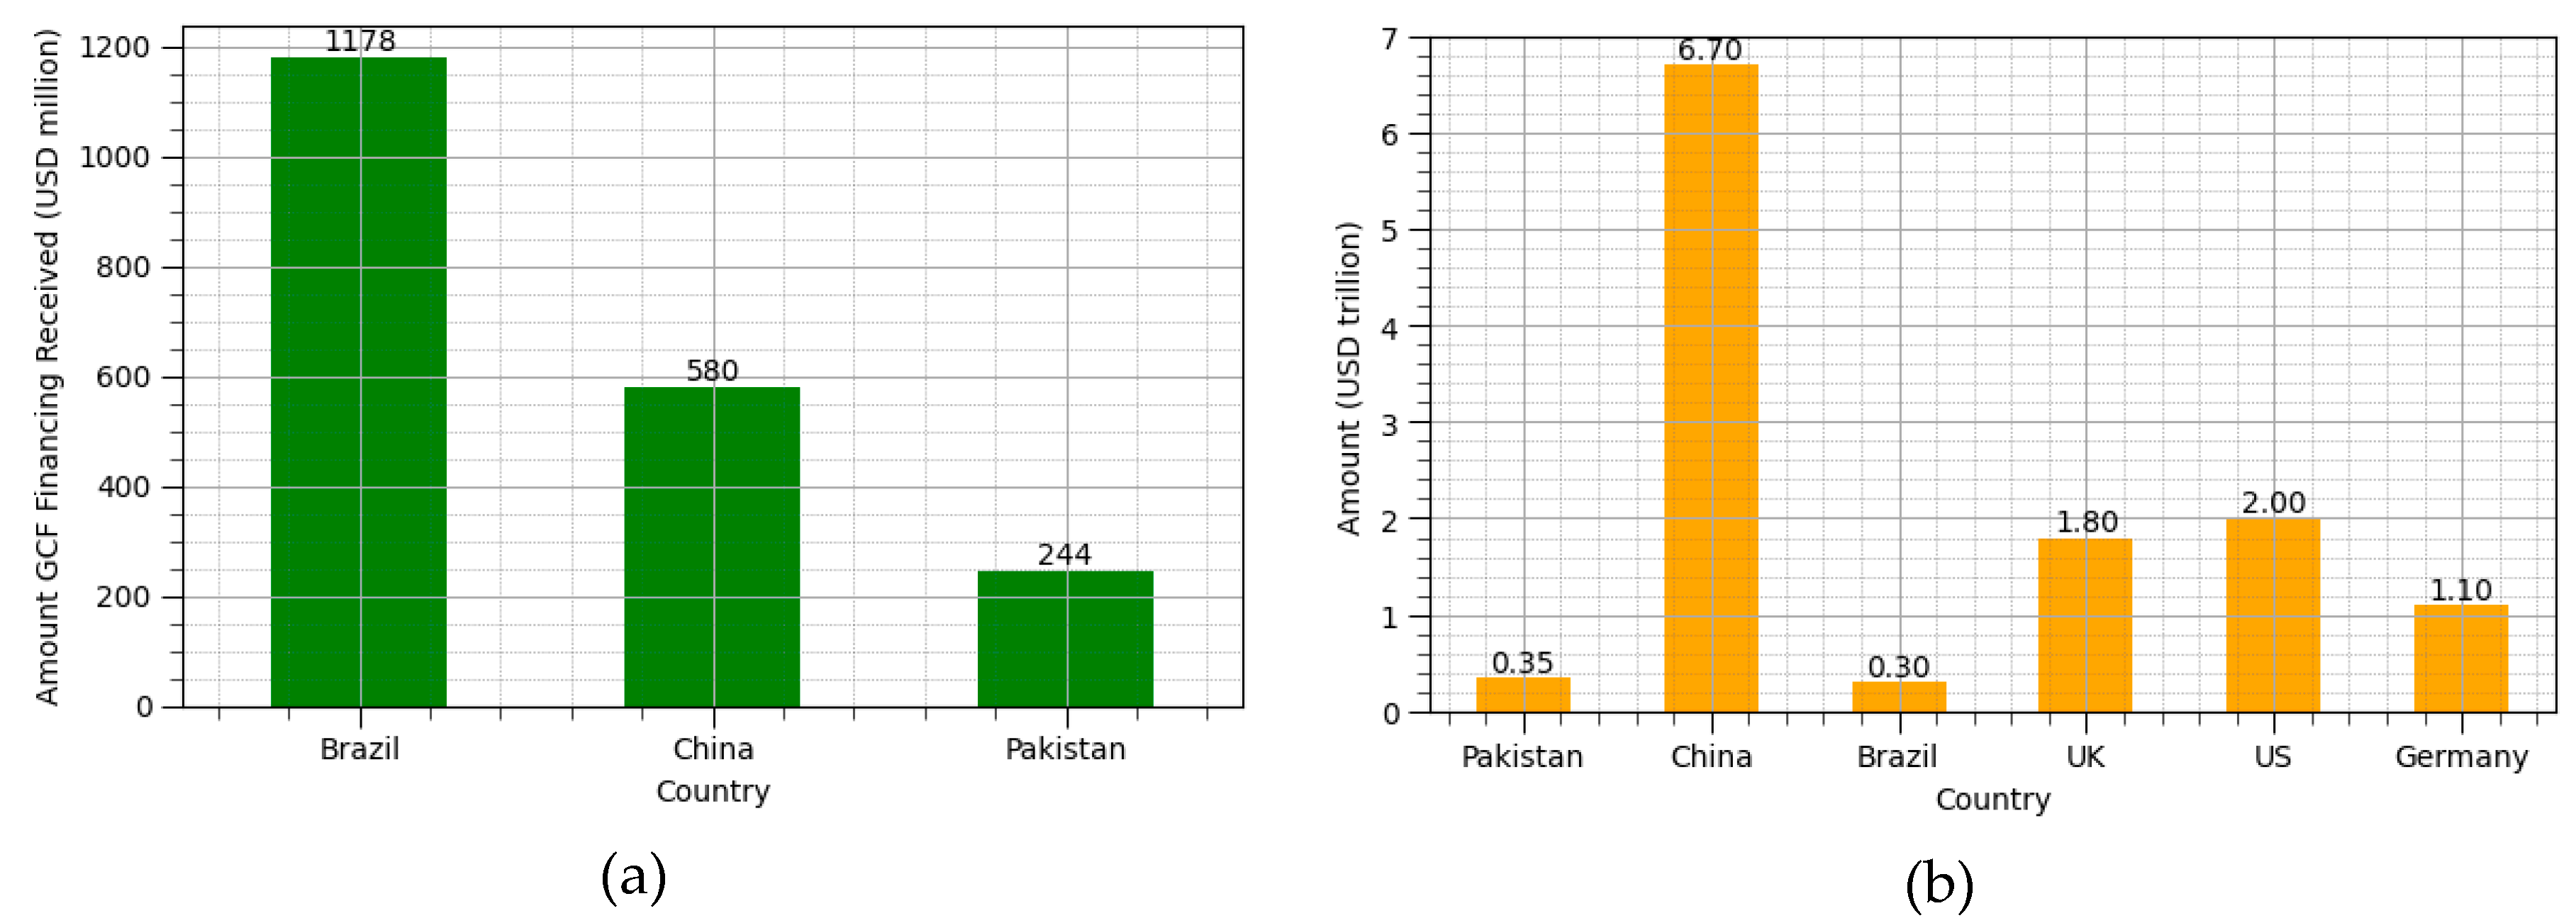
Figure 9.
Total pledged and deposited amounts by country (Reprinted from ref. [63]) .
Figure 9.
Total pledged and deposited amounts by country (Reprinted from ref. [63]) .
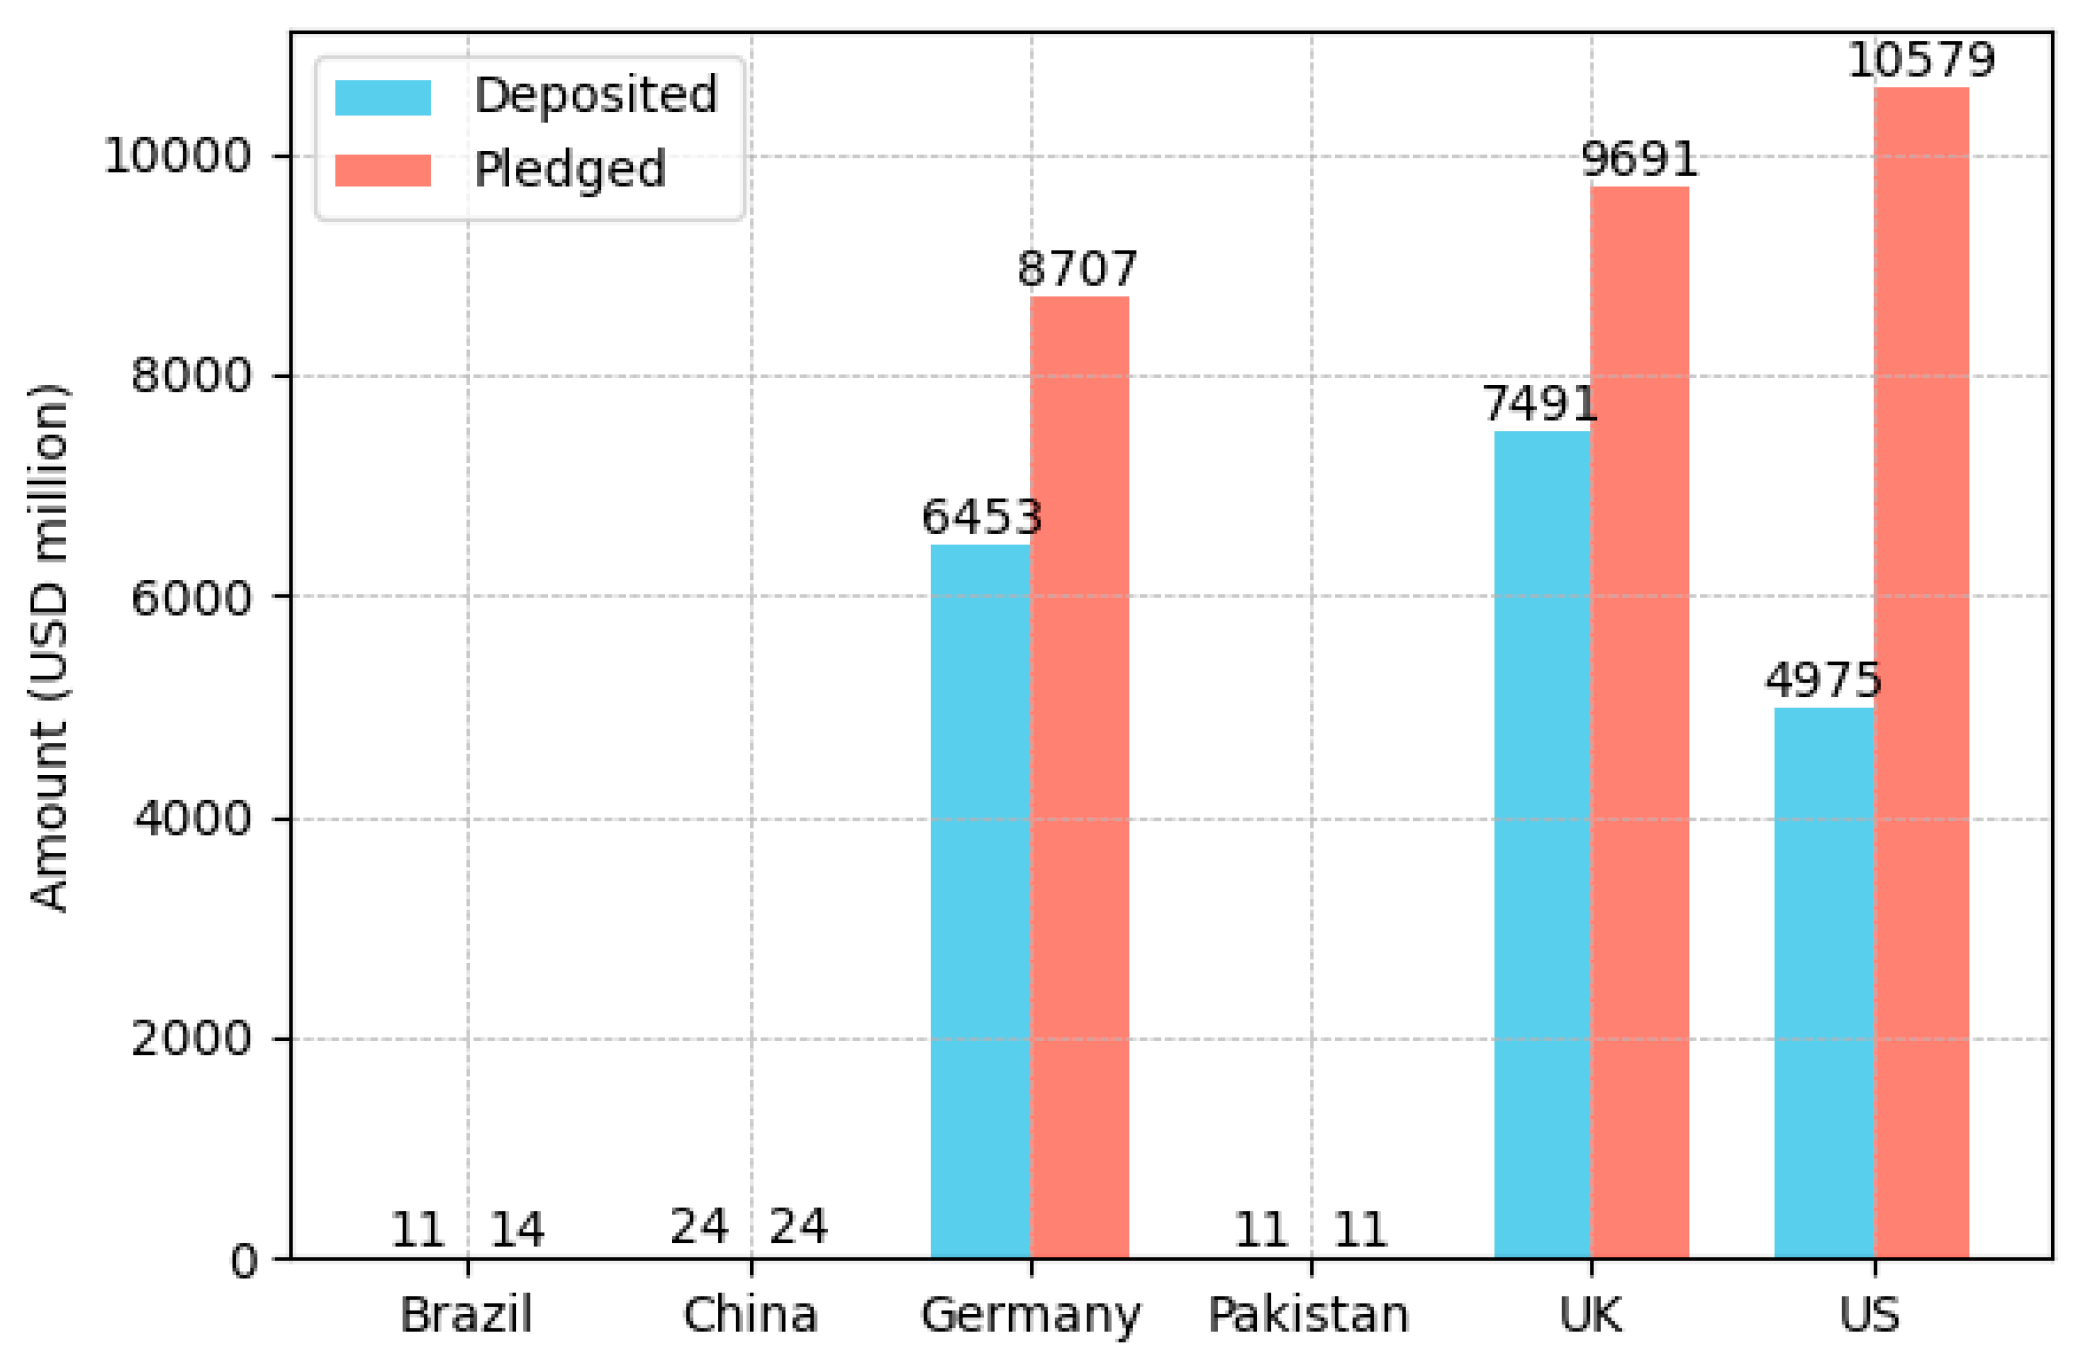
Figure 10.
Adjusted deposits by countries relative to Germany in proportion to RCI.
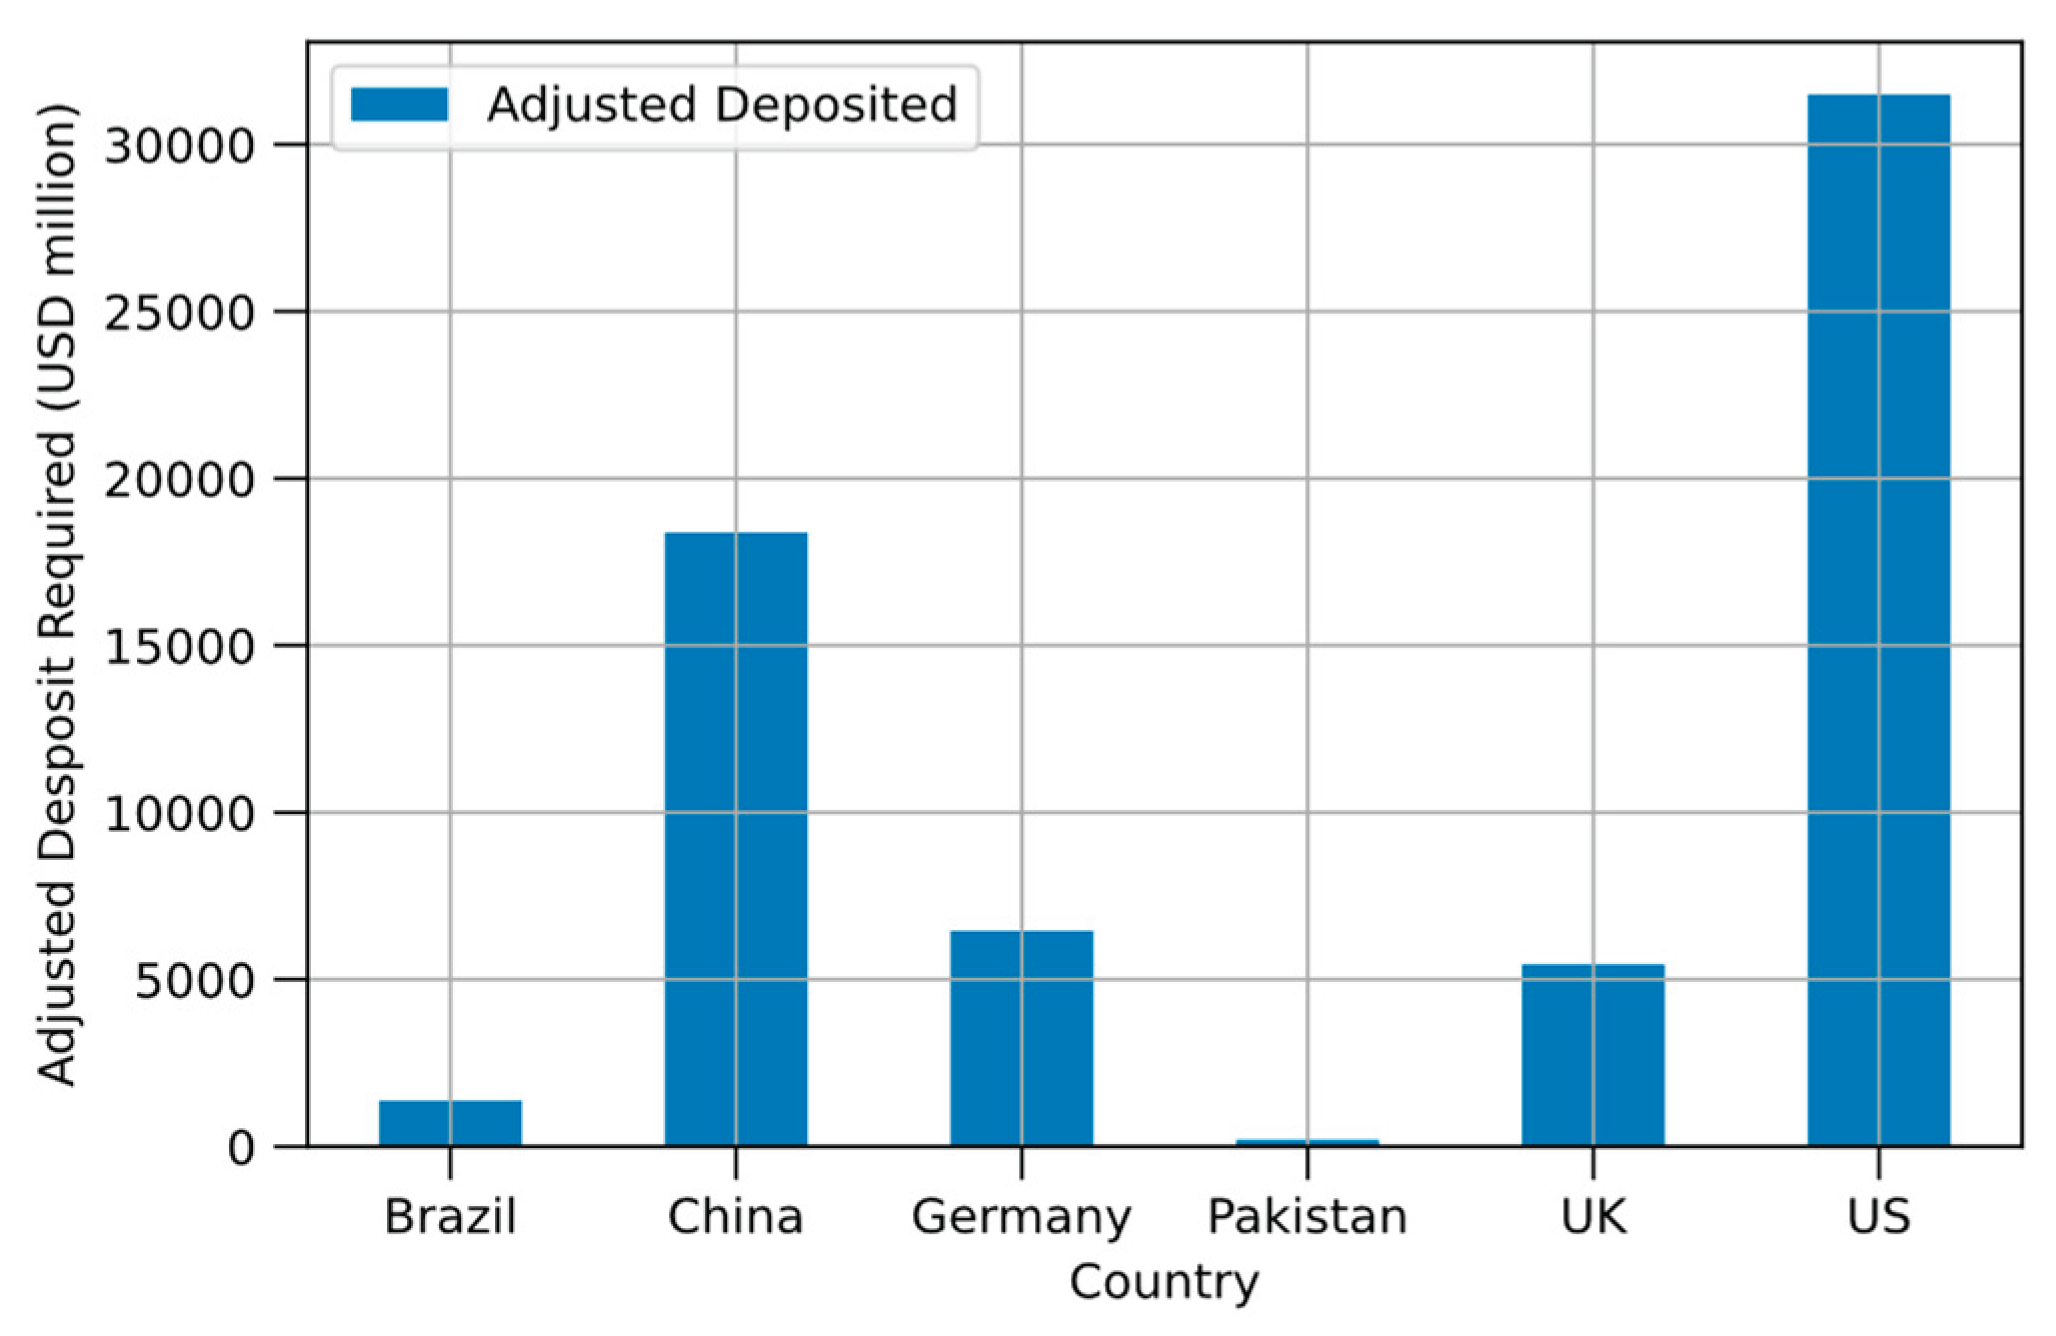
Table 1.
Advantages and disadvantages of various emission allocation schemes [22].
Table 1.
Advantages and disadvantages of various emission allocation schemes [22].
| Allocation Scheme | Advantages | Disadvantages |
|---|---|---|
| Proportional to Area |
|
|
| Proportional to Populations |
|
|
| Proportional to Adult Populations |
|
|
| Proportional to half per capita and half per GDP |
|
|
Table 2.
Definitions of energy transition from various literatures.
| Author | Definition |
|---|---|
| Grübler [28] | A change in the state of an energy system as opposed to a change in an individual energy technology or fuel source. |
| Hirsch and Jones [29] | A change in fuels (e.g., from coal to oil) and their associated technologies (e.g., from steam engine to internal combustion engine). |
| Miller et al. [30] | Shifts in the fuel source for energy production and the technologies used to exploit that fuel. |
| O’Connor [31] | A particularly significant set of changes to the patterns of energy use in a society, potentially affecting resources, carriers, converters, and services. |
| Fouquet and Pearson [32] |
The switch from an economic system dependent on one or a series of energy sources and technologies to another. |
| Smil [33] | The time that elapses between the introduction of a new primary energy source, or prime mover, and its rise to claiming a substantial share of the overall market. |
Table 4.
Performance comparison of case study countries according to different indexes.
| No | Country | GFI (2023) | CCPI (2023) | ETI (2023) | NZEI (2023) | RISE (2021) |
|---|---|---|---|---|---|---|
| 1 | Brazil | 4.70 (Greening Middle) |
61.74 (Medium) |
65.7 | High energy intensity, Low fuel factor | 82 (Green) |
| 2 | China | 5.12 (Greening Middle) |
45.56 (Low) |
64.1 | High energy intensity, High fuel factor | 77 (Green) |
| 3 | Germany | 5.92 (Green Leader) |
65.77 (High) |
66.5 | Low energy intensity, Low fuel factor |
92 (Green) |
| 4 | Pakistan | 3.72 (Climate Abstainer) |
59.35 (Medium) |
46.2 | N/A | 31 (Red) |
| 5 | United States | 5.39 (Green Leader) |
42.79 (Very Low) |
64.0 | High energy intensity, Low fuel factor |
82 (Green) |
Table 5.
Approach comparison between the GDR framework and this work.
| Element | GDR Framework | This work |
|---|---|---|
| Starting year | 1990 | All year |
| Responsibility Index | Exclude emission to reach development threshold |
Include emission to reach development threshold |
| Capacity Index | Exclude GDP for development threshold |
Exclude GDP for development threshold |
| Energy Transition Index | Not included | Included |
Disclaimer/Publisher’s Note: The statements, opinions and data contained in all publications are solely those of the individual author(s) and contributor(s) and not of MDPI and/or the editor(s). MDPI and/or the editor(s) disclaim responsibility for any injury to people or property resulting from any ideas, methods, instructions or products referred to in the content. |
© 2025 by the authors. Licensee MDPI, Basel, Switzerland. This article is an open access article distributed under the terms and conditions of the Creative Commons Attribution (CC BY) license (http://creativecommons.org/licenses/by/4.0/).
Copyright: This open access article is published under a Creative Commons CC BY 4.0 license, which permit the free download, distribution, and reuse, provided that the author and preprint are cited in any reuse.


