
Submitted:
16 June 2025
Posted:
19 June 2025
You are already at the latest version
Abstract
Contemporary museums’ architecture often emphasizes visual aesthetics—large volumes, open‐plan layouts, and highly reflective finishes—resulting in acoustic challenges such as excessive reverberation, poor speech intelligibility, elevated background noise, and reduced privacy. This study quantifies the impact of surface‐specific absorption treatments on acoustic metrics across eight gallery spaces. Room impulse responses calibrated virtual models, which simulated nine absorption scenarios (low, medium, high on ceilings, floors, and walls) and evaluated reverberation time (T20), speech transmission index (STI), clarity (C50), distraction distance (rD), Spatial Decay Rate of Speech (D2,S), and Speech Level at 4m (Lp,A,S,4m). Results indicate that going from concrete to a wood floor yields the most rapid T₂₀ reductions (up to –1.75 s), ceiling treatments deliver the greatest STI and C₅₀ gains (e.g., STI increases of +0.16), and high-absorption walls maximize privacy metrics (D2,S and Lp,A,S,4m). A linear regression model further predicts STI from T₂₀, total absorption (Sabins), and room volume with 84.9 % conditional R², enabling ± 0.03 accuracy without specialized testing. These findings provide empirically derived, surface-specific “first‐move” guidelines for architects and acousticians, underscoring the necessity of integrating acoustics early in museum design to balance auditory and visual objectives and enhance visitor experience.
Keywords:
Museum acoustics
; Room acoustics
; Acoustic simulation
; Speech Intelligibility
; Privacy
1. Introduction
Museums are public spaces that, while not designed as specialized performance venues like concert halls or recording studios, still require controlled acoustic environments. Classic galleries evoke images of hushed halls where silence allows artworks to command attention. Contemporary museums, however, increasingly incorporate experimentation, immersive, and multisensory elements, such as audio guides, interactive installations, and dynamic pathways, which place additional demands on acoustic control.
Contemporary museum architecture often embraces a “white-box” aesthetic—large, open-plan galleries finished in highly reflective materials such as glass, polished concrete, marble, and masonry. However, these elements, designed for striking visual impact, rarely account for acoustic side effects. These effects include long reverberation times, poor speech intelligibility, diminished speech privacy, and increased background noise [1,2,3,4,5,6]— all factors that compromise the visitor experience. Moreover, the increasing use of multimedia technologies may further exacerbate all these problems [7].
Compounding these challenges, acoustic requirements in museums are complex and often conflicting. For instance, museums must ensure high speech intelligibility for guided tours and multimedia presentations, while also providing quiet zones that afford privacy and support individual reflection. Because intelligibility and privacy are inversely related, the selection and placement of finishing materials become critical to balancing these competing demands.
1.1. Previous Research and Literature Gap
Acoustic assessments in museums are most often conducted post-occupancy, frequently in the first years of operation, and few of these consultant-led studies are published to guide future projects [8]. Early research highlighted the importance of acoustic design in gallery environments and outlined core challenges unique to museums [9,10]. Subsequent investigations have largely focused on in-situ measurements of reverberation time (RT), Speech Transmission Index (STI), and Clarity (C50), across individual case studies, with a few works suggesting design recommendations to improve the acoustic environment [11,12,13,14,15]. These suggestions often involve introducing new materials or making minor modifications post-construction. However, these efforts generally fail to address design strategies that could prevent acoustic issues from arising in the first place.
One notable approach to bridging this gap is the use of immersive environments to evaluate soundscape preferences in museums [16]. This research found that soundscapes recorded in exhibition spaces were frequently perceived as unfocused, distracting, and less engaging, with sound masking systems proving to be an effective strategy for mitigating these issues [1]. Multi-criterion approaches, such as the Index of Acoustic Quality in Museums (IAQM) [17] and the Global Acoustic Quality Parameter (PQAM) [18], also integrate objective and subjective data to characterize museums acoustically [17], but have limited outcomes, not offering actionable design solutions that can be effectively implemented during the planning and construction phases. Similarly, subjective assessments were conducted in a historical museum [19] and large-scale institutions like the Tate Modern, highlighting correlations between acoustic comfort and room acoustics indicators in sequential spaces [20], yet not translating findings into generalized guidelines.
Furthermore, formal standards tailored to museum acoustics remain virtually nonexistent. Standards like ISO 22955:2021 define acoustic quality criteria for open-plan offices [21], however, no equivalent normative framework addresses the demands of modern exhibition spaces. This absence underscores the need for systematic research that translates room acoustic metrics into practical, design-integrated solutions that can be implemented during the initial planning and construction phases.
1.2. Acoustic Parameters
Reverberation time, typically estimated as T₂₀ by fitting the decay curve from -5 dB to -25 dB [22], is the most widely regulated acoustic descriptor. ISO 3382-2 defines validation procedures for T₂₀ measurements, yet this metric ignores early reflections, a critical component of perceived room acoustics. However, it is well known that two rooms with identical T₂₀ can sound different if their early reflection patterns diverge [23]. Therefore, relying on reverberation time alone can yield poor correlation with subjective experience. To capture the full aural character of a space, complementary parameters that include early reflections are essential and have been investigated in several studies [24,25,26,27,28]. For instance, studies in educational and office environments have demonstrated the importance of Speech Clarity (C₅₀) and Speech Transmission Index (STI) for listener comfort and distraction distance [29,30,31,32,33,34]:
- Speech clarity (C₅₀): defined as the energy ratio of early (≤ 50 ms) to late arriving sound, expressed in decibels, and introduced in ISO 3382-1 [35].
- Speech Transmission Index (STI): quantifies modulation loss due to reverberation and background noise, providing a direct measure of intelligibility formalized in IEC 60268-16 [36].
Furthermore, museums share several acoustic requirements with open-plan offices to some extent, both demand that speech intelligibility decrease with distance while maintaining adequate clarity at a near field. Also, sources are typically non-directional due to free visitor movement, a characteristic as well as addressed in the open-plan offices standard [37]. Without museum-specific regulations, this study adopts the ISO 3382-3’s open-plan office metrics, which previous work has investigated for its applicability in museums [38]. The single-number quantities prescribed in ISO 3382-3 analyzed in the research are:
- Spatial Decay Rate of Speech (D2,S): A-weighted speech attenuation (dB) when doubling the listener distance from the source. Higher D2,S indicates stronger attenuation.
- Speech Level at 4m (Lp,A,S,4m): A-weighted speech level at 4 m from the source. Lower values denote better attenuation.
- Distraction Distance (rD): distance at which STI falls below 0.50—beyond this point, listeners perceive limited intelligibility, indicating increased speech privacy.
In general, optimal conditions feature high D2,S, and Lp,A,B, low Lp,A,S,4m, and correspondingly small rD [32,37]. While rD accounts for all room acoustic factors affecting speech intelligibility between the source and the listener [32], analyzing rD alone can be misleading, as it can be artificially improved by increasing background noise, potentially degrading overall comfort. Therefore, this research considers all three parameters for a comprehensive assessment.
1.3. Finishing Materials in Museums
Contemporary museum interiors frequently employ fully reflective finishes—concrete, masonry, or marble—to achieve a “white-box” aesthetic [2]. Acoustic treatments, when applied, are often limited to wall panels in multimedia galleries or event atria. Accounting for the acoustic implications of design decisions from the schematic design stage enables a holistic balance of performance and aesthetics: scattering elements can redirect energy toward absorbent surfaces, diffusers can mitigate flutter echoes without excessive sound-level loss, and absorbers can be distributed to fine-tune reverberation times and speech clarity.
Studies in classrooms and performance venues demonstrate how the choice and placement of diffusers and absorbers critically influence acoustic parameters [28,39,40]. The spatial distribution of absorptive materials can also significantly alter clarity and privacy metrics [41]. Yet comparable investigations in museum environments are limited in scope; for example, Barbo (2023) [42] evaluates increased absorption in gallery rooms, yet the interventions are tailored for the four rooms studied, which restricts the generalizability of its recommendations.
1.4. Aim, Research Questions, and Hypotheses
The present study systematically evaluates the acoustic performance of commonly used finishing materials applied to ceilings, floors, and walls in eight museum galleries. Nine absorption scenarios were tested in each room (low, medium, high on each surface), and the acoustic metrics defined above (T₂₀, C₅₀, STI, D2,S, Lp,A,S,4m, rD) were measured for all scenarios in each room.
Specifically, the investigation pursues three aims: quantifying the material-and-surface effects on room acoustics to transform assumptions into data-driven insights that support design decisions; examining the trade-off between speech intelligibility and privacy to identify material and placement strategies that optimize both competing demands; and translating the results into actionable guidelines expressed in architectural terms to ensure that designers can apply the recommendations directly within their workflows.
To frame these aims, four research questions guided the work: (1) How do varying levels of absorption (low, medium, high) on ceilings, floors, and walls affect key acoustic parameters? (2) Does the effect of increasing absorption on one surface (e.g., ceiling) differ from an equivalent increase on another (e.g., floor or wall)? (3) Which surface treatment yields the greatest improvements in speech intelligibility (STI, C₅₀) and speech privacy (D2,S, Lp,A,S,4m, rD)? (4) Given the complexity of measuring or calculating STI, can a regression model be used to predict STI with sufficient accuracy?
Accordingly, four hypotheses were tested. First (H1), it was hypothesized that increasing absorption from low to high would produce significant reductions in T₂₀ and Lp,A,S,4m alongside corresponding increases in STI, C₅₀, rD, and D2,S, regardless of surface type. Second (H2), ceiling treatments were expected to produce the largest gains in intelligibility metrics (STI, C₅₀), whereas wall treatments would most effectively enhance privacy measures (D2,S, rD) (H3). Finally (H4), a regression model based on T₂₀, total absorption, and room volume would predict STI, facilitating calculations during the first stages of design.
2. Materials and Methods
2.1. Room Selection and Impulse-Response Measurements
Eight gallery spaces were selected across three museum buildings to represent a range of volumes (400–1,400 m³), surface finishes, and plan configurations (See Figure 1). Room impulse responses (RIRs) were recorded in each gallery using an omnidirectional dodecahedral loudspeaker and an ambisonics microphone (AMBEO VR 3D, Sennheiser) in A-format and later converted to B-format using an A-B format plug-in (Sennheiser, AMBEO A-B format converter). Sweep signals were emitted from two source positions in opposite corners and recorded at three receiver positions along the main diagonal, resulting in six source-receiver combinations per room. RIRs were processed using MATLAB to extract the acoustic parameters for model calibration.
2.2. Virtual Model Calibration and Acoustic Simulations
Floor plans and measured RIRs were used to construct and calibrate geometric room models in Treble Technologies Acoustic Simulation Suite. Initial material absorption coefficients were assigned using Treble’s material library data. Surface coefficients were then iteratively adjusted until simulated T₂₀ values matched measured values within ±5% across the 63 Hz–8 kHz octave bands. For each calibrated model, nine absorption scenarios were generated by independently assigning low, medium, and high absorption coefficients to one surface at a time (ceiling, floor, or walls). Table 1 shows the material definitions for each absorption level. Simulated RIRs were computed at the same three receiver and two source positions for each scenario and were analyzed to compute the acoustic parameters. All parameters were calculated in one-third-octave bands from 63 Hz to 8 kHz and averaged across receiver positions.
2.3. Statistical Analysis
All acoustic metrics (T₂₀, STI, C₅₀, D2,S, Lp,A,S,4m, rD) were analyzed in a two-stage repeated-measures framework using RStudio (v 2024.12.1). In the first stage, each parameter was evaluated via a two-way within-subjects ANOVA with factors Location (ceiling, floor, wall) and Magnitude (low, medium, high). Summary statistics are presented in Table 2. In the second stage, a one-way within-subjects ANOVA was conducted on the nine combined conditions (ceiling-low, ceiling-medium, ceiling-high, floor-low, … wall-high) to test for differences among every specific absorption scenario. Distributions and condition-level means for all metrics are displayed in Figure 2 and Figure 3.
Repeated observations within each room increase statistical power by leveraging within-room replication and simultaneously account for uncontrolled between-room variability (e.g., geometry, volume, background noise) by treating rooms as a random effect.
Sphericity was assessed with Mauchly’s test and, where violated, Greenhouse–Geisser corrections were applied. Significant effects (α = 0.05) were followed by Holm-adjusted pairwise comparisons (Table 3) to locate differences among factor levels, and by simple-effects contrasts (Table 4) to quantify the magnitude of each absorption increment.
3. Results
3.1. Effect of Location and Magnitude on Each Acoustic Parameter
Table 2 shows that the main effect of absorption magnitude was highly significant for all six metrics, with F-values ranging from F(2,14) = 74.8 for distraction distance (rD) to F(2,14) = 797 for speech clarity (C₅₀) (all p < .001). The main effect of location also reached significance for most metrics, indicating that treating ceilings, floors, or walls produces different acoustic outcomes, except for D₂S (F(2,14)=3.1, p = .077), suggesting that, on average, this privacy metric is less sensitive to where absorption is placed.
Critically, all six parameters exhibited significant Location × Magnitude interactions (all p < .03), confirming that the efficacy of increasing absorption depends on which surface is treated. For example, a given increase in absorption level on the ceiling does not produce the same T₂₀ reduction or STI gain as an equivalent increase on the floor or wall. Detailed post-hoc comparisons and simple-effects analyses to identify the most effective surfaces for each metric are presented in Section 3.3.
3.2. Condition ANOVA: Specific Scenario Comparisons
Figure 2 and Figure 3 show the results for the ANOVAs that were performed across the nine combined absorption conditions for each acoustic metric. Design targets for each metric—indicated by the dashed cyan lines were defined based on ISO 3383-3 [37] and previous research [17,18] as follows: reverberation time (T₂₀) between 1.0 s and 1.5 s; speech clarity (C₅₀) between 0 dB and 5 dB; Speech Transmission Index (STI) between 0.45 and 0.60; distraction distance (rD) below 5 m for high privacy (or above 11 m for low privacy); spatial decay rate (D2,S) between 2 dB and 5 dB; and A-weighted speech level at 4 m (Lp,A,S,4m) between 48 dBA and 52 dBA.
All ANOVA tests were highly significant, indicating that at least one condition differed from the others for each metric. Confirming H1, with increasing absorption: T₂₀ [500, 1k, 2k] declines (F (8,56) = 53.05, p = 1.06×10⁻⁸), C₅₀ [500, 1k, 2k] improves (F (8,56) = 57.14, p = 4.10×10⁻⁹), and STI increases (F (8,56) = 40.92, p = 1.16×10⁻²⁰. Regarding the privacy metrics, with a higher absorption: rD increases (F (8,56) = 54.75, p = 4.93×10⁻⁹), D2,S improves (F (8,56) = 51.77, p = 4.17×10⁻²³) and Lp,A,S,4m decreases (F (8,56) = 68.26, p = 4.46×10⁻²⁶).
Under low-absorption conditions, all median T₂₀ values exceeded the recommended maximum of 1.5 s, with concrete floors (FL) producing the highest variability (1.5–5.2 s) and masonry walls (WL) yielding the lowest median (2.21 s). Introducing medium absorption on the ceiling (CM) effectively brought T₂₀ close to the 1.5 s threshold (median = 1.55 s), whereas equivalent mid-level treatments on floors (FM) and walls (WM) remained above target. In the high-absorption scenarios (CH, FH, WH), every condition fell within the 1.0–1.5 s band, and the WH case even dipped below 1.0 s with minimal variability, suggesting that high-absorption walls are suited for galleries demanding tight reverberation control.
F(8,56) = 53.05, p = 1.06×10⁻⁸ F(8,56) = 57.14, p = 4.10×10⁻⁹ F(8,56) = 40.92, p = 1.16×10⁻²⁰
A similar progression was observed for clarity and intelligibility. Low-absorption C₅₀ values clustered at or below 0 dB, indicating less distinction between direct and reverberant sound, and STI remained under the 0.45 threshold. Medium absorption boosted both C₅₀ and STI, but only the wood ceiling treatment approached the lower thresholds (C₅₀ ≈ 0 dB, STI ≈ 0.45). High-absorption most conditions fall between the optimum STI values suggested, with just one outlier outside for the floor. The microperforated ceiling (CH) gives the highest STI values, followed by the walls and the floor. The CH also reached the highest C50 levels, followed by acoustic plaster walls (WH), but with higher variability. The Carpet Floor (FH) is exactly between the proposed C50 threshold. These findings reinforce H2: ceiling absorbers deliver the greatest STI and C₅₀ improvements (ΔSTI ≈ +0.16 for CH vs. CL), followed by walls (ΔSTI ≈ +0.10), then floors (ΔSTI ≈ +0.13).
F(8,56) = 54.75, p = 4.93×10⁻9 F(8,56) = 51.77, p = 4.17×10⁻23 F(8,56) = 68.26, p = 4.46×10⁻26
Privacy metrics exhibited a more complex relationship (Figure 3). Low absorption yielded median rD values below 5 m—indicative of inherently high speech privacy—while medium and high absorption increased rD into the 5–11 m “transition” zone, reflecting clearer direct sound and reduced masking. However, high absorption also produced steep spatial decay rates (D2,S between 3 dB and 5 dB) and lowered speech levels at 4 m (Lp,A,S,4m around 50 dBA), particularly under WH, which delivered the strongest overall attenuation profile. Although rD alone can suggest reduced privacy at high absorption, the combination of high D2,S, and low Lp,A,S,4m confirms that high-absorption walls most effectively prevent speech intrusion at moderate distances.
3.3. Pairwise Comparisons and Simple-Effects Contrasts
Holm-adjusted pairwise comparisons (Table 3) narrow the ANOVA results to clarify which pairs of location and magnitude of absorption differ across metrics. Comparisons between ceiling and floor treatments were significant for all parameters (T₂₀: p = .044; STI: p = .0054; C₅₀: p = .00021; rD: p = .0069; D2,: p = .0025; Lp,A,S,4m: p = 8.4×10⁻⁵), whereas no significant differences arose between ceiling and wall treatments (all p > .05). Floor–wall contrasts likewise reached significance for each metric (T₂₀: p = .0096; STI: p = .0447; C₅₀: p = .0339; rD: p = .041; D2,S: p = .0045; Lp,A,S,4m: p = .0001), indicating that adding absorption to floor differ acoustically from both ceilings and walls, while ceilings and walls behave similarly when treated.
Magnitude contrasts confirmed that all absorption increments produced significant effects, demonstrating that each increase in absorption level results in a statistically significant performance gain. All steps (low-to-high, medium-to-high, and low-to-medium) yielded highly significant changes across every metric (all p < .001), thereby corroborating the overall magnitude effect.
Simple-effects contrasts (Table 4) quantified the magnitude of each absorption increment on each surface. For ceilings, increasing absorption from low (bare concrete) to medium (wood panel) reduced T₂₀ by 0.96 s, increased STI by 0.05, improved C₅₀ by 2.67 dB, and extended rD by 3.18 m. A further step to high absorption (microperforated panel) yielded an additional 8.65 dB of clarity and 5.59 m of distraction-distance gain. The full low-to-high transition produced the largest improvements across most metrics (ΔSTI = +0.15; ΔC₅₀ = +11.32 dB; ΔrD = +8.77 m; ΔD2,S = +2.09 dB; ΔLp,A,S,4m = –5.40 dB), except ΔT₂₀, which was given by the floor. Confirming that ceiling absorbers are most effective for speech intelligibility (supporting H2) and overall attenuation.
Floor treatments accounted for the steepest initial T₂₀ drop: ΔT₂₀ = –1.06 s when moving from concrete to wood, with a further –0.68 s reduction from wood to carpet (total ΔT₂₀ = –1.75 s). These findings underscore the pivotal role of floor treatments in rapid reverberation control. The low-to-medium change also lowered Lp,A,S,4m by 1.91 dB, while the medium-to-high step produced a 6.08 m increase in rD.
Wall treatments, the low-to-medium shift from masonry to gypsum-wool backing yielded only marginal, non-significant changes (e.g., ΔT₂₀ = –0.21 s; ΔC₅₀ = +0.57 dB; ΔrD = +0.28 m), indicating limited benefit of that incremental treatment. In contrast, the medium-to-high upgrade to acoustic plaster generated substantial privacy gains (ΔD2,S = +1.64 dB; ΔLp,A,S,4m = –4.38 dB) alongside appreciable clarity improvements (ΔC₅₀ = +6.93 dB; ΔrD = +5.16 m). This finding substantiates the hypothesis that wall treatments are critical for optimizing speech privacy (H3).
Together, these contrasts demonstrate that while increased absorption enhances acoustic performance, the scale and nature of the effect depend on both the surface treated and the absorption level, providing the surface-specific guidance required for informed museum design.
3.4. STI Prediction
Hypothesis 4 posited that a regression on T₂₀, total absorption, and volume would predict STI within ± 0.03 units. To test this hypothesis, a linear mixed–effects model was fitted with STI as the outcome and T₂₀, total absorption (in Sabins), and room volume as fixed effects, plus a random intercept for each room. The resulting equation is:
and denote the total absorption and volume for the condition in the room . All three predictors were highly significant (p < .001), confirming their contributions to intelligibility. The model explains 76.2 % of the variance in STI based on fixed effects alone (marginal R² = 0.762), and 84.9 % when room-to-room variability is included (conditional R² = 0.849). Figure 4 presents the predicted STI surface over a practical range of absorption (0–400 Sabins) and volumes (300–1,500 m³), illustrating how STI rises with increased absorption and falls with larger volume.
By substituting an estimated T₂₀, proposed material Sabins, and gallery volume into this equation—or by reading directly from the contour plot—STI can be forecast within ±0.03 units accuracy, confirming H4. This approach obviates the need for time-consuming STI measurements or calculations during preliminary design, enabling faster, evidence-based iterations that bridge acoustic theory and real-world architectural practice.
4. Discussion
The present study has shown that targeted absorption on ceilings, floors, and walls yields predictable, surface-specific improvements in key acoustic metrics, thereby confirming the working hypotheses and extending descriptive case studies into actionable design guidance. As hypothesized (H1), each incremental increase in absorption produced significant reductions in reverberation time (T₂₀) and speech level (Lp,A,S,4m) alongside corresponding gains in speech intelligibility (STI), clarity (C₅₀), distraction distance (rD), and spatial decay rate (D2,S).
Floor treatments emerged as the most effective “first move” for rapid reverberation control. Transitioning from concrete to wood delivered an initial ΔT₂₀ of –1.06 s, and a further –0.68 s when moving to carpet, for a total reduction of –1.75 s. Although these relative gains are the largest observed, concrete floors began with the highest baseline T₂₀; meeting absolute design goals may still require supplementary ceiling or wall absorption. Nevertheless, the pronounced impact of floor finishes affirms their priority when rapid reverberation control is required.
Consistent with Hypothesis 2, ceiling absorbers improved Speech Transmission Index (STI) and clarity (C₅₀) at each absorption increment. Although ceiling absorption can attenuate beneficial early reflections, potentially reducing intelligibility [43], it also reduces late reflections, enhancing overall clarity and controlling sound levels. The high-absorption ceiling configuration achieved dual benefits: raised STI into the optimal 0.60–0.65 range and increased spatial decay rates (D2,S) by 2.09 dB per doubling of distance. This combination is particularly valuable for museum environments where: (1) increasing near-field clarity for guided tours and multimedia content, (2) reducing cognitive fatigue by minimizing reverberant buildup, (3) limiting the propagation of ambient noise from adjacent galleries, and (4) maintaining a far-field privacy for quiet contemplation.
High-absorption walls demonstrated the strongest effects on privacy metrics, as posited in Hypothesis 3. Although medium-level gypsum–wool treatments yielded only marginal improvements, replacing them with high-absorption plaster increased D2,S, and reduced distant speech levels (Lp,A,S,4m) to within ideal ranges, even driving T₂₀ below 1 s. These results extend previous research [44] , which has suggested wall absorbers as a key privacy tool, by quantifying their effectiveness relative to ceiling and floor solutions.
These surface-specific patterns were observed consistently across eight diverse gallery spaces, despite variations in volume, layout, and baseline finishes. This suggests that the proposed “first-move” recommendations—floor finishes for rapid reverberation control, ceiling treatments for intelligibility, and high-absorption walls for privacy—can be broadly applied to museum environments.
Furthermore, although increased absorption raised distraction distance (rD)—suggesting reduced privacy— analyzing this metric alone can be misleading because the steeper decay (high D2,S) and lower levels at moderate distances (Lp,A,S,4m) ensure better overall privacy. These results reinforce previous research that speech privacy is best judged by all the metrics together [32].
From an applied perspective, these findings carry important practical implications for museum design. By quantifying the acoustic impact of ceiling, floor, and wall finishes across diverse galleries, this work converts expert intuition into empirically grounded guidance. Acoustic consultants can make educated guesses about the impact of different finishing materials, like choosing a fully reflective ceiling versus a wood ceiling. However, quantifying these effects across multiple rooms allows more assertive decisions. By translating technical metrics into data-driven recommendations, designers can achieve acoustic targets more efficiently, even without a dedicated acoustician on the project team.
Informing architects is particularly relevant given that museums are public spaces that are not designed as specialized performance venues like concert halls, but still require controlled acoustics, and acousticians frequently do not participate in the design process. As prior research indicates, few museums undergo dedicated acoustic optimization, and when such assessments occur, they often take place years after opening [8]. Early integration of these surface-specific guidelines, when modifications such as altering floor materials are still feasible, minimizes the need for costly retrofits and provides compelling evidence to persuade project teams to prioritize acoustic quality in museum planning.
5. Conclusions
This study has established a quantitative, surface-specific framework for optimizing museum acoustics through targeted absorption treatments. Floor finishes were identified as the most effective “first-move” for rapid reverberation-time control, ceiling absorbers as the primary means to maximize speech intelligibility and clarity, and high-absorption wall treatments as the optimal strategy for enhancing speech privacy. A predictive regression model further enables early-stage STI estimation from readily available parameters (T₂₀, total Sabins, and room volume), eliminating the need for specialized measurement equipment during schematic design.
Some limitations should be considered. First, only nine discrete absorption scenarios were tested; real-world implementations may involve combinations of treatments beyond the single-surface permutations studied here. Second, the tested scenarios focused on informing decisions for new constructions, and more design solutions should be tested for retrofit interventions. For example, ceilings are usually the easiest way to treat an existing museum room, so more ceiling design solutions should be tested.
Moreover, the relationship between objective metrics and subjective visitor experience remains to be validated through perceptual assessments. Future research should integrate immersive listening tests and visitor surveys to correlate psychophysiological assessments and architectural features. Finally, extensions of this work could explore hybrid treatment strategies—combining absorbers, diffusers, and scattering elements—to develop comprehensive acoustic solutions tailored to the evolving needs of contemporary museum environments.
Author Contributions
Conceptualization, methodology, software, formal analysis, investigation, writing—original draft preparation, Milena Jonas Bem; writing—review and editing, supervision, Jonas Braasch. All authors have read and agreed to the published version of the manuscript.
Funding
This research received no external funding.
Data Availability Statement
The original data presented in the study are openly available in [repository name, e.g., FigShare] at [DOI/URL] or [reference/accession number].
Acknowledgments
The authors thank the Massachusetts Museum of Contemporary Art, the Hessel Museum of Art, and the Williams College Museum of Art for granting access and support during acoustic measurements.
Conflicts of Interest
The authors declare no conflicts of interest.
References
- J. Bem, M.; Chabot, S.; Brooks, V.; Braasch, J. Enhancing Museum Experiences: Using Immersive Environments to Evaluate Soundscape Preferences. J. Acoust. Soc. Am. 2025, 157, 1097–1108. [CrossRef]
- J. Bem, M.; Huang, M.; Brooks, V.; Chabot, S.; Braasch, J. Museum Acoustics: Classification and Auralization of Design Approaches. J. Acoust. Soc. Am. 2024, 155, A179. [CrossRef]
- J. Bem, M.; Chabot, S.; Braasch, J. Effects of Sounds on the Visitors’ Experience in Museums. J. Acoust. Soc. Am. 2023, 154, A257. [CrossRef]
- Orhan, C. A Comparative Study on Indoor Soundscape in Museum Environments. M.A., Ann Arbor, United States, 2019.
- Barbo, M.; Brandão, E. Analysis of the Acoustic Characteristics of a Museum of Modernist Architecture - Art Museum of São Paulo Assis Chateaubriand. In Proceedings of the Proceedings of 23rd International Congress on Acoustics (ICA); German Acoustical Society (DEGA): Aachen, Germany, September 9 2019; pp. 3967-3974.
- Carvalho; Gonçalves, H.J.S.; Luísa M M Garcia Acoustics of Modern and Old Museums. In Proceedings of the Proceedings of NOISE-CON 2013; Denver, Colorado., August 26 2013.
- Bubaris, N. Sound in Museums – Museums in Sound. Museum Management and Curatorship 2014, 29, 391–402. [CrossRef]
- Gonçalves, H.J.S. A ACÚSTICA DE MUSEUS MODERNOS. ESTUDO DE CASO O MUSEU DE SERRALVES (PORTO), Universidade do Porto: Portugal, 2012.
- D’Antonio, P.; Cox, T.J.; Haas, S. Shape Optimization: Good Looks and Acoustics Too! The Journal of the Acoustical Society of America 2003, 113, 2322–2322.
- Reber, M. Base-building Architectural and Engineering Acoustic Concerns Unique to Museums and Exhibit Environments. The Journal of the Acoustical Society of America 2003, 113, 2322. [CrossRef]
- D’Orazio, D.; Montoschi, F.; Garai, M. Acoustic Comfort in Highly Attended Museums: A Dynamical Model. Building and Environment 2020, 183, 107176. [CrossRef]
- Mónica, M.; Mendonça, P.; Miranda Guedes, J.; Carvalho, A.P. Roof Replacement of a Heritage Building Using Transparent Solutions: Room Acoustic Performance Comparison. International Journal of Architectural Heritage 2022, 16, 284–301.
- Paxton, B.; Harvie-Clark, J.; Albert, M. Measurements of Ultrasound from Public Address and Voice Alarm Systems in Public Places. The Journal of the Acoustical Society of America 2018, 144, 2548–2553.
- Pon, L.; Douglas, S.C.; Martellotta, F. Sound Absorption Measurements under Strongly Non-Diffuse Conditions: The Case of the Pastrana Tapestries at Meadows Museum in Dallas. Acta Acustica united with Acustica 2016, 102, 955–962.
- Carvalho, A.; Gonçalves, H. The Acoustics of the Serralves Museum (Porto) and Other Modern Museums; 2012;
- J. Bem, M.; Braasch, J.; Chabot, S. Exploring Spatialization: A Method for Subjective Assessment of Soundscape Preference Using Immersive Environments. In Proceedings of the Proceedings of 29th International Conference on Auditory Display (ICAD2024); Troy, NY, USA., June 25 2024.
- Carvalho, A.; Garcia, L.M.M.; Gonçalves, H.J.S. A Multi-Criterion Method to Assess the Acoustic Quality in Museums. In Proceedings of the Proceedings of NOISE-CON 2014; Fort Lauderdale, FL., September 8 2014.
- Carvalho, A.P.O.; Barbosa, S.G.; Costa, A.E.B. Acoustic Characterization of the Municipal Museum Abade Pedrosa. In Proceedings of the Proceedings of INTER-NOISE 2024; Nantes, France., August 25 2024.
- Orhan, C.; Yilmazer, S. Harmony of Context and the Built Environment: Soundscapes in Museum Environments via GT. Applied acoustics 2021, 173, 107709.
- Yang, T.; Kang, J. Subjective Evaluation of Sequential Spaces. Applied Acoustics 2020, 161, 107139.
- ISO 22955:2021 Acoustics — Acoustic Quality of Open Office Spaces; 2021.
- ISO 3382-2:2008 Available online: https://www.iso.org/standard/36201.html (accessed on 26 May 2025).
- Campbell, C.; Svensson, C.; Nilsson, E. The Same Reverberation Time in Two Identical Rooms Does Not Necessarily Mean the Same Levels of Speech Clarity and Sound Levels When We Look at Impact of Different Ceiling and Wall Absorbers. INTERNOISE 2014 - 43rd International Congress on Noise Control Engineering: Improving the World Through Noise Control 2014, 78. [CrossRef]
- Yang, W.; Bradley, J.S. Effects of Room Acoustics on the Intelligibility of Speech in Classrooms for Young Children. The Journal of the Acoustical Society of America 2009, 125, 922–933. [CrossRef]
- Sato, H.; Bradley, J.S. Evaluation of Acoustical Conditions for Speech Communication in Working Elementary School Classrooms. The Journal of the Acoustical Society of America 2008, 123, 2064–2077. [CrossRef]
- Sato, H.; Morimoto, M.; Sato, H.; Wada, M. Relationship between Listening Difficulty and Acoustical Objective Measures in Reverberant Sound Fields. The Journal of the Acoustical Society of America 2008, 123, 2087–2093. [CrossRef]
- Sato, H.; Morimoto, M.; Wada, M. Relationship between Listening Difficulty Rating and Objective Measures in Reverberant and Noisy Sound Fields for Young Adults and Elderly Persons. The Journal of the Acoustical Society of America 2012, 131, 4596–4605. [CrossRef]
- Arvidsson, E.; Nilsson, E.; Hagberg, D.B.; Karlsson, O.J.I. The Effect on Room Acoustical Parameters Using a Combination of Absorbers and Diffusers—An Experimental Study in a Classroom. Acoustics 2020, 2, 505–523. [CrossRef]
- Astolfi, A.; Puglisi, G.E.; Murgia, S.; Minelli, G.; Pellerey, F.; Prato, A.; Sacco, T. Influence of Classroom Acoustics on Noise Disturbance and Well-Being for First Graders. Frontiers in Psychology 2019, 10.
- Di Blasio, S.; Shtrepi, L.; Puglisi, G.E.; Astolfi, A. A Cross-Sectional Survey on the Impact of Irrelevant Speech Noise on Annoyance, Mental Health and Well-Being, Performance and Occupants’ Behavior in Shared and Open-Plan Offices. International Journal of Environmental Research and Public Health 2019, 16, 280. [CrossRef]
- Braat-Eggen, E.; Poll, M.K. v. d.; Hornikx, M.; Kohlrausch, A. Auditory Distraction in Open-Plan Study Environments: Effects of Background Speech and Reverberation Time on a Collaboration Task. Applied Acoustics 2019, 154, 148–160. [CrossRef]
- Haapakangas, A.; Hongisto, V.; Eerola, M.; Kuusisto, T. Distraction Distance and Perceived Disturbance by Noise—An Analysis of 21 Open-Plan Offices. The Journal of the Acoustical Society of America 2017, 141, 127–136. [CrossRef]
- Hongisto, V.; Haapakangas, A.; Varjo, J.; Helenius, R.; Koskela, H. Refurbishment of an Open-Plan Office – Environmental and Job Satisfaction. Journal of Environmental Psychology 2016, 45, 176–191. [CrossRef]
- Haapakangas, A.; Hongisto, V.; Hyönä, J.; Kokko, J.; Keränen, J. Effects of Unattended Speech on Performance and Subjective Distraction: The Role of Acoustic Design in Open-Plan Offices. Applied Acoustics 2014, 86, 1–16. [CrossRef]
- ISO 3382-1:2009 Available online: https://www.iso.org/standard/40979.html (accessed on 26 May 2025).
- IEC 60268-16:2020 Available online: https://webstore.iec.ch/en/publication/26771 (accessed on 26 May 2025).
- ISO 3382-3 “Measurement of Room Acoustic Parameters. Part 3: Open Plan Offices”; Geneva, Switzerland, 2022.
- Barbo, M.N. Acústica de museus: uma proposta metodológica para subsídio ao processo projetual de salas com exposições permanentes.
- Arvidsson, E.; Nilsson, E.; Bard Hagberg, D.; Karlsson, O.J.I. The Difference in Subjective Experience Related to Acoustic Treatments in an Ordinary Public Room: A Case Study. Acoustics 2021, 3, 442–461. [CrossRef]
- Arvidsson, E.; Nilsson, E.; Bard-Hagberg, D.; Karlsson, O.J.I. Subjective Experience of Speech Depending on the Acoustic Treatment in an Ordinary Room. International Journal of Environmental Research and Public Health 2021, 18, 12274. [CrossRef]
- Cucharero, J.; Hänninen, T.; Lokki, T. Influence of Sound-Absorbing Material Placement on Room Acoustical Parameters. Acoustics 2019, 1, 644–660. [CrossRef]
- Barbo, M.N.; Carneiro, E.B.; Fonseca, W.D.; Suzey Gomes de Melo, V.; Bertoli, S.R. Museum Acoustics with the Permanent Exhibition: Assessment Proposals for Acoustical Design 2023.
- Bradley, J.S.; Sato, H.; Picard, M. On the Importance of Early Reflections for Speech in Rooms. The Journal of the Acoustical Society of America 2003, 113, 3233–3244. [CrossRef]
- Keränen, J.; Hakala, J.; Hongisto, V. Effect of Sound Absorption and Screen Height on Spatial Decay of Speech – Experimental Study in an Open-Plan Office. Applied Acoustics 2020, 166, 107340. [CrossRef]
Figure 1.
Composite panoramas of the eight museum galleries investigated in this study. Sites M1, M2, M8, and M9 are in the Massachusetts Museum of Contemporary Art (MASS MoCA). Room H9 is in the Hessel Museum of Art. Galleries W1, W2, and W3 are in the Williams College Museum of Art. Each room illustrates the commonly used finishing materials: masonry walls, concrete/wood floors, gyp/wood ceilings. All are open-plan gallery style with artworks displayed on the wall.
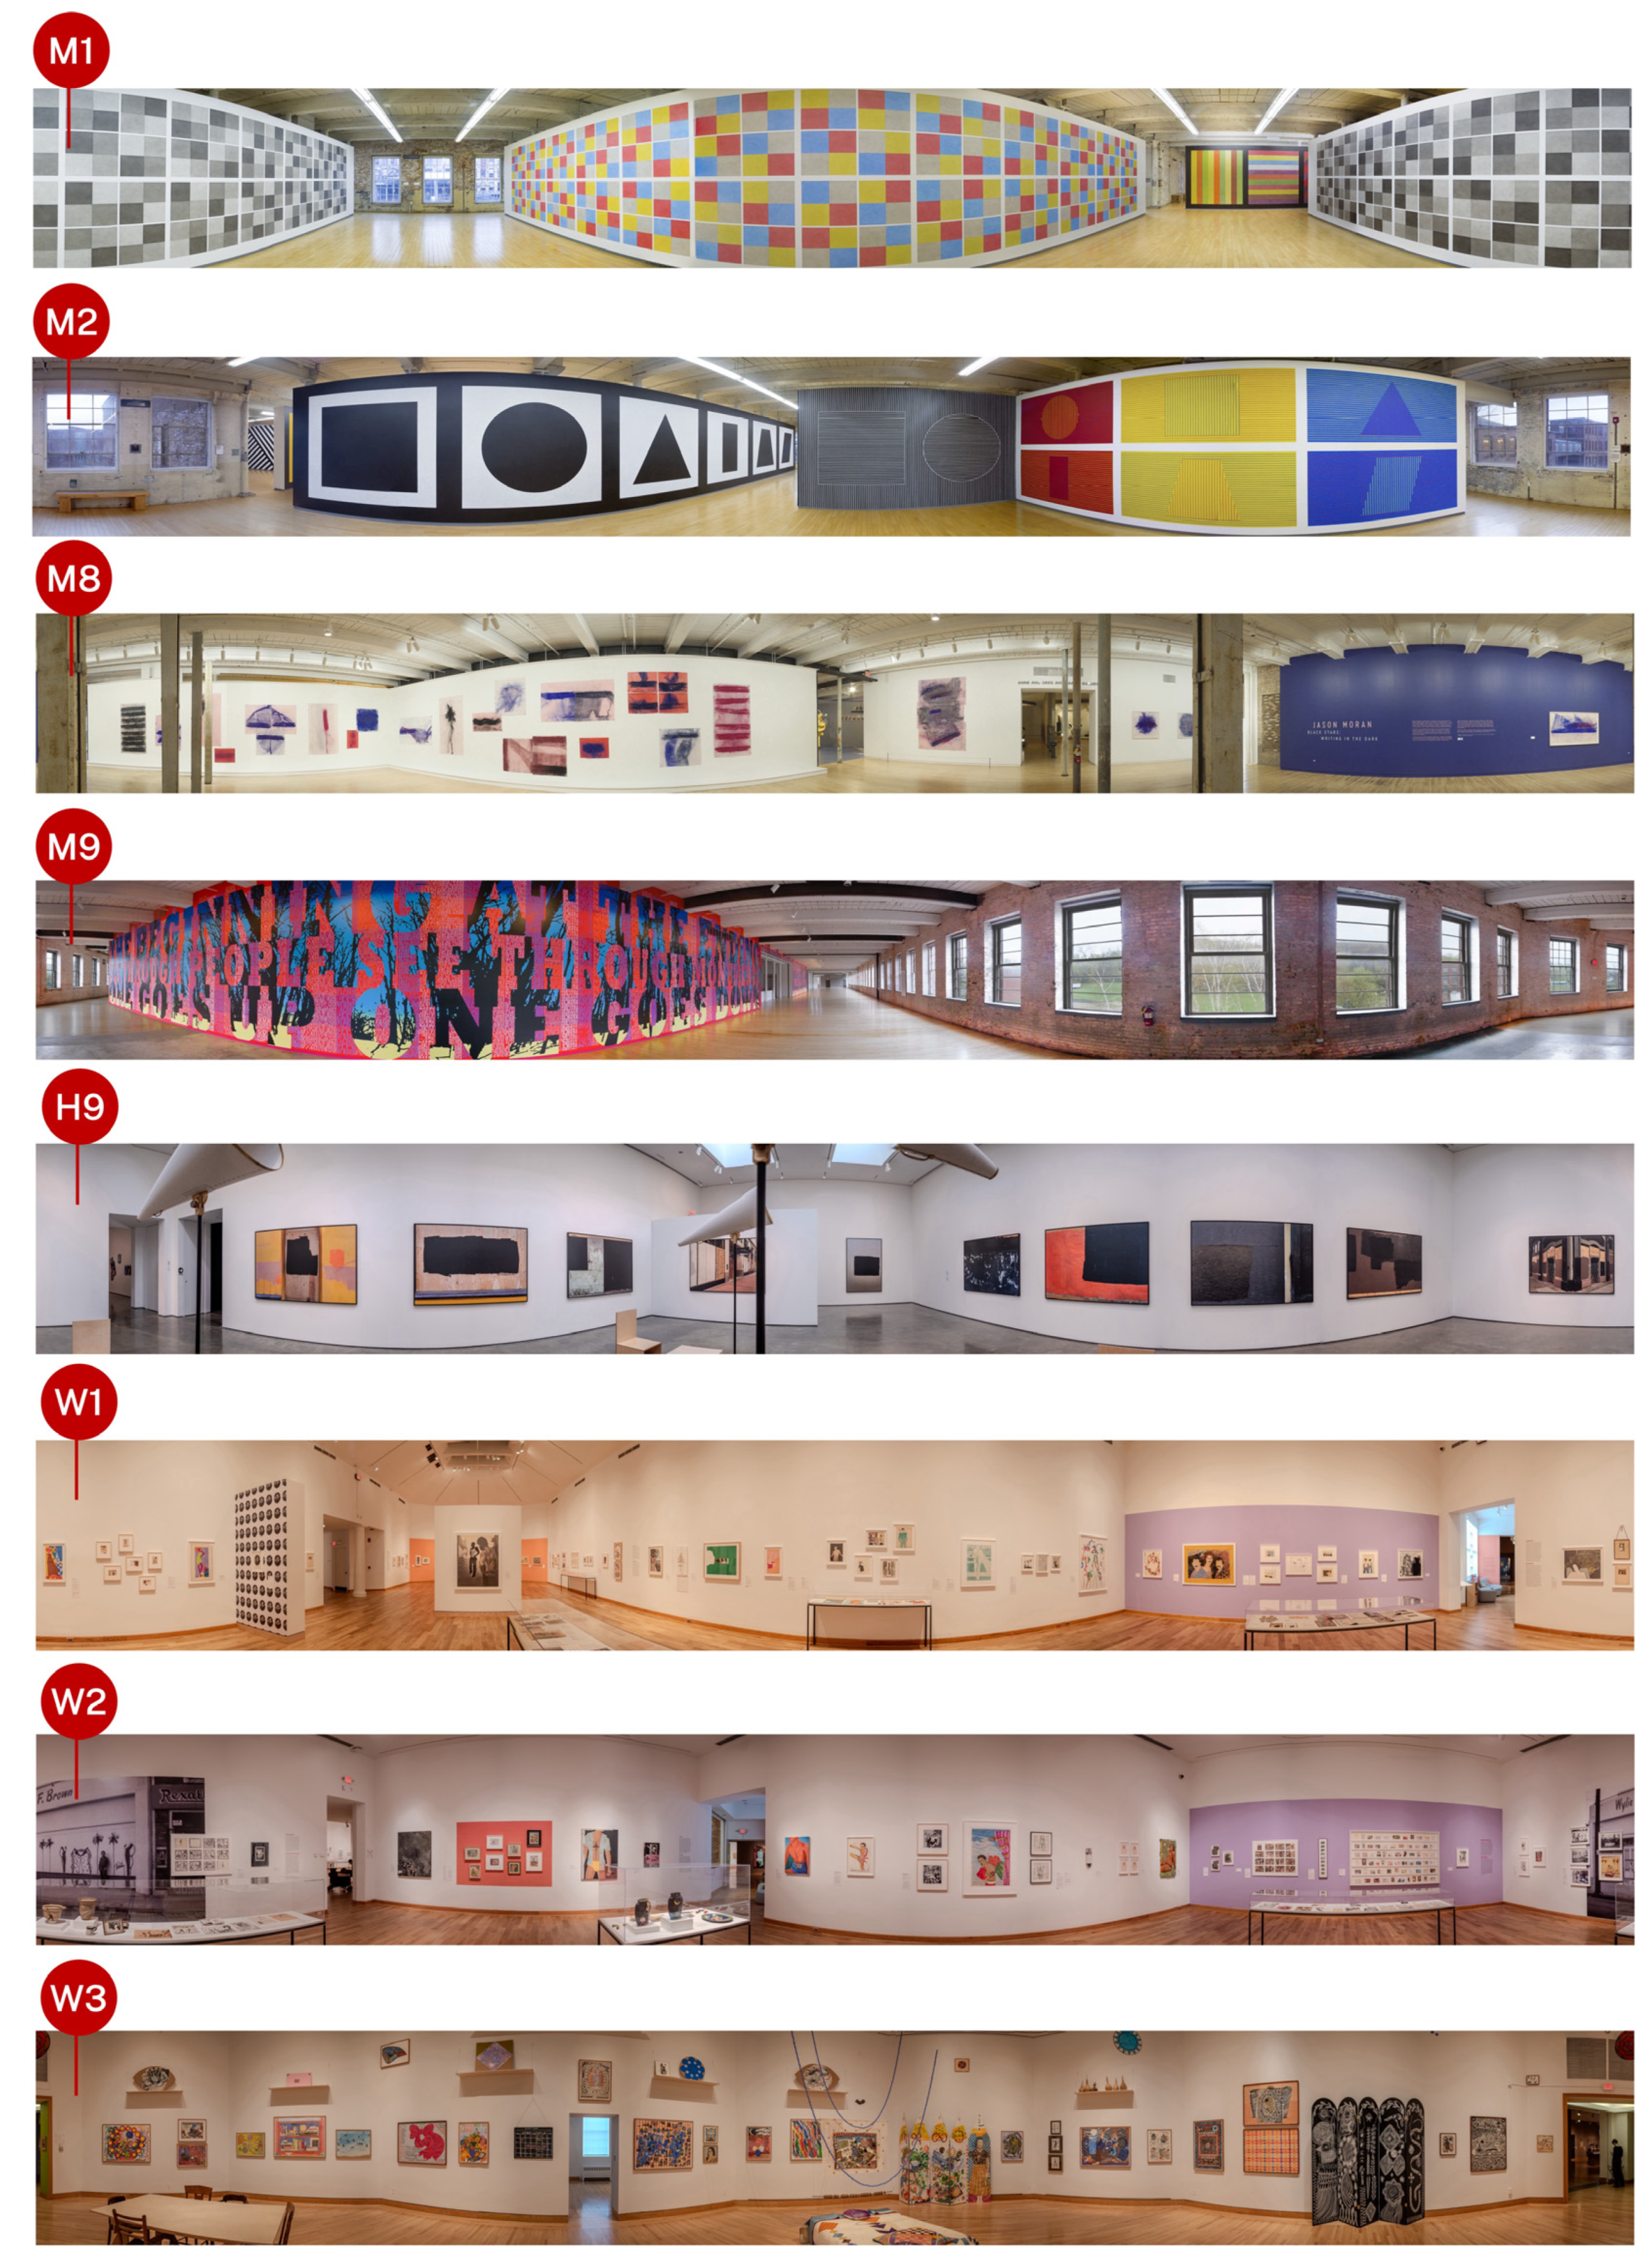
Figure 2.
Distributions of key acoustic metrics under nine absorption conditions: low (CL, FL, WL), medium (CM, FM, WM), and high (CH, FH, WH) applied to ceilings (C), floors (F), and walls (W). Violin plots show the data averaged across six receiver positions in eight galleries (individual points color-coded by room); inset boxes denote the median and interquartile range. Horizontal dashed cyan lines mark target values: 1.0 s and 1.5 s for T₂₀, 0 dB and 5 dB for C₅₀, and 0.45 and 0.60 for STI. ANOVA results are displayed above each graphic. (a) Reverberation time (T₂₀) [500, 1k, 2k]; (b) Speech clarity (C₅₀) [500, 1k, 2k]; (c) Speech Transmission Index (STI).
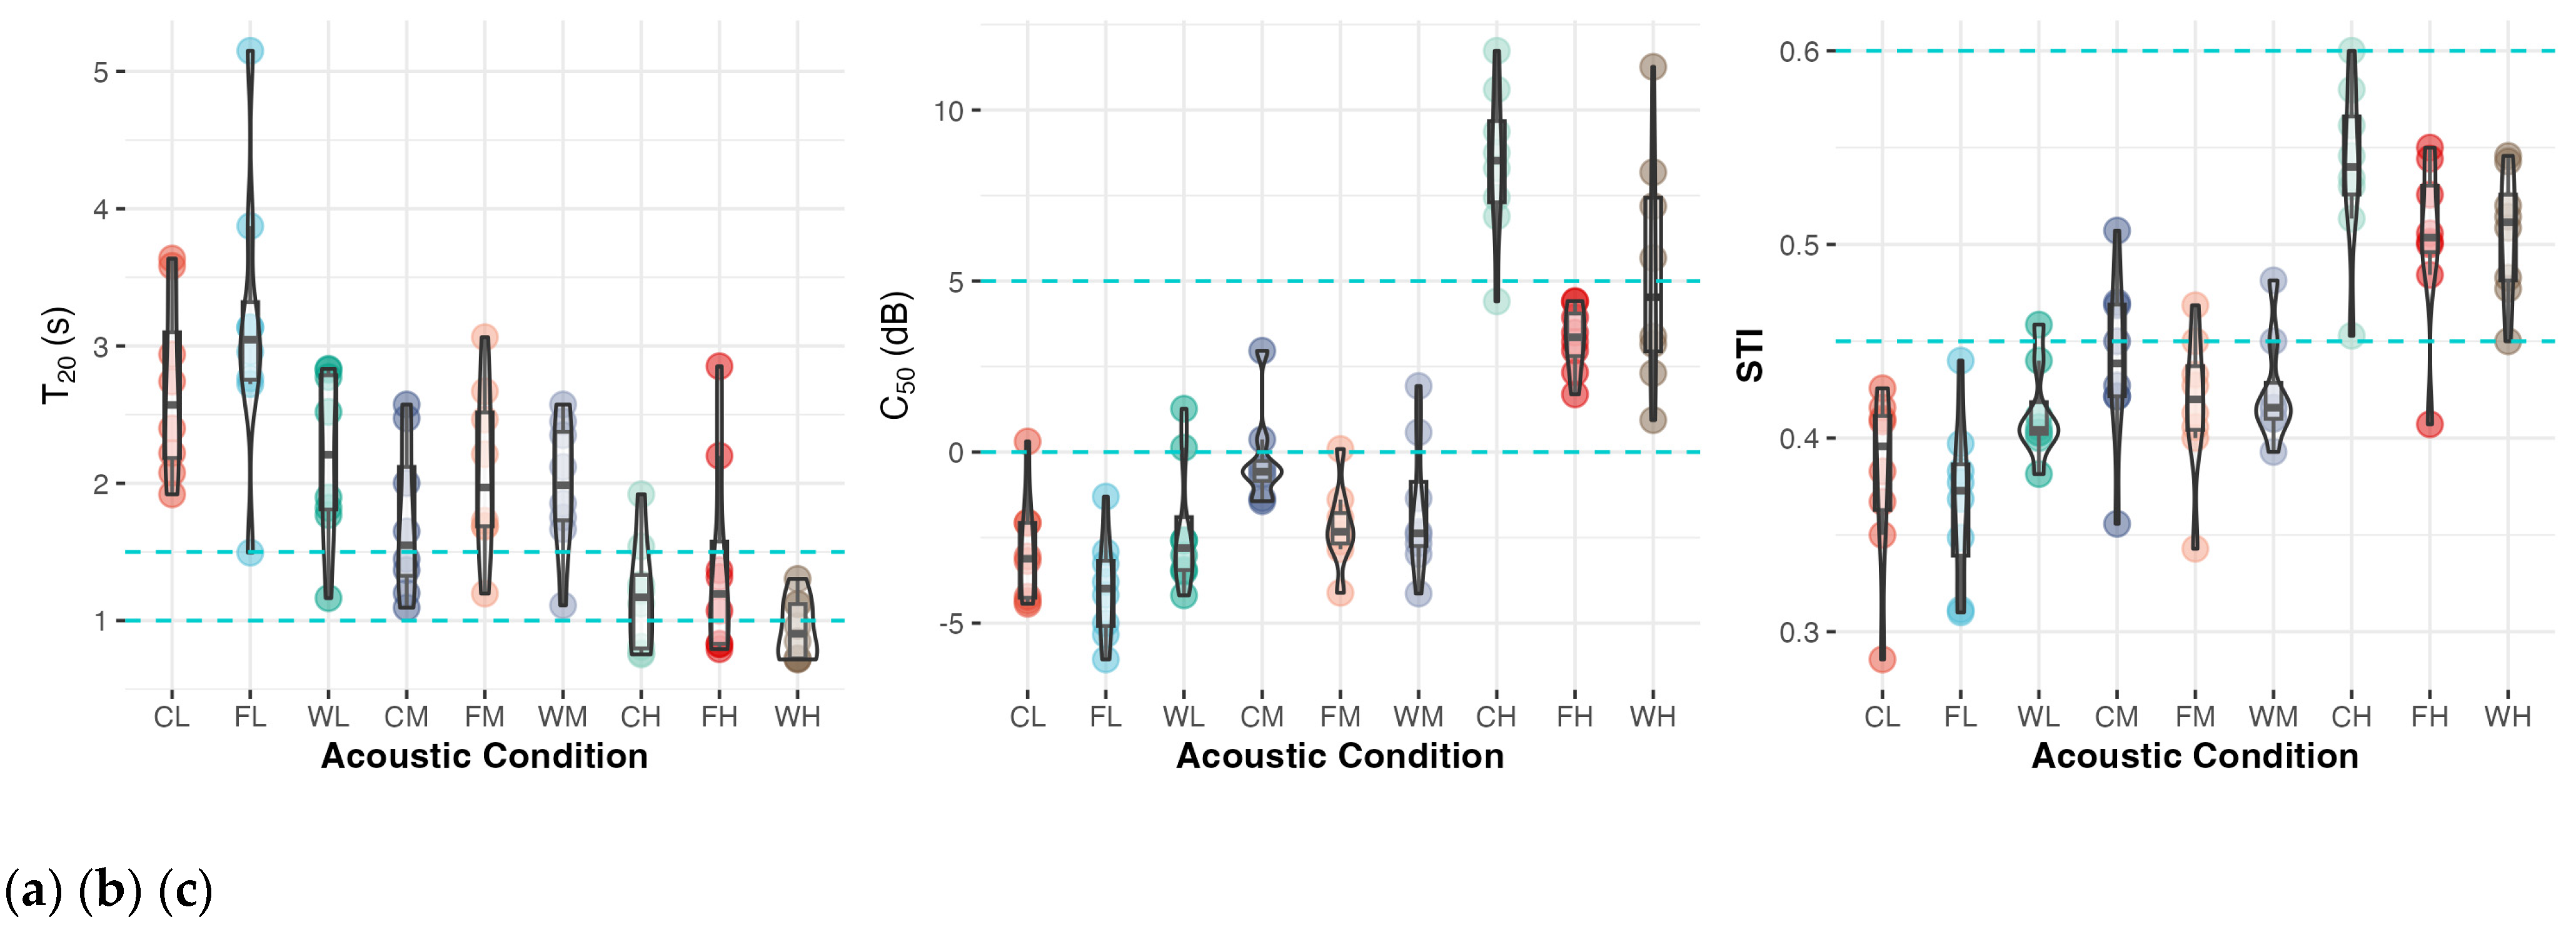
Figure 3.
Distributions of ISO 3382-3 single-number parameters under nine absorption scenarios: low (CL, FL, WL), medium (CM, FM, WM), and high (CH, FH, WH) applied to ceilings (C), floors (F), and walls (W). Violin plots show the average across six receiver positions in eight galleries (individual points color-coded by room); inset boxes represent the median and interquartile range. Horizontal dashed lines mark reference values: 6 m and 12 m for distraction distance, 2 dB and 5 dB for spatial decay rate, and 48 dBA and 52 dBA for speech level at 4 m. ANOVA results are displayed above each panel. (a) Distraction distance (rD); (b) Spatial decay rate of speech (D2,S); (c) A-weighted speech level at 4 m (Lp,A,S,4m). .
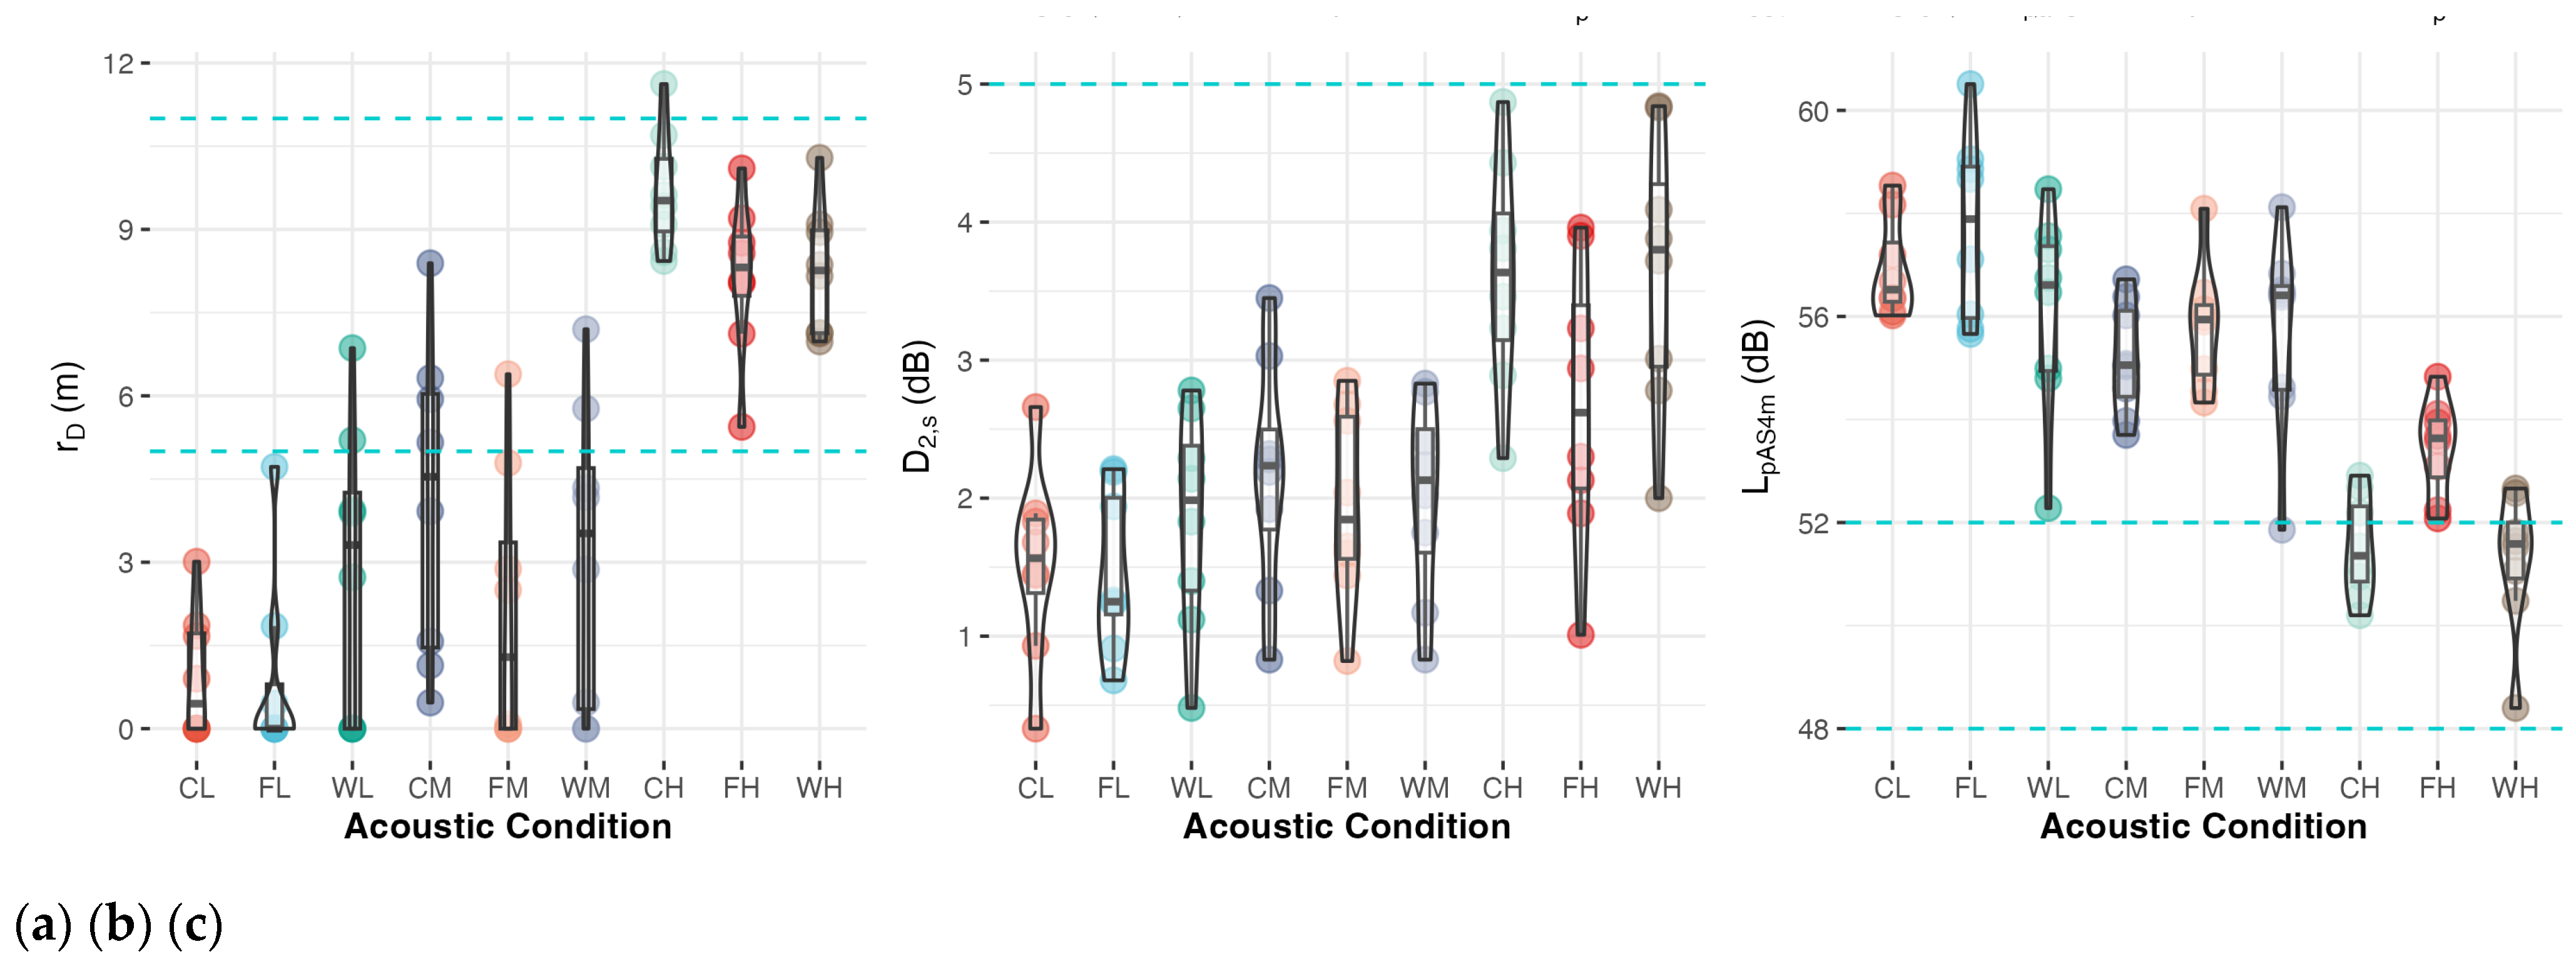
Figure 4.
Predicted STI as a function of total absorption (0–400 Sabins) and room volume (300–1500 m³). Marginal and conditional R² values are shown in the upper right.
Figure 4.
Predicted STI as a function of total absorption (0–400 Sabins) and room volume (300–1500 m³). Marginal and conditional R² values are shown in the upper right.
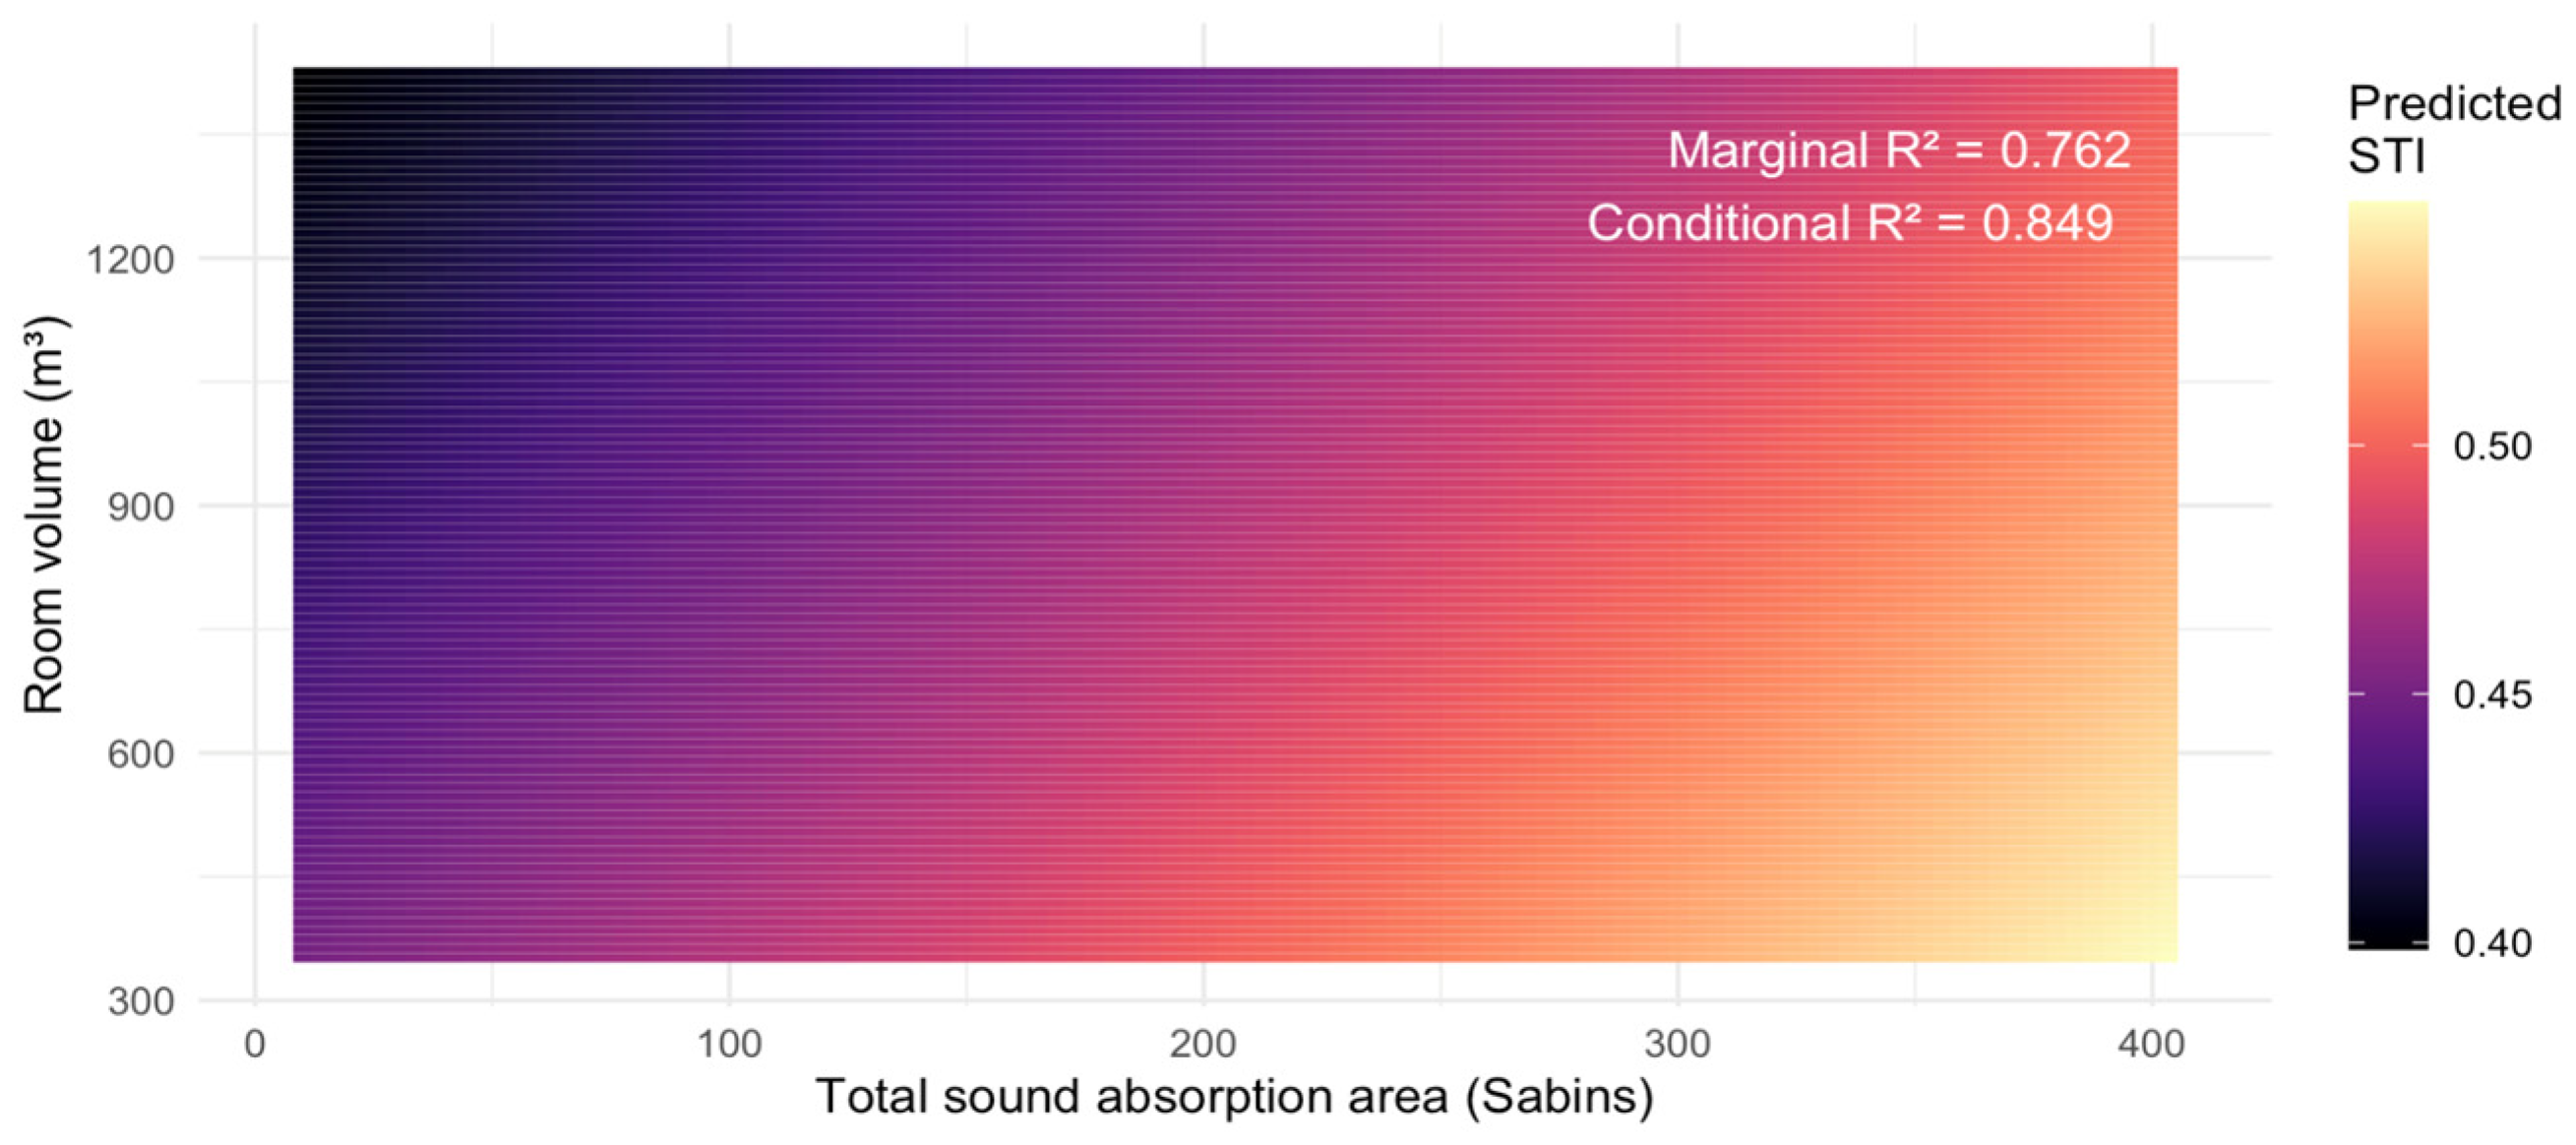

Table 1.
Weighted Sound Absorption Coefficients () and octave-band values for the low, medium, and high absorption treatments applied to ceilings, floors, and walls. Low absorption conditions use fully reflective concrete/masonry; medium absorption conditions employ plywood ceiling panels, wood flooring, or 13 mm gypsum board backed by 100 mm mineral wool; high conditions use microperforated ceiling panels, heavy carpet over concrete floors, or 40 mm acoustic plaster walls.
| Magnitude | Location | Material | Absorption Coefficient | |||||||||
| 63 | 125 | 250 | 500 | 1k | 2k | 4k | 8k | |||||
| Low | All | Fully reflective concrete/masonry | 0.01 | 0.01 | 0.01 | 0.01 | 0.01 | 0.01 | 0.01 | 0.01 | 0.01 | |
| Medium | Floor | Wooden flooring | 0.09 | 0.16 | 0.15 | 0.13 | 0.1 | 0.08 | 0.07 | 0.07 | 0.07 | |
| Wall | 13 mm Gyp board + 100 mm wool | 0.08 | 0.34 | 0.2 | 0.11 | 0.08 | 0.08 | 0.07 | 0.07 | 0.07 | ||
| Ceiling | Plywood paneling 1cm | 0.15 | 0.32 | 0.24 | 0.17 | 0.14 | 0.13 | 0.13 | 0.13 | 0.13 | ||
| High | Floor | Heavy carpet on concrete | 0.4 | 0.18 | 0.18 | 0.2 | 0.27 | 0.44 | 0.63 | 0.59 | 0.35 | |
| Wall | Acoustic plaster 40mm thick | 0.7 | 0.26 | 0.41 | 0.62 | 0.74 | 0.78 | 0.75 | 0.63 | 0.45 | ||
| Ceiling | Micro-perforated panels | 0.8 | 0.16 | 0.26 | 0.5 | 0.81 | 0.94 | 0.9 | 0.85 | 0.8 | ||
Table 2.
Effect of Location and Magnitude on each acoustic parameter.
| Parameter | Location F (2,14), p | Magnitude F (2,14), p | Interaction F (4,28), p |
| T₂₀ | 5.1, p = .021 | 83.8, p < .001 | 3.2, p = .028 |
| STI | 5.7, p = .050 | 122.9, p < .001 | 6.4, p < .001 |
| C₅₀ | 3.5, p = .016 | 797, p < .001 | 7.4, p < .001 |
| rD | 7.9, p = .005 | 74.8, p < .001 | 5.9, p = .0015 |
| D₂S | 3.1, p = .077 | 233.8, p < .001 | 9.4, p < .001 |
| LpAS4m | 8.1, p = .005 | 260.4, p < .001 | 14.6, p < .001 |
Table 3.
Holm-adjusted p-values for Location and Magnitude pairwise contrasts. Ceilings (C), floors (F), walls (W); low (L), medium (M), high (H).
Table 3.
Holm-adjusted p-values for Location and Magnitude pairwise contrasts. Ceilings (C), floors (F), walls (W); low (L), medium (M), high (H).
| Comparison | T₂₀ | STI | C₅₀ | rD | D₂S | LₚAS4m | |
| Location | C vs. F | .044 | .0054 | < .001 | .0069 | .0025 | < .001 |
| C vs. W | .1512 | .5435 | .0682 | .7342 | .579 | .4697 | |
| F vs. W | .0096 | .0447 | .0339 | .041 | .0045 | < .001 | |
| Magnitude | L vs. H | < .001 | < .001 | < .001 | < .001 | < .001 | < .001 |
| M vs. H | < .001 | < .001 | < .001 | < .001 | < .001 | < .001 | |
| L vs. M | < .001 | < .001 | < .001 | < .001 | < .001 | < .001 |
Table 4.
Simple-effects contrasts by surface (Location) and absorption increment (Magnitude). Delta (Δ) is the difference in the mean value when moving from one absorption level to another.
Table 4.
Simple-effects contrasts by surface (Location) and absorption increment (Magnitude). Delta (Δ) is the difference in the mean value when moving from one absorption level to another.
| Location | Contrast | ΔT₂₀ (s) | ΔSTI | ΔC₅₀ (dB) | ΔrD (m) | ΔD₂S | ΔLpAS4m |
| Ceiling | L – M | 0.96 ** | 0.05 ** | 2.67 ** | 3.18 ** | 0.64 ** | 1.74 |
| M – H | 0.55 ** | 0.09 ** | 8.65 ** | 5.59 | 1.45 | 3.66 | |
| H – L | 1.52 ** | 0.15 ** | 11.32 ** | 8.77 ** | 2.09 ** | 5.40 ** | |
| Floor | L – M | 1.06 ** | 0.05 | 1.80 | 1.20 | 0.50 | 1.91 ** |
| M – H | 0.68 ** | 0.08 | 5.48 | 6.08 ** | 0.72 | 2.36 | |
| H – L | 1.75 ** | 0.13 | 7.29 | 7.28 | 1.21 | 4.26 | |
| Wall | L – M | 0.21 * | 0.01 * | 0.57 * | 0.28 * | 0.17 * | 0.43 * |
| M – H | 1.04 | 0.08 | 6.93 | 5.16 | 1.64 ** | 4.38 ** | |
| H – L | 1.26 | 0.09 | 7.50 | 5.43 | 1.81 | 4.81 |
* Contrast not statistically significant (p > .05). ** Largest observed step for that metric.
Disclaimer/Publisher’s Note: The statements, opinions and data contained in all publications are solely those of the individual author(s) and contributor(s) and not of MDPI and/or the editor(s). MDPI and/or the editor(s) disclaim responsibility for any injury to people or property resulting from any ideas, methods, instructions or products referred to in the content. |
© 2025 by the authors. Licensee MDPI, Basel, Switzerland. This article is an open access article distributed under the terms and conditions of the Creative Commons Attribution (CC BY) license (http://creativecommons.org/licenses/by/4.0/).
Copyright: This open access article is published under a Creative Commons CC BY 4.0 license, which permit the free download, distribution, and reuse, provided that the author and preprint are cited in any reuse.


