
Submitted:
16 June 2025
Posted:
17 June 2025
You are already at the latest version
Abstract
This study evaluates the suitability of agricultural land use (LUS) in the Tarquinia Plain, central Italy. The research focuses on processing tomatoes, a key high-value crop, and assesses its suitability under current and future climate change scenarios (RCP4.5 and RCP8.5, 2011-2100). The methodology follows the FAO guidelines and integrates climatic projections, as well as physical and chemical soil characteristics, alongside crop management practices. Expert knowledge was incorporated through the Analytical Hierarchy Process (AHP) to assign weights to variables, reflecting diverse perspectives on the relative importance of climate versus soil factors. The LUS assessment, which integrates all variables, currently classifies the Tarquinia Plain as moderately suitable (S2) for tomato cultivation. However, future climate projections indicate significant impacts: under the RCP8.5 scenario, areas classified as highly suitable decline, and moderately suitable areas transition to marginally suitable, with only 12.45% remaining moderately suitable by 2100 and no areas classified as highly suitable. This study underscores the critical influence of climatic variables on agricultural potential, emphasizing the urgent need for adaptive strategies in crop management for the Tarquinia Plain.
Keywords:
climatic projection
; crop management
; soil parameters
; Analytical Hierarchy Process
; GIS
1. Introduction
According to the Food and Agriculture Organization (FAO), land evaluation is the process of assessing the potential of land for different uses based on its inherent characteristics [1].
This method has long been the primary approach employed worldwide for land use planning [2,3,4]. The need for land evaluation today is driven by evolving challenges, including changing policies, agricultural market trends, and the pressures of climate change. As future climate scenarios alter the conditions for crop development, ensuring the rational use of natural land becomes critical for sustainable development. Achieving sustainable crop production under these changing conditions will significantly impact actors and processes within the agri-food system, challenging their resilience and adaptability [5]. Agricultural systems in various countries, including Italy, are particularly vulnerable to the effects of climate change, with the Mediterranean region at heightened risk due to its unique climatic and environmental conditions [6,7]. In the coming decades, the intensification of unpredictable extreme weather events and climate disruptions will place additional pressure on the agricultural sector, and adaptive strategies will be required to support resilient agricultural systems [8,9]. The expected decrease in agricultural productivity and the challenges of adaptation could significantly affect economic growth [10]. To develop effective mitigation and adaptation strategies across the agricultural value chain, it is essential to understand the impacts of climate change on agricultural suitability, productivity, and incomes [11]. Much of the literature on climate change and climate variability has emphasised the importance of management and adaptation responses at the farm level to effectively address future scenarios [12,13,14].
In this context, Land Use Suitability (LUS) provides a scientific basis for adaptive management strategies to optimize land use by identifying the most suitable areas for specific crops, while reducing soil degradation and conserving resources [15,16]. LUS assessment helps identify vulnerabilities, such as areas prone to drought or flooding, enabling the implementation of targeted mitigation strategies, such as the selection of drought-resistant crops or improved irrigation systems [17]. This can help farmers and policymakers by providing valuable insights for land-use planning and the development of agricultural policies aimed at food security and sustainable development [18,19].
This study evaluates the impact of future climate change on crops sustainability by using an ensemble of global and regional climate models to analyze mean temperature, and total precipitation under two scenarios for the period 2031–2090, with 1986–2005 as the reference period. The study integrates climate projections with soil, topographical, and agronomic data to conduct a LUS assessment, aiming to support the resilience of agricultural practices under future climate scenarios in a Mediterranean area [20]. The study was conducted in the pilot area of Tarquinia (Italy), a case study within the LENSES project funded by the PRIMA Foundation. This region is heavily reliant on irrigated agriculture, particularly industrial tomato production, which is crucial for the local economy. However, this sector is increasingly vulnerable to climate change and faces growing competition for natural resources, underscoring the necessity for adaptive and sustainable strategies.
2. Materials and Methods
2.1. Study Area
The “Tarquinia Plain” is located approximately 90 kilometers north of Rome in the Lazio region of Central Italy (Figure 1). The area under consideration lies between Lake Bolsena and the coastline in front of the municipality of Tarquinia. The region has a typical Mediterranean climate, with warm, dry summers and mild winters, the Koppen-Geiger classification is ‘Csa’ [21]. In the Tarquinia municipality, the average annual rainfall is around 593 mm – 811 mm, predominantly occurring in autumn and spring. The mean daily temperature is 15,5°C, ranging from 7°C in January to 23°C in July (https://en.climate-data.org/europe/italy/lazio/tarquinia-14488/.).
Historically known for its high productivity, agriculture continues to play a vital role in the region's economy. The agricultural landscape is characterized by intensive farming practices with a mix of rainfed winter cereals and irrigated crops, with tomatoes being one of the main high-value crops in the area.
2.2. Data Set and Processing Procedure
Figure 2 summarizes the dataset and processing procedure for estimating the LUS index. This includes data on climate projections, landscape and soil characteristics, and crop management practices. The methods used to assess the LUS index are described in detail in the following sections.
2.2.1. Climatic Projections
The data used in the following analysis were retrieved from the Copernicus Climate Change Service [22] and the Earth System Grid Federation [23]. The examined climate variables are the mean temperature (T), and precipitation (P). Regarding the units of the variables, for mean temperature, the data represent the mean ambient air temperature at 2 m above the surface, and the original unit of the variable was Kelvin (°K), but a unit conversion to Celsius (°C) has been applied. For the precipitation, the variable of the precipitation flux is used, after a conversion to mm·s-1. As for the spatial resolution of the datasets, the best available resolution was chosen, i.e. 0.11° (about 12 km), while the temporal resolution of the input data is daily. Climate projections are influenced by a range of uncertainties, including sampling uncertainty, model uncertainty, scenario uncertainty, and the natural or internal variability of the climate system. These factors collectively contribute to the complexity and variability inherent in climate modelling [24]. The uncertainty due to the choice of climate model is taken into account by using the ensemble of climate models, as several studies have shown that multi-model ensembles produce more accurate results than individual models [25,26].
The analysis was conducted for two distinct periods, the reference period from 1971 to 2000 and a future period from 2011 to 2100. For the future period, the analysis was based on two Representative Concentration Pathways (RCPs). The RCPs, adopted by the IPCC in 2014 [27], outline four different pathways for GHG emissions, atmospheric concentrations, air pollutant emissions and land use throughout the 21st century. Among the four RCPs, RCP2.6 represents a scenario with stringent measures to reduce GHG emissions, while RCP4.5 and RCP6.0 are intermediate scenarios. RCP8.5, on the other hand, assumes no effort to reduce GHG emissions [27]. Scenarios that assume no additional mitigation efforts, referred to as 'baseline scenarios', correspond to pathways between RCP6.0 and RCP8.5.
For this study, RCP4.5 and RCP8.5 were selected. The former is used to examine a more realistic mitigation scenario (compared to RCP2.6), while the latter represents a business-as-usual scenario, providing a basis for comparison. The methodology is described in detail in Papadaskalopoulou et al. (2023)[28].
2.2.2. Physical and Chemical Soil Characteristics
A spatial database containing comprehensive data on physical and chemical soil characteristics has been developed. This includes topographic features, wetness, soil physical and fertility properties, and salinity and alkalinity metrics, among other attributes (Table 1). In Table 1, the different types of factors used in this study were described.
Due to the unavailability of detailed soil data at the territorial scale, in this study, we have chosen to use data at the European level, complemented by national or global data sets. This approach ensured the replicability of the method across different regions.
2.2.3. Crop Management
A crop management database was established, containing information on the main crops cultivated in the area, including details about the growing season and cycle, as well as irrigation and input management information. In this area, industrial tomato was among the most commonly grown crops, making it a suitable choice for assessing the long-term impact of climate scenarios. All crop management data were gathered from local experts and FAO data [32].
2.2.4. Land Use
The land use map of the area was developed using the 2018 CORINE Land Cover [33] dataset for the entire river basin. For the area managed by the Water User Association “Consorzio di Bonifica Litorale Nord” (WUA), where the primary irrigated crops are located, additional data was incorporated. This included a map provided by the WUA with geometric details derived from cadastral layers, and information on the crops registered for the specific year under analysis.
2.3. Methods
The methodology employed for the LUS assessment follows the FAO guidelines [1,25]. The first step in this process is to select the crop for which a suitability assessment was done. In this study, the processing tomato was selected. After this, the collection of soil, crop and climate data was done.
The analysis integrates crop, soil and climate data as input parameters and assigns scores based on established thresholds from Sys et al. [32]. A suitability rating is attributed to each land characteristic. An overlay GIS combined the different layers: topography, wetness, physical soil characteristics, soil fertility characteristics, salinity and alkalinity, and climate ( temperature and precipitation), considering as inputs the variables shown in Table 1. The crop requirements were further adjusted to suit the conditions of the study area. Expert insight is integrated using the Analytical Hierarchy Process (AHP) [34], which facilitates collaboration between agricultural experts and scientists. This process allows for the analysis of various variables, as climatic, crop, and soil characteristics do not hold the same level of importance or relevance (Tables S1 and S2 in Supplementary data). The first step involved preparing a list of the variables associated with the selected crop to be evaluated using the "FAO Land Evaluation Framework". Once the variables were defined, the local tomato experts assigned scores based on their experience. Subsequently, the weights of the different variables were calculated using symmetric matrices to determine the average vector, which represents the weighting of each variable. Finally, variables’ weights were calculated using the “fundamental scale of absolute numbers” (Table 2). It is important to clarify that there are no incorrect answers in the survey; it is based on the experts’ knowledge and experience.
The pilot area was then classified, by assessing and categorizing the land types into orders and classes based on their suitability. The order defines the suitability and is expressed by: S -suitable, which characterises a land where sustainable use giving good benefits is expected; N - not suitable, indicating a land whose qualities do not allow the considered type of use, or are not enough for sustainable outcomes. The classes (1, 2 and 3 for suitable order; 1 and 2 for unsuitable order) express the degrees of suitability or unsuitability. The methodology culminates in the production of maps depicting LUS scores and FAO classes (Table 3), which together can provide valuable insights for effective decision-making in agricultural planning.
Given a set of maps and their corresponding thresholds, we obtained a result in classifying areas suitable for tomato crops. The decision-maker from the study area, directly assigned "relative importance" weights to each layer of the attribute map. In addition to the production of maps for the main land uses with the five FAO classes, climate data projections were used to produce soil suitability maps for the selected crops under different climate scenarios (RCP4.5 and RCP 8.5 for 2050 - 2070 - 2090). Maps were produced using average values: i.e. for the year 2050, we take the average value of climatic variables between 2041 and 2050; for 2070, an average between 2061 and 2070, and so on. The method was implemented using the QGIS system [35].
3. Results
3.1. Climate Projections Results
3.1.1. Mean Temperature
The results of the projected annual mean temperature for the period 2011–2100 demonstrate a consistent upward trend in both scenarios. Under the RCP4.5 scenario, the increase over the 90 years is projected to be up to 1.9°C . By contrast, the RCP8.5 scenario predicts a much larger increase, with temperatures rising by 4.3°C. In both scenarios, the annual mean temperature remains consistently above 15°C throughout the projection period. The maximum value of the annual mean temperature is observed in the case of the RCP8.5 and specifically in the last years of the time series, when it reaches a value of about 19.5°C. The mean temperature of the reference period and future sub-periods is shown in Table 4. It can be seen that the absolute change of the mean temperature compared to the reference period is +1°C for both scenarios in the short-term, while in the long-term it is expected to reach up to +2.3°C and +4.0°C, respectively, for the RCP4.5 and RCP8.5. In addition, in the near-term the absolute value of the mean temperature is expected to be 16°C for both scenarios. This value gradually increase in the long-term to 17.3°C and 18.9°C (2071-2100) for RCP4.5 and RCP8.5, respectively.
Regarding the spatial distribution shown in Figure 3, during the reference period, mean temperatures range from approximately 14°C in the northern part of the pilot area to about 17°C in the southern part. For the 2041–2070 period, projections indicate significant temperature increases across the entire pilot area under both scenarios.
3.1.2. Total Precipitation
The projected mean annual total precipitation for the period 2011-2100 tends to decrease for both scenarios. According to the results for both RCPs in fact, the trend shows a decrease of about 60 mm, with slightly higher values expected for RCP4.5. Additionally, the total precipitation for both scenarios is above 400 mm for almost the entire 90-year period.
Table 5 describes the projected average annual total precipitation for the future sub-periods considered, grouped into dry and wet periods of the year. In the case of the Tarquinia pilot area, the dry months include April to October, while the wet period starts from November to March. The total precipitation is expected to increase in both scenarios over the period 2011-2070. The exception is RCP4.5 2041-2070, where a decrease of 10 mm is expected during the dry period. For the long-term 2071-2100, a decrease is expected for both scenarios and seasons, with a maximum reduction of -27 mm for RCP8.5 during the dry season.
Figure 4 displays the geospatial variation in total precipitation for the periods 1971-2000 and 2041-2070, encompassing both the dry and wet seasons of the year. It is evident that during the wet period, an estimated 320 to 350 mm of precipitation per year occurs. Additionally, the dry period experiences around 325 to 360 mm projected across the entire pilot area. Looking at the overall average data, there are no significant variations in precipitation. However, as shown in Figure 3, some areas become drier during the dry periods, while humid areas receive more precipitation during the winter months.
3.2. LUS Index for Processing Tomatoes
To construct the LUS index, collaboration with local experts was essential to customize the proposed framework to the region's agricultural context and most commonly cultivated crops. In this case, experts contributed (during the interviews) to the weighting of the variables relevant to industrial tomato cultivation. The experts exhibited differing perspectives: one group prioritized climatic variables as more significant, while the other emphasized the importance of soil-related factors.
The methodology evaluated five critical components indices: topography (slope), wetness (flooding and drainage), physical and soil attributes (texture, coarse fragments, soil depth, CaCO3, and gypsum), soil fertility (CEC, base saturation, basic cations, pH, and organic carbon), and salinity/alkalinity (electrical conductivity and exchangeable sodium percentage).
Figure 4 and Figure 5 show the result of the LUS for each variable for industrial tomatoes. Figure 4A illustrates the LUS assessment based on topographical factors. Darker areas, with slopes exceeding 16%, are deemed unsuitable for industrial tomato cultivation and are expected to remain so. Conversely, the greenest areas indicate slopes ranging from 0% to 4%, which are highly suitable for supporting the growth of industrial tomatoes. In Figure S2, two variables are displayed: flooding and drainage (left side of the image), and the wetness factor on the right. The wetness factor (Figure 4B) is given by the combination of flooding and drainage. It is important to note that areas unsuitable marginal suitable for tomato cultivation are found near the Marta River. The soil physical characteristics map (Figure 4C), which incorporates soil texture, coarse fragments, soil depth, gypsum, and carbonate calcium (CaCO3), reveals certain regions that are permanently marginally suitable due to unfavourable carbonate calcium and texture properties (Table 6). Soil fertility characteristics, including pH, organic carbon, cation exchange capacity (CEC), base saturation, and basic cation exchange, highlight critical factors impacting suitability (Figure 5A). Specifically, pH, organic carbon levels, and apparent CEC emerge as significant constraints for tomato cultivation (Table 6). Most of the area is only marginally suitable, with several zones being temporarily or permanently unsuitable. Similarly, alkalinity index, composed of salinity and alkalinity (Figure 5B) were was classified as S1 through interpolation methods. However, an area should be considered unsuitable because it is located near the Tarquinia Saline, adjacent to the sea, and this indicates the need However, anomalies near the Salinas of Tarquinia, which are adjacent to the sea, point to the need for higher resolution mapping to more accurately capture localized variations.
The integration of all soil variables—topography, physical characteristics, fertility, wetness, salinity, and alkalinity—is illustrated in Figure 6. This comprehensive figure identifies the area as average suitable (S2 class) for tomatoes, consistent with the region's primary land uses of irrigated tomato cultivation and rainfed wheat production. These findings underscore the importance of targeted management practices to optimize agricultural potential within the Tarquinia region.
In scenario RCP8.5, highly suitable areas (S1) are shown to decline, losing their favourable status due to adverse climatic factors. Average suitable areas (S2) experience a notable shift, transitioning into marginally suitable zones (S3), as shown in Figure 7. These findings underscore the critical influence of climatic variables in altering the agricultural potential of the region, emphasizing the need for adaptive strategies in crop management.
The results presented in Figure 8 highlight the contrasting impacts of climate scenarios RCP 4.5 and RCP 8.5 on tomato crop suitability when integrating soil properties and climatic variables. Under RCP 4.5, the suitability of areas for cultivation remains relatively stable over time, with an increase in 2070. In the RCP 8.5 scenario, by 2040, 41.55% of the region is deemed moderately suitable for tomato cultivation. By 2100, this percentage increases to 60.68%. However, by 2100, this percentage drops significantly, with 49% of the region remaining moderately suitable.
Notably, no areas are identified as highly suitable for tomato cultivation in this scenario, reflecting the severe impact of intensified climatic stressors on agricultural productivity.
4. Discussion
This study presents a comprehensive approach to creating a land suitability map for processing tomatoes within a Mediterranean context, taking into account crop-specific requirements and environmental factors. Climate projections over a 70-year horizon, based on RCP 4.5 and RCP 8.5 scenarios, were also incorporated to assess future conditions. These factors are crucial for identifying areas at risk of nutrient and water limitations and for understanding the broader impacts of climate change. The results indicate relatively stable temporal patterns but reveal significant impacts on suitability driven by temperature and climate changes. The study’s outputs include detailed maps categorizing the Tarquinia area into five FAO suitability classes, ranging from Highly Suitable (S1) to Permanently Unsuitable (N2). This integrated approach, which identifies current and projected challenges, may serve as a predictive tool to guide land management decisions and mitigate future risks for sustainable agriculture. Currently, the major soil limitations for tomatoes in this area include pH; organic carbon levels, CEC, CaCO3 and texture in some areas. This is in line with the findings of Amara et al.[36], who argue that soil pH and texture are critical suitability criteria for tomato and cabbage production. An analysis of the long-term LUS index revealed notable differences in the impacts of climate scenarios RCP 4.5 and RCP 8.5 on tomato crop suitability when both soil properties and climatic variables are considered (Figure 8). Under RCP 4.5, areas suitable for tomato cultivation show remarkable stability over time, suggesting that moderate mitigation efforts can help maintain agricultural viability. This is consistent with research indicating that proactive measures under milder climate change scenarios can stabilize agricultural systems [37].
On the other hand, the worst-case scenario (RCP 8.5) does not indicate as much long-term deterioration as expected. This may be due to our reliance on aggregated climatic data, which can mask critical effects and/or tipping points. While total annual precipitation may remain constant, it could manifest as extreme, concentrated events over short periods. Currently, the methodology does not account for these extremes, limiting its predictive capacity for long-term scenarios. Another relevant aspect is soil health. At present, we are utilizing current soil data; however, factors such as erosion, compaction, and loss of organic matter can significantly impact soil suitability in the future.
This study acknowledges certain limitations that may impact the quality of results, including challenges related to data quality and accessibility. Specifically, higher-resolution geometrical data could enhance the precision of the findings, providing a clearer understanding of localized issues, such as salinity variations, which are critical for accurate land suitability assessments. This is supported by the study of De Feudis et al. [38], which highlighted how the availability of high-quality environmental databases, complemented by expert GIS, enables the sequential creation of thematic map series that are particularly useful for evaluating the potential presence of external and/or internal soil limiting factors and identifying possible interventions to correct or mitigate them. Addressing these limitations through improved data acquisition and integration would significantly strengthen the study's outcomes.
The methodology employed in this study is adaptable to other regions with varying climates and crops. This approach has already been applied in other Mediterranean areas as part of the LENSES project, including Spain, Turkey, and Greece, while taking into account the specific characteristics of each region. Additionally, the differing viewpoints of experts contribute to the multifaceted considerations required for such assessments across diverse landscapes.
5. Conclusions
This study developed a land-use suitability assessment system for processing tomatoes in the Tarquinia Plain, utilizing soil, crop, and climate data in both current and long-term scenarios. The results indicate that under RCP 4.5 and RCP 8.5, the suitability of areas for cultivation declines in the ‘S2- Average suitable’ category and remains relatively stable over time, with no significant changes observed. However, the analysis underscores the importance of adopting effective agricultural practices to enhance marginally and average suitable areas, as failing to do so could negatively impact yields.
As climate change continues to reshape agricultural landscapes, integrating land suitability assessments into agricultural planning becomes essential. This approach not only strengthens food security but also promotes environmental sustainability and economic resilience within the agricultural system. Overall, this methodology offers significant opportunities for various stakeholders, the index serves as a valuable tool for identifying regions with optimal conditions for specific crops, facilitating strategic decision-making regarding site selection, expansion, and resource allocation. Policymakers can utilize the index to inform land use planning, encouraging agricultural growth in suitable areas and fostering sustainable development within the sector. Furthermore, the index facilitates collaboration and the dissemination of knowledge among researchers, experts, and practitioners, thereby contributing to the continuous refinement of suitability assessment accuracy and relevance. This integrative approach ensures that the methodology benefits all stakeholders, supporting the advancement and resilience of the agricultural sector.
Supplementary Materials
The following supporting information can be downloaded at the website of this paper posted on Preprints.org.
Author Contributions
Conceptualization, S.V., V.B.; methodology, E.H.,M.L.L.,A.O.,C.P.,M.A, D.T., J.G.P.,J.M.G.; validation, X.X., Y.Y. and Z.Z.; formal analysis, E.H.,M.L.L.,A.O.,C.P.,M.A, D.T., J.M.G..; data curation, E.H.,M.L.L.,A.O.,C.P.,M.A, D.T., J.G.P.,J.M.G.; writing—original draft preparation, S.V., V.B.; writing—review and editing, E.H.,M.L.L.,A.O.,C.P.,M.A, D.T., J.M.G, S.F.; funding acquisition, S.F.. All authors have read and agreed to the published version of the manuscript.
Funding
This research was funded by the PRIMA programme, supported by the European Union. GA no [2041] [LENSES—Learning and action alliances for Nexus environments in an uncertain future] [Call 2020 Section 1 Nexus IA].
Data Availability Statement
Data will be made available on request.
Acknowledgments
The authors would like to thank David Tofi and Vicente Bodas for Expert Consultancy.
Conflicts of Interest
C.P., M.A. and D.T. were employed by DRAXIS Environmental S.A.; E.H., M.L.L. and A.O. were employed by AgriSat Iberia S.L.. The remaining authors declare that the research was conducted in the absence of any commercial or financial relationships that could be construed as a potential conflict of interest.
References
- Food and Agriculture Organization of the United Nations (FAO). 2007. Land evaluation: Towards a revised framework for the assessment of land resources. Food and Agriculture Organization of the United Nations. Retrieved from http://www.fao.org/3/a-i5435e.
- Joshi, P. K. , et al. (2015). Land evaluation for sustainable land management: A review. Environmental Management, 55(3), 519-534. [CrossRef]
- Guedes, J.D. New Lives for Ancient and Extinct Crops, Paul E. Minnis (Ed.), University of Arizona Press, Tucson, Arizona, USA (2014), (288 pp., hardback), ISBN: 978-0-8165-3062-5. Agric. Syst. 2015, 140, 87–88. [Google Scholar] [CrossRef]
- Van der Ploeg, S. H. J. A. , et al. (2020). Land evaluation and planning for sustainable land use. Agricultural Systems, 178, 102722. [CrossRef]
- Yang, Y.; Tilman, D.; Jin, Z.; Smith, P.; Barrett, C.B.; Zhu, Y.-G.; Burney, J.; D’oDorico, P.; Fantke, P.; Fargione, J.; et al. Climate change exacerbates the environmental impacts of agriculture. Science 2024, 385, eadn3747. [Google Scholar] [CrossRef]
- Wiebe, K.; Lotze-Campen, H.; Sands, R.D.; Tabeau, A.; Van Der Mensbrugghe, D.; Biewald, A.; Bodirsky, B.L.; Islam, S.; Kavallari, A.; Mason-D'Croz, D.; et al. Climate change impacts on agriculture in 2050 under a range of plausible socioeconomic and emissions scenarios. Environ. Res. Lett. 2015, 10, 85010–85024. [Google Scholar] [CrossRef]
- Pulighe, G.; Di Fonzo, A.; Gaito, M.; Giuca, S.; Lupia, F.; Bonati, G.; De Leo, S. Climate change impact on yield and income of Italian agriculture system: a scoping review. Agric. Food Econ. 2024, 12, 1–21. [Google Scholar] [CrossRef]
- McDowell, J.Z.; Hess, J.J. Accessing adaptation: Multiple stressors on livelihoods in the Bolivian highlands under a changing climate. Glob. Environ. Chang. 2012, 22, 342–352. [Google Scholar] [CrossRef]
- Sharma, R. K. , et al. (2021). Land evaluation for sustainable development in the context of climate change. Land Use Policy, 102, 105207. [CrossRef]
- Food and Agriculture Organization of the United Nations (FAO). 2022. FAO Strategy on Climate Change 2022–2031. Rome.
- Abd-Elmabod, S.K.; Muñoz-Rojas, M.; Jordán, A.; Anaya-Romero, M.; Phillips, J.D.; Jones, L.; Zhang, Z.; Pereira, P.; Fleskens, L.; van der Ploeg, M.; et al. Climate change impacts on agricultural suitability and yield reduction in a Mediterranean region. Geoderma 2020, 374. [Google Scholar] [CrossRef]
- Reidsma, P.; Ewert, F.; Lansink, A.O.; Leemans, R. Adaptation to climate change and climate variability in European agriculture: The importance of farm level responses. Eur. J. Agron. 2010, 32, 91–102. [Google Scholar] [CrossRef]
- (Ipcc), I.P.O.C.C. Climate Change 2021 – The Physical Science Basis; Cambridge University Press (CUP): Cambridge, United Kingdom, 2023. [Google Scholar]
- Zhao, J.; Bindi, M.; Eitzinger, J.; Ferrise, R.; Gaile, Z.; Gobin, A.; Holzkämper, A.; Kersebaum, K.-C.; Kozyra, J.; Kriaučiūnienė, Z.; et al. Priority for climate adaptation measures in European crop production systems. Eur. J. Agron. 2022, 138. [Google Scholar] [CrossRef]
- Food and Agriculture Organization of the United Nations (FAO). 1976. A Framework for Land Evaluation. Food and Agriculture Organization of the United Nations.
- Luo, F.; He, L.; Chen, Z.; He, Z.; Bai, W.; Zhao, Y.; Cen, Y. Optimizing arable land suitability evaluation using improved suitability functions in the Anning River Basin. Sci. Rep. 2024, 14, 1–21. [Google Scholar] [CrossRef] [PubMed]
- Fischer, G. , Shah, M., & van Velthuizen, H., 2002. Climate Change and Agricultural Vulnerability. International Institute for Applied Systems Analysis.
- Wang, S.-M.; Wu, J.-X.; Gunawan, H.; Tu, R.-Q. Optimization of Machining Parameters for Corner Accuracy Improvement for WEDM Processing. Appl. Sci. 2023, 12, 10324. [Google Scholar] [CrossRef]
- Taghizadeh-Mehrjardi, R.; Nabiollahi, K.; Rasoli, L.; Kerry, R.; Scholten, T. Land Suitability Assessment and Agricultural Production Sustainability Using Machine Learning Models. Agronomy 2020, 10, 573. [Google Scholar] [CrossRef]
- Zabel, F.; Putzenlechner, B.; Mauser, W.; Kropp, J.P. Global Agricultural Land Resources – A High Resolution Suitability Evaluation and Its Perspectives until 2100 under Climate Change Conditions. PLOS ONE 2014, 9, e107522. [Google Scholar] [CrossRef]
- Kourtzanidis, K.; Angelakoglou, K.; Giourka, P.; Tsarchopoulos, P.; Nikolopoulos, N.; Ioannidis, D.; Kantorovitch, J.; Formiga, J.; Verbeek, K.; de Vries, M.; et al. Technical and Innovation Management Plans. POCITYF 2020. https://pocityf.eu/ Kottek, M.; Grieser, J.; Beck, C.; Rudolf, B.; Rubel, F. World map of the Köppen-Geiger climate classification updated. Meteorol. Z. 2006, 15, 259–263. [Google Scholar] [CrossRef]
- ERA5 Reanalysis Data. Available online: https://cds.climate.copernicus.eu (accessed on 10 November 2021).
- Earth System Grid Federation (ESGF). (2019). Earth System Grid Federation: A distributed data archive for climate modeling research. Retrieved from https://esgf.llnl.
- Tebaldi, C.; Knutti, R. The use of the multi-model ensemble in probabilistic climate projections. PPhilos. Trans. R. Soc. A Math. Phys. Eng. Sci. 2007, 365, 2053–2075. [Google Scholar] [CrossRef] [PubMed]
- Kiktev, D. , & others. (2007). A new assessment of observed and simulated climate variability over the 20th century using the IPCC models. Geophysical Research Letters, 34(13). [CrossRef]
- Mullen, S. L. , & Buizza, R. (2002). The potential of the ECMWF Ensemble Prediction System for seasonal forecasting. Monthly Weather Review, 130(10), 2482–2494.
- Intergovernmental Panel on Climate Change (IPCC). AR5 Synthesis Report: Climate Change; IPCC: Geneva, Switzerland, 2014; Available online: https://www.ipcc.ch/report/ar5/syr/ (accessed on 18 August 2022).
- Papadaskalopoulou, C. , Antoniadou, M., & Tassopoulos, D. (2023). D7.2 Fit for Nexus Climate Projections and Climate Risk Assessments (v6.0). Zenodo. [CrossRef]
- Panagos, P.; Van Liedekerke, M.; Borrelli, P.; Köninger, J.; Ballabio, C.; Orgiazzi, A.; Lugato, E.; Liakos, L.; Hervas, J.; Jones, A.; et al. European Soil Data Centre 2.0: Soil data and knowledge in support of the EU policies. Eur. J. Soil Sci. 2022, 73. [Google Scholar] [CrossRef]
- Panagos, P.; Van Liedekerke, M.; Jones, A.; Montanarella, L. European Soil Data Centre: Response to European policy support and public data requirements. Land Use Policy 2012, 29, 329–338. [Google Scholar] [CrossRef]
- Jarvis A., H. I. Reuter, A. Nelson, E. Guevara, 2008. Hole-filled seamless SRTM data V4, International Centre for Tropical Agriculture (CIAT), available from https://srtm.csi.cgiar.org.
- Sys, C. (1993). Land Evaluation: Part III - Crop Requirements and Land Suitability. Agricultural Publications, Wageningen University.
- European Environment Agency. Available on line: https://www.eea.europa.eu. (accessed on 19 December 2018).
- Saaty, T.L. Relative measurement and its generalization in decision making why pairwise comparisons are central in mathematics for the measurement of intangible factors the analytic hierarchy/network process. Rev. de La Real Acad. de Cienc. Exactas, Fis. Y Nat. Ser. A. Mat. 2008, 102, 251–318. [Google Scholar] [CrossRef]
- QGIS—A Free and Open Source Geographic Information System. Available online: https://qgis.org (accessed on 18 February 2019).
- Amara Denis M., K. , Patil P.L., Gali S.K. and Quee, D.D., 2016. Soil suitability assessment for sustainable production of vegetable crops in Northern semi-arid region of India. International Journal of Agricultural Policy and Research Vol.4 (3), pp. 52-61, 16 Available online at http://www.journalissues. 20 March. [CrossRef]
- Tubiello, F. N. , Soussana, J. F., & Howden, S. M. (2007). Crop and pasture response to climate change. Proceedings of the National Academy of Sciences, 104(50), 19686-19690.
- McGehee, R.P.; Flanagan, D.C.; Srivastava, P.; Engel, B.A.; Huang, C.-H.; Nearing, M.A. An updated isoerodent map of the conterminous United States. Int. Soil Water Conserv. Res. 2022, 10, 1–16. [Google Scholar] [CrossRef]
Figure 1.
The study area is located in the Lazio region, central Italy.
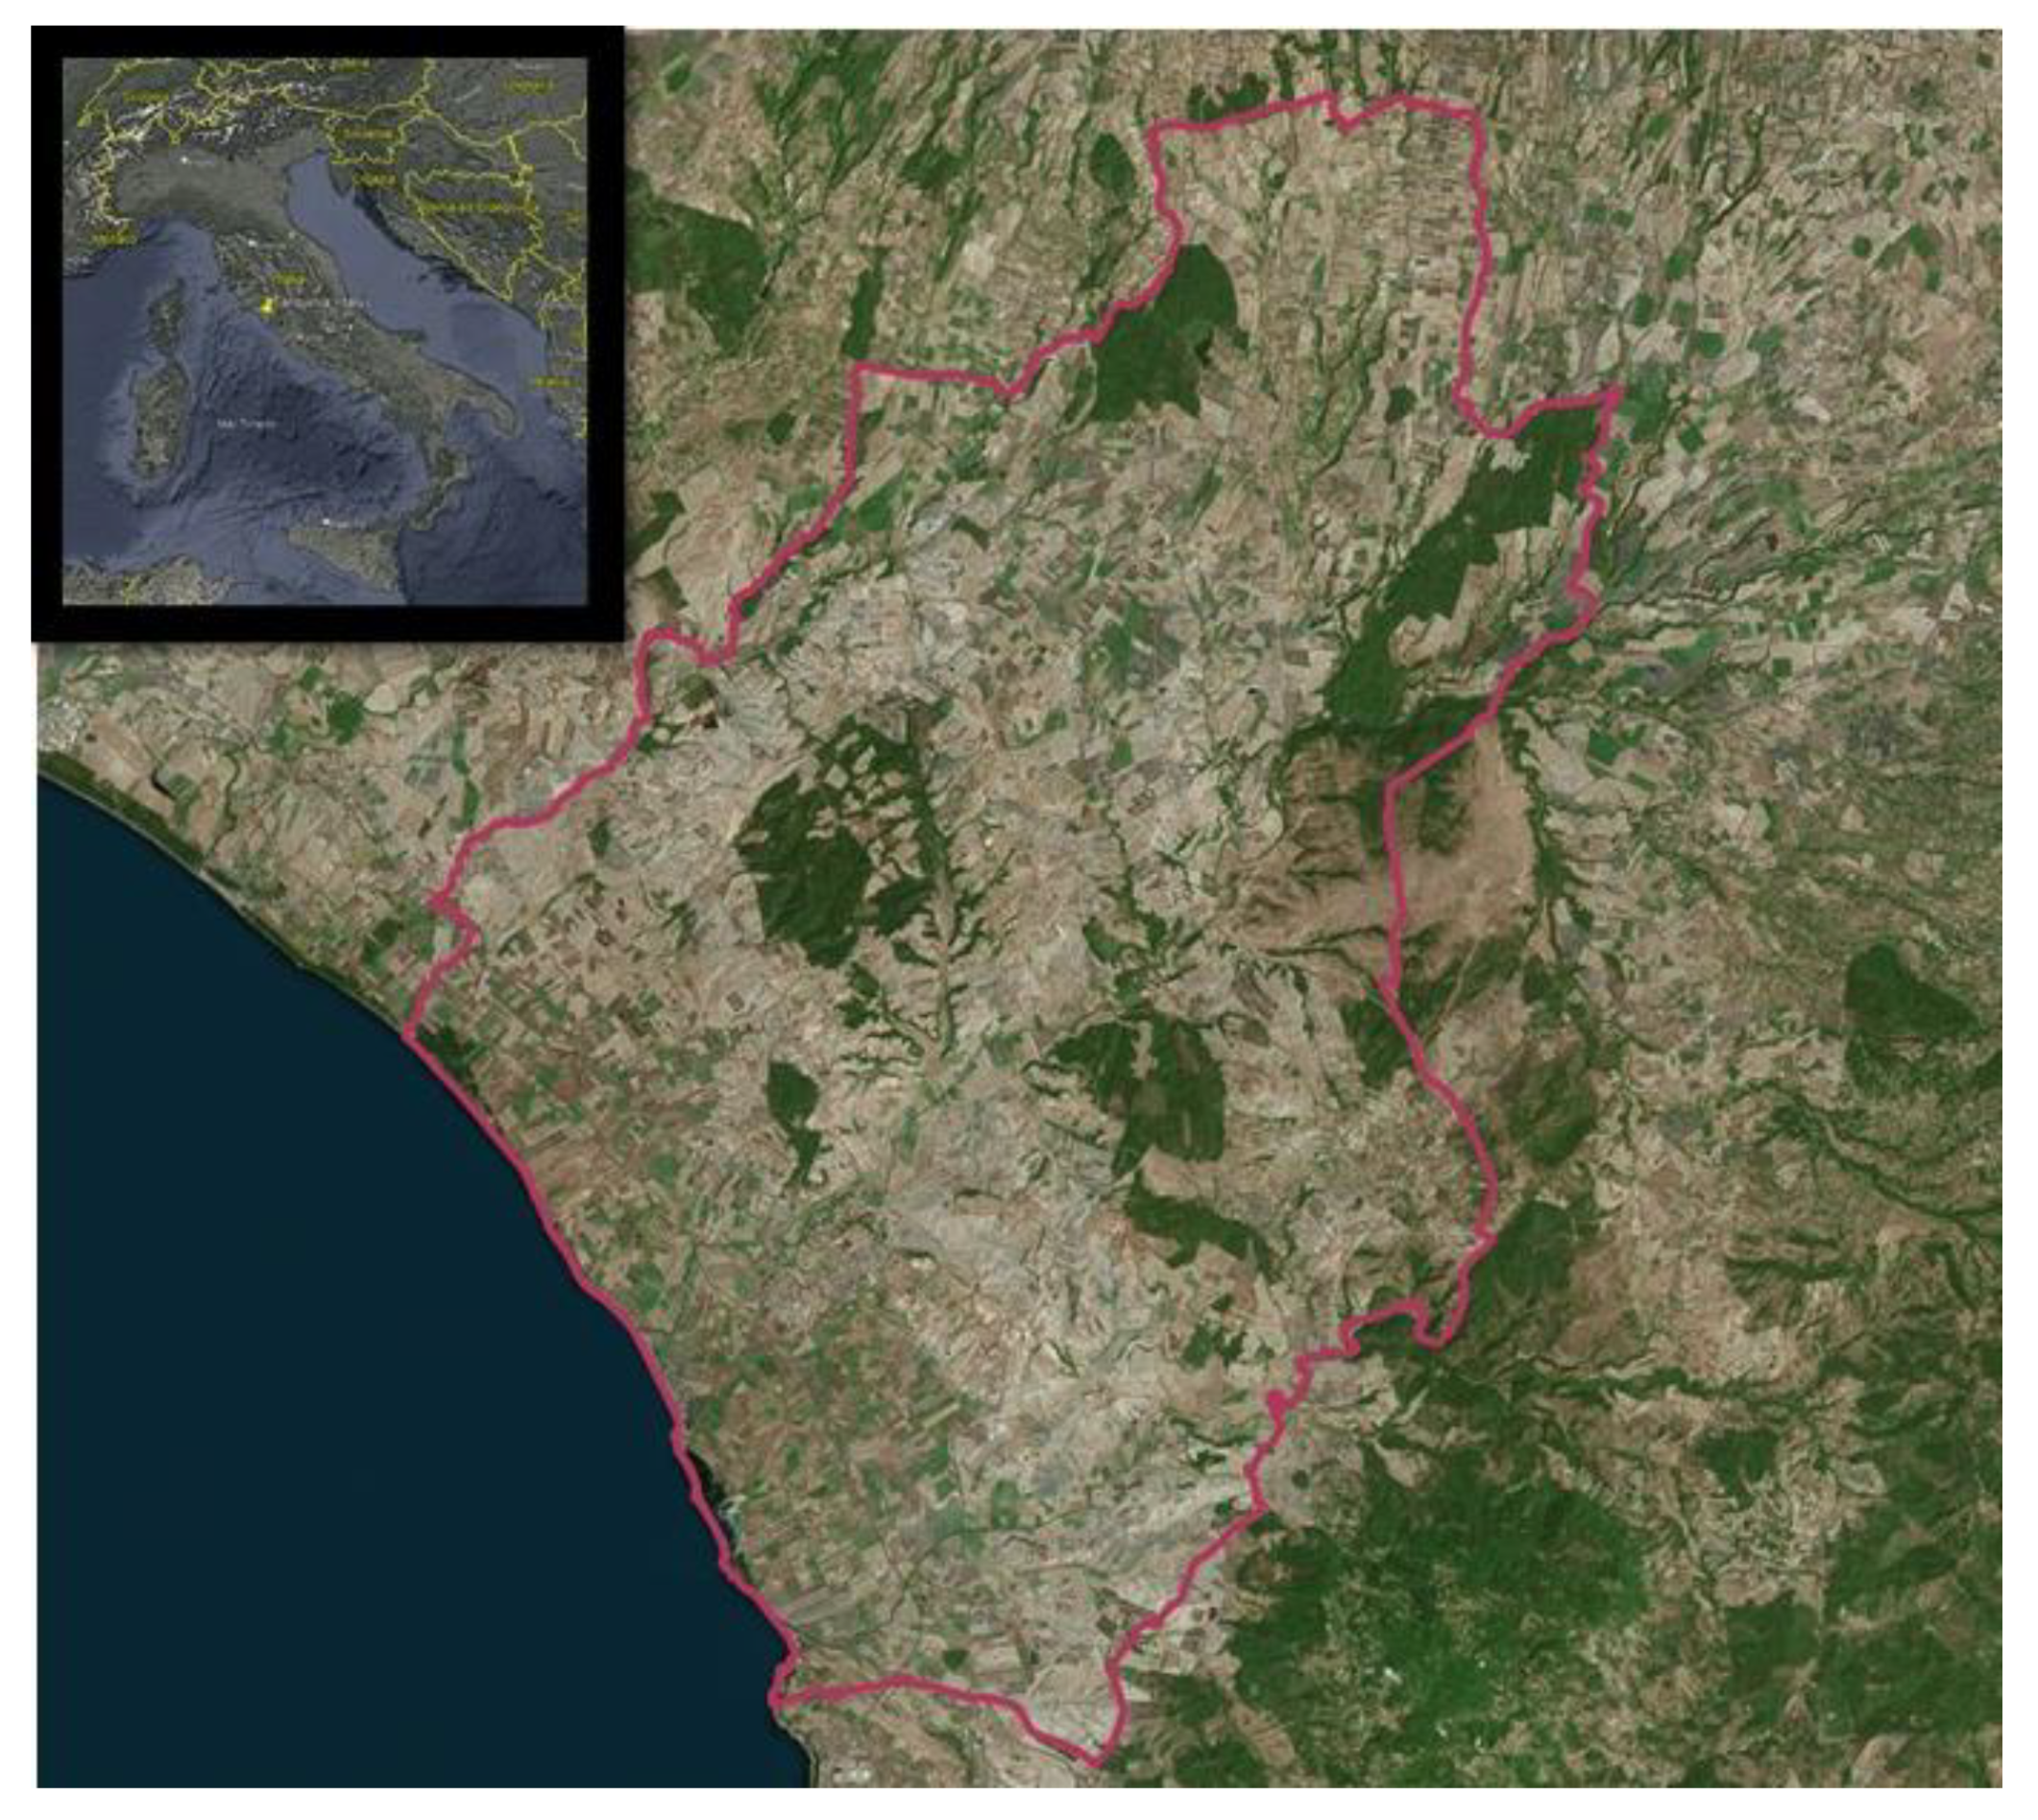
Figure 2.
Inputs requirements and outputs delivered for the Land Use Suitability (LUS) approach.
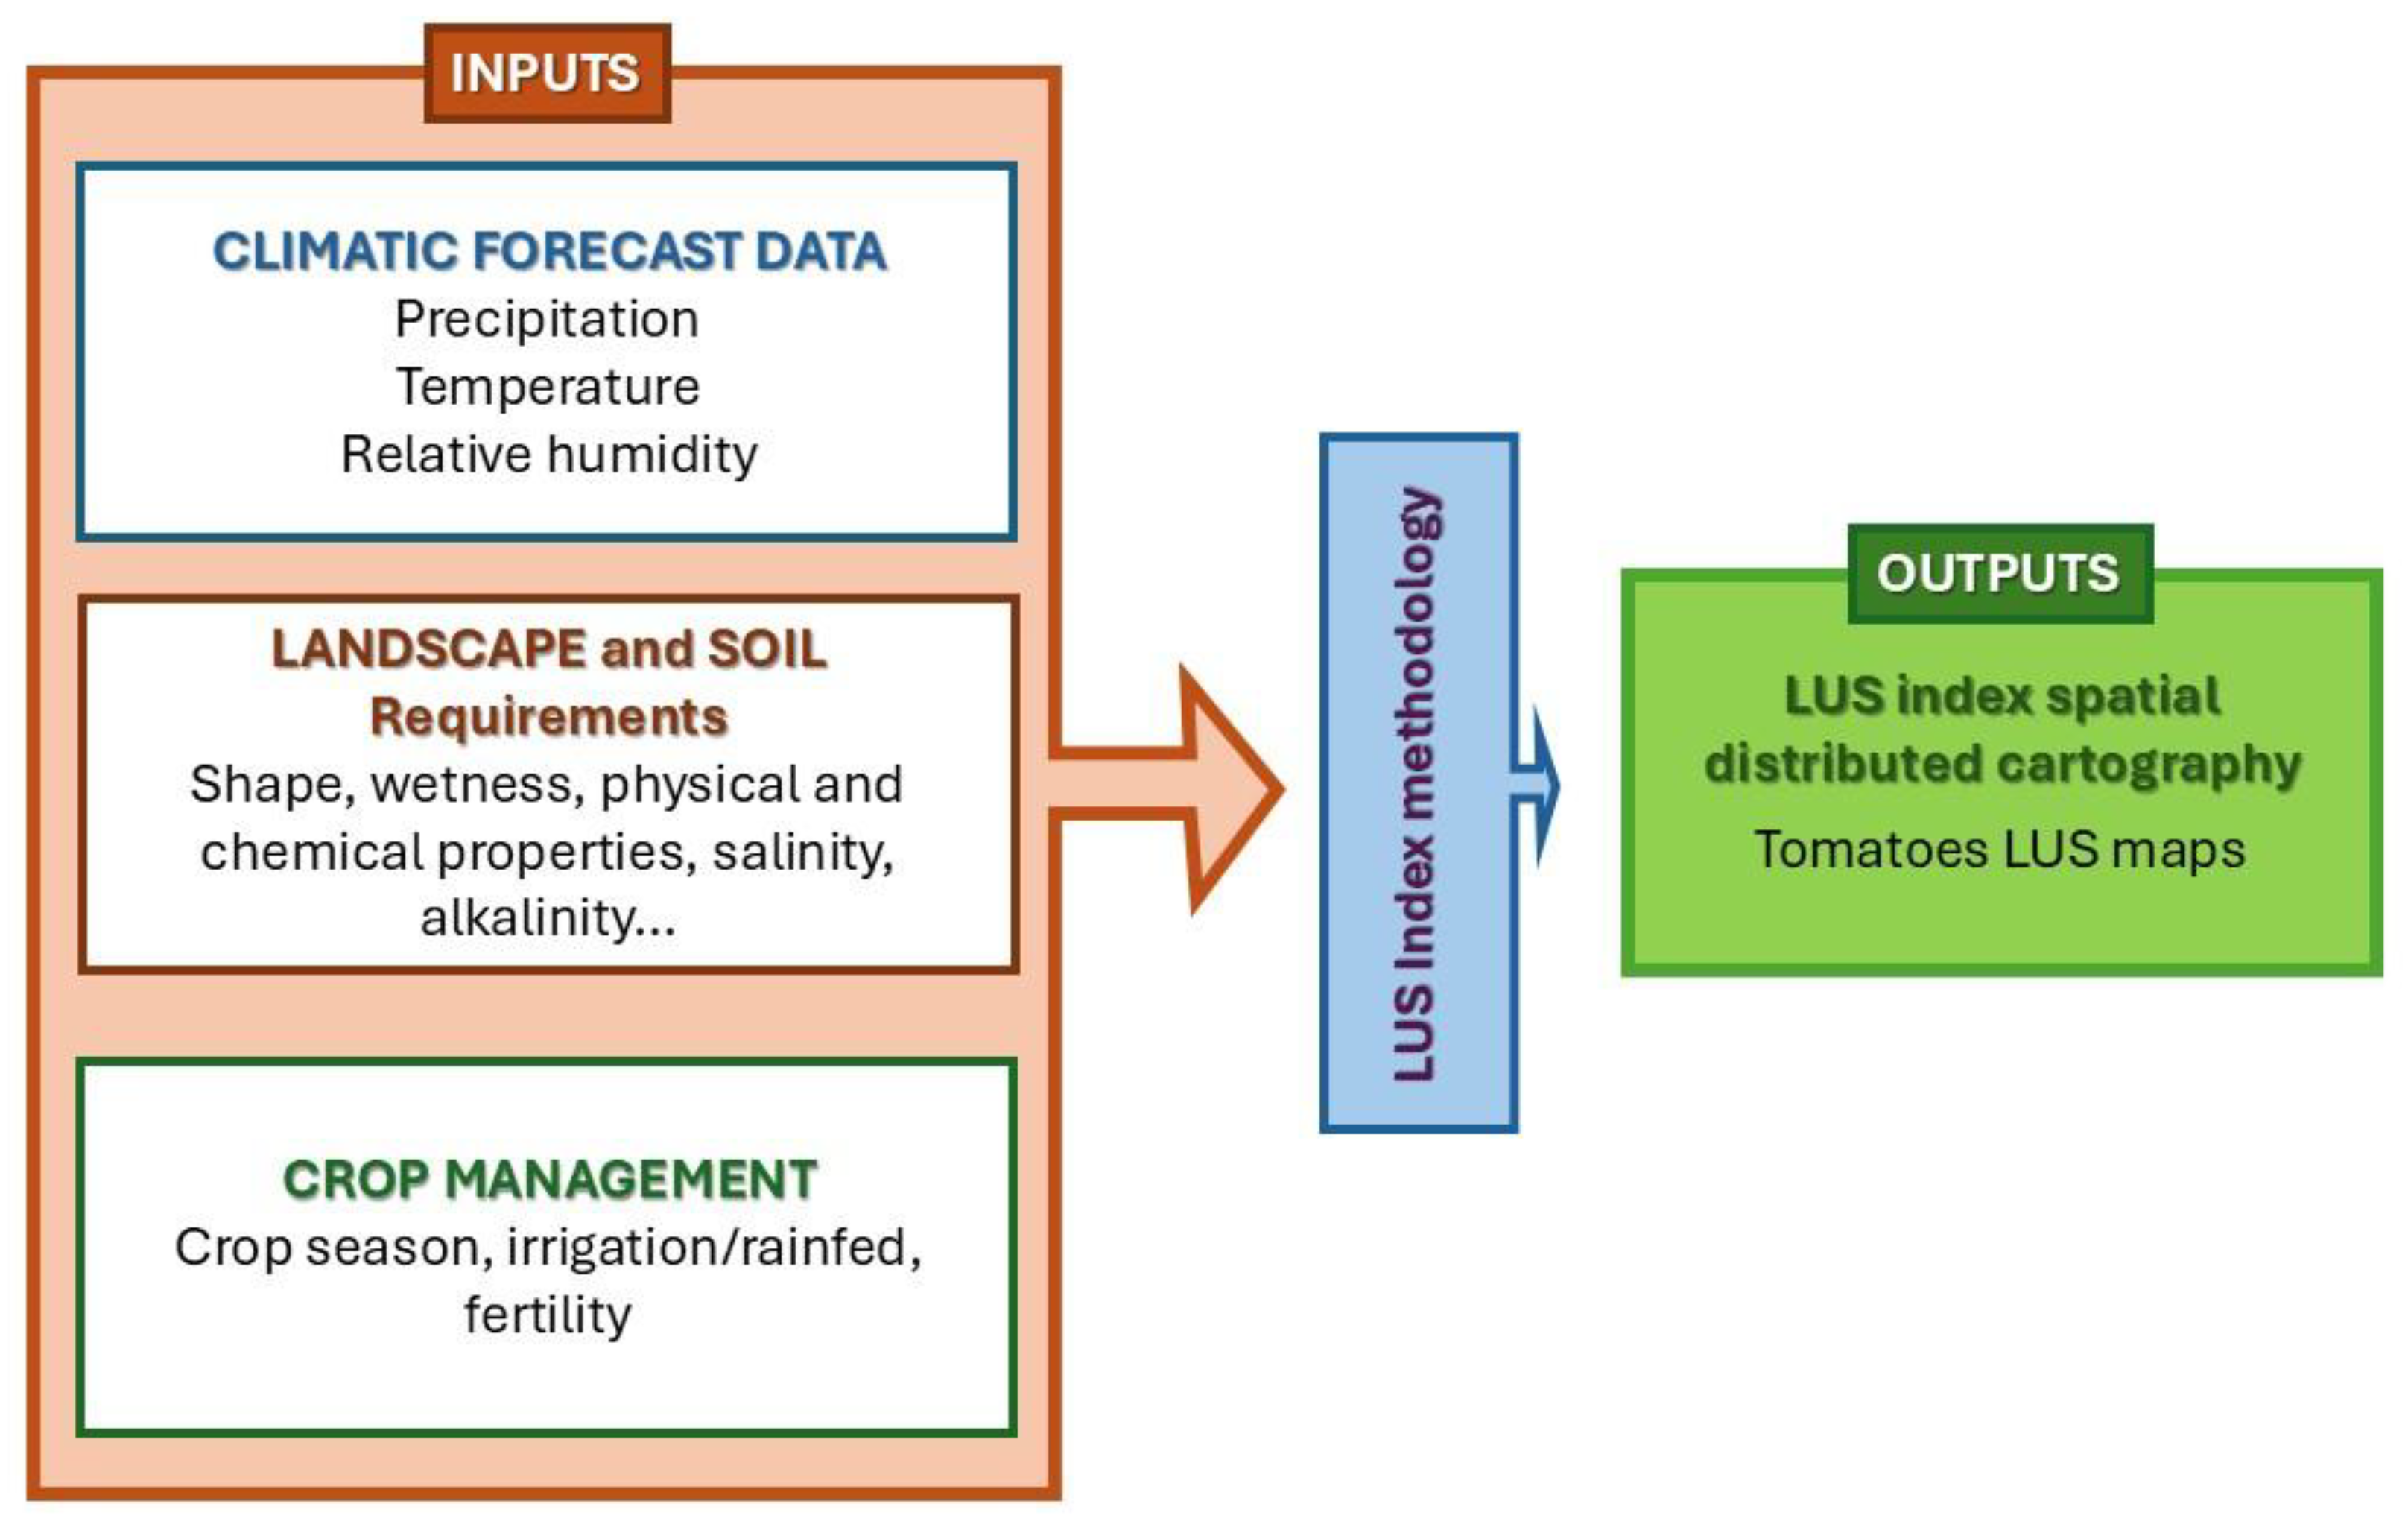
Figure 1.
Spatial distribution of the mean annual temperature, for the reference period (top) and the future period 2041-2070, based on the RCP4.5 and RCP8.5 (bottom), Tarquinia pilot.
Figure 1.
Spatial distribution of the mean annual temperature, for the reference period (top) and the future period 2041-2070, based on the RCP4.5 and RCP8.5 (bottom), Tarquinia pilot.
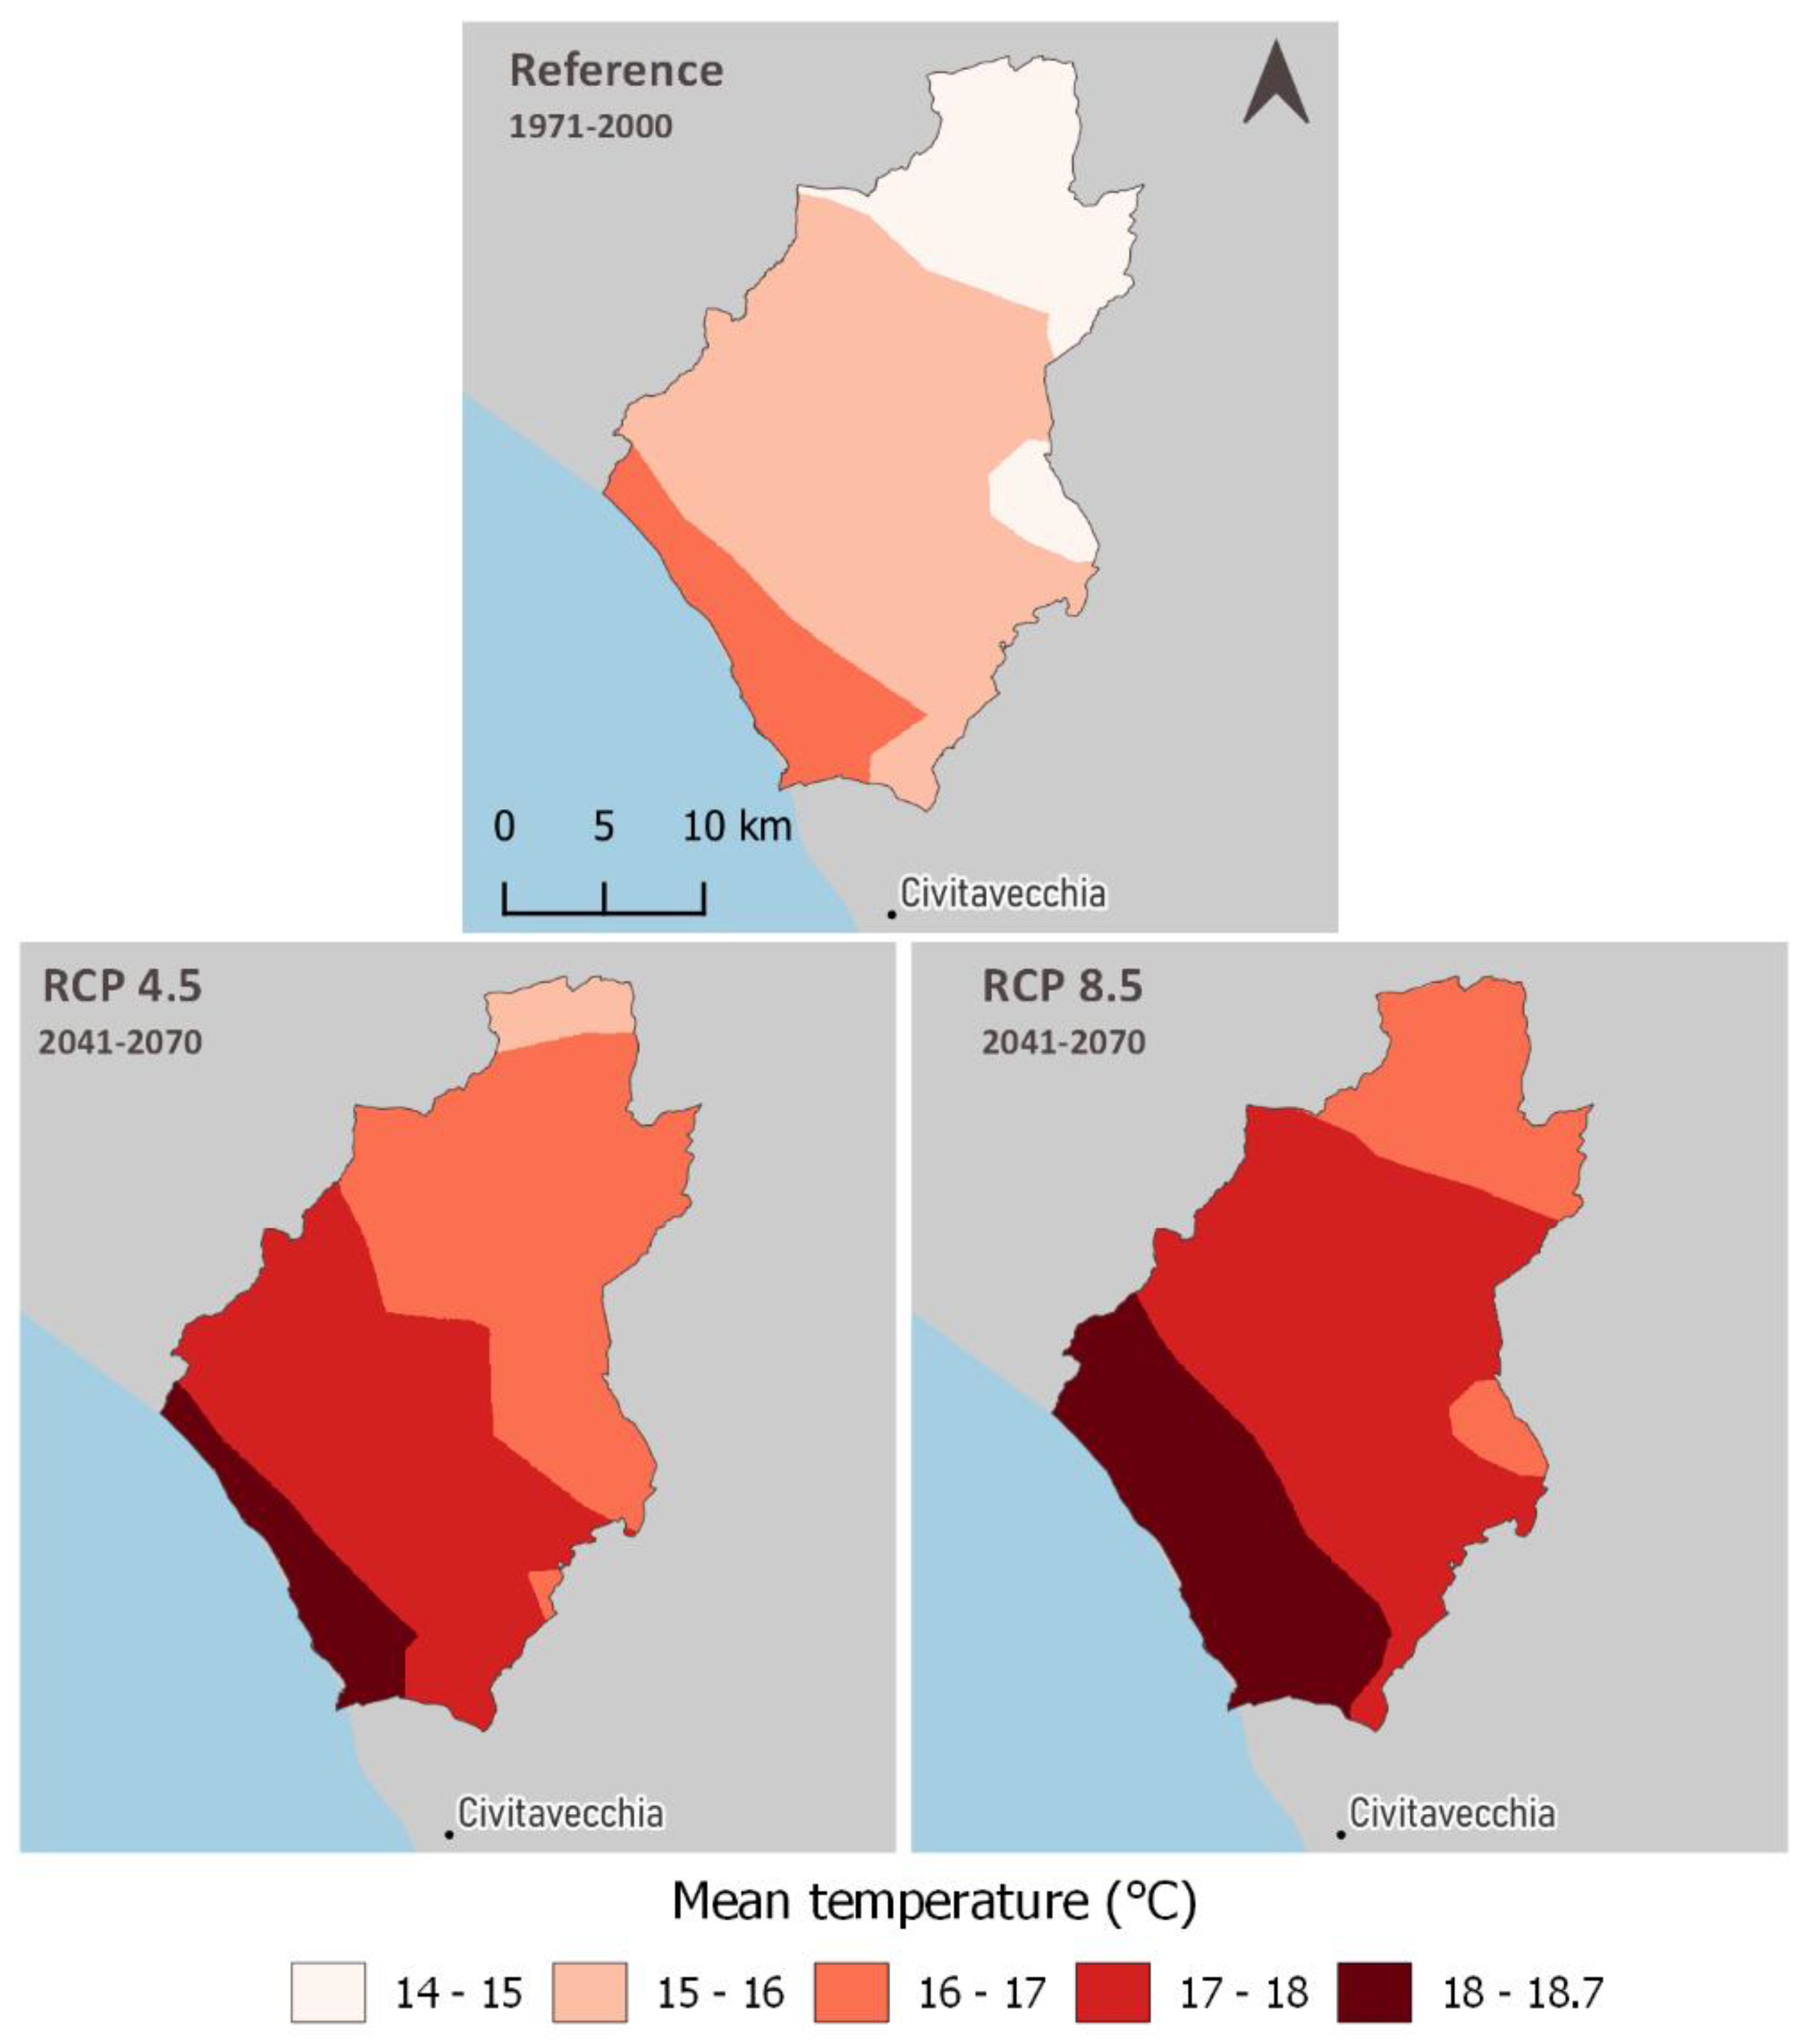
Figure 2.
Spatial distribution of the mean total precipitation during the reference period (top) and the future period based on the RCP4.5 (middle) and RCP8.5 (bottom), for the dry (right) and the wet (left) periods, Tarquinia pilot.
Figure 2.
Spatial distribution of the mean total precipitation during the reference period (top) and the future period based on the RCP4.5 (middle) and RCP8.5 (bottom), for the dry (right) and the wet (left) periods, Tarquinia pilot.
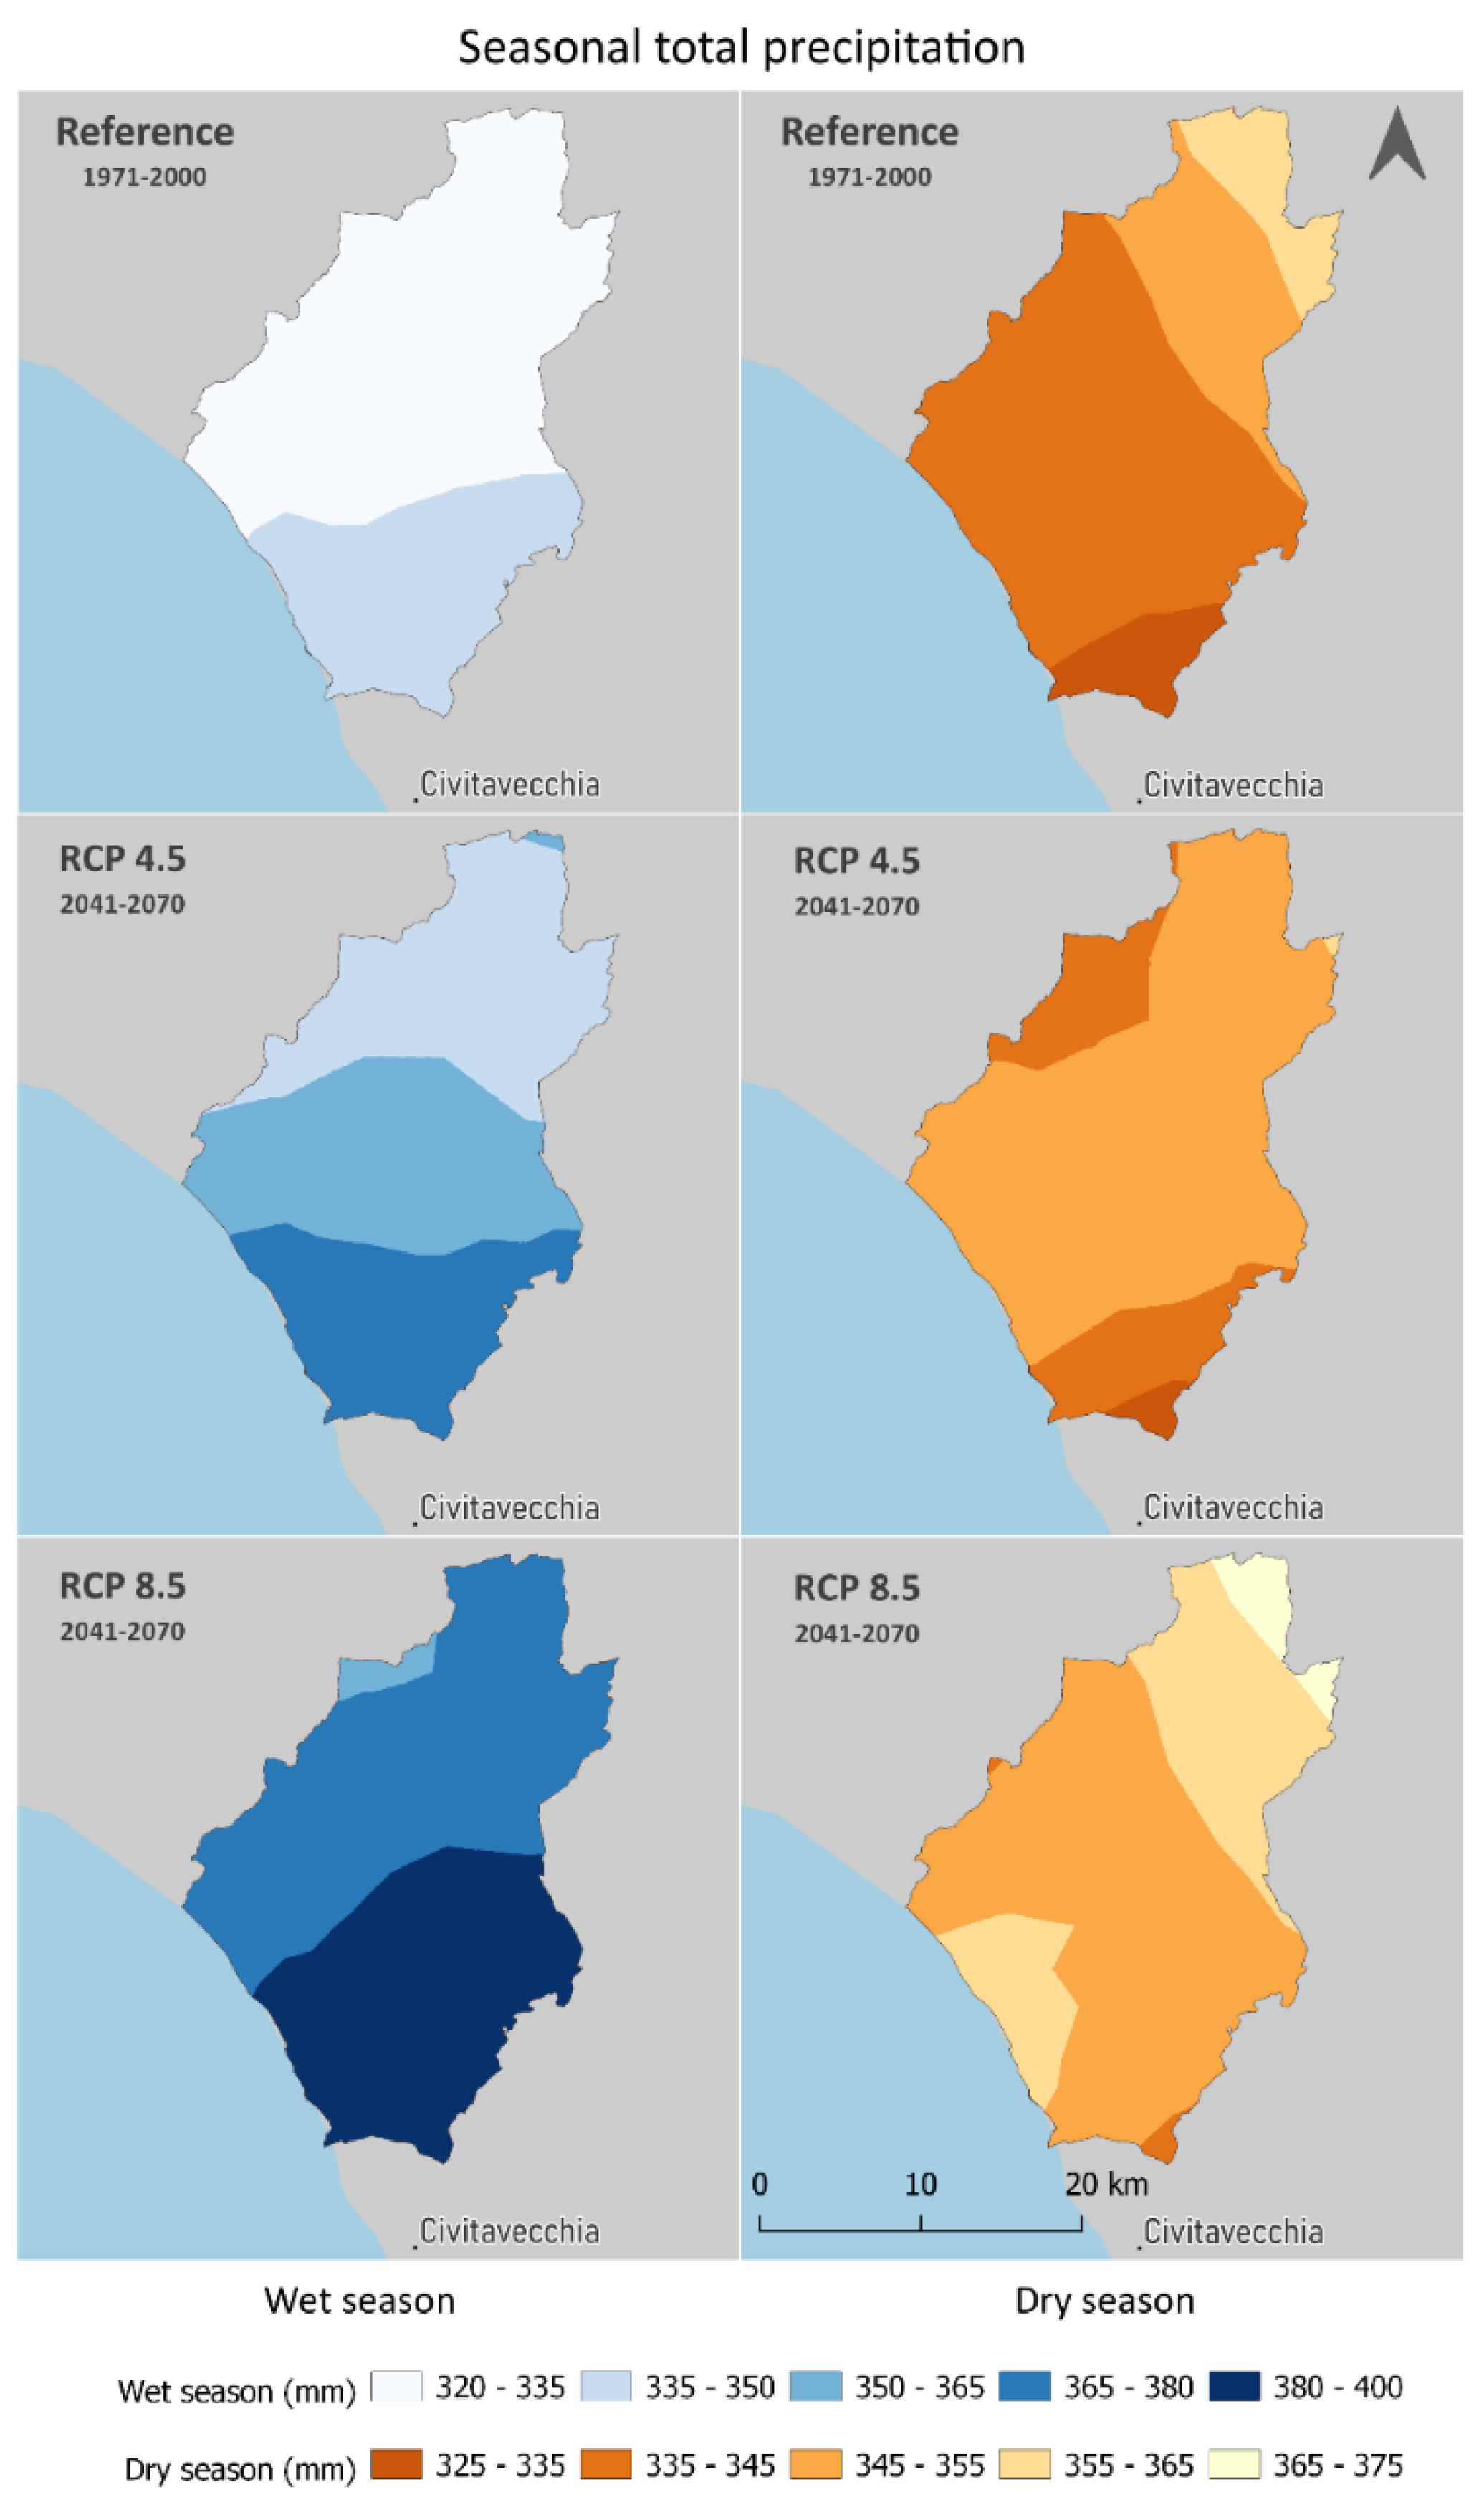
Figure 4.
Topography (A), Wetness (B) and Soil Physical indices suitability maps developed for the Tarquinia area.
Figure 4.
Topography (A), Wetness (B) and Soil Physical indices suitability maps developed for the Tarquinia area.
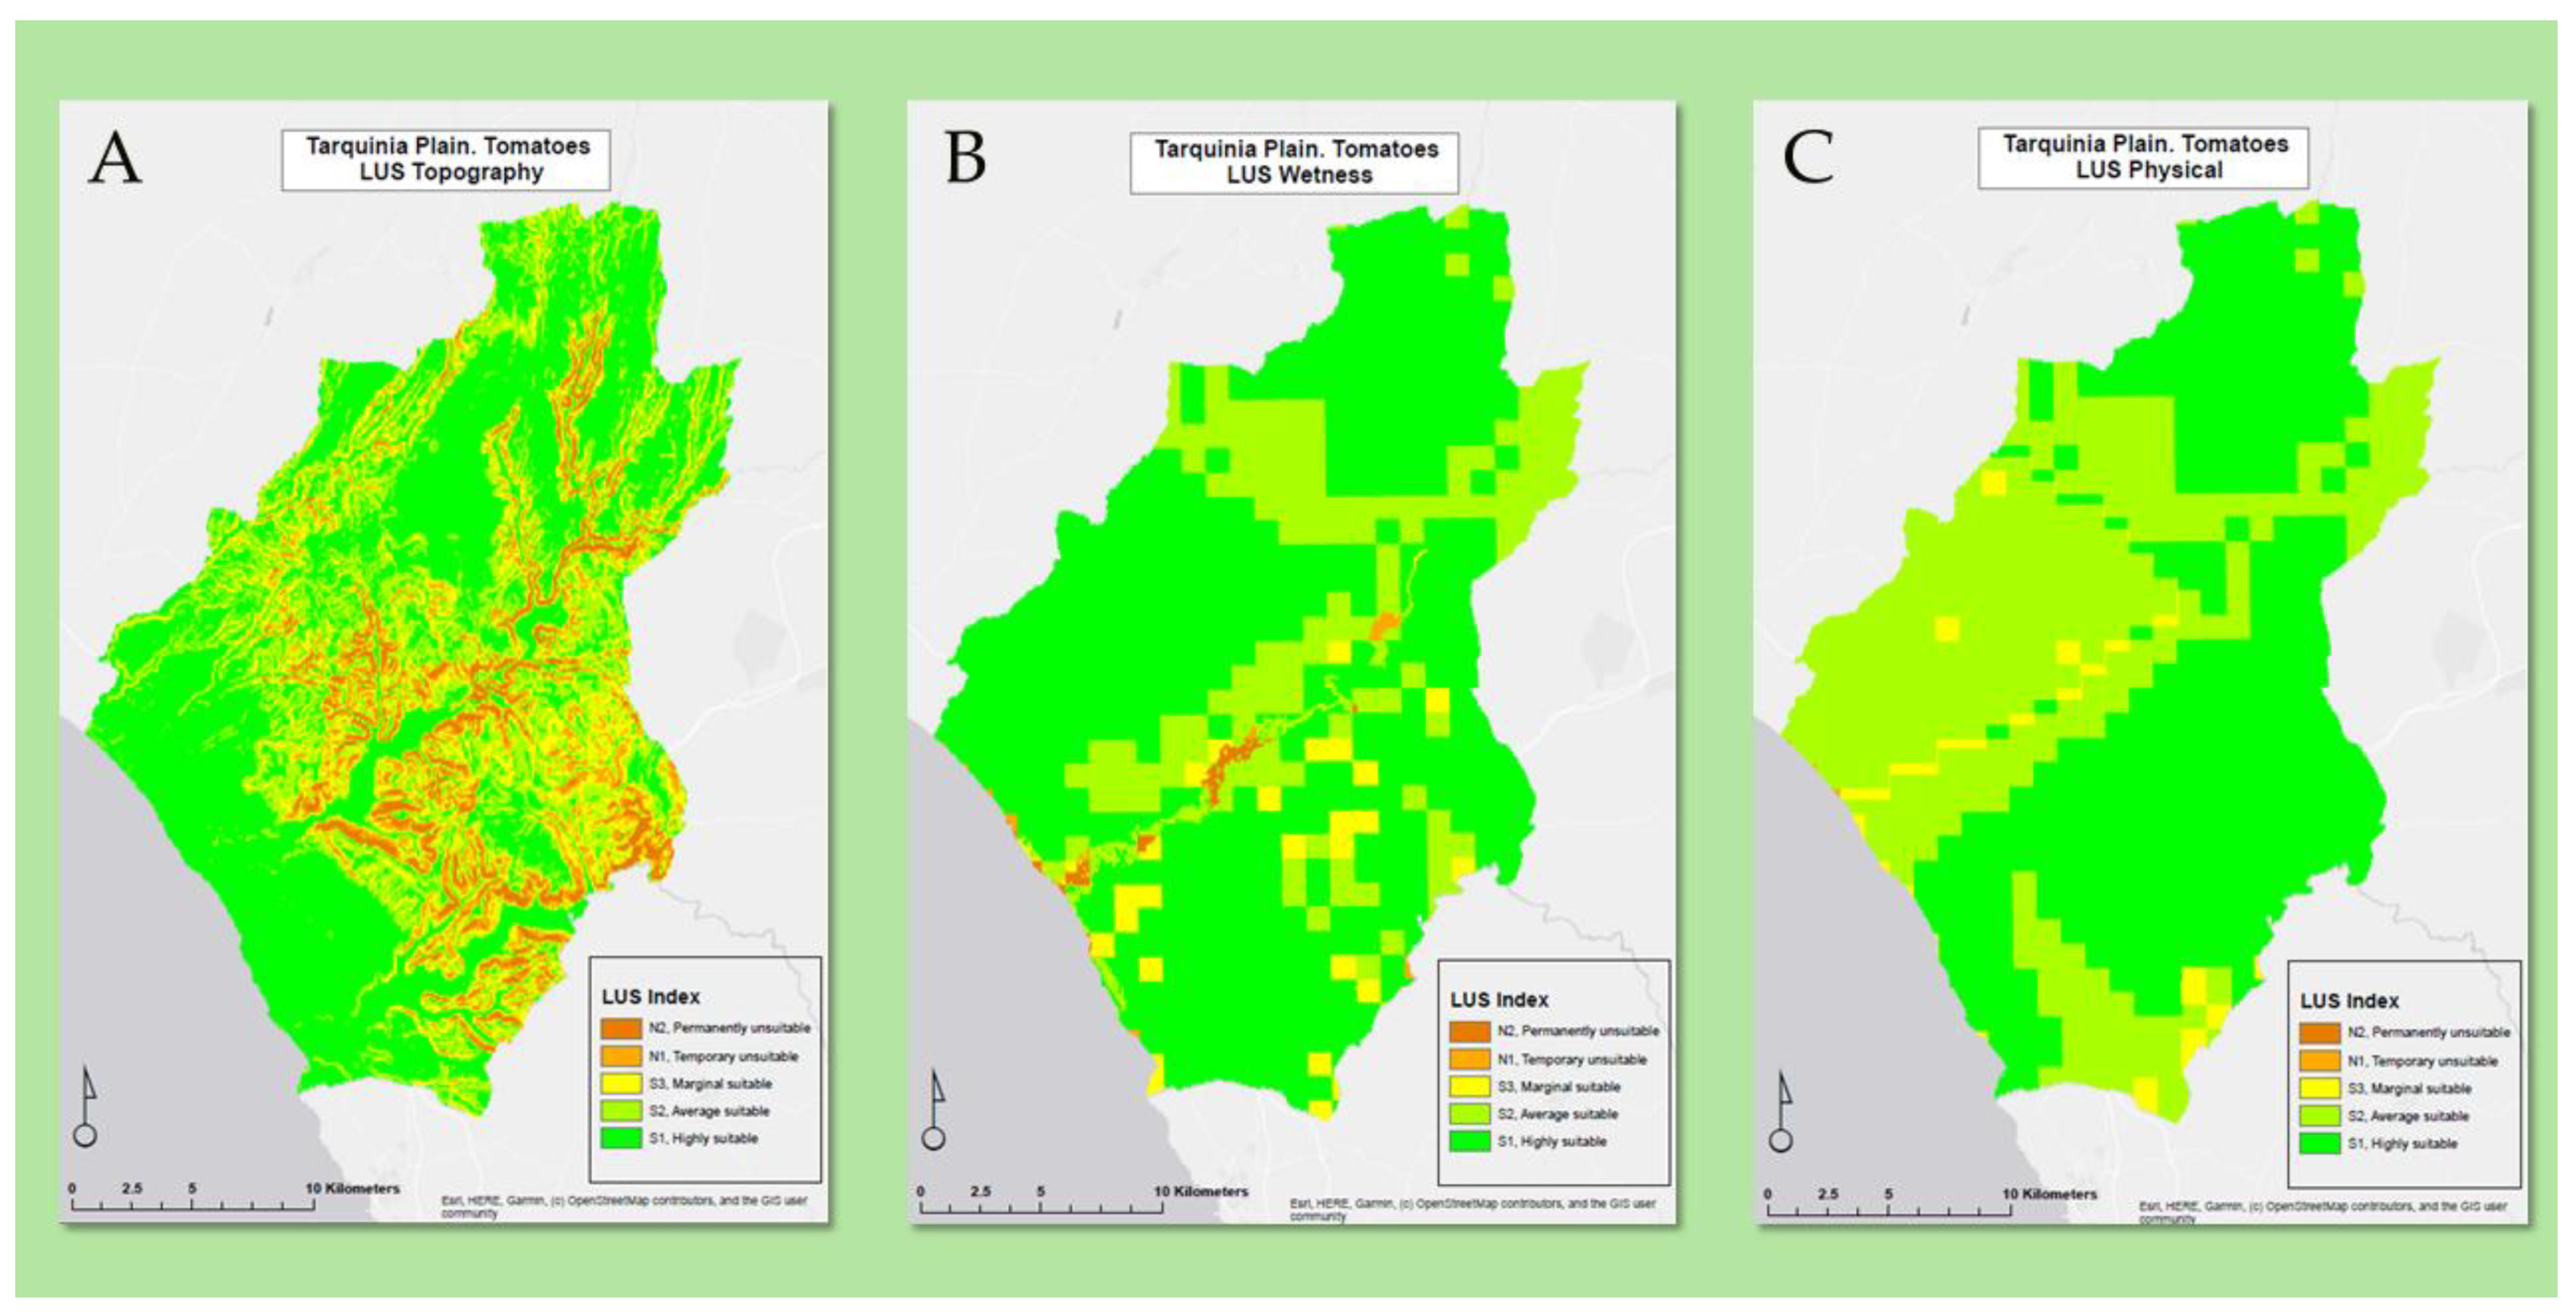
Figure 5.
Soil fertility index map (A) and Alkalinity index maps (B) developed to calculate the Land Suitability index for the Tarquinia area.
Figure 5.
Soil fertility index map (A) and Alkalinity index maps (B) developed to calculate the Land Suitability index for the Tarquinia area.
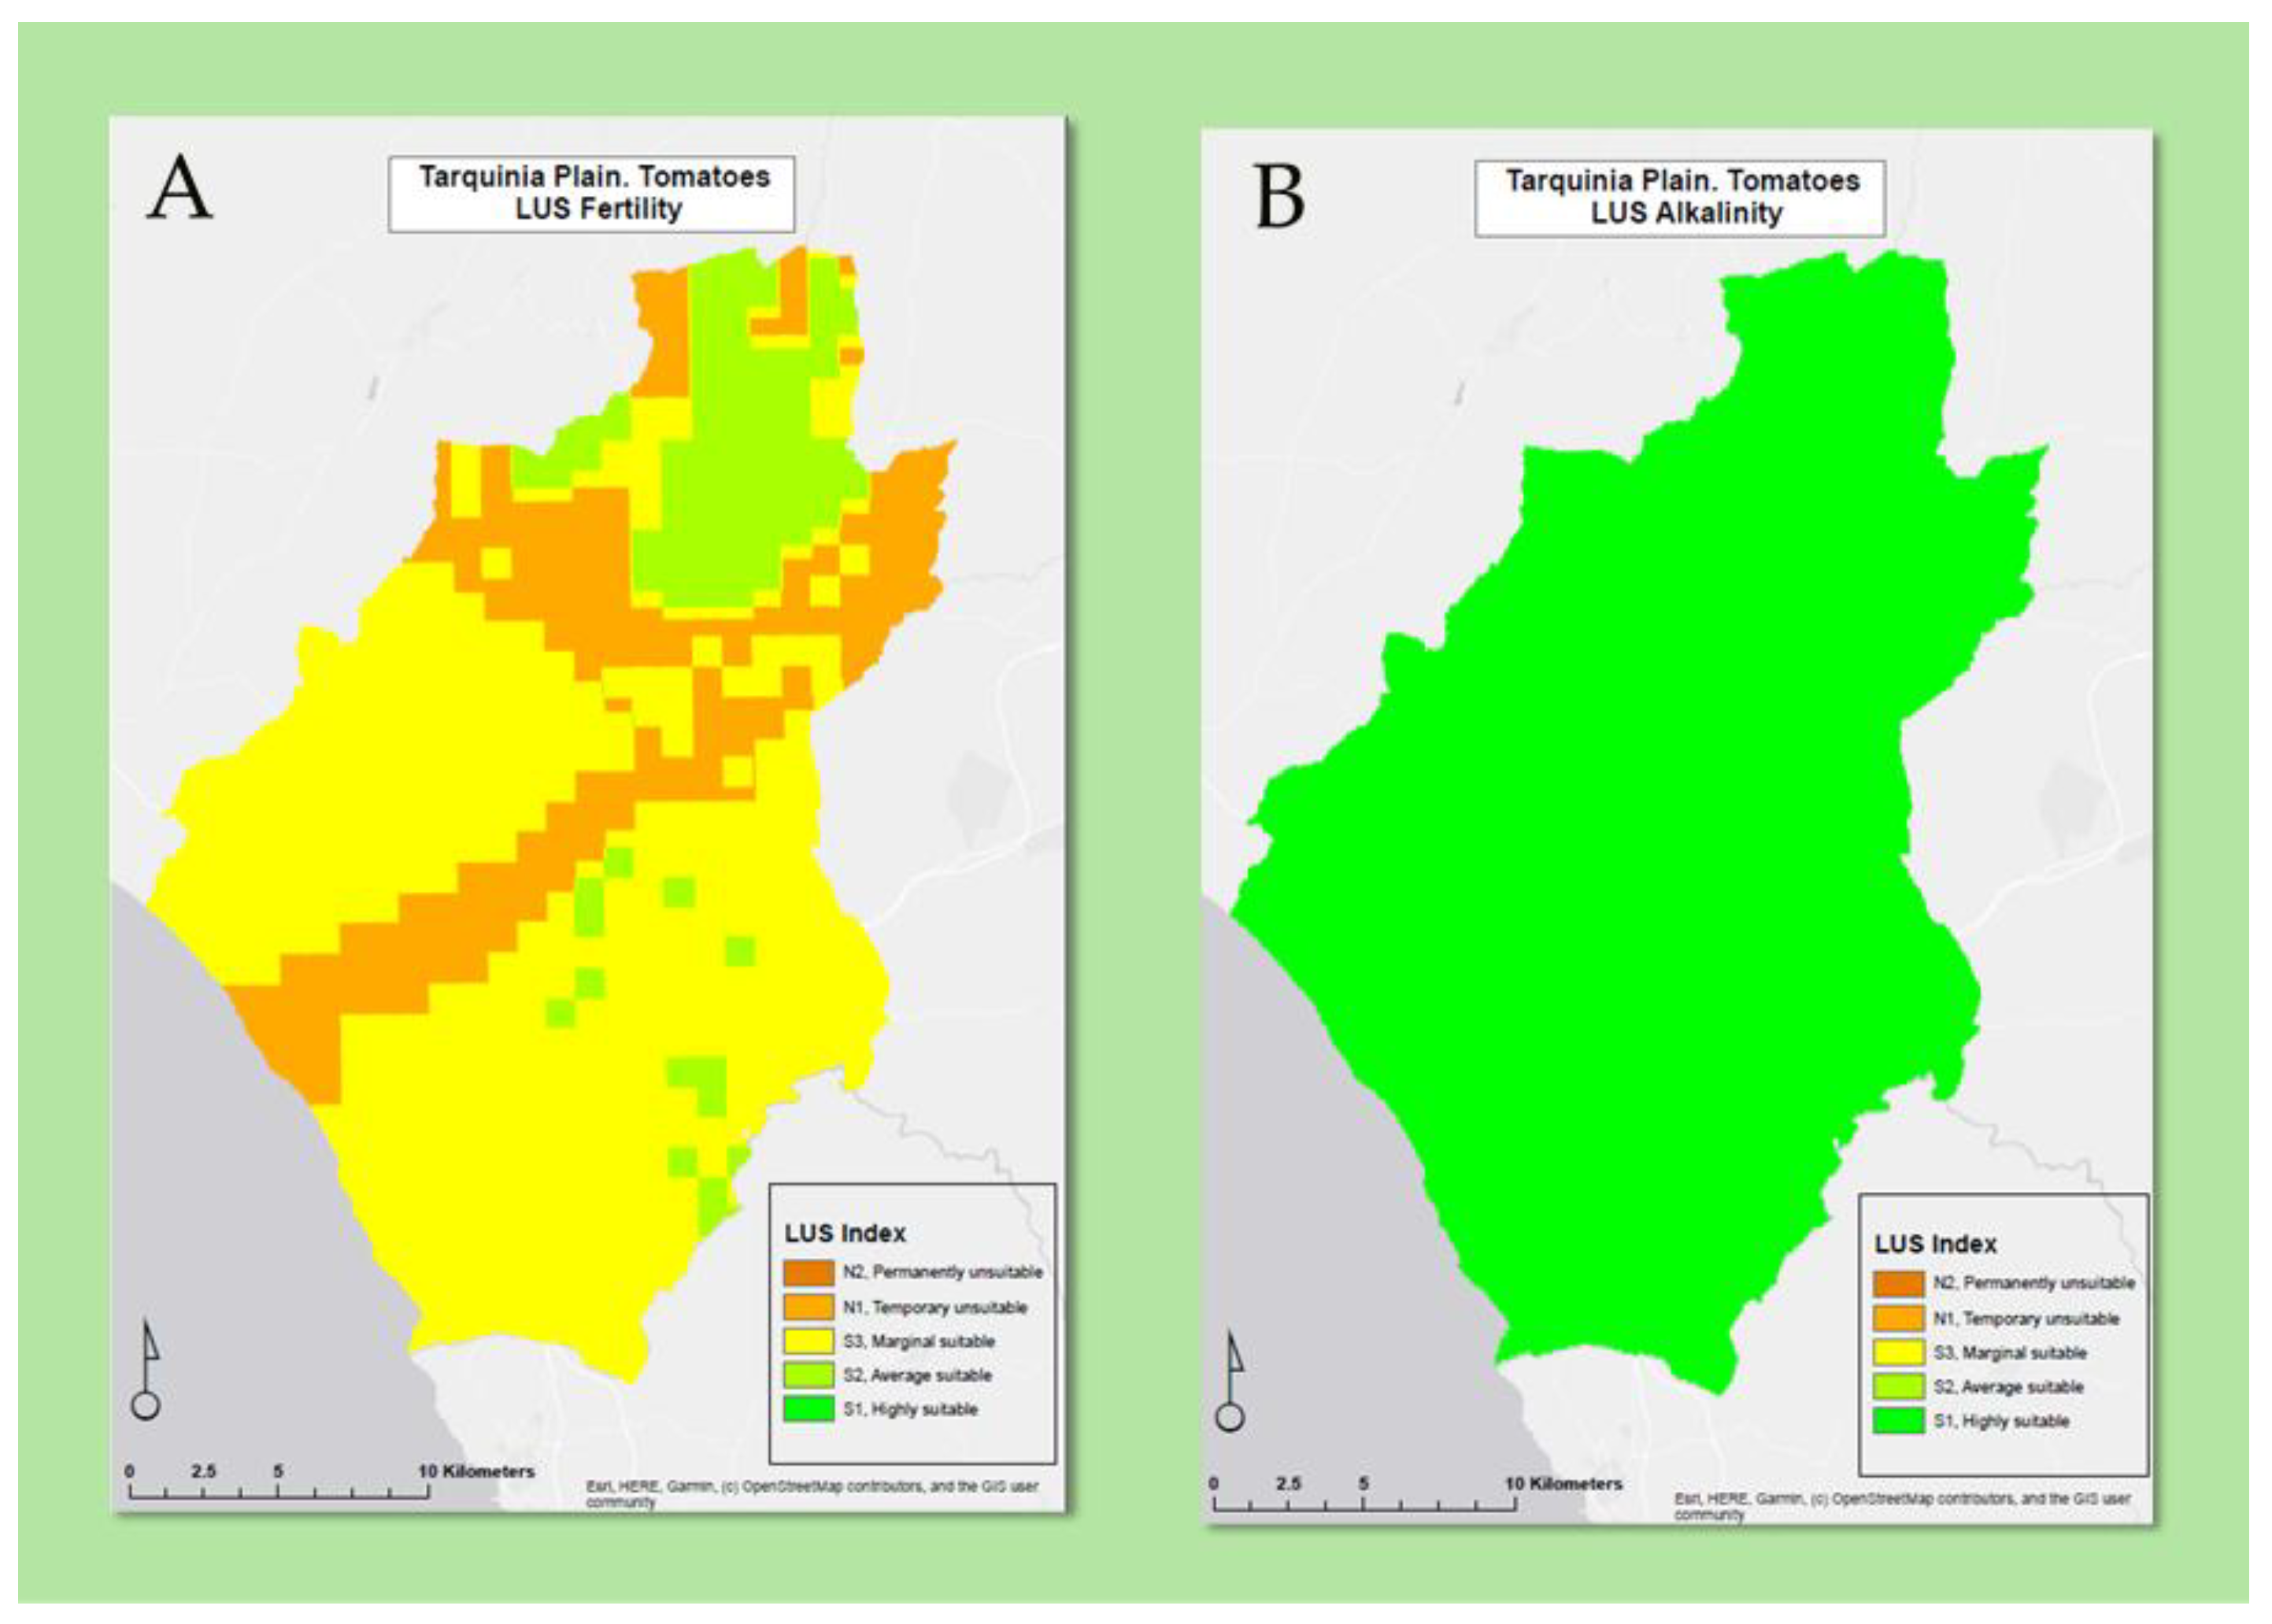
Figure 6.
Land suitability map of tomato cultivation in the Tarquinia Plain considering all soil variables.
Figure 6.
Land suitability map of tomato cultivation in the Tarquinia Plain considering all soil variables.
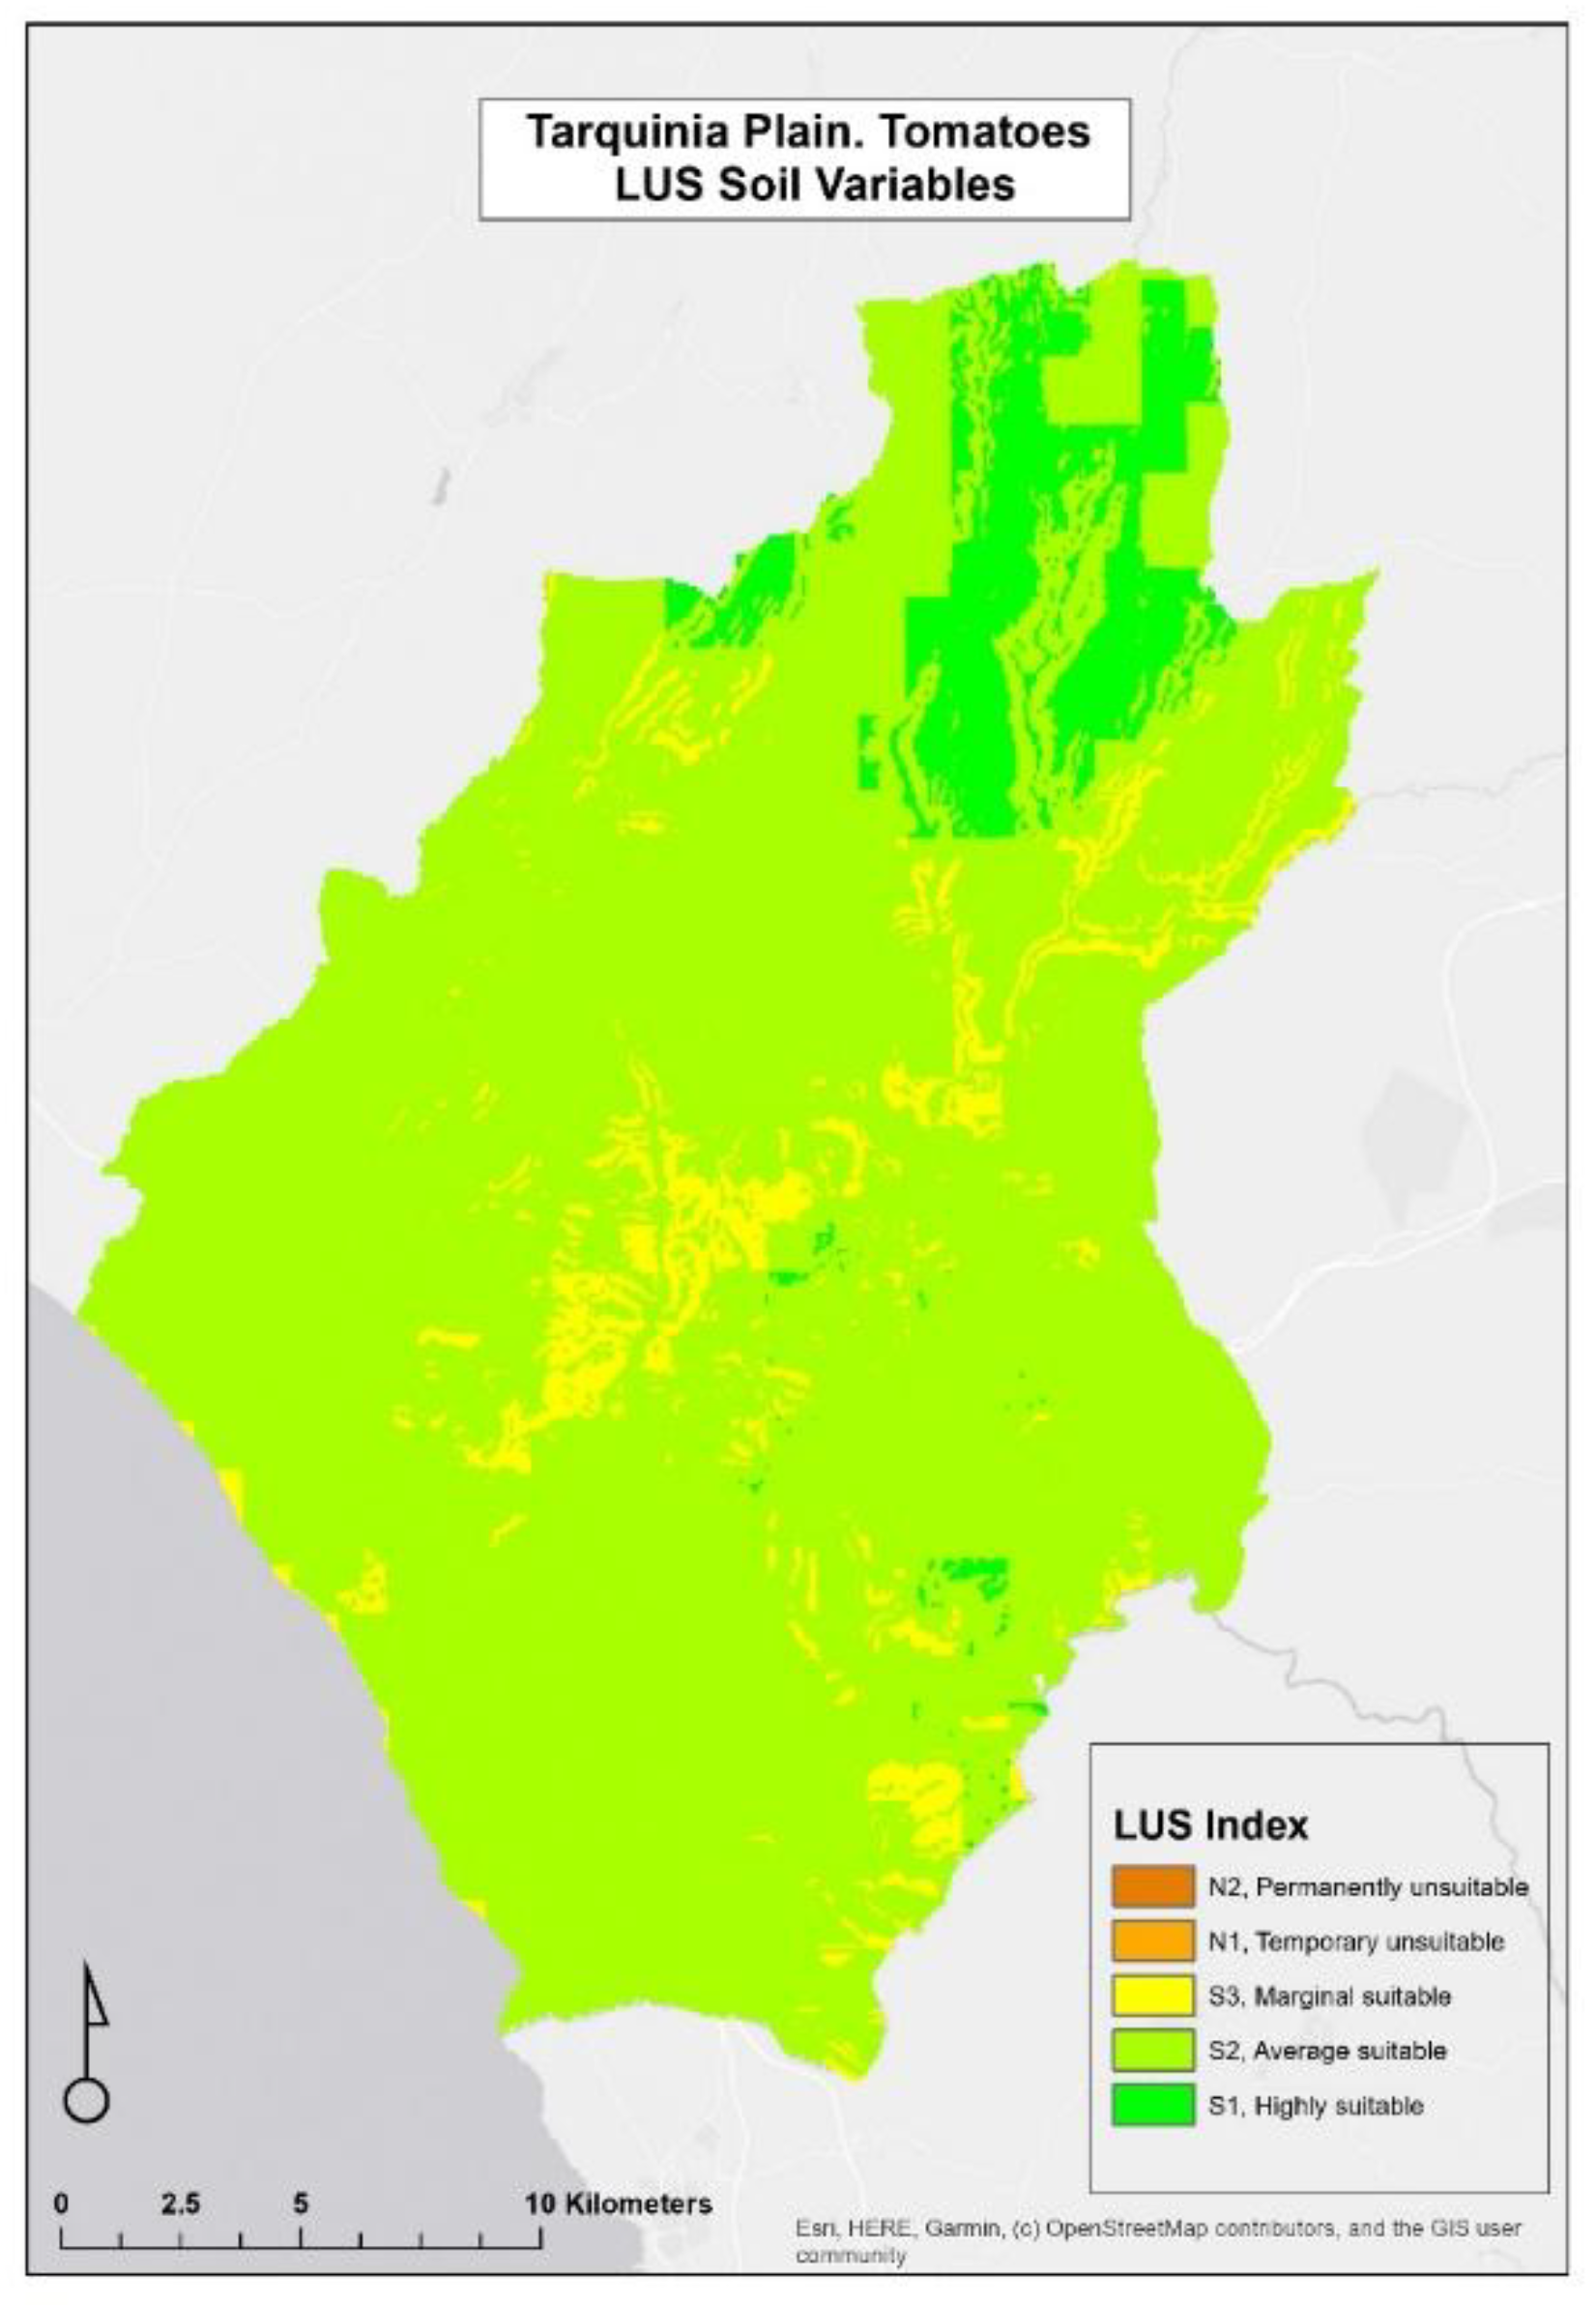
Figure 7.
Land Use Suitability map of processing tomato cultivation integrating all variables – long-term scenario RCP8.5 (2071 – 2100).
Figure 7.
Land Use Suitability map of processing tomato cultivation integrating all variables – long-term scenario RCP8.5 (2071 – 2100).
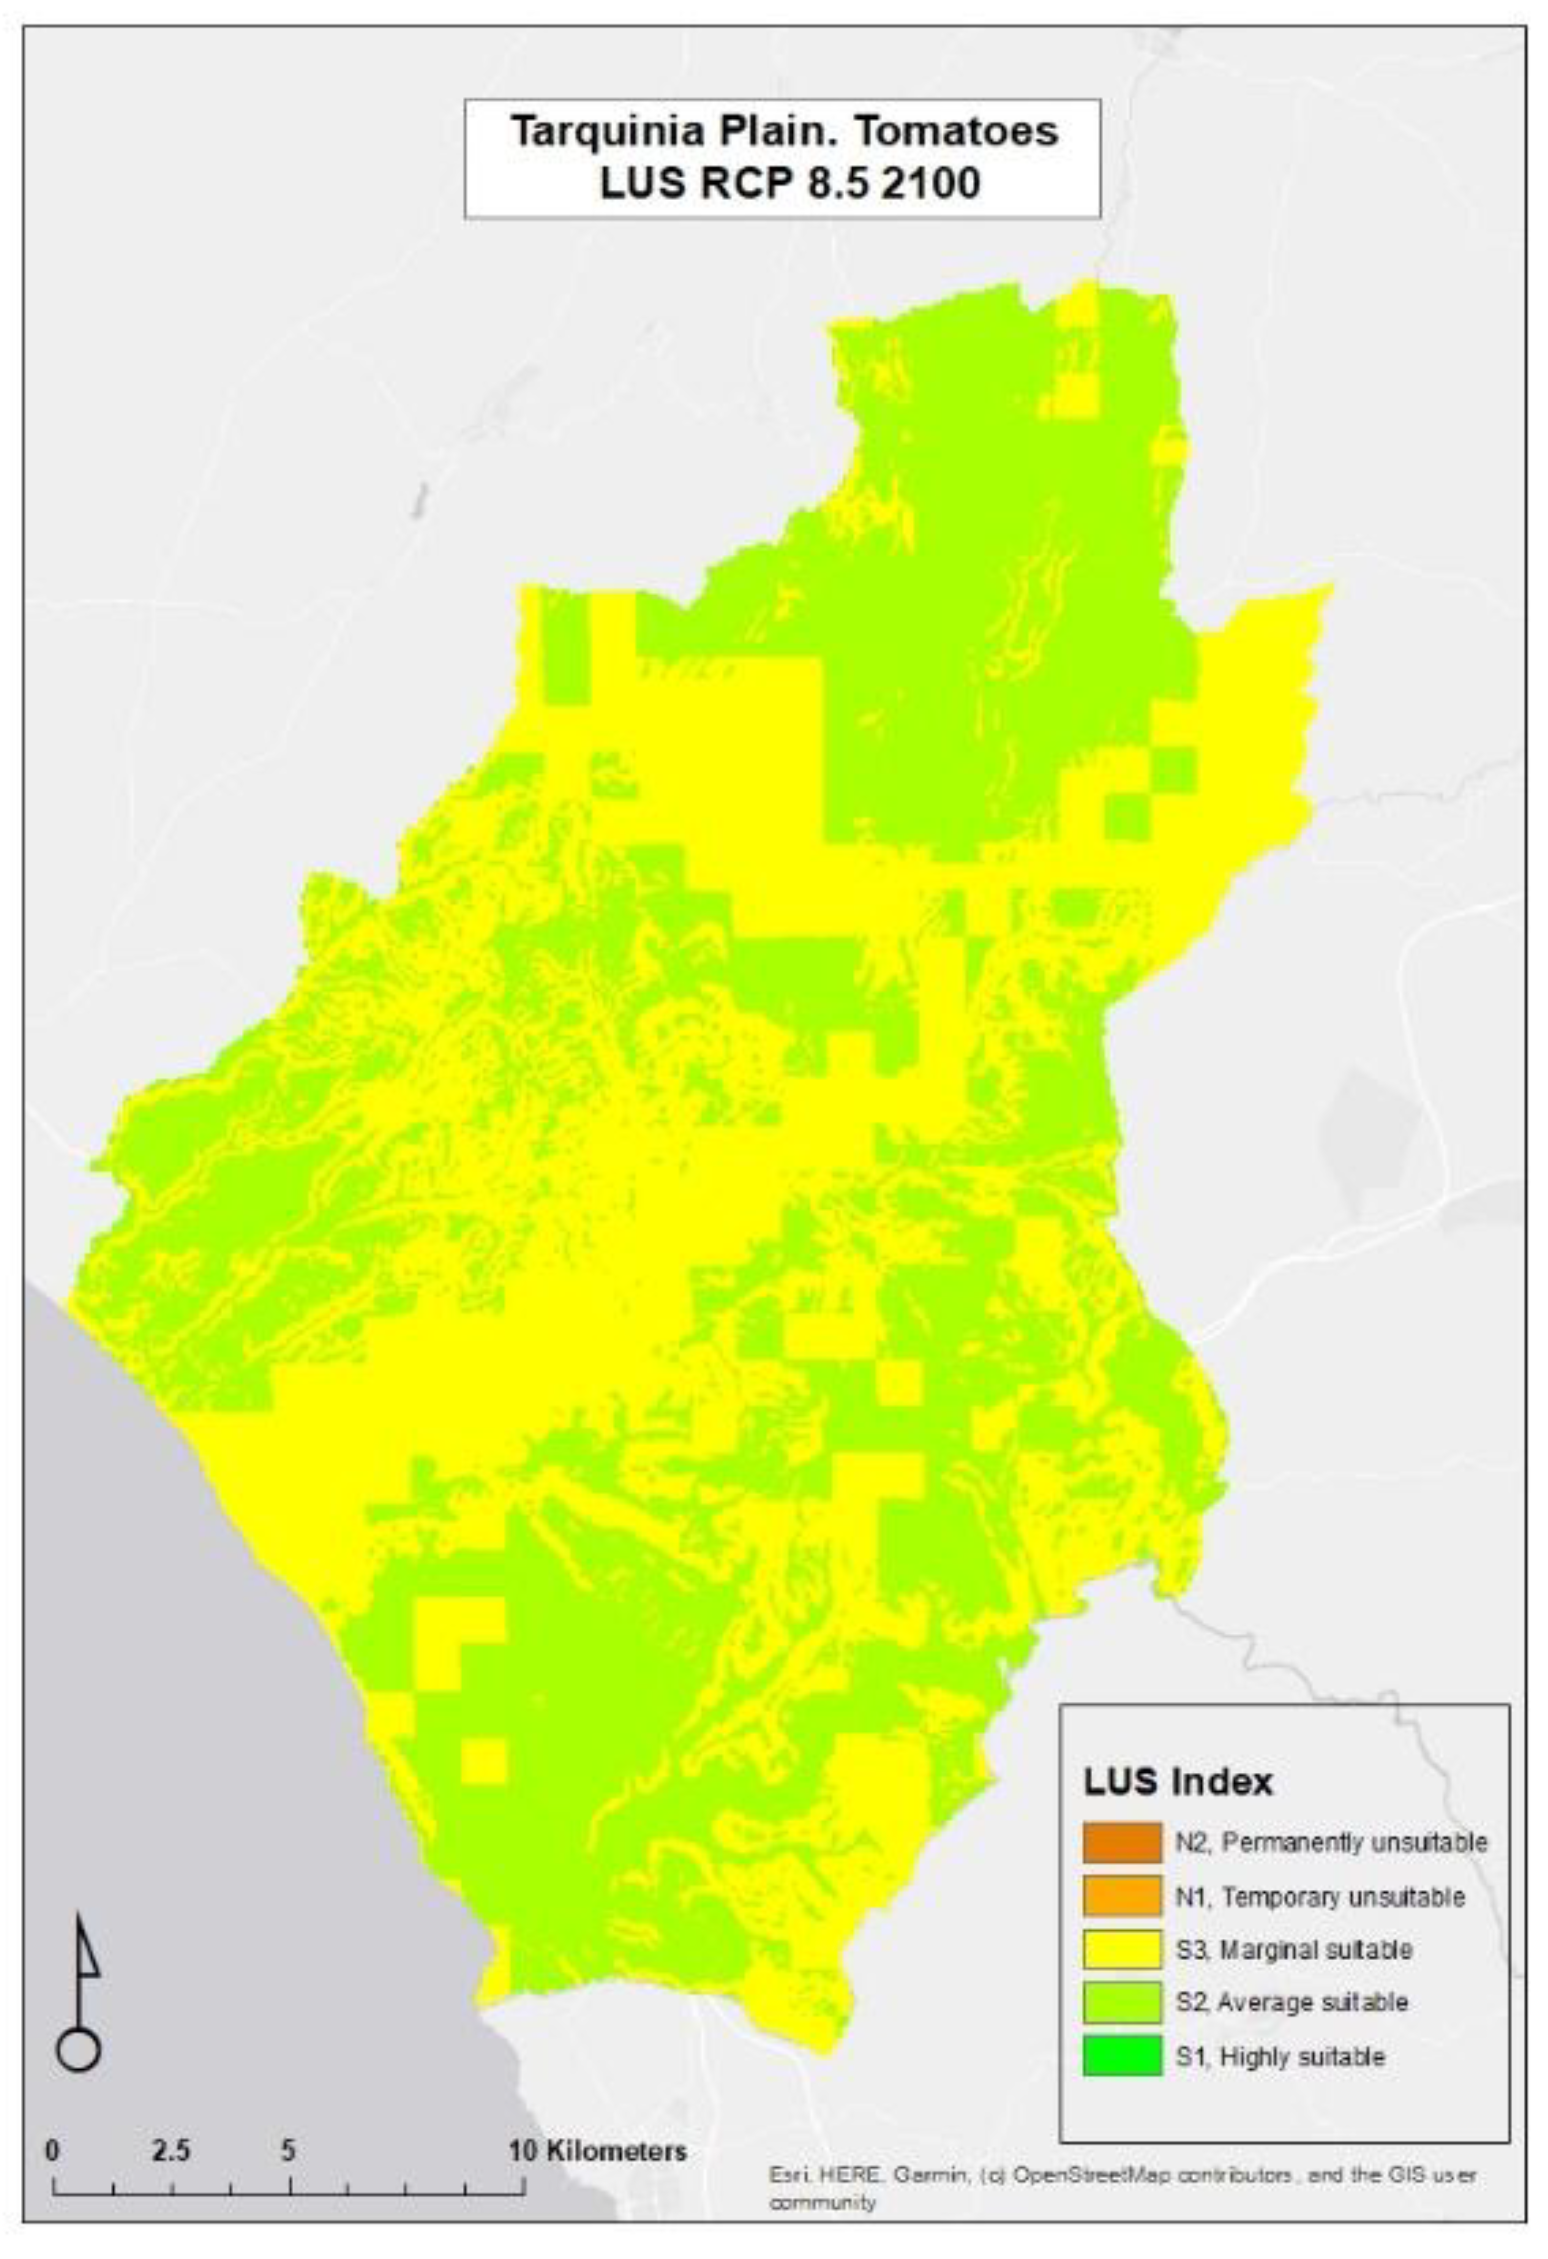
Figure 8.
Distribution (%) of the five FAO classes for processing tomato suitability in the Tarquinia plain – scenario RCP 4.5 and RCP8.5 compared (years 2040, 2070 and 2100).
Figure 8.
Distribution (%) of the five FAO classes for processing tomato suitability in the Tarquinia plain – scenario RCP 4.5 and RCP8.5 compared (years 2040, 2070 and 2100).
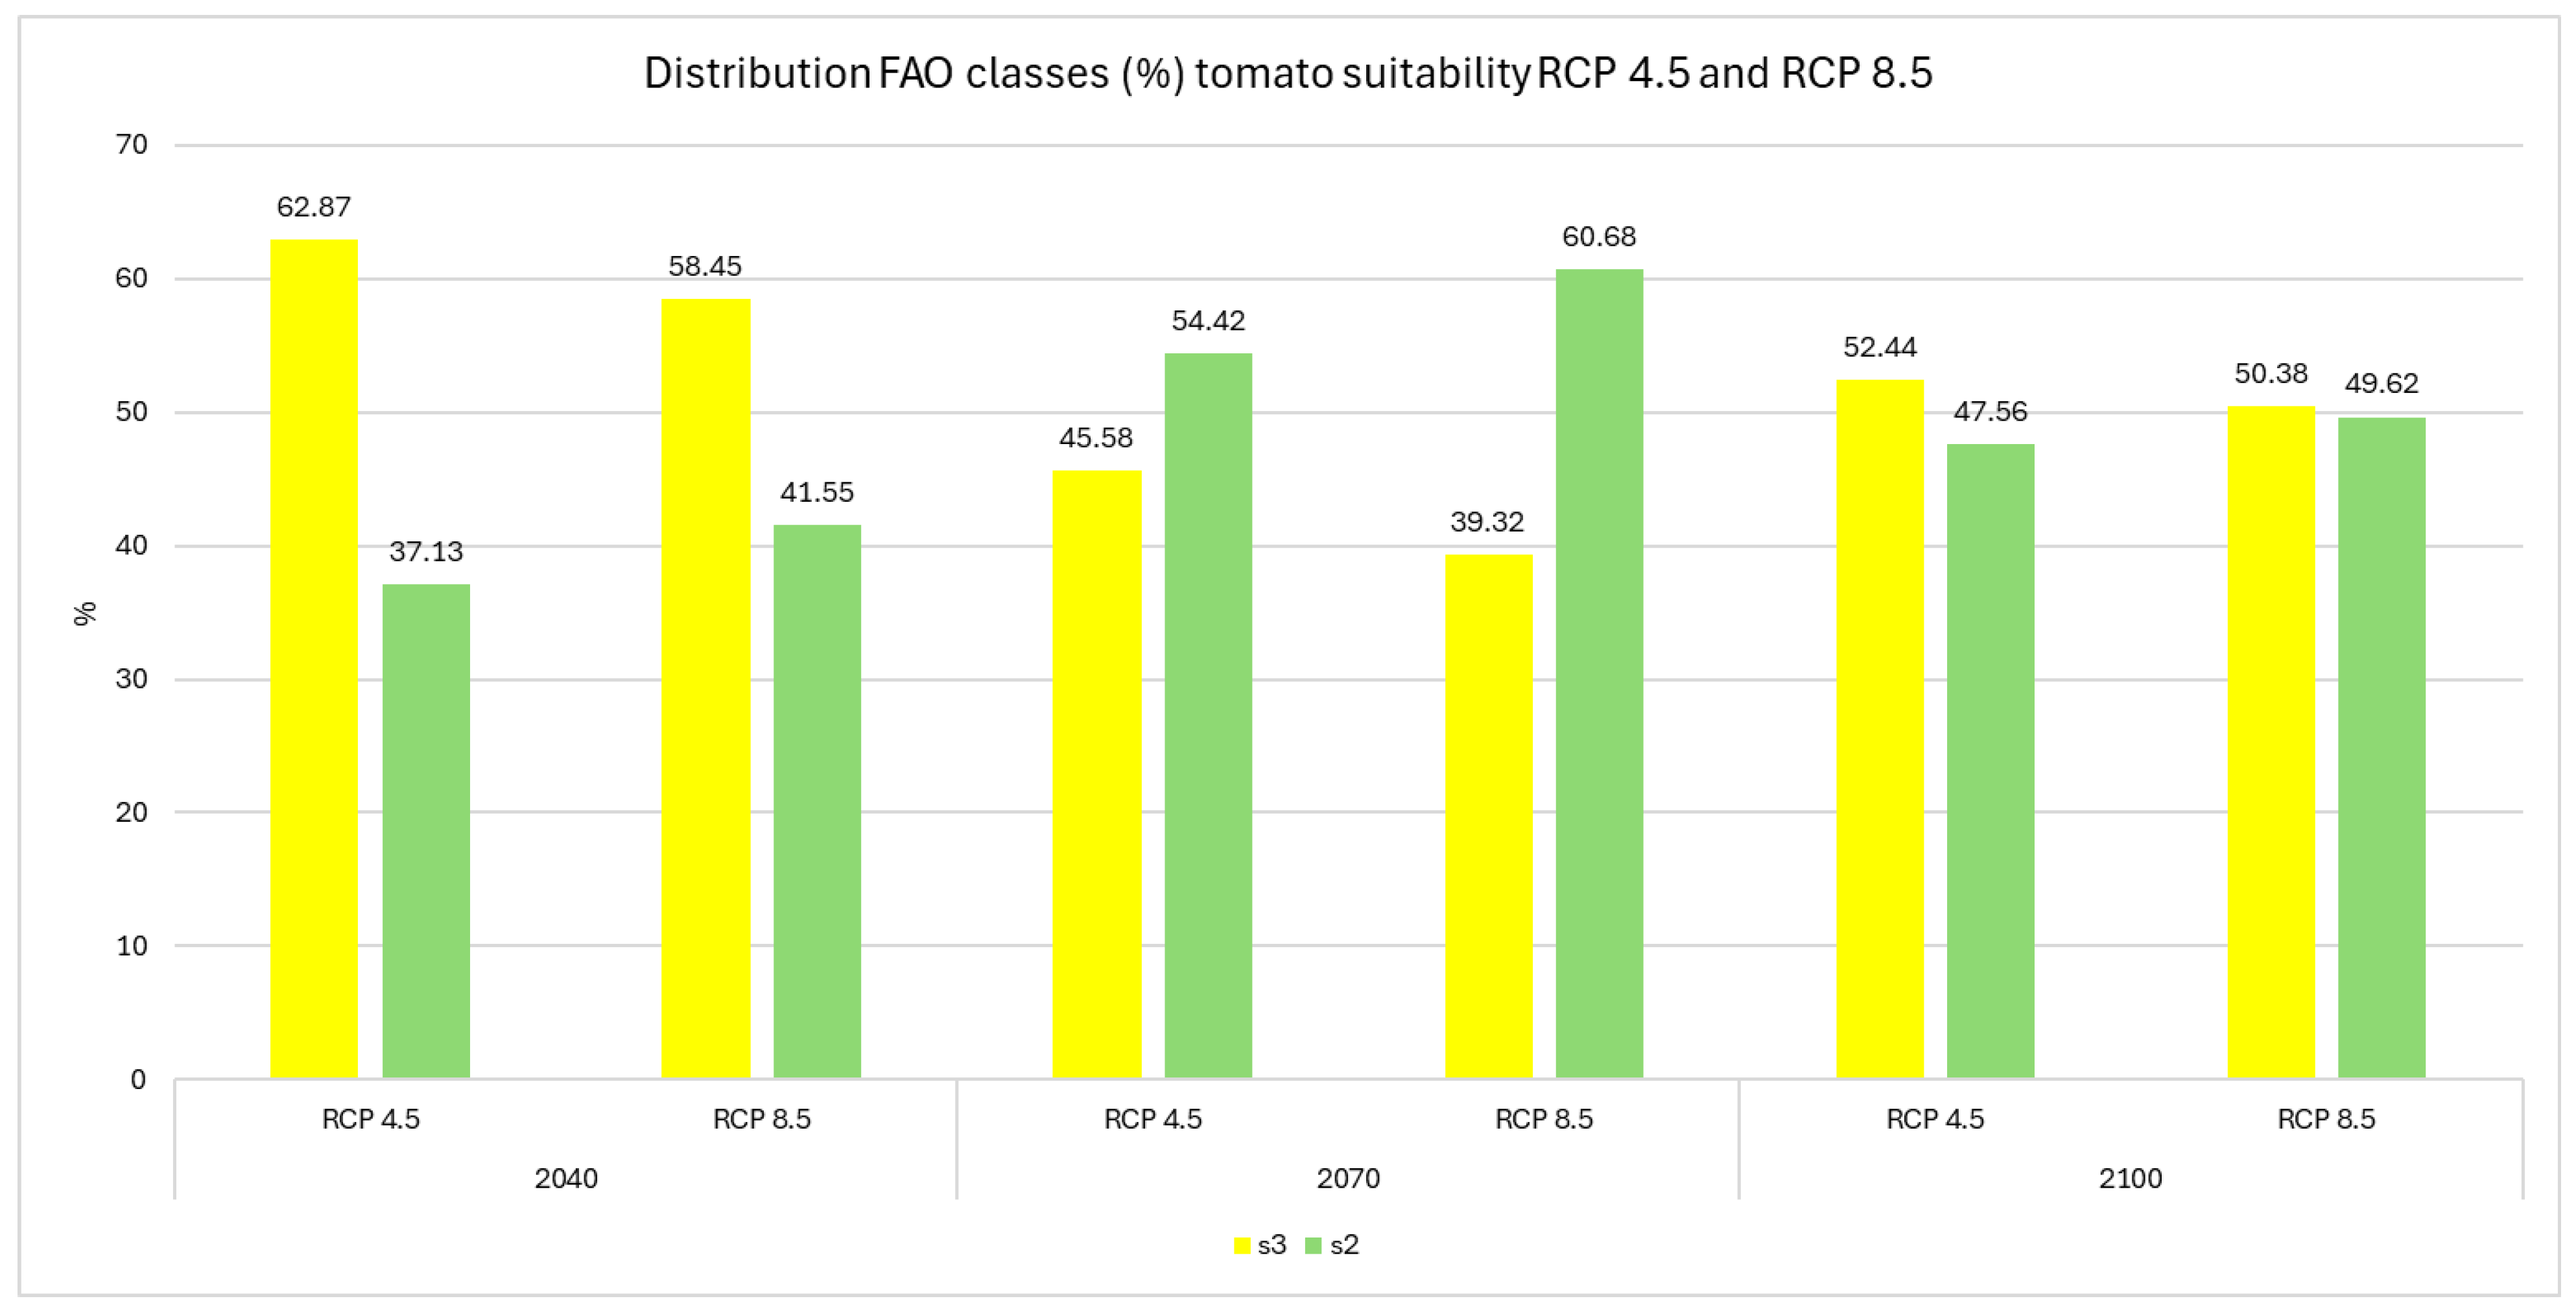

Table 1.
Soil factors, descriptions, and units of variables.
| Class-determining factors | Land qualities/characteristics | Description | Units |
| Soil physical properties (S) | Soil texture/structure | Clay, sand, and silt | - |
| % Gravel volume | Coarse fragments | % | |
| soil depth | Depth available to roots | cm | |
| Soil fertility and chemical properties (F) | pH | Acidity pH (in water 1:2.5) | - |
| % OC | Organic carbon content | % | |
| CEC | Cation Exchange capacity (cmol+/kg) | cmol+/kg | |
| % BS | Base saturation (%) as a proportion of the CEC taken up by exchangeable bases (TEB/CEC) | % | |
| % CaCO3 | Calcium carbonate equivalent (weight %) | % | |
| Gypsum | Gypsum (weight %) | % | |
| Soil salinity and alkalinity (A) | EC | Electrical conductivity class (dS/m range at 25 °C) | dS/m range at 25 °C |
| ESP | Exchangeable sodium percentage of the CEC (%) | % | |
| Topography (T) | % Slope | Slope | % |
| Erosion hazard | Erosion | t ha-1 yr-1 | |
| Wetness (W) | Flooding | Flooding | m |
Table 2.
Fundamental scale of Absolute Numbers. Source:[34].
Table 2.
Fundamental scale of Absolute Numbers. Source:[34].
| Intensity of importance | Definition | Explanation |
| 1 | Equal Importance | Two activities contribute equally to the objective |
| 2 | Weak or slight | |
| 3 | Moderate importance | Experience and judgment slightly favour oneactivity over another |
| 4 | Moderate plus | |
| 5 | Strong importance | Experience and judgment strongly favour oneactivity over another |
| 6 | Strong plus | |
| 7 | Very strong or demonstrated importance | An activity is favoured very strongly over another;its dominance demonstrated in practice |
| 8 | Very, very strong | |
| 9 | Extreme importance | The evidence favouring one activity over anotheris of the highest possible order of affirmation |
Table 3.
FAO classification for Land Evaluation. Source: [15].
Table 3.
FAO classification for Land Evaluation. Source: [15].
| FAO suitability classes | Description | Performance/Score |
| S1- Highly suitable | Land having no, or insignificant limitations to the given type of use | 100 - 85 |
| S2- Average suitable | Land having minor limitations to the given type of use | 85 - 60 |
| S3 - Marginal suitable | Land having moderate limitations to the given type of use | 60 - 40 |
| N1-Temporary unsuitable | Land having severe limitations that preclude the given type of use, but can be improved by specific management | 40 - 25 |
| N2- Permanently unsuitable | Land that have so severe limitations that are very difficult to be overcome | < 25 |
Table 4.
Ensemble mean temperature for the reference period and the future sub-periods based on the RCP4.5 and RCP8.5. Values are presented as absolute change from the reference period 1971-2000 and as absolute values in °C, Tarquinia pilot.
Table 4.
Ensemble mean temperature for the reference period and the future sub-periods based on the RCP4.5 and RCP8.5. Values are presented as absolute change from the reference period 1971-2000 and as absolute values in °C, Tarquinia pilot.
| Mean Temperature | RCP4.5 | RCP8.5 | ||||
| 2011-2040 | 2041-2070 | 2071-2100 | 2011-2040 | 2041-2070 | 2071-2100 | |
| Absolute change(°C) | +1.0 | +1.7 | +2.3 | +1.0 | +2.2 | +4.0 |
| Absolute value(°C) | 16.0 | 16.7 | 17.3 | 16.0 | 17.1 | 18.9 |
Table 5.
Ensemble the mean of total precipitation for the future sub-periods based on the RCP4.5 and RCP8.5 divided in the dry and wet periods. Values are presented as absolute change from the reference period 1971-2000 and as absolute values in mm, Tarquinia pilot.
Table 5.
Ensemble the mean of total precipitation for the future sub-periods based on the RCP4.5 and RCP8.5 divided in the dry and wet periods. Values are presented as absolute change from the reference period 1971-2000 and as absolute values in mm, Tarquinia pilot.
| Precipitations | RCP4.5 | RCP8.5 | |||||
| 2011-2040 | 2041-2070 | 2071-2100 | 2011-2040 | 2041-2070 | 2071-2100 | ||
| Dry period | absolute change (mm) | 4 | -10 | -4 | 14 | 20 | -27 |
| absolute value (mm) | 197 | 182 | 188 | 206 | 213 | 166 | |
| Wet period | absolute change (mm) | 57 | 37 | -3 | 15 | 35 | -6 |
| absolute value (mm) | 539 | 518 | 479 | 497 | 517 | 476 | |
Table 6.
Distribution in percentage of the classes in the Tarquinia area for the different variables. (LUS= Land Use suitability; CEC=Cation Exchange Capacity; CaCO3 =Calcium carbonate equivalent; OC= soil organic carbon; pH= acidity).
Table 6.
Distribution in percentage of the classes in the Tarquinia area for the different variables. (LUS= Land Use suitability; CEC=Cation Exchange Capacity; CaCO3 =Calcium carbonate equivalent; OC= soil organic carbon; pH= acidity).
| LUS classes | Soil physical properties | Soil fertility and chemical properties | ||||||||
| Gravel volume | Soil texture | Soil depth | Base saturation | Gypsum | CEC | CaCO3 | OC | ph | ||
| N2 | Permanently unsuitable | 0.00 | 17.06 | 0.18 | 0.00 | 0.00 | 0.00 | 28.09 | 0.00 | 100.00 |
| N1 | Temporary unsuitable | 0.00 | 0.00 | 2.91 | 28.32 | 0.00 | 0.00 | 0.00 | 80.89 | 0.00 |
| S3 | Marginal suitable | 2.04 | 10.26 | 2.18 | 0.00 | 0.00 | 70.99 | 0.00 | 0.00 | 0.00 |
| S2 | Average suitable | 13.24 | 4.25 | 0.00 | 0.00 | 0.00 | 0.00 | 5.86 | 4.09 | 0.00 |
| S1 | Highly suitable | 84.72 | 68.43 | 94.72 | 71.68 | 100.00 | 29.01 | 66.05 | 15.02 | 0.00 |
Disclaimer/Publisher’s Note: The statements, opinions and data contained in all publications are solely those of the individual author(s) and contributor(s) and not of MDPI and/or the editor(s). MDPI and/or the editor(s) disclaim responsibility for any injury to people or property resulting from any ideas, methods, instructions or products referred to in the content. |
© 2025 by the authors. Licensee MDPI, Basel, Switzerland. This article is an open access article distributed under the terms and conditions of the Creative Commons Attribution (CC BY) license (https://creativecommons.org/licenses/by/4.0/).
Copyright: This open access article is published under a Creative Commons CC BY 4.0 license, which permit the free download, distribution, and reuse, provided that the author and preprint are cited in any reuse.


